Embed Size (px)
Citation preview
Twenty-first
Annual Report
March 31, 2017
A Decade ofOne Water

Cover image: The three services offered by Halifax Water, with the customer and environment in mind Des
ign:
Sha
ron
War
d G
raph
ic D
esig
n; P
rintin
g: A
dvoc
ate
Prin
ting

2 A Decade of One Water
Letter from the Chair
September 19, 2017
Mayor Mike Savage and Members of Regional Council
Re: 2016/17 Annual Report
On behalf of the Halifax Water Board, we are pleased to submit
the utility’s annual report for the year ending March 31, 2017,
marking a decade with a “one water” mandate. Significant
progress has been made over the last 10 years, as outlined in the
General Manager’s Message contained in this report.
With respect to last year, I am pleased to report that a positive
trend continues with improvements in governance, financial
results and customer service. The Board approved revised
Terms of Reference for its effective operation, including Terms
of Reference for the three committees of the Board: the Board
Executive; Audit and Finance; and Environment, Health and
Safety.
The Utility submitted an application to the Nova Scotia Utility
and Review Board (NSUARB) last fall, with proposed changes to
the stormwater rate structure based on the approved Cost of
Service Manual. This culminated from a review of best practice
and three years of administration of the stormwater charge,
initially implemented in July 2013. The application was well
received, with refinements to incent non-residential customers
to minimize peak run-off and a tiered rate structure for
residential customers, consistent with user-pay principles. These
changes put Halifax Water rate structures in line with industry
best practice and, more importantly, in line with constructive
feedback from customers and stakeholders. With the NSUARB
Decision in April, the new rate structure came in to effect on July
1, 2017.
The Utility finished the year in an excellent financial position
with a net profit of $8.86 million, compared to a budget profit
of $0.16 million. Long term debt for the utility decreased by
$12.6 million with total outstanding debt as of March 31, 2017,
at $204.3 million. In accordance with the agreement between
Halifax Water and the Halifax Regional Municipality, a dividend in
the amount of $4.6 million was provided. With a strong financial
trend continuing this year, Halifax Water will not need to increase
rates this year or next.
The past year saw significant accomplishments to enhance
customer service. Of particular note was the implementation
of advanced metering infrastructure and a new operations
management system through Cityworks to improve the
customer experience. Last year also saw our Customer Care
Centre step up to take all service calls from the customer,
whether they are billing or operations related. On that
note, a special thank you is extended to our customers and
Regional Council who have entrusted us with the stewardship
responsibility to deliver water, wastewater and stormwater
service under a one water framework.
Respectfully Submitted,
Ray Ritcey, BComm, MBA, CPA/CGA
Chair of the Board
A Decade of One Water 3
A Decade of One Water
It seems like only yesterday that Halifax Water was given responsibility for stewardship of all things water with the transfer of wastewater and stormwater assets from the municipality in 2007. This transfer was, in large part, based on the track record of the utility since its inception in 1945 and its regional mandate in 1996.
So what have we done? In terms of accomplishments over the past ten years, Halifax Water has made its mark on all three services (water, wastewater and stormwater) with:
• Over $500 million in infrastructure investments, including upgrades and expansions of the Eastern Passage and Aerotech Wastewater Treatment Facilities to meet federal wastewater system effluent regulations [WSER] and facilitate growth.
• Leadership on the recovery of the Halifax Wastewater Treatment Facility after the flood incident of January, 2009.
• Significantly improved compliance with WSER for all wastewater plants; in 2007, only two of fifteen plants were compliant with regulations. All plants are now compliant or on track for compliance by next year.
• Implementation of a wet weather management program to mitigate inflow and infiltration into the wastewater system, thereby reducing wastewater overflows into the environment.
• Continued focus on water loss control in the distribution system, garnering a world class reputation. Halifax Water has recaptured 40 million litres/day of leakage as a result of its efforts and was the first utility in North America to adopt the International Water Association (IWA) methodology.
• Implementation of a seasonal disinfection program for wastewater treatment facilities discharging to the harbour with triple bottom line results.
• Implementation of a robust emergency management program with a focus on response through the incident command system.
• Mitigation and adaptation programs in response to climate change for a more resilient utility.
• Leadership in water research with Dalhousie University through the Natural Science and Engineering Research Council (NSERC) Chair in Water Quality and Treatment (the NSERC Chair has been in place since 2007 and recently renewed for an additional five years).
• Implementation of an environmental management system for water and wastewater treatment facilities, certified to ISO 14001 standards. Halifax Water is the only utility in Atlantic Canada with this certification.
• Implementation of advanced metering infrastructure to enhance customer service.
• Responsible financial management with a focus on cost containment including a program on energy management across the utility to reduce our ecological footprint and costs.
• Continued high regard from customers as measured through the annual survey conducted by Corporate Research Associates. Over 90% of customers were satisfied or very satisfied with Halifax Water’s service each and every year that the survey was conducted.
Although there are many more accomplishments to add to the list, it is the endorsement from customers that keeps us going. Customer Service is the lifeblood of Halifax Water and central to our mission.
Yours in service,
Carl D. Yates, M.A.Sc., P.Eng.General Manager
Our MissionTo provide world-class services for
our customers and our environment.
Our Vision• We will provide our customers with high quality
water, wastewater, and stormwater services.
• Through the adoption of best practices, we willplace the highest value on public health, customer service, fiscal responsibility, workplace safety and
security, asset management, regulatory compliance, and stewardship of the environment.
• We will fully engage employees through teamwork,innovation, and professional development.
A Decade of One Water 5
Board of CommissionersMarch 31, 2017
Ray Ritcey, BComm, MBACPA/CGAChair
Councillor Lisa BlackburnCommissioner
Councillor Steve StreatchCommissioner
Councillor Russell WalkerVice Chair
Mayor Mike SavageCommissioner
Darlene FentonCommissioner
Jacques DubéCommissioner
Don Mason, P.Eng., MCIPCommissioner
ContentsLetter from the Chair 2Message from the General Manager 3General Information of Utility 6High Quality Water 8Responsible Financial Management 12Effective Asset Management 17Regulatory Compliance 23Stewardship of the Environment 28Safety and Security 33Motivated and Satisfied Employees 35Typical Water Analyses 40-44Financial Overview 45Financial Statements 46
Executive Staff
How to reach us:
For more information about Halifax Water and its services, visit our website at www.halifaxwater.ca,
contact Customer Service at (902) 420-9287, e-mail us at [email protected], fax us at
(902) 490-4749, or write us at P.O. Box 8388 RPO CSC, Halifax, N.S., B3K 5M1. You can also reach us via
Facebook and Twitter at @HalifaxWater.
Carl Yates, M.A.Sc., P.Eng.General Manager
Cathie O’Toole, BA, MBA,CPA/CGADirector, Corporate Services
Jamie Hannam, MBA, P.Eng.Director, Engineering and Information Services
Kenda MacKenzie, P.Eng.Director, Regulatory Services
Susheel Arora, M.A.Sc., P.Eng.Director, Wastewater andStormwater Services
Reid Campbell, M. Eng., P.Eng.Director, Water Services
...........................
...........................
...........................
...........................
...........................
...........................
...........................
...........................
...........................
...........................
....................
...........................
...........................
6 A Decade of One Water
Collins Park
Source - Lake FletcherProcess - Ultra Filtration / Nano FiltrationDesign average flows 40 m3/day
Middle Musquodoboit
Source- Musquodoboit RiverProcess- Raw water infiltration gallery- Ultra Filtration / Nano FiltrationDesign average flows 49 m3/day
Five Island Lake
Source - 1 wellProcess - Ultraviolet disinfectionDesign average flows 9 m3/day
Silver Sands
Source - 2 wellsProcess - Green sand pressure filters-Iron and manganese removalDesign average flows 25 m3/day
Miller Lake
Source - 3 wellsProcess - Arsenic removal with G2 MediaNo Production - bulk water supply
Population Served Halifax MunicipalityEstimated population served 365 000 Consumption per capita (all customers) 265 litres/day
Glossary of Terms
ha - hectarem - metrem2 - square metrem3 - cubic metremm - millimetrekm - kilometrecm - centimetre
Transmission and Distribution System
Size of mains 19 mm - 1 500 mm Total water mains 1 582 km Main valves 15 049Fire hydrants 8 356Distribution Pumping Stations 20 Pressure Control/Flow Meter Chambers 140
Services and Meters
WaterSprinkler services (25 mm - 300 mm) 2 117Supply services (10 mm - 400 mm) 88 073 Meters (15 mm - 250 mm) 83 406
Wastewater services 80 143
Treatment Processes
J. Douglas Kline Water Supply Plant
Source - Pockwock LakeProcess - Dual media direct filtration - Iron and manganese removal8 filters 143 m2/eachMax. flow rate 0.137 m3/m2/minDesign capacity 227 000 m3/dayDesign average flows 81 606 m3/day
Lake Major Water Supply Plant
Source - Lake MajorProcess - Upflow clarification and trimedia filtration - Iron and manganese removal4 filters 85 m2/eachMax. flow rate 0.192 m3/m2/minDesign capacity 94 000 m3/dayDesign average flows 33 260 m3/day
Bennery Lake
Source - Bennery LakeProcess - Manganese removal, sedimentation, dual media filtration2 filters 26.65 m2/eachMax. flow capacity 0.10/m3/m2/minDesign capacity 7 950 m3/dayDesign average flows 844 m3/day
General Information of UtilityYear Ended March 31, 2017
Precipitation Measured at Pockwock Rainfall 1 620.90 mm Snowfall 349.25 cmMeasured at Lake Major Rainfall 1 230.8 mm Snowfall 211.5 cm
Sources of Supply andWatershed Areas Pockwock Lake 5 661 ha Safe Yield 145 500 m3/dayChain Lake 206 ha Safe Yield 4 500 m3/dayLake Major 6 944 ha Safe Yield 65 900 m3/dayLake Lemont/Topsail 346 ha Safe Yield 4 500 m3/dayBennery Lake 644 ha Safe Yield 2 300 m3/day
Water Supply Production (Cubic Metres)
Pockwock Lake 29 867 945Lake Major 12 140 028Bennery Lake 308 100Small Systems 47 216Total 42 633 289
Storage Reservoirs(Elevation Above Sea Level)
Lake Major ( 60 m) 9 092 m3Pockwock (170 m) 13 600 m3Geizer 158 (158 m) 36 400 m3Geizer 123 (123 m) 31 800 m3Cowie (113 m) 11 400 m3Robie ( 82 m) 15 900 m3Lakeside /Timberlea (119 m) 5 455 m3Mount Edward 1 (119 m) 22 728 m3Mount Edward 2 (119 m) 22 728 m3Akerley Blvd. (119 m) 37 727 m3North Preston (125 m) 1 659 m3Meadowbrook ( 95 m) 9 091 m3Sampson (123 m) 12 273 m3Stokil (123 m) 23 636 m3Waverley ( 86 m) 1 364 m3Middle Musquodoboit (81m) 275 m3Aerotech (174 m) 4 085 m3Beaver Bank (156 m) 6 937 m3 Total Storage Capacity 259 213 m3
WATERBomont
Source - Shubenacadie RiverProcess - Nano Filtration / Ionic Exchange ResinDesign Average Flows 5 m3/day
A Decade of One Water 7
Treatment Processes
Halifax Process - Enhanced Primary - UV Design average flows - 139 900 m3/dayArea served - Halifax Receiving water - Halifax HarbourVolume treated - 52,272,321 m3
Dartmouth
Process - Enhanced Primary - UV Design average flows - 83 800 m3/day Area served - Dartmouth Receiving water - Halifax HarbourVolume treated - 18,818,967 m3
Herring Cove
Process - Enhanced Primary - UV Design average flows - 28 500 m3/day Area served - Halifax-Herring Cove Receiving water - Halifax Harbour (Outer)Volume treated - 3,633,821 m3
Mill Cove
Process - Secondary - UV / Pure oxygen Activated sludge Design average flows - 28 400 m3/day Area served - Bedford-Sackville Receiving water - Bedford BasinVolume treated - 8,652,553 m3
Eastern Passage
Process - Secondary - UV / Conventional Activated sludgeDesign average flows - 25 000 m3/day Area served - Cole Harbour-Eastern PassageReceiving water - Halifax HarbourVolume treated - 5,161,571 m3
Timberlea
Process - Secondary - Sodium Hypochlorite / RBC Design average flows - 4 540 m3/day Area served - Lakeside-Timberlea Receiving water - Nine Mile RiverVolume treated - 897,691 m3
Wastewater & StormwaterCollection System
Size of pipes 38 mm - 3 600 mm Total sewer length 2 555 km Total manholes 39 977Total Pumping Stations 166Total ditch length 507 kmDriveway culverts Approximately 18 000Cross culverts 1748Holding Tanks and Retention Ponds 54 (12-244,000 m3)Catch basins 23 810
Uplands Park
Process - Tertiary - UV / Trickling filter and wetlandDesign average flows - 91 m3/day Area served - Uplands Park Receiving water - Sandy LakeVolume treated - 30,251 m3
Wellington
Process - Tertiary - UV / Activated sludge /reed bed Design average flows - 68 m3/day Area served - Wellington Receiving water - Grand LakeVolume treated - 6,752 m3
Frame
Process - Secondary - Membrane Bioreactor / UVDesign average flows - 80 m3/day Area served - Frame Sub-Division Receiving water - Lake WilliamVolume treated - 6,616 m3
Belmont
Process - Secondary - Sodium Hypochlorate Extended AerationDesign average flows - 114 m3/dayArea served - Belmont Sub-DivisionReceiving water - Halifax Harbour
RBC = Rotating Biological Contactor; SBR = Sequencing Batch reactor; UV = Ultra Violet Volume treated - 40,880 m3(Decommissioned December 2016)
Aerotech
Process - Tertiary - UV /SBRDesign average flows - 1 360 m3/day Area served - Aerotech Park-Airport Receiving water - Johnson RiverVolume treated - 304,573 m3
Springfield Lake
Prosess - Secondary - UV Activated sludge Design average flows - 543 m3/day Area served - Springfield Lake Receiving water - Lisle LakeVolume treated - 209,398 m3
Fall River
Process - Tertiary - UV / Activated sludge and post filtration Design average flows - 454.5 m3/day Area served - Lockview-McPherson Road Receiving water - Lake FletcherVolume treated - 53,819 m3
North Preston
Process - Tertiary - UV / SBR and engineered wetland Design average flows - 680 m3/day Area served - North Preston Receiving water - Winder LakeVolume treated - 244,407 m3
Middle Musquodoboit
Process - Secondary - UV / RBCDesign average flows - 114 m3/day Area served - Middle Musquodoboit Receiving water - Musquodoboit RiverVolume treated - 71,195 m3
General Information of UtilityYear Ended March 31, 2017
WASTEWATER/STORMWATER
8 A Decade of One Water
High Quality WaterLEAD IN DRINKING WATER
Lead in drinking water remained a
focus for Halifax Water in 2016/17. In
September of 2017, the Halifax Water
Board approved a business plan to
facilitate removal of all lead service lines
(LSLs) from the Halifax Water system,
both those in the public right-of-way,
which are owned by Halifax Water, and
on private property which belongs to the
property owner.
LSLs are found in areas which were
connected to the public water system
before 1960; these include peninsular
Halifax and central Dartmouth. It is
estimated that there are 2000-2500
public LSLs remaining and 10,000-15,000
on private property.
With most LSLs on private property, one
focus of the program will be to assist
property owners in the identification
of LSLs. This will involve a thorough
review of Halifax Water installation and
maintenance records dating back over
the last 100 years. It will also involve
outreach to customers and development
of tools to help them determine if they
have a lead service line.
While Halifax Water has replaced the
vast majority of its LSLs over the last 30+
years, many homeowners have not. There
are a number of barriers to property
owners replacing their LSLs. One barrier is
certainly cost but other barriers include,
lack of familiarity with the construction
process, lack of understanding of the
potential health
risks, lack of awareness of the problem or
not being sure if they have a lead service
line. Over the coming months, Halifax
Water will continue to develop programs
to remove or lessen barriers to customers.
Halifax Water staff have been
participating in a North America-wide
effort to understand and address the
LSL issue. Several Halifax Water staff
have participated in the development
of industry policy through the American
Water Works Association. Halifax Water
staff has also taken part in industry
sponsored research to develop methods
for locating and replacing LSLs.
In the last year, Halifax Water has
added two new features to its LSL
replacement program. Since disturbance
or replacement of an LSL can result in
a short term increase in lead levels in a
home, Halifax Water will now provide
pitcher style filters to homes at risk of
high lead levels. These include homes
with lead services lines that have been
disturbed and not yet replaced; and
homes that have tested for high lead
levels and a contractor is scheduled to
begin replacement work.
The second change provides options
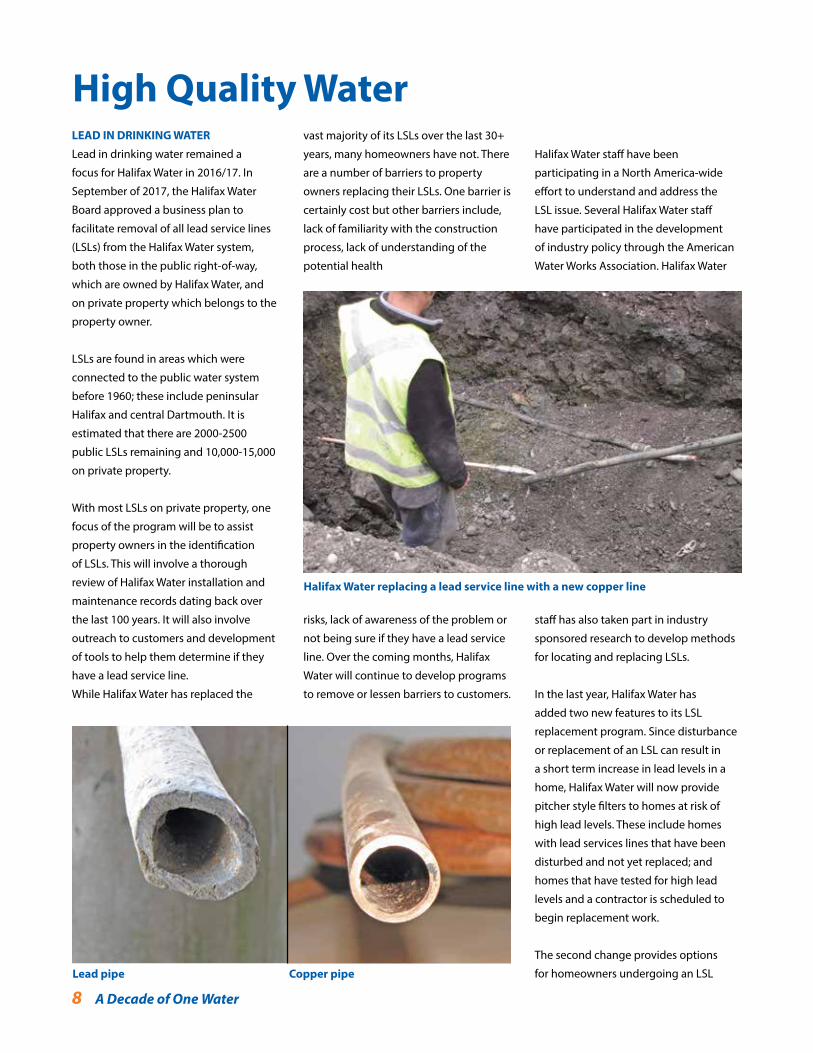
for homeowners undergoing an LSL Lead pipe Copper pipe
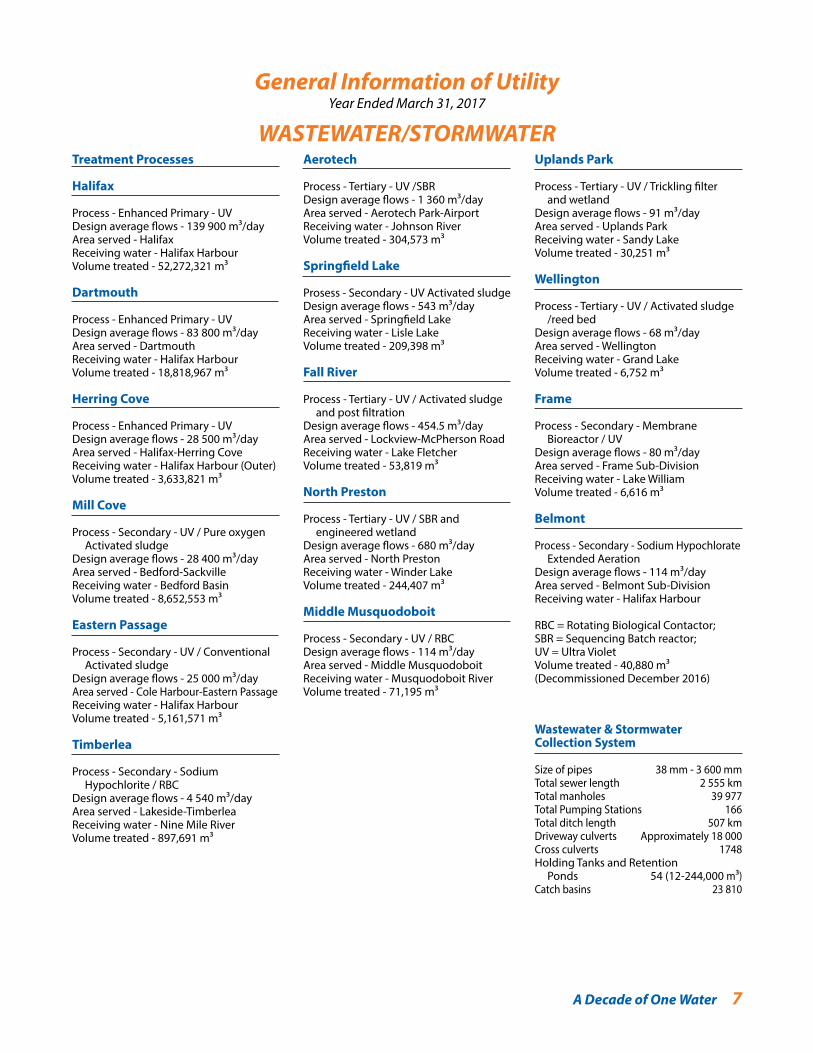
Halifax Water replacing a lead service line with a new copper line
A Decade of One Water 9
replacement. Halifax Water schedules the
public LSL replacement after the property
owner replaces the private property
portion. For reasons such as weather,
scheduling, street permits and locates,
this gap between the private and public
replacement can be two weeks or more
during which there may be elevated lead
levels in the home. While exposure to
lead can be managed in this situation,
some customers have expressed
concern about this gap. Halifax Water
has identified three contractors who
have been approved by Halifax Water to
replace the public portion of the LSL. If
the homeowner chooses to employ one
of these contractors, they will coordinate
replacement of the public and private
into a single project. Homeowners are
encouraged to get several prices for
qualified contractors prior to making
their selection. Information about this
program and all things related to LSLs are
found on the Halifax Water website.
SOURCE WATER QUALITY
Geosmin continues to occur in the
Pockwock water supply. In 2016, geosmin
occurred once again beginning in August
and lasting until winter 2017. Geosmin
is produced from both algae and soil
based bacteria. It is not a health concern
but does have an earthy, musty taste
and odour that is apparent to some
consumers.
Since its first occurence in 2012, Halifax
Water has studied both the occurrence
of geosmin and treatment options to
remove geosmin. There are several
treatment options but all are very costly
from both an installation and long term
operations perspective.
Halifax Water is now looking at geosmin
from the broader perspective of other
source water changes that have been
observed. Halifax Water now has
information to suggest that the lakes
which supply water to our water systems
are undergoing recovery from the
effects of acid rain. Decades of emissions
from industrialization and fossil fuel
consumption have caused lakes in
eastern Canada, and elsewhere, to acidify.
Halifax area lakes typically have a pH of
5-6 or lower. Legislative efforts, improved
technology and the reduction of coal
fired power generation has reduced
acid rain and permitted lakes to recover.
Halifax Water has observed a trend of
increasing pH in local lakes.
This is a positive occurrence from an
environmental perspective, and for our
society at large. From a water treatment
perspective it presents some challenges.
Increasing pH results in increased levels
of natural organic matter (NOM) in our
lakes. NOM must be removed in the
treatment process because it can lead
to disinfection by-products, and also
to make drinking water aesthetically
acceptable. Increased NOM presents
an increased treatment challenge for
treatment plants and leads directly to
increased operating costs. Increased
pH also results in an improved aquatic
habitat for fish and the species they rely
on for food. This includes microbes and
plankton that must be removed in the
treatment process, but also species like
algae which can be the cause of a variety
of taste and odour causing compounds,
such as geosmin.
Halifax Water will be doing increasing
study and research over the coming
years to fully understand the impacts
of recovery on our lakes, the treatment
challenges that come with lake recovery,
and to plan improvements to treatment
processes.
RESEARCH CHAIR
On April 1, 2017, Halifax Water and Dr.
Graham Gagnon at Dalhousie University
successfully renewed the NSERC/Halifax
Water Industrial Research Chair in Water
Quality and Treatment for another 5 year
term. Under this program, the Natural
Sciences and Engineering Research
Council (NSERC) of Canada matches
funds provided by Halifax Water and
other partners to Dalhousie University,
to fund research into drinking water
quality issues. Many of our efforts to
manage lead in drinking water and
improve treatment processes have been
developed based on research conducted
at Dalhousie.
Research conducted over the next five
years will be focused on the themes of
Understanding Source Water Changes
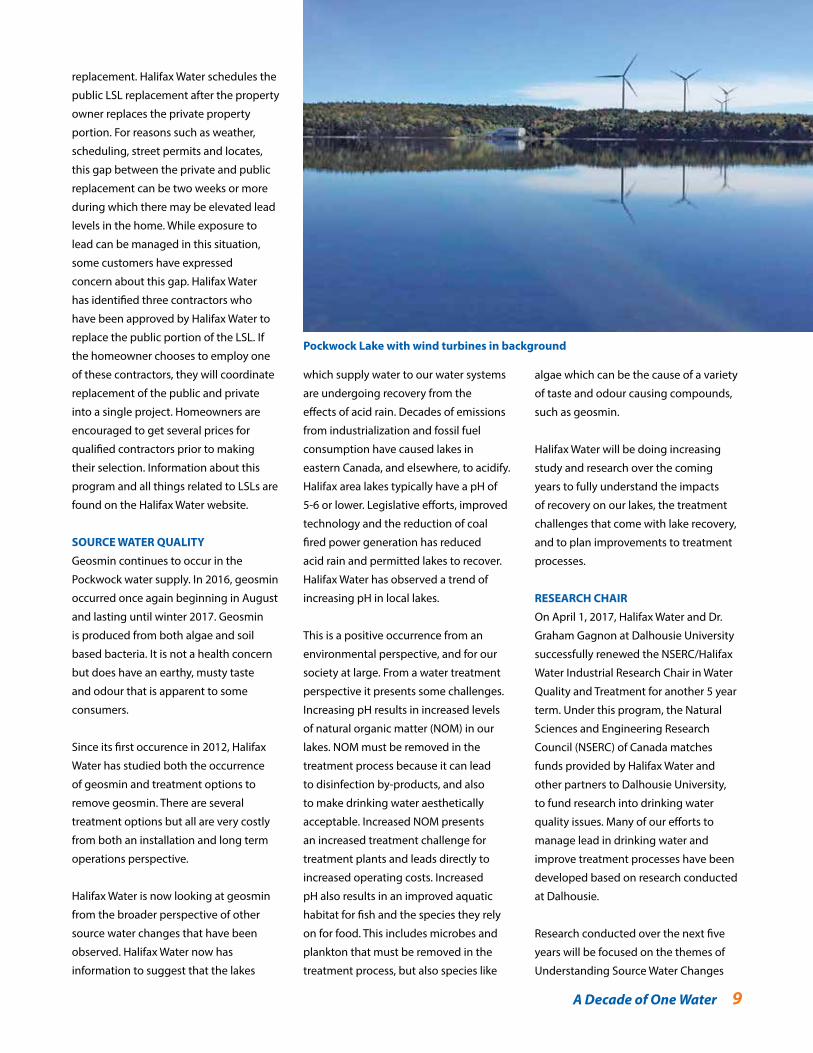
Pockwock Lake with wind turbines in background
10 A Decade of One Water
(such as lake recovery), Adapting
Treatment Processes to Meet Source
Water Challenges, and Distribution
System Water Quality.
Additionally, Halifax Water also joined
an application to NSERC by Drs. Monica
Emelko at the University of Waterloo and
Uldis Silins at the University of Alberta
to establish a national network to study
how management of forested water
sources can improve drinking water
quality. This application was successful
and the network will be established
in 2017. This will result in two other
Dalhousie University researchers, Dr. Rob
Jamieson and Dr. Peter Duinker working
in Halifax Water watersheds to develop
tools and techniques for source water
protection in collaboration with other
network partners across Canada.
2016 DROUGHT
2016 will be remembered across Nova
Scotia for the drought that impacted
water supplies and many households on
private wells.
While many Halifax Water sources
experienced close
to historically low
lake levels, the
impacts of the
drought were
experienced most
directly at Lake
Major.
In early September,
low water levels in
Lake Major resulted
in interruption
to downstream
flows into the Little
Salmon River. Later
in September,
Halifax Water called
on its customers
to undertake
mandatory water
use restrictions and
began contingency
planning in the
event lake levels
continued to drop.
Both Halifax Water staff and customers
responded well to the call to action.
Water consumption in the Lake Major
system decreased by 3 million litres/day
as a result of the restrictions and increased
leak detection and repair efforts.
As a result of this experience, Halifax
Water will explore modifying the design
of a planned new pumping station at
Lake Major to access deeper areas of Lake
Major.
WATER TREATMENT PLANT
IMPROVEMENTS
Halifax Water periodically studies each of
its treatment facilities to assess upgrades
to improve treatment plant performance
replacement. Each plant has a multi year
capital plan based on these studies.
Last year Halifax Water began a project
to replace the filter underdrains and filter
media at the J. Douglas Kline Water Supply
plant. New media and underdrains will
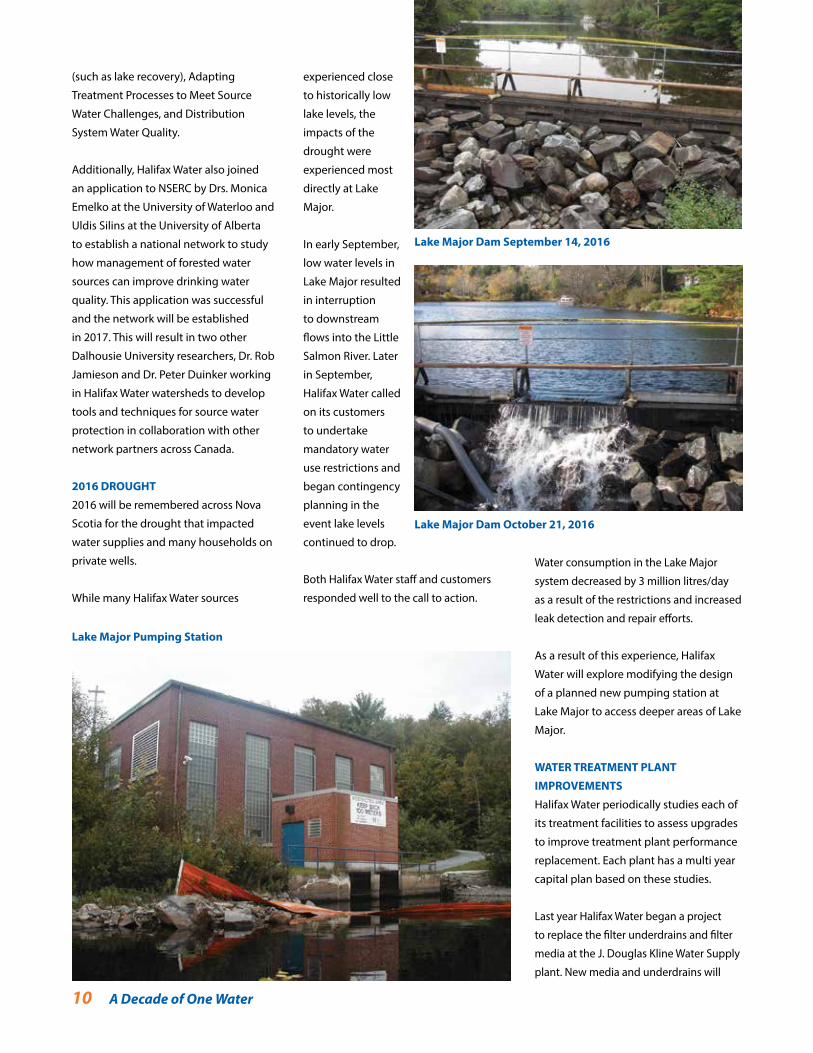
Lake Major Dam September 14, 2016
Lake Major Dam October 21, 2016
Lake Major Pumping Station
A Decade of One Water 11
improve plant performance and position
the plant for challenges that are likely
to arise from changing source water
quality. The project will also include the
installation of air scour. Air scour is a
technology to clean filters at the end of
each run that has been developed since
the plant was designed in the mid 1970’s.
Filters will be upgraded in a multi-phase
project over the next two years to maintain
plant operation through the project.
LAKE MAJOR DAM
Last year, Halifax Water completed the
design of a new dam for Lake Major.
The existing Lake Major dam is due for
replacement due to its age and condition.
The new dam will improve Halifax Water’s
ability to manage flows into the Little
Salmon River and meet new fisheries
maintenance requirements mandated by
Fisheries and Oceans Canada.
The dam design will incorporate a
labrynth spillway which will enable the
dam to pass more water while protecting
upstream properties from flooding.
The project was tendered in the Spring
of 2017 and construction is planned to
begin once permits are received from
approval authorities.
LOCATES
Part of the business of a modern utility
is to respond to calls from contractors
and other utilities to locate buried
infrastructure. Occupational health and
safety regulations have resulted in a large
increase in demand for locates by Halifax
Water and other utilities.
Halifax Water is working to implement
a new locates process through its
computerized maintenance management
system, City Works. Additional staff
will be hired in 2017 to assist with the
increasing volume of locates.
Later in 2017, Halifax Water is expected to
join a computerized, internet based one
call service provided for the Halifax area.
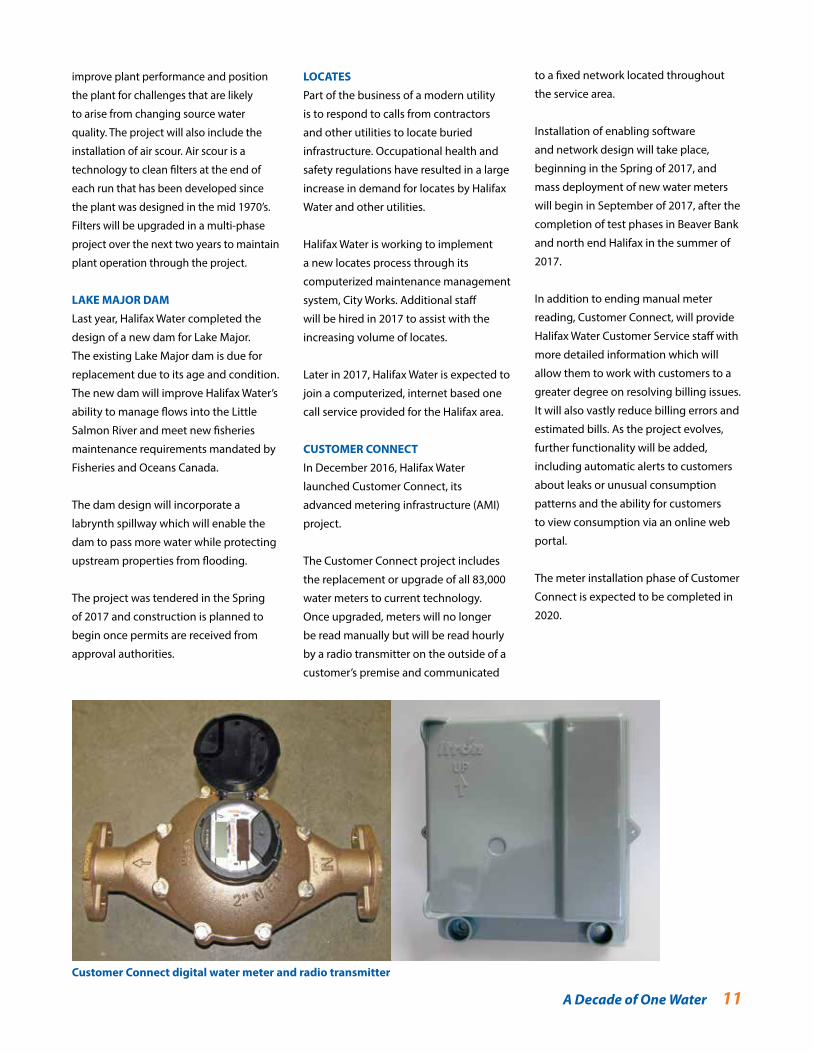
CUSTOMER CONNECT
In December 2016, Halifax Water
launched Customer Connect, its
advanced metering infrastructure (AMI)
project.
The Customer Connect project includes
the replacement or upgrade of all 83,000
water meters to current technology.
Once upgraded, meters will no longer
be read manually but will be read hourly
by a radio transmitter on the outside of a
customer’s premise and communicated
Customer Connect digital water meter and radio transmitter
to a fixed network located throughout
the service area.
Installation of enabling software
and network design will take place,
beginning in the Spring of 2017, and
mass deployment of new water meters
will begin in September of 2017, after the
completion of test phases in Beaver Bank
and north end Halifax in the summer of
2017.
In addition to ending manual meter
reading, Customer Connect, will provide
Halifax Water Customer Service staff with
more detailed information which will
allow them to work with customers to a
greater degree on resolving billing issues.
It will also vastly reduce billing errors and
estimated bills. As the project evolves,
further functionality will be added,
including automatic alerts to customers
about leaks or unusual consumption
patterns and the ability for customers
to view consumption via an online web
portal.
The meter installation phase of Customer
Connect is expected to be completed in
2020.
12 A Decade of One Water
Responsible Financial ManagementANNUAL FINANCIAL RESULTS
The Utility received a clean audit opinion
for the fiscal year ended March 31, 2017.
The financial statements are presented in
accordance with International Financial
Reporting Standards (IFRS). Halifax Water
also produces financial information in
the format required by the NSUARB - the
NSUARB Accounting and Reporting
Handbook (Handbook) for Water Utilities.
The financial summary information
shown on page 45 of the annual report
aligns with the NSUARB Handbook. The
external financial statements reproduced
on pages 46 to 72 of the annual report
align with IFRS and were prepared in
conjunction with the annual audit by
Grant Thornton. Ongoing differences
between NSUARB and IFRS requirements
will steadily increase as debt increases.
IFRS does introduce more volatility,
particularly around post-employment
benefits. The NSUARB handbook will
continue to be used for rate making
purposes.
The underlying activities and operating
results are similar under the two
standards. The key differences are:
1) IFRS includes depreciation on
contributed assets in the income
statement, resulting in higher
depreciation expense,
2) IFRS includes the amortization
of contributed capital in the income
statement, resulting in higher non-
operating revenue,
3) IFRS requires componentization of
assets records and shorter useful lives,
resulting in higher depreciation expense,
4) IFRS does not permit the
appropriation of long term debt principle
payments in the income statement,
resulting in lower non-operating
expenses,
5) IFRS requires the reporting of
the full actuarial liability of employee
future benefits as Other Comprehensive
Income. This may result in either positive
or negative impacts on income, and
6) IFRS requires contributed capital be
treated as a long-term liability, resulting
in much higher long-term liabilities and
much lower equity.
The Net Income for the year under the
NSUARB Handbook is $8.9 M. Under
IFRS, earnings for the year are $23.2
million, and Total Comprehensive
Earnings are $23.9 million. The
main differences are debt principle
appropriations of $21.3 million that are
not included as an expense under IFRS,
and some differences in how assets
are componentized and depreciated
resulting in $7 million dollars of
additional depreciation expense. ($8.9 M
+ $21.3 M - $7 M = $23.2 M IFRS Earnings
for the Year.) IFRS requires the reporting
of changes in the full actuarial liability
of employee future benefits as Other
Comprehensive Income. This may result
in either positive or negative impacts on
income in any given year. In 2016/17, this
resulted in a small improvement which
is reflected as Other Comprehensive
Income of $700 thousand, bringing
IFRS Total Comprehensive Earnings to
$23.9 million. ($23.2 IFRS Earnings for
the Year, plus $700 thousand Other
Comprehensive Income).
Halifax Water’s cash balances and
liquidity have increased since 2016. Plant
in Service assets, net of Accumulated
Depreciation, is $1.17 billion, $9.7 million
higher than this time last year. A total
of 318 Capital Work Orders were closed
during the year, primarily in the final two
months, representing $49.7 million in
Plant In Service Additions. This was offset
by Retirements of Plant In Service of $2.2
million and Depreciation of $37.8 million.
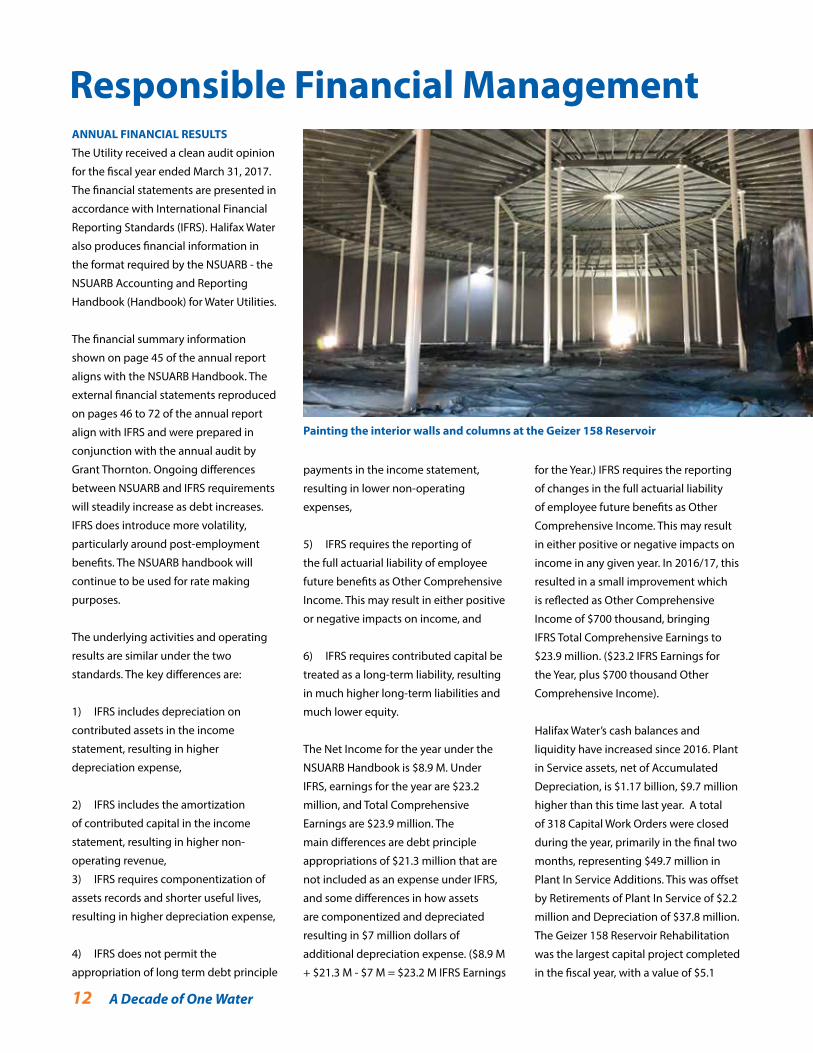
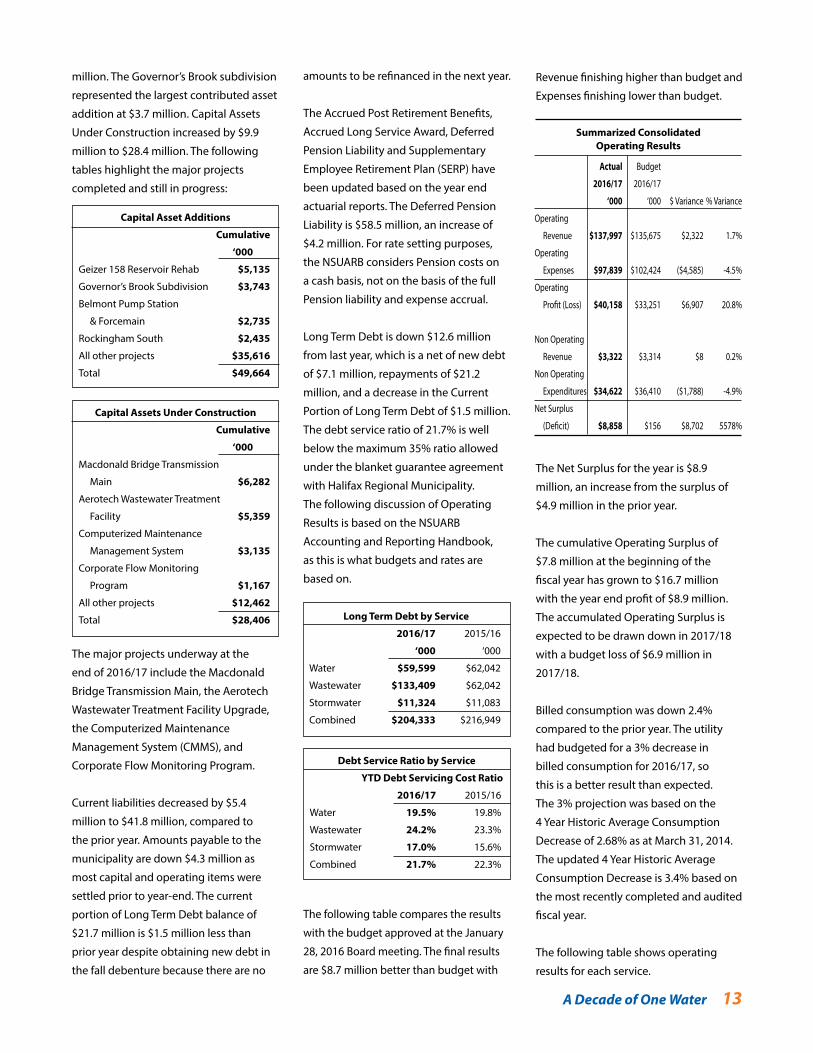
The Geizer 158 Reservoir Rehabilitation
was the largest capital project completed
in the fiscal year, with a value of $5.1
Painting the interior walls and columns at the Geizer 158 Reservoir
A Decade of One Water 13
Revenue finishing higher than budget and
Expenses finishing lower than budget.
The Net Surplus for the year is $8.9
million, an increase from the surplus of
$4.9 million in the prior year.
The cumulative Operating Surplus of
$7.8 million at the beginning of the
fiscal year has grown to $16.7 million
with the year end profit of $8.9 million.
The accumulated Operating Surplus is
expected to be drawn down in 2017/18
with a budget loss of $6.9 million in
2017/18.
Billed consumption was down 2.4%
compared to the prior year. The utility
had budgeted for a 3% decrease in
billed consumption for 2016/17, so
this is a better result than expected.
The 3% projection was based on the
4 Year Historic Average Consumption
Decrease of 2.68% as at March 31, 2014.
The updated 4 Year Historic Average
Consumption Decrease is 3.4% based on
the most recently completed and audited
fiscal year.
The following table shows operating
results for each service.
The following table compares the results
with the budget approved at the January
28, 2016 Board meeting. The final results
are $8.7 million better than budget with
million. The Governor’s Brook subdivision
represented the largest contributed asset
addition at $3.7 million. Capital Assets
Under Construction increased by $9.9
million to $28.4 million. The following
tables highlight the major projects
completed and still in progress:
The major projects underway at the
end of 2016/17 include the Macdonald
Bridge Transmission Main, the Aerotech
Wastewater Treatment Facility Upgrade,
the Computerized Maintenance
Management System (CMMS), and
Corporate Flow Monitoring Program.
Current liabilities decreased by $5.4
million to $41.8 million, compared to
the prior year. Amounts payable to the
municipality are down $4.3 million as
most capital and operating items were
settled prior to year-end. The current
portion of Long Term Debt balance of
$21.7 million is $1.5 million less than
prior year despite obtaining new debt in
the fall debenture because there are no
amounts to be refinanced in the next year.
The Accrued Post Retirement Benefits,
Accrued Long Service Award, Deferred
Pension Liability and Supplementary
Employee Retirement Plan (SERP) have
been updated based on the year end
actuarial reports. The Deferred Pension
Liability is $58.5 million, an increase of
$4.2 million. For rate setting purposes,
the NSUARB considers Pension costs on
a cash basis, not on the basis of the full
Pension liability and expense accrual.
Long Term Debt is down $12.6 million
from last year, which is a net of new debt
of $7.1 million, repayments of $21.2
million, and a decrease in the Current
Portion of Long Term Debt of $1.5 million.
The debt service ratio of 21.7% is well
below the maximum 35% ratio allowed
under the blanket guarantee agreement
with Halifax Regional Municipality.
The following discussion of Operating
Results is based on the NSUARB
Accounting and Reporting Handbook,
as this is what budgets and rates are
based on.
Capital Asset Additions
Cumulative
‘000
Geizer 158 Reservoir Rehab $5,135
Governor’s Brook Subdivision $3,743
Belmont Pump Station
& Forcemain $2,735
Rockingham South $2,435
All other projects $35,616
Total $49,664
Capital Assets Under Construction
Cumulative
‘000
Macdonald Bridge Transmission
Main $6,282
Aerotech Wastewater Treatment
Facility $5,359
Computerized Maintenance
Management System $3,135
Corporate Flow Monitoring
Program $1,167
All other projects $12,462
Total $28,406 Long Term Debt by Service
2016/17 2015/16
‘000 ‘000
Water $59,599 $62,042
Wastewater $133,409 $62,042
Stormwater $11,324 $11,083
Combined $204,333 $216,949
Debt Service Ratio by Service
YTD Debt Servicing Cost Ratio
2016/17 2015/16
Water 19.5% 19.8%
Wastewater 24.2% 23.3%
Stormwater 17.0% 15.6%
Combined 21.7% 22.3%
Actual Budget
2016/17 2016/17
‘000 ‘000 $ Variance % Variance
Operating
Revenue $137,997 $135,675 $2,322 1.7%
Operating
Expenses $97,839 $102,424 ($4,585) -4.5%
Operating
Profit (Loss) $40,158 $33,251 $6,907 20.8%
Non Operating
Revenue $3,322 $3,314 $8 0.2%
Non Operating
Expenditures $34,622 $36,410 ($1,788) -4.9%
Net Surplus
(Deficit) $8,858 $156 $8,702 5578%
Summarized ConsolidatedOperating Results
activities show a profit of $971 thousand
compared to a profit of $855 thousand in
the prior year. The improvement is mainly
due to increased revenue from Septage
Tipping Fees; and there is also increased
income from energy generation
activities.
COST CONTAINMENT
Cost Containment is an on-going focus
for the Utility to help maintain and
stabilize rates. A formal cost containment
program has been in place for four years.
For 2016/17, cost containment initiatives
totaled $5.1 million, and were reported to
the NSUARB on June 30, 2017.
REGULATORY ACTIVITY
On April 1, 2016 rates for water and
wastewater service increased. This was
the the final year of rate increases from
Halifax Water’s November 24, 2014 Rate
Application. No applications for water,
wastewater, or stormwater rate increases
were made in 2016/17, or planned for
2017/18.
From a competitiveness perspective,
Halifax Water’s rates compare very
favorably and continue to be among the
lowest in Canada. The average residential
bill for water, wastewater and stormwater
service is $805 per year, compared to
the average of $889 from benchmarked
Canadian cities.
Halifax Water engaged a consultant to
conduct a Rate Affordability Study in
2016/17. The research addresses the
following questions:
1. Are residential rates for water /
wastewater / stormwater in the service
area covered by Halifax Water affordable
Water Operations
Water Operations show a profit of $3.7
million, compared to a profit of $1.1
million for the previous year. Water
revenue is up $3.3 million. A reduction
in Public Fire Protection revenue is offset
by higher Metered Sales and Private Fire
Protection revenue. Operating Expenses
are up less than $0.1 million, with higher
Administration & Pension offset by
lower Water Supply & Treatment and
Transmission & Distribution.
Wastewater OperationsWastewater Operations show a profit of
$3.4 million, up from a profit of $1.6 million
in the prior year. Wastewater revenue
has increased $3.0 million from the prior
14 A Decade of One Water
Year to Date Operating Results by Service
2016/17 2015/16
‘000 ‘000
Water $3,731 $1,136
Wastewater $3,369 $1,621
Stormwater $1,759 $2,120
Net Surplus
(Deficit) $8,858 $4,877
Results by Activity
2016/17 2015/16
‘000 ‘000
Regulated Activities $7,887 $4,022
Unregulated Activities $971 $855
Net Surplus (Deficit) $8,858 $4,877
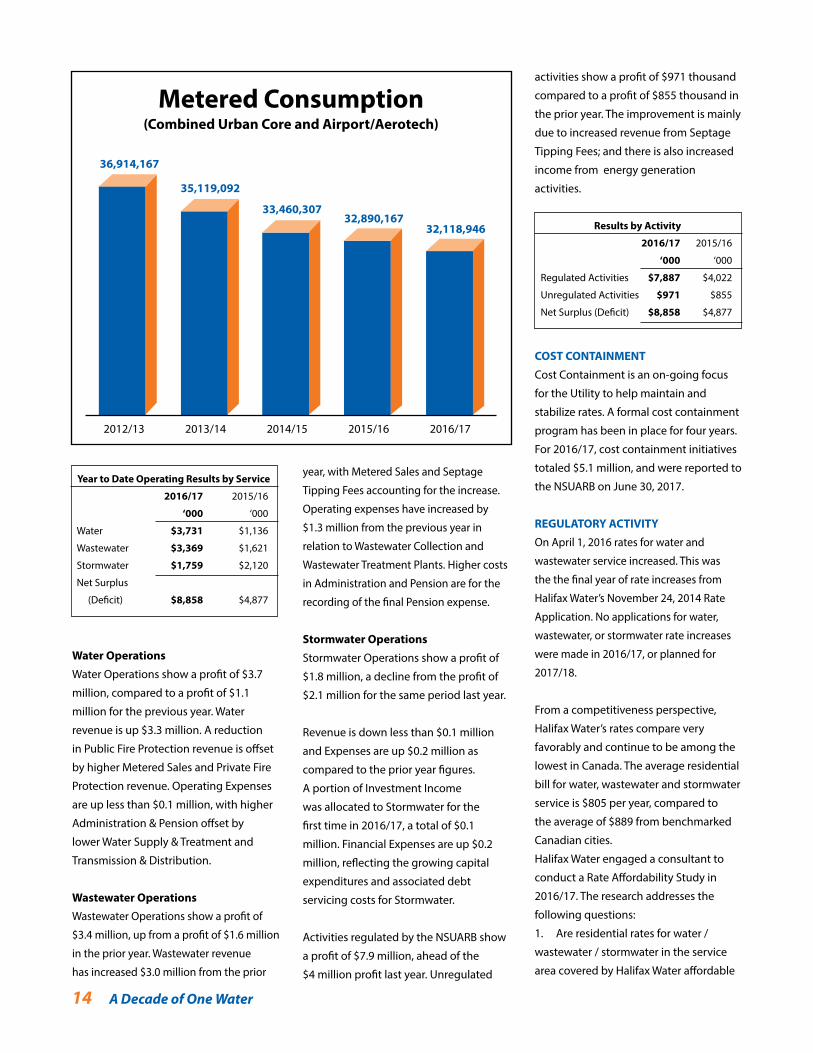
Metered Consumption(Combined Urban Core and Airport/Aerotech)
32,118,94632,890,167
33,460,307
35,119,092
36,914,167
2012/13 2013/14 2014/15 2015/16 2016/17
year, with Metered Sales and Septage
Tipping Fees accounting for the increase.
Operating expenses have increased by
$1.3 million from the previous year in
relation to Wastewater Collection and
Wastewater Treatment Plants. Higher costs
in Administration and Pension are for the
recording of the final Pension expense.
Stormwater Operations
Stormwater Operations show a profit of
$1.8 million, a decline from the profit of
$2.1 million for the same period last year.
Revenue is down less than $0.1 million
and Expenses are up $0.2 million as
compared to the prior year figures.
A portion of Investment Income
was allocated to Stormwater for the
first time in 2016/17, a total of $0.1
million. Financial Expenses are up $0.2
million, reflecting the growing capital
expenditures and associated debt
servicing costs for Stormwater.
Activities regulated by the NSUARB show
a profit of $7.9 million, ahead of the
$4 million profit last year. Unregulated
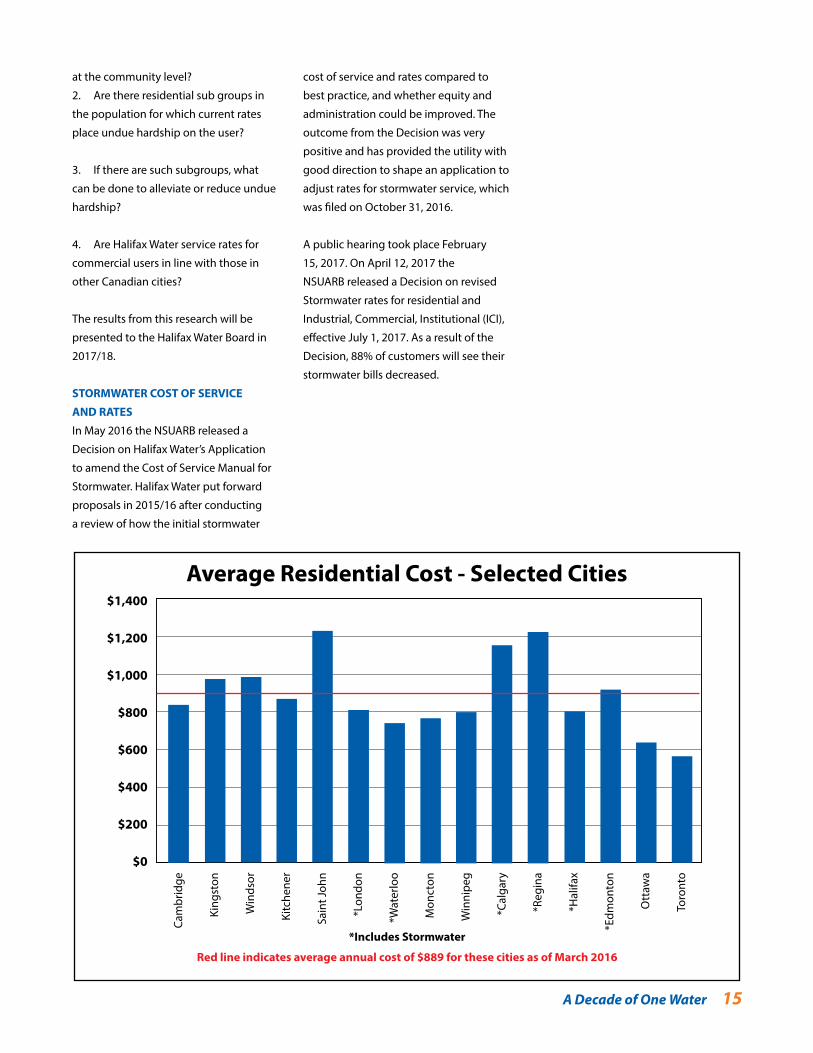
Average Residential Cost - Selected Cities
A Decade of One Water 15
at the community level?
2. Are there residential sub groups in
the population for which current rates
place undue hardship on the user?
3. If there are such subgroups, what
can be done to alleviate or reduce undue
hardship?
4. Are Halifax Water service rates for
commercial users in line with those in
other Canadian cities?
The results from this research will be
presented to the Halifax Water Board in
2017/18.
STORMWATER COST OF SERVICE
AND RATES
In May 2016 the NSUARB released a
Decision on Halifax Water’s Application
to amend the Cost of Service Manual for
Stormwater. Halifax Water put forward
proposals in 2015/16 after conducting
a review of how the initial stormwater
$1,400
$1,200
$1,000
$800
$600
$400
$200
$0
Cam
brid
ge
King
ston
Win
dsor
Kitc
hene
r
Sain
t Joh
n
*Lon
don
*Wat
erlo
o
Mon
cton
Win
nipe
g
*Cal
gary
*Reg
ina
*Hal
ifax
*Edm
onto
n
Ott
awa
Toro
nto
*Includes Stormwater
Red line indicates average annual cost of $889 for these cities as of March 2016
cost of service and rates compared to
best practice, and whether equity and
administration could be improved. The
outcome from the Decision was very
positive and has provided the utility with
good direction to shape an application to
adjust rates for stormwater service, which
was filed on October 31, 2016.
A public hearing took place February
15, 2017. On April 12, 2017 the
NSUARB released a Decision on revised
Stormwater rates for residential and
Industrial, Commercial, Institutional (ICI),
effective July 1, 2017. As a result of the
Decision, 88% of customers will see their
stormwater bills decreased.
16 A Decadeof One Water
help promote accountability in tracking
and closing service requests, and
providing information to customers.
The second major improvement in 2016
was implementation of a Computerized
Maintenance Management System
(CMMS) that enables better management
and operational tracking of repair and
maintenance activities.
In February 2017 Water Operations
calls were centralized. There will be
continued enhancement of Customer
Care with improvements to the website,
development of a Customer Portal in
conjunction with the Customer Connect
project, and investigation of new
telephony systems.
With all water, wastewater, and
stormwater calls directed to the
Customer Care Centre in 2016/17, and the
continued evolution of the maintenance
management system, the utility is well
positioned to be responsive to customer
needs.
Initiatives underway for 2017/18 include
the implementation of a new phone
number (902-420-9287), campaigns to
encourage customers to subscribe to
e-billing, a revised and updated website
and a formal customer complaint
process.
CUSTOMER CARE CENTRE
2016/17 was an exciting year for
customer care service at Halifax Water.
The Commission ended the year with
83,722 water customer connections,
80,143 wastewater customer
connections, and 96,308 stormwater
customers.
Call volumes increased by 3.5% in
2016/17 compared to 2015/16.
Customer Service answered 68,921
calls, and the average speed of answer
was 51 seconds. On average, customer
service answered 300 calls per day with
an average call duration of 4.12 minutes
and an abandon rate of 7%. These results
are viewed positively and represent
improved performance.
Customers also contact Halifax
Water using on-line service requests
and through a generic email
[email protected]. The
email volume in 2016/17 was 9,609,
down 3.5% from 2015/16.
Halifax Water is taking several steps to
improve delivery of customer service
and communication with its customers,
partially as a result of observations
made since implementation of the first
stormwater charges, feedback from
the exemption review process, and
community engagement.
The first major initiative involved
centralizing all calls for water, wastewater
and stormwater service at the utility.
Until March 2016, calls for Wastewater
and Stormwater service were going
through the municipality’s 311
Centre. In February 2016 Halifax Water
implemented a Customer Relationship
Management (CRM) system that will
Service Excellence
A Decade of One Water 17
Effective Asset ManagementCLEAN WATER AND WASTEWATER FUND
On August 16, 2016, Prime Minister
Justin Trudeau, and the Honourable
Stephen McNeil, Premier of Nova Scotia,
announced $238 million for investment
in wastewater and public transit projects
across the province. These expenditures
are part of the first phase of Investing in
Canada, the Government of Canada’s
$120-billion plan to support public
infrastructure across the country over the
next 10 years.
Five projects under the Clean Water &
Wastewater Fund (CWWF) portion of
the program were formally approved
for Halifax Water. The five projects are
highlighted as follows:
1. Northwest Arm Sewer Rehabilitation
Federal/Provincial funding: $12,257,781
The 4.5km Northwest Arm trunk
sewer is over a century old. It is 1200
mm in diameter and a large part of
the line is constructed of clay blocks
mortared together. This line needs to be
structurally renewed to extend its service
life, prevent leakage and overflows into
Northwest Arm.
2. Peninsula Transmission Main
Rehabilitation
Federal/Provincial funding: $5,631,446
This project involves the rehabilitation
of critical water transmission mains in
Halifax for improved service. There has
been significant development activity in
peninsular Halifax in recent years, with
more planned. Increased water supply
is required for future development and
increased densities. This project will
replace the original pipes that have
served the city for over 150 years.
3. Lake Major Dam
Federal/Provincial funding: $3,388,287
A dam is required to impound water
within Lake Major to provide water
supply to the greater Dartmouth area.
A new dam is required to replace the
existing gravity timber and earthen
structure which has reached the end of
its service life.
4. Sullivan’s Pond Storm Sewer
Renewal – Phase 1
Federal/Provincial funding: $6,321,925
The existing storm sewer between
Sullivan’s Pond and Halifax Harbour has
reached the end of its service life. A new
580 metre line was designed, with the
construction completed in two phases
of approximately 290m each. Phase one
from Sullivan’s Pond to Irishtown Road
is approved for funding and will be
completed in 2017.
5. JD Kline Filter Media and Underdrain
Replacement
Federal/Provincial funding: $3,150,120
The J.D. Kline Water Supply Plant supplies
treated water to the communities of
Halifax, Bedford, Sackville, Fall River,
Waverley and Timberlea. This project
involves the replacement of the existing
filter media and underdrains in all eight
filters, the majority of which are beyond
their expected life span.
As of March 31, 2017, all projects were
at or near final design completion with
construction proposed for 2017/18.
The net impact of the CWWF funding
assistance will have a positive impact
on the overall capital funding plan for
Halifax Water in future years and may
reduce debt requirements and rate
impacts or create capacity to fund other
capital projects.
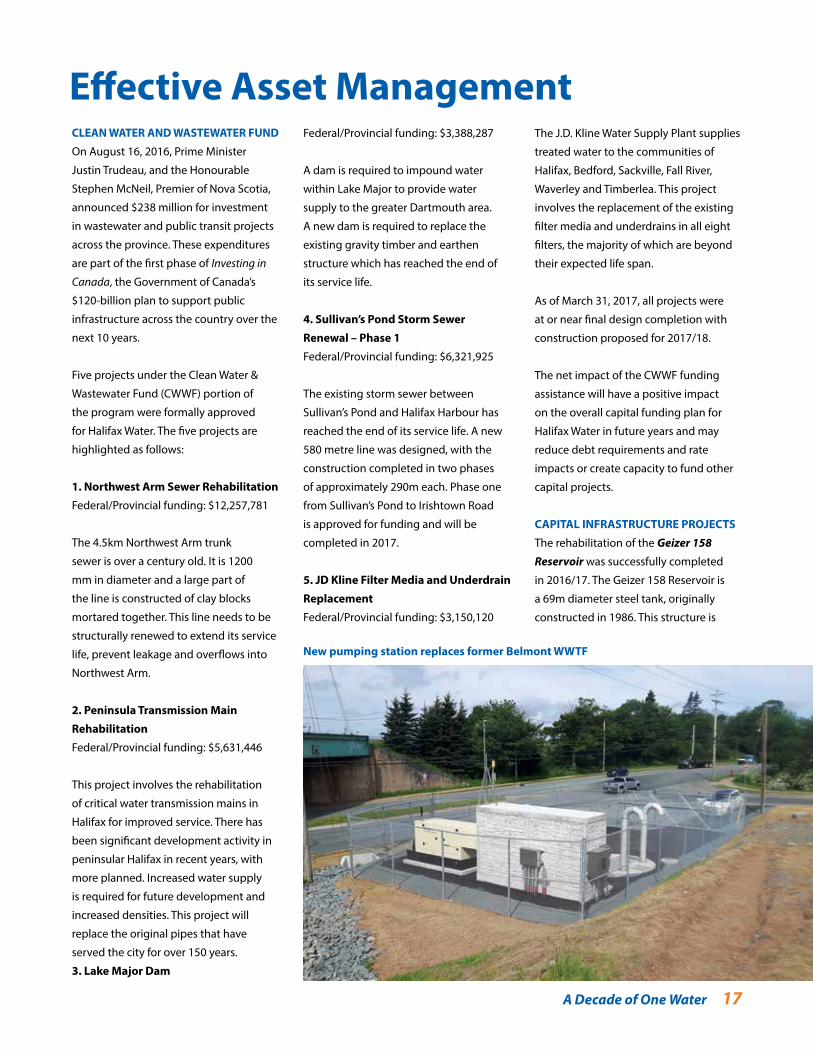
CAPITAL INFRASTRUCTURE PROJECTS
The rehabilitation of the Geizer 158
Reservoir was successfully completed
in 2016/17. The Geizer 158 Reservoir is
a 69m diameter steel tank, originally
constructed in 1986. This structure is
New pumping station replaces former Belmont WWTF
18 A Decade of One Water
the highest and largest storage tank
in the water distribution system in the
West Region. The work involved full
sandblasting, preparation and recoating
of the tank interior, as well as a cleaning
and recoating of the tank exterior.
During the course of sandblasting the
floor, corrosion holes were found in the
floor plate and there were indications
of widespread, severe corrosion on
the underside of the steel floor plate.
Based on industry best practice and
the recommendations of Halifax
Water’s consultant, the solution was the
replacement of the existing floor plate.
The rehabilitation began in May 2016.
The floor replacement was carried out
during the fall of 2016 and the reservoir
was recommissioned and put back into
service in January 2017.
The Chain Control Transmission
Main Realignment project provided
critical upgrades to components of the
original water supply system for Halifax
dating back to the 1800s. The Chain
Control facility feeds three transmission
mains: the 375mm diameter Peninsula
Intermediate (1856), the 600mm
diameter Peninsula Low (1862), and the
675mm diameter Peninsula Low (1892).
These pipelines passed through the
basement of the former Chain Chlorinator
building, which was no longer in use,
and in a deteriorated condition. The
project involved the demolition and
removal of the old Chain Chlorinator
building and associated pipework, with
the site regraded to facilitate improved
municipal parkland/trail access. Three
new sections of transmission mains were
installed through this area, connecting
to the existing transmission mains
downstream on Coronet Avenue. The
work also included the abandonment of
former raw water pipe connections at the
Chain Lake Back-Up Water Supply Station
and the demolition of abandoned valve
chambers on the site.
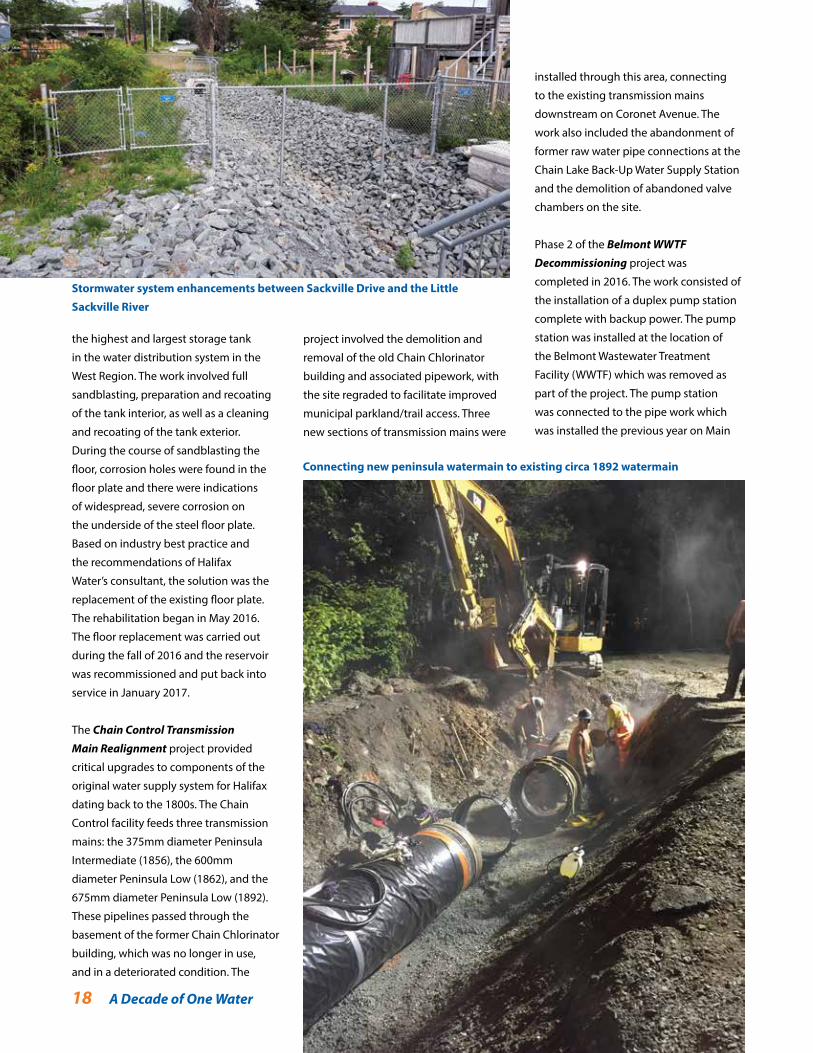
Phase 2 of the Belmont WWTF
Decommissioning project was
completed in 2016. The work consisted of
the installation of a duplex pump station
complete with backup power. The pump
station was installed at the location of
the Belmont Wastewater Treatment
Facility (WWTF) which was removed as
part of the project. The pump station
was connected to the pipe work which
was installed the previous year on Main
Stormwater system enhancements between Sackville Drive and the Little
Sackville River
Connecting new peninsula watermain to existing circa 1892 watermain
A Decade of One Water 19
Rd. The work enabled Halifax Water to
remove the Belmont WWTF to facilitate
compliance with regulations.
The Sackville Cross Road Stormwater
System Renewal project was completed
in 2016. The work consisted of the
replacement of 0.5km of storm sewer
pipe, ranging in size from 300mm to
1200mm, as well as associated manhole
and catchbasin structures. An off street
drainage swale was also reconstructed to
improve system functionality between
Sackville Drive and the Little Sackville
River.
The Aerotech Wastewater Treatment
Facility (AWWTF) Expansion and Upgrade
Project is an excellent example of
investment where long term thinking
and a commitment to balance financial,
social and environmental concerns are
integral to our service delivery.
The AWWTF was originally constructed in
1985. The newly expanded and upgraded
facility will provide tertiary level of
treatment with a capacity of 2000 m3/day.
The key drivers of the AWWTF Project are
regulatory compliance and growth. At a
total project cost of $22 million dollars,
the project is benefiting from $14 million
in cost shared funding from the Federal/
Provincial New Building Canada fund.
Construction of the facility got under way
in September 2016 and is scheduled to
be complete by December 2017.
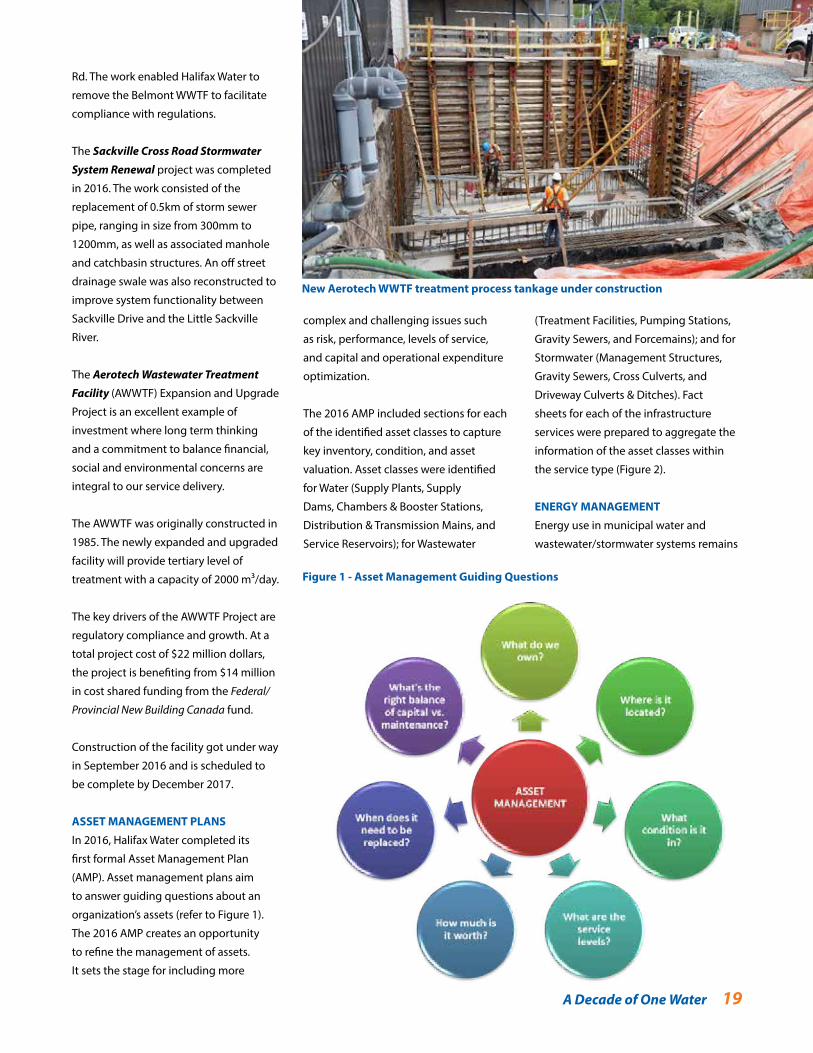
ASSET MANAGEMENT PLANS
In 2016, Halifax Water completed its
first formal Asset Management Plan
(AMP). Asset management plans aim
to answer guiding questions about an
organization’s assets (refer to Figure 1).
The 2016 AMP creates an opportunity
to refine the management of assets.
It sets the stage for including more
complex and challenging issues such
as risk, performance, levels of service,
and capital and operational expenditure
optimization.
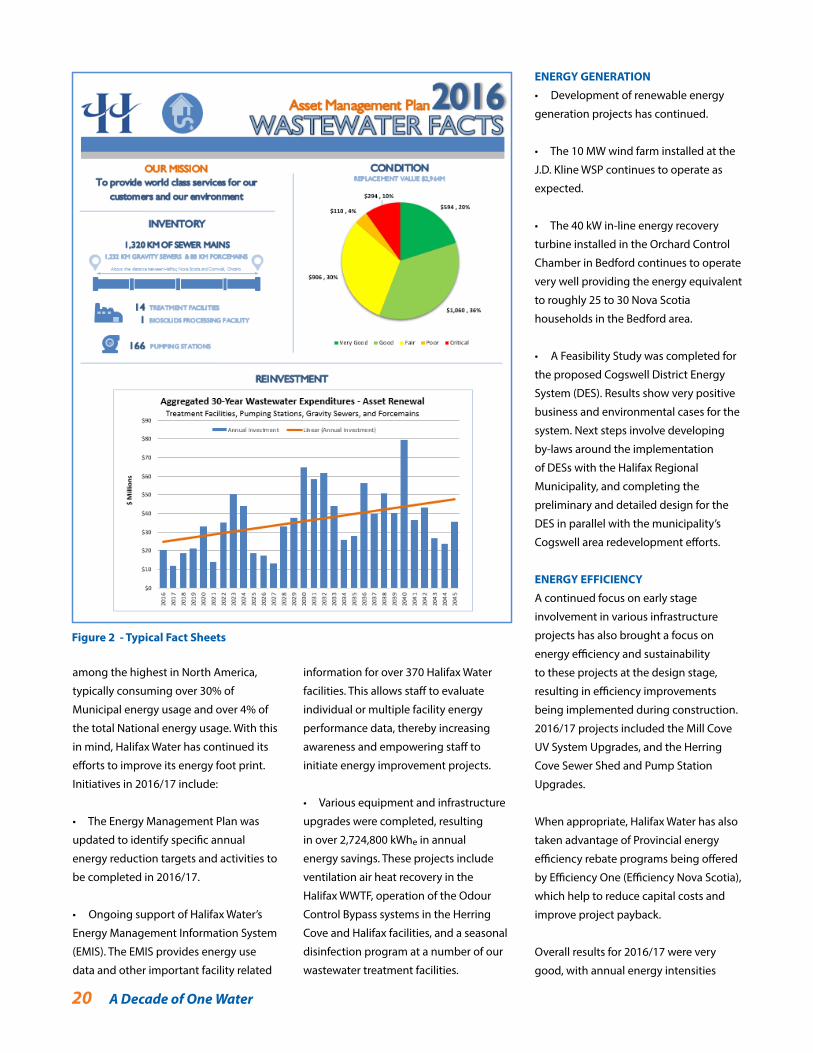
The 2016 AMP included sections for each
of the identified asset classes to capture
key inventory, condition, and asset
valuation. Asset classes were identified
for Water (Supply Plants, Supply
Dams, Chambers & Booster Stations,
Distribution & Transmission Mains, and
Service Reservoirs); for Wastewater
(Treatment Facilities, Pumping Stations,
Gravity Sewers, and Forcemains); and for
Stormwater (Management Structures,
Gravity Sewers, Cross Culverts, and
Driveway Culverts & Ditches). Fact
sheets for each of the infrastructure
services were prepared to aggregate the
information of the asset classes within
the service type (Figure 2).
ENERGY MANAGEMENT
Energy use in municipal water and
wastewater/stormwater systems remains
New Aerotech WWTF treatment process tankage under construction
Figure 1 - Asset Management Guiding Questions
Figure 1 - Asset Management Guiding Questions
20 A Decade of One Water
among the highest in North America,
typically consuming over 30% of
Municipal energy usage and over 4% of
the total National energy usage. With this
in mind, Halifax Water has continued its
efforts to improve its energy foot print.
Initiatives in 2016/17 include:
• The Energy Management Plan was
updated to identify specific annual
energy reduction targets and activities to
be completed in 2016/17.
• Ongoing support of Halifax Water’s
Energy Management Information System
(EMIS). The EMIS provides energy use
data and other important facility related
Figure 1 - Typical Fact Sheet
information for over 370 Halifax Water
facilities. This allows staff to evaluate
individual or multiple facility energy
performance data, thereby increasing
awareness and empowering staff to
initiate energy improvement projects.
• Various equipment and infrastructure
upgrades were completed, resulting
in over 2,724,800 kWhe in annual
energy savings. These projects include
ventilation air heat recovery in the
Halifax WWTF, operation of the Odour
Control Bypass systems in the Herring
Cove and Halifax facilities, and a seasonal
disinfection program at a number of our
wastewater treatment facilities.
ENERGY GENERATION
• Development of renewable energy
generation projects has continued.
• The 10 MW wind farm installed at the
J.D. Kline WSP continues to operate as
expected.
• The 40 kW in-line energy recovery
turbine installed in the Orchard Control
Chamber in Bedford continues to operate
very well providing the energy equivalent
to roughly 25 to 30 Nova Scotia
households in the Bedford area.
• A Feasibility Study was completed for
the proposed Cogswell District Energy
System (DES). Results show very positive
business and environmental cases for the
system. Next steps involve developing
by-laws around the implementation
of DESs with the Halifax Regional
Municipality, and completing the
preliminary and detailed design for the
DES in parallel with the municipality’s
Cogswell area redevelopment efforts.
ENERGY EFFICIENCY
A continued focus on early stage
involvement in various infrastructure
projects has also brought a focus on
energy efficiency and sustainability
to these projects at the design stage,
resulting in efficiency improvements
being implemented during construction.
2016/17 projects included the Mill Cove
UV System Upgrades, and the Herring
Cove Sewer Shed and Pump Station
Upgrades.
When appropriate, Halifax Water has also
taken advantage of Provincial energy
efficiency rebate programs being offered
by Efficiency One (Efficiency Nova Scotia),
which help to reduce capital costs and
improve project payback.
Overall results for 2016/17 were very
good, with annual energy intensities
Figure 2 - Typical Fact Sheets
A Decade of One Water 21
for the organization being reduced by
approximately 5.8% in 2016/17 compared
to 2015/16. A focus on further energy
efficiency and operational improvements
to existing infrastructure in the coming
years will allow Halifax Water to continue
to build on these results.
INFORMATION SERVICES
Information Services (IS) delivered
on several business transformation
initiatives at Halifax Water. The first
major deliverable was to support work
order tracking for linear systems (pipes)
through a Computerized Maintenance
Management System (CMMS). Known
as City Works, the plan is to expand its
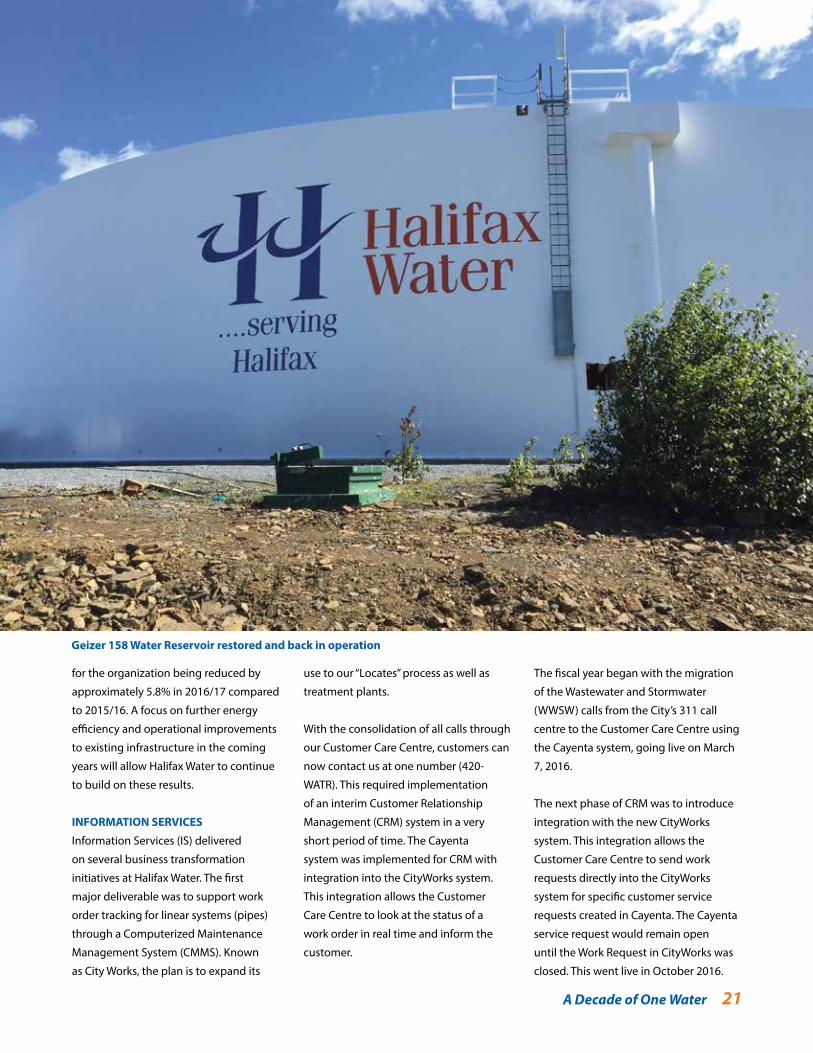
Geizer 158 Water Reservoir restored and back in operation
use to our “Locates” process as well as
treatment plants.
With the consolidation of all calls through
our Customer Care Centre, customers can
now contact us at one number (420-
WATR). This required implementation
of an interim Customer Relationship
Management (CRM) system in a very
short period of time. The Cayenta
system was implemented for CRM with
integration into the CityWorks system.
This integration allows the Customer
Care Centre to look at the status of a
work order in real time and inform the
customer.
The fiscal year began with the migration
of the Wastewater and Stormwater
(WWSW) calls from the City’s 311 call
centre to the Customer Care Centre using
the Cayenta system, going live on March
7, 2016.
The next phase of CRM was to introduce
integration with the new CityWorks
system. This integration allows the
Customer Care Centre to send work
requests directly into the CityWorks
system for specific customer service
requests created in Cayenta. The Cayenta
service request would remain open
until the Work Request in CityWorks was
closed. This went live in October 2016.
22 A Decade of One Water
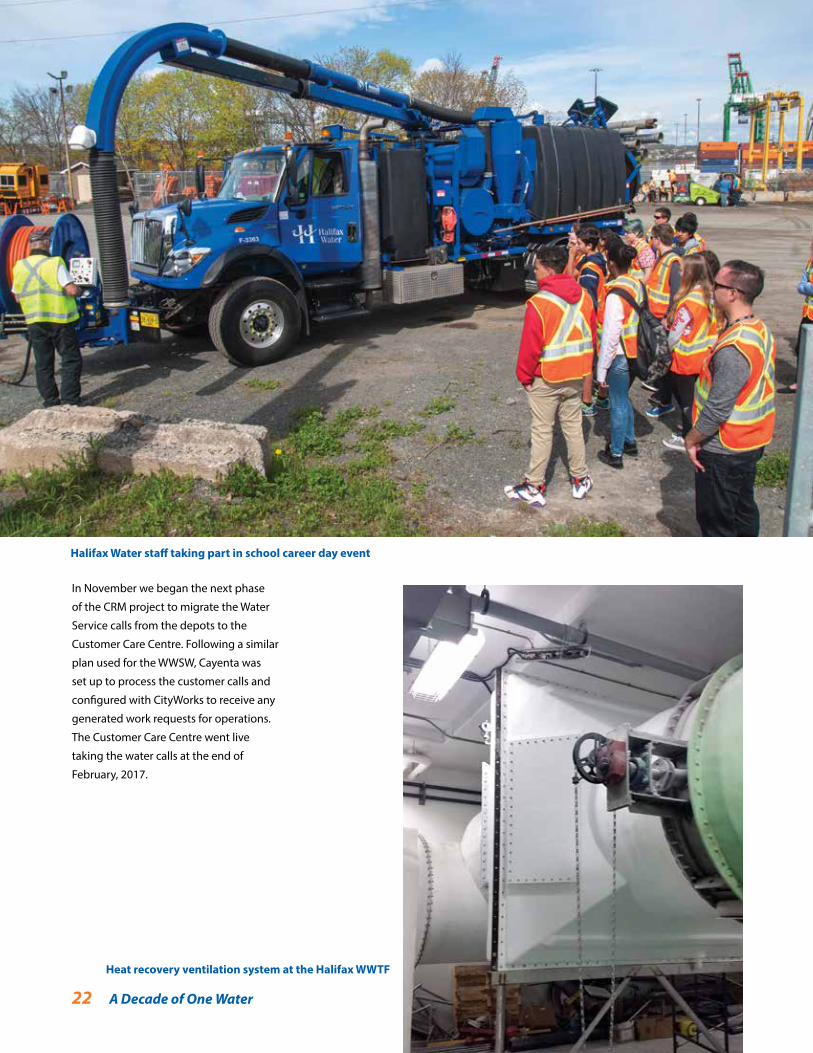
Halifax Water staff taking part in school career day event
In November we began the next phase
of the CRM project to migrate the Water
Service calls from the depots to the
Customer Care Centre. Following a similar
plan used for the WWSW, Cayenta was
set up to process the customer calls and
configured with CityWorks to receive any
generated work requests for operations.
The Customer Care Centre went live
taking the water calls at the end of
February, 2017.
Heat recovery ventilation system at the Halifax WWTF
A Decade of One Water 23
Regulatory ComplianceThe Engineering Approvals group is
focused on adherence to the Halifax Water
Design Specifications, the Supplementary
Standard Specification and the Schedule
of Rates, Rules and Regulations
with respect to connections to, and
expansions of Halifax Water systems. The
administration of new service connections
includes the administration of the
Regional Development Charge.
In 2016/17, the Engineering Approvals
group processed a significant volume of
applications, as follows:
Application Amount
Type Processed
Building Permit
Applications approved 650
New Service & Renewal
Applications approved 379
Subdivision Applications 292
Demolition Permits 115
Clearance Letters 32
Tender Reviews 95
New Backflow Prevention
Applications 93
Backflow Prevention
Devices in Halifax Water’s
distribution system 6604
ENVIRONMENTAL MANAGEMENT
SYSTEM
The International Standards Organization
(ISO) establishes standards for a
variety of processes and products. The
standard pertaining to Environmental
Management Systems (EMS) is 14001-
2004 and requires an organization to:
1. Establish an environmental policy.
2. Identify environmental aspects that
can impact the environment.
3. Identify our applicable legal
requirements.
4. Set appropriate environmental
objectives and targets.
5. Establish programs to implement
our policy, achieve objectives and meet
targets.
6. Periodically audit and review
activities to ensure that the policy is
complied with and the environmental
management system remains
appropriate.
7. Be capable of adapting to changing
circumstances.
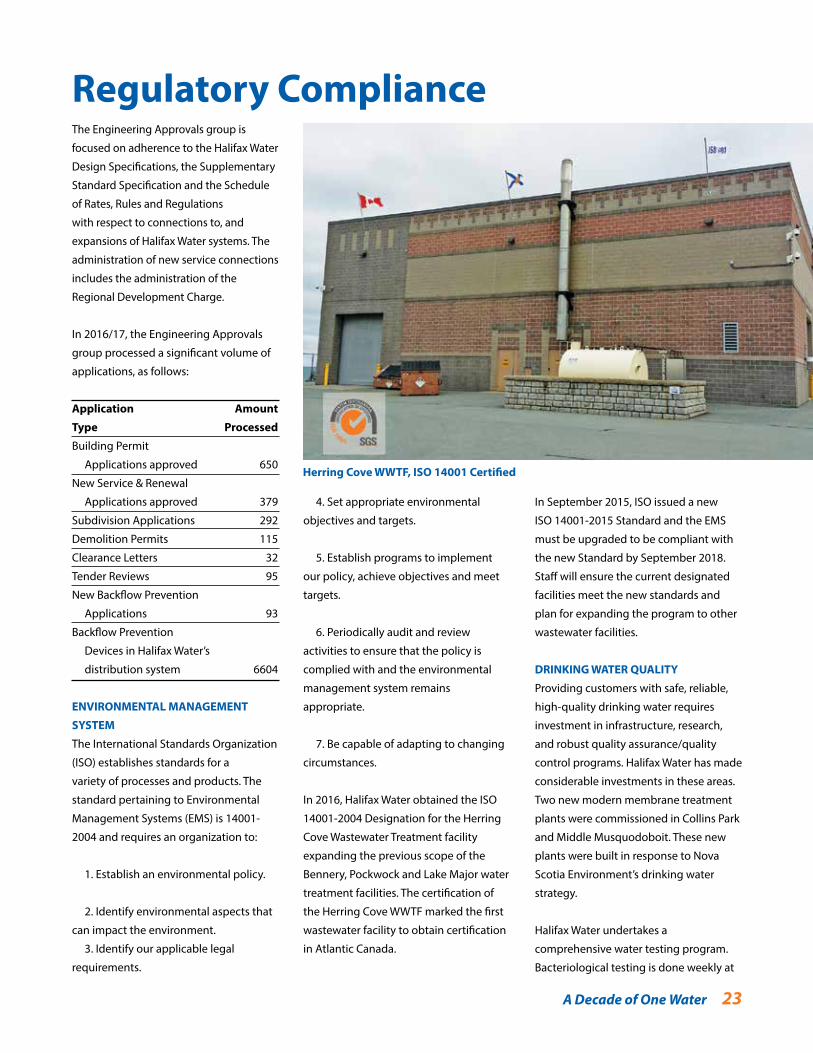
In 2016, Halifax Water obtained the ISO
14001-2004 Designation for the Herring
Cove Wastewater Treatment facility
expanding the previous scope of the
Bennery, Pockwock and Lake Major water
treatment facilities. The certification of
the Herring Cove WWTF marked the first
wastewater facility to obtain certification
in Atlantic Canada.
In September 2015, ISO issued a new
ISO 14001-2015 Standard and the EMS
must be upgraded to be compliant with
the new Standard by September 2018.
Staff will ensure the current designated
facilities meet the new standards and
plan for expanding the program to other
wastewater facilities.
DRINKING WATER QUALITY
Providing customers with safe, reliable,
high-quality drinking water requires
investment in infrastructure, research,
and robust quality assurance/quality
control programs. Halifax Water has made
considerable investments in these areas.
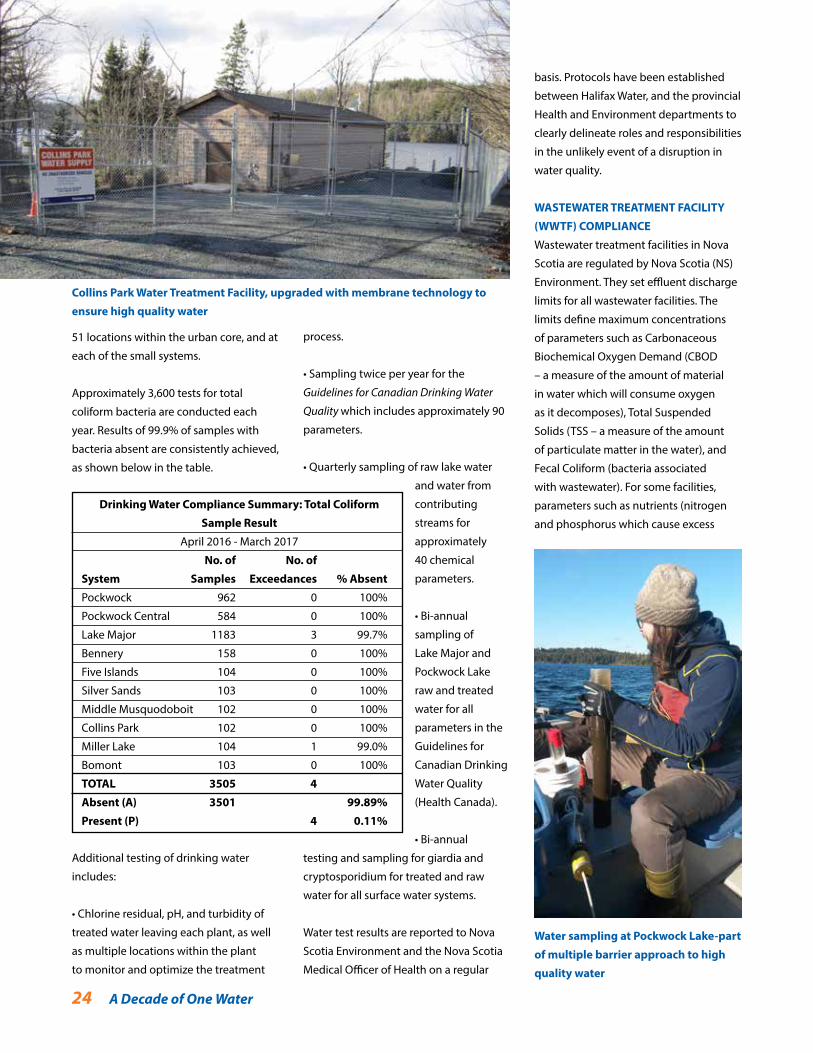
Two new modern membrane treatment
plants were commissioned in Collins Park
and Middle Musquodoboit. These new
plants were built in response to Nova
Scotia Environment’s drinking water
strategy.
Halifax Water undertakes a
comprehensive water testing program.
Bacteriological testing is done weekly at
Herring Cove WWTF, ISO 14001 Certified
24 A Decade of One Water
51 locations within the urban core, and at
each of the small systems.
Approximately 3,600 tests for total
coliform bacteria are conducted each
year. Results of 99.9% of samples with
bacteria absent are consistently achieved,
as shown below in the table.
Additional testing of drinking water
includes:
• Chlorine residual, pH, and turbidity of
treated water leaving each plant, as well
as multiple locations within the plant
to monitor and optimize the treatment
basis. Protocols have been established
between Halifax Water, and the provincial
Health and Environment departments to
clearly delineate roles and responsibilities
in the unlikely event of a disruption in
water quality.
WASTEWATER TREATMENT FACILITY
(WWTF) COMPLIANCE
Wastewater treatment facilities in Nova
Scotia are regulated by Nova Scotia (NS)
Environment. They set effluent discharge
limits for all wastewater facilities. The
limits define maximum concentrations
of parameters such as Carbonaceous
Biochemical Oxygen Demand (CBOD
– a measure of the amount of material
in water which will consume oxygen
as it decomposes), Total Suspended
Solids (TSS – a measure of the amount
of particulate matter in the water), and
Fecal Coliform (bacteria associated
with wastewater). For some facilities,
parameters such as nutrients (nitrogen
and phosphorus which cause excess
Collins Park Water Treatment Facility, upgraded with membrane technology to
ensure high quality water
Drinking Water Compliance Summary: Total Coliform
Sample Result
April 2016 - March 2017
No. of No. of
System Samples Exceedances % Absent
Pockwock 962 0 100%
Pockwock Central 584 0 100%
Lake Major 1183 3 99.7%
Bennery 158 0 100%
Five Islands 104 0 100%
Silver Sands 103 0 100%
Middle Musquodoboit 102 0 100%
Collins Park 102 0 100%
Miller Lake 104 1 99.0%
Bomont 103 0 100%
TOTAL 3505 4
Absent (A) 3501 99.89%
Present (P) 4 0.11%
Water sampling at Pockwock Lake-part
of multiple barrier approach to high
quality water
process.
• Sampling twice per year for the
Guidelines for Canadian Drinking Water
Quality which includes approximately 90
parameters.
• Quarterly sampling of raw lake water
and water from
contributing
streams for
approximately
40 chemical
parameters.
• Bi-annual
sampling of
Lake Major and
Pockwock Lake
raw and treated
water for all
parameters in the
Guidelines for
Canadian Drinking
Water Quality
(Health Canada).
• Bi-annual
testing and sampling for giardia and
cryptosporidium for treated and raw
water for all surface water systems.
Water test results are reported to Nova
Scotia Environment and the Nova Scotia
Medical Officer of Health on a regular
A Decade of One Water 25
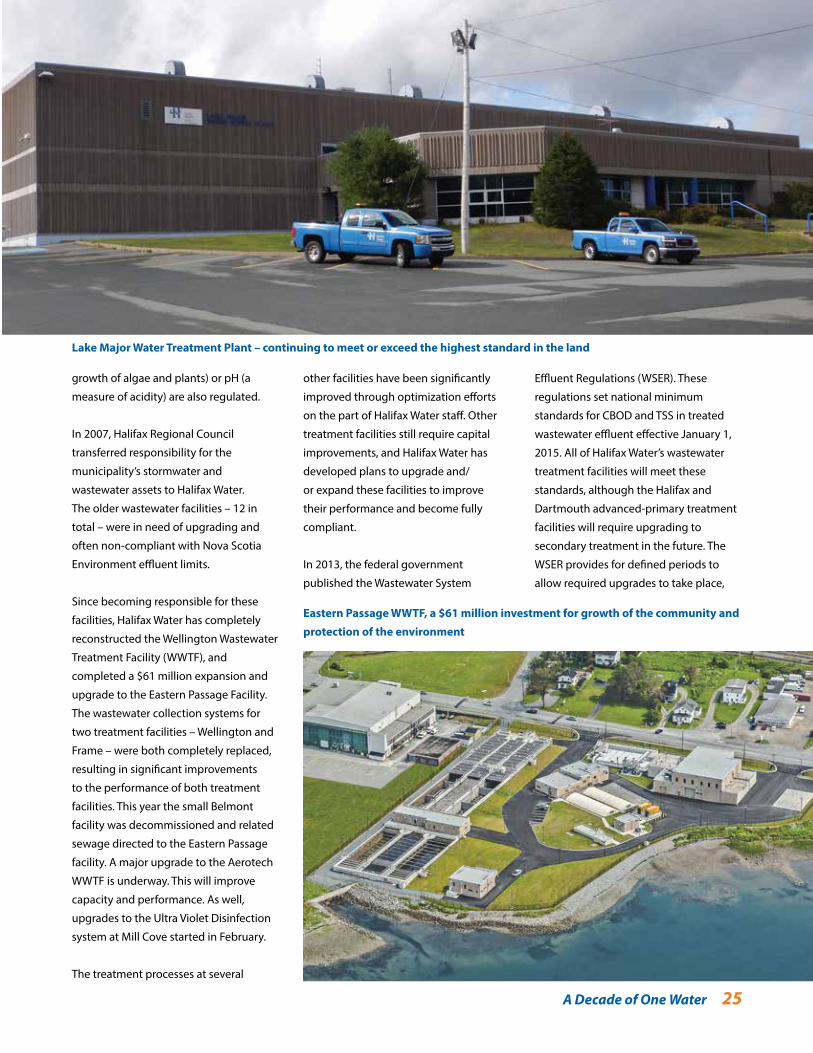
Lake Major Water Treatment Plant – continuing to meet or exceed the highest standard in the land
Eastern Passage WWTF, a $61 million investment for growth of the community and
protection of the environment
growth of algae and plants) or pH (a
measure of acidity) are also regulated.
In 2007, Halifax Regional Council
transferred responsibility for the
municipality’s stormwater and
wastewater assets to Halifax Water.
The older wastewater facilities – 12 in
total – were in need of upgrading and
often non-compliant with Nova Scotia
Environment effluent limits.
Since becoming responsible for these
facilities, Halifax Water has completely
reconstructed the Wellington Wastewater
Treatment Facility (WWTF), and
completed a $61 million expansion and
upgrade to the Eastern Passage Facility.
The wastewater collection systems for
two treatment facilities – Wellington and
Frame – were both completely replaced,
resulting in significant improvements
to the performance of both treatment
facilities. This year the small Belmont
facility was decommissioned and related
sewage directed to the Eastern Passage
facility. A major upgrade to the Aerotech
WWTF is underway. This will improve
capacity and performance. As well,
upgrades to the Ultra Violet Disinfection
system at Mill Cove started in February.
The treatment processes at several
other facilities have been significantly
improved through optimization efforts
on the part of Halifax Water staff. Other
treatment facilities still require capital
improvements, and Halifax Water has
developed plans to upgrade and/
or expand these facilities to improve
their performance and become fully
compliant.
In 2013, the federal government
published the Wastewater System
Effluent Regulations (WSER). These
regulations set national minimum
standards for CBOD and TSS in treated
wastewater effluent effective January 1,
2015. All of Halifax Water’s wastewater
treatment facilities will meet these
standards, although the Halifax and
Dartmouth advanced-primary treatment
facilities will require upgrading to
secondary treatment in the future. The
WSER provides for defined periods to
allow required upgrades to take place,
26 A Decade of One Water
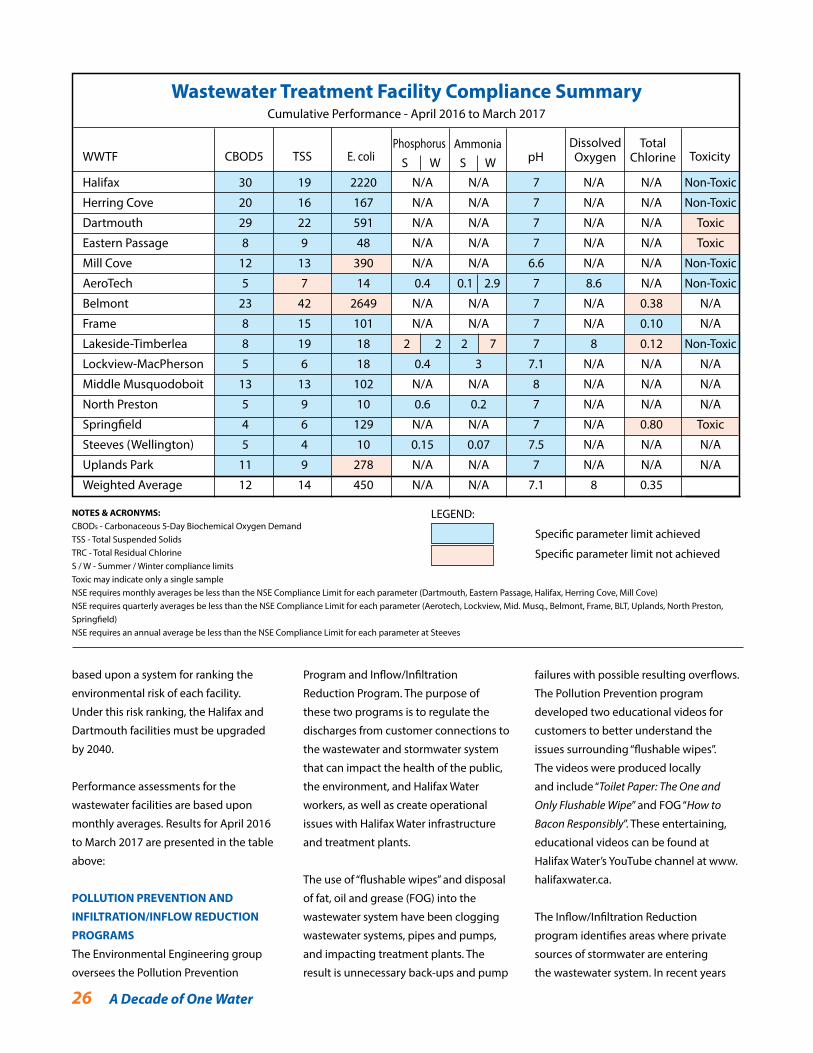
LEGEND:
Specific parameter limit achieved
Specific parameter limit not achieved
NOTES & ACRONYMS:CBOD5 - Carbonaceous 5-Day Biochemical Oxygen Demand TSS - Total Suspended SolidsTRC - Total Residual ChlorineS / W - Summer / Winter compliance limitsToxic may indicate only a single sampleNSE requires monthly averages be less than the NSE Compliance Limit for each parameter (Dartmouth, Eastern Passage, Halifax, Herring Cove, Mill Cove)NSE requires quarterly averages be less than the NSE Compliance Limit for each parameter (Aerotech, Lockview, Mid. Musq., Belmont, Frame, BLT, Uplands, North Preston, Springfield)NSE requires an annual average be less than the NSE Compliance Limit for each parameter at Steeves
Wastewater Treatment Facility Compliance SummaryCumulative Performance - April 2016 to March 2017
WWTFDissolved Oxygen
Total ChlorineCBOD5 TSS E. coli
Phosphorus AmmoniaToxicitypH S W S W
Halifax 30 19 2220 N/A N/A 7 N/A N/A Non-Toxic
Herring Cove 20 16 167 N/A N/A 7 N/A N/A Non-Toxic
Dartmouth 29 22 591 N/A N/A 7 N/A N/A Toxic
Eastern Passage 8 9 48 N/A N/A 7 N/A N/A Toxic
Mill Cove 12 13 390 N/A N/A 6.6 N/A N/A Non-Toxic
AeroTech 5 7 14 0.4 0.1 2.9 7 8.6 N/A Non-Toxic
Belmont 23 42 2649 N/A N/A 7 N/A 0.38 N/A
Frame 8 15 101 N/A N/A 7 N/A 0.10 N/A
Lakeside-Timberlea 8 19 18 2 2 2 7 7 8 0.12 Non-Toxic
Lockview-MacPherson 5 6 18 0.4 3 7.1 N/A N/A N/A
Middle Musquodoboit 13 13 102 N/A N/A 8 N/A N/A N/A
North Preston 5 9 10 0.6 0.2 7 N/A N/A N/A
Springfield 4 6 129 N/A N/A 7 N/A 0.80 Toxic
Steeves (Wellington) 5 4 10 0.15 0.07 7.5 N/A N/A N/A
Uplands Park 11 9 278 N/A N/A 7 N/A N/A N/A
Weighted Average 12 14 450 N/A N/A 7.1 8 0.35
based upon a system for ranking the
environmental risk of each facility.
Under this risk ranking, the Halifax and
Dartmouth facilities must be upgraded
by 2040.
Performance assessments for the
wastewater facilities are based upon
monthly averages. Results for April 2016
to March 2017 are presented in the table
above:
POLLUTION PREVENTION AND
INFILTRATION/INFLOW REDUCTION
PROGRAMS
The Environmental Engineering group
oversees the Pollution Prevention
Program and Inflow/Infiltration
Reduction Program. The purpose of
these two programs is to regulate the
discharges from customer connections to
the wastewater and stormwater system
that can impact the health of the public,
the environment, and Halifax Water
workers, as well as create operational
issues with Halifax Water infrastructure
and treatment plants.
The use of “flushable wipes” and disposal
of fat, oil and grease (FOG) into the
wastewater system have been clogging
wastewater systems, pipes and pumps,
and impacting treatment plants. The
result is unnecessary back-ups and pump
failures with possible resulting overflows.
The Pollution Prevention program
developed two educational videos for
customers to better understand the
issues surrounding “flushable wipes”.
The videos were produced locally
and include “Toilet Paper: The One and
Only Flushable Wipe” and FOG “How to
Bacon Responsibly”. These entertaining,
educational videos can be found at
Halifax Water’s YouTube channel at www.
halifaxwater.ca.
The Inflow/Infiltration Reduction
program identifies areas where private
sources of stormwater are entering
the wastewater system. In recent years
A Decade of One Water 27
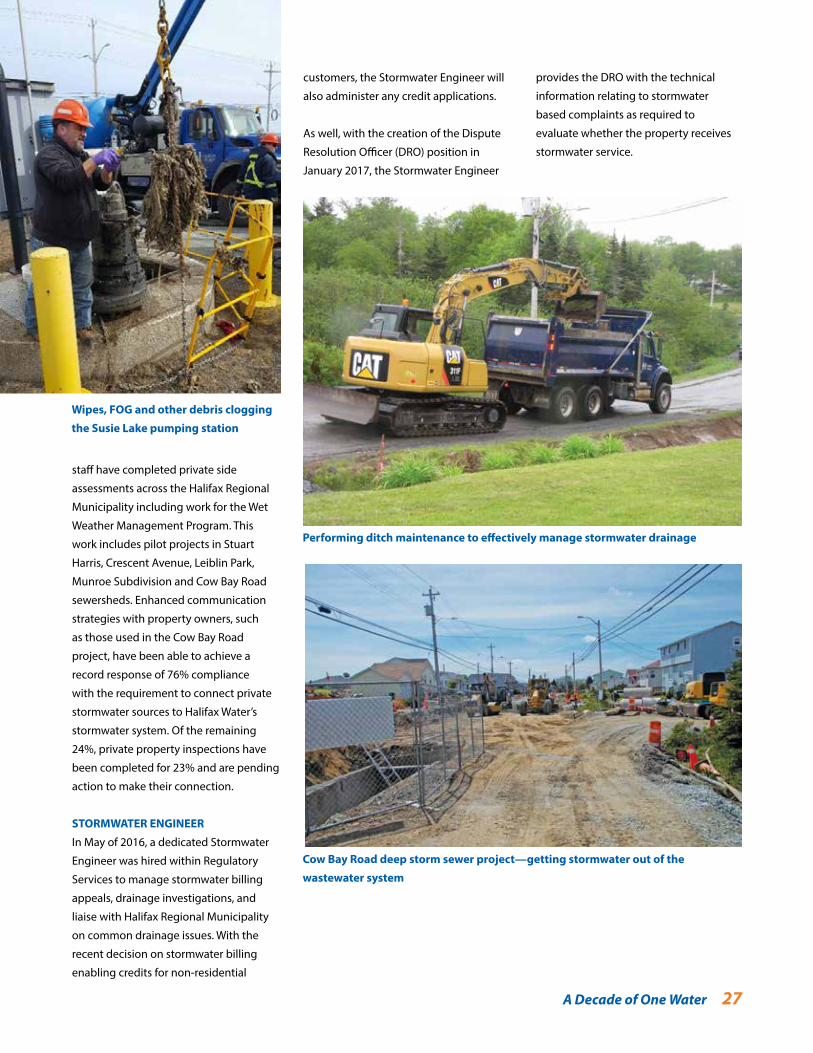
Cow Bay Road deep storm sewer project—getting stormwater out of the
wastewater system
Performing ditch maintenance to effectively manage stormwater drainage
Wipes, FOG and other debris clogging
the Susie Lake pumping station
staff have completed private side
assessments across the Halifax Regional
Municipality including work for the Wet
Weather Management Program. This
work includes pilot projects in Stuart
Harris, Crescent Avenue, Leiblin Park,
Munroe Subdivision and Cow Bay Road
sewersheds. Enhanced communication
strategies with property owners, such
as those used in the Cow Bay Road
project, have been able to achieve a
record response of 76% compliance
with the requirement to connect private
stormwater sources to Halifax Water’s
stormwater system. Of the remaining
24%, private property inspections have
been completed for 23% and are pending
action to make their connection.
STORMWATER ENGINEER
In May of 2016, a dedicated Stormwater
Engineer was hired within Regulatory
Services to manage stormwater billing
appeals, drainage investigations, and
liaise with Halifax Regional Municipality
on common drainage issues. With the
recent decision on stormwater billing
enabling credits for non-residential
customers, the Stormwater Engineer will
also administer any credit applications.
As well, with the creation of the Dispute
Resolution Officer (DRO) position in
January 2017, the Stormwater Engineer
provides the DRO with the technical
information relating to stormwater
based complaints as required to
evaluate whether the property receives
stormwater service.
28 A Decade of One Water
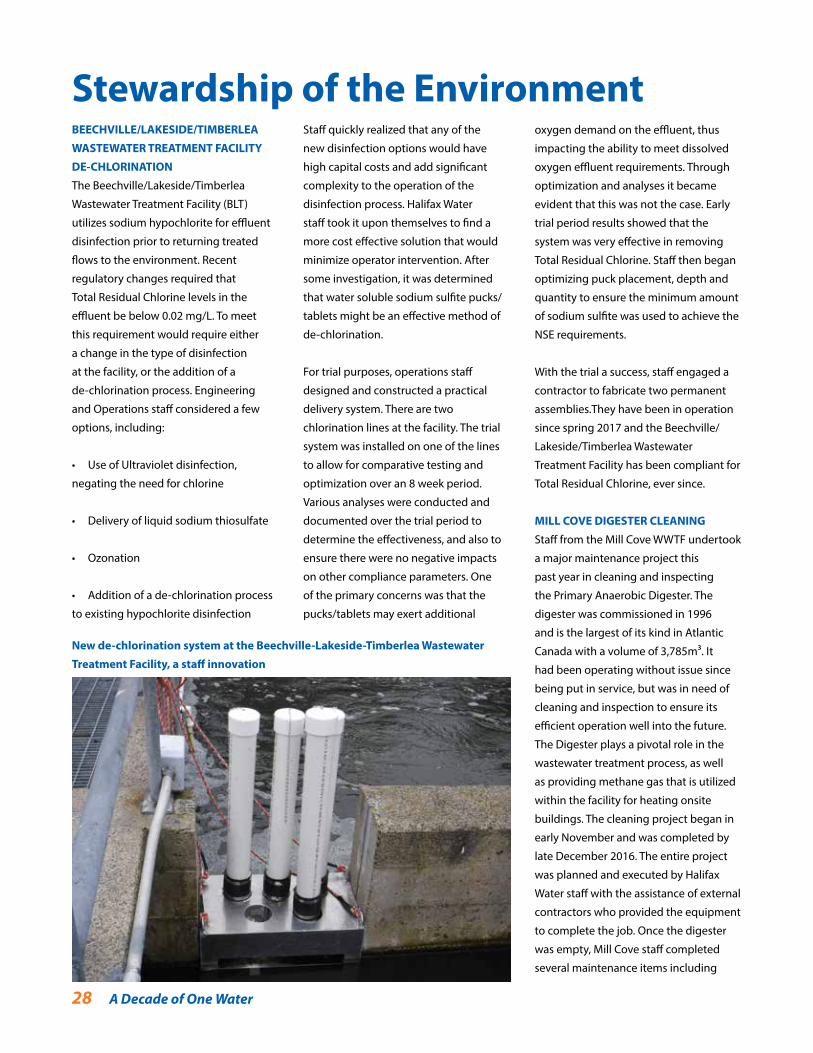
Stewardship of the EnvironmentBEECHVILLE/LAKESIDE/TIMBERLEA
WASTEWATER TREATMENT FACILITY
DE-CHLORINATION
The Beechville/Lakeside/Timberlea
Wastewater Treatment Facility (BLT)
utilizes sodium hypochlorite for effluent
disinfection prior to returning treated
flows to the environment. Recent
regulatory changes required that
Total Residual Chlorine levels in the
effluent be below 0.02 mg/L. To meet
this requirement would require either
a change in the type of disinfection
at the facility, or the addition of a
de-chlorination process. Engineering
and Operations staff considered a few
options, including:
• Use of Ultraviolet disinfection,
negating the need for chlorine
• Delivery of liquid sodium thiosulfate
• Ozonation
• Addition of a de-chlorination process
to existing hypochlorite disinfection
Staff quickly realized that any of the
new disinfection options would have
high capital costs and add significant
complexity to the operation of the
disinfection process. Halifax Water
staff took it upon themselves to find a
more cost effective solution that would
minimize operator intervention. After
some investigation, it was determined
that water soluble sodium sulfite pucks/
tablets might be an effective method of
de-chlorination.
For trial purposes, operations staff
designed and constructed a practical
delivery system. There are two
chlorination lines at the facility. The trial
system was installed on one of the lines
to allow for comparative testing and
optimization over an 8 week period.
Various analyses were conducted and
documented over the trial period to
determine the effectiveness, and also to
ensure there were no negative impacts
on other compliance parameters. One
of the primary concerns was that the
pucks/tablets may exert additional
oxygen demand on the effluent, thus
impacting the ability to meet dissolved
oxygen effluent requirements. Through
optimization and analyses it became
evident that this was not the case. Early
trial period results showed that the
system was very effective in removing
Total Residual Chlorine. Staff then began
optimizing puck placement, depth and
quantity to ensure the minimum amount
of sodium sulfite was used to achieve the
NSE requirements.
With the trial a success, staff engaged a
contractor to fabricate two permanent
assemblies.They have been in operation
since spring 2017 and the Beechville/
Lakeside/Timberlea Wastewater
Treatment Facility has been compliant for
Total Residual Chlorine, ever since.
MILL COVE DIGESTER CLEANING
Staff from the Mill Cove WWTF undertook
a major maintenance project this
past year in cleaning and inspecting
the Primary Anaerobic Digester. The
digester was commissioned in 1996
and is the largest of its kind in Atlantic
Canada with a volume of 3,785m3. It
had been operating without issue since
being put in service, but was in need of
cleaning and inspection to ensure its
efficient operation well into the future.
The Digester plays a pivotal role in the
wastewater treatment process, as well
as providing methane gas that is utilized
within the facility for heating onsite
buildings. The cleaning project began in
early November and was completed by
late December 2016. The entire project
was planned and executed by Halifax
Water staff with the assistance of external
contractors who provided the equipment
to complete the job. Once the digester
was empty, Mill Cove staff completed
several maintenance items including
New de-chlorination system at the Beechville-Lakeside-Timberlea Wastewater
Treatment Facility, a staff innovation
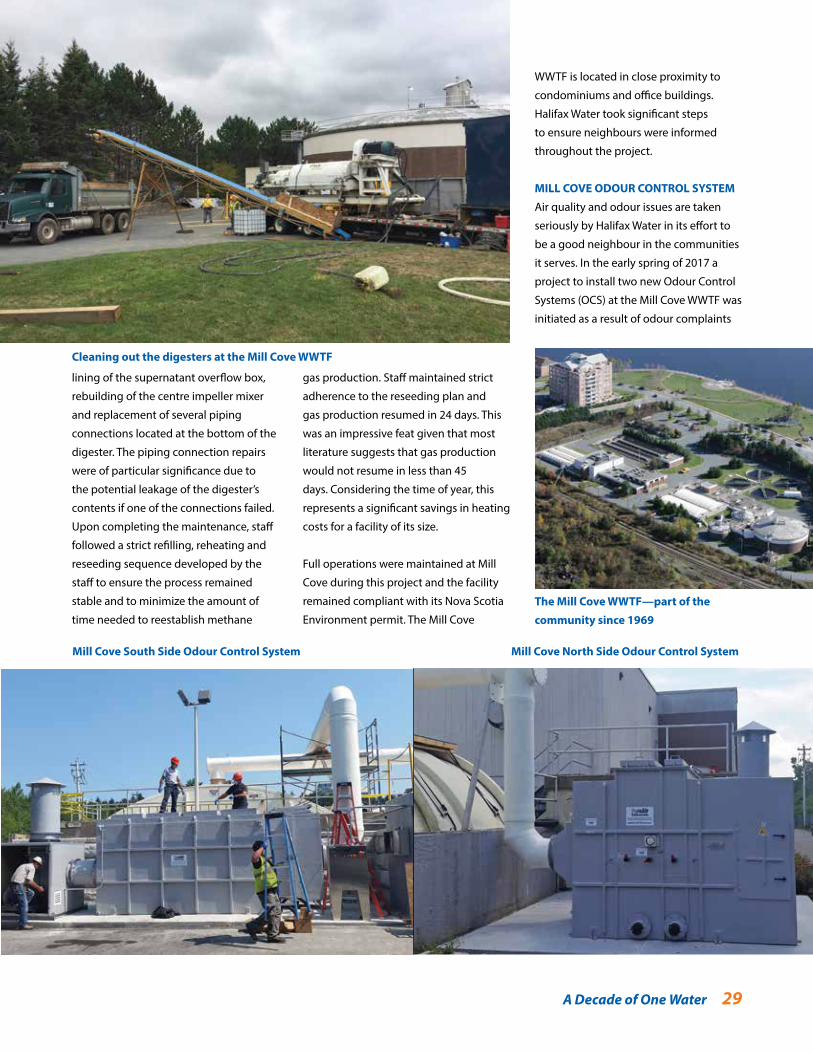
A Decade of One Water 29
lining of the supernatant overflow box,
rebuilding of the centre impeller mixer
and replacement of several piping
connections located at the bottom of the
digester. The piping connection repairs
were of particular significance due to
the potential leakage of the digester’s
contents if one of the connections failed.
Upon completing the maintenance, staff
followed a strict refilling, reheating and
reseeding sequence developed by the
staff to ensure the process remained
stable and to minimize the amount of
time needed to reestablish methane
Cleaning out the digesters at the Mill Cove WWTF
The Mill Cove WWTF—part of the
community since 1969
gas production. Staff maintained strict
adherence to the reseeding plan and
gas production resumed in 24 days. This
was an impressive feat given that most
literature suggests that gas production
would not resume in less than 45
days. Considering the time of year, this
represents a significant savings in heating
costs for a facility of its size.
Full operations were maintained at Mill
Cove during this project and the facility
remained compliant with its Nova Scotia
Environment permit. The Mill Cove
WWTF is located in close proximity to
condominiums and office buildings.
Halifax Water took significant steps
to ensure neighbours were informed
throughout the project.
MILL COVE ODOUR CONTROL SYSTEM
Air quality and odour issues are taken
seriously by Halifax Water in its effort to
be a good neighbour in the communities
it serves. In the early spring of 2017 a
project to install two new Odour Control
Systems (OCS) at the Mill Cove WWTF was
initiated as a result of odour complaints
Mill Cove North Side Odour Control SystemMill Cove South Side Odour Control System
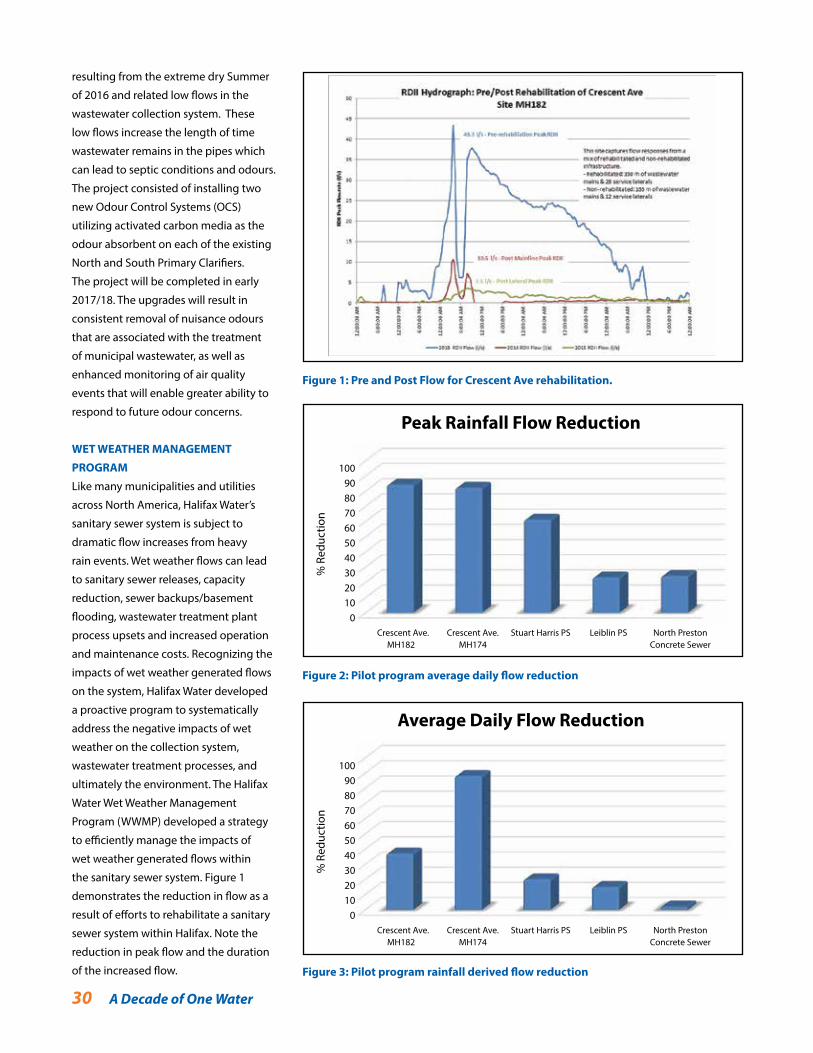
30 A Decade of One Water
resulting from the extreme dry Summer
of 2016 and related low flows in the
wastewater collection system. These
low flows increase the length of time
wastewater remains in the pipes which
can lead to septic conditions and odours.
The project consisted of installing two
new Odour Control Systems (OCS)
utilizing activated carbon media as the
odour absorbent on each of the existing
North and South Primary Clarifiers.
The project will be completed in early
2017/18. The upgrades will result in
consistent removal of nuisance odours
that are associated with the treatment
of municipal wastewater, as well as
enhanced monitoring of air quality
events that will enable greater ability to
respond to future odour concerns.
WET WEATHER MANAGEMENT
PROGRAM
Like many municipalities and utilities
across North America, Halifax Water’s
sanitary sewer system is subject to
dramatic flow increases from heavy
rain events. Wet weather flows can lead
to sanitary sewer releases, capacity
reduction, sewer backups/basement
flooding, wastewater treatment plant
process upsets and increased operation
and maintenance costs. Recognizing the
impacts of wet weather generated flows
on the system, Halifax Water developed
a proactive program to systematically
address the negative impacts of wet
weather on the collection system,
wastewater treatment processes, and
ultimately the environment. The Halifax
Water Wet Weather Management
Program (WWMP) developed a strategy
to efficiently manage the impacts of
wet weather generated flows within
the sanitary sewer system. Figure 1
demonstrates the reduction in flow as a
result of efforts to rehabilitate a sanitary
sewer system within Halifax. Note the
reduction in peak flow and the duration
of the increased flow. Figure 3: Pilot program rainfall derived flow reduction
100908070605040302010
0
% R
educ
tion
Average Daily Flow Reduction
Crescent Ave. Crescent Ave. Stuart Harris PS Leiblin PS North Preston MH182 MH174 Concrete Sewer
100908070605040302010
0
% R
educ
tion
Peak Rainfall Flow Reduction
Crescent Ave. Crescent Ave. Stuart Harris PS Leiblin PS North Preston MH182 MH174 Concrete Sewer
Figure 2: Pilot program average daily flow reduction
Figure 1: Pre and Post Flow for Crescent Ave rehabilitation.
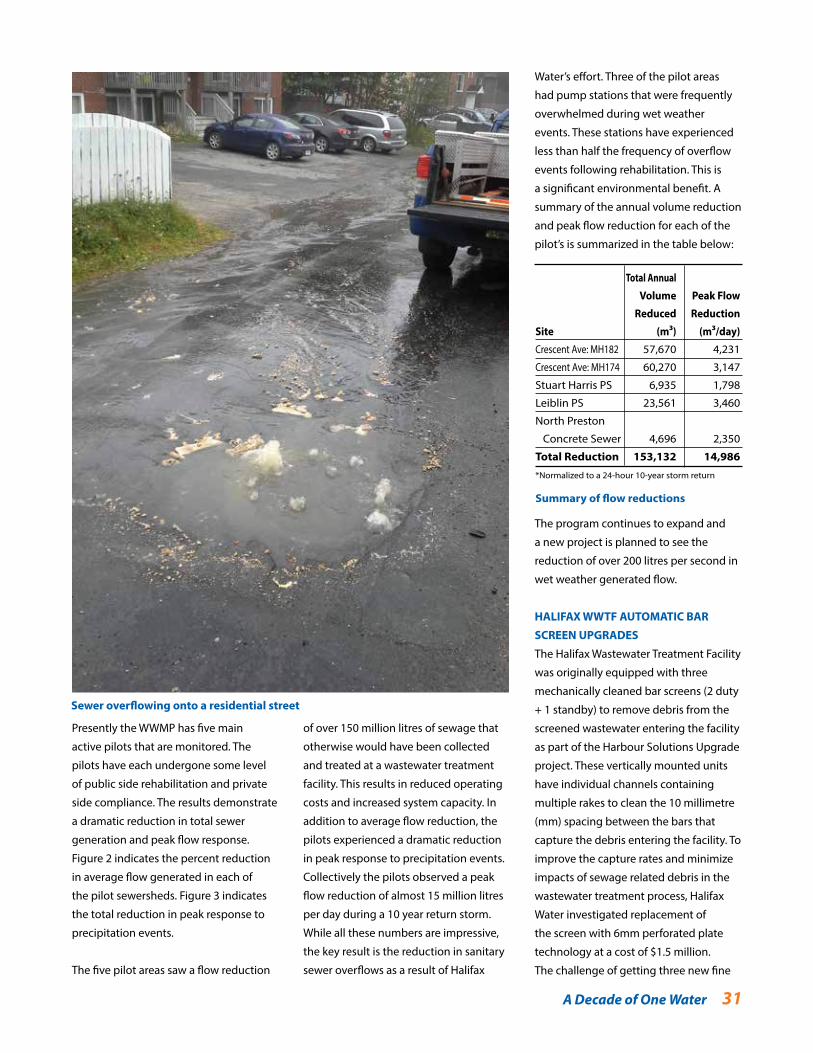
Water’s effort. Three of the pilot areas
had pump stations that were frequently
overwhelmed during wet weather
events. These stations have experienced
less than half the frequency of overflow
events following rehabilitation. This is
a significant environmental benefit. A
summary of the annual volume reduction
and peak flow reduction for each of the
pilot’s is summarized in the table below:
The program continues to expand and
a new project is planned to see the
reduction of over 200 litres per second in
wet weather generated flow.
HALIFAX WWTF AUTOMATIC BAR
SCREEN UPGRADES
The Halifax Wastewater Treatment Facility
was originally equipped with three
mechanically cleaned bar screens (2 duty
+ 1 standby) to remove debris from the
screened wastewater entering the facility
as part of the Harbour Solutions Upgrade
project. These vertically mounted units
have individual channels containing
multiple rakes to clean the 10 millimetre
(mm) spacing between the bars that
capture the debris entering the facility. To
improve the capture rates and minimize
impacts of sewage related debris in the
wastewater treatment process, Halifax
Water investigated replacement of
the screen with 6mm perforated plate
technology at a cost of $1.5 million.
The challenge of getting three new fine
A Decade of One Water 31
Presently the WWMP has five main
active pilots that are monitored. The
pilots have each undergone some level
of public side rehabilitation and private
side compliance. The results demonstrate
a dramatic reduction in total sewer
generation and peak flow response.
Figure 2 indicates the percent reduction
in average flow generated in each of
the pilot sewersheds. Figure 3 indicates
the total reduction in peak response to
precipitation events.
The five pilot areas saw a flow reduction
of over 150 million litres of sewage that
otherwise would have been collected
and treated at a wastewater treatment
facility. This results in reduced operating
costs and increased system capacity. In
addition to average flow reduction, the
pilots experienced a dramatic reduction
in peak response to precipitation events.
Collectively the pilots observed a peak
flow reduction of almost 15 million litres
per day during a 10 year return storm.
While all these numbers are impressive,
the key result is the reduction in sanitary
sewer overflows as a result of Halifax
Sewer overflowing onto a residential street
Total Annual
Volume Peak Flow
Reduced Reduction
Site (m3) (m3/day)
Crescent Ave: MH182 57,670 4,231
Crescent Ave: MH174 60,270 3,147
Stuart Harris PS 6,935 1,798
Leiblin PS 23,561 3,460
North Preston
Concrete Sewer 4,696 2,350
Total Reduction 153,132 14,986
*Normalized to a 24-hour 10-year storm return
Summary of flow reductions
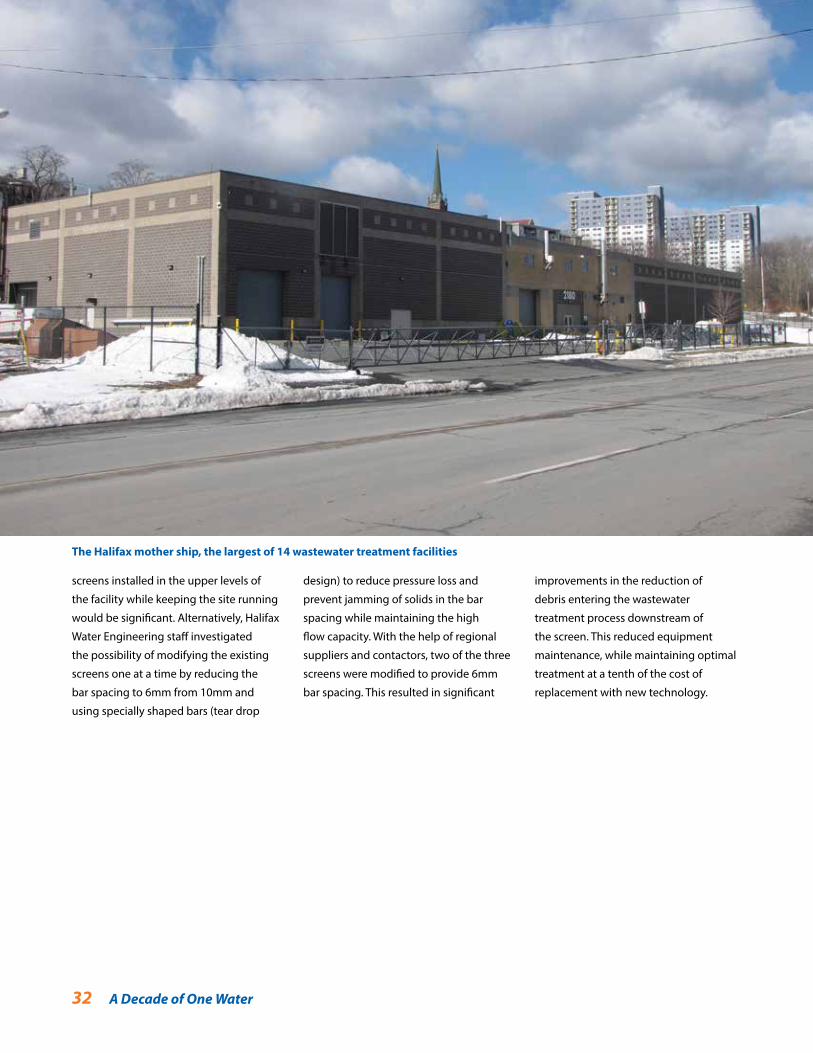
32 A Decade of One Water
The Halifax mother ship, the largest of 14 wastewater treatment facilities
screens installed in the upper levels of
the facility while keeping the site running
would be significant. Alternatively, Halifax
Water Engineering staff investigated
the possibility of modifying the existing
screens one at a time by reducing the
bar spacing to 6mm from 10mm and
using specially shaped bars (tear drop
design) to reduce pressure loss and
prevent jamming of solids in the bar
spacing while maintaining the high
flow capacity. With the help of regional
suppliers and contactors, two of the three
screens were modified to provide 6mm
bar spacing. This resulted in significant
improvements in the reduction of
debris entering the wastewater
treatment process downstream of
the screen. This reduced equipment
maintenance, while maintaining optimal
treatment at a tenth of the cost of
replacement with new technology.
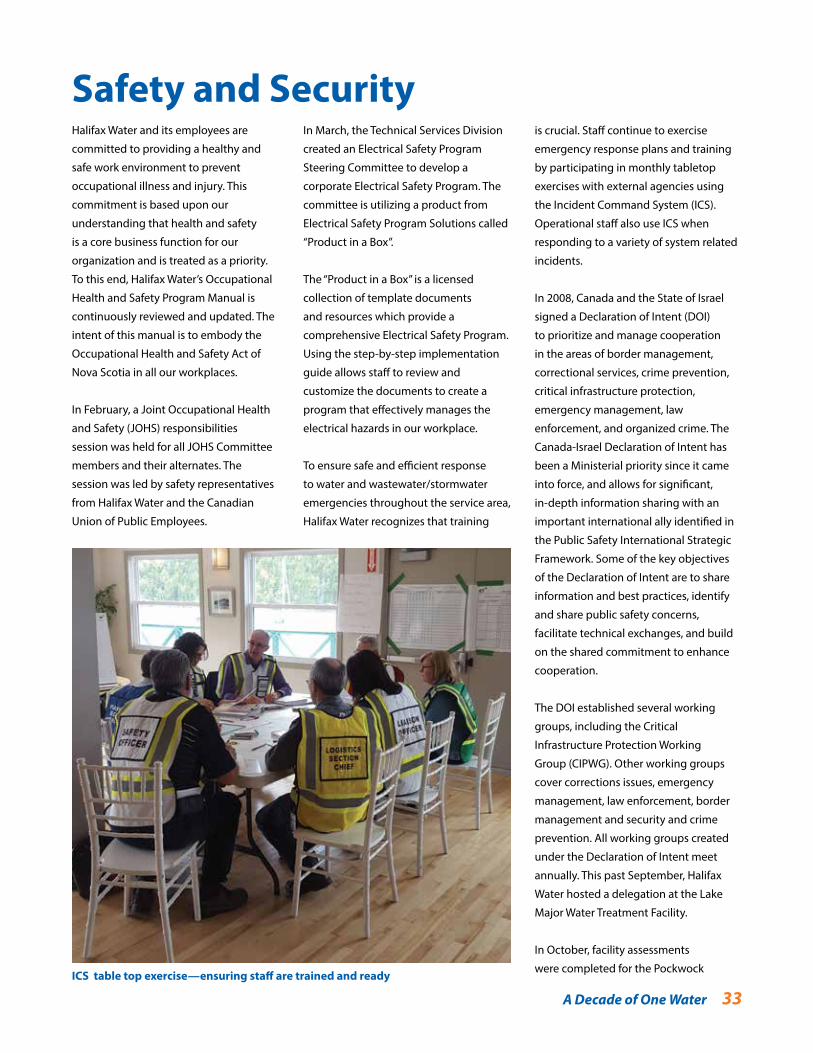
A Decade of One Water 33
Safety and SecurityHalifax Water and its employees are
committed to providing a healthy and
safe work environment to prevent
occupational illness and injury. This
commitment is based upon our
understanding that health and safety
is a core business function for our
organization and is treated as a priority.
To this end, Halifax Water’s Occupational
Health and Safety Program Manual is
continuously reviewed and updated. The
intent of this manual is to embody the
Occupational Health and Safety Act of
Nova Scotia in all our workplaces.
In February, a Joint Occupational Health
and Safety (JOHS) responsibilities
session was held for all JOHS Committee
members and their alternates. The
session was led by safety representatives
from Halifax Water and the Canadian
Union of Public Employees.
In March, the Technical Services Division
created an Electrical Safety Program
Steering Committee to develop a
corporate Electrical Safety Program. The
committee is utilizing a product from
Electrical Safety Program Solutions called
“Product in a Box”.
The “Product in a Box” is a licensed
collection of template documents
and resources which provide a
comprehensive Electrical Safety Program.
Using the step-by-step implementation
guide allows staff to review and
customize the documents to create a
program that effectively manages the
electrical hazards in our workplace.
To ensure safe and efficient response
to water and wastewater/stormwater
emergencies throughout the service area,
Halifax Water recognizes that training
is crucial. Staff continue to exercise
emergency response plans and training
by participating in monthly tabletop
exercises with external agencies using
the Incident Command System (ICS).
Operational staff also use ICS when
responding to a variety of system related
incidents.
In 2008, Canada and the State of Israel
signed a Declaration of Intent (DOI)
to prioritize and manage cooperation
in the areas of border management,
correctional services, crime prevention,
critical infrastructure protection,
emergency management, law
enforcement, and organized crime. The
Canada-Israel Declaration of Intent has
been a Ministerial priority since it came
into force, and allows for significant,
in-depth information sharing with an
important international ally identified in
the Public Safety International Strategic
Framework. Some of the key objectives
of the Declaration of Intent are to share
information and best practices, identify
and share public safety concerns,
facilitate technical exchanges, and build
on the shared commitment to enhance
cooperation.
The DOI established several working
groups, including the Critical
Infrastructure Protection Working
Group (CIPWG). Other working groups
cover corrections issues, emergency
management, law enforcement, border
management and security and crime
prevention. All working groups created
under the Declaration of Intent meet
annually. This past September, Halifax
Water hosted a delegation at the Lake
Major Water Treatment Facility.
In October, facility assessments
were completed for the Pockwock ICS table top exercise—ensuring staff are trained and ready
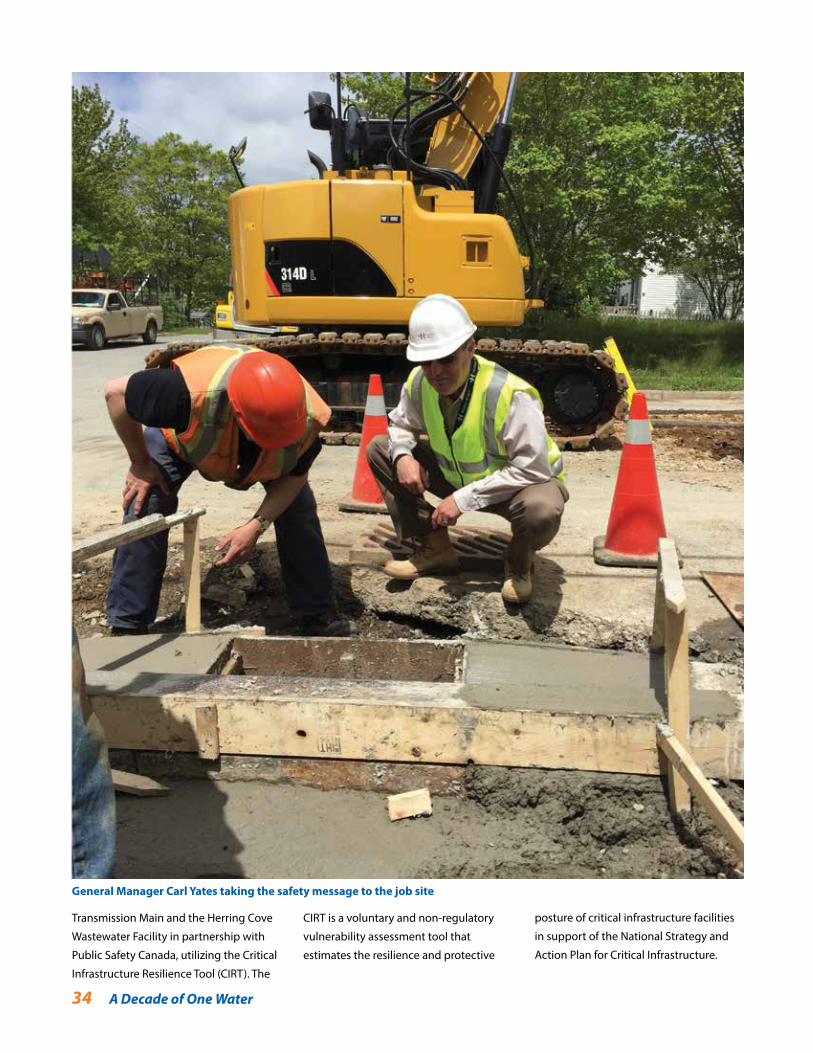
34 A Decade of One Water
Transmission Main and the Herring Cove
Wastewater Facility in partnership with
Public Safety Canada, utilizing the Critical
Infrastructure Resilience Tool (CIRT). The
General Manager Carl Yates taking the safety message to the job site
CIRT is a voluntary and non-regulatory
vulnerability assessment tool that
estimates the resilience and protective
posture of critical infrastructure facilities
in support of the National Strategy and
Action Plan for Critical Infrastructure.
A Decade of One Water 35
Motivated And Satisfied EmployeesHalifax Water has approximately 450
employees, operating under collective
agreements with CUPE Locals 227
and 1431. Turnover is low relative to
other public sector organizations, and
employee satisfaction as measured by
annual employee surveys is generally
high.
Employee satisfaction is key to employee
engagement and productivity. According
to Halifax Water’s 2016 Employee
Satisfaction Survey 69% of employees are
completely or mostly satisfied with their
job overall which is a slight increase from
the previous year. Also, 60% of employees
believe that Halifax Water is one of the
best Employers to work for in the Halifax
area.
In 2016 Halifax Water participated in a
Workforce Management Planning Survey
led by the Municipal Auditor General’s
Office. The survey results found that
87% surveyed believe the organization
is a good place to work, and 94% feel
engaged. The survey also identified
some challenges from the perspective of
employees.
Halifax Water continues to develop
ways to increase employee satisfaction.
A review of current policies, practices
and programs was completed and
updates were made to reflect industry
best standards. Employees’ physical and
psychological health and wellness will
continue to be a focus in the future to
assist employees to live happier, healthier
lives for them and their families.
Halifax Water is committed to improve
employee relations and to instill a
shared accountability for success across
the organization. Throughout the year
several meetings were held between
Human Resources and Union leaders to
discuss ways to improve labour relations.
The meetings were very beneficial and
will continue in the future.
A respectful workplace for all employees
is paramount at Halifax Water. Mandatory
civility and respectful workplace training
sessions were held for all employees and
a final report of findings was received
which will be a focus next year.
There were 127 incidences where
Employees received a formal recognition
for going above and beyond their normal
course of duty through Halifax Water’s
employee recognition program.
SERVICE AWARD BANQUET
At the 2016 Service Award Banquet the
following awards were presented:
30 Year Award
Administration
Sandy Hood
Wastewater & Stormwater Services
Richard Brown
Lloyd Ferguson
Brian Gazeley
Rory MacNeil
Rick Reid
Water Services
Dave Hiscock
Rob Hood
25 Year Award
Water Services
Raymond Doucette
Karen Gardiner
Wastewater & Stormwater Services
Tim Dewolfe
Dave Dort
Laurie Sperry
20 Year Award
Corporate Services
Karen Kearney
Gail Reid
Tanya Shatford
Dawn Slaunwhite
Engineering & Information Services
Ian Guppy
Mike Slayter
Statement Percent Agree or
Strongly Agree
The organization is a good place to work 87%
I am fully engaged in the success of the organization 94%
The work I do helps in achieving the organization’s goals
and priorities 100%
I feel the work I do has an impact on the organization 94%
I feel the work I do has an impact on the residents of the
municipality 94%
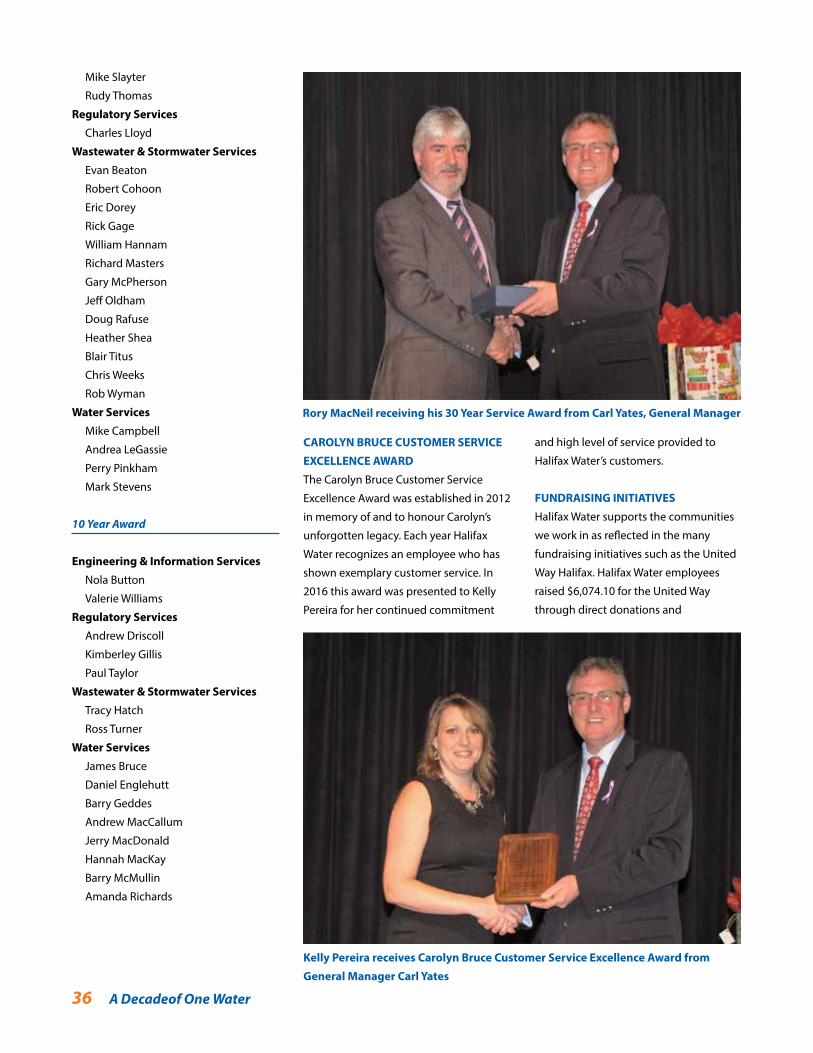
36 A Decadeof One Water
Mike Slayter
Rudy Thomas
Regulatory Services
Charles Lloyd
Wastewater & Stormwater Services
Evan Beaton
Robert Cohoon
Eric Dorey
Rick Gage
William Hannam
Richard Masters
Gary McPherson
Jeff Oldham
Doug Rafuse
Heather Shea
Blair Titus
Chris Weeks
Rob Wyman
Water Services
Mike Campbell
Andrea LeGassie
Perry Pinkham
Mark Stevens
10 Year Award
Engineering & Information Services
Nola Button
Valerie Williams
Regulatory Services
Andrew Driscoll
Kimberley Gillis
Paul Taylor
Wastewater & Stormwater Services
Tracy Hatch
Ross Turner
Water Services
James Bruce
Daniel Englehutt
Barry Geddes
Andrew MacCallum
Jerry MacDonald
Hannah MacKay
Barry McMullin
Amanda Richards
CAROLYN BRUCE CUSTOMER SERVICE
EXCELLENCE AWARD
The Carolyn Bruce Customer Service
Excellence Award was established in 2012
in memory of and to honour Carolyn’s
unforgotten legacy. Each year Halifax
Water recognizes an employee who has
shown exemplary customer service. In
2016 this award was presented to Kelly
Pereira for her continued commitment
Rory MacNeil receiving his 30 Year Service Award from Carl Yates, General Manager
and high level of service provided to
Halifax Water’s customers.
FUNDRAISING INITIATIVES
Halifax Water supports the communities
we work in as reflected in the many
fundraising initiatives such as the United
Way Halifax. Halifax Water employees
raised $6,074.10 for the United Way
through direct donations and
Kelly Pereira receives Carolyn Bruce Customer Service Excellence Award from
General Manager Carl Yates
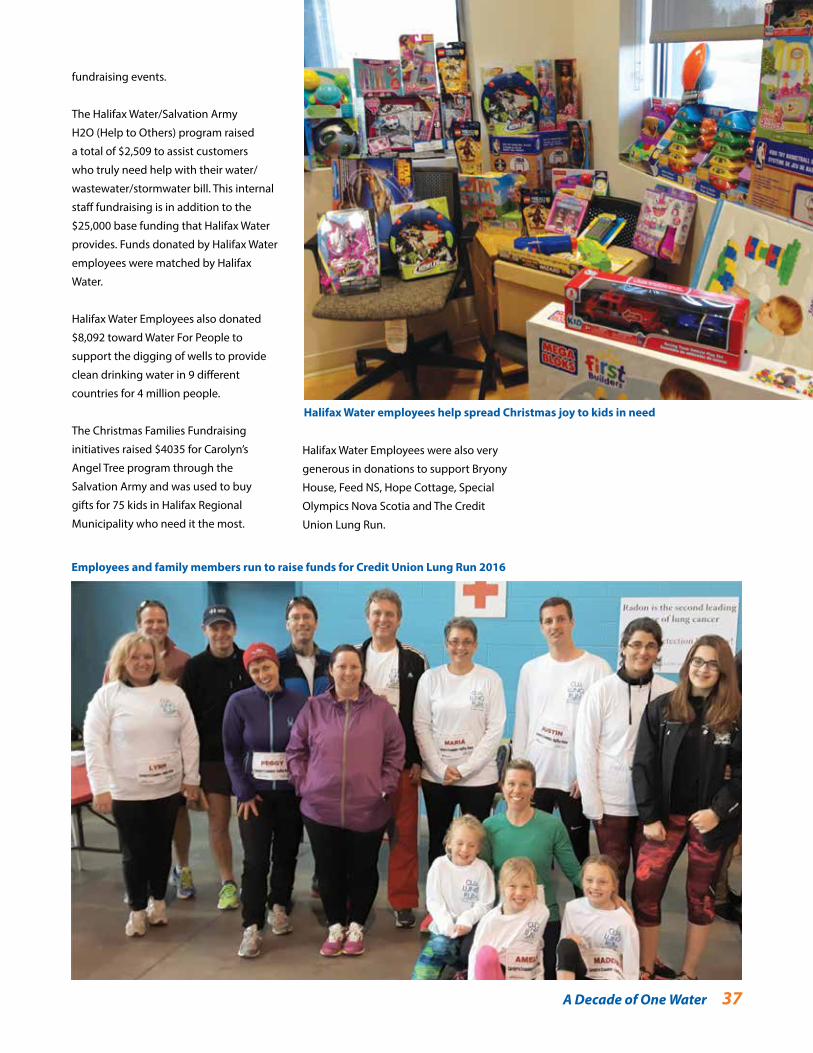
A Decade of One Water 37
Employees and family members run to raise funds for Credit Union Lung Run 2016
Halifax Water employees help spread Christmas joy to kids in need
fundraising events.
The Halifax Water/Salvation Army
H2O (Help to Others) program raised
a total of $2,509 to assist customers
who truly need help with their water/
wastewater/stormwater bill. This internal
staff fundraising is in addition to the
$25,000 base funding that Halifax Water
provides. Funds donated by Halifax Water
employees were matched by Halifax
Water.
Halifax Water Employees also donated
$8,092 toward Water For People to
support the digging of wells to provide
clean drinking water in 9 different
countries for 4 million people.
The Christmas Families Fundraising
initiatives raised $4035 for Carolyn’s
Angel Tree program through the
Salvation Army and was used to buy
gifts for 75 kids in Halifax Regional
Municipality who need it the most.
Halifax Water Employees were also very
generous in donations to support Bryony
House, Feed NS, Hope Cottage, Special
Olympics Nova Scotia and The Credit
Union Lung Run.
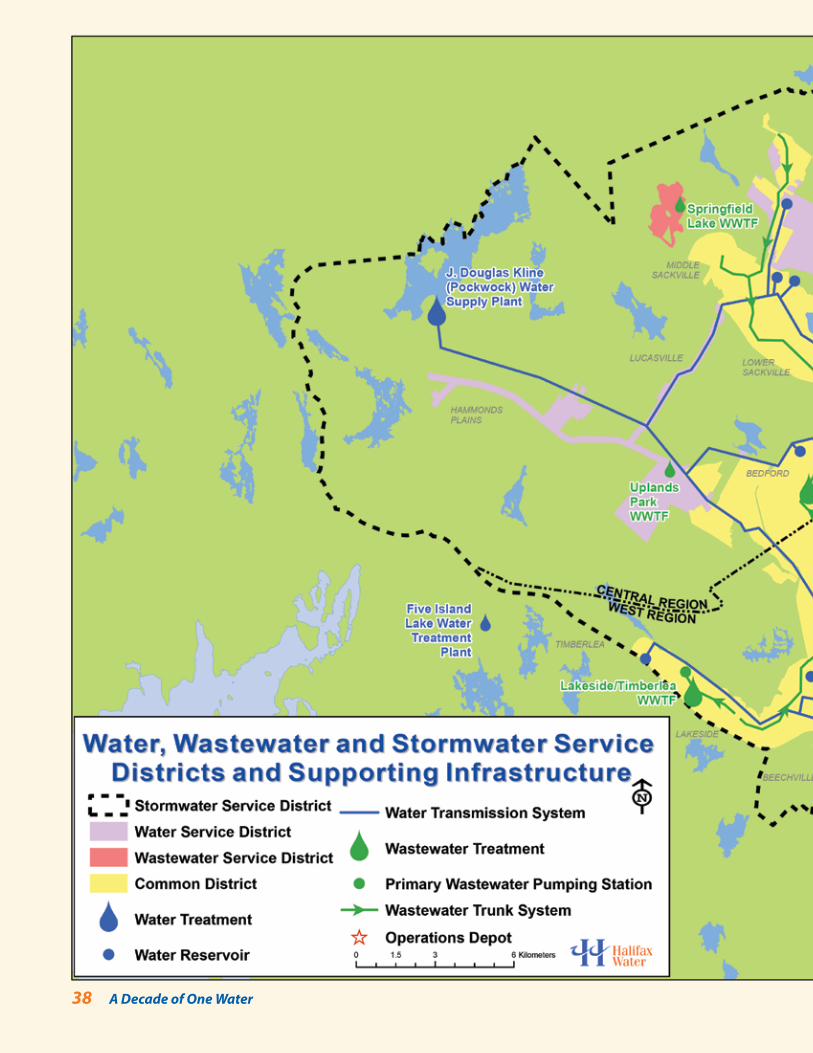
38 A Decade of One Water
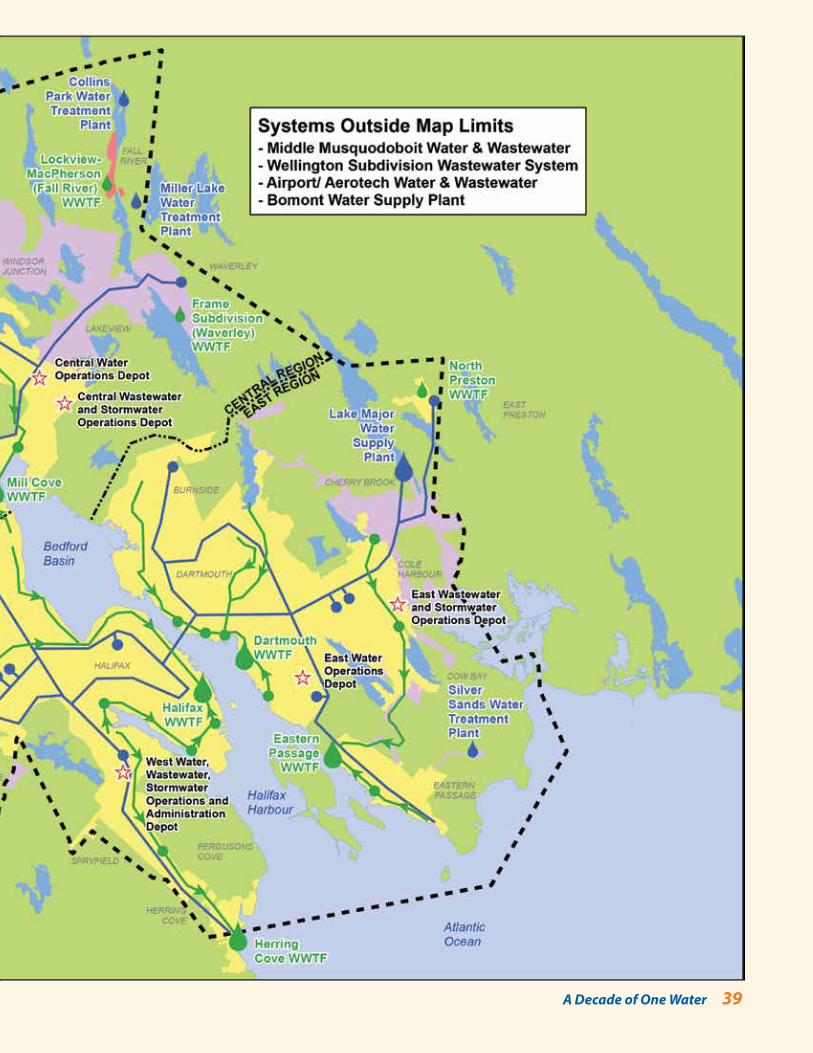
A Decade of One Water 39
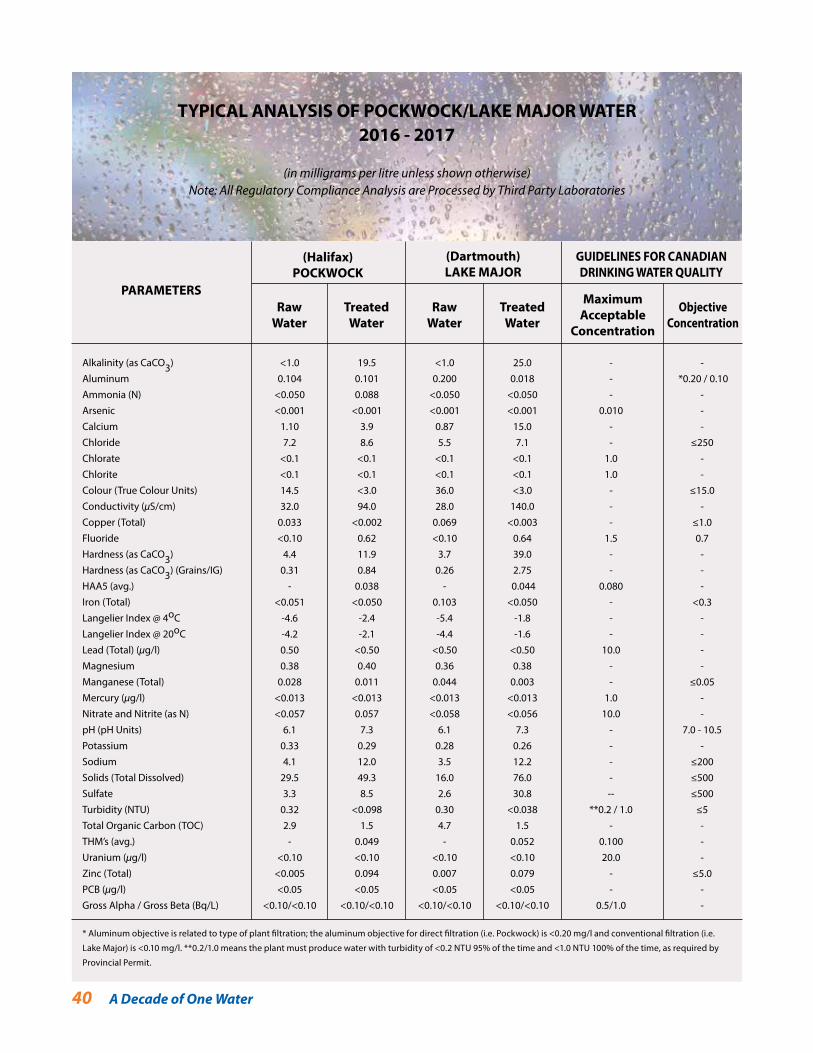
40 A Decade of One Water
<1.00.104
<0.050<0.001
1.107.2
<0.1<0.114.532.0
0.033<0.10
4.40.31
-<0.051
-4.6-4.20.500.38
0.028<0.013<0.057
6.10.334.1
29.53.3
0.322.9
-<0.10
<0.005<0.05
<0.10/<0.10
19.50.1010.088
<0.0013.98.6
<0.1<0.1<3.094.0
<0.0020.6211.90.84
0.038<0.050
-2.4-2.1
<0.500.40
0.011<0.0130.057
7.30.2912.049.38.5
<0.0981.5
0.049<0.100.094<0.05
<0.10/<0.10
<1.00.200
<0.050<0.001
0.875.5
<0.1<0.136.028.0
0.069<0.10
3.70.26
-0.103-5.4-4.4
<0.500.36
0.044<0.013<0.058
6.10.283.5
16.02.6
0.304.7
-<0.100.007<0.05
<0.10/<0.10
25.00.018
<0.050<0.001
15.07.1
<0.1<0.1<3.0
140.0<0.003
0.6439.02.75
0.044<0.050
-1.8-1.6
<0.500.38
0.003<0.013<0.056
7.30.2612.276.030.8
<0.0381.5
0.052<0.100.079<0.05
<0.10/<0.10
---
0.010--
1.01.0
---
1.5--
0.080---
10.0--
1.010.0
------
**0.2 / 1.0-
0.10020.0
--
0.5/1.0
- *0.20 / 0.10
---
≤250--
≤15.0-
≤1.00.7
---
<0.3----
≤0.05--
7.0 - 10.5-
≤200≤500≤500
≤5---
≤5.0--
* Aluminum objective is related to type of plant filtration; the aluminum objective for direct filtration (i.e. Pockwock) is <0.20 mg/l and conventional filtration (i.e.
Lake Major) is <0.10 mg/l. **0.2/1.0 means the plant must produce water with turbidity of <0.2 NTU 95% of the time and <1.0 NTU 100% of the time, as required by
Provincial Permit.
TYPICAL ANALYSIS OF POCKWOCK/LAKE MAJOR WATER2016 - 2017
(in milligrams per litre unless shown otherwise)Note: All Regulatory Compliance Analysis are Processed by Third Party Laboratories
(Halifax)POCKWOCK
(Dartmouth)LAKE MAJOR
GUIDELINES FOR CANADIANDRINKING WATER QUALITY
PARAMETERSRaw
WaterTreatedWater
RawWater
TreatedWater
MaximumAcceptable
Concentration
ObjectiveConcentration
Alkalinity (as CaCO3)AluminumAmmonia (N)ArsenicCalciumChlorideChlorateChloriteColour (True Colour Units)Conductivity (µS/cm)Copper (Total)FluorideHardness (as CaCO3)Hardness (as CaCO3) (Grains/IG)HAA5 (avg.)Iron (Total)Langelier Index @ 4oCLangelier Index @ 20oCLead (Total) (µg/l)MagnesiumManganese (Total)Mercury (µg/l)Nitrate and Nitrite (as N)pH (pH Units)PotassiumSodiumSolids (Total Dissolved)SulfateTurbidity (NTU)Total Organic Carbon (TOC)THM’s (avg.)Uranium (µg/l)Zinc (Total)PCB (µg/l)Gross Alpha / Gross Beta (Bq/L)
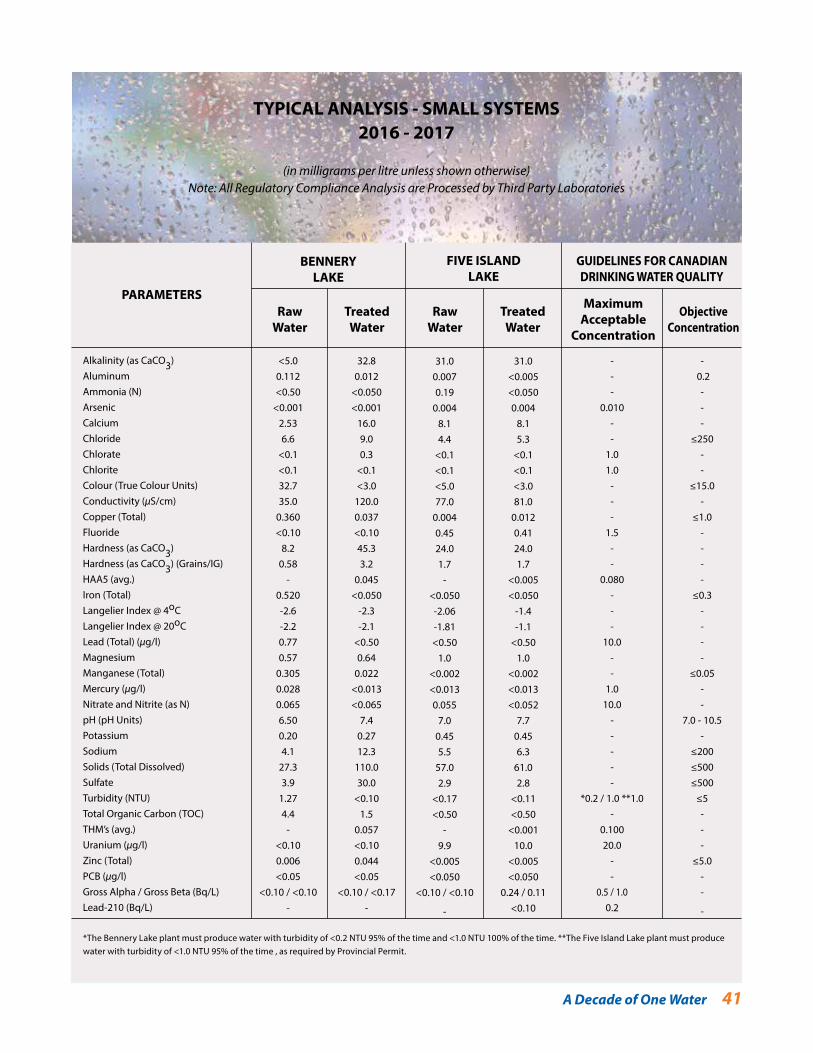
A Decade of One Water 41
- 0.2
---
≤250--
≤15.0-
≤1.0----
≤0.3----
≤0.05--
7.0 - 10.5-
≤200≤500≤500
≤5---
≤5.0--
-
*The Bennery Lake plant must produce water with turbidity of <0.2 NTU 95% of the time and <1.0 NTU 100% of the time. **The Five Island Lake plant must produce water with turbidity of <1.0 NTU 95% of the time , as required by Provincial Permit.
---
0.010--
1.01.0
---
1.5--
0.080---
10.0--
1.010.0
-----
*0.2 / 1.0 **1.0-
0.10020.0
--
0.5 / 1.00.2
<5.00.112<0.50
<0.0012.536.6
<0.1<0.132.735.0
0.360<0.10
8.20.58
-0.520-2.6-2.20.770.57
0.3050.0280.0656.500.204.1
27.33.9
1.274.4
-<0.100.006<0.05
<0.10 / <0.10-
32.80.012
<0.050<0.001
16.09.00.3
<0.1<3.0
120.00.037<0.1045.33.2
0.045<0.050
-2.3-2.1
<0.500.64
0.022<0.013<0.065
7.40.2712.3
110.030.0
<0.101.5
0.057<0.100.044<0.05
<0.10 / <0.17-
31.00.0070.19
0.0048.14.4
<0.1<0.1<5.077.0
0.0040.4524.01.7
-<0.050-2.06-1.81<0.50
1.0<0.002<0.0130.055
7.00.455.5
57.02.9
<0.17<0.50
-9.9
<0.005<0.050
<0.10 / <0.10
-
31.0<0.005<0.0500.004
8.15.3
<0.1<0.1<3.081.0
0.0120.4124.01.7
<0.005<0.050
-1.4-1.1
<0.501.0
<0.002<0.013<0.052
7.70.456.3
61.02.8
<0.11<0.50
<0.00110.0
<0.005<0.050
0.24 / 0.11<0.10
TYPICAL ANALYSIS - SMALL SYSTEMS2016 - 2017
(in milligrams per litre unless shown otherwise)Note: All Regulatory Compliance Analysis are Processed by Third Party Laboratories
BENNERYLAKE
FIVE ISLANDLAKE
GUIDELINES FOR CANADIANDRINKING WATER QUALITY
PARAMETERSRaw
WaterTreatedWater
RawWater
TreatedWater
MaximumAcceptable
Concentration
ObjectiveConcentration
Alkalinity (as CaCO3)AluminumAmmonia (N)ArsenicCalciumChlorideChlorateChloriteColour (True Colour Units)Conductivity (µS/cm)Copper (Total)FluorideHardness (as CaCO3)Hardness (as CaCO3) (Grains/IG)HAA5 (avg.)Iron (Total)Langelier Index @ 4oCLangelier Index @ 20oCLead (Total) (µg/l)MagnesiumManganese (Total)Mercury (µg/l)Nitrate and Nitrite (as N)pH (pH Units)PotassiumSodiumSolids (Total Dissolved)SulfateTurbidity (NTU)Total Organic Carbon (TOC)THM’s (avg.)Uranium (µg/l)Zinc (Total)PCB (µg/l)Gross Alpha / Gross Beta (Bq/L)Lead-210 (Bq/L)
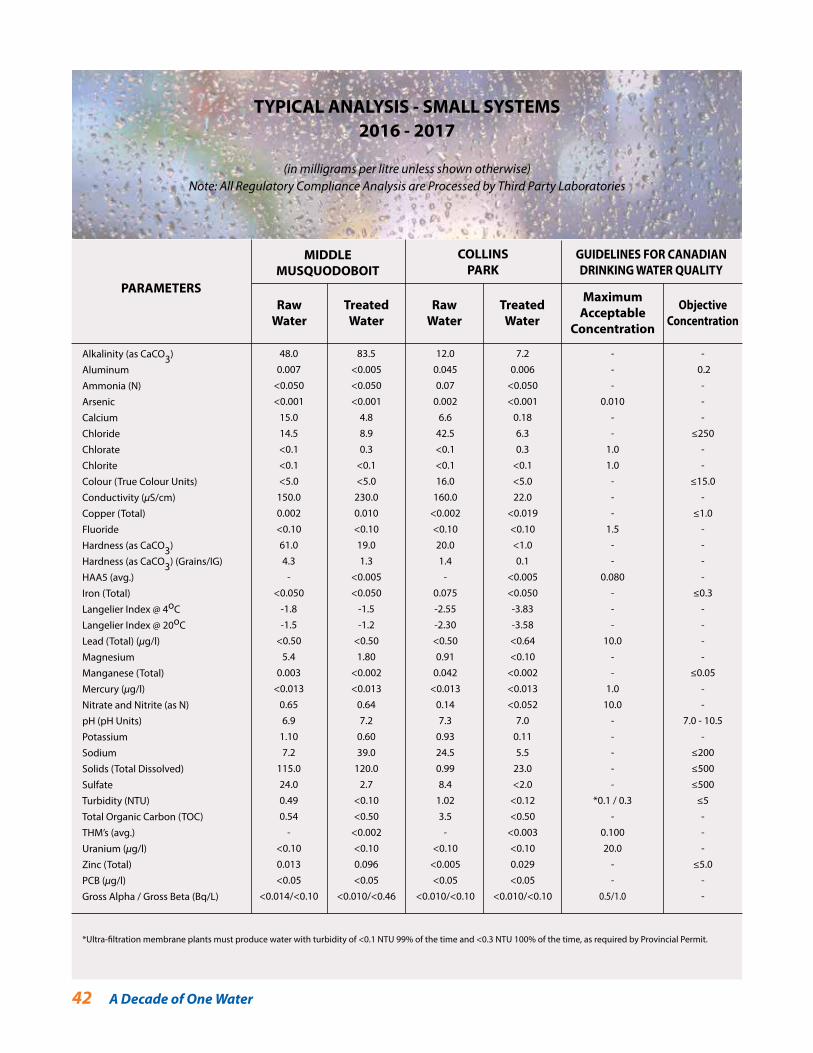
42 A Decade of One Water
- 0.2
---
≤250--
≤15.0-
≤1.0----
≤0.3----
≤0.05--
7.0 - 10.5-
≤200≤500≤500
≤5---
≤5.0--
---
0.010--
1.01.0
---
1.5--
0.080---
10.0--
1.010.0
-----
*0.1 / 0.3-
0.10020.0
--
0.5/1.0
48.00.007
<0.050<0.001
15.014.5<0.1<0.1<5.0
150.00.002<0.1061.04.3
-<0.050
-1.8-1.5
<0.505.4
0.003<0.013
0.656.9
1.107.2
115.024.00.490.54
-<0.100.013<0.05
<0.014/<0.10
83.5<0.005<0.050<0.001
4.88.90.3
<0.1<5.0
230.00.010<0.1019.01.3
<0.005<0.050
-1.5-1.2
<0.501.80
<0.002<0.013
0.647.2
0.6039.0
120.02.7
<0.10<0.50
<0.002<0.100.096<0.05
<0.010/<0.46
12.00.0450.07
0.0026.6
42.5<0.1<0.116.0
160.0<0.002<0.1020.01.4
-0.075-2.55-2.30<0.500.91
0.042<0.013
0.147.3
0.9324.50.998.4
1.023.5
-<0.10
<0.005<0.05
<0.010/<0.10
7.20.006
<0.050<0.001
0.186.30.3
<0.1<5.022.0
<0.019<0.10<1.00.1
<0.005<0.050-3.83-3.58<0.64<0.10
<0.002<0.013<0.052
7.00.115.5
23.0<2.0
<0.12<0.50
<0.003<0.100.029<0.05
<0.010/<0.10
TYPICAL ANALYSIS - SMALL SYSTEMS2016 - 2017
(in milligrams per litre unless shown otherwise)Note: All Regulatory Compliance Analysis are Processed by Third Party Laboratories
MIDDLEMUSQUODOBOIT
COLLINSPARK
GUIDELINES FOR CANADIANDRINKING WATER QUALITY
PARAMETERSRaw
WaterTreatedWater
RawWater
TreatedWater
MaximumAcceptable
Concentration
ObjectiveConcentration
Alkalinity (as CaCO3)AluminumAmmonia (N)ArsenicCalciumChlorideChlorateChloriteColour (True Colour Units)Conductivity (µS/cm)Copper (Total)FluorideHardness (as CaCO3)Hardness (as CaCO3) (Grains/IG)HAA5 (avg.)Iron (Total)Langelier Index @ 4oCLangelier Index @ 20oCLead (Total) (µg/l)MagnesiumManganese (Total)Mercury (µg/l)Nitrate and Nitrite (as N)pH (pH Units)PotassiumSodiumSolids (Total Dissolved)SulfateTurbidity (NTU)Total Organic Carbon (TOC)THM’s (avg.)Uranium (µg/l)Zinc (Total)PCB (µg/l)Gross Alpha / Gross Beta (Bq/L)
*Ultra-filtration membrane plants must produce water with turbidity of <0.1 NTU 99% of the time and <0.3 NTU 100% of the time, as required by Provincial Permit.
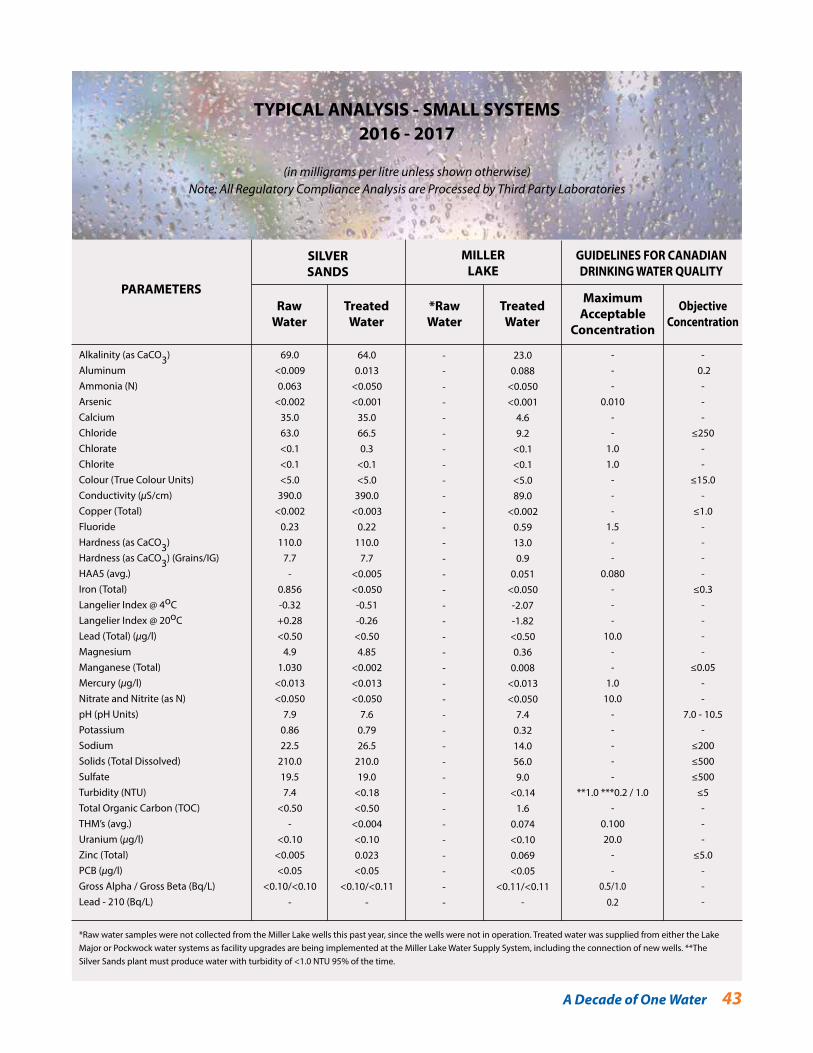
A Decade of One Water 43
- 0.2
---
≤250--
≤15.0-
≤1.0----
≤0.3----
≤0.05--
7.0 - 10.5-
≤200≤500≤500
≤5---
≤5.0---
SILVERSANDS
MILLERLAKE
GUIDELINES FOR CANADIANDRINKING WATER QUALITY
PARAMETERSRaw
WaterTreatedWater
*RawWater
TreatedWater
MaximumAcceptable
Concentration
ObjectiveConcentration
---
0.010--
1.01.0
---
1.5--
0.080---
10.0--
1.010.0
-----
**1.0 ***0.2 / 1.0-
0.10020.0
--
0.5/1.00.2
69.0<0.0090.063
<0.00235.063.0<0.1<0.1<5.0
390.0<0.002
0.23110.0
7.7-
0.856-0.32+0.28<0.50
4.91.030
<0.013<0.050
7.90.8622.5
210.019.57.4
<0.50-
<0.10<0.005<0.05
<0.10/<0.10-
64.00.013
<0.050<0.001
35.066.50.3
<0.1<5.0
390.0<0.003
0.22110.0
7.7<0.005<0.050-0.51-0.26<0.504.85
<0.002<0.013<0.050
7.60.7926.5
210.019.0
<0.18<0.50
<0.004<0.100.023<0.05
<0.10/<0.11-
------------------------------------
23.00.088
<0.050<0.001
4.69.2
<0.1<0.1<5.089.0
<0.0020.5913.00.9
0.051<0.050-2.07-1.82<0.500.36
0.008<0.013<0.050
7.40.3214.056.09.0
<0.141.6
0.074<0.100.069<0.05
<0.11/<0.11-
Alkalinity (as CaCO3)AluminumAmmonia (N)ArsenicCalciumChlorideChlorateChloriteColour (True Colour Units)Conductivity (µS/cm)Copper (Total)FluorideHardness (as CaCO3)Hardness (as CaCO3) (Grains/IG)HAA5 (avg.)Iron (Total)Langelier Index @ 4oCLangelier Index @ 20oCLead (Total) (µg/l)MagnesiumManganese (Total)Mercury (µg/l)Nitrate and Nitrite (as N)pH (pH Units)PotassiumSodiumSolids (Total Dissolved)SulfateTurbidity (NTU)Total Organic Carbon (TOC)THM’s (avg.)Uranium (µg/l)Zinc (Total)PCB (µg/l)Gross Alpha / Gross Beta (Bq/L)Lead - 210 (Bq/L)
TYPICAL ANALYSIS - SMALL SYSTEMS2016 - 2017
(in milligrams per litre unless shown otherwise)Note: All Regulatory Compliance Analysis are Processed by Third Party Laboratories
*Raw water samples were not collected from the Miller Lake wells this past year, since the wells were not in operation. Treated water was supplied from either the Lake Major or Pockwock water systems as facility upgrades are being implemented at the Miller Lake Water Supply System, including the connection of new wells. **The Silver Sands plant must produce water with turbidity of <1.0 NTU 95% of the time.
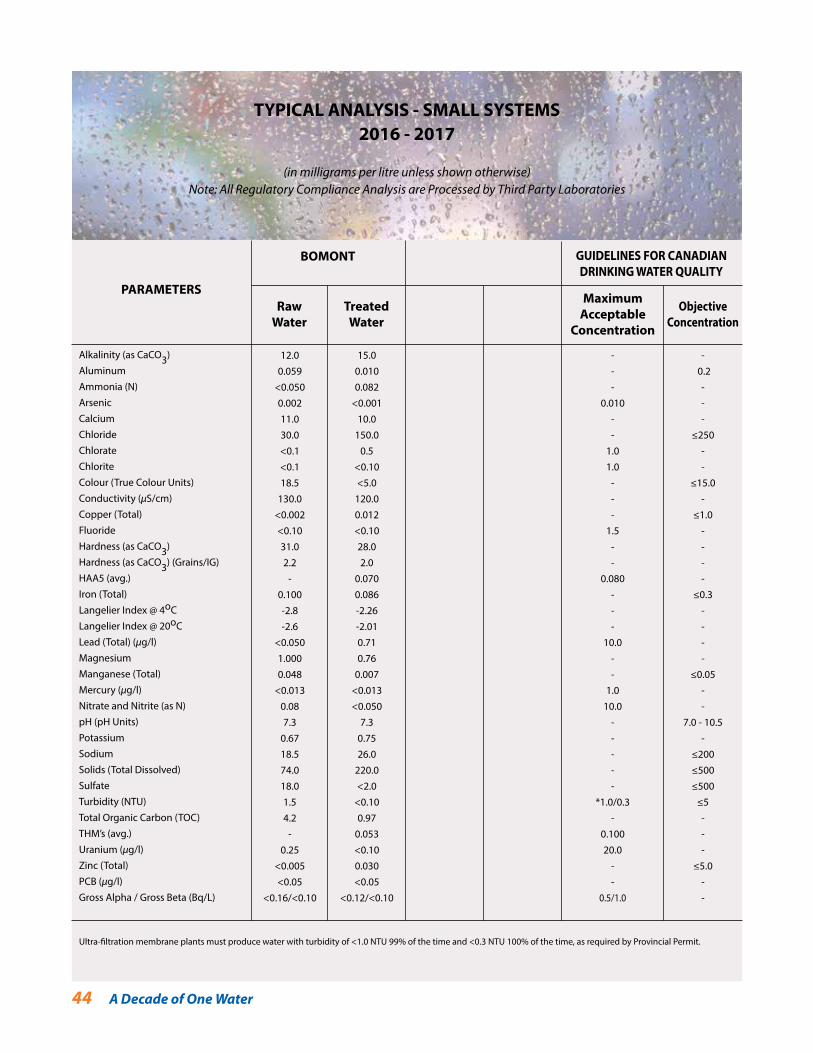
44 A Decade of One Water
- 0.2
---
≤250--
≤15.0-
≤1.0----
≤0.3----
≤0.05--
7.0 - 10.5-
≤200≤500≤500
≤5---
≤5.0--
BOMONT GUIDELINES FOR CANADIANDRINKING WATER QUALITY
PARAMETERSRaw
WaterTreatedWater
MaximumAcceptable
Concentration
ObjectiveConcentration
---
0.010--
1.01.0
---
1.5--
0.080---
10.0--
1.010.0
-----
*1.0/0.3-
0.10020.0
--
0.5/1.0
12.00.059
<0.0500.00211.030.0<0.1<0.118.5
130.0<0.002<0.1031.02.2
-0.100-2.8-2.6
<0.0501.0000.048
<0.0130.087.3
0.6718.574.018.01.54.2
-0.25
<0.005<0.05
<0.16/<0.10
15.00.0100.082
<0.00110.0
150.00.5
<0.10<5.0
120.00.012<0.1028.02.0
0.0700.086-2.26-2.010.710.76
0.007<0.013<0.050
7.30.7526.0
220.0<2.0
<0.100.97
0.053<0.100.030<0.05
<0.12/<0.10
Alkalinity (as CaCO3)AluminumAmmonia (N)ArsenicCalciumChlorideChlorateChloriteColour (True Colour Units)Conductivity (µS/cm)Copper (Total)FluorideHardness (as CaCO3)Hardness (as CaCO3) (Grains/IG)HAA5 (avg.)Iron (Total)Langelier Index @ 4oCLangelier Index @ 20oCLead (Total) (µg/l)MagnesiumManganese (Total)Mercury (µg/l)Nitrate and Nitrite (as N)pH (pH Units)PotassiumSodiumSolids (Total Dissolved)SulfateTurbidity (NTU)Total Organic Carbon (TOC)THM’s (avg.)Uranium (µg/l)Zinc (Total)PCB (µg/l)Gross Alpha / Gross Beta (Bq/L)
TYPICAL ANALYSIS - SMALL SYSTEMS2016 - 2017
(in milligrams per litre unless shown otherwise)Note: All Regulatory Compliance Analysis are Processed by Third Party Laboratories
Ultra-filtration membrane plants must produce water with turbidity of <1.0 NTU 99% of the time and <0.3 NTU 100% of the time, as required by Provincial Permit.
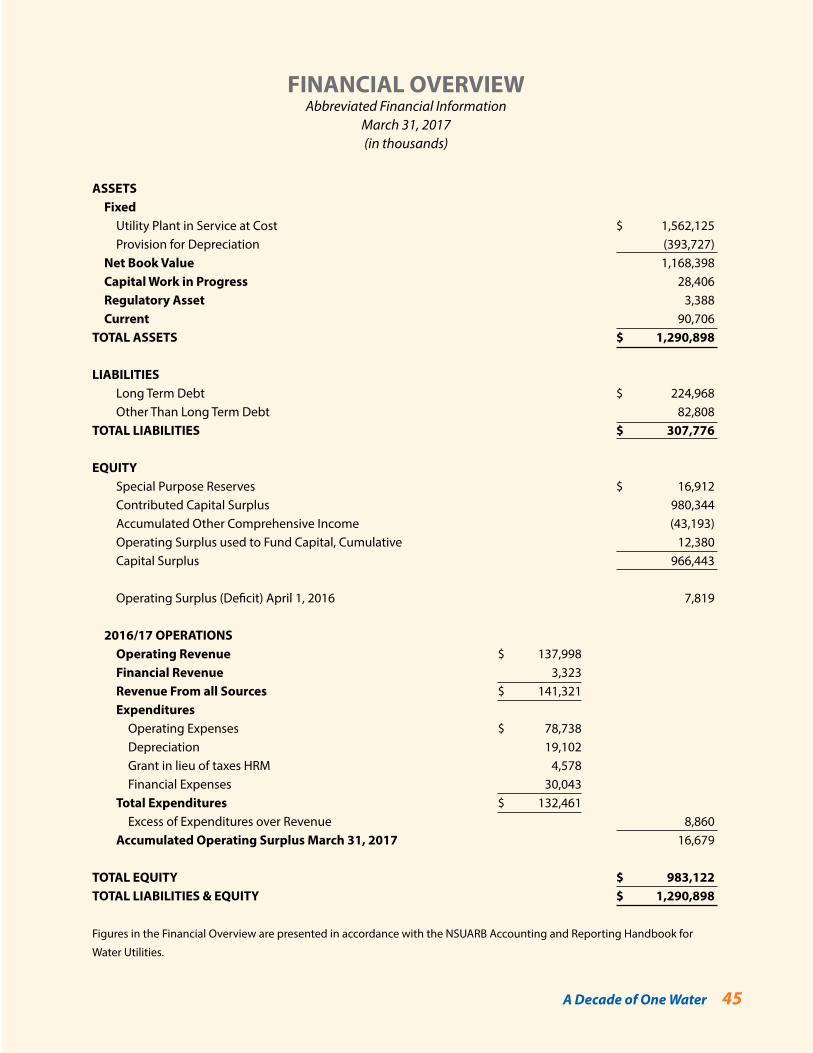
A Decade of One Water 45
FINANCIAL OVERVIEWAbbreviated Financial Information
March 31, 2017(in thousands)
ASSETS Fixed Utility Plant in Service at Cost $ 1,562,125 Provision for Depreciation (393,727) Net Book Value 1,168,398 Capital Work in Progress 28,406 Regulatory Asset 3,388 Current 90,706TOTAL ASSETS $ 1,290,898
LIABILITIES Long Term Debt $ 224,968 Other Than Long Term Debt 82,808TOTAL LIABILITIES $ 307,776
EQUITY Special Purpose Reserves $ 16,912 Contributed Capital Surplus 980,344 Accumulated Other Comprehensive Income (43,193) Operating Surplus used to Fund Capital, Cumulative 12,380 Capital Surplus 966,443 Operating Surplus (Deficit) April 1, 2016 7,819
2016/17 OPERATIONS Operating Revenue $ 137,998 Financial Revenue 3,323 Revenue From all Sources $ 141,321 Expenditures Operating Expenses $ 78,738 Depreciation 19,102 Grant in lieu of taxes HRM 4,578 Financial Expenses 30,043 Total Expenditures $ 132,461 Excess of Expenditures over Revenue 8,860 Accumulated Operating Surplus March 31, 2017 16,679
TOTAL EQUITY $ 983,122TOTAL LIABILITIES & EQUITY $ 1,290,898
Figures in the Financial Overview are presented in accordance with the NSUARB Accounting and Reporting Handbook for
Water Utilities.
46 A Decade of One Water
Financial Statements
Halifax Regional Water Commission
March 31, 2017
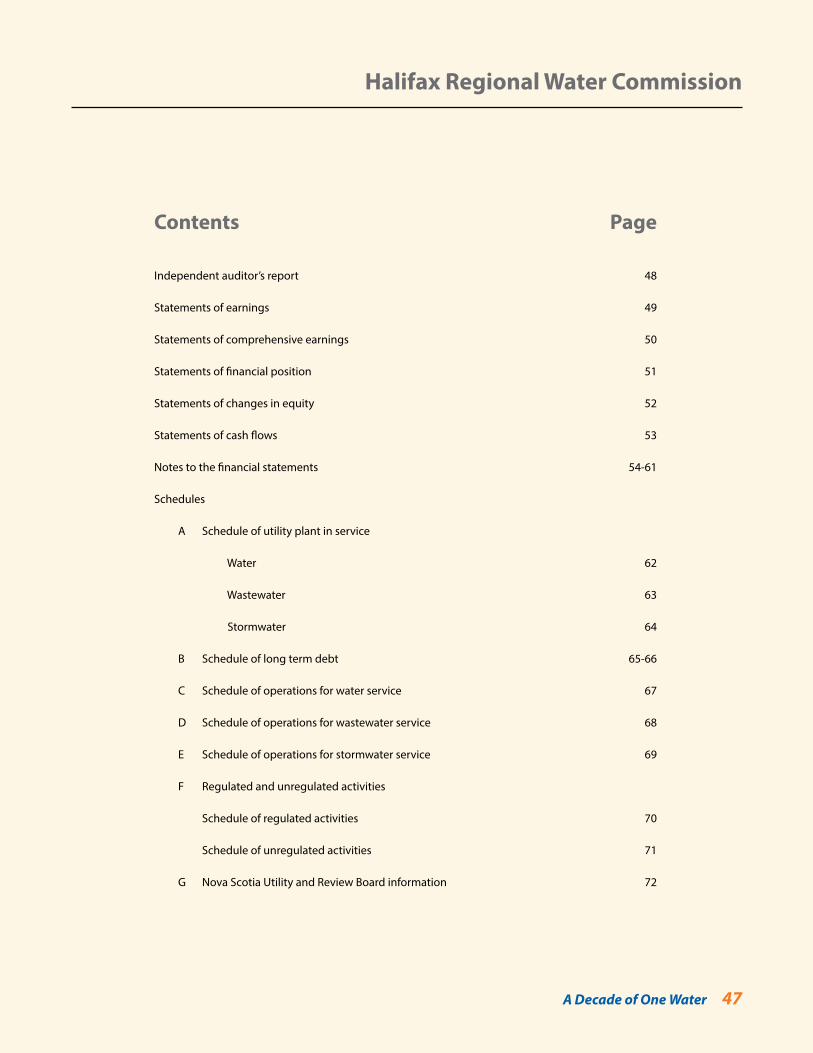
A Decade of One Water 47
Contents Page
Independent auditor’s report 48
Statements of earnings 49
Statements of comprehensive earnings 50
Statements of financial position 51
Statements of changes in equity 52
Statements of cash flows 53
Notes to the financial statements 54-61
Schedules
A Schedule of utility plant in service
Water 62
Wastewater 63
Stormwater 64
B Schedule of long term debt 65-66
C Schedule of operations for water service 67
D Schedule of operations for wastewater service 68
E Schedule of operations for stormwater service 69
F Regulated and unregulated activities
Schedule of regulated activities 70
Schedule of unregulated activities 71
G Nova Scotia Utility and Review Board information 72
Halifax Regional Water Commission
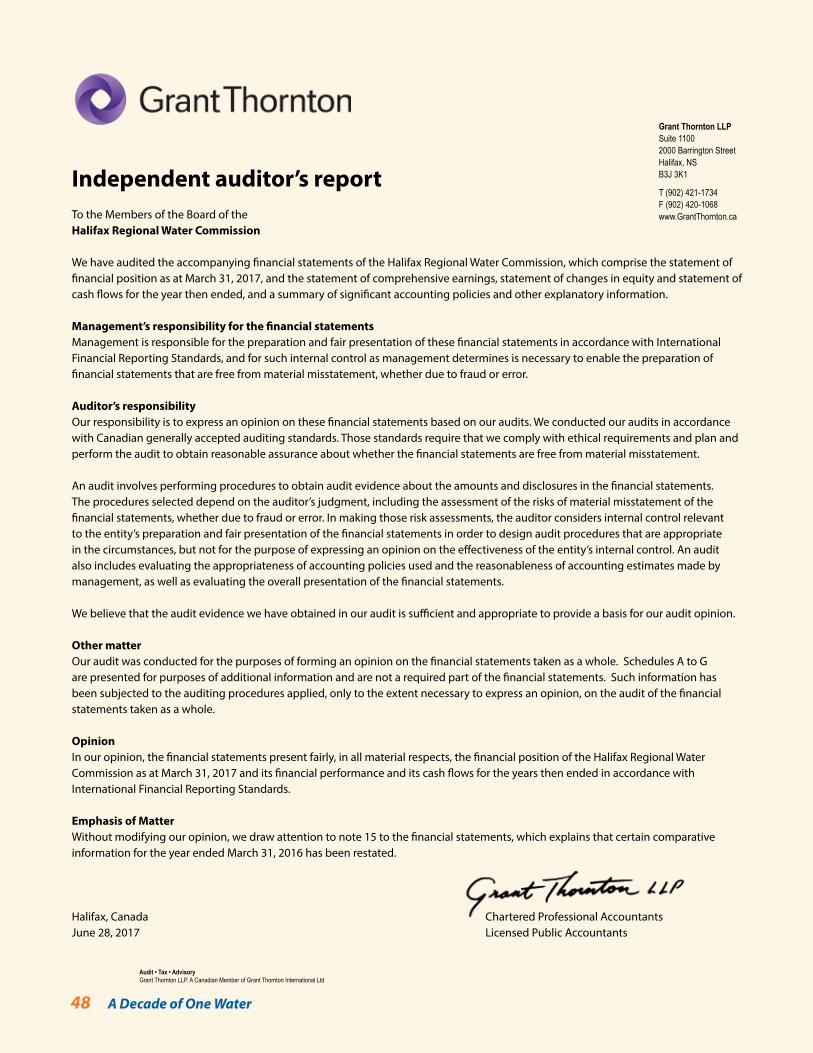
48 A Decade of One Water
Grant Thornton LLPSuite 11002000 Barrington StreetHalifax, NSB3J 3K1
T (902) 421-1734F (902) 420-1068www.GrantThornton.ca
Audit • Tax • AdvisoryGrant Thornton LLP. A Canadian Member of Grant Thornton International Ltd
Independent auditor’s report To the Members of the Board of theHalifax Regional Water Commission
We have audited the accompanying financial statements of the Halifax Regional Water Commission, which comprise the statement of financial position as at March 31, 2017, and the statement of comprehensive earnings, statement of changes in equity and statement of cash flows for the year then ended, and a summary of significant accounting policies and other explanatory information.
Management’s responsibility for the financial statementsManagement is responsible for the preparation and fair presentation of these financial statements in accordance with International Financial Reporting Standards, and for such internal control as management determines is necessary to enable the preparation of financial statements that are free from material misstatement, whether due to fraud or error.
Auditor’s responsibilityOur responsibility is to express an opinion on these financial statements based on our audits. We conducted our audits in accordance with Canadian generally accepted auditing standards. Those standards require that we comply with ethical requirements and plan and perform the audit to obtain reasonable assurance about whether the financial statements are free from material misstatement.
An audit involves performing procedures to obtain audit evidence about the amounts and disclosures in the financial statements. The procedures selected depend on the auditor’s judgment, including the assessment of the risks of material misstatement of the financial statements, whether due to fraud or error. In making those risk assessments, the auditor considers internal control relevant to the entity’s preparation and fair presentation of the financial statements in order to design audit procedures that are appropriate in the circumstances, but not for the purpose of expressing an opinion on the effectiveness of the entity’s internal control. An audit also includes evaluating the appropriateness of accounting policies used and the reasonableness of accounting estimates made by management, as well as evaluating the overall presentation of the financial statements.
We believe that the audit evidence we have obtained in our audit is sufficient and appropriate to provide a basis for our audit opinion.
Other matterOur audit was conducted for the purposes of forming an opinion on the financial statements taken as a whole. Schedules A to G are presented for purposes of additional information and are not a required part of the financial statements. Such information has been subjected to the auditing procedures applied, only to the extent necessary to express an opinion, on the audit of the financial statements taken as a whole.
OpinionIn our opinion, the financial statements present fairly, in all material respects, the financial position of the Halifax Regional Water Commission as at March 31, 2017 and its financial performance and its cash flows for the years then ended in accordance with International Financial Reporting Standards.
Emphasis of MatterWithout modifying our opinion, we draw attention to note 15 to the financial statements, which explains that certain comparative information for the year ended March 31, 2016 has been restated.
Halifax, Canada Chartered Professional AccountantsJune 28, 2017 Licensed Public Accountants
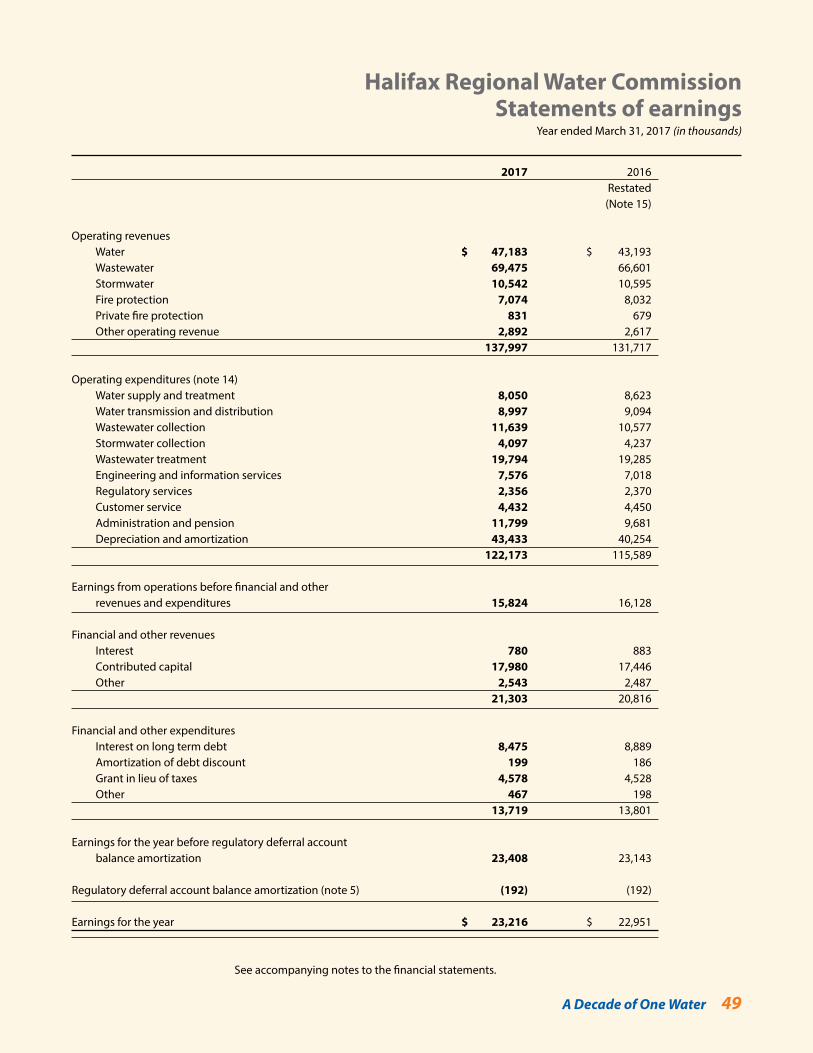
A Decade of One Water 49
Halifax Regional Water Commission Statements of earnings
Year ended March 31, 2017 (in thousands)
2017 2016 Restated (Note 15)
Operating revenues Water $ 47,183 $ 43,193 Wastewater 69,475 66,601 Stormwater 10,542 10,595 Fire protection 7,074 8,032 Private fire protection 831 679 Other operating revenue 2,892 2,617 137,997 131,717
Operating expenditures (note 14) Water supply and treatment 8,050 8,623 Water transmission and distribution 8,997 9,094 Wastewater collection 11,639 10,577 Stormwater collection 4,097 4,237 Wastewater treatment 19,794 19,285 Engineering and information services 7,576 7,018 Regulatory services 2,356 2,370 Customer service 4,432 4,450 Administration and pension 11,799 9,681 Depreciation and amortization 43,433 40,254 122,173 115,589
Earnings from operations before financial and other revenues and expenditures 15,824 16,128
Financial and other revenues Interest 780 883 Contributed capital 17,980 17,446 Other 2,543 2,487 21,303 20,816
Financial and other expenditures Interest on long term debt 8,475 8,889 Amortization of debt discount 199 186 Grant in lieu of taxes 4,578 4,528 Other 467 198 13,719 13,801
Earnings for the year before regulatory deferral account balance amortization 23,408 23,143
Regulatory deferral account balance amortization (note 5) (192) (192)
Earnings for the year $ 23,216 $ 22,951
See accompanying notes to the financial statements.
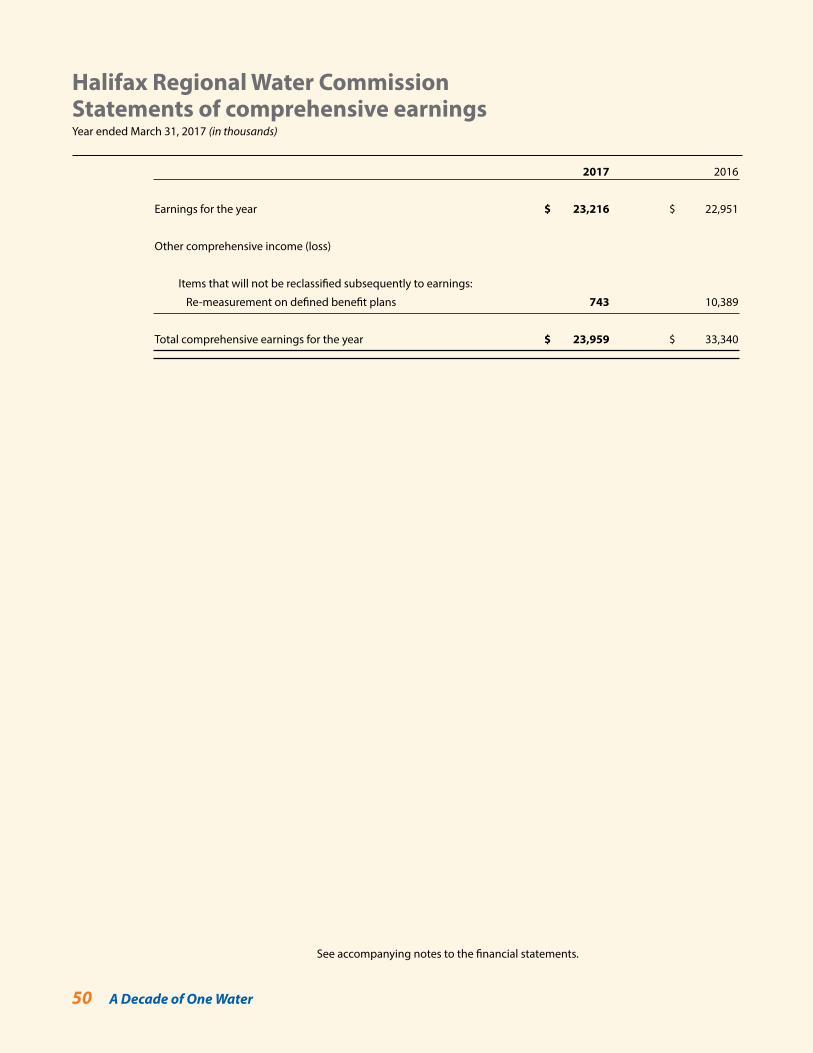
50 A Decade of One Water
Halifax Regional Water Commission Statements of comprehensive earningsYear ended March 31, 2017 (in thousands)
2017 2016
Earnings for the year $ 23,216 $ 22,951
Other comprehensive income (loss)
Items that will not be reclassified subsequently to earnings:
Re-measurement on defined benefit plans 743 10,389
Total comprehensive earnings for the year $ 23,959 $ 33,340
See accompanying notes to the financial statements.
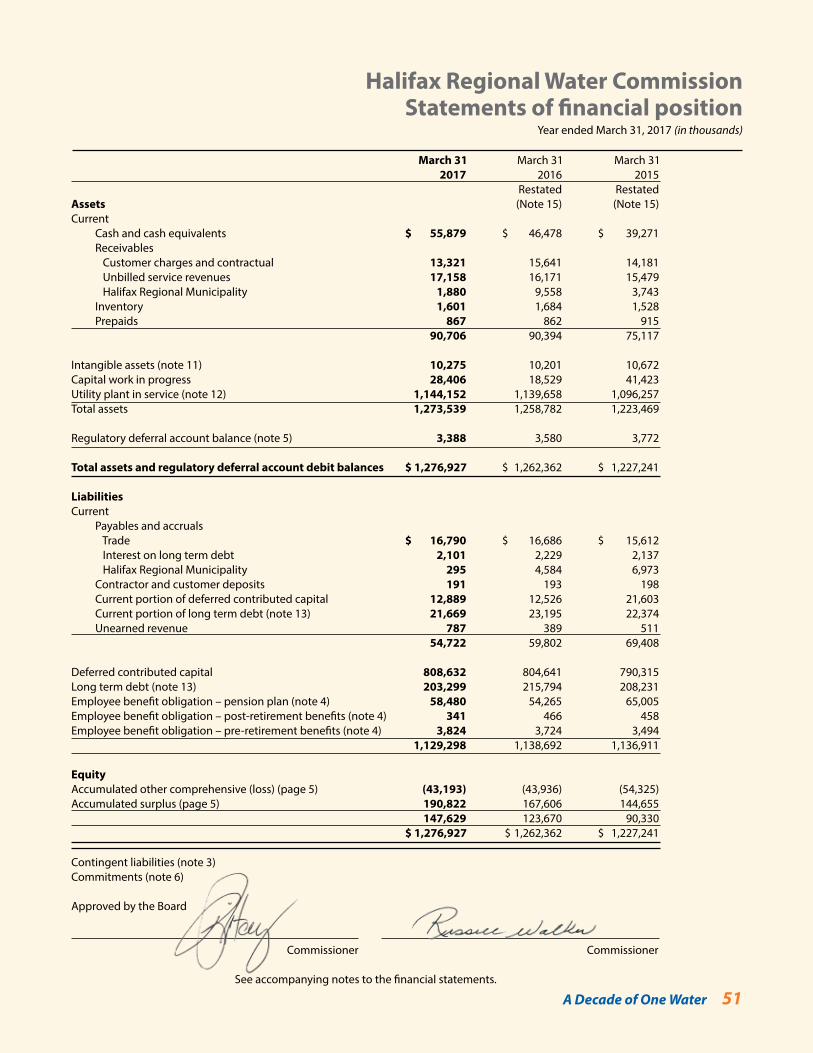
A Decade of One Water 51
Halifax Regional Water Commission Statements of financial position
Year ended March 31, 2017 (in thousands)
2017 2016 2015 Restated RestatedAssets (Note 15) (Note 15) Current Cash and cash equivalents $ 55,879 $ 46,478 $ 39,271 Receivables Customer charges and contractual 13,321 15,641 14,181 Unbilled service revenues 17,158 16,171 15,479 Halifax Regional Municipality 1,880 9,558 3,743 Inventory 1,601 1,684 1,528 Prepaids 867 862 915 90,706 90,394 75,117
Intangible assets (note 11) 10,275 10,201 10,672Capital work in progress 28,406 18,529 41,423Utility plant in service (note 12) 1,144,152 1,139,658 1,096,257Total assets 1,273,539 1,258,782 1,223,469
Regulatory deferral account balance (note 5) 3,388 3,580 3,772
Total assets and regulatory deferral account debit balances $ 1,276,927 $ 1,262,362 $ 1,227,241
LiabilitiesCurrent Payables and accruals Trade $ 16,790 $ 16,686 $ 15,612 Interest on long term debt 2,101 2,229 2,137 Halifax Regional Municipality 295 4,584 6,973 Contractor and customer deposits 191 193 198 Current portion of deferred contributed capital 12,889 12,526 21,603 Current portion of long term debt (note 13) 21,669 23,195 22,374 Unearned revenue 787 389 511 54,722 59,802 69,408
Deferred contributed capital 808,632 804,641 790,315Long term debt (note 13) 203,299 215,794 208,231Employee benefit obligation – pension plan (note 4) 58,480 54,265 65,005Employee benefit obligation – post-retirement benefits (note 4) 341 466 458Employee benefit obligation – pre-retirement benefits (note 4) 3,824 3,724 3,494 1,129,298 1,138,692 1,136,911
EquityAccumulated other comprehensive (loss) (page 5) (43,193) (43,936) (54,325)Accumulated surplus (page 5) 190,822 167,606 144,655 147,629 123,670 90,330 $ 1,276,927 $ 1,262,362 $ 1,227,241
Contingent liabilities (note 3)Commitments (note 6)
Approved by the Board
Commissioner Commissioner
See accompanying notes to the financial statements.
March 31 March 31 March 31
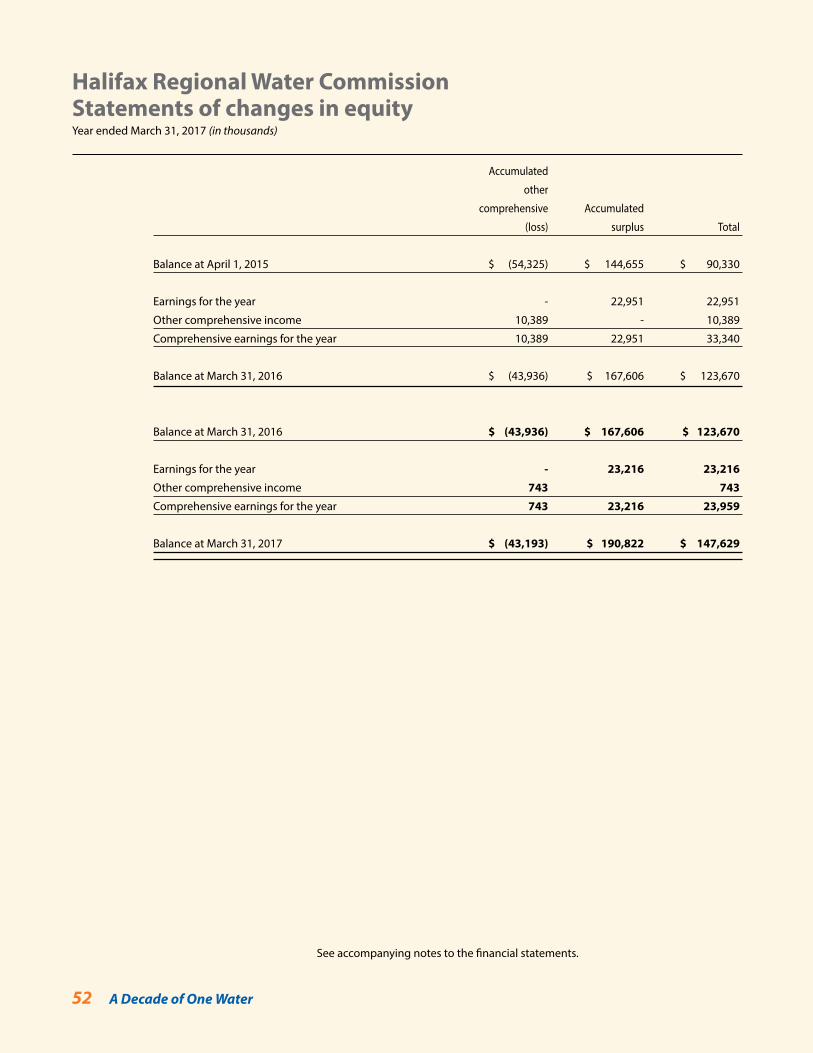
52 A Decade of One Water
Halifax Regional Water Commission Statements of changes in equityYear ended March 31, 2017 (in thousands)
Accumulated
other
comprehensive Accumulated
(loss) surplus Total
Balance at April 1, 2015 $ (54,325) $ 144,655 $ 90,330
Earnings for the year - 22,951 22,951
Other comprehensive income 10,389 - 10,389
Comprehensive earnings for the year 10,389 22,951 33,340
Balance at March 31, 2016 $ (43,936) $ 167,606 $ 123,670
Balance at March 31, 2016 $ (43,936) $ 167,606 $ 123,670
Earnings for the year - 23,216 23,216
Other comprehensive income 743 743
Comprehensive earnings for the year 743 23,216 23,959
Balance at March 31, 2017 $ (43,193) $ 190,822 $ 147,629
See accompanying notes to the financial statements.
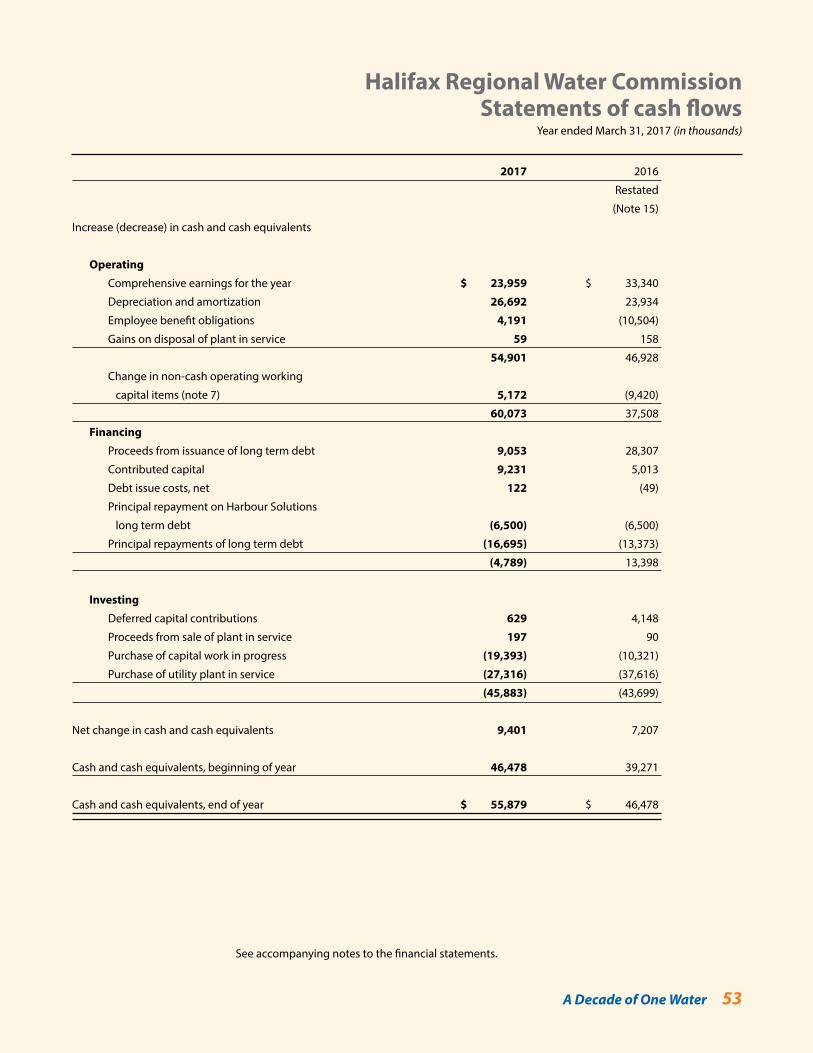
A Decade of One Water 53
Halifax Regional Water Commission Statements of cash flows
Year ended March 31, 2017 (in thousands)
2017 2016
Restated
(Note 15)
Increase (decrease) in cash and cash equivalents
Operating
Comprehensive earnings for the year $ 23,959 $ 33,340
Depreciation and amortization 26,692 23,934
Employee benefit obligations 4,191 (10,504)
Gains on disposal of plant in service 59 158
54,901 46,928
Change in non-cash operating working
capital items (note 7) 5,172 (9,420)
60,073 37,508
Financing
Proceeds from issuance of long term debt 9,053 28,307
Contributed capital 9,231 5,013
Debt issue costs, net 122 (49)
Principal repayment on Harbour Solutions
long term debt (6,500) (6,500)
Principal repayments of long term debt (16,695) (13,373)
(4,789) 13,398
Investing
Deferred capital contributions 629 4,148
Proceeds from sale of plant in service 197 90
Purchase of capital work in progress (19,393) (10,321)
Purchase of utility plant in service (27,316) (37,616)
(45,883) (43,699)
Net change in cash and cash equivalents 9,401 7,207
Cash and cash equivalents, beginning of year 46,478 39,271
Cash and cash equivalents, end of year $ 55,879 $ 46,478
See accompanying notes to the financial statements.
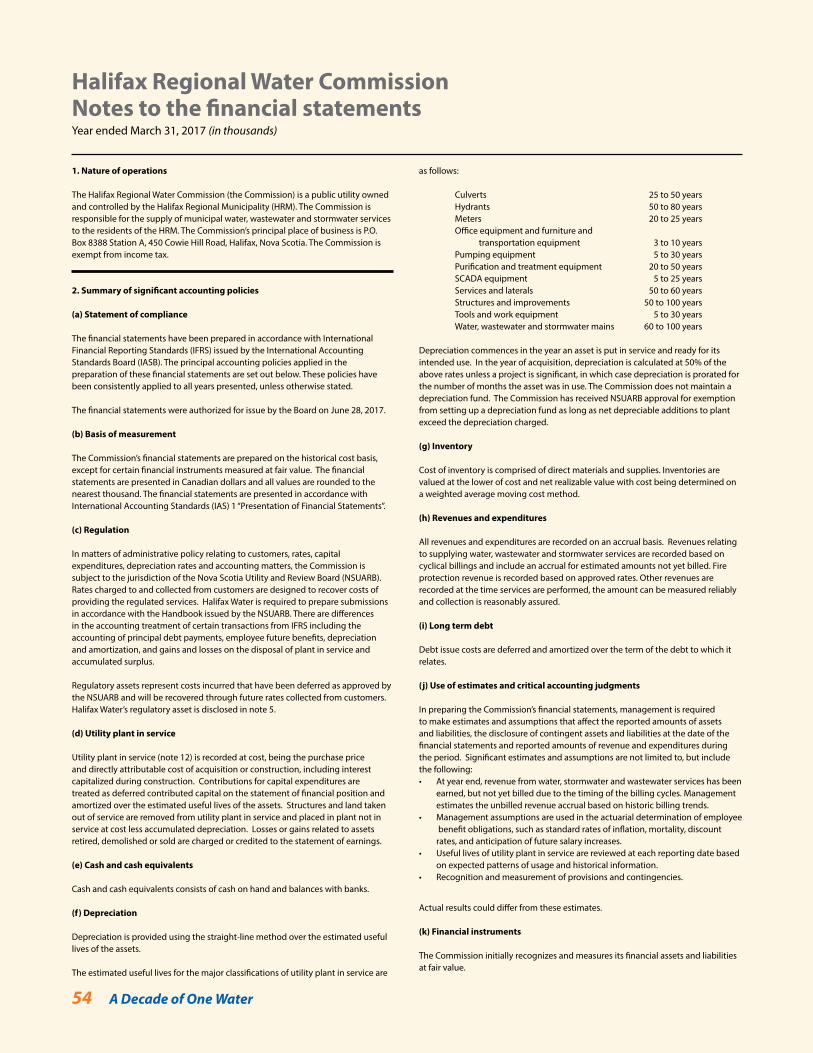
54 A Decade of One Water
Halifax Regional Water Commission Notes to the financial statementsYear ended March 31, 2017 (in thousands)
1. Nature of operations
The Halifax Regional Water Commission (the Commission) is a public utility owned and controlled by the Halifax Regional Municipality (HRM). The Commission is responsible for the supply of municipal water, wastewater and stormwater services to the residents of the HRM. The Commission’s principal place of business is P.O. Box 8388 Station A, 450 Cowie Hill Road, Halifax, Nova Scotia. The Commission is exempt from income tax.
2. Summary of significant accounting policies
(a) Statement of compliance
The financial statements have been prepared in accordance with International Financial Reporting Standards (IFRS) issued by the International Accounting Standards Board (IASB). The principal accounting policies applied in the preparation of these financial statements are set out below. These policies have been consistently applied to all years presented, unless otherwise stated.
The financial statements were authorized for issue by the Board on June 28, 2017.
(b) Basis of measurement
The Commission’s financial statements are prepared on the historical cost basis, except for certain financial instruments measured at fair value. The financial statements are presented in Canadian dollars and all values are rounded to the nearest thousand. The financial statements are presented in accordance with International Accounting Standards (IAS) 1 “Presentation of Financial Statements”.
(c) Regulation
In matters of administrative policy relating to customers, rates, capital expenditures, depreciation rates and accounting matters, the Commission is subject to the jurisdiction of the Nova Scotia Utility and Review Board (NSUARB). Rates charged to and collected from customers are designed to recover costs of providing the regulated services. Halifax Water is required to prepare submissions in accordance with the Handbook issued by the NSUARB. There are differences in the accounting treatment of certain transactions from IFRS including the accounting of principal debt payments, employee future benefits, depreciation and amortization, and gains and losses on the disposal of plant in service and accumulated surplus.
Regulatory assets represent costs incurred that have been deferred as approved by the NSUARB and will be recovered through future rates collected from customers. Halifax Water’s regulatory asset is disclosed in note 5.
(d) Utility plant in service
Utility plant in service (note 12) is recorded at cost, being the purchase price and directly attributable cost of acquisition or construction, including interest capitalized during construction. Contributions for capital expenditures are treated as deferred contributed capital on the statement of financial position and amortized over the estimated useful lives of the assets. Structures and land taken out of service are removed from utility plant in service and placed in plant not in service at cost less accumulated depreciation. Losses or gains related to assets retired, demolished or sold are charged or credited to the statement of earnings.
(e) Cash and cash equivalents
Cash and cash equivalents consists of cash on hand and balances with banks.
(f) Depreciation
Depreciation is provided using the straight-line method over the estimated useful lives of the assets.
The estimated useful lives for the major classifications of utility plant in service are
as follows:
Culverts 25 to 50 years Hydrants 50 to 80 years Meters 20 to 25 years Office equipment and furniture and transportation equipment 3 to 10 years Pumping equipment 5 to 30 years Purification and treatment equipment 20 to 50 years SCADA equipment 5 to 25 years Services and laterals 50 to 60 years Structures and improvements 50 to 100 years Tools and work equipment 5 to 30 years Water, wastewater and stormwater mains 60 to 100 years
Depreciation commences in the year an asset is put in service and ready for its intended use. In the year of acquisition, depreciation is calculated at 50% of the above rates unless a project is significant, in which case depreciation is prorated for the number of months the asset was in use. The Commission does not maintain a depreciation fund. The Commission has received NSUARB approval for exemption from setting up a depreciation fund as long as net depreciable additions to plant exceed the depreciation charged.
(g) Inventory
Cost of inventory is comprised of direct materials and supplies. Inventories are valued at the lower of cost and net realizable value with cost being determined on a weighted average moving cost method.
(h) Revenues and expenditures
All revenues and expenditures are recorded on an accrual basis. Revenues relating to supplying water, wastewater and stormwater services are recorded based on cyclical billings and include an accrual for estimated amounts not yet billed. Fire protection revenue is recorded based on approved rates. Other revenues are recorded at the time services are performed, the amount can be measured reliably and collection is reasonably assured.
(i) Long term debt
Debt issue costs are deferred and amortized over the term of the debt to which it relates.
(j) Use of estimates and critical accounting judgments
In preparing the Commission’s financial statements, management is required to make estimates and assumptions that affect the reported amounts of assets and liabilities, the disclosure of contingent assets and liabilities at the date of the financial statements and reported amounts of revenue and expenditures during the period. Significant estimates and assumptions are not limited to, but include the following:• At year end, revenue from water, stormwater and wastewater services has been earned, but not yet billed due to the timing of the billing cycles. Management estimates the unbilled revenue accrual based on historic billing trends.• Management assumptions are used in the actuarial determination of employee benefit obligations, such as standard rates of inflation, mortality, discount rates, and anticipation of future salary increases.• Useful lives of utility plant in service are reviewed at each reporting date based on expected patterns of usage and historical information.• Recognition and measurement of provisions and contingencies.
Actual results could differ from these estimates.
(k) Financial instruments
The Commission initially recognizes and measures its financial assets and liabilities at fair value.
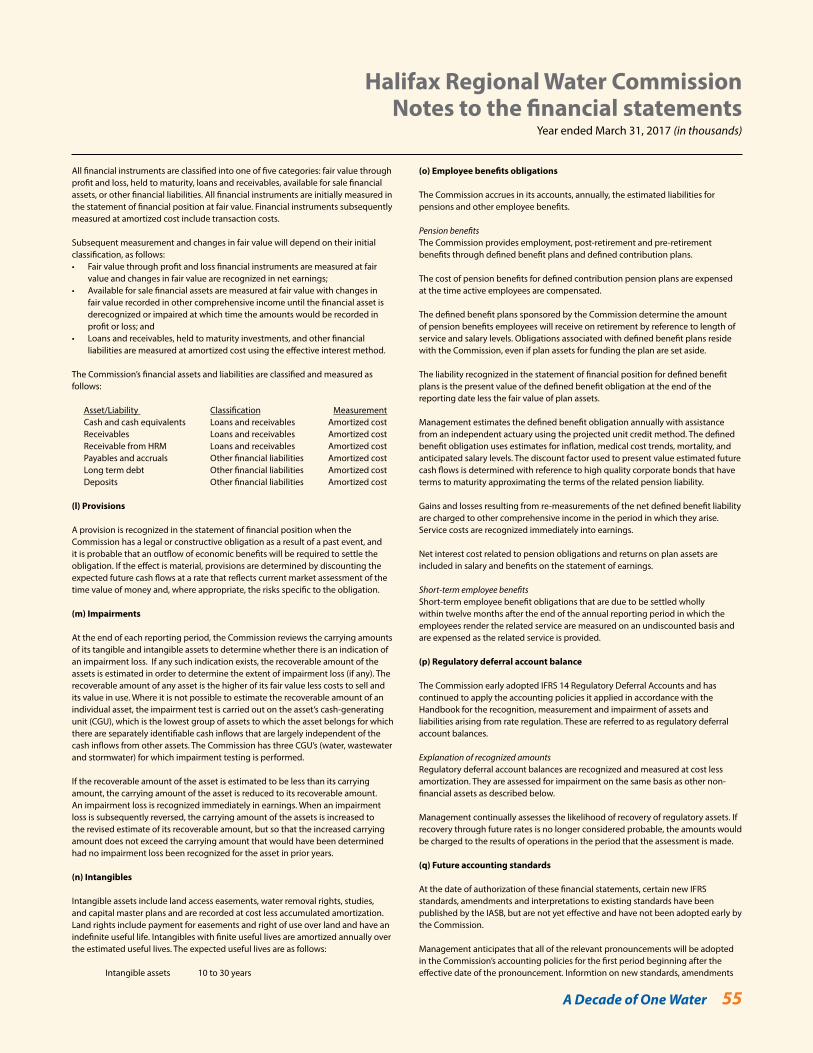
A Decade of One Water 55
Halifax Regional Water Commission Notes to the financial statements
Year ended March 31, 2017 (in thousands)
All financial instruments are classified into one of five categories: fair value through profit and loss, held to maturity, loans and receivables, available for sale financial assets, or other financial liabilities. All financial instruments are initially measured in the statement of financial position at fair value. Financial instruments subsequently measured at amortized cost include transaction costs.
Subsequent measurement and changes in fair value will depend on their initial classification, as follows:• Fair value through profit and loss financial instruments are measured at fair value and changes in fair value are recognized in net earnings;• Available for sale financial assets are measured at fair value with changes in fair value recorded in other comprehensive income until the financial asset is derecognized or impaired at which time the amounts would be recorded in profit or loss; and• Loans and receivables, held to maturity investments, and other financial liabilities are measured at amortized cost using the effective interest method.
The Commission’s financial assets and liabilities are classified and measured as follows:
Asset/Liability Classification Measurement Cash and cash equivalents Loans and receivables Amortized cost Receivables Loans and receivables Amortized cost Receivable from HRM Loans and receivables Amortized cost Payables and accruals Other financial liabilities Amortized cost Long term debt Other financial liabilities Amortized cost Deposits Other financial liabilities Amortized cost
(l) Provisions
A provision is recognized in the statement of financial position when the Commission has a legal or constructive obligation as a result of a past event, and it is probable that an outflow of economic benefits will be required to settle the obligation. If the effect is material, provisions are determined by discounting the expected future cash flows at a rate that reflects current market assessment of the time value of money and, where appropriate, the risks specific to the obligation.
(m) Impairments
At the end of each reporting period, the Commission reviews the carrying amounts of its tangible and intangible assets to determine whether there is an indication of an impairment loss. If any such indication exists, the recoverable amount of the assets is estimated in order to determine the extent of impairment loss (if any). The recoverable amount of any asset is the higher of its fair value less costs to sell and its value in use. Where it is not possible to estimate the recoverable amount of an individual asset, the impairment test is carried out on the asset’s cash-generating unit (CGU), which is the lowest group of assets to which the asset belongs for which there are separately identifiable cash inflows that are largely independent of the cash inflows from other assets. The Commission has three CGU’s (water, wastewater and stormwater) for which impairment testing is performed.
If the recoverable amount of the asset is estimated to be less than its carrying amount, the carrying amount of the asset is reduced to its recoverable amount. An impairment loss is recognized immediately in earnings. When an impairment loss is subsequently reversed, the carrying amount of the assets is increased to the revised estimate of its recoverable amount, but so that the increased carrying amount does not exceed the carrying amount that would have been determined had no impairment loss been recognized for the asset in prior years.
(n) Intangibles
Intangible assets include land access easements, water removal rights, studies, and capital master plans and are recorded at cost less accumulated amortization. Land rights include payment for easements and right of use over land and have an indefinite useful life. Intangibles with finite useful lives are amortized annually over the estimated useful lives. The expected useful lives are as follows:
Intangible assets 10 to 30 years
(o) Employee benefits obligations
The Commission accrues in its accounts, annually, the estimated liabilities for pensions and other employee benefits.
Pension benefitsThe Commission provides employment, post-retirement and pre-retirement benefits through defined benefit plans and defined contribution plans.
The cost of pension benefits for defined contribution pension plans are expensed at the time active employees are compensated.
The defined benefit plans sponsored by the Commission determine the amount of pension benefits employees will receive on retirement by reference to length of service and salary levels. Obligations associated with defined benefit plans reside with the Commission, even if plan assets for funding the plan are set aside.
The liability recognized in the statement of financial position for defined benefit plans is the present value of the defined benefit obligation at the end of the reporting date less the fair value of plan assets.
Management estimates the defined benefit obligation annually with assistance from an independent actuary using the projected unit credit method. The defined benefit obligation uses estimates for inflation, medical cost trends, mortality, and anticipated salary levels. The discount factor used to present value estimated future cash flows is determined with reference to high quality corporate bonds that have terms to maturity approximating the terms of the related pension liability.
Gains and losses resulting from re-measurements of the net defined benefit liability are charged to other comprehensive income in the period in which they arise. Service costs are recognized immediately into earnings.
Net interest cost related to pension obligations and returns on plan assets are included in salary and benefits on the statement of earnings.
Short-term employee benefitsShort-term employee benefit obligations that are due to be settled wholly within twelve months after the end of the annual reporting period in which the employees render the related service are measured on an undiscounted basis and are expensed as the related service is provided.
(p) Regulatory deferral account balance
The Commission early adopted IFRS 14 Regulatory Deferral Accounts and has continued to apply the accounting policies it applied in accordance with the Handbook for the recognition, measurement and impairment of assets and liabilities arising from rate regulation. These are referred to as regulatory deferral account balances.
Explanation of recognized amountsRegulatory deferral account balances are recognized and measured at cost less amortization. They are assessed for impairment on the same basis as other non-financial assets as described below.
Management continually assesses the likelihood of recovery of regulatory assets. If recovery through future rates is no longer considered probable, the amounts would be charged to the results of operations in the period that the assessment is made.
(q) Future accounting standards
At the date of authorization of these financial statements, certain new IFRS standards, amendments and interpretations to existing standards have been published by the IASB, but are not yet effective and have not been adopted early by the Commission.
Management anticipates that all of the relevant pronouncements will be adopted in the Commission’s accounting policies for the first period beginning after the effective date of the pronouncement. Informtion on new standards, amendments
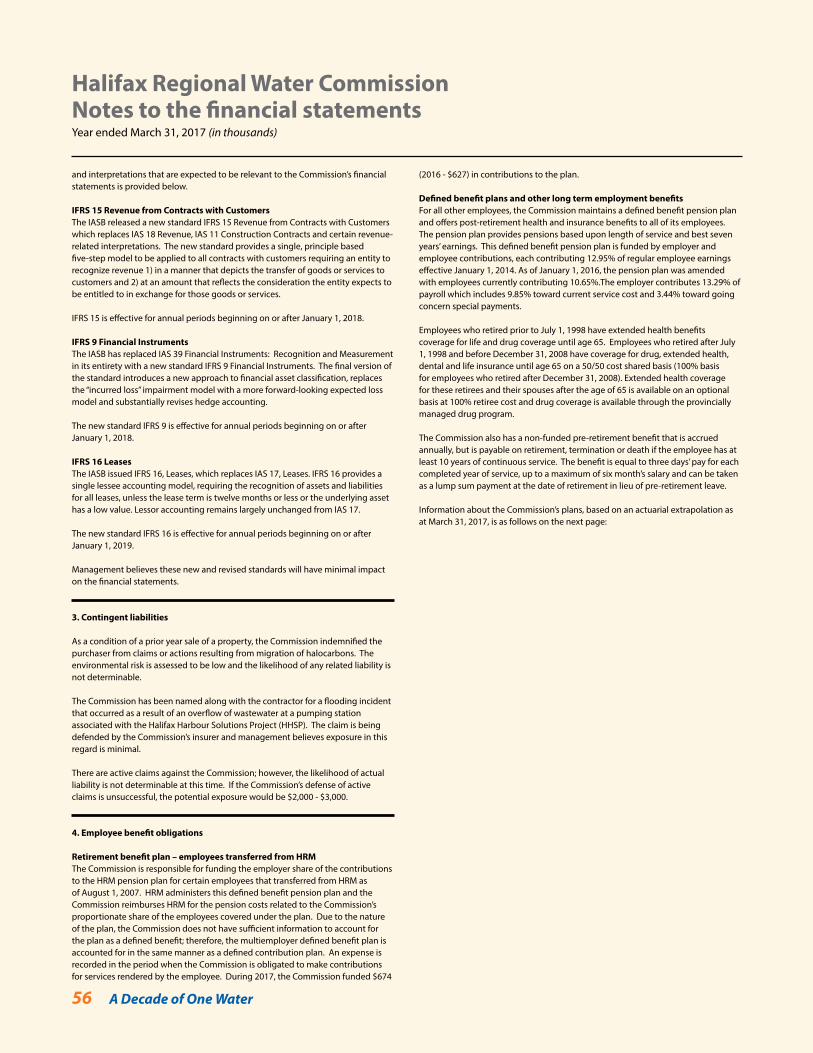
56 A Decade of One Water
Halifax Regional Water Commission Notes to the financial statementsYear ended March 31, 2017 (in thousands)
and interpretations that are expected to be relevant to the Commission’s financial statements is provided below.
IFRS 15 Revenue from Contracts with CustomersThe IASB released a new standard IFRS 15 Revenue from Contracts with Customers which replaces IAS 18 Revenue, IAS 11 Construction Contracts and certain revenue-related interpretations. The new standard provides a single, principle based five-step model to be applied to all contracts with customers requiring an entity to recognize revenue 1) in a manner that depicts the transfer of goods or services to customers and 2) at an amount that reflects the consideration the entity expects to be entitled to in exchange for those goods or services.
IFRS 15 is effective for annual periods beginning on or after January 1, 2018.
IFRS 9 Financial InstrumentsThe IASB has replaced IAS 39 Financial Instruments: Recognition and Measurement in its entirety with a new standard IFRS 9 Financial Instruments. The final version of the standard introduces a new approach to financial asset classification, replaces the “incurred loss” impairment model with a more forward-looking expected loss model and substantially revises hedge accounting.
The new standard IFRS 9 is effective for annual periods beginning on or after January 1, 2018.
IFRS 16 LeasesThe IASB issued IFRS 16, Leases, which replaces IAS 17, Leases. IFRS 16 provides a single lessee accounting model, requiring the recognition of assets and liabilities for all leases, unless the lease term is twelve months or less or the underlying asset has a low value. Lessor accounting remains largely unchanged from IAS 17.
The new standard IFRS 16 is effective for annual periods beginning on or after January 1, 2019.
Management believes these new and revised standards will have minimal impact on the financial statements.
3. Contingent liabilities
As a condition of a prior year sale of a property, the Commission indemnified the purchaser from claims or actions resulting from migration of halocarbons. The environmental risk is assessed to be low and the likelihood of any related liability is not determinable.
The Commission has been named along with the contractor for a flooding incident that occurred as a result of an overflow of wastewater at a pumping station associated with the Halifax Harbour Solutions Project (HHSP). The claim is being defended by the Commission’s insurer and management believes exposure in this regard is minimal.
There are active claims against the Commission; however, the likelihood of actual liability is not determinable at this time. If the Commission’s defense of active claims is unsuccessful, the potential exposure would be $2,000 - $3,000.
4. Employee benefit obligations
Retirement benefit plan – employees transferred from HRMThe Commission is responsible for funding the employer share of the contributions to the HRM pension plan for certain employees that transferred from HRM as of August 1, 2007. HRM administers this defined benefit pension plan and the Commission reimburses HRM for the pension costs related to the Commission’s proportionate share of the employees covered under the plan. Due to the nature of the plan, the Commission does not have sufficient information to account for the plan as a defined benefit; therefore, the multiemployer defined benefit plan is accounted for in the same manner as a defined contribution plan. An expense is recorded in the period when the Commission is obligated to make contributions for services rendered by the employee. During 2017, the Commission funded $674
(2016 - $627) in contributions to the plan.
Defined benefit plans and other long term employment benefitsFor all other employees, the Commission maintains a defined benefit pension plan and offers post-retirement health and insurance benefits to all of its employees. The pension plan provides pensions based upon length of service and best seven years’ earnings. This defined benefit pension plan is funded by employer and employee contributions, each contributing 12.95% of regular employee earnings effective January 1, 2014. As of January 1, 2016, the pension plan was amended with employees currently contributing 10.65%.The employer contributes 13.29% of payroll which includes 9.85% toward current service cost and 3.44% toward going concern special payments.
Employees who retired prior to July 1, 1998 have extended health benefits coverage for life and drug coverage until age 65. Employees who retired after July 1, 1998 and before December 31, 2008 have coverage for drug, extended health, dental and life insurance until age 65 on a 50/50 cost shared basis (100% basis for employees who retired after December 31, 2008). Extended health coverage for these retirees and their spouses after the age of 65 is available on an optional basis at 100% retiree cost and drug coverage is available through the provincially managed drug program.
The Commission also has a non-funded pre-retirement benefit that is accrued annually, but is payable on retirement, termination or death if the employee has at least 10 years of continuous service. The benefit is equal to three days’ pay for each completed year of service, up to a maximum of six month’s salary and can be taken as a lump sum payment at the date of retirement in lieu of pre-retirement leave.
Information about the Commission’s plans, based on an actuarial extrapolation as at March 31, 2017, is as follows on the next page:
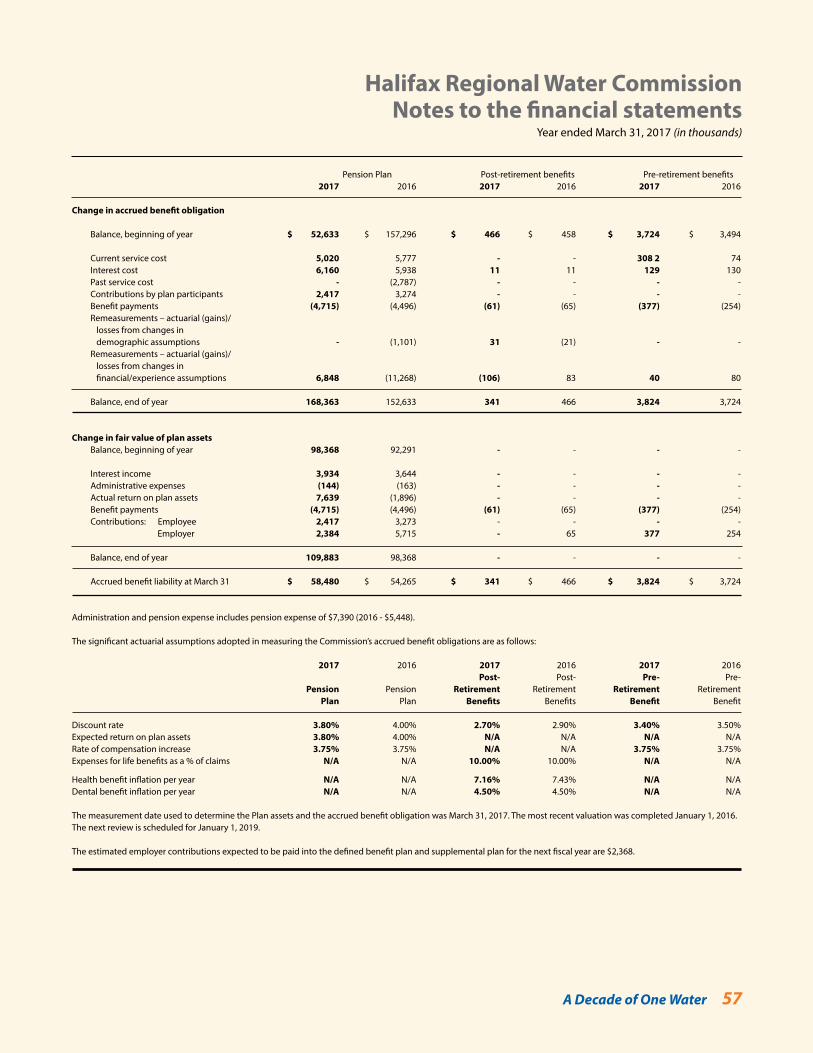
A Decade of One Water 57
Halifax Regional Water Commission Notes to the financial statements
Year ended March 31, 2017 (in thousands)
Pension Plan Post-retirement benefits Pre-retirement benefits 2017 2016 2017 2016 2017 2016
Change in accrued benefit obligation
Balance, beginning of year $ 52,633 $ 157,296 $ 466 $ 458 $ 3,724 $ 3,494
Current service cost 5,020 5,777 - - 308 2 74 Interest cost 6,160 5,938 11 11 129 130 Past service cost - (2,787) - - - - Contributions by plan participants 2,417 3,274 - - - - Benefit payments (4,715) (4,496) (61) (65) (377) (254) Remeasurements – actuarial (gains)/ losses from changes in demographic assumptions - (1,101) 31 (21) - - Remeasurements – actuarial (gains)/ losses from changes in financial/experience assumptions 6,848 (11,268) (106) 83 40 80
Balance, end of year 168,363 152,633 341 466 3,824 3,724
Change in fair value of plan assets Balance, beginning of year 98,368 92,291 - - - -
Interest income 3,934 3,644 - - - - Administrative expenses (144) (163) - - - - Actual return on plan assets 7,639 (1,896) - - - - Benefit payments (4,715) (4,496) (61) (65) (377) (254) Contributions: Employee 2,417 3,273 - - - - Employer 2,384 5,715 - 65 377 254 Balance, end of year 109,883 98,368 - - - -
Accrued benefit liability at March 31 $ 58,480 $ 54,265 $ 341 $ 466 $ 3,824 $ 3,724
Administration and pension expense includes pension expense of $7,390 (2016 - $5,448).
The significant actuarial assumptions adopted in measuring the Commission’s accrued benefit obligations are as follows:
2017 2016 2017 2016 2017 2016 Post- Post- Pre- Pre- Pension Pension Retirement Retirement Retirement Retirement Plan Plan Benefits Benefits Benefit Benefit
Discount rate 3.80% 4.00% 2.70% 2.90% 3.40% 3.50%Expected return on plan assets 3.80% 4.00% N/A N/A N/A N/ARate of compensation increase 3.75% 3.75% N/A N/A 3.75% 3.75%Expenses for life benefits as a % of claims N/A N/A 10.00% 10.00% N/A N/A
Health benefit inflation per year N/A N/A 7.16% 7.43% N/A N/ADental benefit inflation per year N/A N/A 4.50% 4.50% N/A N/A
The measurement date used to determine the Plan assets and the accrued benefit obligation was March 31, 2017. The most recent valuation was completed January 1, 2016. The next review is scheduled for January 1, 2019.
The estimated employer contributions expected to be paid into the defined benefit plan and supplemental plan for the next fiscal year are $2,368.
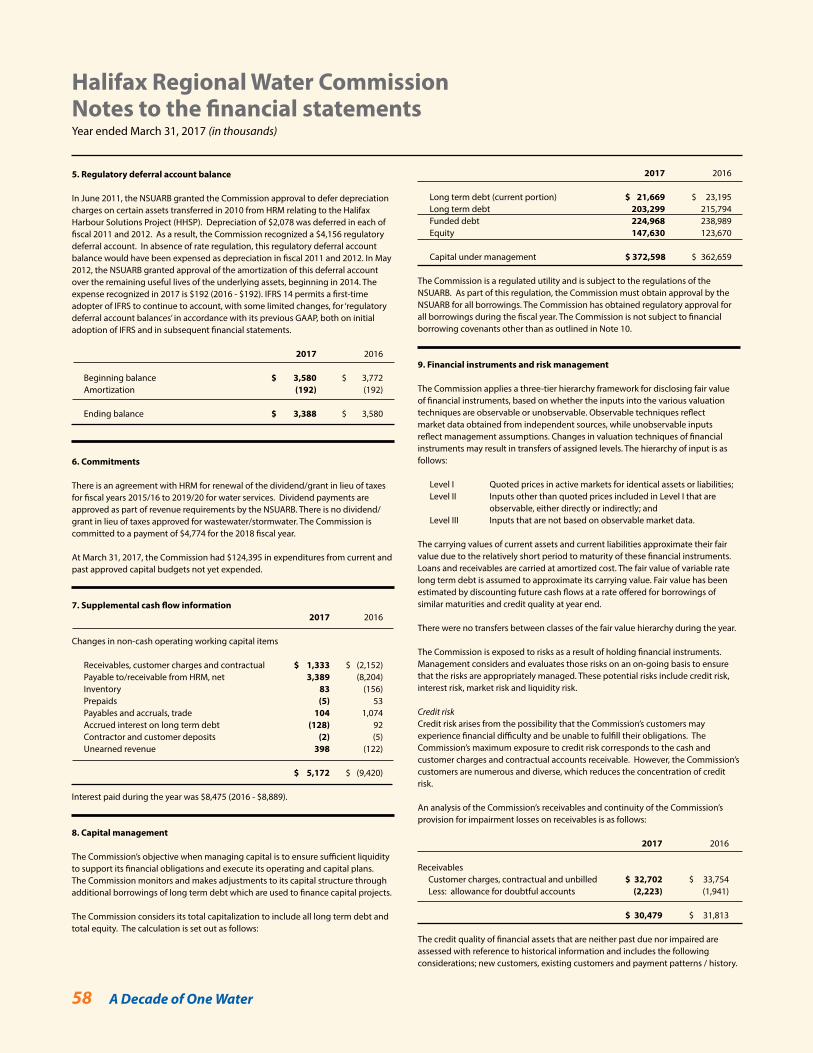
58 A Decade of One Water
Halifax Regional Water Commission Notes to the financial statementsYear ended March 31, 2017 (in thousands)
5. Regulatory deferral account balance
In June 2011, the NSUARB granted the Commission approval to defer depreciation charges on certain assets transferred in 2010 from HRM relating to the Halifax Harbour Solutions Project (HHSP). Depreciation of $2,078 was deferred in each of fiscal 2011 and 2012. As a result, the Commission recognized a $4,156 regulatory deferral account. In absence of rate regulation, this regulatory deferral account balance would have been expensed as depreciation in fiscal 2011 and 2012. In May 2012, the NSUARB granted approval of the amortization of this deferral account over the remaining useful lives of the underlying assets, beginning in 2014. The expense recognized in 2017 is $192 (2016 - $192). IFRS 14 permits a first-time adopter of IFRS to continue to account, with some limited changes, for ‘regulatory deferral account balances’ in accordance with its previous GAAP, both on initial adoption of IFRS and in subsequent financial statements.
2017 2016
Beginning balance $ 3,580 $ 3,772 Amortization (192) (192)
Ending balance $ 3,388 $ 3,580
6. Commitments
There is an agreement with HRM for renewal of the dividend/grant in lieu of taxes for fiscal years 2015/16 to 2019/20 for water services. Dividend payments are approved as part of revenue requirements by the NSUARB. There is no dividend/grant in lieu of taxes approved for wastewater/stormwater. The Commission is committed to a payment of $4,774 for the 2018 fiscal year.
At March 31, 2017, the Commission had $124,395 in expenditures from current and past approved capital budgets not yet expended.
7. Supplemental cash flow information 2017 2016
Changes in non-cash operating working capital items
Receivables, customer charges and contractual $ 1,333 $ (2,152) Payable to/receivable from HRM, net 3,389 (8,204) Inventory 83 (156) Prepaids (5) 53 Payables and accruals, trade 104 1,074 Accrued interest on long term debt (128) 92 Contractor and customer deposits (2) (5) Unearned revenue 398 (122)
$ 5,172 $ (9,420)
Interest paid during the year was $8,475 (2016 - $8,889).
8. Capital management
The Commission’s objective when managing capital is to ensure sufficient liquidity to support its financial obligations and execute its operating and capital plans. The Commission monitors and makes adjustments to its capital structure through additional borrowings of long term debt which are used to finance capital projects.
The Commission considers its total capitalization to include all long term debt and total equity. The calculation is set out as follows:
2017 2016
Long term debt (current portion) $ 21,669 $ 23,195 Long term debt 203,299 215,794 Funded debt 224,968 238,989 Equity 147,630 123,670
Capital under management $ 372,598 $ 362,659
The Commission is a regulated utility and is subject to the regulations of the NSUARB. As part of this regulation, the Commission must obtain approval by the NSUARB for all borrowings. The Commission has obtained regulatory approval for all borrowings during the fiscal year. The Commission is not subject to financial borrowing covenants other than as outlined in Note 10.
9. Financial instruments and risk management
The Commission applies a three-tier hierarchy framework for disclosing fair value of financial instruments, based on whether the inputs into the various valuation techniques are observable or unobservable. Observable techniques reflect market data obtained from independent sources, while unobservable inputs reflect management assumptions. Changes in valuation techniques of financial instruments may result in transfers of assigned levels. The hierarchy of input is as follows:
Level I Quoted prices in active markets for identical assets or liabilities; Level II Inputs other than quoted prices included in Level I that are observable, either directly or indirectly; and Level III Inputs that are not based on observable market data.
The carrying values of current assets and current liabilities approximate their fair value due to the relatively short period to maturity of these financial instruments. Loans and receivables are carried at amortized cost. The fair value of variable rate long term debt is assumed to approximate its carrying value. Fair value has been estimated by discounting future cash flows at a rate offered for borrowings of similar maturities and credit quality at year end.
There were no transfers between classes of the fair value hierarchy during the year.
The Commission is exposed to risks as a result of holding financial instruments. Management considers and evaluates those risks on an on-going basis to ensure that the risks are appropriately managed. These potential risks include credit risk, interest risk, market risk and liquidity risk.
Credit riskCredit risk arises from the possibility that the Commission’s customers may experience financial difficulty and be unable to fulfill their obligations. The Commission’s maximum exposure to credit risk corresponds to the cash and customer charges and contractual accounts receivable. However, the Commission’s customers are numerous and diverse, which reduces the concentration of credit risk.
An analysis of the Commission’s receivables and continuity of the Commission’s provision for impairment losses on receivables is as follows:
2017 2016
Receivables Customer charges, contractual and unbilled $ 32,702 $ 33,754 Less: allowance for doubtful accounts (2,223) (1,941)
$ 30,479 $ 31,813
The credit quality of financial assets that are neither past due nor impaired are assessed with reference to historical information and includes the following considerations; new customers, existing customers and payment patterns / history.
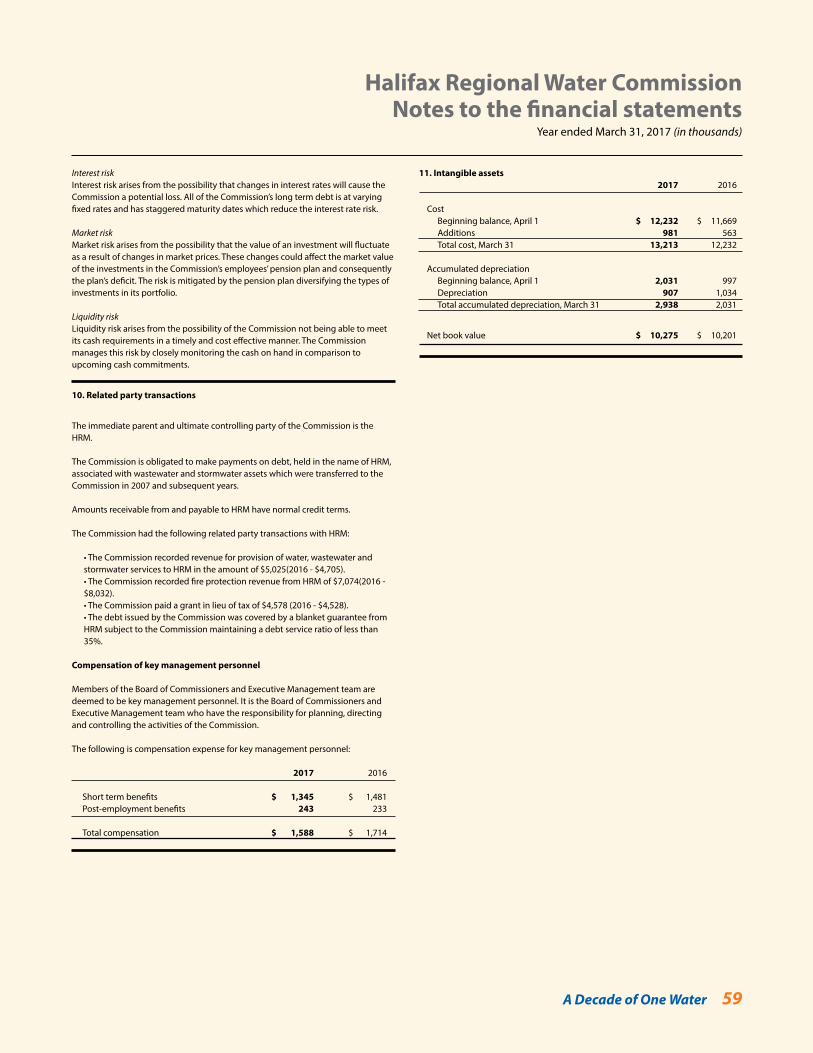
A Decade of One Water 59
Halifax Regional Water Commission Notes to the financial statements
Year ended March 31, 2017 (in thousands)
Interest riskInterest risk arises from the possibility that changes in interest rates will cause the Commission a potential loss. All of the Commission’s long term debt is at varying fixed rates and has staggered maturity dates which reduce the interest rate risk.
Market riskMarket risk arises from the possibility that the value of an investment will fluctuate as a result of changes in market prices. These changes could affect the market value of the investments in the Commission’s employees’ pension plan and consequently the plan’s deficit. The risk is mitigated by the pension plan diversifying the types of investments in its portfolio.
Liquidity riskLiquidity risk arises from the possibility of the Commission not being able to meet its cash requirements in a timely and cost effective manner. The Commission manages this risk by closely monitoring the cash on hand in comparison to upcoming cash commitments.
10. Related party transactions
The immediate parent and ultimate controlling party of the Commission is the HRM.
The Commission is obligated to make payments on debt, held in the name of HRM, associated with wastewater and stormwater assets which were transferred to the Commission in 2007 and subsequent years.
Amounts receivable from and payable to HRM have normal credit terms.
The Commission had the following related party transactions with HRM:
• The Commission recorded revenue for provision of water, wastewater and stormwater services to HRM in the amount of $5,025(2016 - $4,705). • The Commission recorded fire protection revenue from HRM of $7,074(2016 - $8,032). • The Commission paid a grant in lieu of tax of $4,578 (2016 - $4,528). • The debt issued by the Commission was covered by a blanket guarantee from HRM subject to the Commission maintaining a debt service ratio of less than 35%.
Compensation of key management personnel
Members of the Board of Commissioners and Executive Management team are deemed to be key management personnel. It is the Board of Commissioners and Executive Management team who have the responsibility for planning, directing and controlling the activities of the Commission.
The following is compensation expense for key management personnel:
2017 2016
Short term benefits $ 1,345 $ 1,481 Post-employment benefits 243 233
Total compensation $ 1,588 $ 1,714
11. Intangible assets 2017 2016
Cost Beginning balance, April 1 $ 12,232 $ 11,669 Additions 981 563 Total cost, March 31 13,213 12,232
Accumulated depreciation Beginning balance, April 1 2,031 997 Depreciation 907 1,034 Total accumulated depreciation, March 31 2,938 2,031
Net book value $ 10,275 $ 10,201
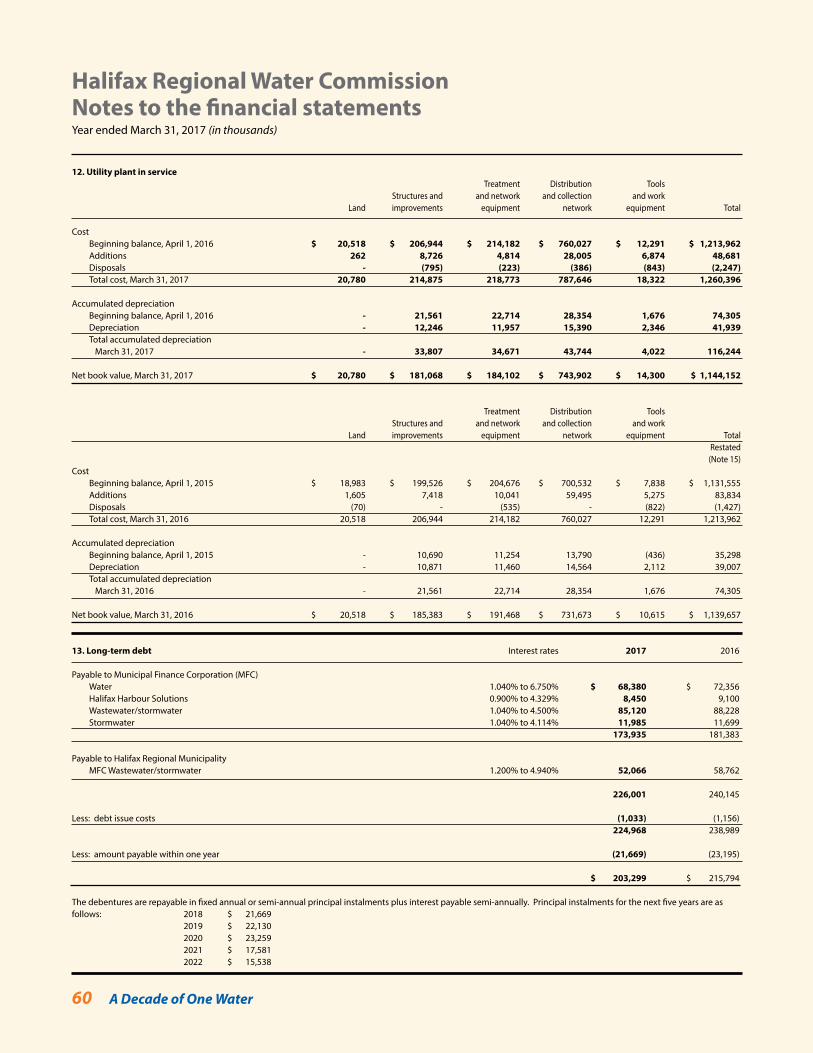
60 A Decade of One Water
Halifax Regional Water Commission Notes to the financial statementsYear ended March 31, 2017 (in thousands)
12. Utility plant in service Treatment Distribution Tools Structures and and network and collection and work Land improvements equipment network equipment Total
Cost Beginning balance, April 1, 2016 $ 20,518 $ 206,944 $ 214,182 $ 760,027 $ 12,291 $ 1,213,962 Additions 262 8,726 4,814 28,005 6,874 48,681 Disposals - (795) (223) (386) (843) (2,247) Total cost, March 31, 2017 20,780 214,875 218,773 787,646 18,322 1,260,396
Accumulated depreciation Beginning balance, April 1, 2016 - 21,561 22,714 28,354 1,676 74,305 Depreciation - 12,246 11,957 15,390 2,346 41,939 Total accumulated depreciation March 31, 2017 - 33,807 34,671 43,744 4,022 116,244
Net book value, March 31, 2017 $ 20,780 $ 181,068 $ 184,102 $ 743,902 $ 14,300 $ 1,144,152
Treatment Distribution Tools Structures and and network and collection and work Land improvements equipment network equipment Total Restated (Note 15)Cost Beginning balance, April 1, 2015 $ 18,983 $ 199,526 $ 204,676 $ 700,532 $ 7,838 $ 1,131,555 Additions 1,605 7,418 10,041 59,495 5,275 83,834 Disposals (70) - (535) - (822) (1,427) Total cost, March 31, 2016 20,518 206,944 214,182 760,027 12,291 1,213,962
Accumulated depreciation Beginning balance, April 1, 2015 - 10,690 11,254 13,790 (436) 35,298 Depreciation - 10,871 11,460 14,564 2,112 39,007 Total accumulated depreciation March 31, 2016 - 21,561 22,714 28,354 1,676 74,305
Net book value, March 31, 2016 $ 20,518 $ 185,383 $ 191,468 $ 731,673 $ 10,615 $ 1,139,657
13. Long-term debt Interest rates 2017 2016
Payable to Municipal Finance Corporation (MFC) Water 1.040% to 6.750% $ 68,380 $ 72,356 Halifax Harbour Solutions 0.900% to 4.329% 8,450 9,100 Wastewater/stormwater 1.040% to 4.500% 85,120 88,228 Stormwater 1.040% to 4.114% 11,985 11,699 173,935 181,383
Payable to Halifax Regional Municipality MFC Wastewater/stormwater 1.200% to 4.940% 52,066 58,762
226,001 240,145
Less: debt issue costs (1,033) (1,156) 224,968 238,989
Less: amount payable within one year (21,669) (23,195)
$ 203,299 $ 215,794
The debentures are repayable in fixed annual or semi-annual principal instalments plus interest payable semi-annually. Principal instalments for the next five years are as follows: 2018 $ 21,669 2019 $ 22,130 2020 $ 23,259 2021 $ 17,581 2022 $ 15,538
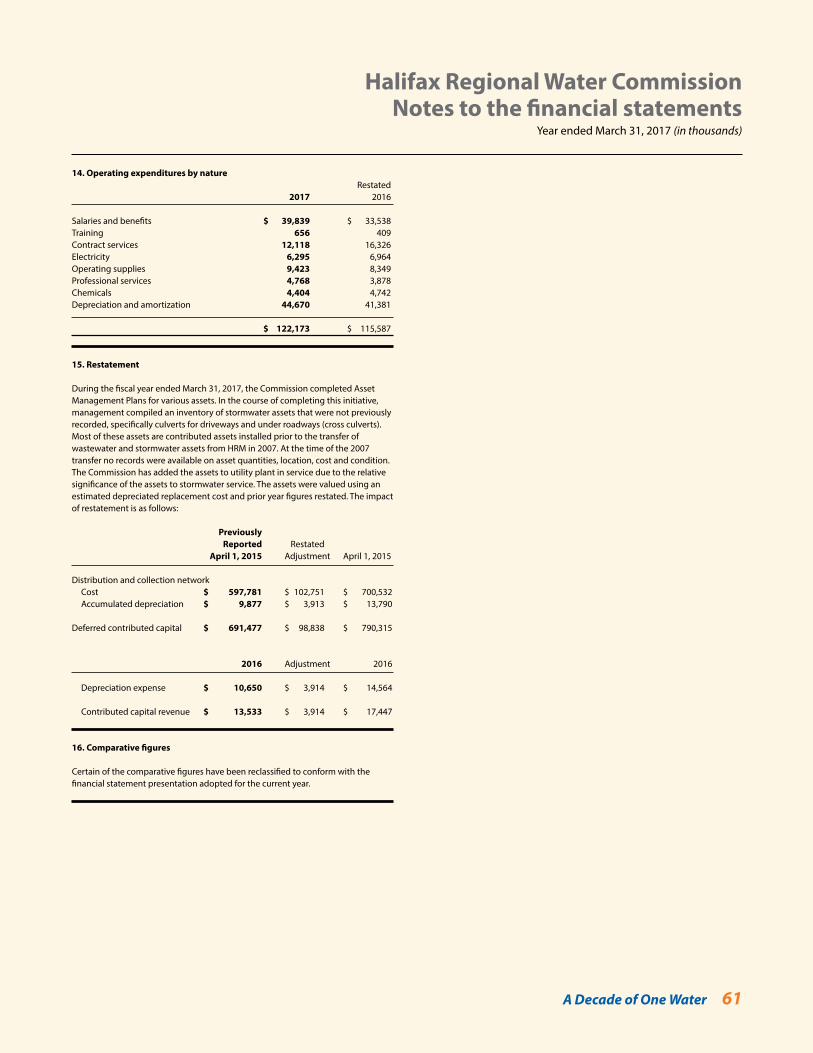
A Decade of One Water 61
Halifax Regional Water Commission Notes to the financial statements
Year ended March 31, 2017 (in thousands)
14. Operating expenditures by nature Restated 2017 2016
Salaries and benefits $ 39,839 $ 33,538Training 656 409Contract services 12,118 16,326Electricity 6,295 6,964Operating supplies 9,423 8,349Professional services 4,768 3,878Chemicals 4,404 4,742Depreciation and amortization 44,670 41,381
$ 122,173 $ 115,587
15. Restatement
During the fiscal year ended March 31, 2017, the Commission completed Asset Management Plans for various assets. In the course of completing this initiative, management compiled an inventory of stormwater assets that were not previously recorded, specifically culverts for driveways and under roadways (cross culverts). Most of these assets are contributed assets installed prior to the transfer of wastewater and stormwater assets from HRM in 2007. At the time of the 2007 transfer no records were available on asset quantities, location, cost and condition. The Commission has added the assets to utility plant in service due to the relative significance of the assets to stormwater service. The assets were valued using an estimated depreciated replacement cost and prior year figures restated. The impact of restatement is as follows:
Previously Reported Restated April 1, 2015 Adjustment April 1, 2015
Distribution and collection network Cost $ 597,781 $ 102,751 $ 700,532 Accumulated depreciation $ 9,877 $ 3,913 $ 13,790
Deferred contributed capital $ 691,477 $ 98,838 $ 790,315
2016 Adjustment 2016
Depreciation expense $ 10,650 $ 3,914 $ 14,564
Contributed capital revenue $ 13,533 $ 3,914 $ 17,447
16. Comparative figures
Certain of the comparative figures have been reclassified to conform with the financial statement presentation adopted for the current year.
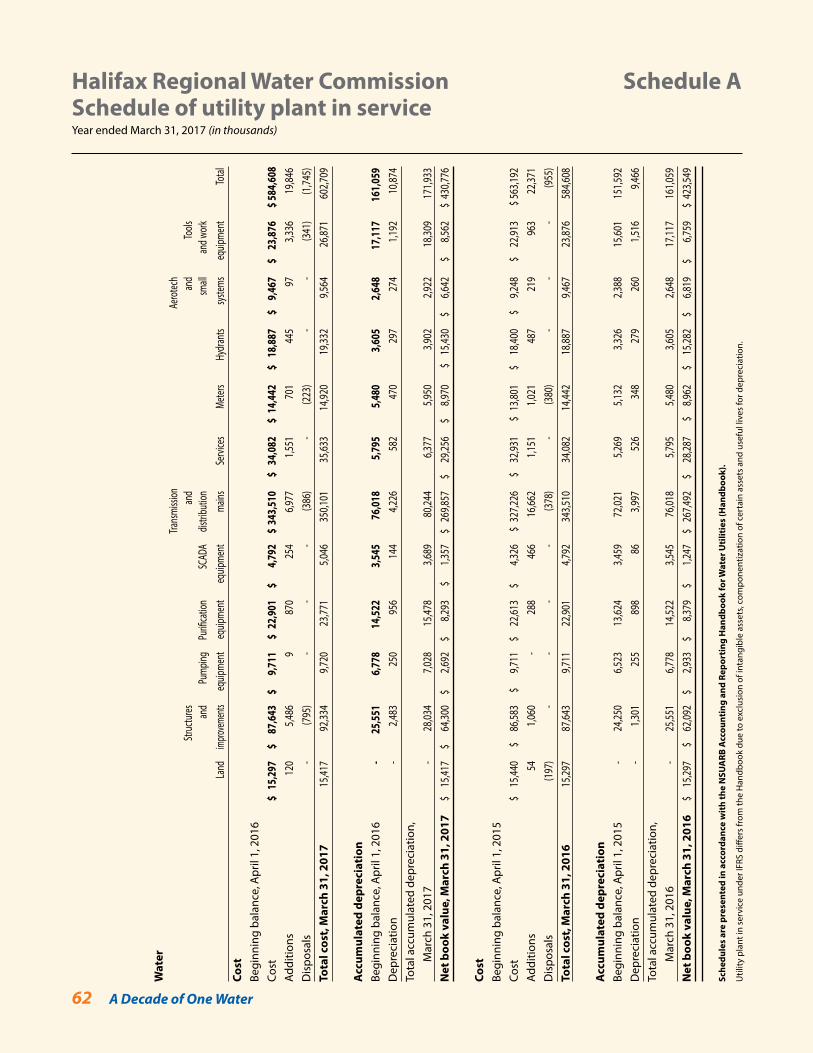
62 A Decade of One Water
Halifax Regional Water Commission Schedule ASchedule of utility plant in serviceYear ended March 31, 2017 (in thousands)
Wat
er
Tra
nsmi
ssion
Aero
tech
Str
uctu
res
an
d
and
To
ols
and
Pu
mping
Pu
rifica
tion
SC
ADA
distr
ibutio
n
small
and w
ork
La
nd
impro
vemen
ts e
quipm
ent
equip
ment
e
quipm
ent
ma
ins
Se
rvice
s
Meter
s
Hydr
ants
syste
ms
equ
ipmen
t
Total
Cost
Begi
nnin
g ba
lanc
e, A
pril
1, 2
016
Cost
$
15,2
97
$ 87
,643
$
9,71
1 $
22,
901
$ 4,
792
$ 34
3,51
0 $
34,
082
$ 14
,442
$
18,8
87
$ 9
,467
$
23,8
76
$ 584
,608
Addi
tions
120
5,4
86
9
87
0
254
6,9
77
1,5
51
70
1
445
97
3,336
19,84
6D
ispo
sals
-
(795
)
-
-
-
(386
)
-
(223
)
-
-
(341
)
(1,74
5)To
tal c
ost,
Mar
ch 3
1, 2
017
15,41
7
92,33
4
9,720
23,77
1
5,04
6
350,1
01
35
,633
14
,920
19
,332
9,5
64
26
,871
60
2,709
Acc
umul
ated
dep
reci
atio
nBe
ginn
ing
bala
nce,
Apr
il 1,
201
6
-
25
,551
6,77
8
14,5
22
3,
545
76
,018
5,79
5
5,48
0
3,60
5
2,64
8
17,1
17
161
,059
Dep
reci
atio
n
-
2,4
83
25
0
956
14
4
4,226
582
47
0
297
27
4
1,192
10,87
4To
tal a
ccum
ulat
ed d
epre
ciat
ion,
M
arch
31,
201
7
-
28
,034
7,0
28
15
,478
3,
689
80
,244
6,
377
5,9
50
3,9
02
2,
922
18
,309
17
1,933
Net
boo
k va
lue,
Mar
ch 3
1, 2
017
$
15,41
7 $
64,30
0 $
2,692
$
8,29
3 $
1,3
57
$ 26
9,857
$
29,25
6 $
8,97
0 $
15,4
30
$ 6,6
42
$ 8,
562
$ 43
0,776
Cost
Begi
nnin
g ba
lanc
e, A
pril
1, 2
015
Cost
$
15,44
0 $
86
,583
$ 9,
711
$ 22
,613
$ 4,3
26
$ 32
7,226
$
32
,931
$ 1
3,801
$
18,40
0 $
9,2
48
$
22,91
3 $
563,1
92Ad
ditio
ns
54
1,060
-
288
46
6
16,66
2
1,151
1,021
487
21
9
963
22
,371
Dis
posa
ls
(1
97)
-
-
-
-
(3
78)
-
(3
80)
-
-
-
(9
55)
Tota
l cos
t, M
arch
31,
201
6
15
,297
87
,643
9,7
11
22
,901
4,
792
34
3,510
34,08
2
14,44
2
18,88
7
9,467
23,87
6
584,6
08
Acc
umul
ated
dep
reci
atio
nBe
ginn
ing
bala
nce,
Apr
il 1,
201
5
-
24
,250
6,5
23
13
,624
3,4
59
72
,021
5,2
69
5,1
32
3,3
26
2,3
88
15
,601
15
1,592
Dep
reci
atio
n
-
1,3
01
25
5
898
86
3,99
7
526
34
8
279
26
0
1,516
9,46
6To
tal a
ccum
ulat
ed d
epre
ciat
ion,
M
arch
31,
201
6
-
25
,551
6,7
78
14
,522
3,5
45
76
,018
5,7
95
5,
480
3,6
05
2,
648
17
,117
16
1,059
Net
boo
k va
lue,
Mar
ch 3
1, 2
016
$
15,29
7 $
62,09
2 $
2,933
$
8,379
$
1,24
7 $
267,4
92
$ 28
,287
$ 8,
962
$ 15
,282
$ 6,8
19
$ 6,
759
$ 42
3,549
Sche
dule
s ar
e pr
esen
ted
in a
ccor
danc
e w
ith
the
NSU
ARB
Acc
ount
ing
and
Repo
rtin
g H
andb
ook
for W
ater
Uti
litie
s (H
andb
ook)
.
Util
ity p
lant
in s
ervi
ce u
nder
IFRS
diff
ers
from
the
Han
dboo
k du
e to
exc
lusi
on o
f int
angi
ble
asse
ts, c
ompo
nent
izat
ion
of c
erta
in a
sset
s an
d us
eful
live
s fo
r dep
reci
atio
n.
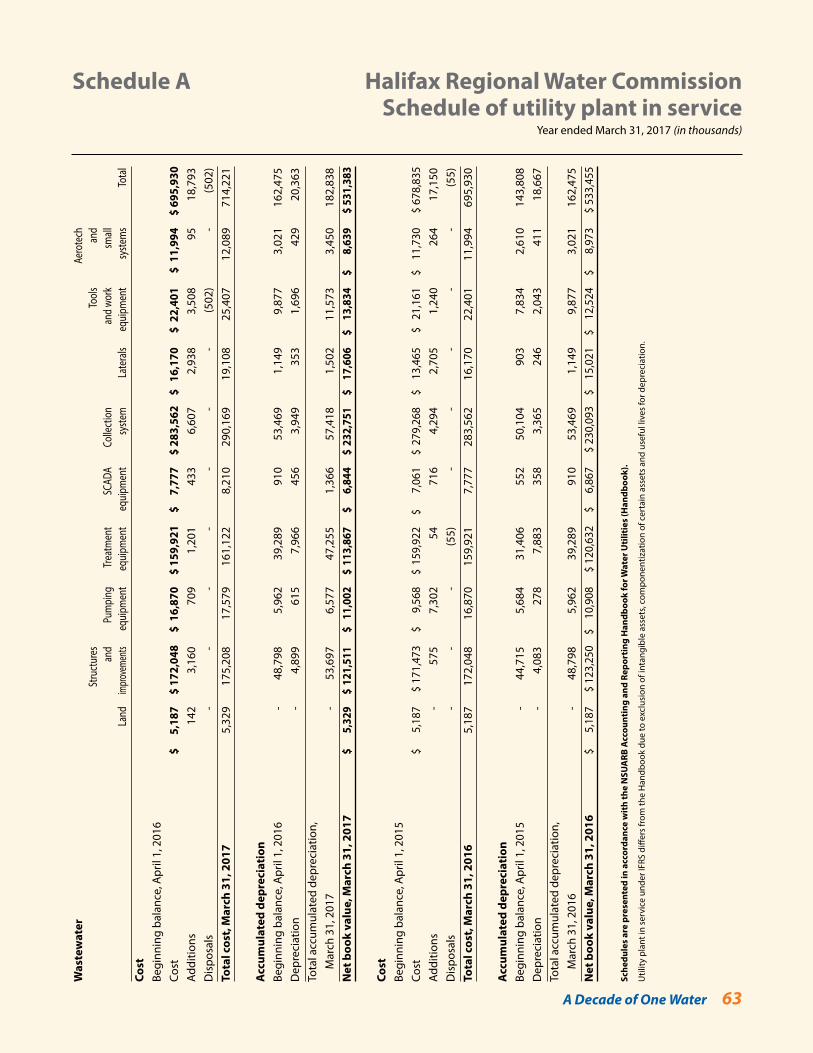
A Decade of One Water 63
Was
tew
ater
Aero
tech
St
ruct
ures
Tool
s
and
an
d
Pu
mpi
ng
Tr
eatm
ent
SC
ADA
Colle
ctio
n
an
d wo
rk
sm
all
Land
im
prove
ments
e
quip
men
t e
quip
men
t e
quip
men
t
syste
m
La
tera
ls
equ
ipm
ent
sy
stem
s
Tota
lCo
stBe
ginn
ing
bala
nce,
Apr
il 1,
201
6Co
st
$
5,18
7
$ 17
2,04
8 $
16,
870
$
159,
921
$
7,77
7
$ 28
3,56
2
$ 1
6,17
0 $
22,
401
$ 1
1,99
4
$ 69
5,93
0Ad
ditio
ns
14
2
3,1
60
70
9
1,
201
433
6,60
7
2,
938
3,50
8
95
18,7
93D
ispo
sals
-
-
-
-
-
-
-
(502
)
-
(502
)To
tal c
ost,
Mar
ch 3
1, 2
017
5,32
9
17
5,20
8
17
,579
161,
122
8,21
0
29
0,16
9
19
,108
25,4
07
12
,089
714,
221
Acc
umul
ated
dep
reci
atio
nBe
ginn
ing
bala
nce,
Apr
il 1,
201
6
-
48
,798
5,96
2
39
,289
910
53,4
69
1,
149
9
,877
3,02
1
16
2,47
5D
epre
ciat
ion
-
4,89
9
61
5
7,
966
4
56
3,
949
353
1,69
6
42
9
20
,363
Tota
l acc
umul
ated
dep
reci
atio
n,
Mar
ch 3
1, 2
017
-
53,6
97
6,
577
4
7,25
5
1,
366
5
7,41
8
1,
502
11,5
73
3,
450
182,
838
Net
boo
k va
lue,
Mar
ch 3
1, 2
017
$
5,
329
$
121,
511
$ 1
1,00
2
$ 11
3,86
7 $
6,
844
$
232,
751
$
17,
606
$
13,
834
$
8,
639
$ 5
31,3
83
Cost
Begi
nnin
g ba
lanc
e, A
pril
1, 2
015
Cost
$
5,
187
$ 1
71,4
73
$
9,56
8
$ 1
59,9
22
$
7,06
1
$ 2
79,2
68
$ 1
3,46
5 $
21
,161
$
11
,730
$
678
,835
Addi
tions
-
575
7,30
2
54
716
4
,294
2,7
05
1
,240
264
17,1
50D
ispo
sals
-
-
-
(5
5)
-
-
-
-
-
(55)
Tota
l cos
t, M
arch
31,
201
6
5,
187
17
2,04
8
16
,870
159,
921
7,77
7
28
3,56
2
16
,170
22,4
01
1
1,99
4
695,
930
Acc
umul
ated
dep
reci
atio
nBe
ginn
ing
bala
nce,
Apr
il 1,
201
5
-
44
,715
5,68
4
31
,406
552
50,1
04
90
3
7,
834
2,61
0
14
3,80
8D
epre
ciat
ion
-
4,08
3
27
8
7,8
83
35
8
3,
365
246
2,04
3
41
1
18
,667
Tota
l acc
umul
ated
dep
reci
atio
n,
Mar
ch 3
1, 2
016
-
48,7
98
5,
962
3
9,28
9
91
0
53,
469
1,14
9
9,
877
3
,021
162,
475
Net
boo
k va
lue,
Mar
ch 3
1, 2
016
$
5,1
87
$ 1
23,2
50
$
10,9
08
$ 1
20,6
32
$
6,86
7 $
230
,093
$
15
,021
$
12
,524
$
8,
973
$ 5
33,4
55
Sche
dule
s ar
e pr
esen
ted
in a
ccor
danc
e w
ith
the
NSU
ARB
Acc
ount
ing
and
Repo
rtin
g H
andb
ook
for W
ater
Uti
litie
s (H
andb
ook)
.
Util
ity p
lant
in s
ervi
ce u
nder
IFRS
diff
ers
from
the
Han
dboo
k du
e to
exc
lusi
on o
f int
angi
ble
asse
ts, c
ompo
nent
izat
ion
of c
erta
in a
sset
s an
d us
eful
live
s fo
r dep
reci
atio
n.
Schedule A Halifax Regional Water Commission Schedule of utility plant in service
Year ended March 31, 2017 (in thousands)
Wat
er
Tra
nsmi
ssion
Aero
tech
Str
uctu
res
an
d
and
To
ols
and
Pu
mping
Pu
rifica
tion
SC
ADA
distr
ibutio
n
small
and w
ork
La
nd
impro
vemen
ts e
quipm
ent
equip
ment
e
quipm
ent
ma
ins
Se
rvice
s
Meter
s
Hydr
ants
syste
ms
equ
ipmen
t
Total
Cost
Begi
nnin
g ba
lanc
e, A
pril
1, 2
016
Cost
$
15,2
97
$ 87
,643
$
9,71
1 $
22,
901
$ 4,
792
$ 34
3,51
0 $
34,
082
$ 14
,442
$
18,8
87
$ 9
,467
$
23,8
76
$ 584
,608
Addi
tions
120
5,4
86
9
87
0
254
6,9
77
1,5
51
70
1
445
97
3,336
19,84
6D
ispo
sals
-
(795
)
-
-
-
(386
)
-
(223
)
-
-
(341
)
(1,74
5)To
tal c
ost,
Mar
ch 3
1, 2
017
15,41
7
92,33
4
9,720
23,77
1
5,04
6
350,1
01
35
,633
14
,920
19
,332
9,5
64
26
,871
60
2,709
Acc
umul
ated
dep
reci
atio
nBe
ginn
ing
bala
nce,
Apr
il 1,
201
6
-
25
,551
6,77
8
14,5
22
3,
545
76
,018
5,79
5
5,48
0
3,60
5
2,64
8
17,1
17
161
,059
Dep
reci
atio
n
-
2,4
83
25
0
956
14
4
4,226
582
47
0
297
27
4
1,192
10,87
4To
tal a
ccum
ulat
ed d
epre
ciat
ion,
M
arch
31,
201
7
-
28
,034
7,0
28
15
,478
3,
689
80
,244
6,
377
5,9
50
3,9
02
2,
922
18
,309
17
1,933
Net
boo
k va
lue,
Mar
ch 3
1, 2
017
$
15,41
7 $
64,30
0 $
2,692
$
8,29
3 $
1,3
57
$ 26
9,857
$
29,25
6 $
8,97
0 $
15,4
30
$ 6,6
42
$ 8,
562
$ 43
0,776
Cost
Begi
nnin
g ba
lanc
e, A
pril
1, 2
015
Cost
$
15,44
0 $
86
,583
$ 9,
711
$ 22
,613
$ 4,3
26
$ 32
7,226
$
32
,931
$ 1
3,801
$
18,40
0 $
9,2
48
$
22,91
3 $
563,1
92Ad
ditio
ns
54
1,060
-
288
46
6
16,66
2
1,151
1,021
487
21
9
963
22
,371
Dis
posa
ls
(1
97)
-
-
-
-
(3
78)
-
(3
80)
-
-
-
(9
55)
Tota
l cos
t, M
arch
31,
201
6
15
,297
87
,643
9,7
11
22
,901
4,
792
34
3,510
34,08
2
14,44
2
18,88
7
9,467
23,87
6
584,6
08
Acc
umul
ated
dep
reci
atio
nBe
ginn
ing
bala
nce,
Apr
il 1,
201
5
-
24
,250
6,5
23
13
,624
3,4
59
72
,021
5,2
69
5,1
32
3,3
26
2,3
88
15
,601
15
1,592
Dep
reci
atio
n
-
1,3
01
25
5
898
86
3,99
7
526
34
8
279
26
0
1,516
9,46
6To
tal a
ccum
ulat
ed d
epre
ciat
ion,
M
arch
31,
201
6
-
25
,551
6,7
78
14
,522
3,5
45
76
,018
5,7
95
5,
480
3,6
05
2,
648
17
,117
16
1,059
Net
boo
k va
lue,
Mar
ch 3
1, 2
016
$
15,29
7 $
62,09
2 $
2,933
$
8,379
$
1,24
7 $
267,4
92
$ 28
,287
$ 8,
962
$ 15
,282
$ 6,8
19
$ 6,
759
$ 42
3,549
Sche
dule
s ar
e pr
esen
ted
in a
ccor
danc
e w
ith
the
NSU
ARB
Acc
ount
ing
and
Repo
rtin
g H
andb
ook
for W
ater
Uti
litie
s (H
andb
ook)
.
Util
ity p
lant
in s
ervi
ce u
nder
IFRS
diff
ers
from
the
Han
dboo
k du
e to
exc
lusi
on o
f int
angi
ble
asse
ts, c
ompo
nent
izat
ion
of c
erta
in a
sset
s an
d us
eful
live
s fo
r dep
reci
atio
n.
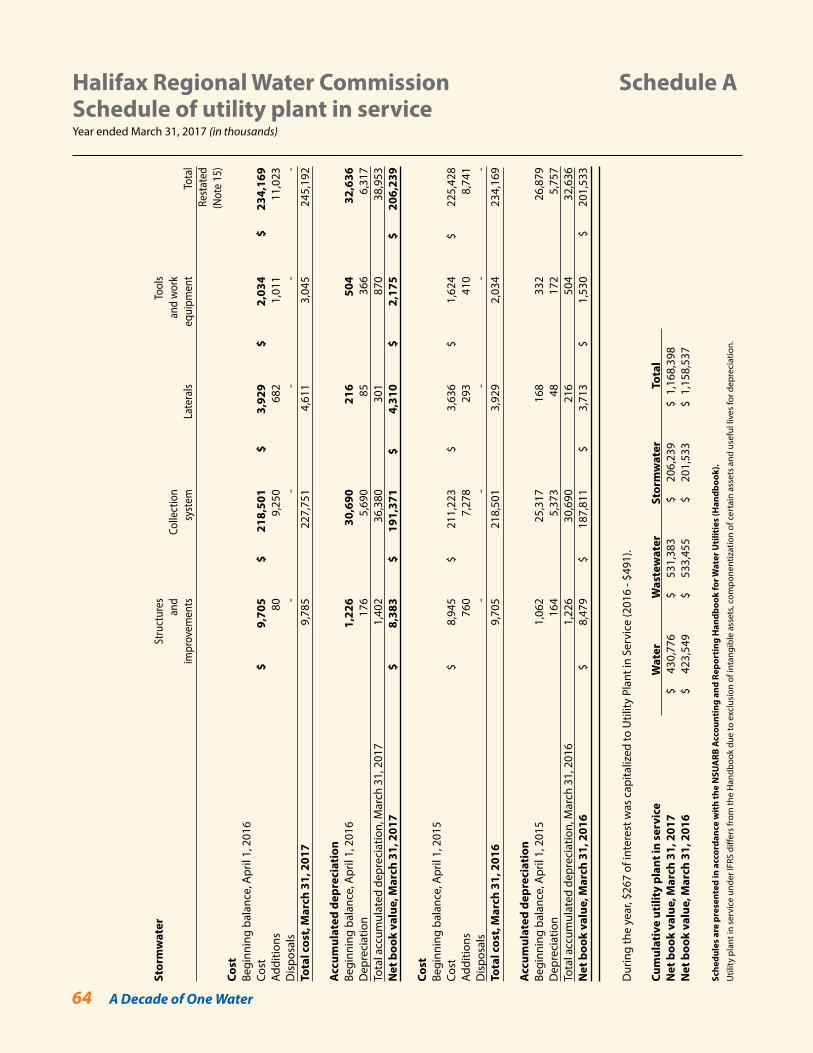
64 A Decade of One Water
Halifax Regional Water Commission Schedule A Schedule of utility plant in serviceYear ended March 31, 2017 (in thousands)
Stor
mw
ater
Stru
ctur
es
To
ols
and
Colle
ctio
n
and
wor
k
im
prov
emen
ts
sy
stem
Late
rals
equi
pmen
t
Tota
l
Re
stat
ed
(N
ote
15)
Cost
Begi
nnin
g ba
lanc
e, A
pril
1, 2
016
Cost
$
9,
705
$
218
,501
$
3,
929
$
2,
034
$
234,
169
Addi
tions
80
9,
250
6
82
1,
011
1
1,02
3D
ispo
sals
-
-
-
-
-To
tal c
ost,
Mar
ch 3
1, 2
017
9,78
5
22
7,75
1
4,
611
3,04
5
24
5,19
2
Acc
umul
ated
dep
reci
atio
nBe
ginn
ing
bala
nce,
Apr
il 1,
201
6
1,
226
30,6
90
21
6
50
4
32
,636
Dep
reci
atio
n
17
6
5,
690
85
3
66
6,
317
Tota
l acc
umul
ated
dep
reci
atio
n, M
arch
31,
201
7
1,
402
36,3
80
3
01
8
70
38
,953
Net
boo
k va
lue,
Mar
ch 3
1, 2
017
$
8,
383
$
19
1,37
1
$ 4
,310
$
2,
175
$
20
6,23
9
Cost
Begi
nnin
g ba
lanc
e, A
pril
1, 2
015
Cost
$
8,9
45
$ 2
11,2
23
$
3,63
6
$
1,62
4
$
225,
428
Addi
tions
760
7,27
8
293
410
8
,741
Dis
posa
ls
-
-
-
-
-
Tota
l cos
t, M
arch
31,
201
6
9,
705
218,
501
3,92
9
2,
034
2
34,1
69
Acc
umul
ated
dep
reci
atio
nBe
ginn
ing
bala
nce,
Apr
il 1,
201
5
1,
062
25,3
17
1
68
33
2
26
,879
Dep
reci
atio
n
164
5,37
3
48
172
5
,757
Tota
l acc
umul
ated
dep
reci
atio
n, M
arch
31,
201
6
1,
226
30,6
90
21
6
50
4
32,
636
Net
boo
k va
lue,
Mar
ch 3
1, 2
016
$
8,
479
$
187,
811
$
3,7
13
$
1,53
0 $
20
1,53
3
Dur
ing
the
year
, $26
7 of
inte
rest
was
cap
italiz
ed to
Util
ity P
lant
in S
ervi
ce (2
016
- $49
1).
Cum
ulat
ive
utili
ty p
lant
in s
ervi
ce
Wat
er
W
aste
wat
er
Sto
rmw
ater
T
otal
Net
boo
k va
lue,
Mar
ch 3
1, 2
017
$
43
0,77
6 $
53
1,38
3 $
20
6,23
9 $
1,16
8,39
8N
et b
ook
valu
e, M
arch
31,
201
6
$
423,
549
$
53
3,45
5 $
20
1,53
3
$ 1
,158
,537
Sche
dule
s ar
e pr
esen
ted
in a
ccor
danc
e w
ith
the
NSU
ARB
Acc
ount
ing
and
Repo
rtin
g H
andb
ook
for W
ater
Uti
litie
s (H
andb
ook)
.
Util
ity p
lant
in s
ervi
ce u
nder
IFRS
diff
ers
from
the
Han
dboo
k du
e to
exc
lusi
on o
f int
angi
ble
asse
ts, c
ompo
nent
izat
ion
of c
erta
in a
sset
s an
d us
eful
live
s fo
r dep
reci
atio
n.
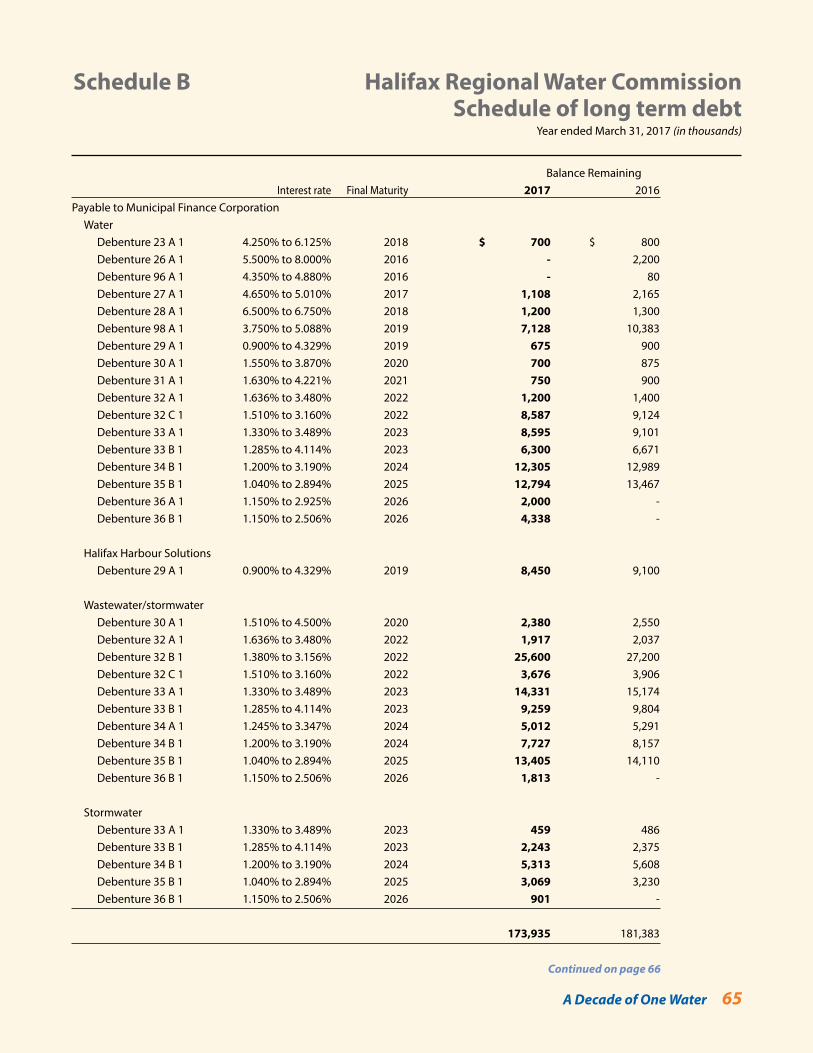
A Decade of One Water 65
Schedule B Halifax Regional Water CommissionSchedule of long term debt
Year ended March 31, 2017 (in thousands)
Balance Remaining Interest rate Final Maturity 2017 2016Payable to Municipal Finance Corporation Water Debenture 23 A 1 4.250% to 6.125% 2018 $ 700 $ 800 Debenture 26 A 1 5.500% to 8.000% 2016 - 2,200 Debenture 96 A 1 4.350% to 4.880% 2016 - 80 Debenture 27 A 1 4.650% to 5.010% 2017 1,108 2,165 Debenture 28 A 1 6.500% to 6.750% 2018 1,200 1,300 Debenture 98 A 1 3.750% to 5.088% 2019 7,128 10,383 Debenture 29 A 1 0.900% to 4.329% 2019 675 900 Debenture 30 A 1 1.550% to 3.870% 2020 700 875 Debenture 31 A 1 1.630% to 4.221% 2021 750 900 Debenture 32 A 1 1.636% to 3.480% 2022 1,200 1,400 Debenture 32 C 1 1.510% to 3.160% 2022 8,587 9,124 Debenture 33 A 1 1.330% to 3.489% 2023 8,595 9,101 Debenture 33 B 1 1.285% to 4.114% 2023 6,300 6,671 Debenture 34 B 1 1.200% to 3.190% 2024 12,305 12,989 Debenture 35 B 1 1.040% to 2.894% 2025 12,794 13,467 Debenture 36 A 1 1.150% to 2.925% 2026 2,000 - Debenture 36 B 1 1.150% to 2.506% 2026 4,338 -
Halifax Harbour Solutions Debenture 29 A 1 0.900% to 4.329% 2019 8,450 9,100
Wastewater/stormwater Debenture 30 A 1 1.510% to 4.500% 2020 2,380 2,550 Debenture 32 A 1 1.636% to 3.480% 2022 1,917 2,037 Debenture 32 B 1 1.380% to 3.156% 2022 25,600 27,200 Debenture 32 C 1 1.510% to 3.160% 2022 3,676 3,906 Debenture 33 A 1 1.330% to 3.489% 2023 14,331 15,174 Debenture 33 B 1 1.285% to 4.114% 2023 9,259 9,804 Debenture 34 A 1 1.245% to 3.347% 2024 5,012 5,291 Debenture 34 B 1 1.200% to 3.190% 2024 7,727 8,157 Debenture 35 B 1 1.040% to 2.894% 2025 13,405 14,110 Debenture 36 B 1 1.150% to 2.506% 2026 1,813 -
Stormwater Debenture 33 A 1 1.330% to 3.489% 2023 459 486 Debenture 33 B 1 1.285% to 4.114% 2023 2,243 2,375 Debenture 34 B 1 1.200% to 3.190% 2024 5,313 5,608 Debenture 35 B 1 1.040% to 2.894% 2025 3,069 3,230 Debenture 36 B 1 1.150% to 2.506% 2026 901 -
173,935 181,383
Continued on page 66
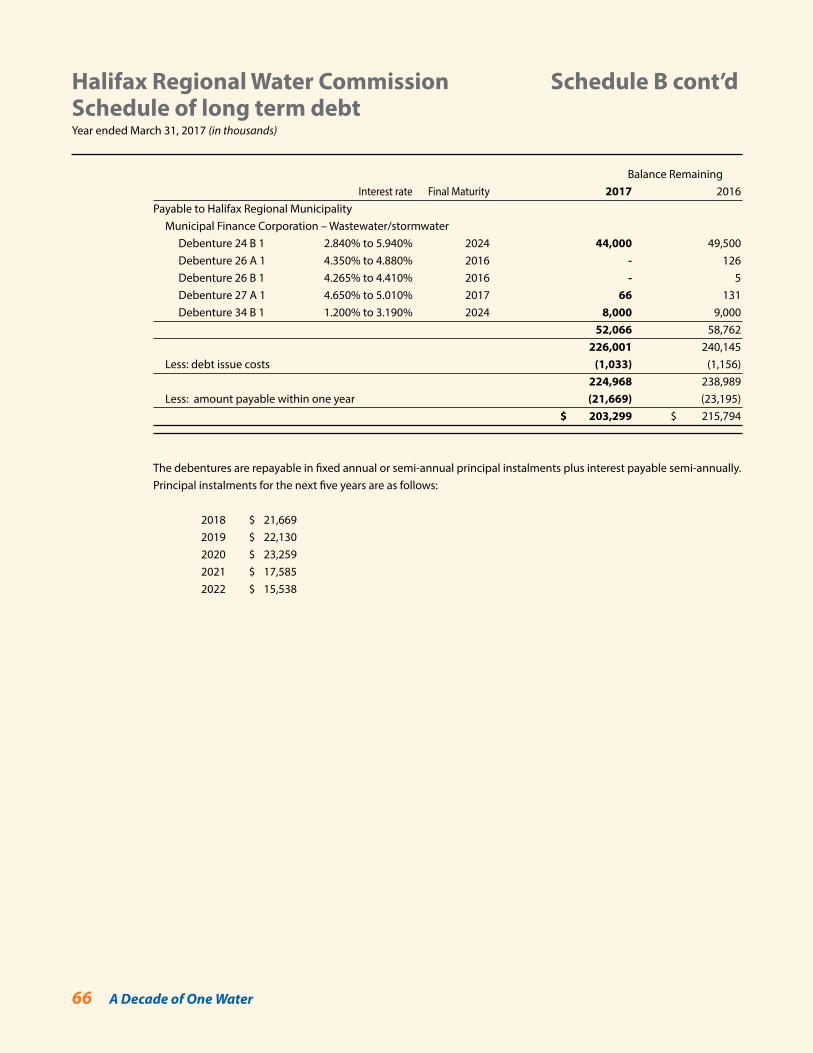
66 A Decade of One Water
Halifax Regional Water Commission Schedule B cont’dSchedule of long term debtYear ended March 31, 2017 (in thousands)
Balance Remaining Interest rate Final Maturity 2017 2016Payable to Halifax Regional Municipality Municipal Finance Corporation – Wastewater/stormwater Debenture 24 B 1 2.840% to 5.940% 2024 44,000 49,500 Debenture 26 A 1 4.350% to 4.880% 2016 - 126 Debenture 26 B 1 4.265% to 4.410% 2016 - 5 Debenture 27 A 1 4.650% to 5.010% 2017 66 131 Debenture 34 B 1 1.200% to 3.190% 2024 8,000 9,000 52,066 58,762 226,001 240,145 Less: debt issue costs (1,033) (1,156) 224,968 238,989 Less: amount payable within one year (21,669) (23,195) $ 203,299 $ 215,794
The debentures are repayable in fixed annual or semi-annual principal instalments plus interest payable semi-annually. Principal instalments for the next five years are as follows:
2018 $ 21,669 2019 $ 22,130 2020 $ 23,259 2021 $ 17,585 2022 $ 15,538
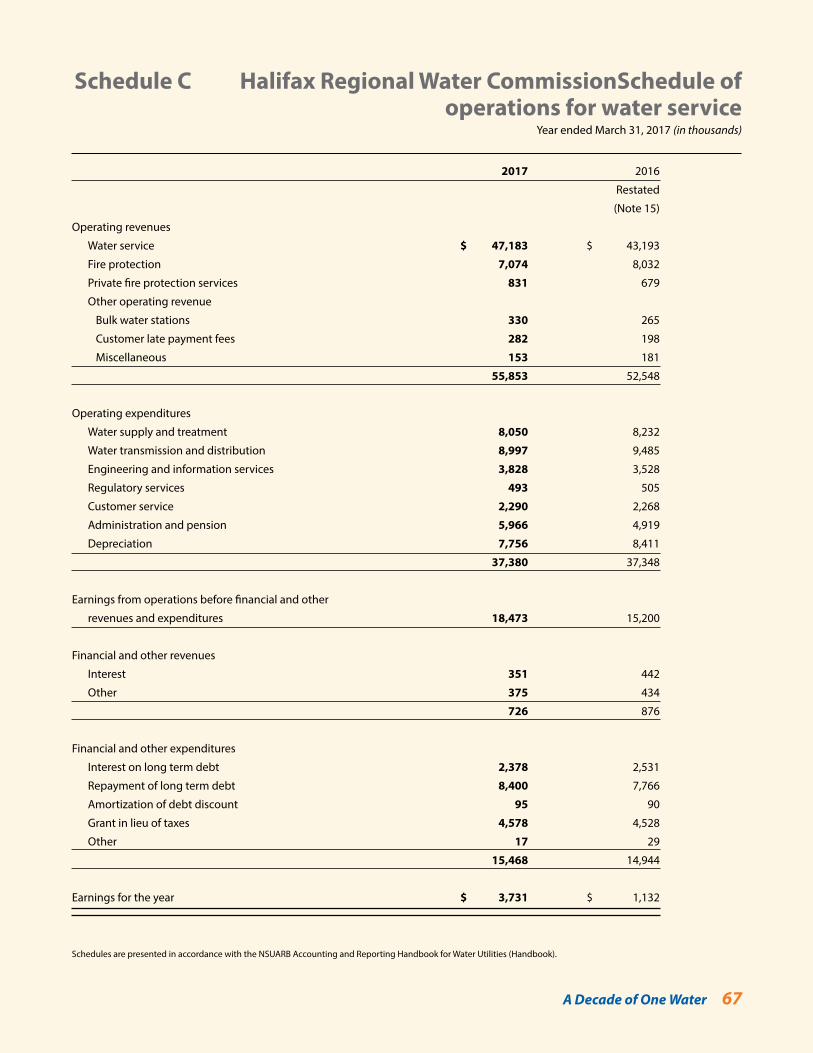
A Decade of One Water 67
Schedule C Halifax Regional Water CommissionSchedule of operations for water service
Year ended March 31, 2017 (in thousands)
2017 2016
Restated
(Note 15)
Operating revenues
Water service $ 47,183 $ 43,193
Fire protection 7,074 8,032
Private fire protection services 831 679
Other operating revenue
Bulk water stations 330 265
Customer late payment fees 282 198
Miscellaneous 153 181
55,853 52,548
Operating expenditures
Water supply and treatment 8,050 8,232
Water transmission and distribution 8,997 9,485
Engineering and information services 3,828 3,528
Regulatory services 493 505
Customer service 2,290 2,268
Administration and pension 5,966 4,919
Depreciation 7,756 8,411
37,380 37,348
Earnings from operations before financial and other
revenues and expenditures 18,473 15,200
Financial and other revenues
Interest 351 442
Other 375 434
726 876
Financial and other expenditures
Interest on long term debt 2,378 2,531
Repayment of long term debt 8,400 7,766
Amortization of debt discount 95 90
Grant in lieu of taxes 4,578 4,528
Other 17 29
15,468 14,944
Earnings for the year $ 3,731 $ 1,132
Schedules are presented in accordance with the NSUARB Accounting and Reporting Handbook for Water Utilities (Handbook).
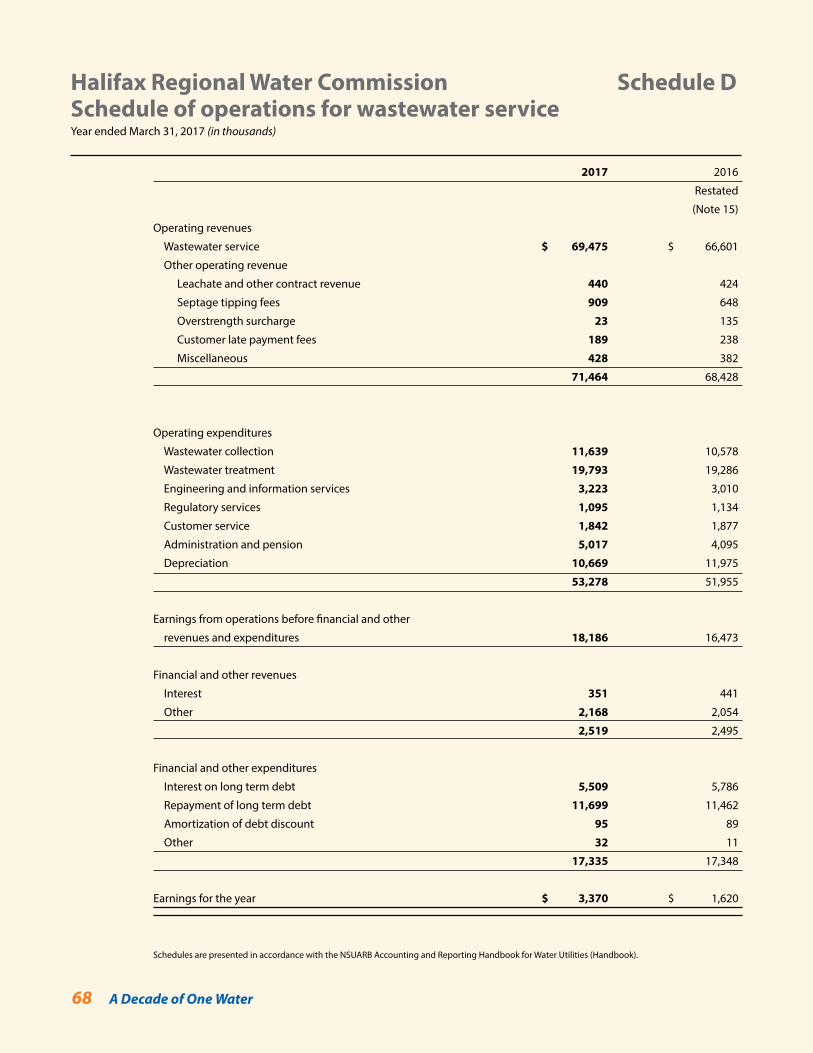
68 A Decade of One Water
Halifax Regional Water Commission Schedule DSchedule of operations for wastewater serviceYear ended March 31, 2017 (in thousands)
2017 2016
Restated
(Note 15)
Operating revenues
Wastewater service $ 69,475 $ 66,601
Other operating revenue
Leachate and other contract revenue 440 424
Septage tipping fees 909 648
Overstrength surcharge 23 135
Customer late payment fees 189 238
Miscellaneous 428 382
71,464 68,428
Operating expenditures
Wastewater collection 11,639 10,578
Wastewater treatment 19,793 19,286
Engineering and information services 3,223 3,010
Regulatory services 1,095 1,134
Customer service 1,842 1,877
Administration and pension 5,017 4,095
Depreciation 10,669 11,975
53,278 51,955
Earnings from operations before financial and other
revenues and expenditures 18,186 16,473
Financial and other revenues
Interest 351 441
Other 2,168 2,054
2,519 2,495
Financial and other expenditures
Interest on long term debt 5,509 5,786
Repayment of long term debt 11,699 11,462
Amortization of debt discount 95 89
Other 32 11
17,335 17,348
Earnings for the year $ 3,370 $ 1,620
Schedules are presented in accordance with the NSUARB Accounting and Reporting Handbook for Water Utilities (Handbook).
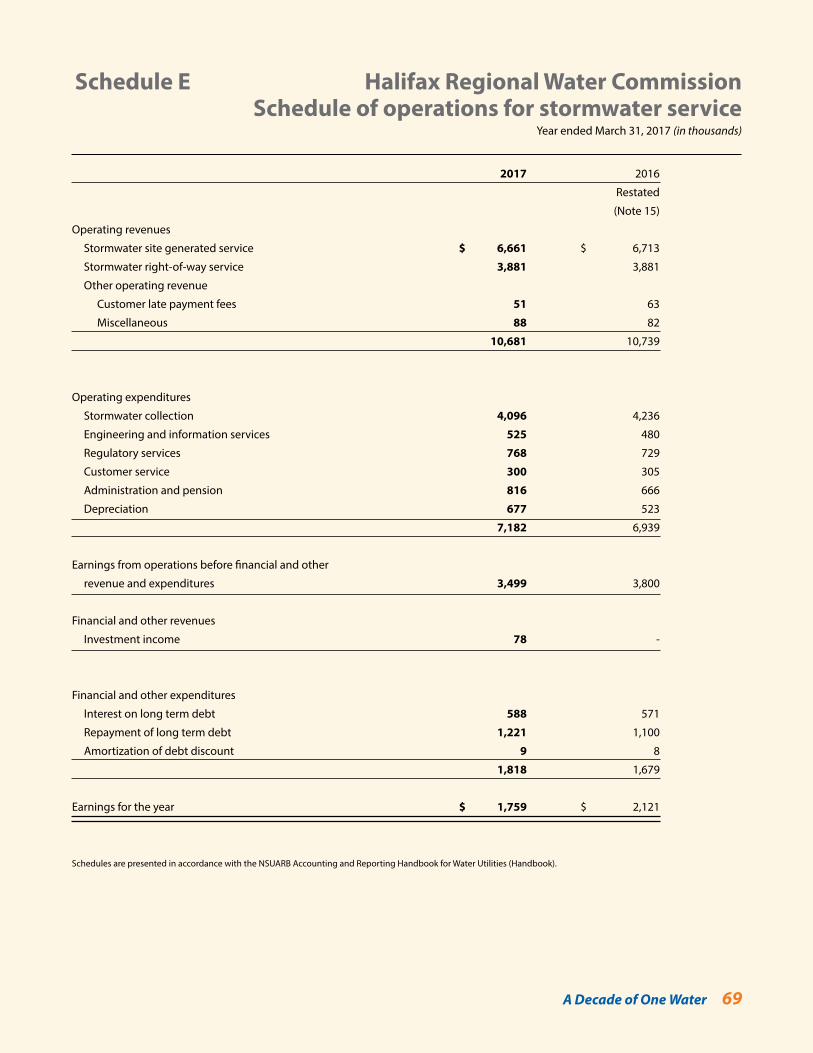
A Decade of One Water 69
2017 2016
Restated
(Note 15)
Operating revenues
Stormwater site generated service $ 6,661 $ 6,713
Stormwater right-of-way service 3,881 3,881
Other operating revenue
Customer late payment fees 51 63
Miscellaneous 88 82
10,681 10,739
Operating expenditures
Stormwater collection 4,096 4,236
Engineering and information services 525 480
Regulatory services 768 729
Customer service 300 305
Administration and pension 816 666
Depreciation 677 523
7,182 6,939
Earnings from operations before financial and other
revenue and expenditures 3,499 3,800
Financial and other revenues
Investment income 78 -
Financial and other expenditures
Interest on long term debt 588 571
Repayment of long term debt 1,221 1,100
Amortization of debt discount 9 8
1,818 1,679
Earnings for the year $ 1,759 $ 2,121
Schedules are presented in accordance with the NSUARB Accounting and Reporting Handbook for Water Utilities (Handbook).
Schedule E Halifax Regional Water CommissionSchedule of operations for stormwater service
Year ended March 31, 2017 (in thousands)
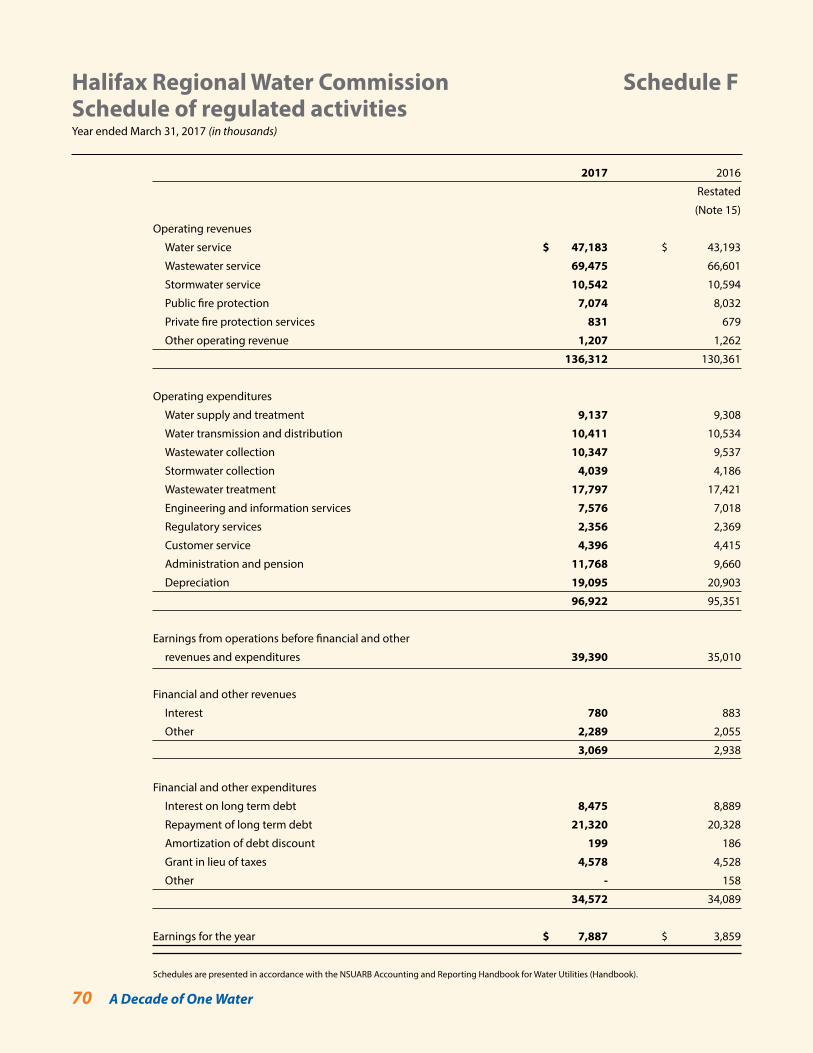
70 A Decade of One Water
Halifax Regional Water Commission Schedule FSchedule of regulated activitiesYear ended March 31, 2017 (in thousands)
2017 2016
Restated
(Note 15)
Operating revenues
Water service $ 47,183 $ 43,193
Wastewater service 69,475 66,601
Stormwater service 10,542 10,594
Public fire protection 7,074 8,032
Private fire protection services 831 679
Other operating revenue 1,207 1,262
136,312 130,361
Operating expenditures
Water supply and treatment 9,137 9,308
Water transmission and distribution 10,411 10,534
Wastewater collection 10,347 9,537
Stormwater collection 4,039 4,186
Wastewater treatment 17,797 17,421
Engineering and information services 7,576 7,018
Regulatory services 2,356 2,369
Customer service 4,396 4,415
Administration and pension 11,768 9,660
Depreciation 19,095 20,903
96,922 95,351
Earnings from operations before financial and other
revenues and expenditures 39,390 35,010
Financial and other revenues
Interest 780 883
Other 2,289 2,055
3,069 2,938
Financial and other expenditures
Interest on long term debt 8,475 8,889
Repayment of long term debt 21,320 20,328
Amortization of debt discount 199 186
Grant in lieu of taxes 4,578 4,528
Other - 158
34,572 34,089
Earnings for the year $ 7,887 $ 3,859
Schedules are presented in accordance with the NSUARB Accounting and Reporting Handbook for Water Utilities (Handbook).
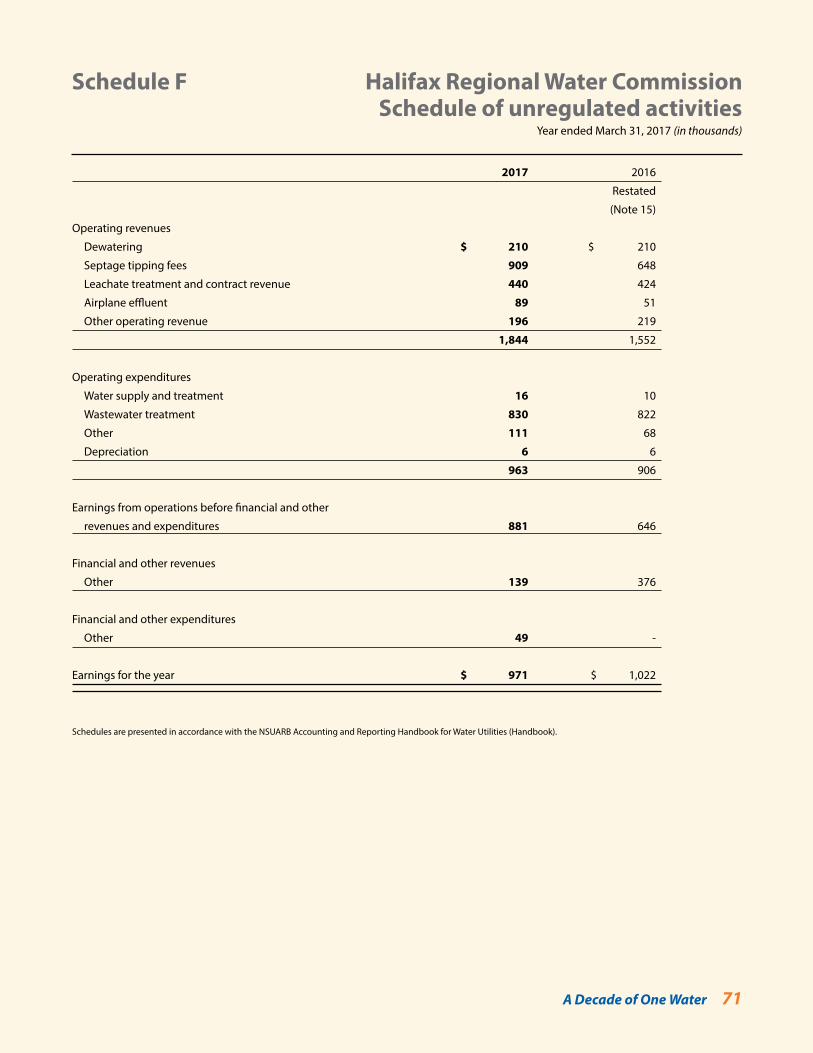
A Decade of One Water 71
Schedule F Halifax Regional Water CommissionSchedule of unregulated activities
Year ended March 31, 2017 (in thousands)
2017 2016
Restated
(Note 15)
Operating revenues
Dewatering $ 210 $ 210
Septage tipping fees 909 648
Leachate treatment and contract revenue 440 424
Airplane effluent 89 51
Other operating revenue 196 219
1,844 1,552
Operating expenditures
Water supply and treatment 16 10
Wastewater treatment 830 822
Other 111 68
Depreciation 6 6
963 906
Earnings from operations before financial and other
revenues and expenditures 881 646
Financial and other revenues
Other 139 376
Financial and other expenditures
Other 49 -
Earnings for the year $ 971 $ 1,022
Schedules are presented in accordance with the NSUARB Accounting and Reporting Handbook for Water Utilities (Handbook).
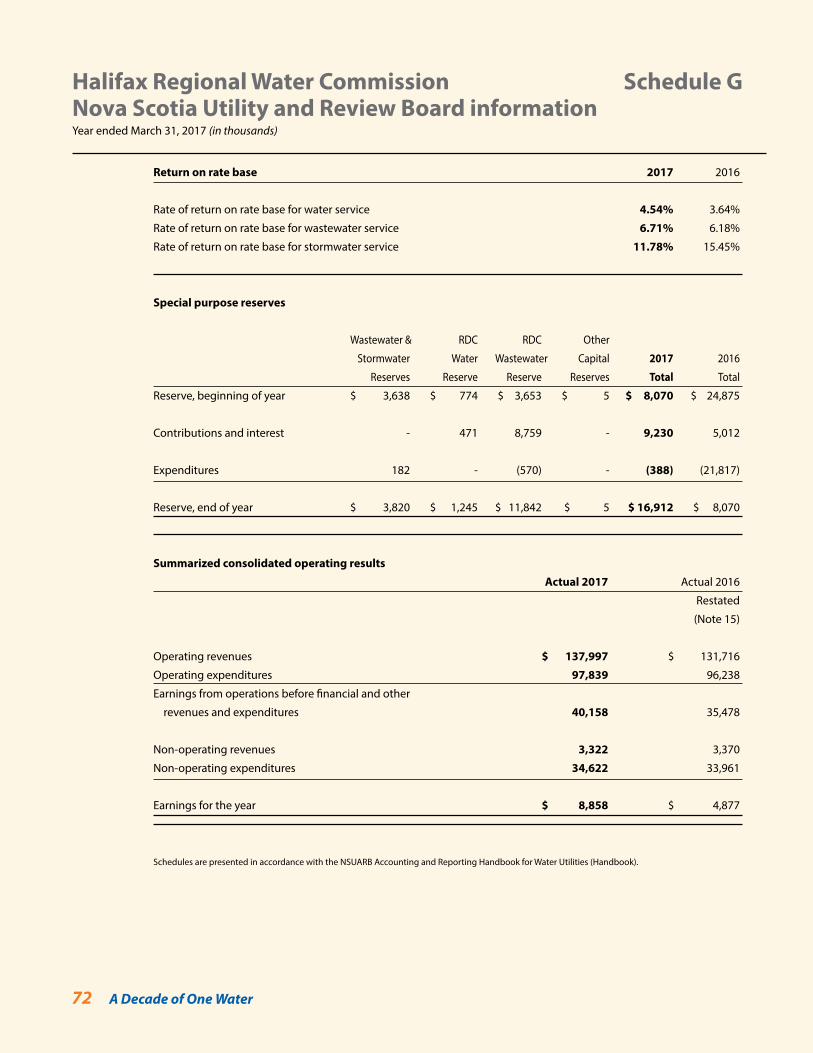
72 A Decade of One Water
Halifax Regional Water Commission Schedule GNova Scotia Utility and Review Board informationYear ended March 31, 2017 (in thousands)
Return on rate base 2017 2016
Rate of return on rate base for water service 4.54% 3.64%
Rate of return on rate base for wastewater service 6.71% 6.18%
Rate of return on rate base for stormwater service 11.78% 15.45%
Special purpose reserves
Wastewater & RDC RDC Other
Stormwater Water Wastewater Capital 2017 2016
Reserves Reserve Reserve Reserves Total Total
Reserve, beginning of year $ 3,638 $ 774 $ 3,653 $ 5 $ 8,070 $ 24,875
Contributions and interest - 471 8,759 - 9,230 5,012
Expenditures 182 - (570) - (388) (21,817)
Reserve, end of year $ 3,820 $ 1,245 $ 11,842 $ 5 $ 16,912 $ 8,070
Summarized consolidated operating results
Actual 2017 Actual 2016
Restated
(Note 15)
Operating revenues $ 137,997 $ 131,716
Operating expenditures 97,839 96,238
Earnings from operations before financial and other
revenues and expenditures 40,158 35,478
Non-operating revenues 3,322 3,370
Non-operating expenditures 34,622 33,961
Earnings for the year $ 8,858 $ 4,877
Schedules are presented in accordance with the NSUARB Accounting and Reporting Handbook for Water Utilities (Handbook).