Embed Size (px)
Citation preview
A Debt Intolerance Framework Applied to Central America, Panama and the Dominican
Republic
Geoffrey J. Bannister and Luis-Diego Barrot
WP/11/220
© 2011 International Monetary Fund WP/11/220
IMF Working Paper
Western Hemisphere Department
A Debt Intolerance Framework Applied to Central America, Panama and the Dominican Republic
Prepared by Geoffrey J. Bannister and Luis-Diego Barrot
Authorized for distribution by Alejandro Santos
September 2011
Abstract
This paper presents an alternative method for calculating debt targets using the debt intolerance literature of Reinhart, Rogoff, and Savastano (2003) and Reinhart and Rogoff (2009). The methodology presented improves on the previous papers by using a dynamic panel approach, correcting for endogeneity in the regressors and basing the calculation of debt targets on credit ratings, a more objective criteria. In addition the study uses a new data base on general government debt covering 120 countries over 21 years. The paper suggests a ranking of Central America, Panama, and Dominican Republic (CAPDR) countries in terms of debt intolerance––an index which could be used to further investigate the main components of debt intolerance.
JEL Classification Numbers: E44, F30, F34, H63
Keywords: CAPDR, Central America, Debt, Dominican Republic, Panama
Author’s E-Mail Address:[email protected], [email protected]
This Working Paper should not be reported as representing the views of the IMF. The views expressed in this Working Paper are those of the author(s) and do not necessarily represent those of the IMF or IMF policy. Working Papers describe research in progress by the author(s) and are published to elicit comments and to further debate.

2
Contents Page
Abstract ......................................................................................................................................2
I. Introduction ............................................................................................................................3
II. Background ...........................................................................................................................5 A. Debt Targets in Theory .............................................................................................5 B. Debt Targets in Practice ............................................................................................5
III. The Original Debt Intolerance Approach ............................................................................6
IV. Revised Approach to Debt Intolerance ................................................................................9 A. Introduction ...............................................................................................................9 B. The IIR and Debt .....................................................................................................10 C. The Debt Intolerance Equation ...............................................................................11 D. The Estimation Method ...........................................................................................12 E. Estimation Results ...................................................................................................12
V. Application to CAPDR .......................................................................................................14
VI. Conclusion .........................................................................................................................20
References ................................................................................................................................22 Tables Table 1. Empirical Studies of Debt Thresholds ...............................................................6 Table 2. Predicted IIR and Debt Intolerance Regions for Argentina and Malaysia ........8 Table 3. Debt Thresholds Using Debt Intolerance Approach ..........................................9 Table 4. Estimation of the Debt Intolerance Equation ...................................................13 Table 5. IIR and Credit Ratings .....................................................................................16 Table 6. CAPDR Thresholds Based on the Debt Intolerance Equation .........................18 Table 7. Credit Rating Classifications and the 2010 IIR Index .....................................19 Table 8. Ranking of Countries by Debt Intolerance ......................................................20 Figures Figure 1. RRS (2003) Division of Countries Into Clubs ...................................................7 Figure 2. Scatter Plot of the IIR and Debt-to GDP .........................................................10 Figure 3a. Costa Rica, Estimated Effect of Debt on the IIR .............................................15 Figure 3b. Costa Rica, IIR and Debt Target Thresholds ...................................................17
3
I. INTRODUCTION1
The global crisis of 2008-2010 led to an increase in the debt ratios of Central America, Panama and Dominican Republic (CAPDR) as these countries loosened fiscal policy to counteract the effects on economic activity of a rapid and substantial deterioration in the international environment. This rapid increase in debt, though moderate in comparison to industrialized countries, raises questions about the sustainability of debt and fiscal space available to confront future crises. An important question in this context is: what level of debt could these countries safely target going forward? A number of approaches have been traditionally used to answer this question, including debt sustainability analyses, studies of the effect of a rising debt ratio on real GDP growth and the external balance, and studies that look at the effectiveness of fiscal policy stimulus under different levels of debt.
This paper takes an alternative approach to the calculation of debt targets, related to the literature on debt intolerance by Reinhart, Rogoff and Savastano (2003) and Reinhart and Rogoff (2009). These authors begin from the empirical observation that certain countries fall into repeated debt defaults at relatively low levels of debt – a syndrome they call debt intolerance. In these countries, weak institutions and a problematic political system make public borrowing an overwhelmingly tempting device to avoid hard choices about domestic spending and taxing. At the same time, fiscal rigidities, economic inefficiencies and exposure to external shocks make these economies vulnerable to fiscal and debt crises at relatively low levels of debt to GDP. On a practical level, measuring a country’s debt intolerance allows for an additional indicator of a “safe” level of debt or a benchmark against which current and future levels of debt can be compared, to assess the risk of fiscal and external payments stress.
As an initial measure of debt intolerance, Reinhart, Rogoff and Savastano (2003) (RRS henceforward) use the Institutional Investor Rating (IIR), a rating compiled twice a year by Institutional Investor Magazine based on surveys of institutional investors, money managers and economists.2
1 The authors are grateful for comments from Marco Piñon, Rodrigo Valdez, Miguel Savastano, Alejandro Santos, participants at a Western Hemisphere Department seminar at the IMF, and participants at the X Central American Regional Conference in Managua, Nicaragua, July 28-29, 2011. The authors also thank Raphael Espinoza for generously sharing his STATA codes and advice.
They regress the IIR on a number of indicators of debt intolerance, including the debt ratio, the history of inflation and default, to find the marginal effect of an additional unit of debt on the IIR and hence on debt intolerance. Using the results of this “debt intolerance equation” it is possible to find the level of debt consistent with a given level of the IIR, given a country’s history of inflation and default. A number of studies (for example Di Bella (2008), Everaert (2008) and Topalova and Nyberg (2009)) have used this approach to develop debt targets for countries as different as the Dominican Republic, Kenya and India.
2 The rating grades each country on a scale from 0 (least creditworthy) to 100 (most creditworthy), and covers over 166 countries from the mid 1980s forward.
4
In this paper we follow this general approach, but with a number of modifications of the previous methodology:
• This study uses a dynamic panel data framework, rather than a static cross-section estimation used in RRS and previous studies. This allows for an estimation of the changes in the IIR with respect to changes in debt, making it easier to apply to different countries with different levels of debt and debt intolerance.
• The study uses Generalized Method of Moments estimators (GMM) designed for panel data estimations (Arellano and Bond (1991) and Arellano and Bover (1995)), which correct for endogeneity of regressors and allow for the introduction of country-specific fixed effects.
• Instead of dividing the sample into groupings (debt clubs) based on the mean and standard deviation of the IIR, this study estimates one equation for all countries. This eliminates a potential problem of endogeneity of the IIR groupings (clubs) and the error term in the RRS methodology which could result in biased coefficient estimates.
• The selection of the threshold IIR level on which the debt target is based depends on the correspondence of the IIR with credit ratings of major rating agencies, rather than on graduation to a higher “club” as in RRS and previous studies.
• The study uses a new debt data set on general government debt (Abbas et al. (2010)), instead of external debt only as in RRS.
The result is the estimation of a debt intolerance equation that can be applied flexibly to the calculation of debt targets for most countries in the IIR sample. First, after benchmarking the relationship between the IIR and debt at the 2010 level for each country, it is possible to use the coefficients of the econometric estimation to describe a country-specific functional relationship between the IIR and debt. Second, mapping the IIR index with the credit rating, it is possible to choose a reference level of the IIR (an IIR target) that corresponds with a given credit rating target (say investment grade), which then permits the direct calculation of a corresponding debt target that would allow a country to reach the target IIR, all other things equal.
The outline of the paper is as follows: the next section describes recent work on optimal public debt ratios and indicative debt targets. Section III briefly reviews the original debt intolerance approach and results. Section IV presents the revised methodology pursued in this paper. Section V presents results for the application to CAPDR and an index of debt intolerance. Section VI concludes.
5
II. BACKGROUND
A. Debt Targets in Theory
The theoretical literature provides little practical guidance for setting debt targets. General equilibrium models have been developed to explore the trade-off between the costs and benefits of government debt. Aiyagari et al. (1998), Floden (2001) and Shin (2006), for example, illustrate the trade off between the benefits of public debt to enhance the liquidity of households by providing an additional means to smooth consumption and effectively loosen their borrowing constraints, and the cost of future implied taxes that have adverse effects on wealth distribution and incentives, and the crowding out of private investment. Public debt thus improves the risk sharing ability of households and provides a vehicle to diversify idiosyncratic income risk by relaxing the borrowing constraint, but at the cost of allocative inefficiency and slower growth. Saint Paul (2005) cites additional benefits of government debt markets for efficient financial markets, including financial innovation that comes from deep and liquid public debt markets, and the ability to use public debt as collateral for private sector borrowing. Few of these models have been implemented empirically. Aiyagari et al. (1998), calibrate their model for the US and calculate the optimal debt ratio at 66 percent of GDP; Weh-Sol, (2010) uses the same model to calculate an optimal debt ratio for South Korea of 62 percent of GDP.
B. Debt Targets in Practice
More practical approaches to developing debt targets have relied on empirical evidence for the conduct of fiscal policy and the relationship between debt and growth. IMF(2003) uses a debt sustainability approach to determine the level of debt to GDP that is compatible with a country’s past fiscal performance. If a country has been able to generate high primary surpluses in the past then it should be able to tolerate a higher level of debt-to-GDP without encountering destabilizing or unsustainable debt dynamics. This amounts to assuming that past fiscal effort, as summarized by the average primary surplus, is the best guide to future fiscal effort. Under this scenario, assuming an historical differential between the real interest rate and the real growth rate, they determine that the average sustainable debt for emerging market countries at around 25 percent of GDP. A more recent analysis along similar lines for industrial countries is preformed by Ostry et al. (2010), but estimating a fiscal reaction function to summarize past behavior. They find that the debt limit, above which debt dynamics become unsustainable ranges from 170 to 180 percent of GDP. An alternative approach is to look at the effectiveness of countercyclical fiscal policy conditional on the starting level of debt-to-GDP. A number of studies have found that the power of fiscal policy to affect aggregate demand depends on the initial level of debt, with higher debt levels leading to a reduction in the multiplier or even a negative multiplier. IMF (2008, 2009), for example, find that the effectiveness of fiscal policy is smaller or negative in countries with high public debt, defined as above 60-75 percent of GDP for industrial countries and 25 percent of GDP for emerging markets. Debt levels have been found to be correlated with real GDP growth. Higher public debt levels could crowd out financing for more efficient private investment, or lead to a higher
6
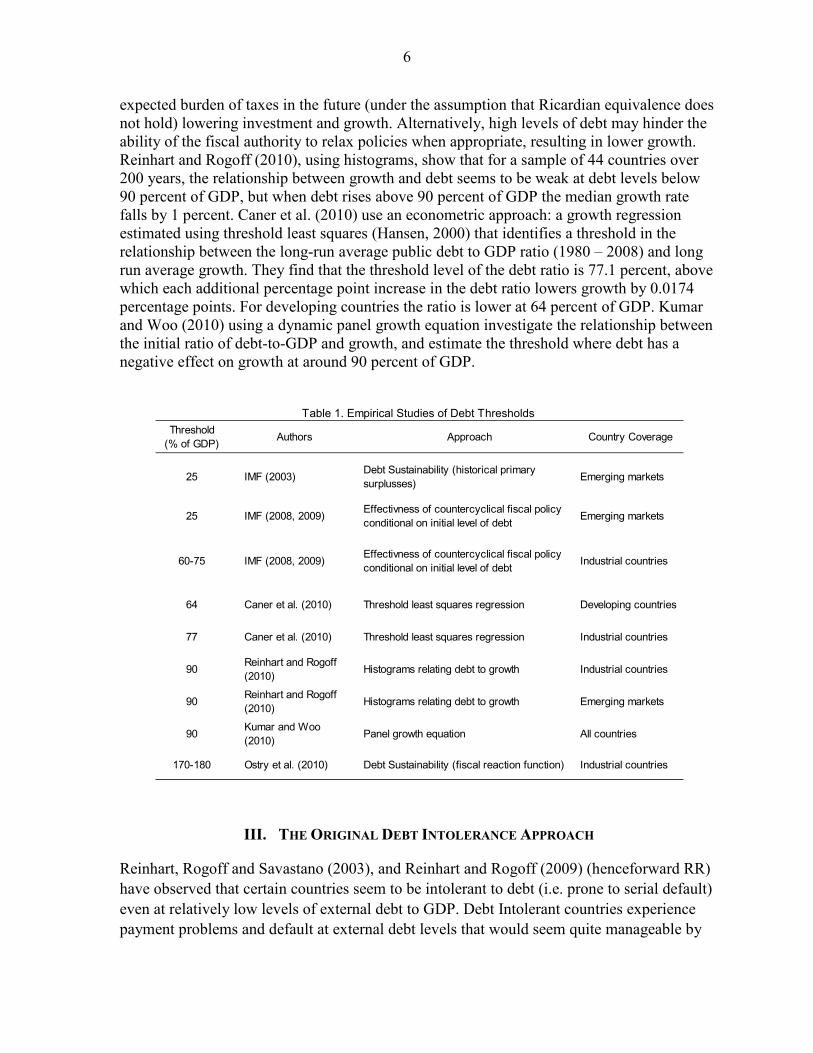
expected burden of taxes in the future (under the assumption that Ricardian equivalence does not hold) lowering investment and growth. Alternatively, high levels of debt may hinder the ability of the fiscal authority to relax policies when appropriate, resulting in lower growth. Reinhart and Rogoff (2010), using histograms, show that for a sample of 44 countries over 200 years, the relationship between growth and debt seems to be weak at debt levels below 90 percent of GDP, but when debt rises above 90 percent of GDP the median growth rate falls by 1 percent. Caner et al. (2010) use an econometric approach: a growth regression estimated using threshold least squares (Hansen, 2000) that identifies a threshold in the relationship between the long-run average public debt to GDP ratio (1980 – 2008) and long run average growth. They find that the threshold level of the debt ratio is 77.1 percent, above which each additional percentage point increase in the debt ratio lowers growth by 0.0174 percentage points. For developing countries the ratio is lower at 64 percent of GDP. Kumar and Woo (2010) using a dynamic panel growth equation investigate the relationship between the initial ratio of debt-to-GDP and growth, and estimate the threshold where debt has a negative effect on growth at around 90 percent of GDP.
III. THE ORIGINAL DEBT INTOLERANCE APPROACH
Reinhart, Rogoff and Savastano (2003), and Reinhart and Rogoff (2009) (henceforward RR) have observed that certain countries seem to be intolerant to debt (i.e. prone to serial default) even at relatively low levels of external debt to GDP. Debt Intolerant countries experience payment problems and default at external debt levels that would seem quite manageable by
Threshold (% of GDP) Authors Approach Country Coverage
25 IMF (2003) Debt Sustainability (historical primary surplusses) Emerging markets
25 IMF (2008, 2009) Effectivness of countercyclical fiscal policy conditional on initial level of debt Emerging markets
60-75 IMF (2008, 2009) Effectivness of countercyclical fiscal policy conditional on initial level of debt Industrial countries
64 Caner et al. (2010) Threshold least squares regression Developing countries
77 Caner et al. (2010) Threshold least squares regression Industrial countries
90 Reinhart and Rogoff (2010) Histograms relating debt to growth Industrial countries
90 Reinhart and Rogoff (2010) Histograms relating debt to growth Emerging markets
90 Kumar and Woo (2010) Panel growth equation All countries
170-180 Ostry et al. (2010) Debt Sustainability (fiscal reaction function) Industrial countries
Table 1. Empirical Studies of Debt Thresholds
7
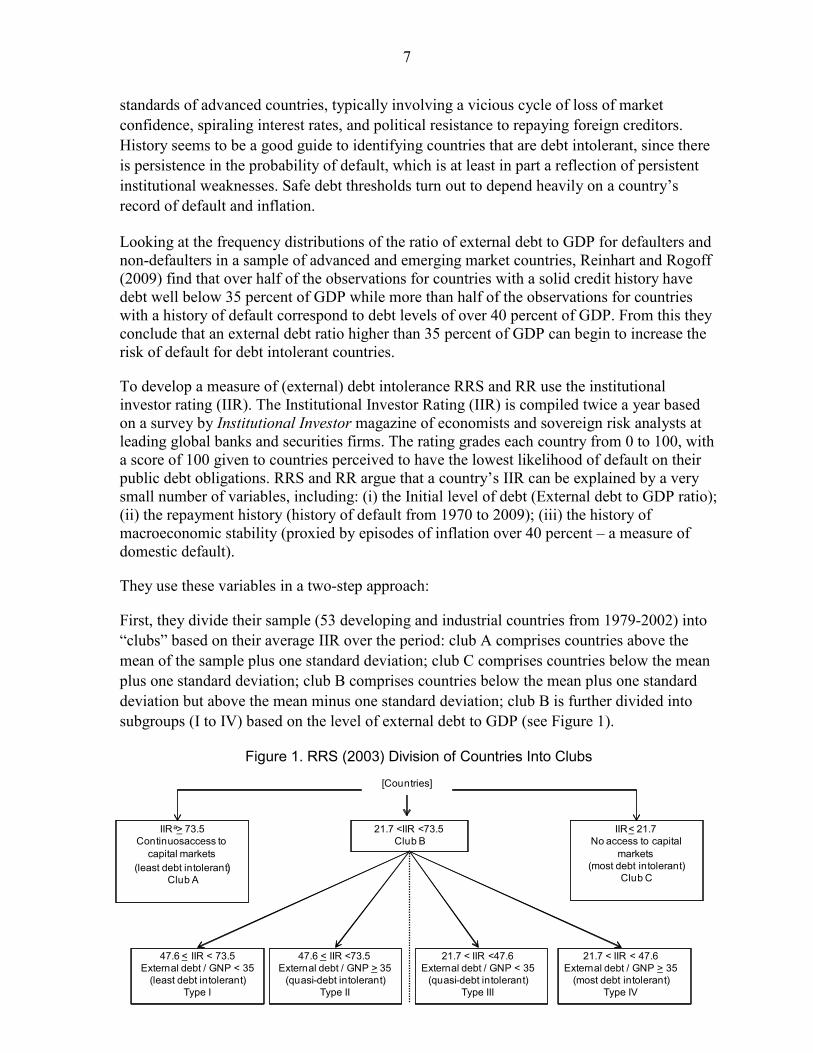
[Countries]
21.7 <IIR <73.5Club B
IIRa> 73.5Continuosaccess to
capital markets (least debt intolerant)
Club A
IIR< 21.7No access to capital
markets (most debt intolerant)
Club C
47.6 < IIR < 73.5External debt / GNP < 35
(least debt intolerant)Type I
47.6 < IIR <73.5External debt / GNP > 35
(quasi-debt intolerant)Type II
21.7 < IIR < 47.6External debt / GNP > 35
(most debt intolerant)Type IV
21.7 < IIR <47.6External debt / GNP < 35
(quasi-debt intolerant)Type III
standards of advanced countries, typically involving a vicious cycle of loss of market confidence, spiraling interest rates, and political resistance to repaying foreign creditors. History seems to be a good guide to identifying countries that are debt intolerant, since there is persistence in the probability of default, which is at least in part a reflection of persistent institutional weaknesses. Safe debt thresholds turn out to depend heavily on a country’s record of default and inflation.
Looking at the frequency distributions of the ratio of external debt to GDP for defaulters and non-defaulters in a sample of advanced and emerging market countries, Reinhart and Rogoff (2009) find that over half of the observations for countries with a solid credit history have debt well below 35 percent of GDP while more than half of the observations for countries with a history of default correspond to debt levels of over 40 percent of GDP. From this they conclude that an external debt ratio higher than 35 percent of GDP can begin to increase the risk of default for debt intolerant countries.
To develop a measure of (external) debt intolerance RRS and RR use the institutional investor rating (IIR). The Institutional Investor Rating (IIR) is compiled twice a year based on a survey by Institutional Investor magazine of economists and sovereign risk analysts at leading global banks and securities firms. The rating grades each country from 0 to 100, with a score of 100 given to countries perceived to have the lowest likelihood of default on their public debt obligations. RRS and RR argue that a country’s IIR can be explained by a very small number of variables, including: (i) the Initial level of debt (External debt to GDP ratio); (ii) the repayment history (history of default from 1970 to 2009); (iii) the history of macroeconomic stability (proxied by episodes of inflation over 40 percent – a measure of domestic default).
They use these variables in a two-step approach:
First, they divide their sample (53 developing and industrial countries from 1979-2002) into “clubs” based on their average IIR over the period: club A comprises countries above the mean of the sample plus one standard deviation; club C comprises countries below the mean plus one standard deviation; club B comprises countries below the mean plus one standard deviation but above the mean minus one standard deviation; club B is further divided into subgroups (I to IV) based on the level of external debt to GDP (see Figure 1).
Figure 1. RRS (2003) Division of Countries Into Clubs
8
Using these clubs, they run a cross-section regression using averages across time periods for the variables, explaining the IIR as a function of debt (external), default history and inflation, and using an interactive dummy for debt on those countries that belong to club A and another for those countries that do not.3
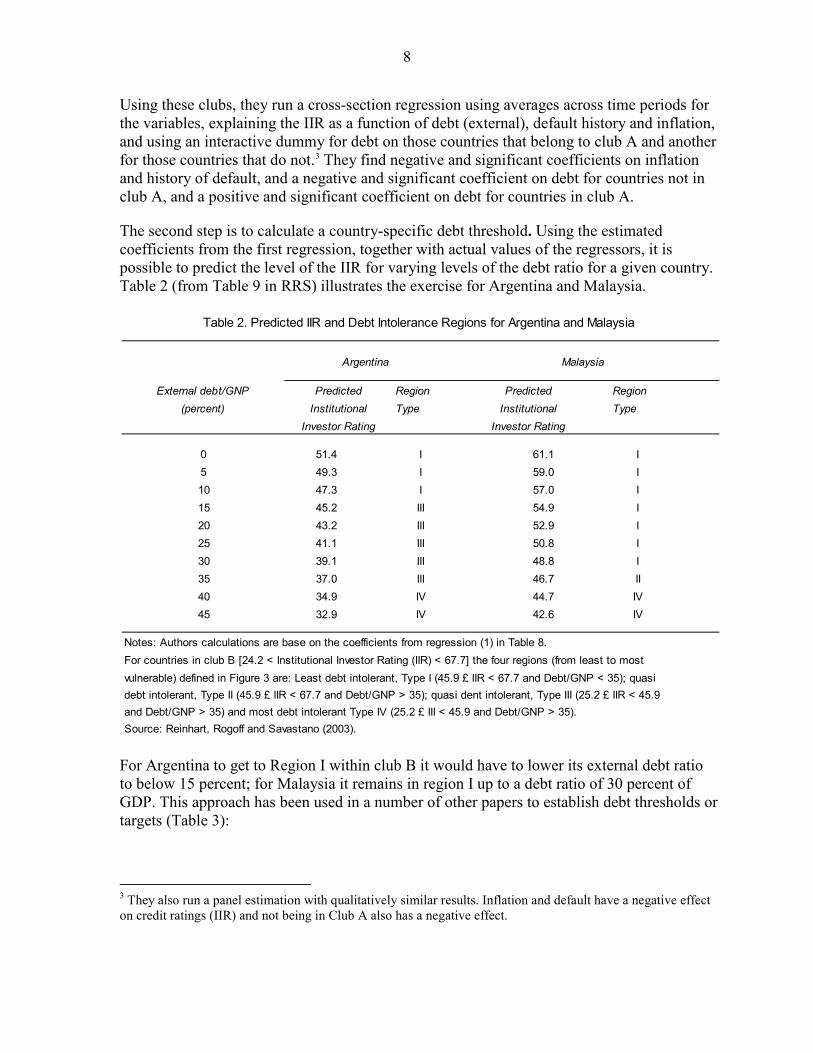
The second step is to calculate a country-specific debt threshold. Using the estimated coefficients from the first regression, together with actual values of the regressors, it is possible to predict the level of the IIR for varying levels of the debt ratio for a given country. Table 2 (from Table 9 in RRS) illustrates the exercise for Argentina and Malaysia.
They find negative and significant coefficients on inflation and history of default, and a negative and significant coefficient on debt for countries not in club A, and a positive and significant coefficient on debt for countries in club A.
For Argentina to get to Region I within club B it would have to lower its external debt ratio to below 15 percent; for Malaysia it remains in region I up to a debt ratio of 30 percent of GDP. This approach has been used in a number of other papers to establish debt thresholds or targets (Table 3):
3 They also run a panel estimation with qualitatively similar results. Inflation and default have a negative effect on credit ratings (IIR) and not being in Club A also has a negative effect.
Argentina Malaysia
External debt/GNP Region Predicted Region(percent) Type Institutional Type
Investor Rating
0 51.4 I 61.1 I5 49.3 I 59.0 I10 47.3 I 57.0 I15 45.2 III 54.9 I20 43.2 III 52.9 I25 41.1 III 50.8 I30 39.1 III 48.8 I35 37.0 III 46.7 II40 34.9 IV 44.7 IV45 32.9 IV 42.6 IV
Notes: Authors calculations are base on the coefficients from regression (1) in Table 8.For countries in club B [24.2 < Institutional Investor Rating (IIR) < 67.7] the four regions (from least to mostvulnerable) defined in Figure 3 are: Least debt intolerant, Type I (45.9 £ IIR < 67.7 and Debt/GNP < 35); quasidebt intolerant, Type II (45.9 £ IIR < 67.7 and Debt/GNP > 35); quasi dent intolerant, Type III (25.2 £ IIR < 45.9and Debt/GNP > 35) and most debt intolerant Type IV (25.2 £ III < 45.9 and Debt/GNP > 35).Source: Reinhart, Rogoff and Savastano (2003).
Investor Rating
PredictedInstitutional
Table 2. Predicted IIR and Debt Intolerance Regions for Argentina and Malaysia
9
IV. REVISED APPROACH TO DEBT INTOLERANCE
A. Introduction
There are a number of problems with the traditional approach to estimating the debt intolerance equation. First there is a possible endogeneity of regressors (debt, inflation and default) to the dependent variable (IIR) which may lead to biased estimates of the coefficients. RRS recognize this and use instrumental variable estimations with the same general results as their original estimation. However, there may also be endogeneity of IIR groupings (clubs). Because these are groupings based on partitions of the dependent variable (as opposed to the more traditional dummies based on partitions of independent variables) they may also be correlated with the error term, resulting in biased estimates of the coefficients. Second, the static cross-section estimation does not take into account changes in the IIR and debt over time, and the linear relationship between IIR and debt may be restrictive. In addition, the definition of “clubs” depends on the sample of countries chosen for the estimation, which may lead to bias when defining IIR targets and the corresponding debt targets. Third, previous estimations use external debt only, while a broader definition to include domestic debt (i.e. general government debt) might give a more complete picture of the importance of debt levels for debt intolerance. The revised approach seeks to address some of these problems by: • Using a dynamic panel data framework, estimating changes in the IIR with respect to
changes in debt, which facilitates application to different countries with different levels of debt and debt intolerance;
• Using Generalized Method of Moments estimation in a panel error correction model framework, correcting for endogeneity of regressors, and introducing country-specific fixed effects;
• Instead of dividing the sample into ad-hoc clubs based on the mean and standard deviation of the IIR, the methodology estimates one equation for all countries, avoiding potential endogeneity of the debt groupings and the error term.
• Basing the IIR target and corresponding debt threshold calculation on credit ratings of major rating agencies;
Author Country Target Debt/GDP Club
Di Bella (2008) Dominican Republic 25 BIIEveraert (2008) Kenya 41 BITopolova and Nyberg (2010) India 49 BI
Table 3. Debt Thresholds Using the Debt-Intolerance Approach
10
• Using a new data set on general government debt (Abbas et al. (2010));
Our sample includes 120 countries, developed and developing, from 1989 to 2009, an unbalanced panel, except for the last 15 years which are fairly complete. To eliminate noise, and following standard practice, we take 5- year averages over 4 periods (1989-1994 – 6 years; 1995-1999 – 5 years; 2000-2004 – 5 years; 2005-2009- 5 years).
B. The IIR and Debt
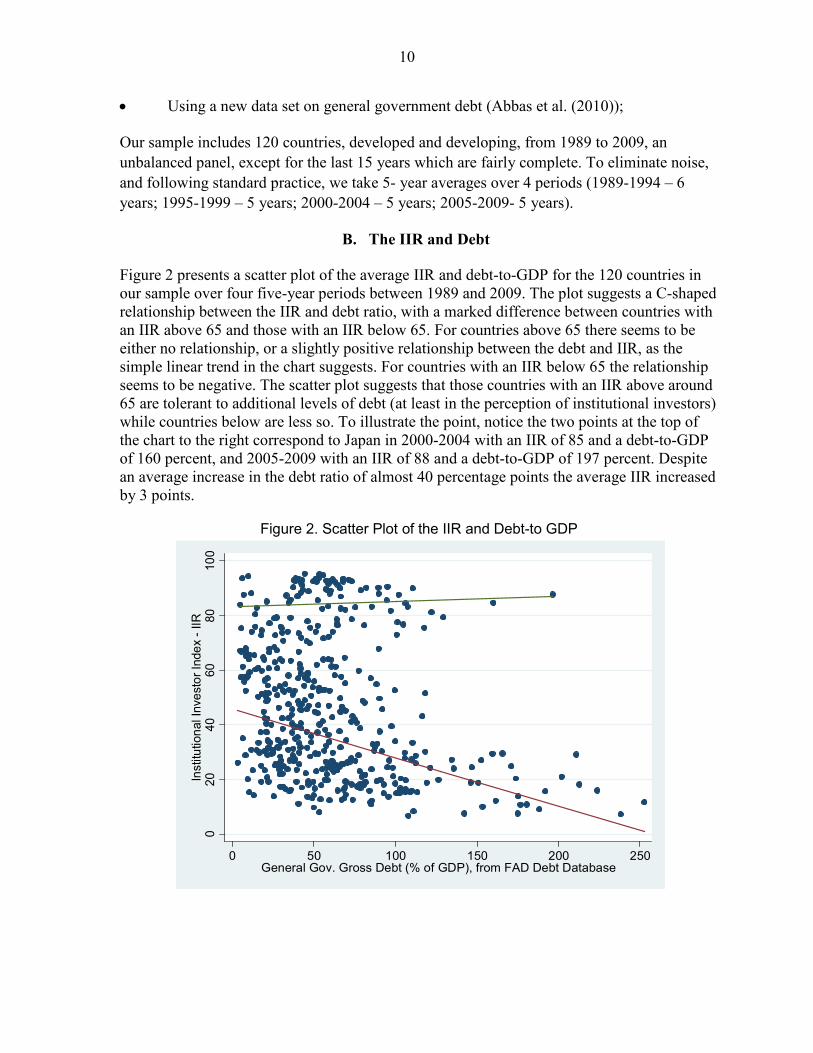
Figure 2 presents a scatter plot of the average IIR and debt-to-GDP for the 120 countries in our sample over four five-year periods between 1989 and 2009. The plot suggests a C-shaped relationship between the IIR and debt ratio, with a marked difference between countries with an IIR above 65 and those with an IIR below 65. For countries above 65 there seems to be either no relationship, or a slightly positive relationship between the debt and IIR, as the simple linear trend in the chart suggests. For countries with an IIR below 65 the relationship seems to be negative. The scatter plot suggests that those countries with an IIR above around 65 are tolerant to additional levels of debt (at least in the perception of institutional investors) while countries below are less so. To illustrate the point, notice the two points at the top of the chart to the right correspond to Japan in 2000-2004 with an IIR of 85 and a debt-to-GDP of 160 percent, and 2005-2009 with an IIR of 88 and a debt-to-GDP of 197 percent. Despite an average increase in the debt ratio of almost 40 percentage points the average IIR increased by 3 points.
Figure 2. Scatter Plot of the IIR and Debt-to GDP
020
4060
8010
0In
stitu
tiona
l Inv
esto
r Ind
ex -
IIR
0 50 100 150 200 250General Gov. Gross Debt (% of GDP), from FAD Debt Database
11
C. The Debt Intolerance Equation
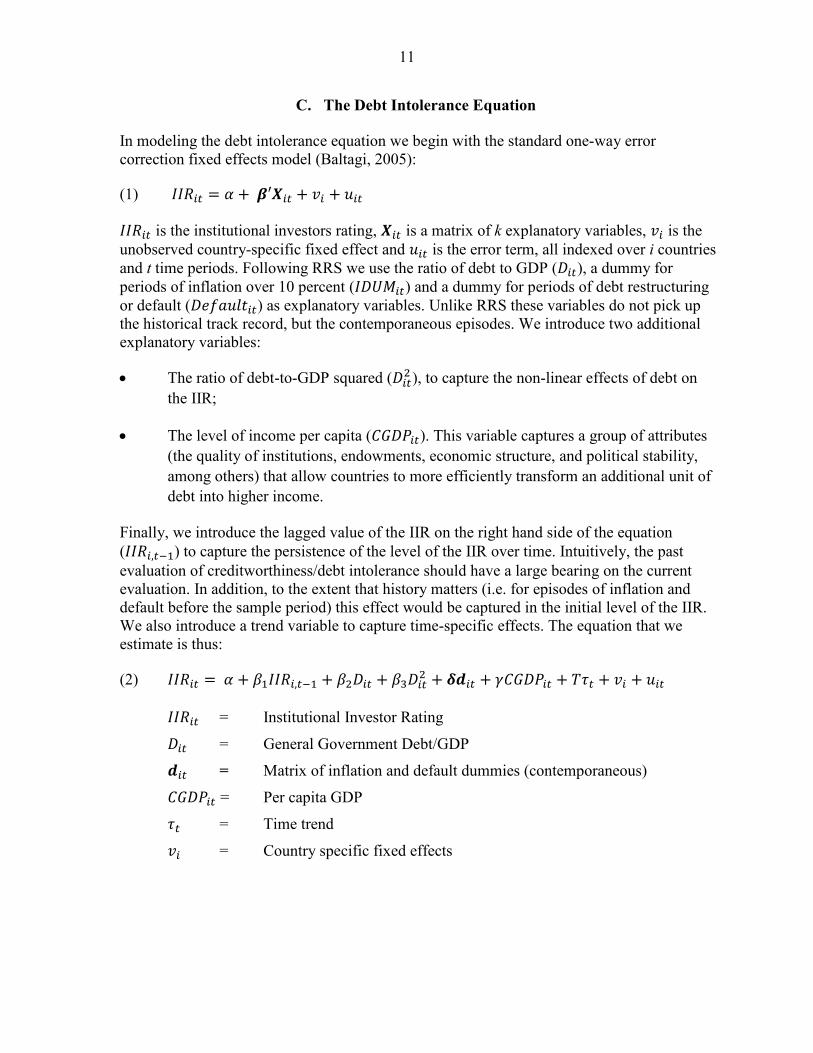
In modeling the debt intolerance equation we begin with the standard one-way error correction fixed effects model (Baltagi, 2005):
(1) 𝐼𝐼𝑅𝑖𝑡 = 𝛼 + 𝜷′𝑿𝑖𝑡 + 𝑣𝑖 + 𝑢𝑖𝑡
𝐼𝐼𝑅𝑖𝑡 is the institutional investors rating, 𝑿𝑖𝑡 is a matrix of k explanatory variables, 𝑣𝑖 is the unobserved country-specific fixed effect and 𝑢𝑖𝑡 is the error term, all indexed over i countries and t time periods. Following RRS we use the ratio of debt to GDP (𝐷𝑖𝑡), a dummy for periods of inflation over 10 percent (𝐼𝐷𝑈𝑀𝑖𝑡) and a dummy for periods of debt restructuring or default (𝐷𝑒𝑓𝑎𝑢𝑙𝑡𝑖𝑡) as explanatory variables. Unlike RRS these variables do not pick up the historical track record, but the contemporaneous episodes. We introduce two additional explanatory variables:
• The ratio of debt-to-GDP squared (𝐷𝑖𝑡2 ), to capture the non-linear effects of debt on the IIR;
• The level of income per capita (𝐶𝐺𝐷𝑃𝑖𝑡). This variable captures a group of attributes (the quality of institutions, endowments, economic structure, and political stability, among others) that allow countries to more efficiently transform an additional unit of debt into higher income.
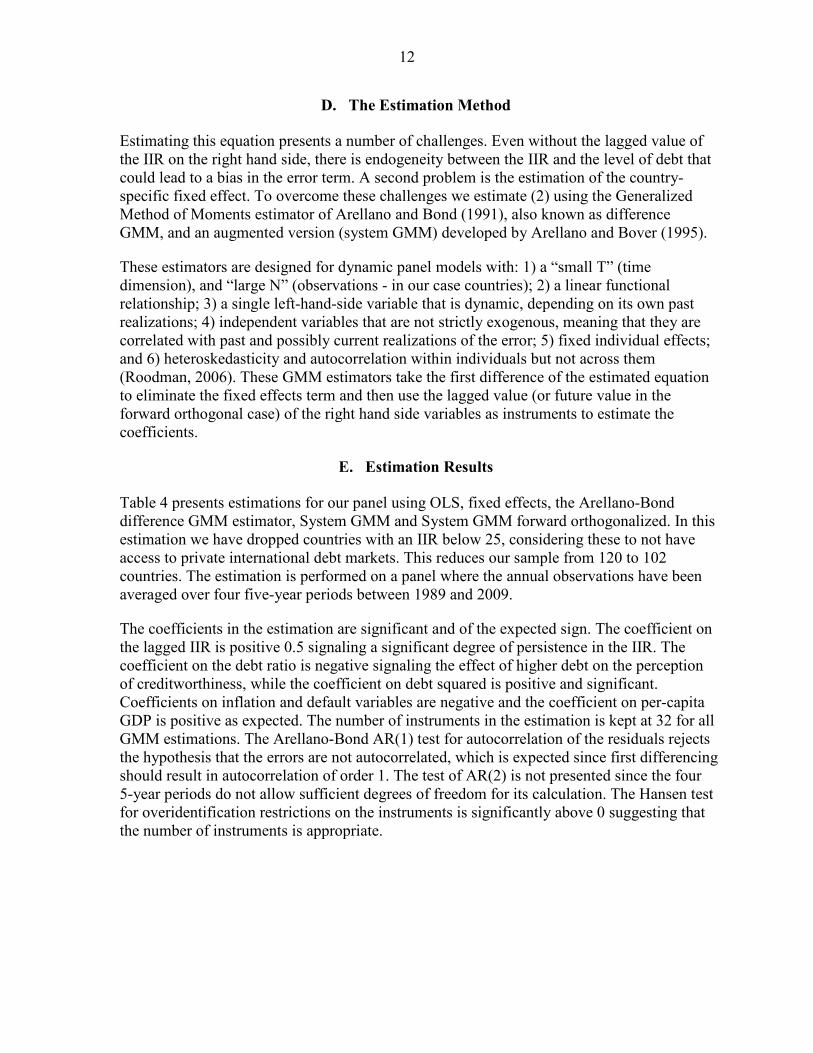
Finally, we introduce the lagged value of the IIR on the right hand side of the equation (𝐼𝐼𝑅𝑖,𝑡−1) to capture the persistence of the level of the IIR over time. Intuitively, the past evaluation of creditworthiness/debt intolerance should have a large bearing on the current evaluation. In addition, to the extent that history matters (i.e. for episodes of inflation and default before the sample period) this effect would be captured in the initial level of the IIR. We also introduce a trend variable to capture time-specific effects. The equation that we estimate is thus:
(2) 𝐼𝐼𝑅𝑖𝑡 = 𝛼 + 𝛽1𝐼𝐼𝑅𝑖,𝑡−1 + 𝛽2𝐷𝑖𝑡 + 𝛽3𝐷𝑖𝑡2 + 𝜹𝒅𝑖𝑡 + 𝛾𝐶𝐺𝐷𝑃𝑖𝑡 + 𝑇𝜏𝑡 + 𝑣𝑖 + 𝑢𝑖𝑡
𝐼𝐼𝑅𝑖𝑡 = Institutional Investor Rating
𝐷𝑖𝑡 = General Government Debt/GDP
𝒅𝑖𝑡 = Matrix of inflation and default dummies (contemporaneous)
𝐶𝐺𝐷𝑃𝑖𝑡 = Per capita GDP
𝜏𝑡 = Time trend
𝑣𝑖 = Country specific fixed effects
12
D. The Estimation Method
Estimating this equation presents a number of challenges. Even without the lagged value of the IIR on the right hand side, there is endogeneity between the IIR and the level of debt that could lead to a bias in the error term. A second problem is the estimation of the country-specific fixed effect. To overcome these challenges we estimate (2) using the Generalized Method of Moments estimator of Arellano and Bond (1991), also known as difference GMM, and an augmented version (system GMM) developed by Arellano and Bover (1995).
These estimators are designed for dynamic panel models with: 1) a “small T” (time dimension), and “large N” (observations - in our case countries); 2) a linear functional relationship; 3) a single left-hand-side variable that is dynamic, depending on its own past realizations; 4) independent variables that are not strictly exogenous, meaning that they are correlated with past and possibly current realizations of the error; 5) fixed individual effects; and 6) heteroskedasticity and autocorrelation within individuals but not across them (Roodman, 2006). These GMM estimators take the first difference of the estimated equation to eliminate the fixed effects term and then use the lagged value (or future value in the forward orthogonal case) of the right hand side variables as instruments to estimate the coefficients.
E. Estimation Results
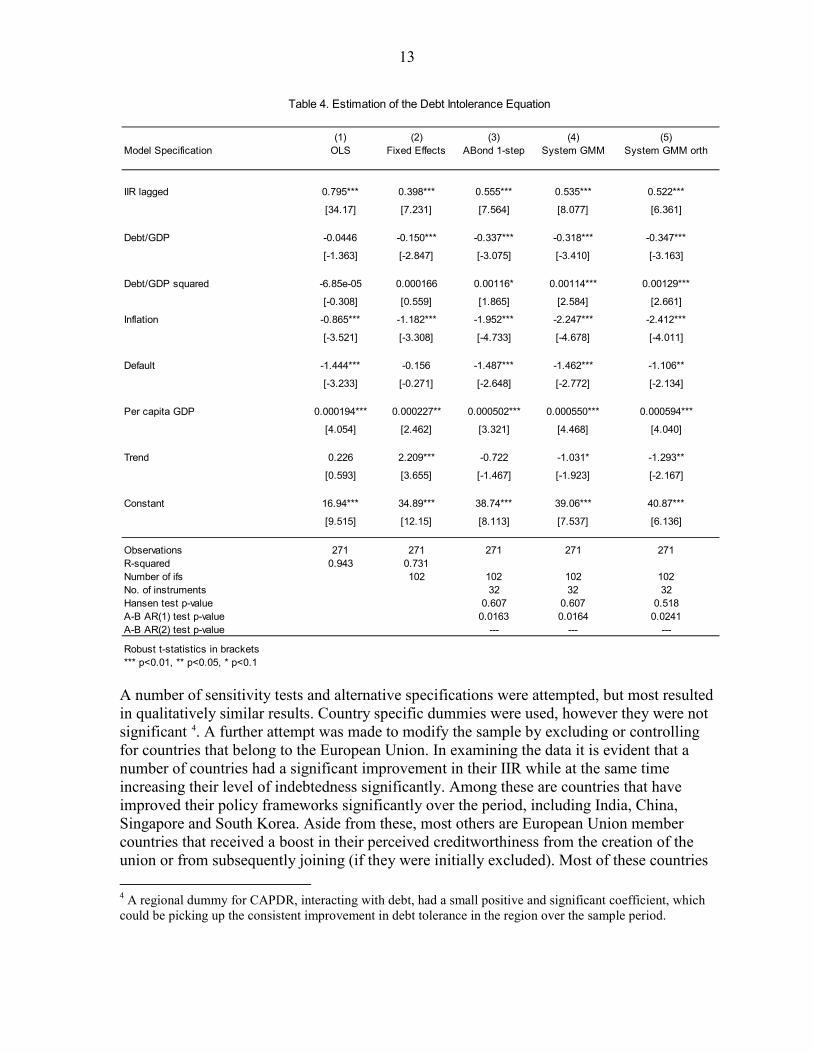
Table 4 presents estimations for our panel using OLS, fixed effects, the Arellano-Bond difference GMM estimator, System GMM and System GMM forward orthogonalized. In this estimation we have dropped countries with an IIR below 25, considering these to not have access to private international debt markets. This reduces our sample from 120 to 102 countries. The estimation is performed on a panel where the annual observations have been averaged over four five-year periods between 1989 and 2009.
The coefficients in the estimation are significant and of the expected sign. The coefficient on the lagged IIR is positive 0.5 signaling a significant degree of persistence in the IIR. The coefficient on the debt ratio is negative signaling the effect of higher debt on the perception of creditworthiness, while the coefficient on debt squared is positive and significant. Coefficients on inflation and default variables are negative and the coefficient on per-capita GDP is positive as expected. The number of instruments in the estimation is kept at 32 for all GMM estimations. The Arellano-Bond AR(1) test for autocorrelation of the residuals rejects the hypothesis that the errors are not autocorrelated, which is expected since first differencing should result in autocorrelation of order 1. The test of AR(2) is not presented since the four 5-year periods do not allow sufficient degrees of freedom for its calculation. The Hansen test for overidentification restrictions on the instruments is significantly above 0 suggesting that the number of instruments is appropriate.
13
A number of sensitivity tests and alternative specifications were attempted, but most resulted in qualitatively similar results. Country specific dummies were used, however they were not significant 4
4 A regional dummy for CAPDR, interacting with debt, had a small positive and significant coefficient, which could be picking up the consistent improvement in debt tolerance in the region over the sample period.
. A further attempt was made to modify the sample by excluding or controlling for countries that belong to the European Union. In examining the data it is evident that a number of countries had a significant improvement in their IIR while at the same time increasing their level of indebtedness significantly. Among these are countries that have improved their policy frameworks significantly over the period, including India, China, Singapore and South Korea. Aside from these, most others are European Union member countries that received a boost in their perceived creditworthiness from the creation of the union or from subsequently joining (if they were initially excluded). Most of these countries
(1) (2) (3) (4) (5)Model Specification OLS Fixed Effects ABond 1-step System GMM System GMM orth
IIR lagged 0.795*** 0.398*** 0.555*** 0.535*** 0.522***
[34.17] [7.231] [7.564] [8.077] [6.361]
Debt/GDP -0.0446 -0.150*** -0.337*** -0.318*** -0.347***
[-1.363] [-2.847] [-3.075] [-3.410] [-3.163]
Debt/GDP squared -6.85e-05 0.000166 0.00116* 0.00114*** 0.00129***
[-0.308] [0.559] [1.865] [2.584] [2.661]
Inflation -0.865*** -1.182*** -1.952*** -2.247*** -2.412***
[-3.521] [-3.308] [-4.733] [-4.678] [-4.011]
Default -1.444*** -0.156 -1.487*** -1.462*** -1.106**
[-3.233] [-0.271] [-2.648] [-2.772] [-2.134]
Per capita GDP 0.000194*** 0.000227** 0.000502*** 0.000550*** 0.000594***
[4.054] [2.462] [3.321] [4.468] [4.040]
Trend 0.226 2.209*** -0.722 -1.031* -1.293**
[0.593] [3.655] [-1.467] [-1.923] [-2.167]
Constant 16.94*** 34.89*** 38.74*** 39.06*** 40.87***
[9.515] [12.15] [8.113] [7.537] [6.136]
Observations 271 271 271 271 271R-squared 0.943 0.731Number of ifs 102 102 102 102No. of instruments 32 32 32Hansen test p-value 0.607 0.607 0.518A-B AR(1) test p-value 0.0163 0.0164 0.0241A-B AR(2) test p-value --- --- ---
Robust t-statistics in brackets*** p<0.01, ** p<0.05, * p<0.1
Table 4. Estimation of the Debt Intolerance Equation
14
have higher IIRs and higher debt at the end of the period compared to when they started. The prominent example is Greece, whose IIR increased by 30 points from 1989-93 to 2005-09, while its debt ratio rose by 24 points. Excluding EU countries from the sample reduces the number of countries to 88 from 102, but does not significantly change the qualitative results of the estimation. An EU member dummy, on its own or interacted with debt, did not turn out to be significant.5
An estimation was also run on the annual data series. The coefficient on the lagged IIR was higher as expected (0.78), since abrupt changes are less likely from year-to-year, and the coefficient on debt lower (-0.2); both had the right sign and were significant. Coefficients on inflation, default and per capita GDP were similar to the baseline estimation. Tests reject second order autocorrelation and confirm the number of instruments is appropriate.
V. APPLICATION TO CAPDR
To operationalize the model we take the first difference of the estimated equation (2) and assume no changes in the inflation and default dummies and per-capita GDP so that these elements, the constant and the country-specific fixed effects term drop out. We also assume that time-specific effects are zero. This yields the following equation for the adjustment of the IIR with respect to debt:
(3) 𝐼𝐼𝑅� 𝑡 = �1 + �̂�1�𝐼𝐼𝑅𝑡−1 − �̂�1𝐼𝐼𝑅𝑡−2 + �̂�2(𝐷𝑡 − 𝐷𝑡−1) + �̂�3(𝐷𝑡2 − 𝐷𝑡−12 )
We then calculate the path of the IIR for changes in debt starting from the benchmark of the 2010 level.6
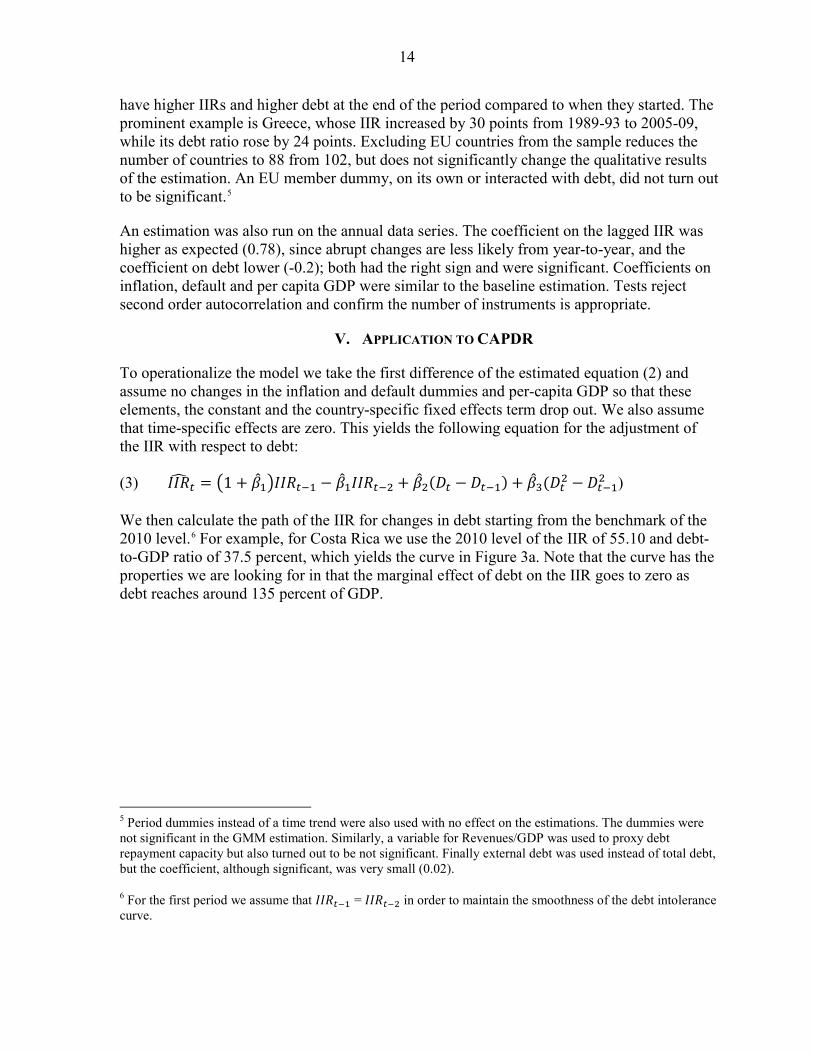
For example, for Costa Rica we use the 2010 level of the IIR of 55.10 and debt-to-GDP ratio of 37.5 percent, which yields the curve in Figure 3a. Note that the curve has the properties we are looking for in that the marginal effect of debt on the IIR goes to zero as debt reaches around 135 percent of GDP.
5 Period dummies instead of a time trend were also used with no effect on the estimations. The dummies were not significant in the GMM estimation. Similarly, a variable for Revenues/GDP was used to proxy debt repayment capacity but also turned out to be not significant. Finally external debt was used instead of total debt, but the coefficient, although significant, was very small (0.02).
6 For the first period we assume that 𝐼𝐼𝑅𝑡−1 = 𝐼𝐼𝑅𝑡−2 in order to maintain the smoothness of the debt intolerance curve.
15
Figure 3a. Costa Rica, Estimated Effect of Debt on the IIR
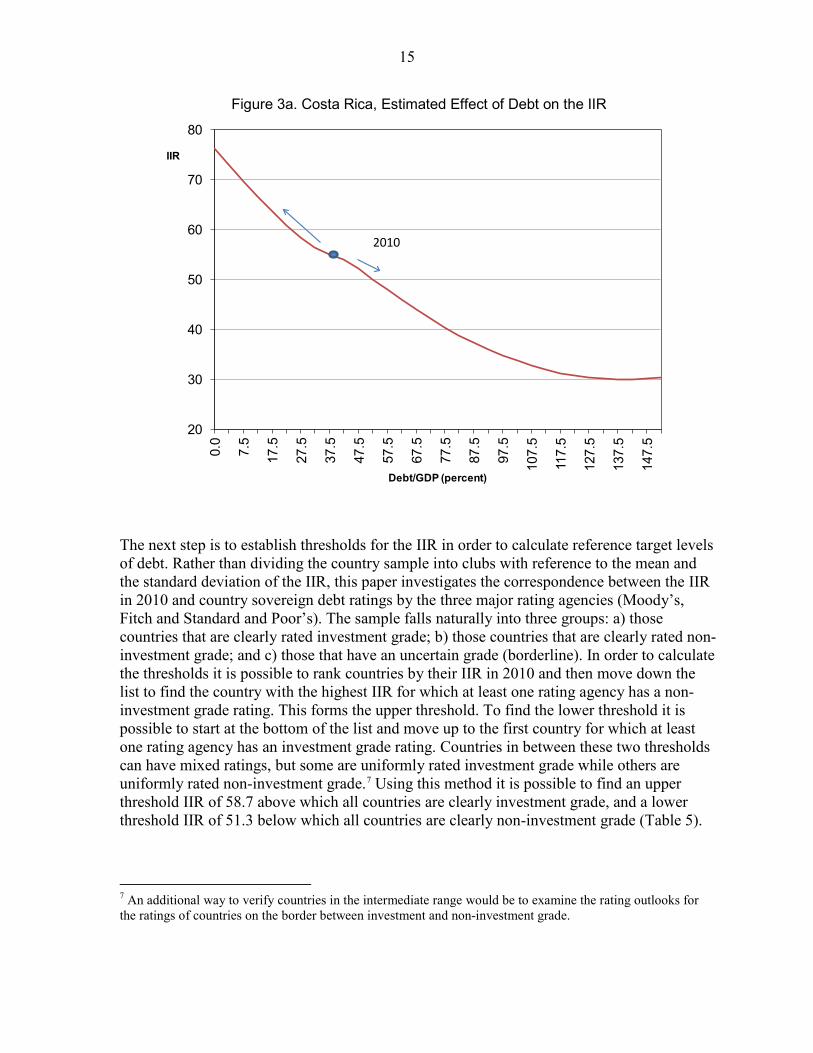
The next step is to establish thresholds for the IIR in order to calculate reference target levels of debt. Rather than dividing the country sample into clubs with reference to the mean and the standard deviation of the IIR, this paper investigates the correspondence between the IIR in 2010 and country sovereign debt ratings by the three major rating agencies (Moody’s, Fitch and Standard and Poor’s). The sample falls naturally into three groups: a) those countries that are clearly rated investment grade; b) those countries that are clearly rated non-investment grade; and c) those that have an uncertain grade (borderline). In order to calculate the thresholds it is possible to rank countries by their IIR in 2010 and then move down the list to find the country with the highest IIR for which at least one rating agency has a non-investment grade rating. This forms the upper threshold. To find the lower threshold it is possible to start at the bottom of the list and move up to the first country for which at least one rating agency has an investment grade rating. Countries in between these two thresholds can have mixed ratings, but some are uniformly rated investment grade while others are uniformly rated non-investment grade.7
7 An additional way to verify countries in the intermediate range would be to examine the rating outlooks for the ratings of countries on the border between investment and non-investment grade.
Using this method it is possible to find an upper threshold IIR of 58.7 above which all countries are clearly investment grade, and a lower threshold IIR of 51.3 below which all countries are clearly non-investment grade (Table 5).
20
30
40
50
60
70
80
0.0
7.5
17.5
27.5
37.5
47.5
57.5
67.5
77.5
87.5
97.5
107.
5
117.
5
127.
5
137.
5
147.
5
IIR
Debt/GDP (percent)
2010
16
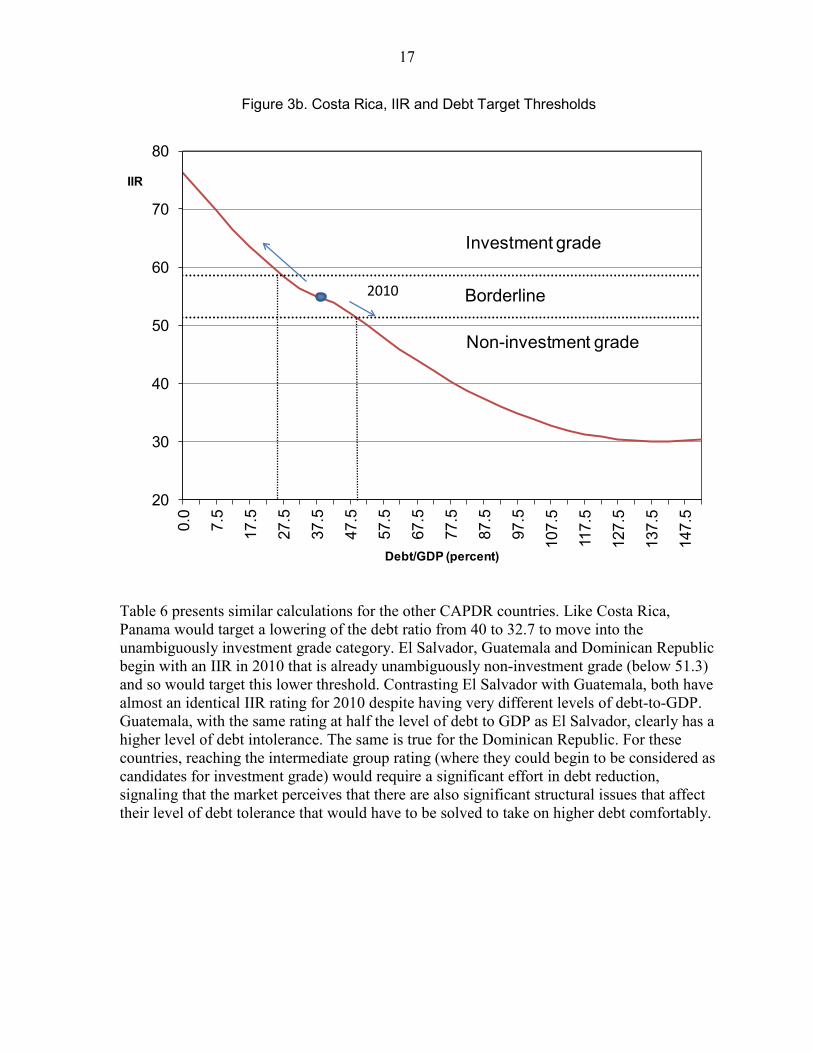
Applying these thresholds to the information in Figure 3a determines the debt ratio that Costa Rica would have to reach to be unambiguously investment grade (in this case 25.4 percent) or how much space it has to increase debt before becoming unambiguously non-investment grade (in this case raising debt to around 50 percent of GDP) (Figure 3b), holding all other determinants of debt intolerance constant.
IFS Country Fitch Moody's S&P IIR 2010178 Ireland A+ Aa2 AA- 67.50 184 Spain AA+ Aa1 AA 66.70 922 Russian Federation BBB Baa1 BBB 66.40 616 Botswana A2 A- 66.30 534 India BBB- Baa3 BBB- 64.60 182 Portugal AA- A1 A- 62.20 199 South Africa BBB+ A3 BBB+ 62.00 578 Thailand BBB Baa1 BBB+ 60.20 939 Estonia A A1 A 59.50 233 Colombia BB+ Ba1 BBB- 58.70 744 Tunisia BBB Baa2 BBB 58.50 293 Peru BBB- Baa3 BBB- 58.30 944 Hungary BBB Baa1 BBB- 56.90 283 Panama * BBB- Baa3 BBB- 56.90 536 Indonesia BB+ Ba2 BB 56.20 960 Croatia BBB- Baa3 BBB 55.60 186 Turkey BB+ Ba2 BB 55.30 686 Morocco BBB- Ba1 BBB- 55.20 238 Costa Rica * BB Baa3 BB 55.10 918 Bulgaria BBB- Baa3 BBB 54.40 946 Lithuania BBB Baa1 BBB 54.30 916 Kazakhstan BBB- Baa2 BBB- 54.00 672 Libya BBB+ A- 53.70 968 Romania BB+ Baa3 BB+ 51.40 566 Philippines BB Ba3 BB- 51.30 469 Egypt BB+ Ba1 BB+ 51.00 298 Uruguay BB Ba3 BB 50.10 582 Vietnam BB- Ba3 BB 47.90 941 Latvia BB+ Ba3 BB 47.30 439 Jordan Ba2 BB 45.80 253 El Salvador * BB Ba1 BB 45.50 258 Guatemala * BB+ Ba1 BB 45.30 174 Greece BB+ Ba1 BB+ 43.90 646 Gabon BB- BB- 42.20 666 Lesotho BB- 42.10 614 Angola B+ B1 B+ 41.30 243 Dominican Republic * B B1 B 40.80 746 Uganda B B+ 35.00
* CAPDR countryNotes: Shared ratings in borderline area are not investment grade.
Table 5. IIR and Credit Ratings
Unambiguously Investment Grade
Borderline
Unambiguously Non-Investment Grade
17
Figure 3b. Costa Rica, IIR and Debt Target Thresholds
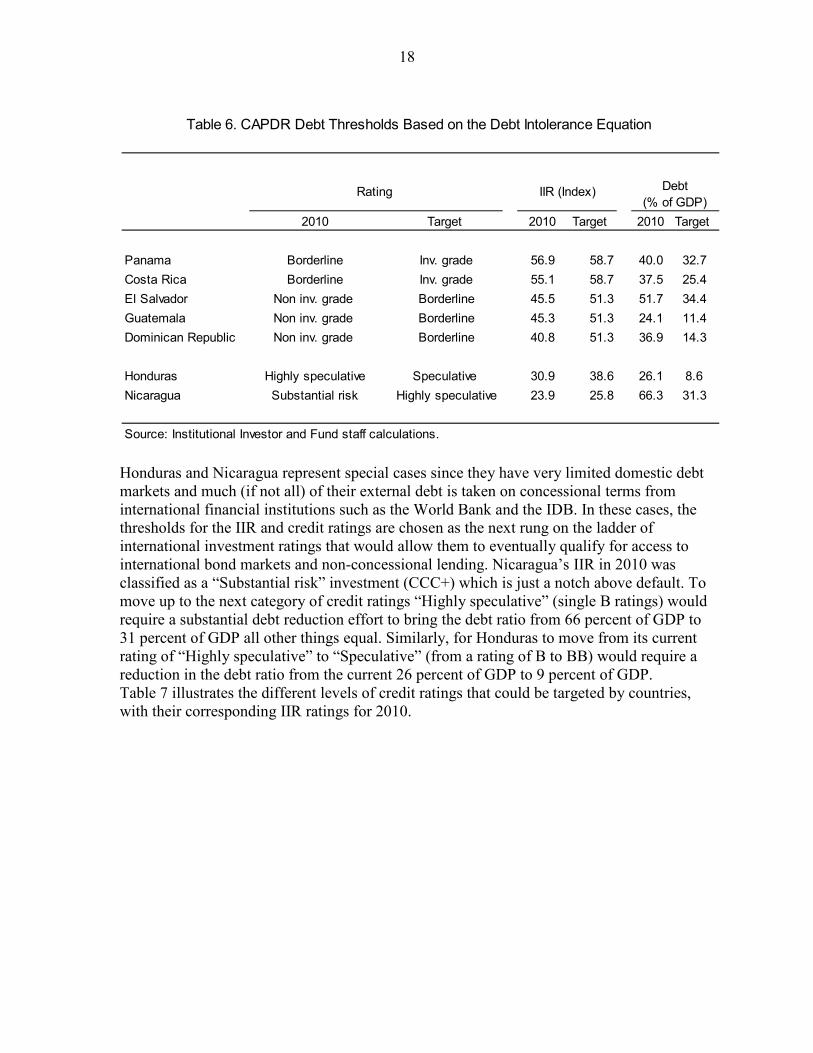
Table 6 presents similar calculations for the other CAPDR countries. Like Costa Rica, Panama would target a lowering of the debt ratio from 40 to 32.7 to move into the unambiguously investment grade category. El Salvador, Guatemala and Dominican Republic begin with an IIR in 2010 that is already unambiguously non-investment grade (below 51.3) and so would target this lower threshold. Contrasting El Salvador with Guatemala, both have almost an identical IIR rating for 2010 despite having very different levels of debt-to-GDP. Guatemala, with the same rating at half the level of debt to GDP as El Salvador, clearly has a higher level of debt intolerance. The same is true for the Dominican Republic. For these countries, reaching the intermediate group rating (where they could begin to be considered as candidates for investment grade) would require a significant effort in debt reduction, signaling that the market perceives that there are also significant structural issues that affect their level of debt tolerance that would have to be solved to take on higher debt comfortably.
20
30
40
50
60
70
80
0.0
7.5
17.5
27.5
37.5
47.5
57.5
67.5
77.5
87.5
97.5
107.
5
117.
5
127.
5
137.
5
147.
5
IIR
Debt/GDP (percent)
2010
Investment grade
Non-investment grade
Borderline
18
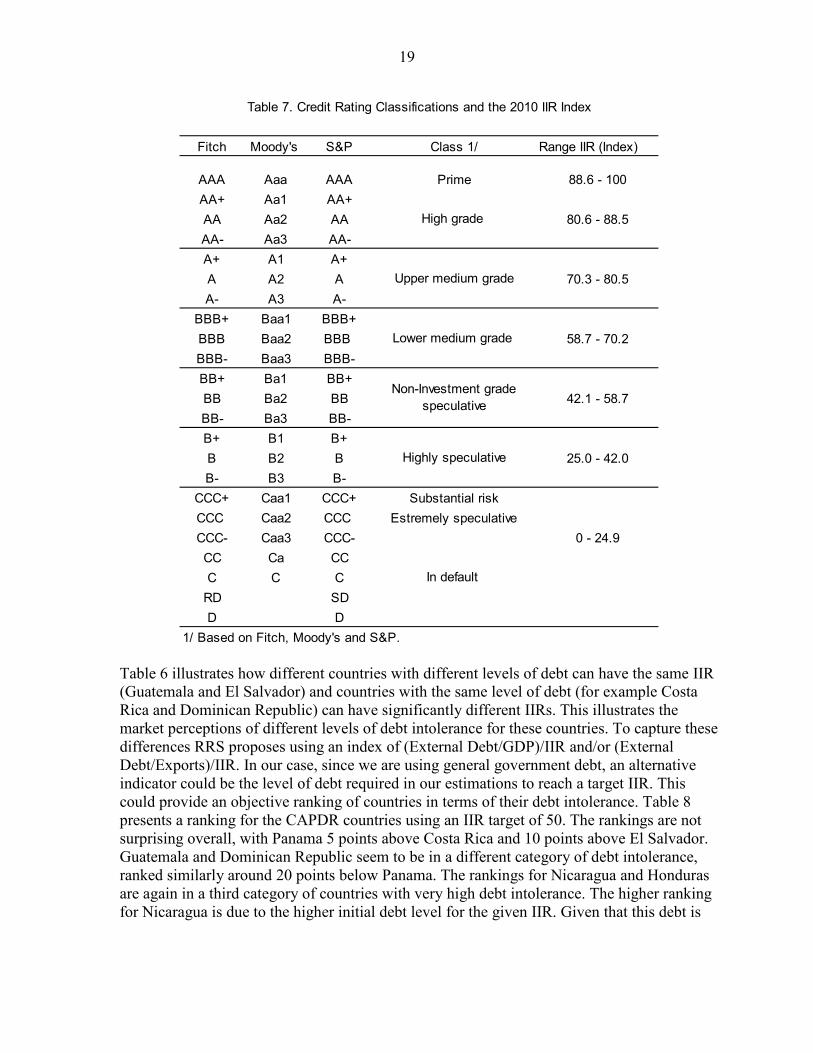
Honduras and Nicaragua represent special cases since they have very limited domestic debt markets and much (if not all) of their external debt is taken on concessional terms from international financial institutions such as the World Bank and the IDB. In these cases, the thresholds for the IIR and credit ratings are chosen as the next rung on the ladder of international investment ratings that would allow them to eventually qualify for access to international bond markets and non-concessional lending. Nicaragua’s IIR in 2010 was classified as a “Substantial risk” investment (CCC+) which is just a notch above default. To move up to the next category of credit ratings “Highly speculative” (single B ratings) would require a substantial debt reduction effort to bring the debt ratio from 66 percent of GDP to 31 percent of GDP all other things equal. Similarly, for Honduras to move from its current rating of “Highly speculative” to “Speculative” (from a rating of B to BB) would require a reduction in the debt ratio from the current 26 percent of GDP to 9 percent of GDP. Table 7 illustrates the different levels of credit ratings that could be targeted by countries, with their corresponding IIR ratings for 2010.
2010 Target 2010 Target 2010 Target
Panama Borderline Inv. grade 56.9 58.7 40.0 32.7Costa Rica Borderline Inv. grade 55.1 58.7 37.5 25.4El Salvador Non inv. grade Borderline 45.5 51.3 51.7 34.4Guatemala Non inv. grade Borderline 45.3 51.3 24.1 11.4Dominican Republic Non inv. grade Borderline 40.8 51.3 36.9 14.3
Honduras Highly speculative Speculative 30.9 38.6 26.1 8.6Nicaragua Substantial risk Highly speculative 23.9 25.8 66.3 31.3
Source: Institutional Investor and Fund staff calculations.
Debt (% of GDP)
Table 6. CAPDR Debt Thresholds Based on the Debt Intolerance Equation
Rating IIR (Index)
19
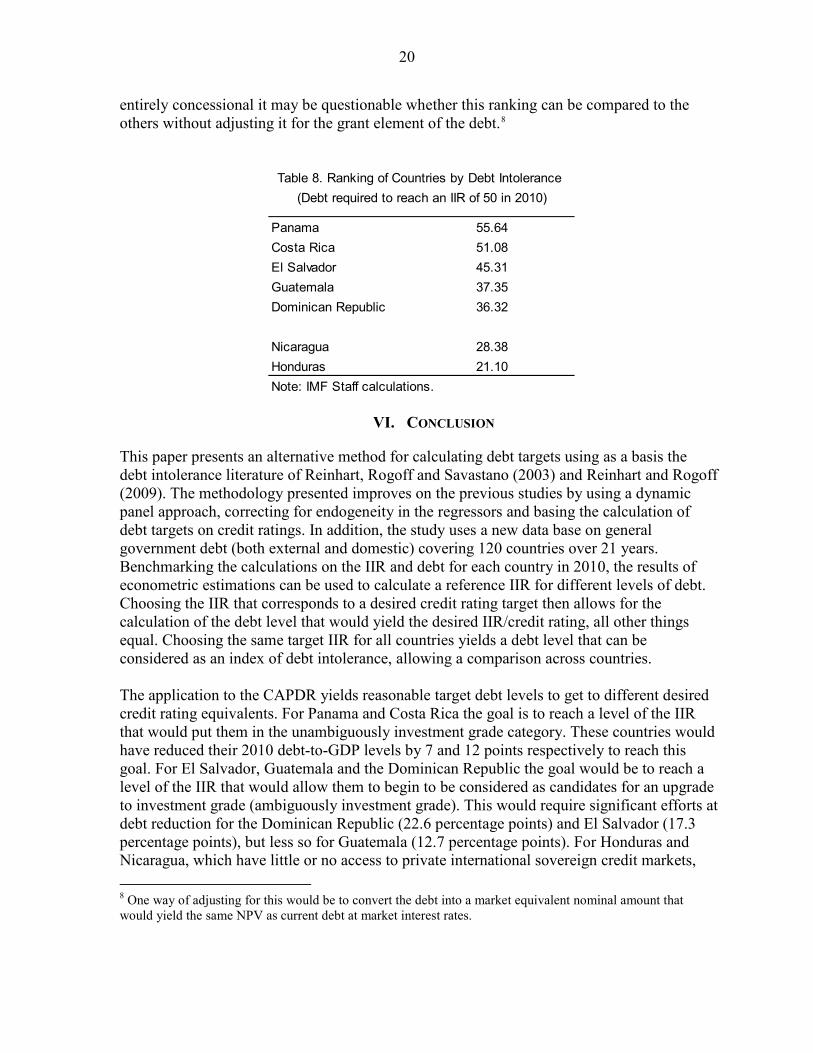
Table 6 illustrates how different countries with different levels of debt can have the same IIR (Guatemala and El Salvador) and countries with the same level of debt (for example Costa Rica and Dominican Republic) can have significantly different IIRs. This illustrates the market perceptions of different levels of debt intolerance for these countries. To capture these differences RRS proposes using an index of (External Debt/GDP)/IIR and/or (External Debt/Exports)/IIR. In our case, since we are using general government debt, an alternative indicator could be the level of debt required in our estimations to reach a target IIR. This could provide an objective ranking of countries in terms of their debt intolerance. Table 8 presents a ranking for the CAPDR countries using an IIR target of 50. The rankings are not surprising overall, with Panama 5 points above Costa Rica and 10 points above El Salvador. Guatemala and Dominican Republic seem to be in a different category of debt intolerance, ranked similarly around 20 points below Panama. The rankings for Nicaragua and Honduras are again in a third category of countries with very high debt intolerance. The higher ranking for Nicaragua is due to the higher initial debt level for the given IIR. Given that this debt is
Fitch Moody's S&P Class 1/ Range IIR (Index)
AAA Aaa AAA Prime 88.6 - 100AA+ Aa1 AA+ AA Aa2 AA 80.6 - 88.5AA- Aa3 AA-A+ A1 A+A A2 A 70.3 - 80.5A- A3 A-
BBB+ Baa1 BBB+BBB Baa2 BBB 58.7 - 70.2BBB- Baa3 BBB-BB+ Ba1 BB+BB Ba2 BB 42.1 - 58.7BB- Ba3 BB-B+ B1 B+B B2 B 25.0 - 42.0B- B3 B-
CCC+ Caa1 CCC+ Substantial riskCCC Caa2 CCC Estremely speculativeCCC- Caa3 CCC- 0 - 24.9CC Ca CCC C C
RD SDD D
1/ Based on Fitch, Moody's and S&P.
In default
High grade
Upper medium grade
Lower medium grade
Non-Investment grade speculative
Highly speculative
Table 7. Credit Rating Classifications and the 2010 IIR Index
20
entirely concessional it may be questionable whether this ranking can be compared to the others without adjusting it for the grant element of the debt.8
VI. CONCLUSION
This paper presents an alternative method for calculating debt targets using as a basis the debt intolerance literature of Reinhart, Rogoff and Savastano (2003) and Reinhart and Rogoff (2009). The methodology presented improves on the previous studies by using a dynamic panel approach, correcting for endogeneity in the regressors and basing the calculation of debt targets on credit ratings. In addition, the study uses a new data base on general government debt (both external and domestic) covering 120 countries over 21 years. Benchmarking the calculations on the IIR and debt for each country in 2010, the results of econometric estimations can be used to calculate a reference IIR for different levels of debt. Choosing the IIR that corresponds to a desired credit rating target then allows for the calculation of the debt level that would yield the desired IIR/credit rating, all other things equal. Choosing the same target IIR for all countries yields a debt level that can be considered as an index of debt intolerance, allowing a comparison across countries. The application to the CAPDR yields reasonable target debt levels to get to different desired credit rating equivalents. For Panama and Costa Rica the goal is to reach a level of the IIR that would put them in the unambiguously investment grade category. These countries would have reduced their 2010 debt-to-GDP levels by 7 and 12 points respectively to reach this goal. For El Salvador, Guatemala and the Dominican Republic the goal would be to reach a level of the IIR that would allow them to begin to be considered as candidates for an upgrade to investment grade (ambiguously investment grade). This would require significant efforts at debt reduction for the Dominican Republic (22.6 percentage points) and El Salvador (17.3 percentage points), but less so for Guatemala (12.7 percentage points). For Honduras and Nicaragua, which have little or no access to private international sovereign credit markets, 8 One way of adjusting for this would be to convert the debt into a market equivalent nominal amount that would yield the same NPV as current debt at market interest rates.
Panama 55.64Costa Rica 51.08El Salvador 45.31Guatemala 37.35Dominican Republic 36.32
Nicaragua 28.38Honduras 21.10Note: IMF Staff calculations.
(Debt required to reach an IIR of 50 in 2010)Table 8. Ranking of Countries by Debt Intolerance
21
the goal is to get to a rating that would allow them to begin to consider some kind of limited market access. However, the reference numbers calculated here would have to be adjusted for the level of concessionality of their general debt to make them comparable to the other countries in the region. It should be noted that the analysis here holds all other factors that affect debt intolerance fixed, and relies solely on changes in the level of debt-to-GDP to improve the market’s perception of debt intolerance as embodied in the IIR. It is conceivable, and advisable, that countries work on these other aspects as well to improve their debt tolerance. In our econometric equations, these are embodied in the inflation (macroeconomic stability), default, and per-capita GDP variables, which are highly aggregated indicators for complex factors such as institutional capacity and allocative and technical efficiency that affect a countries capacity to convert debt into growth and enhance its repayment capacity. A first step in this analysis would be to develop an index of debt intolerance that would be comparable across countries for a particular point in time. This paper proposes such an index, calculated as the level of debt required in each country to reach a given level of the IIR (in our case an IIR of 50). When implemented for the CAPDR region it shows that countries with divergent debt levels and IIRs can have similar levels of debt intolerance. Further work is required to explain the differences in these debt intolerance rankings, to see what other countries might be considered peers for CAPDR in terms of debt intolerance, and to investigate the characteristics that affect debt intolerance most directly.
22
REFERENCES
Abbas, S. Ali, Nazim Belhocine, Asmaa ElGanainy, and Mark Horton, 2010, “A Historical Public Debt Database,” Working Paper 10/245 (Washington, International Monetary Fund).
Aiyagari, S. Rao, and Ellen R. McGrattan, 1998, “The Optimum Quantity of Debt,” Journal
of Monetary Economics, Vol. 42 (3), pp. 447–469. Arellano, M., and S. Bond, 1991, “Some Tests of Specification for Panel Data: Monte Carlo
Evidence and an Application to Employment Equations,” Review of Economic Studies, Vol. 58, pp. 277297.
–––––, and O. Bover, 1995, “Another Look at the Instrumental Variables Estimation of Error
Components Models,” Journal of Econometrics, Vol. 68, pp. 29–51. Baltagi, B. H., 2005, Econometric Analysis of Panel Data, (New York: John Wiley and Sons
Ltd) Caner, Mehmet, Thomas Grennes, and Fritzi Koehler-Geib, 2010, “Finding the Tipping
Point-When Sovereign Debt Turns Bad,” World Bank Policy Research Working Paper No. 5391, World Bank, Washington DC.
Di Bella, Gabriel, 2008, “A Stochastic Framework for Public Debt Sustainability Analysis,”
Working Paper 08/58 (Washington, International Monetary Fund). Everaert, Greetje, 2008, “Kenya: Selected Issues Paper, IMF Country Report No. 08/337
(Washington: International Monetary Fund). Floden, Martin, 2001, “The Effectiveness of Government Debt and Transfers as Insurance,”
Journal of Monetary Economics 48 (2001) pp. 81–108. Hansen, Bruce E., 2000, “Sample Splitting and Threshold Estimation,” Econometrica,
Vol. 68 No. 3 (May, 2000), pp 575–603. International Monetary Fund, 2003, “Public Debt in Emerging Markets, Is it too high?”
World Economic Outlook, September 2003, Chapter 3,World Economic and Financial Surveys (Washington)
–––––, 2008, “Fiscal Policy as a Countercyclical Tool,” World Economic Outlook, October
2008, Chapter 5, World Economic and Financial Surveys (Washington) –––––, 2009, “From Recession to Recovery: How soon and how strong?” World Economic
Outlook, April 2009, Chapter 3, World Economic and Financial Surveys (Washington)
23
Kumar, Manmohan S., and Jaejoon Woo, 2010, “Public Debt and Growth,” Working Paper 10/174 (Washington, International Monetary Fund).
Ostry, Jonathan D. Atish R. Ghosh, Jun I Kim, and Mahvash S. Qureshi, 2010, “Fiscal
Space.” IMF Staff Position Note 10/11 (Washington: International Monetary Fund). Reinhart, Carmen M., Kenneth S. Rogoff, and Miguel A. Savastano, 2003. “Debt
Intolerance,” Brookings Papers on Economic Activity, I:2003 (Washington: Brookings Institution).
Reinhart, Carmen M., and Kenneth S. Rogoff, 2009, This Time is Different; Eight Centuries
of Financial Folly, Princeton University Press. –––––, 2010, “Growth in a Time of Debt,” prepared for the American Economic Review
Papers and Proceedings. Roodman, David, 2006, “How to do xtabond2: An Introduction to “Difference” and
“System” GMM in Stata,” Working Paper No. 103, Center for Global Development, Washington.
Saint-Paul, Gilles, 2005, “Fiscal Policy and Economic Growth: the Role of Financial
Intermediation,” Review of International Economics, 13(3), pp. 612-629. Shin, Yongseok, 2006, “Ramsey Meets Bewley: Optimal Government Financing with
Incomplete Markets,” Department of Economics, University of Wisconsin. Topalova, Petia, and Dan Nyberg, 2009, “What Level of Public Debt Could India Target?”
Working Paper 10/7 (Washington: International Monetary Fund). Weh-Sol, Moon, 2010, “Korea’s Optimal Public Debt Ratio,” SERI Quarterly, April 2010,
Samsung Economic Research Institute, Seoul.