Embed Size (px)
Citation preview
A Data Viewer for Stream-Sediment and Surface-Water Chemistry, Geology, and Geography of the Humboldt River Basin, Northern Nevada
Bulletin 2210-F
U.S. Department of the Interior U.S. Geological Survey
A Data Viewer for Stream-Sediment and Surface-Water Chemistry, Geology, and Geography of the Humboldt River Basin, Northern Nevada
By Douglas B. Yager and Helen W. Folger
Chapter F ofGeoenvironmental Investigations of the Humboldt River Basin, Northern NevadaEdited by Lisa L. Stillings
Bulletin 2210-F
U.S. Department of the InteriorU.S. Geological Survey
U.S. Department of the InteriorGale A. Norton, Secretary
U.S. Geological SurveyP. Patrick Leahy, Acting Director
U.S. Geological Survey, Reston, Virginia: 2005Version 1.0
Any use of trade, product, or firm names in this publication is for descriptive purposes only and does not imply endorsement by the U.S. Government.
Although this report is in the public domain, permission must be secured from the individual copyright owners to reproduce any copyrighted materials contained within this report.
For more information on the USGS—the Federal source for science about the Earth, its natural and living resources, natural hazards, and the environment: World Wide Web: http://www.usgs.gov/ Telephone: 1-888-ASK-USGS
This publication is available online at URL: http://pubs.usgs.gov/bul/b2210-f/
For information on other USGS products and ordering information: World Wide Web: http://www.usgs.gov/pubprod/ Telephone: 1-888-ASK-USGS
Suggested citation:Yager, D.B., and Folger, H.W., 2005, A data viewer for stream-sediment and surface-water chemistry, geolgoy, and geography of the Humboldt River basin, northern Nevada, chap. F of Stillings, L.L., ed., Geoenvironmental investiga-tions of the Humboldt River basin, northern Nevada: U.S. Geological Survey Bulletin 2210-F, 9 p., available at URL <http://pubs.usgs.gov/bul/b2210-f/>.
Preface
Northern Nevada is one of the world’s foremost regions of gold production. The Humboldt River Basin (HRB) covers 43,500 km2 in northern Nevada (Crompton, 1995), and it is home to approxi-mately 18 active gold and silver mines (Driesner and Coyner, 2001) among at least 55 significant metallic mineral deposits (Long and others, 1998). Many of the gold mines are along the Carlin trend in the east-central portion of the HRB, and together they have produced 50 million ounces of gold from 1962 (when the Carlin mine first opened) through April 2002 (Nevada Mining Asso-ciation, 2002). Mining is not new to the region, however. Beginning in 1849, mining has taken place in numerous districts that cover 39 percent of the land area in the HRB (Tingley, 1998). In addition to gold and silver, As, Ba, Cu, Fe, Hg, Li, Mn, Mo, Pb, S, Sb, V, W, Zn, and industrial commodities such as barite, limestone, fluorite, sand and gravel, gypsum, gemstones, pumice, zeolites, and building stone, have been extracted from the HRB (McFaul and others, 2000).
Due to the large amount of historical and recent mining in the HRB, the Bureau of Land Manage-ment (BLM) in Nevada asked the U.S. Geological Survey (USGS) Mineral Resources Program to conduct a series of mineral-deposit-related environmental studies in the HRB. BLM required data and geoenvironmental interpretations regarding (1) the chemical composition of water, soil, sediment, and mine waste in the HRB, (2) the natural background chemistry of these materials, and (3) how mining activities may have altered their chemistry. The paper that follows describes one of the studies conducted by the USGS Minerals Program to answer these and similar ques-tions.
All papers within this series of investigations can be found as lettered chapters of USGS Bulletin 2210, Geoenvironmental Investigations of the Humboldt River Basin, Northern Nevada. Each chapter is available separately online.
References Cited
Crompton, E.J., 1995, Potential hydrologic effects of mining in the Humboldt River Basin, northern Nevada: U.S. Geological Survey Water Resources Investigations Report 94-4233, 2 sheets.
Driesner, D., and Coyner, A., 2001, Major mines of Nevada 2000: Mineral industries in Nevada’s economy: Nevada Bureau of Mines and Geology Special Publication P-12, 28 p.
Long, K.R., DeYoung, J.H., Jr., and Ludington, S.D., 1998, Significant deposits of gold, silver, copper, lead, and zinc in the United States: U.S. Geological Survey Open-File Report 98-206A, 33 p. [USGS Open-File Report 98-206B contains one 3.5-inch diskette].
McFaul, E.J., Mason G.T., Jr., Ferguson, W.B., and Lipin, B.R., 2000, U.S. Geological Survey mineral databases—MRDS and MAS/MILS: U.S. Geological Survey Digital Data Series DDS-52, two CD-ROMs.
Nevada Mining Association, 2002, Industry to celebrate 50 millionth ounce of gold: Nevada Mining Association News Release, April 11, 2002.
Tingley, J.V., 1998, Mining districts of Nevada (2nd ed.): Nevada Bureau of Mines and Geol-ogy Report 47d, one CD-ROM.
iii
Contents
Preface ...........................................................................................................................................................iiiIntroduction.....................................................................................................................................................1GIS Terminology .............................................................................................................................................1Themes and Databases Included as Part of the Data Viewer ...............................................................1
Geologic and Mining-Related Themes ..............................................................................................1Geology of Northern Nevada .....................................................................................................1Significant Mineral Deposits in Nevada ..................................................................................1Mineral Favorability Tracts .........................................................................................................2Mill, Smelter, and Fluvial Tailings Locations ............................................................................3
Geochemical Themes...........................................................................................................................3Data Sets for Sediment and Soil Chemistry ............................................................................3Surface-Water-Chemistry Theme and Database ...................................................................4
Geographic Themes .............................................................................................................................4Use of ArcExplorer to View Humboldt River Basin Data Sets ................................................................4
ArcExplorer Software...........................................................................................................................4ArcExplorer Functionality ....................................................................................................................4
Open ArcExplorer Project File ...................................................................................................4Add Theme ....................................................................................................................................5Query Tool .....................................................................................................................................5Identify ...........................................................................................................................................6Map Tips ........................................................................................................................................6
Use of MapSheetsExpress to View Humboldt Basin Data Sets.............................................................6MapSheetsExpress Software .............................................................................................................6MapSheetsExpress Functionality ......................................................................................................6
Swiper ...........................................................................................................................................6Transparency ................................................................................................................................6Pop-Up Label ................................................................................................................................7Legend ...........................................................................................................................................7Layer and Map Views ..................................................................................................................7
Example of Using MapSheetsExpress to View Humboldt River Basin Data Sets ......................7Acknowledgments .........................................................................................................................................7References ......................................................................................................................................................8Appendix A—System Requirements ..........................................................................................................9
Figure
1. Organization of data ...................................................................................................................5
iv
Tables
1. Names and descriptions of vector data sets included with the Humboldt River basin data viewer ...........................................................................................2
2. Raster digital terrain coverage, NURE geochemical contour maps, and mineral favorability tracts for the Humboldt River basin and vicinity ........................3
3. Compilation of surface-water chemistry for the Humboldt River basin, northern Nevada, for samples collected from June 28, 1989, through August 1, 2000
[Excel file table_3.xls downloadable from DATA\WATER_DATA\Spreadsheet directory]
Note Regarding Downloading Files
A user may install the entire contents of this report on their personal computer including the text, GIS data viewing software, GIS vector and image data, readme file, and metadata by downloading the “viewer.zip” file from the “B2210-F Downloads” link on the front page of this Web site. Note that, once the entire contents of the B2210_F.zip file are extracted, the directory structure should not change, as some files are dependent on established directory paths in order to function properly.
Additional information on the mineral and environmental assessments done by the U.S. Geological Survey may be found at the following URLs.
http://pubs.usgs.gov/mf/2003/mf-2407/#MF2407M http://pubs.usgs.gov/bul/b2210-a/ http://pubs.usgs.gov/bul/b2210-c/ http://pubs.usgs.gov/bul/b2210-d/ http://pubs.usgs.gov/bul/b2210-e/ http://pubs.usgs.gov/of/2004/1245/plu-FAQ.htm
v
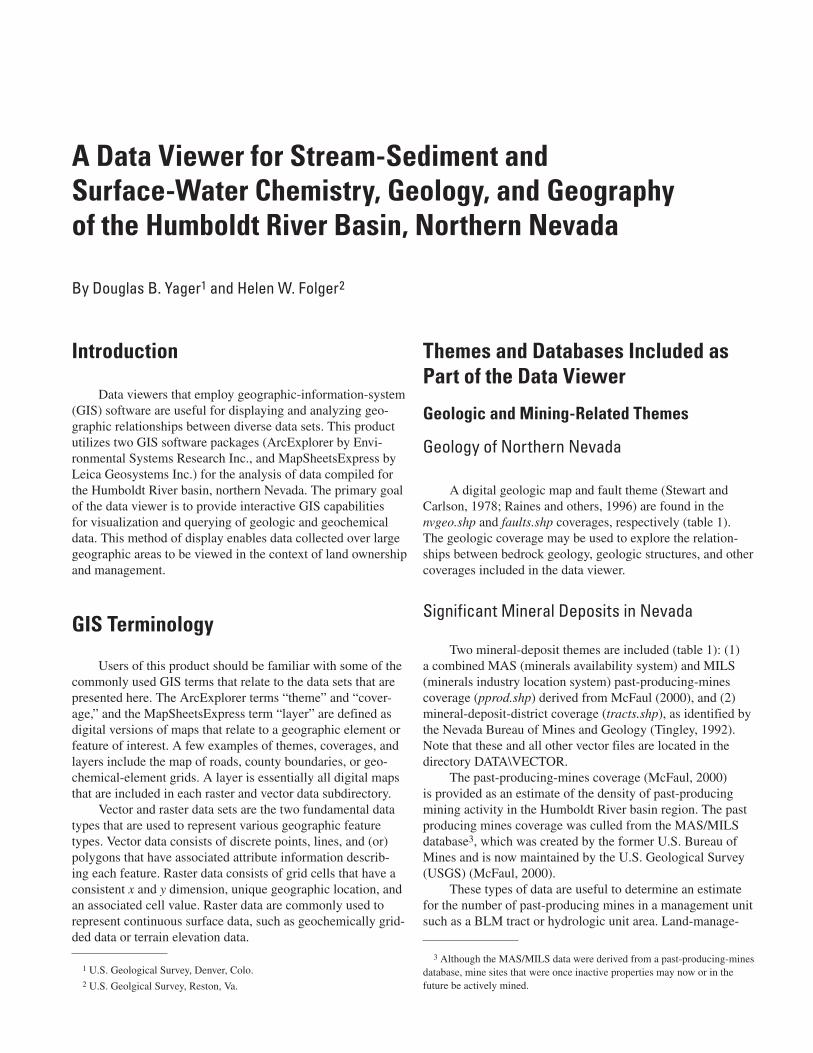
Introduction
Data viewers that employ geographic-information-system (GIS) software are useful for displaying and analyzing geo-graphic relationships between diverse data sets. This product utilizes two GIS software packages (ArcExplorer by Envi-ronmental Systems Research Inc., and MapSheetsExpress by Leica Geosystems Inc.) for the analysis of data compiled for the Humboldt River basin, northern Nevada. The primary goal of the data viewer is to provide interactive GIS capabilities for visualization and querying of geologic and geochemical data. This method of display enables data collected over large geographic areas to be viewed in the context of land ownership and management.
GIS Terminology
Users of this product should be familiar with some of the commonly used GIS terms that relate to the data sets that are presented here. The ArcExplorer terms “theme” and “cover-age,” and the MapSheetsExpress term “layer” are defined as digital versions of maps that relate to a geographic element or feature of interest. A few examples of themes, coverages, and layers include the map of roads, county boundaries, or geo-chemical-element grids. A layer is essentially all digital maps that are included in each raster and vector data subdirectory.
Vector and raster data sets are the two fundamental data types that are used to represent various geographic feature types. Vector data consists of discrete points, lines, and (or) polygons that have associated attribute information describ-ing each feature. Raster data consists of grid cells that have a consistent x and y dimension, unique geographic location, and an associated cell value. Raster data are commonly used to represent continuous surface data, such as geochemically grid-ded data or terrain elevation data.
Themes and Databases Included as Part of the Data Viewer
Geologic and Mining-Related Themes
Geology of Northern Nevada
A digital geologic map and fault theme (Stewart and Carlson, 1978; Raines and others, 1996) are found in the nvgeo.shp and faults.shp coverages, respectively (table 1). The geologic coverage may be used to explore the relation-ships between bedrock geology, geologic structures, and other coverages included in the data viewer.
Significant Mineral Deposits in Nevada
Two mineral-deposit themes are included (table 1): (1) a combined MAS (minerals availability system) and MILS (minerals industry location system) past-producing-mines coverage (pprod.shp) derived from McFaul (2000), and (2) mineral-deposit-district coverage (tracts.shp), as identified by the Nevada Bureau of Mines and Geology (Tingley, 1992). Note that these and all other vector files are located in the directory DATA\VECTOR.
The past-producing-mines coverage (McFaul, 2000) is provided as an estimate of the density of past-producing mining activity in the Humboldt River basin region. The past producing mines coverage was culled from the MAS/MILS database3, which was created by the former U.S. Bureau of Mines and is now maintained by the U.S. Geological Survey (USGS) (McFaul, 2000).
These types of data are useful to determine an estimate for the number of past-producing mines in a management unit such as a BLM tract or hydrologic unit area. Land-manage-
A Data Viewer for Stream-Sediment and Surface-Water Chemistry, Geology, and Geography of the Humboldt River Basin, Northern Nevada
By Douglas B. Yager1 and Helen W. Folger2
1 U.S. Geological Survey, Denver, Colo.2 U.S. Geolgical Survey, Reston, Va.
3 Although the MAS/MILS data were derived from a past-producing-mines database, mine sites that were once inactive properties may now or in the future be actively mined.
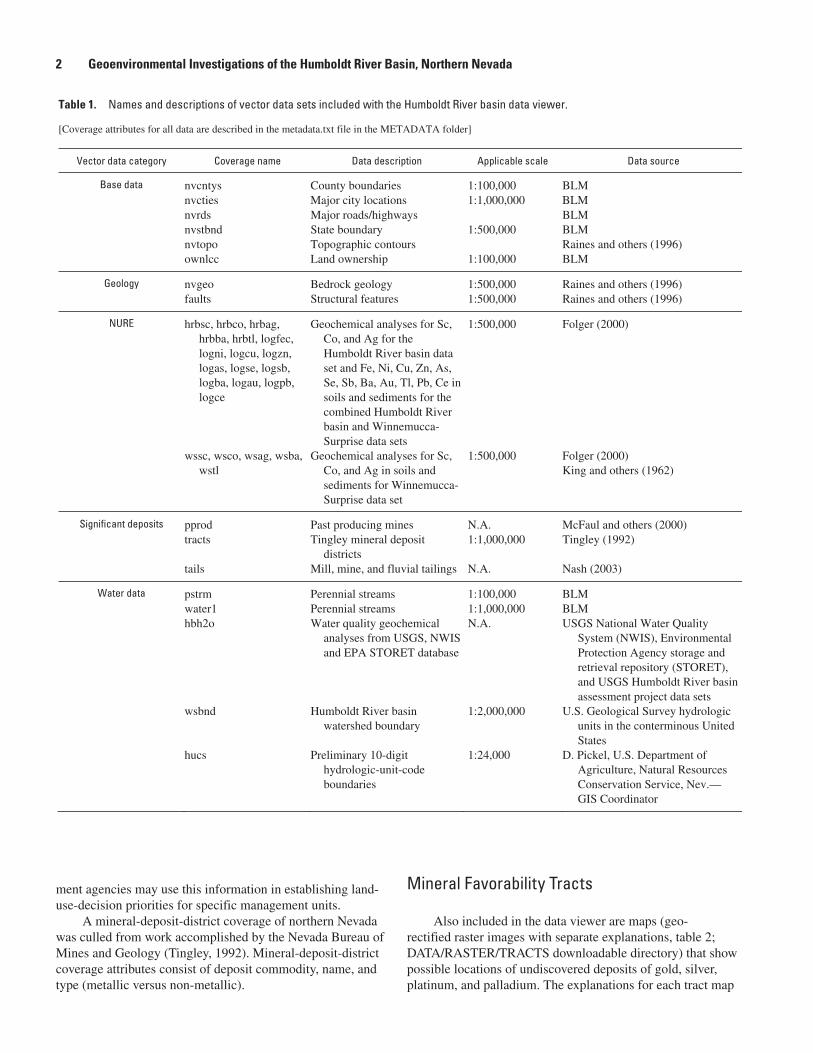
ment agencies may use this information in establishing land-use-decision priorities for specific management units.
A mineral-deposit-district coverage of northern Nevada was culled from work accomplished by the Nevada Bureau of Mines and Geology (Tingley, 1992). Mineral-deposit-district coverage attributes consist of deposit commodity, name, and type (metallic versus non-metallic).
Mineral Favorability Tracts
Also included in the data viewer are maps (geo-rectified raster images with separate explanations, table 2; DATA/RASTER/TRACTS downloadable directory) that show possible locations of undiscovered deposits of gold, silver, platinum, and palladium. The explanations for each tract map
Table 1. Names and descriptions of vector data sets included with the Humboldt River basin data viewer.
[Coverage attributes for all data are described in the metadata.txt file in the METADATA folder]
Vector data category Coverage name Data description Applicable scale Data source
Base data nvcntys County boundaries 1:100,000 BLMnvcties Major city locations 1:1,000,000 BLMnvrds Major roads/highways BLMnvstbnd State boundary 1:500,000 BLMnvtopo Topographic contours Raines and others (1996) ownlcc Land ownership 1:100,000 BLM
Geology nvgeo Bedrock geology 1:500,000 Raines and others (1996) faults Structural features 1:500,000 Raines and others (1996)
NURE hrbsc, hrbco, hrbag, hrbba, hrbtl, logfec, logni, logcu, logzn, logas, logse, logsb, logba, logau, logpb, logce
Geochemical analyses for Sc, Co, and Ag for the Humboldt River basin data set and Fe, Ni, Cu, Zn, As, Se, Sb, Ba, Au, Tl, Pb, Ce in soils and sediments for the combined Humboldt River basin and Winnemucca-Surprise data sets
1:500,000 Folger (2000)
wssc, wsco, wsag, wsba, wstl
Geochemical analyses for Sc, Co, and Ag in soils and sediments for Winnemucca-Surprise data set
1:500,000 Folger (2000) King and others (1962)
Significant deposits pprod Past producing mines N.A. McFaul and others (2000) tracts Tingley mineral deposit
districts1:1,000,000 Tingley (1992)
tails Mill, mine, and fluvial tailings N.A. Nash (2003)
Water data pstrm Perennial streams 1:100,000 BLMwater1 Perennial streams 1:1,000,000 BLMhbh2o Water quality geochemical
analyses from USGS, NWIS and EPA STORET database
N.A. USGS National Water Quality System (NWIS), Environmental Protection Agency storage and retrieval repository (STORET), and USGS Humboldt River basin assessment project data sets
wsbnd Humboldt River basin watershed boundary
1:2,000,000 U.S. Geological Survey hydrologic units in the conterminous United States
hucs Preliminary 10-digithydrologic-unit-code boundaries
1:24,000 D. Pickel, U.S. Department of Agriculture, Natural Resources Conservation Service, Nev.— GIS Coordinator
� Geoenvironmental Investigations of the Humboldt River Basin, Northern Nevada
are located in the DATA/RASTER/ TRACTS /explanations directory and are stored as JPEG images (plu_expl.jpg, sed_expl.jpg, and vol_expl.jpg). The explanations are opened with any image viewer that supports the JPEG format.
These maps were developed as part of the USGS assess-ment of metallic mineral resources, Humboldt River basin, northern Nevada (Wallace and others, 2004). The assessment focused on mineral deposits and geologic environments that were known to contain these elements—they are economically important commodities in the Humboldt River basin at present and may be important commodities in the near future.
The mineral resource assessment used a combination of expert (knowledge-based) and geographic-information-system data-analysis methods to potentially identify three types of mineral deposits: (1) multielement deposits related to plutonic rocks, (2) gold-silver deposits in sedimentary rocks, and (3) gold-silver deposits that formed in near-surface, epithermal environments. U.S. Geological Survey geologists used their knowledge and expertise to compile and develop geologi-cal, geophysical, geochemical, and mineral-deposit data that was pertinent to the assessment. The data were then analyzed and modeled in a geographic information system (GIS) using weights-of-evidence and weighted logistic regression techniques to produce maps showing areas of varying degrees of favor-ability for the occurrence of the three types of undiscovered deposits (plu.jpg, vol.jpg, and sed.jpg). The areas with the highest likelihood of containing undiscovered deposits were classified as “prospective,” (colored red) and those with the next highest likelihood were classified as “favorable” (colored yel-low). “Permissive” (colored purple) areas are the broadest and most general category, and all undiscovered deposits are likely to occur in these areas. The dark-gray areas represent tracts that have an overburden thickness of greater than 1 km and are thus “nonpermissive.” White areas are nonpermissive because they do not meet any minimum criteria for hosting a deposit type.
Mill, Smelter, and Fluvial Tailings Locations
The coverage tails (table 1) includes point locations for mine-related sites such as smelters, mills, and fluvial tail-ings. Data were compiled during the U.S. Geological Survey Humboldt River watershed environmental assessment (Nash, 2003).
Geochemical Themes
Data Sets for Sediment and Soil Chemistry
Geochemical analyses of stream-sediment and soil samples collected by the NURE (National Uranium Resource Evaluation) program and the U.S. Geological Survey are integrated both as point coverages of log-transformed data (vector data sets, table 1) and as images of gridded and nor-malized data (raster data sets, table 2). The data sets contain updated and new chemical analyses of the original NURE samples and analysis of additional stream sediments col-lected by the USGS (King and others, 1996; Folger, 2000). These new analyses were completed during the period 1995 to 2000 specifically to provide a regional and analytically consistent geochemical data set for the mineral and envi-ronmental assessment on public lands. The sample coverage for the Humboldt River basin is generally spatially uniform with a sample density of one sample site per 17 km2 . Sample density is greatest along range fronts and sparsest along mountain ridges and valley bottoms.
These NURE data sets are useful for evaluating rela-tionships between water and sediment chemistry, as well as identifying areas that may warrant further mineral exploration (Folger, 2000, Yager and Folger; 2003).
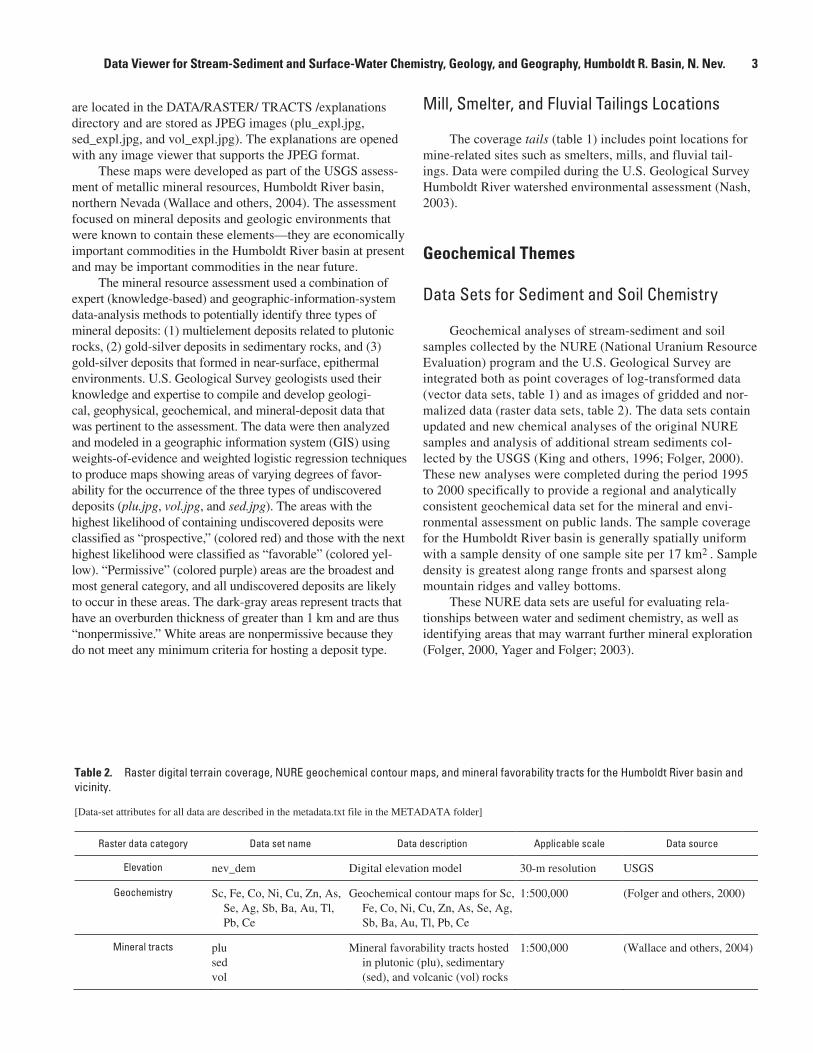
Table 2. Raster digital terrain coverage, NURE geochemical contour maps, and mineral favorability tracts for the Humboldt River basin andvicinity.
[Data-set attributes for all data are described in the metadata.txt file in the METADATA folder]
Raster data category Data set name Data description Applicable scale Data source
Elevation nev_dem Digital elevation model 30-m resolution USGS
Geochemistry Sc, Fe, Co, Ni, Cu, Zn, As, Se, Ag, Sb, Ba, Au, Tl, Pb, Ce
Geochemical contour maps for Sc, Fe, Co, Ni, Cu, Zn, As, Se, Ag, Sb, Ba, Au, Tl, Pb, Ce
1:500,000 (Folger and others, 2000)
Mineral tracts plusedvol
Mineral favorability tracts hosted in plutonic (plu), sedimentary (sed), and volcanic (vol) rocks
1:500,000 (Wallace and others, 2004)
Data Viewer for Stream-Sediment and Surface-Water Chemistry, Geology, and Geography, Humboldt R. Basin, N. Nev. �
Surface-Water-Chemistry Theme and Database
The water-chemistry data set contains chemical analyses from samples of surface water collected by the U.S. Geologi-cal Survey in and near the Humboldt River basin between 1997 and 2000, U.S. Geological Survey Water Resources National Water Information System (NWIS), and the Environ-mental Protection Agency’s STORET database. More than 60 analytical parameters are reported for 2,133 records, including pH, alkalinity, and conductivity. Also included are surface-water analyses of dissolved and total recoverable major- and trace-elements for locations in and near the Humboldt River basin.4 These data were combined into a single database (hbh2o.shp) (table 1).
A difference in sample density from one area to another is the result of sparse sampling, and the lack of surface flow.
Hydrologic coverages include rivers and streams (pstrm.shp, water1.shp) and the Humboldt River watershed boundary (wsbnd.shp). The user should note that small-scale (coarse resolution) 1:100,000- and 1:500,000-scale stream-drainage coverages provided with this data viewer do not include all of the first-order streams, or intermittent, and ephemeral drainages that have been sampled by USGS person-nel. Thus, locations of some sample sites do not correspond with stream locations. In addition, 10-digit hydrologic-unit-code boundaries (hucs.shp) provided by the Natural Resource Conservation Service are also included for the purpose of helping to delineate watershed-management areas (D. Pickel, 2003, written commun.).
An Excel spreadsheet of the water data is included as part of this report (table_3.xls that is downloadable from direc-tory DATA\WATER_DATA\Spreadsheet). The spreadsheet is included as a reference for significant-figure and detection-limit analytical issues as they relate to (1) a specific element analyzed and (2) a specific agency that originally acquired and analyzed the data—these agencies may have employed several different laboratories and analytical methods.
Geographic Themes
Several coverages are provided as a geographic frame of reference for the other databases (table 1). These cover-ages include land ownership (ownlcc.shp), county and State boundaries (nvcntys.sh and nvstbnd.shp, respectively), cities (nvcties.shp), and major roads (nvrds.shp). A hill-shaded-relief, digital elevation model (nev_dem.tif) and a vector topographic coverage (nvtopo.shp) provide digital terrain information for the study area. Other applicable geographic data that are not included may easily be integrated such as those coverages currently located on the U.S. Bureau of Land
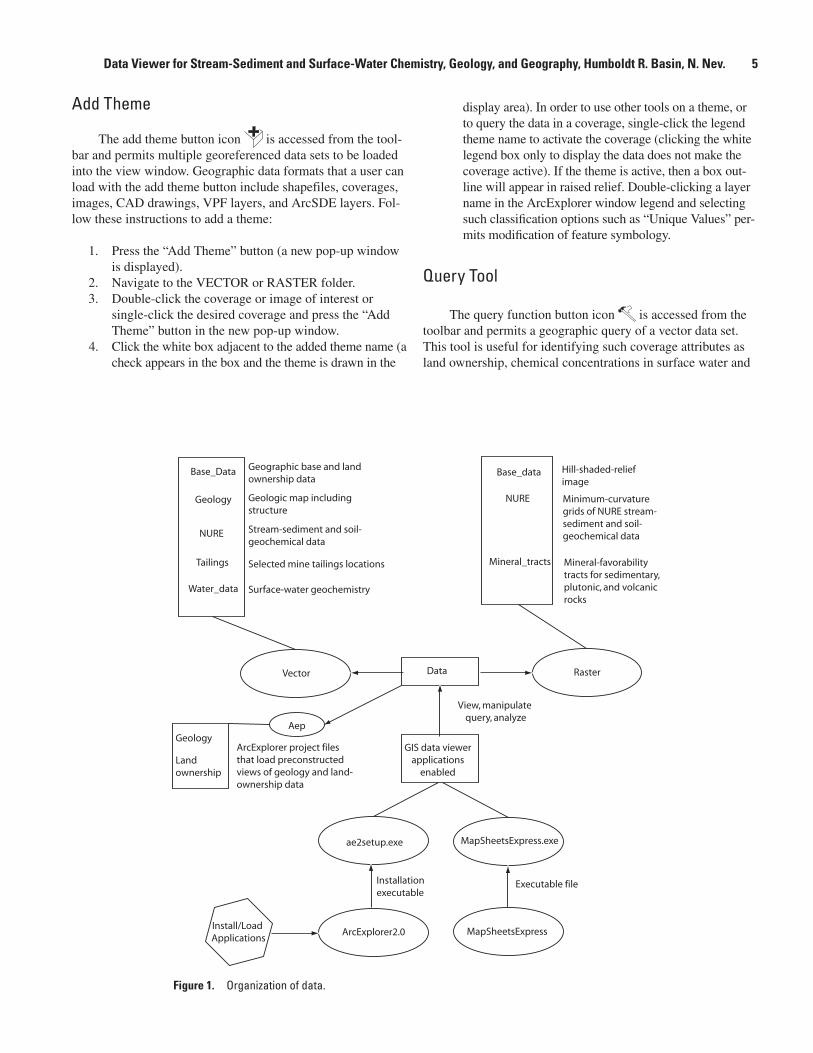
Management Reno, Nev., office GIS Web site at URL <http://www.nv.blm.gov/gis/default.htm>. An organization diagram (fig. 1) is included as an aid in navigating the downloadable directory structure.
Use of ArcExplorer to View Humboldt River Basin Data Sets
ArcExplorer Software
ArcExplorer is a GIS data viewer developed by ESRI, Inc. ArcExplorer permits the viewing and data query of multiple, georeferenced data sets. ArcExplorer is also well suited for displaying and constructing basic data queries of vector cover-ages. Supported data-format types include ESRI shapefiles (.shp, .shx, .dbf), ArcExplorer project files, ArcInfo coverages, compatible image formats such as TIFF and JPEG, CAD draw-ings, VPF layers, and ArcSDE layers. An ArcExplorer project file (.aep) file has been preconstructed for the Nevada geologic map (Stewart and Carlson, 1978; Raines and others, 1996) in addition to the Bureau of Land Management land-ownership coverage ownlcc.shp. The .aep files permit preconstructed and symbolized views of a coverage to be displayed. This allows the user to display the land-ownership coverage (i.e., ownlcc.shp) in a standard color scheme used by the Bureau of Land Man-agement. The file nv_geol.aep allows the user to display the geology with color symbology that is similar to the Stewart and Carlson (1978) geologic map. Permission to use this product was granted by ESRI, Inc. Click here to view permission for use. System requirements are discussed in Appendix A.
ArcExplorer Functionality
ArcExplorer has a similar look and feel as ArcView but has much less robust functionality when compared with ArcView. For example, pan, zoom, identify, and query functionality are both a part of ArcExplorer and ArcView. There are several ArcExplorer functions that are useful when evaluating geographic relationships in Humboldt River basin data. Some of these functions, which are accessed in the main toolbar of the ArcExplorer user interface, include the follow-ing.
Open ArcExplorer Project File
The user can open a preconstructed view of both the Bureau of Land Management ownership coverage and the Nevada geology coverage. To open an ArcExplorer project, click the “File” followed by the “Open Project” buttons and open either the land_own.aep or nv_geol.aep files in the root directory.
4 Note that cells that are blank when viewed with either ArcExplorer or MapSheetsExpress indicate a value is not determined. These blank cells are represented as –999999 in the water database Excel spreadsheet.
� Geoenvironmental Investigations of the Humboldt River Basin, Northern Nevada
Add Theme
The add theme button icon is accessed from the tool-bar and permits multiple georeferenced data sets to be loaded into the view window. Geographic data formats that a user can load with the add theme button include shapefiles, coverages, images, CAD drawings, VPF layers, and ArcSDE layers. Fol-low these instructions to add a theme:
1. Press the “Add Theme” button (a new pop-up window is displayed).
2. Navigate to the VECTOR or RASTER folder. 3. Double-click the coverage or image of interest or
single-click the desired coverage and press the “Add Theme” button in the new pop-up window.
4. Click the white box adjacent to the added theme name (a check appears in the box and the theme is drawn in the
display area). In order to use other tools on a theme, or to query the data in a coverage, single-click the legend theme name to activate the coverage (clicking the white legend box only to display the data does not make the coverage active). If the theme is active, then a box out-line will appear in raised relief. Double-clicking a layer name in the ArcExplorer window legend and selecting such classification options such as “Unique Values” per-mits modification of feature symbology.
Query Tool
The query function button icon is accessed from the toolbar and permits a geographic query of a vector data set. This tool is useful for identifying such coverage attributes as land ownership, chemical concentrations in surface water and
RasterVector Data
GIS data viewer applications
enabled
ArcExplorer2.0 MapSheetsExpress
MapSheetsExpress.exeae2setup.exe
Executable fileInstallationexecutable
Install/Load Applications
View, manipulate query, analyze
Geographic base and land ownership data
Geologic map including structure
Stream-sediment and soil-geochemical data
Selected mine tailings locations
Surface-water geochemistry
Base_Data
Geology
NURE
Tailings
Water_data
Base_data
NURE
Mineral_tracts
Hill-shaded-relief image
Minimum-curvature grids of NURE stream-sediment and soil-geochemical data
Mineral-favorability tracts for sedimentary,plutonic, and volcanicrocks
Aep
ArcExplorer project files that load preconstructed views of geology and land-ownership data
Geology
Land ownership
Figure 1. Organization of data.
Data Viewer for Stream-Sediment and Surface-Water Chemistry, Geology, and Geography, Humboldt R. Basin, N. Nev. �
sediments, and specific mineral districts and deposits. Once a coverage or data theme is selected, the following procedure is used to construct a query:
1. Press the query icon. 2. Select the field name for the query (the name will be
displayed below the selected item). 3. Select an arithmetic operator, such as “=” (nested que-
ries are possible by using “and” and “or” between two attributes of an item).
4. Select a sample value. 5. Select the “display field” name to be the same as the
initial query field name. 6. Press execute. 7. Press highlight results (the selected set will be high-
lighted).
Identify
The identify function button icon is accessed from the toolbar and permits data attributes to be viewed for an active coverage. To use this function,
1. Activate the coverage of interest, then press the identify button.
2. Place the arrow tool point at the feature of interest on the coverage and double- click. A pop-up window will display the attributes of the selected feature.
Vector data available for display and query in ArcEx-plorer are listed in table 1; raster data sets (table 2) may be dis-played only as a backdrop in ArcExplorer; MapSheetsExpress provides for additional raster-data-query functionality.
Map Tips
The map tips function button icon is accessed from the toolbar and allows a user to hold the cursor over an item and reveal its associated attributes. To use this function,
1. Activate the coverage of interest, then press the Map Tips button.
2. Choose the attribute display field from the coverage attribute drop-down list.
3. Hold the cursor over a feature in the active coverage—the associated feature attribute will be displayed.
Note that ArcExplorer has a limit in its ability to display long text strings when the identify function is used. The Map Tips function does not have as severe a limitation in display-ing long text strings, thus, Map Tips could be useful when an entire attribute value needs to be determined. The user is referred to the program help for functionality of other parts of ArcExplorer. The installation executable for ArcExplorer is located in the downloadable ArcExplorer2.0 folder as is the ArcExplorer PDF file “Using ArcExplorer.”
Use of MapSheetsExpress to View Humboldt Basin Data Sets
MapSheetsExpress Software
MapSheetsExpress is a GIS data viewer developed by Leica Geosystems, Inc. MapSheetsExpress permits simultaneous view-ing of multiple, georeferenced raster and vector data. Supported file types include MapSheetsExpress, ERDAS Imagine (.img), ESRI shapefile (.shp), Tagged Image File Format (.tiff), MrSID (.sid), and JPEG (.jpg). Permission to use this product was granted by Leica Geosystems, Inc. Click here to view permission for use.
MapSheetsExpress Functionality
There are several MapSheetsExpress functions that are useful when evaluating geographic relationships between Humboldt River basin data. Some of these functions, which are accessed in the main toolbar of the MapSheetsExpress user interface, include:
Swiper
The purpose of the swiper function is to allow compari-son of two geochemical contour maps or a combination of a contour map and a hill-shaded-relief image. Upon activating the swiper function icon (on the toolbar), the overlaying map may be “slid” away to reveal the underlying map. Once two maps are opened in a view window and the swiper icon is clicked, a “Swipe” window opens, allowing the user to slide away the upper map either from left to right (horizontal) or top to bottom (vertical). The current coverages in the view window are indicated as tabs on the bot-tom of the view screen. Those coverages, which have tabs that are situated to the left of the coverage selected in the “Swipe layers to left of” drop-down menu, will be removed from view when the “Swipe” function is used.
Transparency
The transparency function icon is accessed from the toolbar and allows a geochemical contour map that is overlain on another map to be rendered transparent. Once two maps are opened in a view window and the transparency function icon is clicked, a “Set Layer Transparency” window
opens, allowing the user to adjust the transparency of the upper map from
opaque to transparent. This function is particularly useful when comparing two geochemical contour maps or comparing a contour map with a hill-shaded rendering of a digital eleva-tion model.
� Geoenvironmental Investigations of the Humboldt River Basin, Northern Nevada
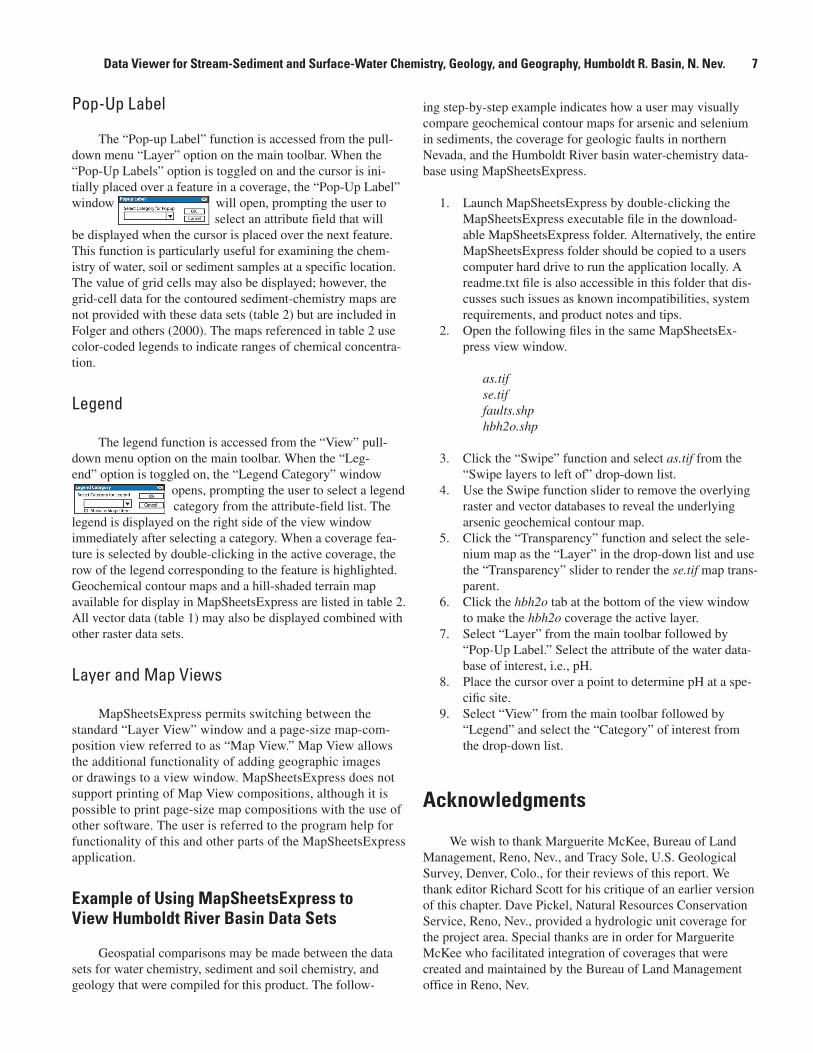
Pop-Up Label
The “Pop-up Label” function is accessed from the pull-down menu “Layer” option on the main toolbar. When the “Pop-Up Labels” option is toggled on and the cursor is ini-tially placed over a feature in a coverage, the “Pop-Up Label” window will open, prompting the user to
ing step-by-step example indicates how a user may visually compare geochemical contour maps for arsenic and selenium in sediments, the coverage for geologic faults in northern Nevada, and the Humboldt River basin water-chemistry data-base using MapSheetsExpress.
1. Launch MapSheetsExpress by double-clicking the MapSheetsExpress executable file in the download-able MapSheetsExpress folder. Alternatively, the entire MapSheetsExpress folder should be copied to a users computer hard drive to run the application locally. A readme.txt file is also accessible in this folder that dis-cusses such issues as known incompatibilities, system requirements, and product notes and tips.
2. Open the following files in the same MapSheetsEx-press view window.
as.tif se.tif faults.shp hbh2o.shp
3. Click the “Swipe” function and select as.tif from the “Swipe layers to left of” drop-down list.
4. Use the Swipe function slider to remove the overlying raster and vector databases to reveal the underlying arsenic geochemical contour map.
5. Click the “Transparency” function and select the sele-nium map as the “Layer” in the drop-down list and use the “Transparency” slider to render the se.tif map trans-parent.
6. Click the hbh2o tab at the bottom of the view window to make the hbh2o coverage the active layer.
7. Select “Layer” from the main toolbar followed by “Pop-Up Label.” Select the attribute of the water data-base of interest, i.e., pH.
8. Place the cursor over a point to determine pH at a spe-cific site.
9. Select “View” from the main toolbar followed by “Legend” and select the “Category” of interest from the drop-down list.
Acknowledgments
We wish to thank Marguerite McKee, Bureau of Land Management, Reno, Nev., and Tracy Sole, U.S. Geological Survey, Denver, Colo., for their reviews of this report. We thank editor Richard Scott for his critique of an earlier version of this chapter. Dave Pickel, Natural Resources Conservation Service, Reno, Nev., provided a hydrologic unit coverage for the project area. Special thanks are in order for Marguerite McKee who facilitated integration of coverages that were created and maintained by the Bureau of Land Management office in Reno, Nev.
select an attribute field that will be displayed when the cursor is placed over the next feature. This function is particularly useful for examining the chem-istry of water, soil or sediment samples at a specific location. The value of grid cells may also be displayed; however, the grid-cell data for the contoured sediment-chemistry maps are not provided with these data sets (table 2) but are included in Folger and others (2000). The maps referenced in table 2 use color-coded legends to indicate ranges of chemical concentra-tion.
Legend
The legend function is accessed from the “View” pull-down menu option on the main toolbar. When the “Leg-end” option is toggled on, the “Legend Category” window
opens, prompting the user to select a legend category from the attribute-field list. The
legend is displayed on the right side of the view window immediately after selecting a category. When a coverage fea-ture is selected by double-clicking in the active coverage, the row of the legend corresponding to the feature is highlighted. Geochemical contour maps and a hill-shaded terrain map available for display in MapSheetsExpress are listed in table 2. All vector data (table 1) may also be displayed combined with other raster data sets.
Layer and Map Views
MapSheetsExpress permits switching between the standard “Layer View” window and a page-size map-com-position view referred to as “Map View.” Map View allows the additional functionality of adding geographic images or drawings to a view window. MapSheetsExpress does not support printing of Map View compositions, although it is possible to print page-size map compositions with the use of other software. The user is referred to the program help for functionality of this and other parts of the MapSheetsExpress application.
Example of Using MapSheetsExpress to View Humboldt River Basin Data Sets
Geospatial comparisons may be made between the data sets for water chemistry, sediment and soil chemistry, and geology that were compiled for this product. The follow-
Data Viewer for Stream-Sediment and Surface-Water Chemistry, Geology, and Geography, Humboldt R. Basin, N. Nev. �
References
Baedecker, P.A., Grossman, J.N., and Buttleman, K.P., 1998, National geochemical database, PLUTO geochemical data-base for the United States: U.S. Geological Survey Digital Data Series, DDS-47, 1 CD-ROM.
Cox, D.P., and Singer, D.A., 1986, Mineral deposit models: U.S. Geological Survey Bulletin 1693, 379 p.
du Bray, E.A., ed., 1995, Preliminary compilation of descrip-tive geoenvironmental mineral deposit models: U.S. Geo-logical Survey Open-File Report 95-831, 268 p.
Folger, H.W., 2000, Analytical results and sample locations of reanalyzed NURE stream-sediment and soil samples for the Humboldt River basin mineral-environmental assessment, northern Nevada: U.S. Geological Survey Open-File Report 00-421, 1 CD-ROM.
Gray, J.E., Adams, M.G., Crock, J.G., and Theodorakos, P.M., 1999, Geochemical data for environmental studies of mer-cury mines in Nevada: U.S. Geological Survey Open-File Report 99-576, 47 p.
Grimes, D.J., McHugh, J.B., and Meir, A.L., 1995, Chemical analyses of major, minor, and trace elements including gold and arsenic species, As(III), and As(V), in water samples collected along the Getchall trend, Humboldt County, Nevada: U.S. Geological Survey Open-File Report 95-636, 26 p.
Grimes, D.J., McHugh, J.B., and Meir, A.L., 1994, Chemical analyses of major, minor, and trace elements including gold and arsenic species, As(III), and As(V), in water samples from Kelly Creek Valley, Humboldt County, Nevada: U.S. Geological Survey Open-File Report 1994-135, 14 p.
King, H.D., Fey, D.L., Mootooka, J.M., Knight, R.J., Roushey, B.H., and McGuire, D.J., 1996, Analytical data and sample locality map of stream-sediment and soil samples from the Winnemucca-Surprise Resource Assessment Area, north-west Nevada and northeast California: U.S. Geological Survey Open-File Report 96-062-A [paper] and 96-062-B [diskette], 341 p.
McFaul, E.J., Mason, G.T., Jr., Ferguson, W.B., and Lipin, B.R., 2000, U.S. Geological Survey mineral databases; MRDS and MAS/MILS: U.S. Geological Survey Digital Data Series, DDS-52, 2 CD-ROMs.
Miller, W.R., 2000, Geochemical baselines of stream and spring waters and rankings of the potential release of total dissolved solids and resistance to introduced acidity from watersheds underlain by four rock compositional types from the Humboldt River basin, Nevada: U.S. Geological Survey Open-File Report 00-161, 50 p.
Nash, J.T., 2000, Hydrogeochemical data for historic mining areas, Humboldt watershed and adjacent areas, northern Nevada: U.S. Geological Survey Open-File Report 00-459, 49 p., available online at URL <http://pubs.usgs.gov/of/2000/ofr-00-0459/>.
Nash, J.T., 2003, Historic mills and mill tailings as poten-tial sources of contamination in and near the Humboldt River basin, northern Nevada: U.S. Geological Sur-vey Bulletin 2210-D, 36 p., available online at URL <http://pubs.usgs.gov/bul/b2210-d/>.
Raines, G.L., Sawatzky, D.L., Connors, K.A., 1996, Great Basin geoscience data base: U.S. Geological Survey Digital Data Series DDS-41, 2 CD-ROMs.
Stewart J.H., and Carlson, J.E., 1978, Geologic map of Nevada: U.S. Geological Survey and Nevada Bureau of Mines and Geology, scale, 1:500,000.
Tingley, J.V., 1992, Mining districts of Nevada: Nevada Bureau of Mines and Geology, Mackay School of Mines, Nevada Bureau of Mines and Geology Map 43, scale 1:1,000,000.
Wallace, A.R., Ludington, S., Mihalasky, M.J., Peters, S.G., Theodore, T.G., Ponce, D.A., and Berger, B.R., 2004, Assessment of metallic mineral resources in the Humboldt River basin, northern Nevada, with a section on platinum-group-element (PGE) potential of the Humboldt mafic com-plex by M.L. Zientek, G.B. Sidder, and R.A. Zierenberg: U.S. Geological Survey Bulletin 2218, 1 CD-ROM.
Yager, D.B., and Folger, H.W., 2003, NURE geochemical maps for the Humboldt River watershed and surrounding areas, northern Nevada: U.S. Geological Survey Miscella-neous Field Studies Map MF-2407-A–M.
� Geoenvironmental Investigations of the Humboldt River Basin, Northern Nevada
Your system must meet the following requirements for ArcExplorer and MapSheetsExpress to install and function properly on your PC:
· Windows 95 and 98, Windows NT version 4.0, Win-dows 2000
· IBM/PC or compatible system with 486-class proces-sor or better
· 16 MB RAM · 40 MB hard-disk space for a typical installation (10
MB for minimum installation) · Video card capable of 256-color (8-bit) display or
better
The following items are recommended for best perfor-mance:
· Pentium-class processor or better. · 32 MB RAM. · 2 MB accelerated video card, capable of high-color
(16-bit) display at 1024×768 resolution.
Appendix A—System Requirements
Published in the Central Region, Denver, ColoradoManuscript approved for publication October 13, 2005Editing, page layout, photocomposition—Richard W. Scott, Jr.Graphics by the authors
Data Viewer for Stream-Sediment and Surface-Water Chemistry, Geology, and Geography, Humboldt R. Basin, N. Nev. �