Embed Size (px)
Citation preview
1
Paper 1337-2017
A Data Mining Approach to Predict Student-at-risk
Youyou Zheng, Thanuja Sakruti, University of Connecticut
ABSTRACT Student success is one of the most important topics for institutions. In this paper, the institutional researchers discussed the data mining process that could predict student at risk for a major STEM course at a top public university. SAS® Visual Analytics and SAS® Enterprise Miner were used for data visualization and predictive modeling. Several different modeling methods were compared to identify the optimal model.
INTRODUCTION Data mining is an analysis process to obtain useful information from large data set and unveil its hidden pattern (Mehmed 2003, Tan 2005). It has been successfully applied in the business areas like fraud detection and customer retention for decades. With the increasing amount of educational data, educational data mining has become more and more important to uncover the hidden patterns within the institutional data, so as to support institutional decision making (Luan 2012). However, only very limited studies have been done on educational data mining for institutional decision support. The institutional researchers from Western Kentucky University built up a model to help increasing yield and retention at the University (Bogard 2013). The researcher from the University of California also proposed to apply data mining technique in the college recruitment process to achieve enrollment goals (Chang 2009). Both of the institutions used SAS® Enterprise Miner as their data mining tool. In this study, we are going to use SAS Enterprise Miner to build up the student-at-risk model. At the University of Connecticut (UConn), General Chemistry is a required course for undergraduate students in the STEM disciplines. It has a relatively higher DFW rate (D=Drop, F=Failure, W=Withdraw) compared with other courses. Take Fall 2012 as an example, the average DFW% is 24% at UConn and there are over a thousand students enrolled in this course. In this study, undergraduate students enrolled in Fall 2012 was used to build up the models. SEMMA (Sample, Explore, Modify, Model and Assess) method introduced by SAS Institute Inc. were applied to develop the predictive models. The freshman SAT scores, class and enrollment campus, semester GPA, first generation, low income, and other factors were used to predict students’ performance in this course. In the predictive modeling process, several different modeling techniques (decision tree, neural network, ensemble models, and logistic regression) had been compared with each other in order to find an optimal one for our institution. The purpose of this study was to predict student success in the future study so as to improve the education quality in our institution.
METHOD
1. Selection of Variables
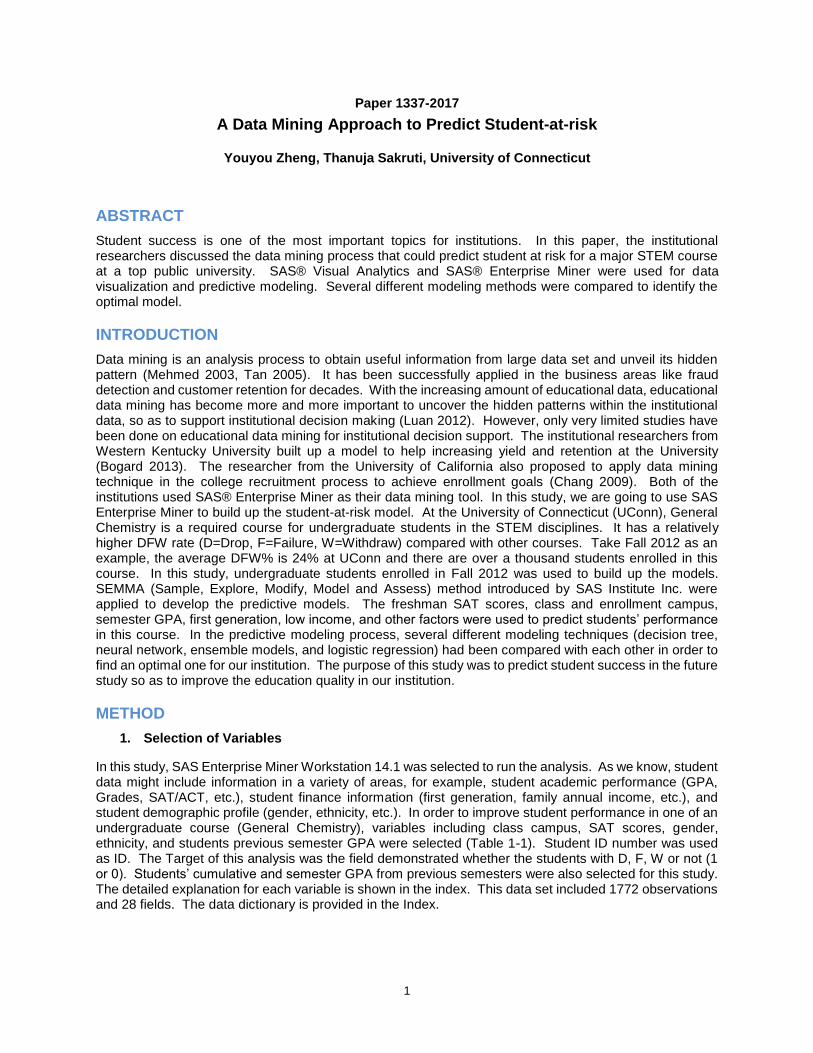
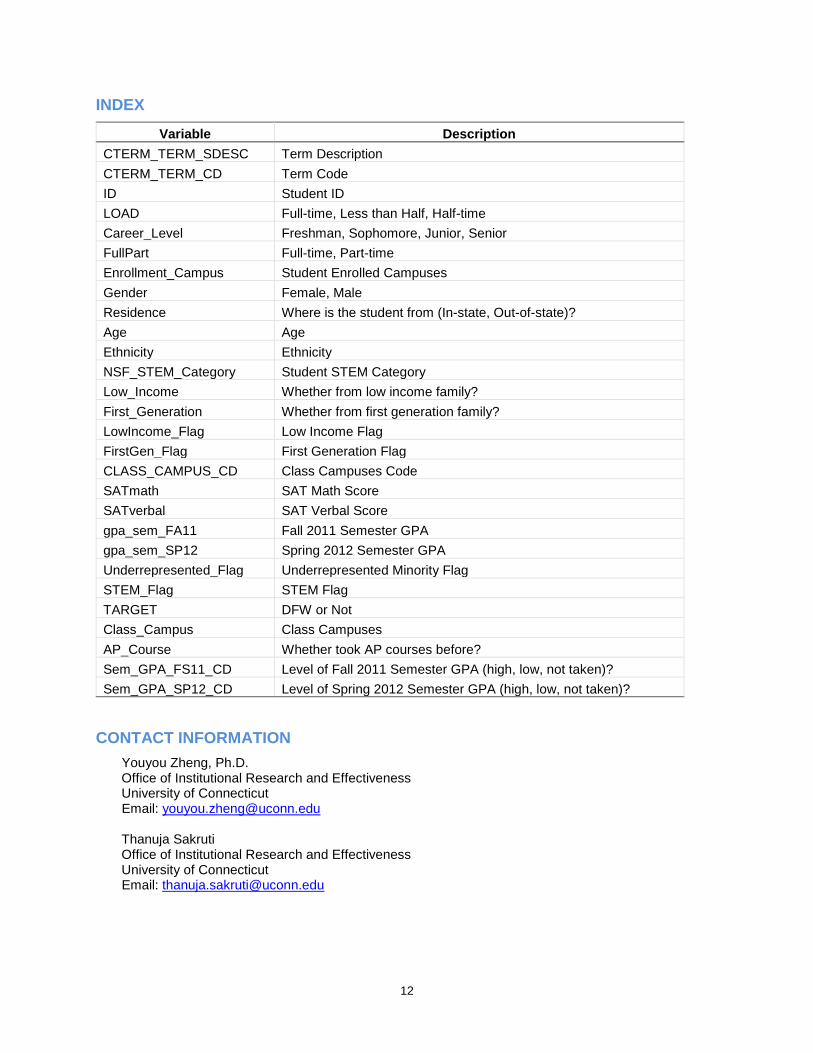
In this study, SAS Enterprise Miner Workstation 14.1 was selected to run the analysis. As we know, student data might include information in a variety of areas, for example, student academic performance (GPA, Grades, SAT/ACT, etc.), student finance information (first generation, family annual income, etc.), and student demographic profile (gender, ethnicity, etc.). In order to improve student performance in one of an undergraduate course (General Chemistry), variables including class campus, SAT scores, gender, ethnicity, and students previous semester GPA were selected (Table 1-1). Student ID number was used as ID. The Target of this analysis was the field demonstrated whether the students with D, F, W or not (1 or 0). Students’ cumulative and semester GPA from previous semesters were also selected for this study. The detailed explanation for each variable is shown in the index. This data set included 1772 observations and 28 fields. The data dictionary is provided in the Index.
2
Table 1-1: Variables Used in the Analysis
2. Data Exploration
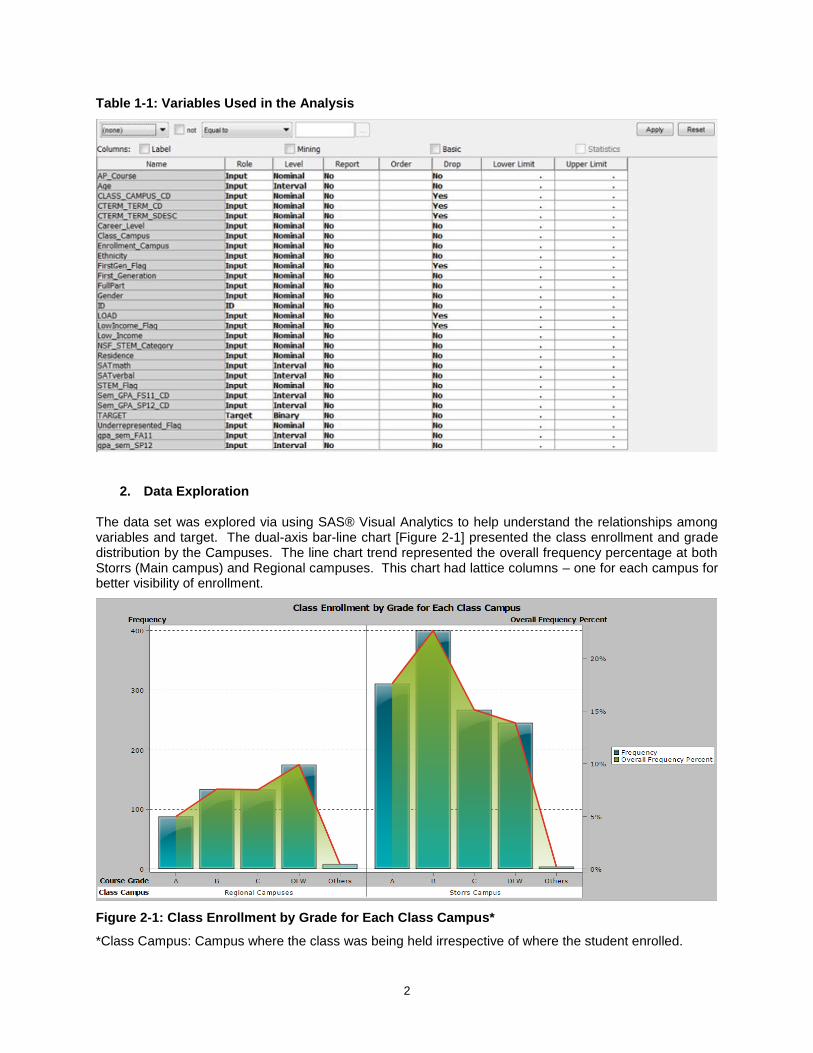
The data set was explored via using SAS® Visual Analytics to help understand the relationships among variables and target. The dual-axis bar-line chart [Figure 2-1] presented the class enrollment and grade distribution by the Campuses. The line chart trend represented the overall frequency percentage at both Storrs (Main campus) and Regional campuses. This chart had lattice columns – one for each campus for better visibility of enrollment.
Figure 2-1: Class Enrollment by Grade for Each Class Campus*
*Class Campus: Campus where the class was being held irrespective of where the student enrolled.
3
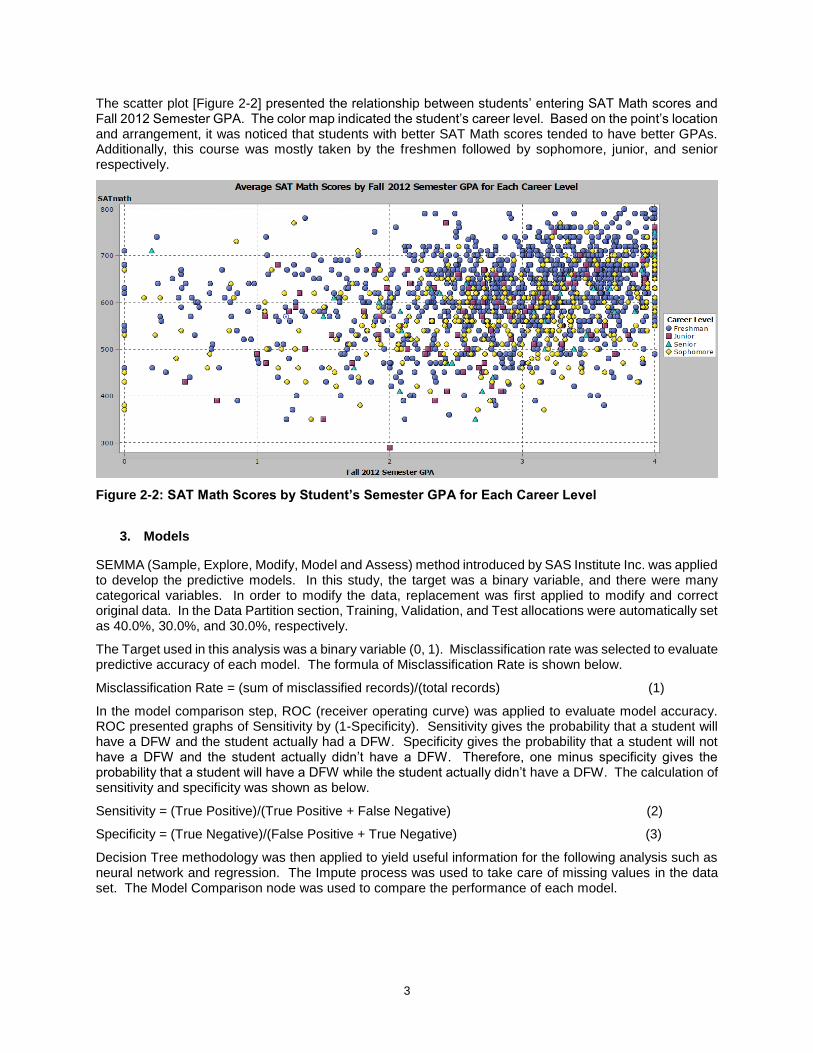
The scatter plot [Figure 2-2] presented the relationship between students’ entering SAT Math scores and Fall 2012 Semester GPA. The color map indicated the student’s career level. Based on the point’s location and arrangement, it was noticed that students with better SAT Math scores tended to have better GPAs. Additionally, this course was mostly taken by the freshmen followed by sophomore, junior, and senior respectively.
Figure 2-2: SAT Math Scores by Student’s Semester GPA for Each Career Level
3. Models
SEMMA (Sample, Explore, Modify, Model and Assess) method introduced by SAS Institute Inc. was applied to develop the predictive models. In this study, the target was a binary variable, and there were many categorical variables. In order to modify the data, replacement was first applied to modify and correct original data. In the Data Partition section, Training, Validation, and Test allocations were automatically set as 40.0%, 30.0%, and 30.0%, respectively.
The Target used in this analysis was a binary variable (0, 1). Misclassification rate was selected to evaluate predictive accuracy of each model. The formula of Misclassification Rate is shown below.
Misclassification Rate = (sum of misclassified records)/(total records) (1)
In the model comparison step, ROC (receiver operating curve) was applied to evaluate model accuracy. ROC presented graphs of Sensitivity by (1-Specificity). Sensitivity gives the probability that a student will have a DFW and the student actually had a DFW. Specificity gives the probability that a student will not have a DFW and the student actually didn’t have a DFW. Therefore, one minus specificity gives the probability that a student will have a DFW while the student actually didn’t have a DFW. The calculation of sensitivity and specificity was shown as below.
Sensitivity = (True Positive)/(True Positive + False Negative) (2)
Specificity = (True Negative)/(False Positive + True Negative) (3)
Decision Tree methodology was then applied to yield useful information for the following analysis such as neural network and regression. The Impute process was used to take care of missing values in the data set. The Model Comparison node was used to compare the performance of each model.
4
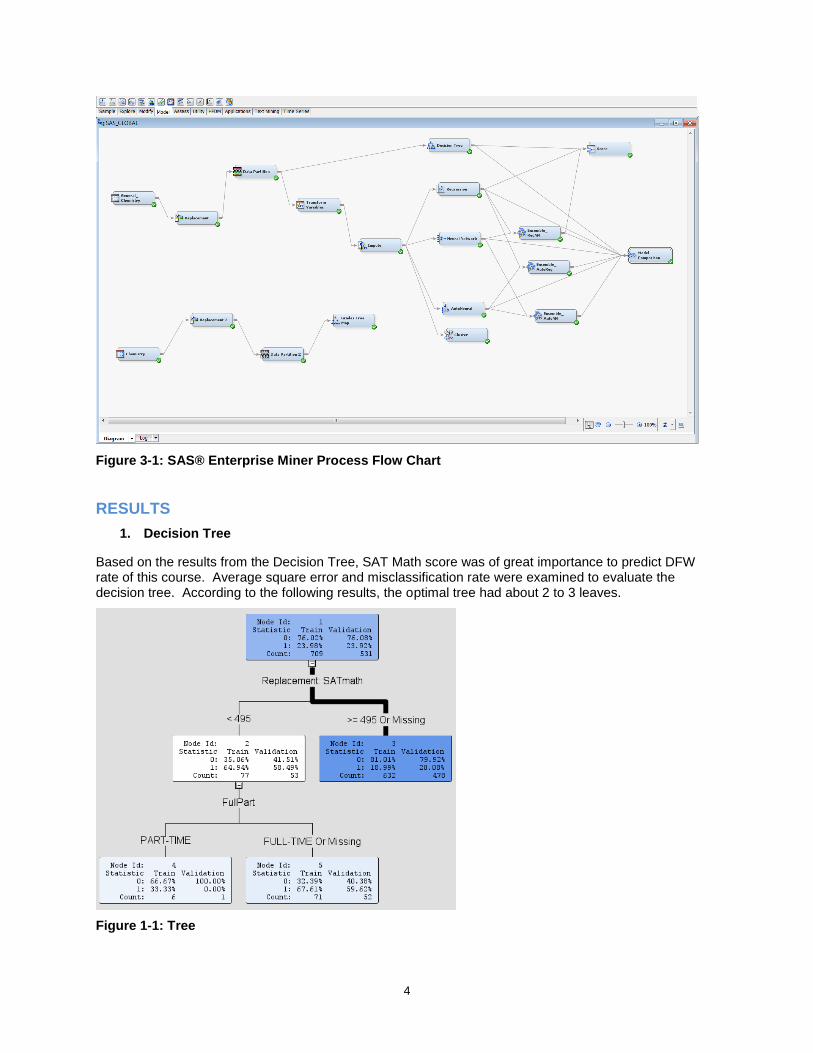
Figure 3-1: SAS® Enterprise Miner Process Flow Chart
RESULTS
1. Decision Tree
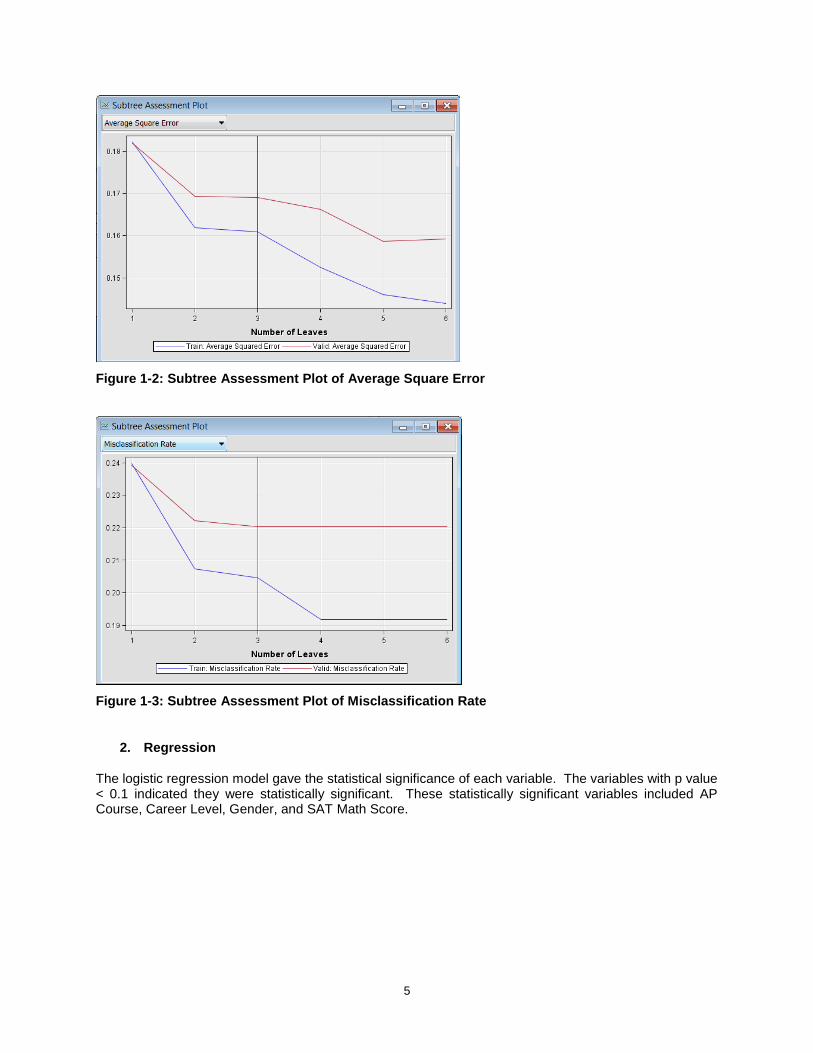
Based on the results from the Decision Tree, SAT Math score was of great importance to predict DFW rate of this course. Average square error and misclassification rate were examined to evaluate the decision tree. According to the following results, the optimal tree had about 2 to 3 leaves.
Figure 1-1: Tree
5
Figure 1-2: Subtree Assessment Plot of Average Square Error
Figure 1-3: Subtree Assessment Plot of Misclassification Rate
2. Regression
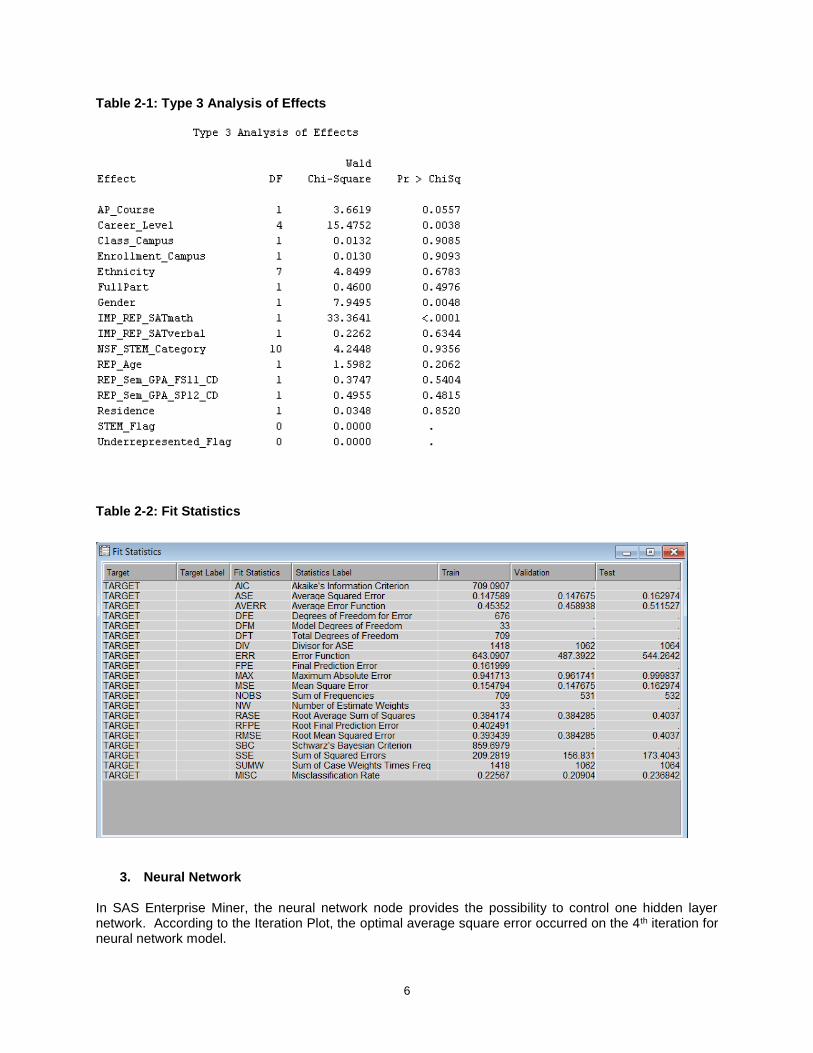
The logistic regression model gave the statistical significance of each variable. The variables with p value < 0.1 indicated they were statistically significant. These statistically significant variables included AP Course, Career Level, Gender, and SAT Math Score.
6
Table 2-1: Type 3 Analysis of Effects
Table 2-2: Fit Statistics
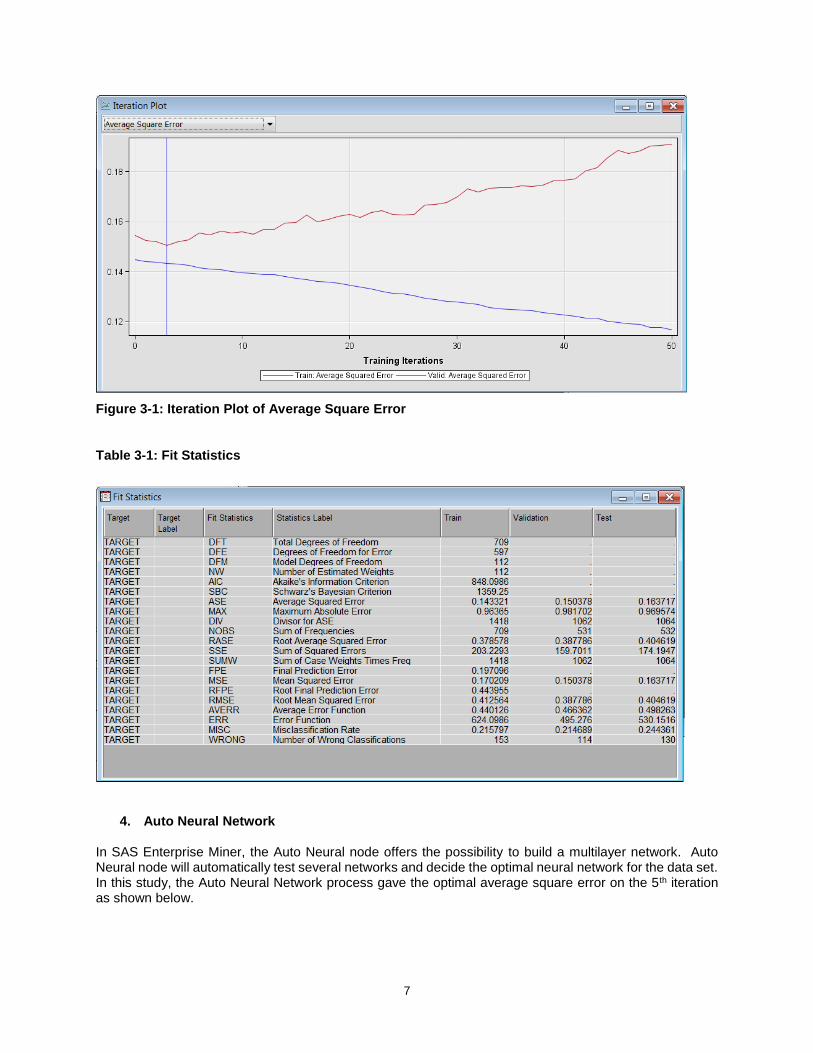
3. Neural Network
In SAS Enterprise Miner, the neural network node provides the possibility to control one hidden layer network. According to the Iteration Plot, the optimal average square error occurred on the 4th iteration for neural network model.
7
Figure 3-1: Iteration Plot of Average Square Error
Table 3-1: Fit Statistics
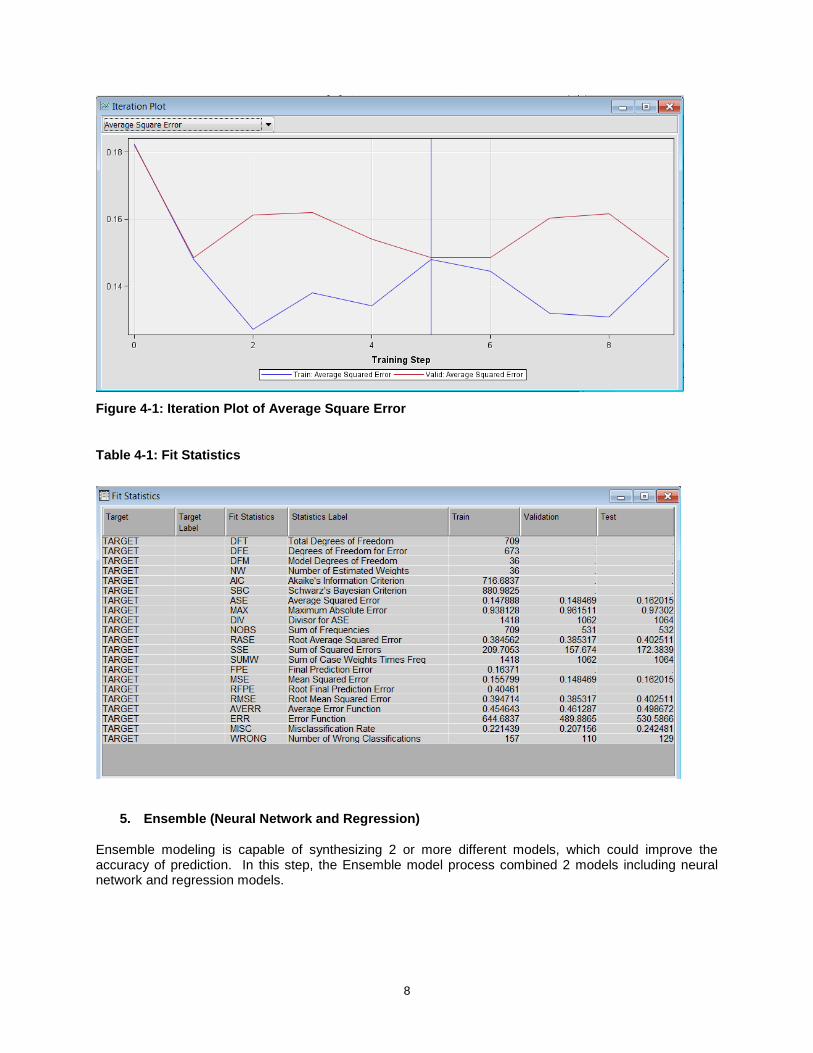
4. Auto Neural Network
In SAS Enterprise Miner, the Auto Neural node offers the possibility to build a multilayer network. Auto Neural node will automatically test several networks and decide the optimal neural network for the data set. In this study, the Auto Neural Network process gave the optimal average square error on the 5th iteration as shown below.
8
Figure 4-1: Iteration Plot of Average Square Error
Table 4-1: Fit Statistics
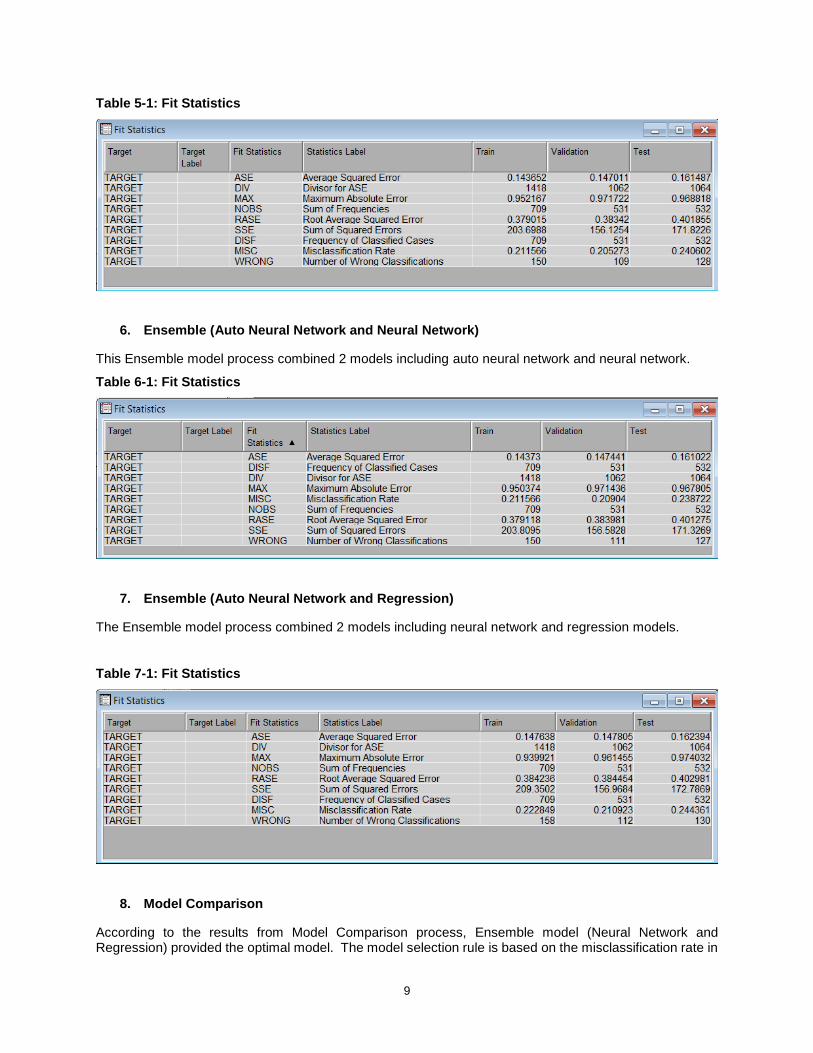
5. Ensemble (Neural Network and Regression)
Ensemble modeling is capable of synthesizing 2 or more different models, which could improve the accuracy of prediction. In this step, the Ensemble model process combined 2 models including neural network and regression models.
9
Table 5-1: Fit Statistics
6. Ensemble (Auto Neural Network and Neural Network)
This Ensemble model process combined 2 models including auto neural network and neural network.
Table 6-1: Fit Statistics
7. Ensemble (Auto Neural Network and Regression)
The Ensemble model process combined 2 models including neural network and regression models.
Table 7-1: Fit Statistics
8. Model Comparison
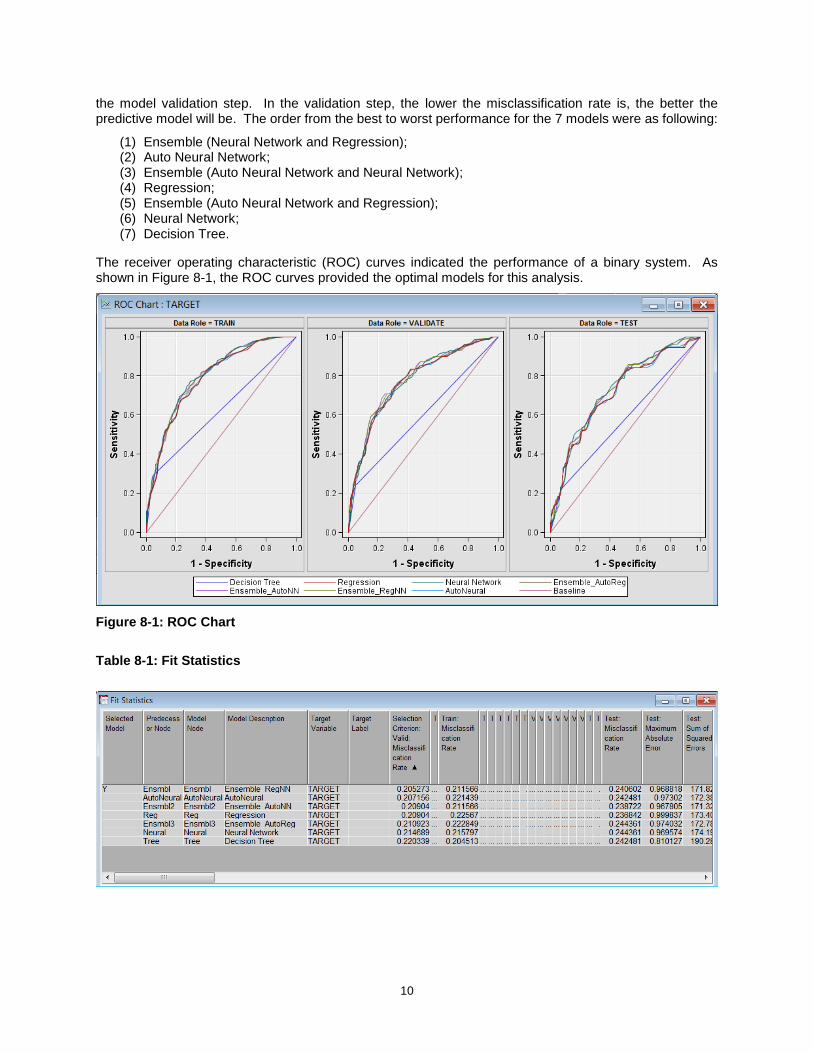
According to the results from Model Comparison process, Ensemble model (Neural Network and Regression) provided the optimal model. The model selection rule is based on the misclassification rate in
10
the model validation step. In the validation step, the lower the misclassification rate is, the better the predictive model will be. The order from the best to worst performance for the 7 models were as following:
(1) Ensemble (Neural Network and Regression); (2) Auto Neural Network; (3) Ensemble (Auto Neural Network and Neural Network); (4) Regression; (5) Ensemble (Auto Neural Network and Regression); (6) Neural Network; (7) Decision Tree.
The receiver operating characteristic (ROC) curves indicated the performance of a binary system. As shown in Figure 8-1, the ROC curves provided the optimal models for this analysis.
Figure 8-1: ROC Chart
Table 8-1: Fit Statistics
11
CONCLUSION AND DISCUSSION
SAS® Enterprise Miner is a powerful tool for higher education data mining. Ensemble modeling and neural network provide better solutions compared with other modeling methods applied. Neural network is a well-known tool for enrollment management, this study shows it is also powerful in course data analysis. In order to improve the accuracy of the predictive model for university course analysis, more variables and more school years data will be added into the data set for our future work. In the future study, the variables such as early college experience, study abroad and other related information will be considered. The similar predictive modeling methods could be applied in the investigation of graduation, which could potentially help more students obtain their degree within 4 years.
ACKNOWLEDGMENT
This work was done with the great help from Dr. Thulasi Kumar at the OIRA (Office of Institutional Research and Assessment) of George Mason University.
REFERENCES
Bogard, M. (2013). A Data Driven Analytic Strategy for Increasing Yield and Retention at Western Kentucky University Using SAS Enterprise BI and SAS Enterprise Miner. SAS Global Forum 2013.
Chang T. (2009). Data Mining: A Magic Technology for College Recruitment. http://www.ocair.org/files/presentations/paper2008_09/tongshan_chang_2009.pdf.
Luan J., Kumar T., Sujitparapitaya S., and Bohannon T. (2012). Exploring and Mining Data. The Handbook of Institutional Research. Howard R.D., McLaughlin G.W., Knight W.E., John Wiley & Sons, Inc.: 478-501.
Mehmed, K. (2003). Data Mining: Concepts, Models, Methods, and Algorithms., John Wiley & Sons.
Tan P., Steinbach M., Kumar V. (2005). Introduction to Data Mining, Addison Wesley.
Christie P., Georges J., Thompson J., and Wells C. (2011). Applied Analytics Using SAS® Enterprise MinerTM
Course Notes, SAS Institute Inc.
12
INDEX
Variable Description
CTERM_TERM_SDESC Term Description
CTERM_TERM_CD Term Code
ID Student ID
LOAD Full-time, Less than Half, Half-time
Career_Level Freshman, Sophomore, Junior, Senior
FullPart Full-time, Part-time
Enrollment_Campus Student Enrolled Campuses
Gender Female, Male
Residence Where is the student from (In-state, Out-of-state)?
Age Age
Ethnicity Ethnicity
NSF_STEM_Category Student STEM Category
Low_Income Whether from low income family?
First_Generation Whether from first generation family?
LowIncome_Flag Low Income Flag
FirstGen_Flag First Generation Flag
CLASS_CAMPUS_CD Class Campuses Code
SATmath SAT Math Score
SATverbal SAT Verbal Score
gpa_sem_FA11 Fall 2011 Semester GPA
gpa_sem_SP12 Spring 2012 Semester GPA
Underrepresented_Flag Underrepresented Minority Flag
STEM_Flag STEM Flag
TARGET DFW or Not
Class_Campus Class Campuses
AP_Course Whether took AP courses before?
Sem_GPA_FS11_CD Level of Fall 2011 Semester GPA (high, low, not taken)?
Sem_GPA_SP12_CD Level of Spring 2012 Semester GPA (high, low, not taken)?
CONTACT INFORMATION
Youyou Zheng, Ph.D. Office of Institutional Research and Effectiveness University of Connecticut Email: [email protected]
Thanuja Sakruti Office of Institutional Research and Effectiveness University of Connecticut Email: [email protected]

13
SAS and all other SAS Institute Inc. product or service names are registered trademarks or trademarks of SAS Institute Inc. in the USA and other countries. ® indicates USA registration.
Other brand and product names are trademarks of their respective companies.


![Using Data Mining Techniques to Predict Students …...on the historical data on student enrolments in modules. Vialardi et al. [12] utilised data mining techniques to predict students’](https://img.pdfslide.us/doc/110x75/5f30b5715c46185b4610febd/using-data-mining-techniques-to-predict-students-on-the-historical-data-on-student.jpg)