Embed Size (px)
Citation preview
A Data Analysis of Senior Student Truancy Data
for the Green Bay Area Public School District
by
Amanda Retzak Krump
A Research Paper Submitted in Partial Fulfillment of the
Requirements for the Education Specialist Degree
in
School Psychology
Approved: 6 Semester Credits
_________________________________ Dr. Ed Biggerstaff, Research Chair
_________________________________
Jill Stanton, Research Committee Member
_________________________________ Mary Beth Tusing, Research Committee Member
The Graduate School
University of Wisconsin-Stout
May, 2005
ii
The Graduate School
University of Wisconsin Stout
Menomonie, WI 54751
ABSTRACT
Retzak Krump Amanda D.
_____________________________________________________________________ (Writer) (Last Name) (First Name) (Middle Initial)
A Data Analysis of Senior Student Truancy Data for the Green Bay Area Public
School District
_____________________________________________________________________ (Title)
School Psychology, Dr. Ed Biggerstaff, 5/05 42 ______________________________________________________________________
(Graduate Program) (Research Advisor) (Month/Year) (# of Pages)
American Psychological Association, 5th edition ___________________________________________________________________ (Name of Style Manual Used in this Study)
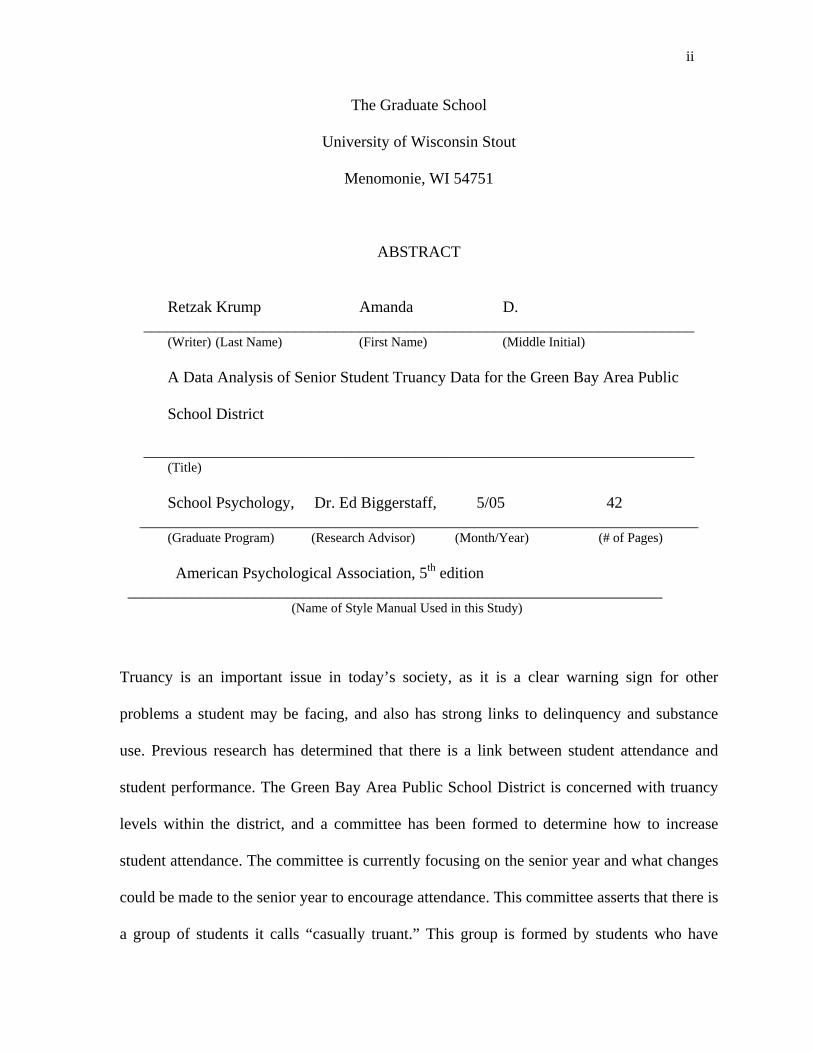
Truancy is an important issue in today’s society, as it is a clear warning sign for other
problems a student may be facing, and also has strong links to delinquency and substance
use. Previous research has determined that there is a link between student attendance and
student performance. The Green Bay Area Public School District is concerned with truancy
levels within the district, and a committee has been formed to determine how to increase
student attendance. The committee is currently focusing on the senior year and what changes
could be made to the senior year to encourage attendance. This committee asserts that there is
a group of students it calls “casually truant.” This group is formed by students who have
iii
skipped one or more periods between 5 and 25 times per semester. This study is a pilot
analysis of casually truant senior student records. It confirms that within the Green Bay Area
Public School District, there is a link between student attendance and performance as
measured by grade point average. As student attendance decreases, so does student
performance. In addition, this study examines the types of courses that casually truant seniors
skip. Results indicate that English classes are most frequently skipped, followed by special
education classes, and then study period. While a large number of truant students were
enrolled in more than one English or special education course, most students who were truant
from study period were only enrolled in one study period during the semester. These results
suggest the District should consider reevaluating these and other courses in determining how
to improve the senior year. Further research with truancy subgroups is recommended.
iv
Acknowledgments
I would like to express my gratitude for Dr. Biggerstaff’s patience, suggestions, and guidance
that made my completion of this study possible. He helped turn an unfortunate situation into
a positive experience, and is both an excellent teacher and advisor. In addition, I would like
to thank Jill Stanton, who has helped me throughout two research projects. I would like to
express my appreciation to Mary Beth Tusing, who was willing to take on this project at a
less than optimal time for her. Finally, I would like to thank my husband, Ben, and my
parents, Gary and Lynn, who have been extremely supportive of my education and research.
v
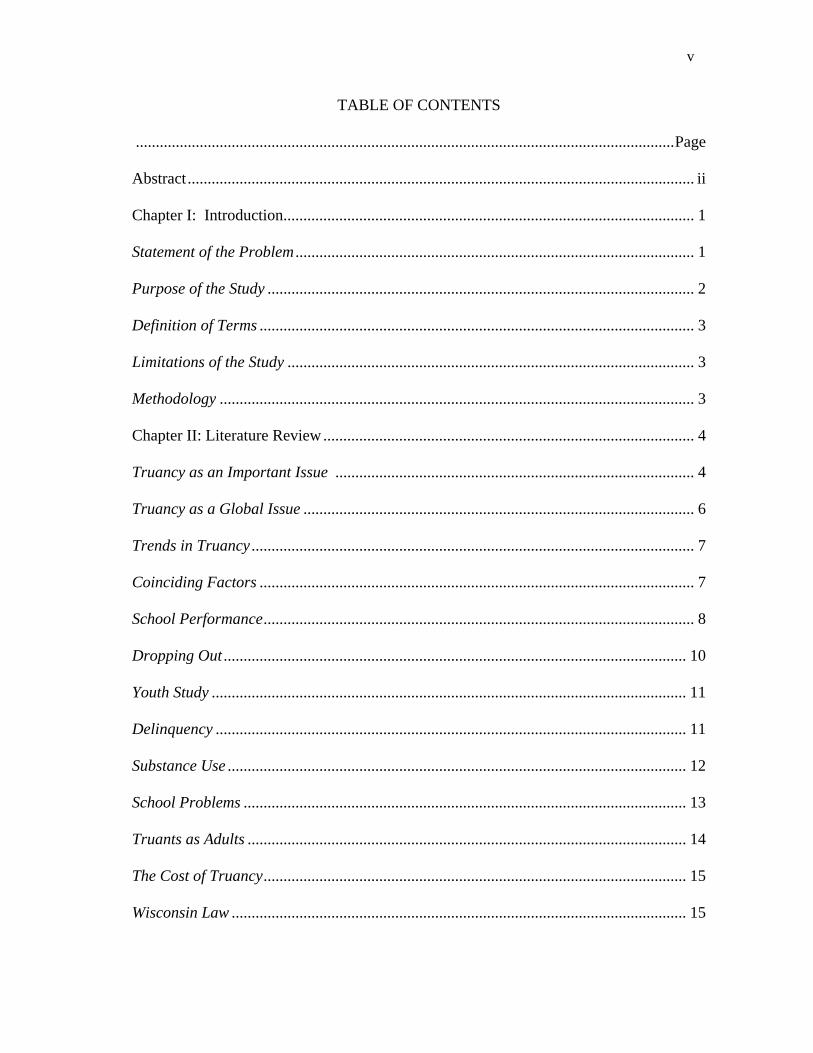
TABLE OF CONTENTS
.......................................................................................................................................Page
Abstract............................................................................................................................... ii
Chapter I: Introduction....................................................................................................... 1
Statement of the Problem .................................................................................................... 1
Purpose of the Study ........................................................................................................... 2
Definition of Terms ............................................................................................................. 3
Limitations of the Study ...................................................................................................... 3
Methodology ....................................................................................................................... 3
Chapter II: Literature Review............................................................................................. 4
Truancy as an Important Issue .......................................................................................... 4
Truancy as a Global Issue .................................................................................................. 6
Trends in Truancy ............................................................................................................... 7
Coinciding Factors ............................................................................................................. 7
School Performance............................................................................................................ 8
Dropping Out .................................................................................................................... 10
Youth Study ....................................................................................................................... 11
Delinquency ...................................................................................................................... 11
Substance Use ................................................................................................................... 12
School Problems ............................................................................................................... 13
Truants as Adults .............................................................................................................. 14
The Cost of Truancy.......................................................................................................... 15
Wisconsin Law .................................................................................................................. 15
vi
Green Bay Area Public School District Open/Closed Campus Research ....................... 16
Senior Year Planning........................................................................................................ 16
Chapter III: Methodology ................................................................................................. 17
Subject Selection and Description .................................................................................... 17
Data Collection Procedures ............................................................................................. 17
Data Analysis .................................................................................................................... 18
Limitations ........................................................................................................................ 20
Chapter IV: Results........................................................................................................... 21
The Relationship Between Absences and Grade Point Average....................................... 21
Figure A ............................................................................................................................ 23
Trends in Types of Courses Skipped ................................................................................. 23
Figure B ............................................................................................................................ 26
Chapter V: Discussion ...................................................................................................... 27
Limitations ........................................................................................................................ 28
Conclusions....................................................................................................................... 28
Recommendations ............................................................................................................. 30
References......................................................................................................................... 34
1
CHAPTER I: INTRODUCTION
As a part of its strategic plan, the Green Bay Area Public School District is determining
how to improve the senior year in order to reduce student truancy. This study is a pilot
analysis that will be part of ongoing research within the district.
Statement of the Problem
Student absenteeism and truancy is an ongoing area of concern for many school
districts (Lee & Burkam, 2003). There is agreement that truancy is an important issue
because of the negative impact of loss of human capital when students do not complete
school (Lee & Burkam).
Student absenteeism and truancy are also areas of great concern for the Green Bay Area
Public School District. The District reported on student absenteeism and truancy rates for the
2003-2004 school year in its 2004 report, Student Learning and Performance Data. This
report indicated that at the high school level, there was an overall attendance rate of 89.2%,
with lowest attendance for American Indian students (73.3%) and highest for White students
(91.2%). Attendance was generally the same for males (89.4%) and females (89.0%).
Attendance was higher for non-low socioeconomic status students (91.5%) than students of
low socioeconomic status (83.5%). Attendance of non-English Language Learners was
slightly higher (89.4%) than English Language Learners (87.9%). Attendance of students
identified with a disability was lower (82.5%) than students not identified with a disability
(90.7%). In comparing itself to nine other Wisconsin districts of comparable size, Green Bay
ranked ninth lowest for attendance rates (out of 10) (Green Bay Area Public School District,
2004, December). This indicates that students within the School District have lower
attendance rates compared to students in Wisconsin districts of comparable size.
2
The School District also examined truancy data. Habitual truants are defined as students
who are absent from school without an acceptable excuse for part or all of five or more days
in which school is held during a semester. Habitual truancy was at 34.6% overall at the high
school level, with American Indian students having the highest rate (68.3%) and White
students having the lowest rate (27.9%). Habitual truancy was higher for males (37.5%) than
females (31.6%). In addition, truancy rates for students of low socioeconomic status were
nearly two times higher (at 53.2%) than non-low socioeconomic students (26.8%) at the high
school level. Habitual truancy was higher among English Language Learners (44.7%) than
non ELL students (32.9%). Truancy was considerably higher among students with a
disability (51.7%) compared to students without a disability (30.8%). Among 9 peer districts,
Green Bay Area Public Schools had the 4th highest habitual truancy rate (out of 10) (Green
Bay Area Public School District, 2004, December).
Student attendance and truancy are areas of great concern for the Green Bay Area Public
School District. The District is developing strategies with the goal of a 3% annual reduction
of students absent 10 or more days per year (Green Bay Area Public School District, 2003).
A District Committee has been formed to review and implement these strategies. One of
these strategies to reduce truancy is to review the present program for the senior year of high
school to determine how to better engage seniors to school. This study is being conducted as
a part of this review. It is a pilot analysis of senior truancy data that will be used in future
planning for the senior year.
Purpose of the Study
There are two purposes for this study. The first is to find if there is a relationship
between increased absences and decreased grade point average for students defined below as

3
“casual truants.” The second is to determine if there is a trend in the types of courses that
casually truant seniors skip.
Definition of Terms
Casual truants (As defined by The Green Bay Area Public School District’s Truancy
Committee) This group includes students who are absent from one or more periods
without an acceptable excuse between five and 25 times per class, per semester.
Habitual truants (As defined by The Wisconsin Department of Public Instruction,
2004) This group is traditionally defined as students who are absent from school
without an acceptable excuse for part or all of five or more days during a school
semester.
Non-truants (As defined by The Green Bay Area Public School District’s Truancy
Committee) This group is defined as students who have fewer than five unexcused
absences per class, per semester.
Limitations of the Study
This study examines data only for the Green Bay Area Public School District and is
not intended to represent trends in truancy for other school districts. In addition, it only
examines data for the senior year and will not represent trends for other grades within the
District.
Methodology
This study will review recent truancy research, including companion issues related to
truancy. The study will examine senior truancy data for the Green Bay Area Public School
District. Finally, current related research and areas for future research will be discussed.
4
CHAPTER II: LITERATURE REVIEW
Many educators, researchers, and policymakers recognize truancy as an important
issue in today’s society (Johnson, 1997; Johnson 2000; Lee & Burkam, 2003). While truancy
is a costly behavior that has been linked to delinquency, substance use, home problems, and
high school dropout, over the past 30 years, only two to six percent of the general public has
seen truancy as a major problem facing our public schools (Colorado Foundation for
Families and Children, 2003; Phi Delta Kappa, 2003). The following chapter will review the
importance of truancy, issues related to truancy, and truancy research conducted by the
Green Bay Area Public School District.
Truancy as an Important Issue
To fully understand truancy as an important issue facing today’s society, it is
necessary to briefly reflect on the importance of schooling. In our nation, a large portion of a
child’s education occurs within a school setting. This education allows for generations to
pass on what they have learned and to add to the skills and knowledge that the child has
learned outside of school. Education allows for students to preserve previously acquired
knowledge and culture, and to provide a platform for change (Bass, 1997). When students are
not present in school, they miss the structured opportunity our society has developed to
provide them with the knowledge, skills, and culture that we expect them to have.
In addition to educational opportunities, schools provide assistance to students and
help prepare them for today’s society and workforce. While the demand for unskilled labor
is shrinking, truant students are likely poorly prepared for skilled work. When they enter the
workforce, truants are less likely to secure work, and companies often must teach workers
who were truant the skills needed for their jobs (Colorado Foundation for Families and
5
Children, 2003). Jobs now often demand students to be knowledgeable, and to have the
ability to evaluate information, think critically, and solve problems (Fredricks, Blumenfeld,
& Paris, 2004). Students must be committed to school in order to acquire these capabilities.
Schools not only help students prepare for work, but also help students facilitate their
transition into adulthood and society. Students who leave school miss valuable information,
developmental opportunities, and personal assistance by missing school experiences (Lee &
Burkam, 2003). Individuals need educational skills to become attached and integrated in
prosocial contexts (Huizinga, Loeber, & Thornberry, 1995). These opportunities are
sometimes only available within the school setting.
Truancy is also important when considered as a warning sign for other problems for
which the student may be at-risk. Truancy, within a broad context, is a nonconforming
behavior that often includes delinquency and drug use (Huizinga et al., 1995). Truancy
provides an indication of low attachment to school, and of a student bonding with deviant
peers (Hallfors et al., 2002). To prevent delinquency, substance abuse, and attachment to
deviant peers, society and schools must intervene with truancy.
Truancy is an issue nation-wide. In some large cities, daily absentee rates are as high as
30% (Garry, 1996). School districts across the nation have made numerous efforts to increase
student attendance. Such efforts vary widely and include linking grades with attendance,
creating truancy assessment centers, training parents as truancy officers, and charging parents
when their children miss school (Gehring, 2004). Some of these efforts have helped students
to stay in or return to school.
Law enforcement agencies are also involved in truancy prevention. Many law
enforcement agencies around the country have joined with schools for truancy interventions,

6
and a large number have developed programs to decrease student truancy (Gavin, 1997).
While these efforts have resulted in a decrease in truancy, truancy remains a nation-wide
problem. There was a 58% increase in the national rate of truancy offense cases between
1985 and 1998 (Colorado Foundation for Families and Children, 2002).
Truancy is an important issue that results in students being less prepared for today’s
society. Schools and law enforcement agencies nation-wide are attacking truancy through a
variety of efforts. While truancy reduction programs are frequently successful, truancy
remains an important issue nationally.
Truancy as a Global Issue
The United States is not alone in its concern regarding school truancy. Johnson (1997;
2000) conducted surveys with Canadian school personnel regarding risk factors, or attributes
and circumstances that make risk outcomes more likely for students. One recent survey
asked Canadian inner-city school principals to rate student-based risk factors, which include:
drinking alcohol, smoking marijuana, using hard drugs, engaging in criminal behavior, being
sexually active, being truant from school, not enjoying school, learning English as a second
language, having language limitations, and having limited life experiences. Out of these ten
factors, principals rated school truancy as the highest risk factor contributing to overall
student risk (Johnson, 2000). In a similar survey of teachers in Canadian inner-city schools,
teachers rated truancy as the fourth highest of these same ten factors contributing to student
risk, indicating that they believed student truancy strongly to absolutely contribute to student
risk (Johnson, 1997).
A large body of truancy research has also come from England. These studies identify
truancy as a major issue (Lauchlan, 2003; Bosworth, 1994). One study demonstrated that
7
there are a number of factors that coincide with student truancy, and that pupil performance
is closely related to truancy (Bosworth). Schools in England have also developed
interventions to tackle truancy (Lauchlan). Truancy is an issue that other nations have
identified as contributing to student risk, and that these nations also work to prevent.
Trends in Truancy
The Colorado Foundation for Families and Children (2003) noted specific trends in
student truancy. Truancy tends to be higher among males, minorities, urban youth, low socio-
economic families, single-parent homes, families with many children, and children of
dropouts. While these are factors that many schools and families are not able to easily
change, parental involvement and attention also correlate with better attendance. Finally,
truancy rates tend to increase as children get older, and many students who drop out of high
school were truant as early as elementary school (Colorado Foundation for Families and
Children, 2003). These trends suggest a framework for understanding some of the issues that
may coincide with truancy.
Coinciding Factors
In addition to noting trends in student truancy, there are a large number of factors that
have been identified in research that correlate with a student’s truancy. A Juvenile Justice
Bulletin by Baker, Sigmon, and Nugent (2001) divides these correlates into four factors:
family, school, economic, and student. Family factors include issues that the student faces at
home, such as lack of guidance or supervision, abuse, poverty, and parental attitudes
regarding education. School factors include issues the student faces at school, such as school
size and the school’s ability to meet the needs of the student. Economic factors include
economic problems the student may face, such as lack of affordable transportation and
8
student mobility. Student variables include issues the student may have personal difficulty
with, such as drug and alcohol abuse, poor social skills, and poor health (Baker et al.).
The National Center for School Engagement (2005) also reported that the above
factors coincide with student truancy. In addition, they noted that truants often have lower
self-esteem and greater feelings of parental rejection than non-truants (National Center for
School Engagement). Truants are less likely to view school as important and sometimes feel
less competent in school than non-truants. Truant students frequently have problems with
schoolwork and have difficulty keeping up with other students (Ingersoll & LeBoeuf, 1997).
These are a number of factors that truants may face in addition to their disengagement
from school. Given truancy’s relationship with the factors outlined above, truancy may be a
warning sign for other family, school, economic, and personal problems that the student may
be facing.
School Performance
While students may be facing a number of issues in addition to truancy, their
performance in school may also suffer greatly if they are truant. Lamdin (1996) found that
while the factors outlined above are related to student performance, student attendance is also
significantly related to standardized achievement test performance. As student attendance
increases, performance on standardized achievement tests increases as well. In addition, one
study found that attendance had a greater impact on student performance than school size and
average class size (Caldas, 1993). This indicates that while students may have other variables
that impact their schooling, attendance is an important factor in their performance.
Truancy rates not only are related to a student’s performance on standardized tests, but
also to their school performance and achievement, as measured by grade point average.

9
Students who are truant have lower grade point averages than those who are not (Hallfors et
al., 2002). Baker et al. (2001) found that students with the highest truancy rates have the
lowest academic performance. In one study, when motivation was measured by truancy and
student attendance, motivation had a stronger influence on school grades than cognitive,
affective, or attitudinal factors alone (Anderson & Keith, 1997). This indicates that there is a
strong link between school attachment and grades independent from other variables.
Truancy has also been an issue related to student performance at the college level.
Studies have confirmed a strong relationship between attendance and grades in college
(Gump, 2004). Truancy appears to be related to student performance throughout the levels of
education.
Student performance on tests has become increasingly important in recent years with the
implementation of No Child Left Behind (Gehring, 2000). According No Child Left Behind,
schools must improve academic performance. In order to improve academic performance,
students must come to school (Gehring). Schools that are faced with large school size and
high student-to-teacher ratios are still able to improve student achievement simply by
increasing student attendance rates (Caldas, 1993). All too often, research has focused on
other factors that put students at risk for low performance, factors that are often outside of
society’s realm of control. Instead, researchers should focus on improving student
attendance, which is significantly related to student performance (Lamdin, 1996). Schools’
efforts to improve performance do not yield results if students are not present to learn.
Students who are truant perform more poorly on standardized tests and have lower grade
point averages than their non-truant peers. The impact of attendance on grades and
standardized tests is also evident at the college level. As pressure for schools to improve

10
student performance increases, it is essential that students attend school to increase their
performance.
Dropping Out
Many students who are truant perform so poorly in school that they are unable to
catch up. As a result, many students who are truant drop out of school (Garry, 1996). One
study found that 80% of dropouts were chronically truant (Colorado Foundation for Families
and Children, 2002). Truancy places students at-risk for dropping out of school, which has
serious implications for both students and society. Dropouts have fewer job prospects, lower
salaries, and are more often unemployed than high school graduates (Baker et al., 2001;
Ingersoll & LeBoeuf, 1997). For example, in 1993 approximately three out of five high
school dropouts were unemployed (Ingersoll & LeBoeuf). Dropouts are more likely to
depend on welfare and more likely to be imprisoned (Baker et al.). The average dropout costs
over $200,000 during their lifetime for government social services and criminal justice costs
(National Center for School Engagement, 2005). Each year’s class of dropouts costs the
Nation over $240 billion in lost earnings and subsequent taxes over their lifetimes. This cost
does not include the cost of law enforcement, prison programs, welfare, healthcare, and other
social services (Ingersoll & LeBoeuf,). Truancy often leads to dropping out, which is very
costly to society.
Students typically disengage from school prior to dropping out. This disengagement
is often noted through students cutting class and skipping school (Fredricks et al., 2004). By
intervening with students who are disengaged from school, schools can make it less likely
that students will drop out.
11
Youth Study
Three studies in Denver, Pittsburgh, and Rochester revealed developmental pathways
that describe disruptive behavior for childhood and adolescence. Students who later had
difficulties with juvenile offenses typically began exhibiting stubborn behavior at a young
age. Next, some of these students began exhibiting minor acts such as lying and shoplifting,
followed by defiance and minor aggression. Then, more serious offenses began as well as
avoidance of authority, which includes truancy. For some students, avoidance of authority
was followed by more serious violent or delinquent behaviors. These studies suggest that
later, more serious offenses can be prevented by intervention with preceding behaviors.
While not all students who are truant engage in more serious offenses, by intervening with
truants, society may be able to prevent some students from engaging in such offenses
(Huizinga et al., 1995).
Delinquency
Delinquency is another area of concern that is problematic to society. It is typically
measured by the following offenses: theft, $50-$100; theft, over $100; theft, motor vehicle;
burglary; aggravated assault; robbery; rape; gang fighting; purse snatching/pick pocketing;
theft from an automobile; sell of marijuana; sell of hard drugs; and, fencing (selling or
buying stolen goods) (Huizinga et al., 1995).
There is a well-documented link between truancy and delinquency that was recognized as
early as the 1800s (Gavin, 1997). Many juvenile offenders are also habitual truants, and
chronic absenteeism is considered the most powerful predictor of delinquent behavior
(National Center for School Engagement, 2005; Garry, 1996). Truancy is a clear warning
sign for delinquent activity, social isolation, educational failure, expulsion, risk of teen
12
pregnancy, and drop out (Baker et al., 2001; National Center for School Engagement).
Students who are truant are more likely to engage in a number of delinquent behaviors.
There is a large body of research that links truancy with crime. Many communities
have noticed that many daytime crimes such as burglary and shoplifting are committed by
truants who would otherwise be in school (Gavin, 1997). In addition to these crimes, students
who are often absent are at a higher risk of engaging in violent behavior (Garry, 1996). These
behaviors tend to start at an early age; for one-tenth of delinquents, a street offense was
committed by the age of seven. In addition, the rate of street offenses continues to increase
up to the age of 17, and youth who are not highly committed to school one year have higher
levels of street crimes the following year (Huizinga et al., 1995). Nationally, efforts to reduce
truancy have produced significant reductions in crimes associated with juvenile offenders
(Gavin; National Center for School Engagement, 2005). When Milwaukee schools began a
Truancy Abatement Burglary Suppression Program, there was a reduction in violent crime
during school days. Homicides went down 43%, sexual assaults went down 24%, aggravated
assaults went down 24%, and robberies went down 16% (Ingersoll & LeBoeuf, 1997).
Educational success is necessary for children on probation or in aftercare to prevent
recidivism and further involvement in justice systems (Ingersoll & LeBoeuf). As
communities fight truancy and educate students, they seem to be able to reduce crime.
Substance Use
In addition to a strong link with crime, truancy is also linked to substance use. A
study of 58 communities’ school survey data collected from 1980-2000 determined that
truancy was a strong predictor of substance use, especially at the middle school level.
Students who are truant are more likely to use cigarettes, alcohol, marijuana, inhalants, and

13
other illegal drugs. For example, one study found that the rate of marijuana use among eighth
graders was 27% for truants, compared to six percent of non-truants (Hallfors et al., 2002).
Truancy was also a predictor of substance use at the high school level. The rate of marijuana
use among twelfth graders was 33% for truants, and 13% for non-truants (Hallfors et al.).
Frequent truants are also more likely to affiliate with drug-using peers, and often use drugs
while cutting class (Hallfors et al.).
The use of such drugs can add to the difficulties the student may already be facing. A
study by Huizinga et al. (1995) found that with the onset of drug use, violent offenses and the
carrying of concealed weapons tended to increase. In addition, continued drug use was
related to an increase in violent offenses and frequency of carrying concealed weapons.
Changes in substance use are found to have a larger impact on delinquent behavior than the
reverse (Huizinga et al.).
School Problems
Truancy is also related to problems within the school setting. For example, 70% of
suspended youth were chronically truant within the last six months before their suspension.
Fifty percent of expelled students had been chronically truant in the year preceding their
expulsion (Colorado Foundation for Families and Children, 2002). Many youth who are
habitually truant are the same youth who bring weapons to school, bully peers, or disrupt the
school’s learning environment (Ingersoll & LeBoeuf, 1997).
Truants’ difficulties at school are not limited to behavioral problems. Many students
who become delinquent have undiagnosed learning disabilities (Ingersoll & LeBoeuf, 1997).
Schools must understand the link between truancy, delinquency, and school problems to
prevent further difficulties. It appears that for most jail inmates, school difficulties and
14
disengagement typically occur before crime alone forces them to drop out of school. Over a
third of jail inmates said the main reason they quit school was because of academic problems,
behavior problems, or lost interest, whereas only one in six dropped out due to illegal
activities and related consequences (Harlow, 2003).
While the relationships between truancy, dropping out, and delinquency are strong,
schools are able to intervene with school engagement, as it is considered malleable.
Commitment to school has been identified as a protective factor for avoidance of
delinquency (Huizinga et al., 1995). Students often disengage from school well before they
become habitual truants or drop out (Colorado Foundation for Families and Children, 2002;
Lee & Burkam, 2003). By decreasing truancy rates and increasing student engagement,
communities are able to prevent the poor outcomes of delinquency (Huizinga et al.). By
understanding the strong link between truancy and delinquency, communities can help
students who are at-risk for future difficulties.
Truants as Adults
The link between problematic behavior and truancy is not limited to children. Adults
who were truant as children are more likely to have difficulties in adulthood with violence,
marital problems, job problems, adult criminality, and incarceration than adults who were not
truant (Baker et al., 2001). For example, the majority of criminals were school truants
(Colorado Foundation for Families and Children, 2003). In 1997, 74.5% of state and 59.4%
of federal prison inmates had not completed high school (Harlow, 2003). Clearly, the
difficulties related to truancy do not end when the student becomes an adult.

15
The Cost of Truancy
Truancy is an issue that has financial implications for society as well. While an exact
dollar amount cannot be put on the cost to society resulting from truancy, there are
significant costs due to a less educated work force, increased daytime crime, business loss
because of said crime, cost of social services, and loss of education funding (Baker et al.,
2001; Garry, 1996). In addition, there is a negative impact of the loss of human capital when
students do not complete school (Lee & Burkam, 2003). As noted previously, if the truant
dropped out of high school, the costs increase. It is estimated that one high school dropout
costs the public over $200,000 throughout his/her life in public service programs, and each
year’s class of dropouts cost the Nation more than $240 billion in lost earnings and foregone
taxes (Colorado Foundation for Families and Children, 2003; Ingersoll & LeBoeuf, 1997).
Truancy is costly not only to society, but to individuals as well. Adults who were
truant have a reduced earning capacity (Garry, 1996). Adults who were often truant tend to
have lower paying jobs and a higher reliance on healthcare (Baker et al., 2001). The costs of
truancy to both society and those who were truant are great, and truancy interventions help
reduce these costs.
Wisconsin Law
Truancy laws are designed to help states combat truancy. These laws vary from state to
state. According to the Wisconsin Department of Public Instruction (2004), students are
legally required to attend school either until they graduate or until the end of the term in
which they turn 18. Students are required to attend school regularly during the full school
periods and hours. Truancy proceedings begin after a student misses part or all of five or
more days in a semester without an acceptable excuse. If students do not attend school, their

16
parents and guardians could be fined up to $300 or imprisoned for 30 days, for the first
offense (Wisconsin Department of Public Instruction). These laws enforce the importance of
attending school.
Green Bay Area Public School District Open/Closed Campus Research
The Green Bay Public School District shares the concerns regarding student truancy and
has conducted research to better understand truancy within the district. As part of its action
planning to reduce student absenteeism, the District gathered data regarding its open campus
policy for lunch (Green Bay Area Public Schools, 2004, November). This study found that a
higher percentage of students were truant during the periods before and after lunch than
during the remaining school periods. Of the students who were considered truant (missing
five or more periods during the school year), 21.6% had higher truancy during the periods
before and after their lunch hour. This research was presented to the School Board; however,
no decisions have been made yet regarding the school’s lunch policies.
Senior Year Planning
The Green Bay Area Public School District is now examining how to improve the
senior year to reduce student truancy. It is focusing its efforts on truant students who have
not completely disengaged from school, or those students who still attend school. In addition,
the current study examines truancy specifically for the senior year. It will identify the
relationship between senior truancy and grade point average. Next, it will determine if there
is a trend in the District regarding the types of classes that students skip. This information
will assist the District in its decision making about how to change the senior year.
17
CHAPTER III: METHODOLOGY
This research is being conducted as a pilot analysis for the Green Bay Area Public
School District’s Truancy Committee. It will determine if a link between student truancy and
low student performance exists for senior students within the Green Bay Area Public School
District. It will also describe trends in the type of courses that District seniors skip. The
following chapter reviews the student records selected, data collection procedures, data
analysis procedures, and limitations of the methodology.
Subject Selection and Description
The records of senior students within the Green Bay Area Public School District were
reviewed in this study. These records were for the first semester of the 2004-2005 school
year. These senior students’ records were selected from the District’s four regular education
high schools. Records for students who had fewer than twenty-five unexcused absences in
all periods were included in the study. The records of students who were not enrolled in their
courses throughout the semester due to dropout, chronic absenteeism, withdrawal from
courses, or incarceration were not included in the study.
Student records were then utilized to break students into two groups, non-truant and
casually truant. The first group, non-truants, consisted of students who had fewer than five
absences in all periods. The second group, casual truants, consisted of students who had
between five and twenty-five absences per period, for one or more periods.
Data Collection Procedures
Data was collected from the School District’s student record database, Zangle 2004. It
included the students’ identifying information, unexcused absences by period, and semester
grade point average. This information was transferred to an Excel 2000 file. The students’
18
schedules for the first semester were also collected from Zangle, and the absences by course
type were transferred to another Excel file.
Data Analysis
Grade point average analysis. Using the Excel 2000 file, the average of the non-
truants’ and average of the casually truants’ grade point average were calculated. Next, the
casually truant group was sub-grouped into the number of periods from which they were
truant, in increments of ten periods. The average grade point averages were then calculated
for each subgroup.
Type of courses skipped analysis. For students within the casually truant group, all
periods were identified that had been skipped five or more times during the semester. Using
Zangle 2004, the researcher determined what type of course the student was scheduled for
during their truancy. The type of course was identified by the class identification code given
by the School District. Two courses, study period and Reaching Educational and Personal
Objectives, were assigned their own category, as they identified a specific course or program
of interest. The type of course was broken down into the following categories:
1) Agri-science (courses related to the environment and natural resources, such as
Animal Science and Landscaping and Horticulture)
2) Business (courses in the field of business and marketing, such as Computerized
Accounting, Marketing, Keyboard Skills, and Web Page Design)
3) English (courses in English Language Arts, such as English, Theater, Writing, and
Communication)
4) Family and consumer sciences (courses related to family, economic, and social
systems, such as Culinary Arts, Child Service Skills, and Certified Nursing Assistant)
19
5) Math (courses in mathematics, such as Integrated Math, Geometry, Statistics, and
Calculus)
6) Personal Finance/Management (course required for graduation that addresses real-life
personal and financial situations)
7) Physical Education (courses in health and physical education, such as Physical
Education, Adaptive Physical Education, and Health)
8) Reaching Educational and Personal Objectives program (self-contained program for
special education students who are credit deficient; includes a work-study
component)
9) Science (courses in science, such as Physical Science, Biology, Chemistry)
10) Social Studies (courses in history and social issues, such as History, Economics, and
Geography)
11) Special Education (courses for students identified as having an educational disability,
such as Special Education Resource, Communication Skills, History, and Math)
12) Study Period (non-credit period in which students complete homework or study)
13) Technology Education (courses related to engineering, science, and technology, such
as Small Engines, Graphics, Architecture, and Engineering)
Categories that had fewer than 100 periods skipped were eliminated from the study, as
the categories typically had only one class within them, or had a small number of students
enrolled in the class. These categories include English as a Second Language, Foreign
Language, Music, Art, Health, Off-Campus, Utility, and Plato. The Cooperative Educational
Services Agency program was also excluded from this portion of the study, as only two
students were casually truant in that course. Courses within the category of “Other” besides
20
Study Hall and Reaching Educational and Personal Objectives were also excluded, as the
District uses this category to identify courses that do not fit into any other category.
Two students had more than one course scheduled during a period from which they
were truant. The information from this period was excluded from this portion of study, since
it could not be determined which course they had skipped.
After it was determined from which periods students were absent, the number of
absences per course was then inputted into another Excel 2000 file. These absences were
then added to determine the total number of periods skipped by course type.
Limitations
Given the nature of the research, the group sizes vary greatly between the non-truant
and casually truant groups and casually truant subgroups. In addition, the possibility of
human error for the input of data into Zangle 2004, and the input of course types into Excel
2000 exists. This analysis also only includes descriptive data, and is not intended to predict
or demonstrate causal relationships.

21
CHAPTER IV: RESULTS
This pilot analysis, which reviewed senior student attendance records, has two
purposes. The first is to find if there is a relationship between increased absences and
decreased grade point average for casually truant students. The second purpose is to
determine if there is a trend in the types of courses that casually truant seniors skip.
This analysis used student records to collect information regarding students’
attendance, grade point average, and course schedule. Using this information, the average
grade point average of non-truants and casually truant subgroups was calculated. The type of
course that students were truant from was identified and totaled. Descriptive statistics are
used to synthesize the information gathered.
The Relationship Between Absences and Grade Point Average
The analysis of average grade point averages between the non-truant and casually
truant seniors confirms the relationship between school attendance and grade point average
within the Green Bay Area Public School District. There were a total of 1376 student records
used in this portion of the study. There were 1148 students within the non-truant group, and
their average grade point average was 2.789. The casually truant group included 228
students, and the average grade point average for this group was 1.995. There was a
difference of 0.794 grade points between the two groups, indicating that the grade point
average of the casually truant group tended to be lower than the grade point average of the
non-truant group.
The average grade point average for the casually truant seniors was further examined
by subgroups based on the total number of unexcused periods in the semester. As illustrated
in Figure A, there were differences noted in average grade point average even among
22
students who had skipped only five to 14 periods per semester. The average grade point
average for the 60 students who had unexcused absences for five to 14 periods was 2.400, a
difference of 0.389 grade points from the non-truant group. For the next group, which
included 70 students who had skipped between 15 and 24 periods, the average grade point
average was 1.946, a difference of 0.843 grade points from the non-truant group.
The number of students included in each subgroup decreased for the groups that
included more than 25 period absences, and Figure A shows that average grade point average
was around 1.9 for students who skipped between 15 and 54 periods. For the 10 students who
skipped 25 to 34 periods, the average grade point average was 1.968; for the 24 students who
skipped 35 to 44 periods, it was 1.886; for the 11 students who skipped 45 to 54 periods, it
was 1.913.
The average grade point average and the number of students included in each
subgroup tended to decrease again for students who were absent for 55 or more periods, as
illustrated in Figure A. The average grade point average for the seven students who skipped
55 to 64 periods was 1.547, a difference of 1.242 grade points from the non-truant group. For
the six students who skipped 65 to 74 periods, the average grade point average was 1.672,
and for the eight students who skipped 75 to 84 periods, it was 1.664.
Grade point averages again decreased when students missed 85 or more periods. For
the eight students who skipped 85 to 94 periods, the average grade point average was 1.470.
The eight students who skipped 95 or more periods had an average grade point average of
1.322, a difference of 1.467 grade points from the non-truant group.
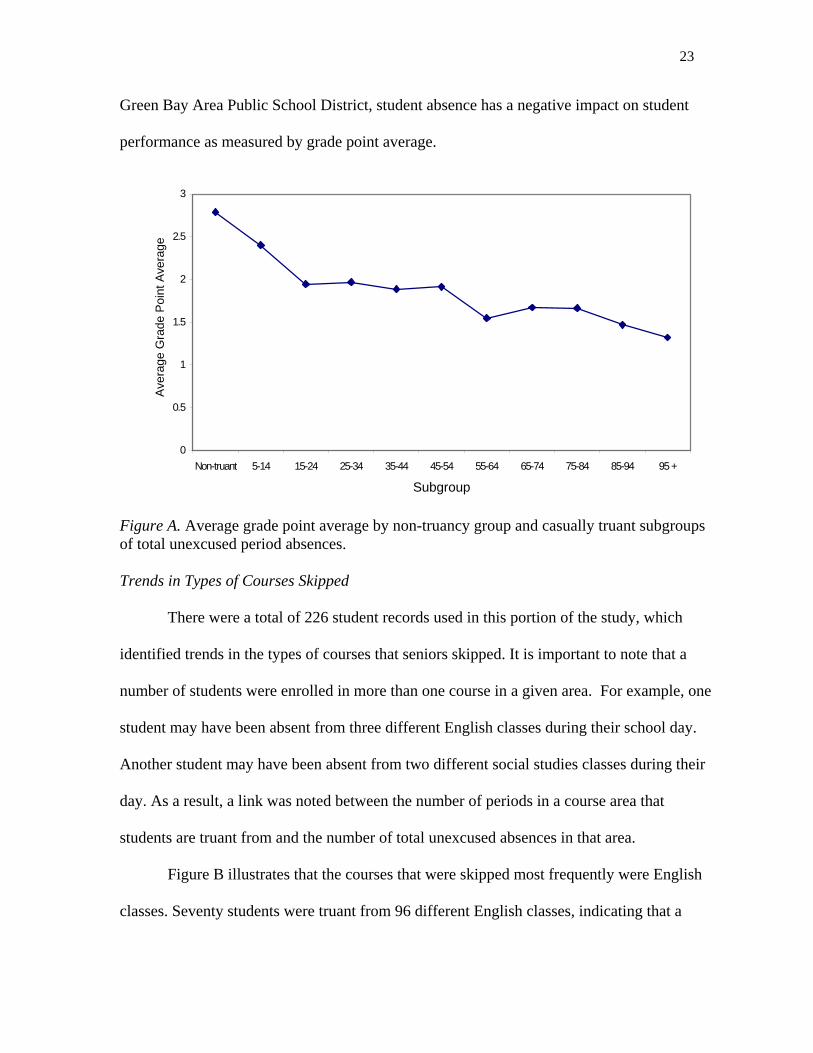
For each casual truant subgroup included, the average grade point average was lower
than the average grade point average of the non-truant group. This implies that within the
23
Green Bay Area Public School District, student absence has a negative impact on student
performance as measured by grade point average.
0
0.5
1
1.5
2
2.5
3
Non-truant 5-14 15-24 25-34 35-44 45-54 55-64 65-74 75-84 85-94 95 +
Subgroup
Ave
rage
Gra
de P
oint
Ave
rage
Figure A. Average grade point average by non-truancy group and casually truant subgroups of total unexcused period absences. Trends in Types of Courses Skipped
There were a total of 226 student records used in this portion of the study, which
identified trends in the types of courses that seniors skipped. It is important to note that a
number of students were enrolled in more than one course in a given area. For example, one
student may have been absent from three different English classes during their school day.
Another student may have been absent from two different social studies classes during their
day. As a result, a link was noted between the number of periods in a course area that
students are truant from and the number of total unexcused absences in that area.
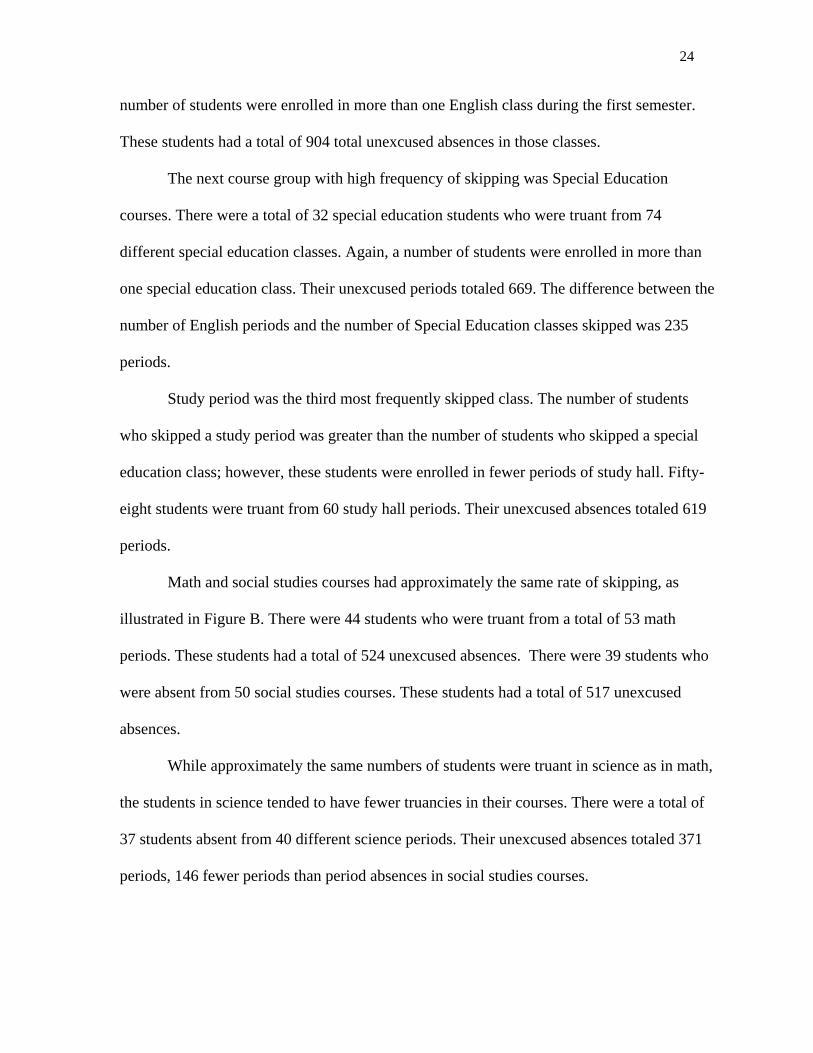
Figure B illustrates that the courses that were skipped most frequently were English
classes. Seventy students were truant from 96 different English classes, indicating that a
24
number of students were enrolled in more than one English class during the first semester.
These students had a total of 904 total unexcused absences in those classes.
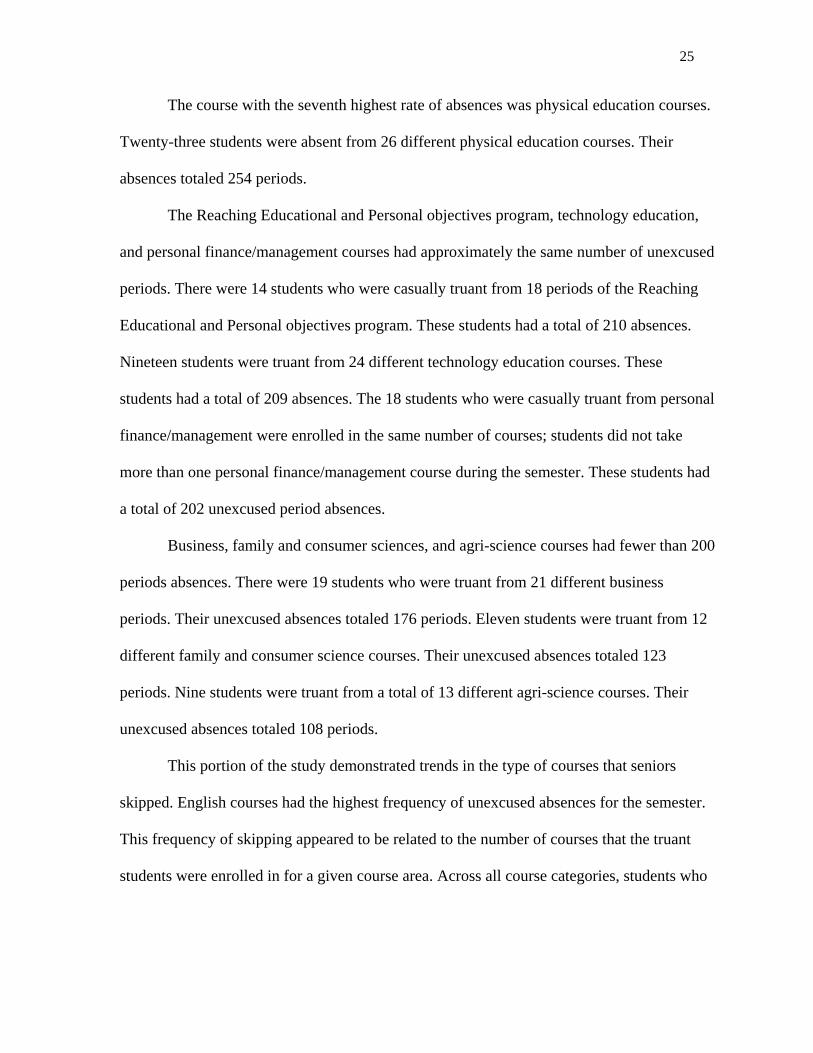
The next course group with high frequency of skipping was Special Education
courses. There were a total of 32 special education students who were truant from 74
different special education classes. Again, a number of students were enrolled in more than
one special education class. Their unexcused periods totaled 669. The difference between the
number of English periods and the number of Special Education classes skipped was 235
periods.
Study period was the third most frequently skipped class. The number of students
who skipped a study period was greater than the number of students who skipped a special
education class; however, these students were enrolled in fewer periods of study hall. Fifty-
eight students were truant from 60 study hall periods. Their unexcused absences totaled 619
periods.
Math and social studies courses had approximately the same rate of skipping, as
illustrated in Figure B. There were 44 students who were truant from a total of 53 math
periods. These students had a total of 524 unexcused absences. There were 39 students who
were absent from 50 social studies courses. These students had a total of 517 unexcused
absences.
While approximately the same numbers of students were truant in science as in math,
the students in science tended to have fewer truancies in their courses. There were a total of
37 students absent from 40 different science periods. Their unexcused absences totaled 371
periods, 146 fewer periods than period absences in social studies courses.
25
The course with the seventh highest rate of absences was physical education courses.
Twenty-three students were absent from 26 different physical education courses. Their
absences totaled 254 periods.
The Reaching Educational and Personal objectives program, technology education,
and personal finance/management courses had approximately the same number of unexcused
periods. There were 14 students who were casually truant from 18 periods of the Reaching
Educational and Personal objectives program. These students had a total of 210 absences.
Nineteen students were truant from 24 different technology education courses. These
students had a total of 209 absences. The 18 students who were casually truant from personal
finance/management were enrolled in the same number of courses; students did not take
more than one personal finance/management course during the semester. These students had
a total of 202 unexcused period absences.
Business, family and consumer sciences, and agri-science courses had fewer than 200
periods absences. There were 19 students who were truant from 21 different business
periods. Their unexcused absences totaled 176 periods. Eleven students were truant from 12
different family and consumer science courses. Their unexcused absences totaled 123
periods. Nine students were truant from a total of 13 different agri-science courses. Their
unexcused absences totaled 108 periods.
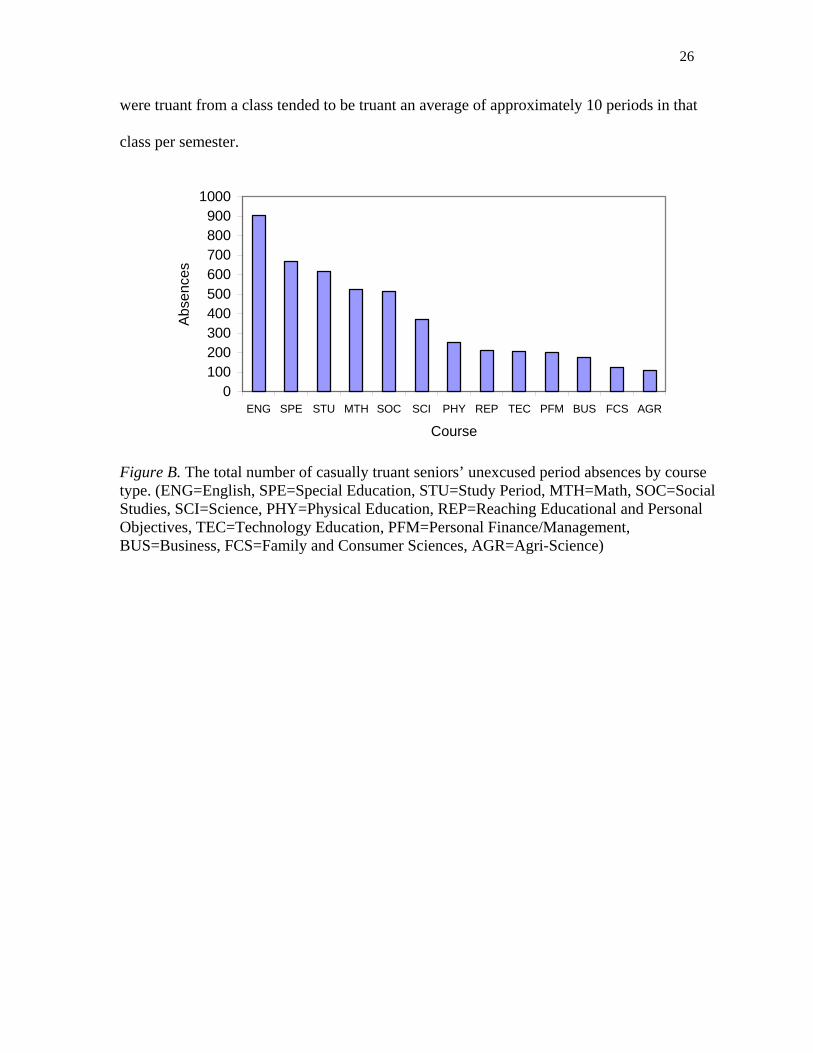
This portion of the study demonstrated trends in the type of courses that seniors
skipped. English courses had the highest frequency of unexcused absences for the semester.
This frequency of skipping appeared to be related to the number of courses that the truant
students were enrolled in for a given course area. Across all course categories, students who
26
were truant from a class tended to be truant an average of approximately 10 periods in that
class per semester.
0100200300400500600700800900
1000
ENG SPE STU MTH SOC SCI PHY REP TEC PFM BUS FCS AGR
Course
Abs
ence
s
Figure B. The total number of casually truant seniors’ unexcused period absences by course type. (ENG=English, SPE=Special Education, STU=Study Period, MTH=Math, SOC=Social Studies, SCI=Science, PHY=Physical Education, REP=Reaching Educational and Personal Objectives, TEC=Technology Education, PFM=Personal Finance/Management, BUS=Business, FCS=Family and Consumer Sciences, AGR=Agri-Science)
27
CHAPTER V: DISCUSSION
Truancy is an important issue in today’s society. Schools play an important role in
preparing students for the workforce and for life. There are a number of family, economic,
school, and student factors that coincide with truancy. In addition, researchers have identified
a link between student performance and student attendance. As students are increasingly
truant from school, their performance (as measured by grade point average and standardized
test scores) tends to decrease. Many students who drop out from school were previously
truant from school, and their disengagement began before they dropped out.
Truancy is also part of a developmental pathway that can lead to additional problems
for students. Truancy is considered a warning sign for delinquency, social isolation,
educational failure, and risk of pregnancy. Truants are at a higher risk for substance use than
non-truants, especially at the middle school level. Students who are truant are more likely to
have problems in school, including suspension and expulsion.
The issues related to truancy continue when the student becomes an adult. Adults who
were truant as children are more likely to have difficulties in adulthood with violence, marital
problems, job problems, adult criminality, and incarceration than adults who were not truant.
There are considerable costs of truancy to society due to a less educated work force,
increased daytime crime, business loss because of said crime, cost of social services, and loss
of education funding.
Truancy is also an important issue within the Green Bay Area Public School District, and
has been studied by the District. One study found that there were higher rates of truancy in
the hour before and after the lunch period. A committee was formed to tackle the issue of
truancy within the District. It is currently focusing its efforts on the senior year, and on

28
students it defines as “casually truant.” This study is a pilot data analysis for the District
truancy committee. It examines senior student truancy and grade point average, and identifies
the types of courses that students tend to skip. The information gathered from this study will
assist the District with further planning.
Limitations
This study is only intended to represent senior truancy data within the Green Bay
Area Public School District. It is not intended to predict or determine causal relationships.
There is the possibility for human error within the analysis, and the group sizes vary.
Conclusions
The Grade Point Average Analysis confirmed that as student absences increase,
student performance decreases, as measured by grade point average. Students who were not
truant tended to have a higher grade point average than students who were casually truant. In
addition, students who were more often truant had lower grade point averages than students
who were less often truant; however, this relationship was not perfectly linear. Large
differences in grade point average were noted between the non-truant group and the casually
truant group that had skipped five to 14 periods. The grade point average then seemed to
plateau around 1.9 for casual truants who had skipped 15 to 54 periods. Grade point average
again decreased in the groups that had higher rates of truancy.
Analysis of student attendance records and schedules indicates that English courses
had the highest frequency of skipping by seniors. It is important to note that the District
requires four credits of high school English for graduation, more credits than required for any
other course area. A number of truant students were enrolled in, and therefore truant from
more than one English course. For example, several students were enrolled in three English
29
classes during the semester, presumably to meet graduation requirements. When these
students were casually truant, their truancy was typically in more than one English course.
Special education courses had the second highest frequency of skipping. As with
English courses, there were a large number of students who were enrolled in more than one
special education course. In addition, students with disabilities tend to have higher rates of
truancy than non-disabled peers, according to District reports. These two factors help explain
why truancy rates in special education courses are quite high considering the number of
students enrolled in them.
One interesting finding was that study period also had a high frequency of truancy.
Both the English and special education categories had more than one class within them; that
is to say, they represented more than one course. Study period, on the other hand included
only one class, and only two students were enrolled in more than one study period.
Nevertheless, study hall had the third highest frequency of periods skipped. It is possible that
students do not view study hall as an important class since the period is for independent work
rather than instruction. It is also possible that more truant students enroll in a study hall so
that they can make up the missed work from their truancy in other courses.
Another finding was that the number of different periods the students were truant
from was related to the number of total unexcused periods. In all categories, students who
were truant from any course were likely to be absent approximately ten times in that course
per semester. This indicates that while students may have shown a preference for skipping
one class over another, the frequency of skipping that class was approximately equal across
class categories.

30
Recommendations
District changes. This study was intended to provide information that would help the
District understand senior truancy better, and to provide baseline data for the casually truant
group. Based on the study’s findings, several changes to the senior year could be explored
further.
As found in previous research, truant students often have difficulty catching up after
they are truant, which can lead to dropout. The District provides the opportunity for students
to obtain the credits necessary for graduation by allowing students to take more than one
English class. As the study found, though, students tend to have high truancy rates in
English. Perhaps the District should explore other possibilities for helping students to catch
up in English rather than enrolling students in separate one-credit English courses. For
example, the District could offer an English course that is designed specifically for students
who are credit deficient in English. The course could span over two periods, and would allow
for students to have a comprehensive two credit English course rather than taking two
separate courses. It would allow for seniors to receive remedial instruction before tackling
the more difficult work expected of senior-level English courses. In addition, students would
be able to focus on one course rather than two. There would be less overlap of large or
similar assignments that they may have in separate courses.
The course area that had the second highest frequency of truancy was special
education. This is especially problematic considering special education students already have
another barrier to learning besides attendance. In addition, special education students have
smaller class sizes and have more opportunities to build relationships with staff, factors that
typically decrease the likelihood of truancy. The Truancy Committee plans to hold a focus

31
group to ask seniors for their perspectives on truancy, and what changes could be made to
decrease truancy. Perhaps the District would find it beneficial to hold such focus groups
specifically for special education students. This would help the District to determine how to
better meet the needs of these students.
The Green Bay Area Public School District has demonstrated in previous research
that student truancy tends to be higher in the periods before and after lunch. To date, the
Board of Education has not reached consensus to close the campus during lunch, which the
District hopes would lower truancy. Perhaps another viable option would be to hold open
study halls for seniors during the hour before or after lunch. This would allow students who
wish to take an extended lunch off campus to do so without being truant. It would also allow
students the opportunity to make decisions about how to best use their free time, decisions
that they will be making after graduation. In addition, the open study hall could be used as an
incentive for attending class.
Previous research has demonstrated that truancy interventions are most effective
when they address not only student truancy, but are also a collaborative effort to address
delinquency and substance abuse. While changing the senior year may impact senior student
truancy, the School District may also want to consider a more comprehensive intervention for
those students who need additional support to return to school.
Future truancy research. While the current focus of this study is senior truancy, the
District Truancy Committee plans to examine truancy at all levels of education. The District
may find it beneficial to conduct similar analyses at the different grade levels to determine if
the trends demonstrated in the present study are consistent across grade levels.

32
This study points to new research that would be beneficial to both the District and to
other truancy researchers. First, the trend in classes skipped appeared to vary for students
who had fewer than 15 total unexcused period absences. These students were often truant in
only one course during the day. It appeared that the students who had fewer than 15 total
unexcused periods tended to skip less academically demanding courses, namely study hall
and physical education. This observation can only be verified by further research.
This study also indicates trends in the types of courses seniors skip that may or may
not exist in other school districts. Other districts may find it beneficial to conduct similar
research that would determine if their students skip the same types of courses as students
within the Green Bay Area Public School District. This would help educators examine if
there are certain areas of instruction or programs that may need to be redesigned to better
engage students.
The Green Bay Area Public School District has high truancy and low attendance rates
when compared to Wisconsin districts of comparable size. As they did with their
Open/Closed Campus Report, the District may wish to consult with these other districts
regarding their truancy policies and interventions. This would help the District to understand
how other districts in Wisconsin are working to engage students.
Most research in truancy has focused on habitual truants and students who have
dropped out. The Green Bay Area Public School District has proposed another level of
disengagement between non-truants and truants, those students it defines as casual truants.
This is a step in the direction of understanding and studying disengagement and truancy as
continuums rather than distinctive categories. According to the current definitions of truancy,
a student who has skipped study hall 5 times during the semester and a student who has

33
skipped 75 days out of the semester are grouped together as habitual truants. It seems
intuitive that these students will likely need different interventions to encourage them to
return to school full-time, and that they will need different supports to remain in school once
they have returned. By understanding the different levels of truancy, we will be more able to
understand truants and therefore design effective interventions.
Truancy is an issue that has not received a great deal of public attention despite its
links to many other problems. Research is important as it increases knowledge of truancy and
helps the public to understand the issues related to truancy better. As society expects students
to gain specific knowledge and skills from education, we must make sure that they are
coming to school and attending their classes.
34
REFERENCES
American Psychological Association (2001). Publication Manual of the American
Psychological Association (5th ed.). Washington, DC: Author.
Anderson, E. S., & Keith, T. Z. (1997). A longitudinal test of a model of academic success
for at-risk high school students. The Journal of Educational Research, 90, 259-268.
Baker, M. L., Sigmon, J. N., & Nugent, M. E. (2001, September). Truancy reduction:
Keeping students in school. Office of Juvenile Justice and Delinquency Juvenile
Justice Bulletin. Retrieved March 22, 2005, from
www.ncjrs.org/html/ojjdp/jjbul2001_9_1/contents.html
Bass, R. V. (1997). The purpose of education. The Educational Forum, 61, 128-132.
Bosworth, D. (1994). Truancy and pupil performance. Education Economics, 2(30), 243-264.
Caldas, S. J. (1993). Reexamination of input and process factor effects on public school
achievement. Journal of Educational Research, 86(4), 206-214.
Colorado Foundation for Families and Children (2002, September). Youth out of school:
Linking absence to delinquency. Retrieved March 20, 2005, from
www.truancyprevention.org/documents/DonnerReport2_001.pdf
Colorado Foundation for Families and Children (2003, October). Saving money, saving
youth. Retrieved March 20, 2005, from
www.truancyprevention.org/documents/Donner-FINALREPORT2003_003.pdf
Fredricks, F. A., Blumenfeld, P. C., & Paris, A. H. (2004). School engagement: Potential
of the concept, state of the evidence. Review of Educational Research, 74(1), 59-109.
35
Garry, E. M. (1996, October). Truancy: First step to a lifetime of problems. Office of
Juvenile Justice and Delinquency Prevention Juvenile Justice Bulletin. Retrieved
March 22, 2005, from www.ncjrs.org/pdffiles/truncy.pdf
Gavin, T. (1997). Truancy. FBI Law Enforcement Bulletin, 66(3), 8-14.
Gehring, J. (2004). Districts tackling truancy with new zeal. Education Week, 24(4), 1-2.
Green Bay Area Public School District (2003, July). Strategic plan. Unpublished manuscript.
Green Bay Area Public School District (2004, December). Student learning and performance
data, 2003-2004 school year. Unpublished manuscript.
Green Bay Area Public School District (2004, November). High school open/closed campus
study report. Unpublished manuscript.
Gump, S. E. (2004). The truth behind truancy: Student rationales for cutting class.
Educational Research Quarterly, 28(2), 50-58.
Hallfors, D., Vevea, J. L., Iritani, B., Cho, H., Khatapoush, S., & Saxe, L. (2002).
Truancy, grade point average, and sexual activity: A meta-analysis of risk indicators
for youth substance use. Journal of School Health, 72(5), 205-211.
Harlow, C. W. (2003, January). Education and correctional populations. Department of
Justice Bureau of Justice Statistics Special Report. (ERIC Documentation
Reproduction Service No. ED477377).
Huizinga, D., Loeber, R., & Thornberry, T. P. (1995, August). Urban delinquency and
substance abuse, initial findings. Office of Juvenile Justice and Delinquency
Prevention.
36
Ingersoll, S., & LeBoeuf, D. (1997, February). Reaching out to youth out of the education
mainstream. Office of Juvenile Justice and Delinquency Prevention Juvenile Justice
Bulletin. (ERIC Documentation Reproduction Service No. ED408667).
Johnson, G. M. (1997). Teachers in the inner city: Experience-based ratings of factors that
place students at risk. Preventing School Failure, 42, 19-26.
Johnson, G. M. (2000). The impact of risk factors: A survey of inner-city school principals.
Child Study Journal, 30(3), 187-204.
Lamdin, D. J. (1996). Evidence of student attendance as an independent variable in education
production functions. The Journal of Educational Research, 89, 155-162.
Lauchlan, F. (2003). Responding to chronic non-attendance: A review of intervention
approaches. Educational Psychology in Practice, 19(2), 133-146.
Lee, V. E., & Burkam, D. T. (2003). Dropping out of high school: The role of school
organization and structure. American Educational Research Journal, 40(2), 353-393.
National Center for School Engagement (2005). Truancy Fact Sheet. Retrieved March 18,
2005, from http://www.truancyprevention.org/documents/TruancyFactSheet.pdf
Phi Delta Kappa (2003, August). The annual Gallup poll of the public’s attitudes toward
the public schools, selected years 1970-2003. Phi Delta Kappan. Retrieved March 2,
2005, from http://nces.ed.gov/programs/digest/d03/tables/pdf/table23.pdf
Wisconsin Department of Public Instruction (2004). Answers to Frequently Asked
Compulsory School Attendance Questions. Retrieved March 22, 2005, from
www.dpi.state.wi.us/dpi/dlsea/sspw/pdf/attendqa2.pdf
Zangle Desktop (2004). [Computer software]. Claremont, CA: C Innovation.