Embed Size (px)
Citation preview

A Data Acquisition, Reporting and AnalysisSoftware Package
Developed For the Environmental ProfessionalEngaged in:
Air Quality StudiesMeteorological Studies
ModelingPermitting
P.O.Box 500207 Austin, Texas 78750Phone (512) 918-8035 Fax (512) 9128-9684 email: [email protected]

2
Table of Contents
1 Introduction..............................................................................................................62 Software Installation.................................................................................................7
2.1 System Requirements .....................................................................................72.2 Installation .......................................................................................................72.3 The Data link Menu and Icon Bars...................................................................7
3 DataLink/AQM Station Configuration .......................................................................93.1 Add a New DataLink/AQM Station...................................................................93.2 Update a DataLink/AQM Station Configuration..............................................11
3.2.1 Modify an Existing DataLink/AQM Station Configuration............................113.2.2 Creating/Changing a Password for Configuration Modification...................11
3.3 Configure a Data Logger Station in DataLink/AQM........................................123.3.1 Info Tab (Figure 3-6)..................................................................................123.3.2 Connect Tab (Figure 3-7)...........................................................................133.3.3 Download Data Logger Configuration ........................................................153.3.4 RealTimeMode Spec. Tab (Figure 3-8)......................................................153.3.5 Memo Tab (Figure 3-9) ..............................................................................173.3.6 Wind Rose Tab (Figure 3-10).....................................................................183.3.7 Table ID Tab..............................................................................................193.3.8 Timing Tab (Figure 3-20) ...........................................................................293.3.9 Parameters Tab (Figure 3-21)....................................................................293.3.10 Config Import/Export Tab.......................................................................30
3.4 Remove a Station from DataLink/AQM ..........................................................324 Terminal Mode.......................................................................................................33
4.1 Set Data Logger Clock...................................................................................344.2 Synchronize PC Clock...................................................................................354.3 Retrieve the Data Logger Configuration into DataLink/AQM ..........................354.4 Configure a Data Logger with DataLink/AQM’s configuration.........................374.5 Hot Buttons....................................................................................................37
5 Automatic Polling ...................................................................................................395.1 Activate Automatic Polling .............................................................................395.2 Daily Polling...................................................................................................395.3 Repetitive Polling...........................................................................................405.4 Initiate Automatic Polling ...............................................................................415.5 Remove a Station from a Polling Group.........................................................415.6 Create Additional Polling Groups (Figure 5-5 & Figure 5-6) ...........................415.7 Remove a Polling Group................................................................................42
6 Automatically Print Reports....................................................................................436.1 Add a Station to the Automatic Print Queue...................................................436.2 Remove a Station from and Automatic Print Queue.......................................446.3 Add or Remove Automatic Print Queues .......................................................446.4 Create a Daily Report Template ....................................................................44
6.4.1 Select Channels to Report .........................................................................456.4.2 Report Orientation .....................................................................................456.4.3 Name a Report and Assign a Template Name...........................................466.4.4 Separate Reports.......................................................................................476.4.5 Data Source...............................................................................................476.4.6 Preview a Report .......................................................................................47

3
6.4.7 Save a Report Template............................................................................477 View Data and/or Manually Print Reports...............................................................48
7.1 Channel Definition Table ...............................................................................487.2 Report Date ...................................................................................................497.3 View Channel Data........................................................................................497.4 Modify Data ...................................................................................................507.5 Reports Available ..........................................................................................50
7.5.1 Annual Report (Fig. x.x) .............................................................................507.5.2 Monthly Report (Fig. x.x)............................................................................527.5.3 Daily Report (Fig. x.x.) ...............................................................................537.5.4 Aux (Interim) Report (Fig. x.x)....................................................................547.5.5 Monthly Detail Report (Fig. x.x)..................................................................557.5.6 Channels Output Report (Fig. x.x) .............................................................567.5.7 Calibration Report (Fig x.x) ........................................................................577.5.8 Alarms and Alarm Reports (Fig. x.x) ..........................................................587.5.9 Text File Reports (Fig x.x)..........................................................................587.5.10 Alarm Status Report (Filtered) (Fig. x.x).................................................59
8 Trend Charts..........................................................................................................608.1 Multi Station/Multi Channel Trend Charts.......................................................60
8.1.1 Alter Type of Trend Chart ..........................................................................628.1.2 Alter Chart Appearance .............................................................................638.1.3 Print and Save Charts and Chart Configurations .......................................658.1.4 Automatic Chart Update.............................................................................65
8.2 Single Station/Multi Channel Trend Charts ....................................................659 Wind Rose .............................................................................................................66
9.1 Wind Rose Plot Setup....................................................................................669.2 Wind Rose Plot Update .................................................................................66
10 Back-Up and Recovery......................................................................................6811 Real Time Data Acquisition ...............................................................................71
11.1 Meter Setup...................................................................................................7111.1.1 Gauge Configuration..............................................................................7111.1.2 LED Display Setup.................................................................................72
11.2 Real Time Trend Charts ................................................................................7311.2.1 Initialize Trend Charts ............................................................................73
12 Retrieve Data Manually .....................................................................................74

4
Table of Figures
Figure 2-1 Main Screen Menu and Icon Bars ..................................................................8Figure 3-1 DataLink/AQM Icon........................................................................................9Figure 3-2 Main DataLink/AQM Screen...........................................................................9Figure 3-3 Add New Station Pop-Up Box ......................................................................10Figure 3-4 Station Config Pop-up Box...........................................................................11Figure 3-5 Change Password Pop-Up Box....................................................................12Figure 3-6 Station Configuration Info Tab Screen .........................................................13Figure 3-7 Connect Tab Screen ....................................................................................14Figure 3-8 Real Time Mode Specification Tab Screen ..................................................16Figure 3-9 Station Configuration Memo Tab Screen .....................................................18Figure 3-10 Wind Rose Tab Screen..............................................................................19Figure 3-11 Table ID Tab - Hourly Tab Screen..............................................................20Figure 3-12 Text Output Rules/Channels [Hourly Record] – Type/Naming Rule Screen22Figure 3-13 Text Output Rule / Channel - Channel Tab Screen ....................................23Figure 3-14 Text Output Rule / Channel - Output Tab Screen.......................................25Figure 3-15 Location of Output Files .............................................................................25Figure 3-16 Text Output Rule / Channel - Import Tab Screen .......................................26Figure 3-17 Table ID Tab - Aux Tab Screen..................................................................27Figure 3-18 Table ID Tab - Alarm Tab Screen ..............................................................28Figure 3-19 Table ID Tab - Calibration Tab Screen.......................................................28Figure 3-20 Data Transfer Timing Screen .....................................................................29Figure 3-21 Hot Button Parameters Tab Screen ...........................................................30Figure 3-22 Import a DataLinkAQM Configuration Screen ............................................31Figure 3-23 Export a DataLinkAQM Configuration Screen ............................................31Figure 3-24 Remove a Station from DataLink/AQM.......................................................32Figure 4-1 Terminal Mode Opening Screen ..................................................................33Figure 4-2 Terminal Mode Extended Functions Screen.................................................34Figure 4-3 Set Logger Date/Time Warning Pop Up Box ................................................34Figure 4-4 Set Logger Date/Time Pop Up Box ..............................................................35Figure 4-5 Report ... Default FileName Screen.............................................................35Figure 4-6 Channel Subdirectory display on Main DataLink/AQM Screen.....................36Figure 4-7 Configuration Save As Screen .....................................................................36Figure 4-8 Send Configuration Screen ..........................................................................37Figure 5-1 Select Stations for Automatic Polling............................................................39Figure 5-2 Change Daily Poll Execution Time ...............................................................40Figure 5-3 Change Repetitive Polling Start Time...........................................................40Figure 5-4 Remove a Station from a Polling Group .......................................................41Figure 5-5 Create a New Polling Group ........................................................................41Figure 5-6 Add New Group Pop-Up Box .......................................................................42Figure 5-7 Remove a Polling Group..............................................................................42Figure 6-1 Select Stations for Automatic Report Printing...............................................43Figure 6-2 Change Time Automatic Reports Print .........................................................43Figure 6-3 Data Browser Screen...................................................................................44Figure 6-4 Daily Average Report Screen.......................................................................45Figure 6-5 Print Setup Screen.......................................................................................46Figure 7-1 Channel Definition Screen ...........................................................................49Figure 8-1 Trend Chart (Multi Station) Screen - Channels Tab (No Chart) ....................61

5
Figure 8-2 Trend Chart (Multi Station) Screen - Channels Tab (Chart)..........................62Figure 8-3 Chart Appearance Editor..............................................................................64Figure 10-1 Password of BackUp Pop Up Box..............................................................68Figure 10-2 Data BackUp Screen .................................................................................69
6
1 IntroductionDataLink/AQM is a Data Acquisition Software package for environmental monitoring andmeteorological study that maintains tradition for the tenured environmental professional.The software allows direct or modem connection to H2NS, or a variety of othermanufacturers, data loggers.
Key Functions:• Automatic or manual polling of interim and/or final data from multiple data loggers
(stations) at multiple locations at customer determined frequency and times.• Automatic alarm flags to alert operators of out of spec performance.• Automatic or manual reporting of custom configured reports from multiple data
loggers.• Multi Station/Multi Channel Trend Charts in Line, Bar, Area and/or 3D formats.• Wind Rose Plots• Alarm and Calibration documentation• “Real Time” access of instantaneous data, as often as every ten seconds, in a
variety of formats: Meters, Bar Charts, Trend Charts and Tabular summarieswith max/min, interval averaging and totals in a separate “Real Time” database.
• Real Time and Terminal Mode access to configured data loggers.• Hot Button access to set/unset data logger digital status bits and relays.• Pass through access to serial port Instrumentation for monitoring, configuration,
calibration and troubleshooting.• Edit and/or export Final and Interim nonproprietary databases to popular spread
sheets and applications (e.g. Excel and Access)• Ease of set up by automatically passing data logger configuration in either
direction.
This manual describes how to customize and use DataLink/AQM to monitor and controldata loggers and attached instruments and obtain accurate, timely, and tailored data,reports and charts.

7
2 Software Installation
2.1 System RequirementsThe minimum system requirements for running DataLink/AQM are:
• Pentium 233 or better processor• Windows 95, 98, 2000, ME, NT4.0, XP• 64MB Ram• 33.6K Data/Fax Modem (56K V90 recommended)• 2.4GB Hard Drive or Larger• 600 x 800 pixel minimum SVGA Monitor• Color Printer, Optional (recommended)
2.2 InstallationOpen the computer’s CDROM tray. Insert the DataLink/AQM distribution CDROM andclose the tray.
Prior to installation, make a copy of your DataLink/AQM distribution CDROM. If aCDROM “burner” (CD/RW drive) is not available, copy each of the “disks” (directories)on the CD to individual 3.5" diskettes. Number the diskettes sequentially. Store them ina secure, climate-controlled area. While this step is not necessary, it is good practice.
Select "Start", "Run" then "Browse".
In the "Browse” window double click your CDROM drive (D:, E:, etc.).
Double click "Disk 1."
Select startup and click OK.
The serial number of the software is on the CD label and on the CD jewel box carrierlabel.
2.3 The Data link Menu and Icon Bars
Figure 2-1 is a representation of DataLink/AQM’s Main Screen Menu and Icon Bar. Itwill be referred to throughout this manual. The icon names used in this manual will bethe same as the pop up identifier which is displayed on screen when the mouse pointeris paused over the icon on the main DataLink/AQM screen.

8
Figure 2-1 Main Screen Menu and Icon Bars
Icon Bar
Menu Bar
Title Bar
1. Data Browser
2. Trend Chart
3. Wind Rose Plot
4. Back Up Data
5. Terminal Mode
6. Retrieve Data 7. Real Time Mode 8. Display Real Time Meters
9. Display RealTime Charting
10. ToggleAuto QueueOn and Off
9
3 DataLink/AQM Station ConfigurationFor a data logger’s data to be available for analysis and reporting, the station must beconfigured in DataLink/AQM.
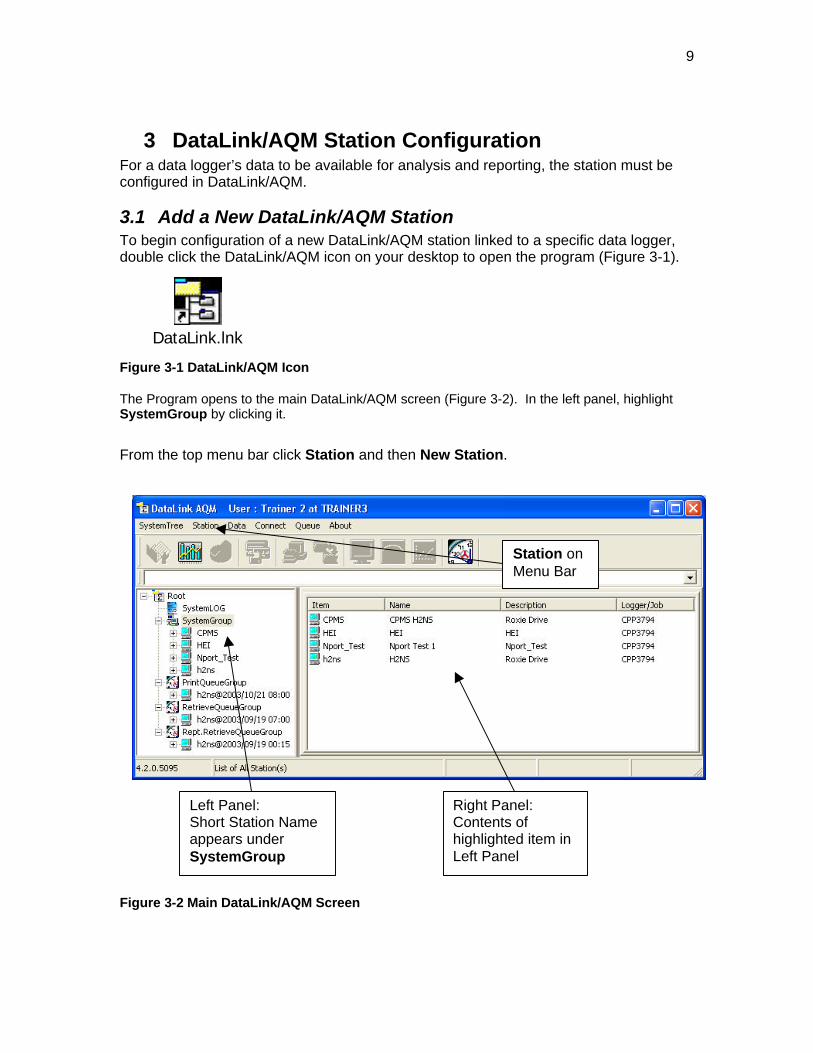
3.1 Add a New DataLink/AQM StationTo begin configuration of a new DataLink/AQM station linked to a specific data logger,double click the DataLink/AQM icon on your desktop to open the program (Figure 3-1).
Figure 3-1 DataLink/AQM Icon
The Program opens to the main DataLink/AQM screen (Figure 3-2). In the left panel, highlightSystemGroup by clicking it.
From the top menu bar click Station and then New Station.
Figure 3-2 Main DataLink/AQM Screen
DataLink.lnk
Left Panel:Short Station Nameappears underSystemGroup
Right Panel:Contents ofhighlighted item inLeft Panel
Station onMenu Bar

10
In the Add New Station window that appears, input a Station ID. This identifier is astation reference. It is limited to 10 characters and is intended as an short station namefor easy identification. Give it a short name that relates to the actual station name(Figure 3-3).
Figure 3-3 Add New Station Pop-Up Box
If data is available on an INI file to configure the new station, click the Import StationConfiguration From INI File check box. Next, click the browse button to the right ofthe StationConfig.INI box to select the file from its network location.
The Station Database Folder section allows the selection of where the newstation’s database will be located on the computer’s network. To use the defaultfolder (C:\DataLink\XXX Station) simply click the “Ok” button. However, to selecta customized location in a folder on the local computer, a file server, or anylocation on the computer’s network, click the User Define radio button and eithertype in the location, or select it from the browser button on the right side of thebox.
Once the database folder location is selected, default or custom, click Ok. The station IDwill appear in the left panel of the main page and the Station Configuration windowappears. To continue go to Section 3.3.
Type in a ShortStation Name
Browser Buttons
Radio Buttons
Check Box

11
3.2 Update a DataLink/AQM Station ConfigurationIt is often necessary to update station configuration information after the station hasbeen given a short station ID (name) on the main data link page. In fact, it must be doneduring initial station configuration as will be discussed later (Section 3.3.3).
3.2.1 Modify an Existing DataLink/AQM Station ConfigurationIf DataLink/AQM is not running, double click the DataLink/AQM icon on your desktop toopen the program (Figure 3-1). The main DataLink/AQM screen (Figure 3-2) appears.
In the left panel, highlight the abbreviated Station Name of the data logger to beupdated.
On the menu bar at the top of the screen, select Station and then ModifyStation.
Enter a password, if necessary, in the Station Config pop-up box and click Ok (Figure3-4). The Station Configuration window appears.
3.2.2 Creating/Changing a Password for ConfigurationModification
The first time a station is opened after it is created; no password is required to modifythe station configuration. To add or change a password, begin to open the station asdescribed above. However, rather than clicking the Ok button; click the Change buttonin the lower right hand corner of the password window (Figure 3-4).
Figure 3-4 Station Config Pop-up Box
In the Change Password pop-up box, enter the old password (or skip to the first newpassword box if there is no password). Enter a new password in the second box. Enterthe new password again in the third box to assure it was entered correctly the first time.Then click Ok (Figure 3-5).
Password Change Button
Enter Password (if necessary) orclick Password Change Button

12
Figure 3-5 Change Password Pop-Up Box
Once a password has been assigned, a user has three chances to enter the correctpassword before clicking Ok or the System Config screen will automatically close.
3.3 Configure a Data Logger Station in DataLink/AQMThe Station Configuration window appears when Ok is clicked in either the Add NewStation window (Section 3.1) or the Station Config window when Modify Station isselected (Section 3.2.1). The Station Configuration window has nine separate tabs forstation configuration information. The Info tab is the default tab when the StationConfiguration widow first appears.
3.3.1 Info Tab (Figure 3-6)When the Info tab is active, Basic Station Information appears in the tab identificationblock above the tab row.
The Station Name on this screen is the name that will be attached to all data recordsand reports. This name is an expansion of the abbreviated name used when the stationwas set up as a “new” station. It is a descriptive name such as “Austin Met Tower”, “6th
street Ozone”, etc. Simply type the Station Name (limited to 30 characters) in the box.
If you plan to automatically poll the station for data (usually the case), click the EnableQueue check box.
For further identification, enter the station’s physical address in the Station Address box(optional).
Next, click the Logger Type drop down box; highlight the appropriate logger (CPP-3794or DSM3260), and click.
Enter Old Password(if any)
Enter NewPassword Twice

13
Figure 3-6 Station Configuration Info Tab Screen
If a DSM is selected, a Unit ID drop down box appears. Click the drop down box,highlight the appropriate $ ID for the DSM (i.e. $1) and click.
If a CPP is selected, three areas appear. The Unit ID drop down box defaults to "h". Ifmore than two CPPs are at the same site, sharing the same Communication Line, thesecond CPP would have an ID of “i”, the third “j”, etc. The Hangup ID drop down boxdefaults to “u” and should not be changed. The CPP 3794 ID defaults to “010”. This isalways its identifier and should be left intact.
3.3.2 Connect Tab (Figure 3-7)While in the Station Configuration window (Section 3.3), click the Connect tab.Connection Information (RS232 & Tel) appears in the tab identification block abovethe tab bar.
Short StationName HeaderTab Identification Block
Enter Full Station Name
Click check box toenable auto collection ofstation data
Tab Bar
Channels buttonopens theChannels DefinitionTable screen
Enter StationAddress
Drop DownBoxes
14
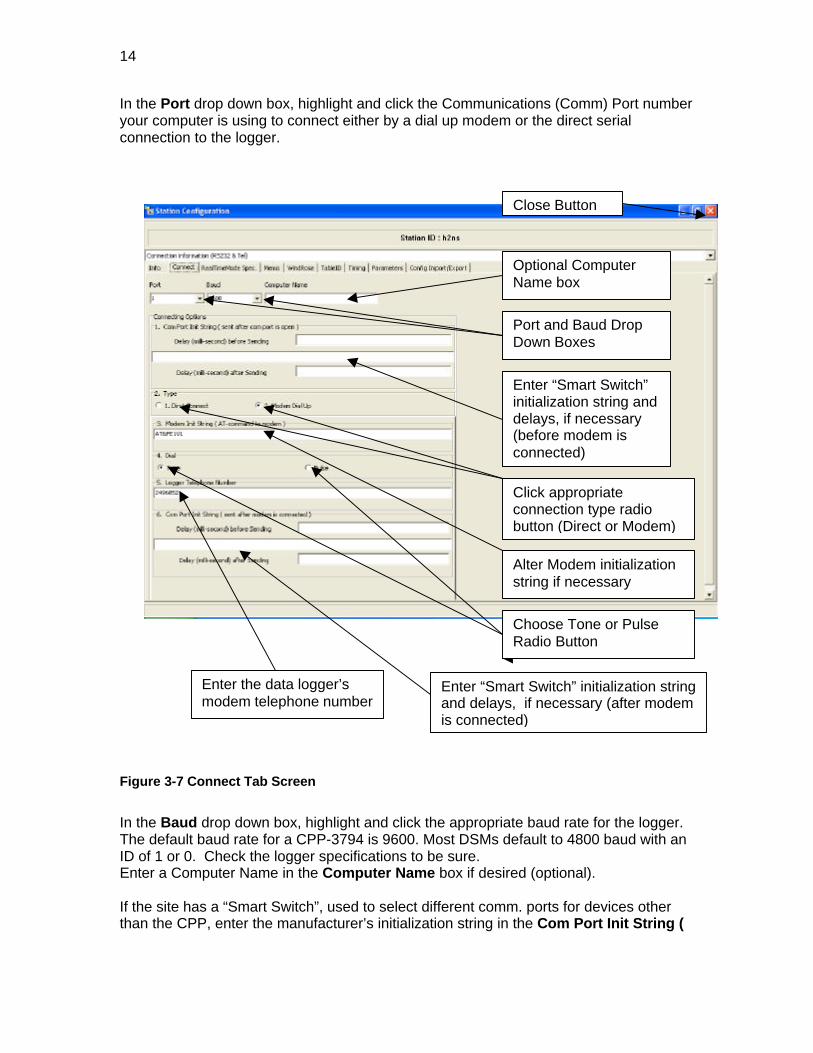
In the Port drop down box, highlight and click the Communications (Comm) Port numberyour computer is using to connect either by a dial up modem or the direct serialconnection to the logger.
Figure 3-7 Connect Tab Screen
In the Baud drop down box, highlight and click the appropriate baud rate for the logger.The default baud rate for a CPP-3794 is 9600. Most DSMs default to 4800 baud with anID of 1 or 0. Check the logger specifications to be sure.Enter a Computer Name in the Computer Name box if desired (optional).
If the site has a “Smart Switch”, used to select different comm. ports for devices otherthan the CPP, enter the manufacturer’s initialization string in the Com Port Init String (
Optional ComputerName box
Port and Baud DropDown Boxes
Enter “Smart Switch”initialization string anddelays, if necessary(before modem isconnected)
Click appropriateconnection type radiobutton (Direct or Modem)
Alter Modem initializationstring if necessary
Choose Tone or PulseRadio Button
Enter the data logger’smodem telephone number
Enter “Smart Switch” initialization stringand delays, if necessary (after modemis connected)
Close Button

15
sent after the comm port is open ) section. Consult the switch manufacturer’sdocumentation for the correct string and the correct delay times.
In the Type section, click the 1. Dirct Connect or 2. Modem Dial Up radio button, asappropriate.
If a modem is used for connection, the standard modem “AT” command set will appearas the default in the Modem Init String (AT-command to modem) section. However,the option exists to enter another string if necessary. Older modems (1200-2800 baud)sometimes have difficulty connecting to the modern 56K baud modems. It may benecessary to enter a unique command set for older modems to “shake hands” with anewer modem. When difficulty has been encountered in these circumstances, an “AT”command set that has been successfully used is “&FE0Q0V1&C1&D2S0=0&N2”.
In the Dial section click the appropriate radio button for either Tone (the default) orPulse dialing. Enter the phone number of the modem at the station site in the LoggerTelephone Number box.
If necessary, complete the Com Port Init String ( sent after modem is connected )section of the window. Consult the switch manufacturer’s documentation for the correctstring and the correct delay times.
3.3.3 Download Data Logger ConfigurationIf data was not available on an INI file to configure the new station in Section 3.1, it isnecessary to retrieve the configuration of the data logger at the physical station beforecontinuing with the DataLink/AQM Station Configuration. Therefore, suspend the datalogger configuration by clicking the close (“X”) button in the upper right hand corner ofthe screen. Section 4.3 describes how to retrieve the data logger’s configuration.
After the data logger’s configuration has been downloaded return to data loggerconfiguration by following the steps in Section 3.2 above.
Alternately, you may import a station configuration from an existing data logger set upexactly as the “new” logger is to be set up. This configuration can then be uploaded tothe “new” data logger. To use this function see section 3.3.10. However, it is almostalways better to download the data logger’s configuration directly from the logger(Section 4.3).
3.3.4 RealTimeMode Spec. Tab (Figure 3-8)DataLink/AQM allows data to be displayed in a “Real Time” mode. The data displayedcomes from a unique set of “real time” records separate from the main polled data base.This section defines how a separate “real time” database is be created by downloadingcurrent actual, not averaged, readings from the data logger at specific intervals. Whenoperating in “real time” mode, the mode is suspended when it is time to automaticallypoll the regularly scheduled final or interim data for the main data base. Once the poll iscompleted, DataLink/AQM automatically returns to “real time” mode. See Section 11 fora complete discussion of the types of “real time” displays available.
While in the Station Configuration window (Section 3.3), click the RealTimeModeSpec. tab.

16
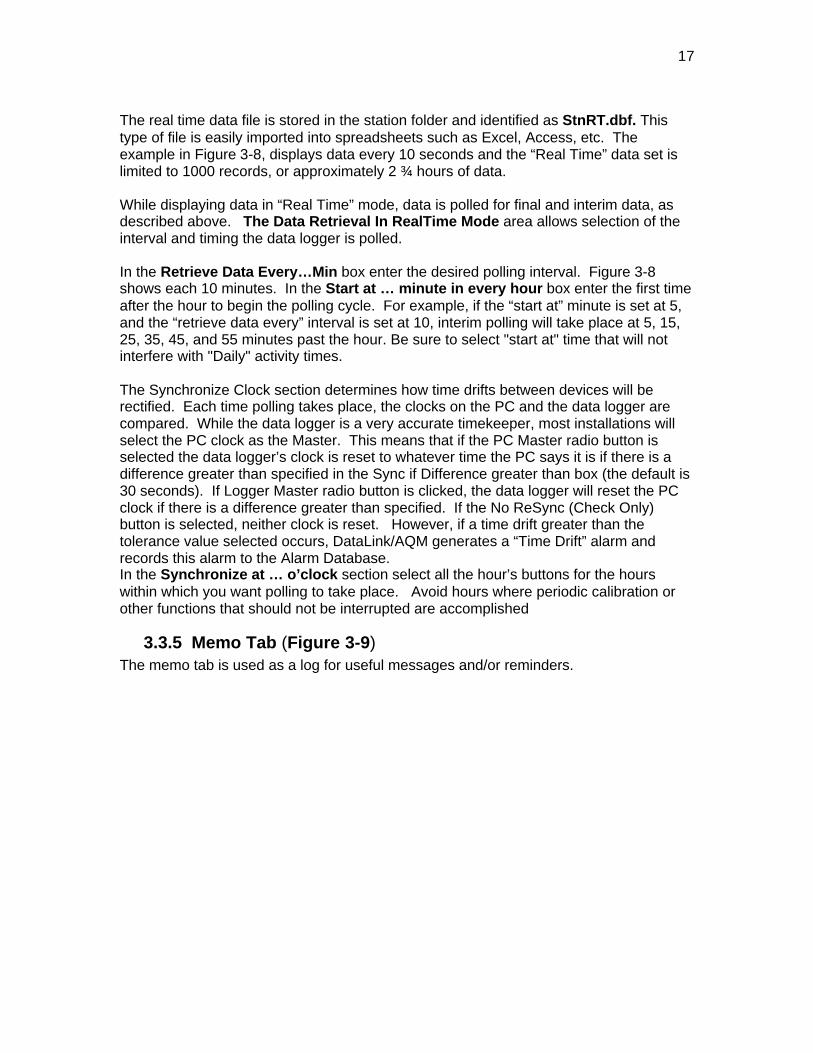
The Real Time Update Rate is the frequency at which data displays are refreshed(whether standard data has changed because of a new poll or not). It controls howquickly current data is displayed. DataLink/AQM defaults to an update rate of 30seconds. Enter the time you deem appropriate, recognizing that the fastest effectiverefresh rate is every 10 seconds.
Figure 3-8 Real Time Mode Specification Tab Screen
The Max Real Time Record # is the largest number of records which will be kept in the“real time” set of data used for display. The data set is a “snapshot” of actual data anddoes not include averaged data. As new records are added, the oldest records areremoved. The maximum number of records is selectable from 1 to 10,000 (sufficient tohold over 27 hours of 10 second data). Since Real Time data is used solely formonitoring immediate performance, and final and interim data is the data of record, it isnot necessary to maintain an extensive “real time” data base. Select a number ofreadings that allows sufficient data for the Real Time displays to be configured in Section11. For example, setting an update rate of every 10 seconds would create 6 records perminute. If a trend chart of real time data is created for an hour of data there would needto be a minimum of 360 records (60 minutes x 6 records/minute).
RealTimeMode Spec. Tab
Enter Real Timedata update rate Enter the number of data
records to be maintainedin the separate Real Timedatabase
Enter frequency ofautomatic polling Enter the minutes after
the hour to begin polling
Check hours inthe day to syncclocksClick appropriate radio
button to synchronizeDataLink/AQM anddata logger clocks
Check All hours button (thenuncheck unwanted hours)
Enter timedifference to alarmand sync clocks
17
The real time data file is stored in the station folder and identified as StnRT.dbf. Thistype of file is easily imported into spreadsheets such as Excel, Access, etc. Theexample in Figure 3-8, displays data every 10 seconds and the “Real Time” data set islimited to 1000 records, or approximately 2 ¾ hours of data.
While displaying data in “Real Time” mode, data is polled for final and interim data, asdescribed above. The Data Retrieval In RealTime Mode area allows selection of theinterval and timing the data logger is polled.
In the Retrieve Data Every…Min box enter the desired polling interval. Figure 3-8shows each 10 minutes. In the Start at … minute in every hour box enter the first timeafter the hour to begin the polling cycle. For example, if the “start at” minute is set at 5,and the “retrieve data every” interval is set at 10, interim polling will take place at 5, 15,25, 35, 45, and 55 minutes past the hour. Be sure to select "start at" time that will notinterfere with "Daily" activity times.
The Synchronize Clock section determines how time drifts between devices will berectified. Each time polling takes place, the clocks on the PC and the data logger arecompared. While the data logger is a very accurate timekeeper, most installations willselect the PC clock as the Master. This means that if the PC Master radio button isselected the data logger’s clock is reset to whatever time the PC says it is if there is adifference greater than specified in the Sync if Difference greater than box (the default is30 seconds). If Logger Master radio button is clicked, the data logger will reset the PCclock if there is a difference greater than specified. If the No ReSync (Check Only)button is selected, neither clock is reset. However, if a time drift greater than thetolerance value selected occurs, DataLink/AQM generates a “Time Drift” alarm andrecords this alarm to the Alarm Database.In the Synchronize at … o’clock section select all the hour’s buttons for the hourswithin which you want polling to take place. Avoid hours where periodic calibration orother functions that should not be interrupted are accomplished
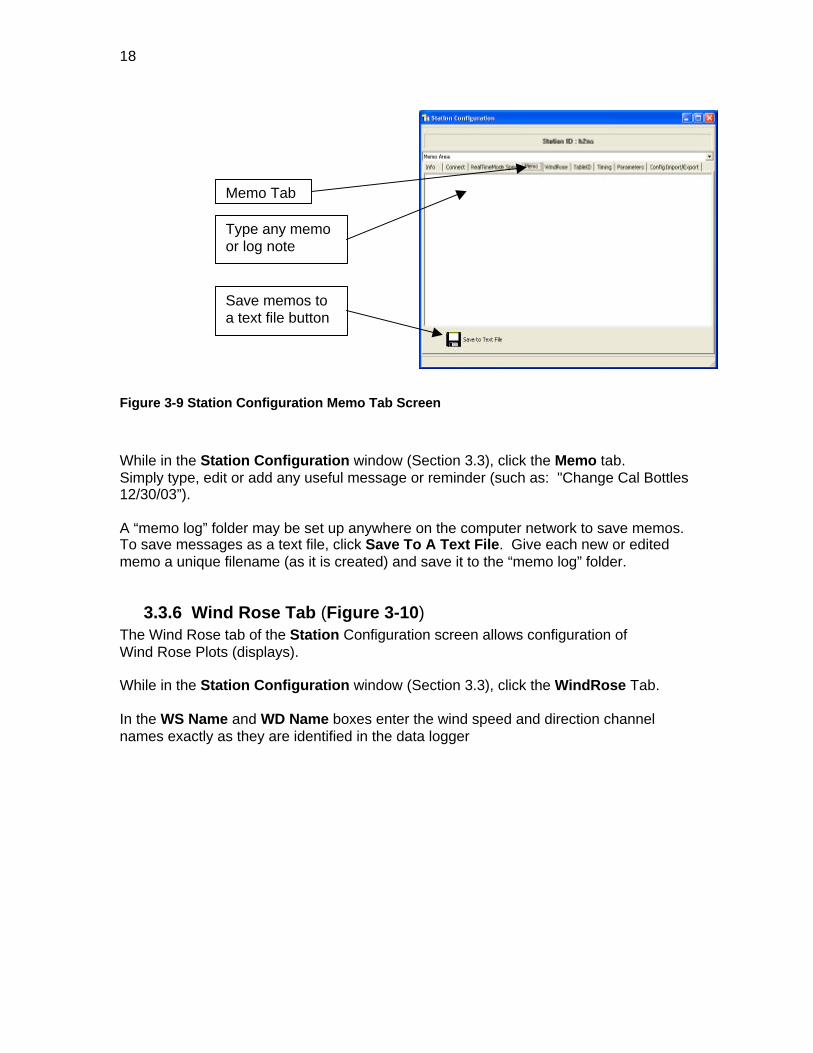
3.3.5 Memo Tab (Figure 3-9)The memo tab is used as a log for useful messages and/or reminders.
18
Figure 3-9 Station Configuration Memo Tab Screen
While in the Station Configuration window (Section 3.3), click the Memo tab.Simply type, edit or add any useful message or reminder (such as: "Change Cal Bottles12/30/03”).
A “memo log” folder may be set up anywhere on the computer network to save memos.To save messages as a text file, click Save To A Text File. Give each new or editedmemo a unique filename (as it is created) and save it to the “memo log” folder.
3.3.6 Wind Rose Tab (Figure 3-10)The Wind Rose tab of the Station Configuration screen allows configuration ofWind Rose Plots (displays).
While in the Station Configuration window (Section 3.3), click the WindRose Tab.
In the WS Name and WD Name boxes enter the wind speed and direction channelnames exactly as they are identified in the data logger
Type any memoor log note
Save memos toa text file button
Memo Tab

19
Figure 3-10 Wind Rose Tab Screen
In the Wind Speed class boundaries section, enter the desired wind speed boundariesin the five boxes with the lowest speed in left most box progressing higher in each box tothe right. This will provide six wind speed categories.For more on wind rose see Section 9.
3.3.7 Table ID TabThe Table ID tab is where configuration is set for retrieving “Final Average”, “Interim”,“Alarm”, and “Calibration” data.
While in the Station Configuration Screen (Section 3.3), click the Table ID tab.
Four secondary tabs appear on the Table ID tab. The default tab is the last tabreviewed during this session, or Hourly if the first time accessed.
3.3.7.1 Table ID Tab - Hourly Tab (Figure 3-11)The Hourly tab is where parameters for the “Final Average” data are set.
Click the Hourly tab.
WindRose tab
Enter Wind SpeedChannel name
Enter Wind DirectionChannel name
Enter Wind Speedplot boundaries inorder left to right
20
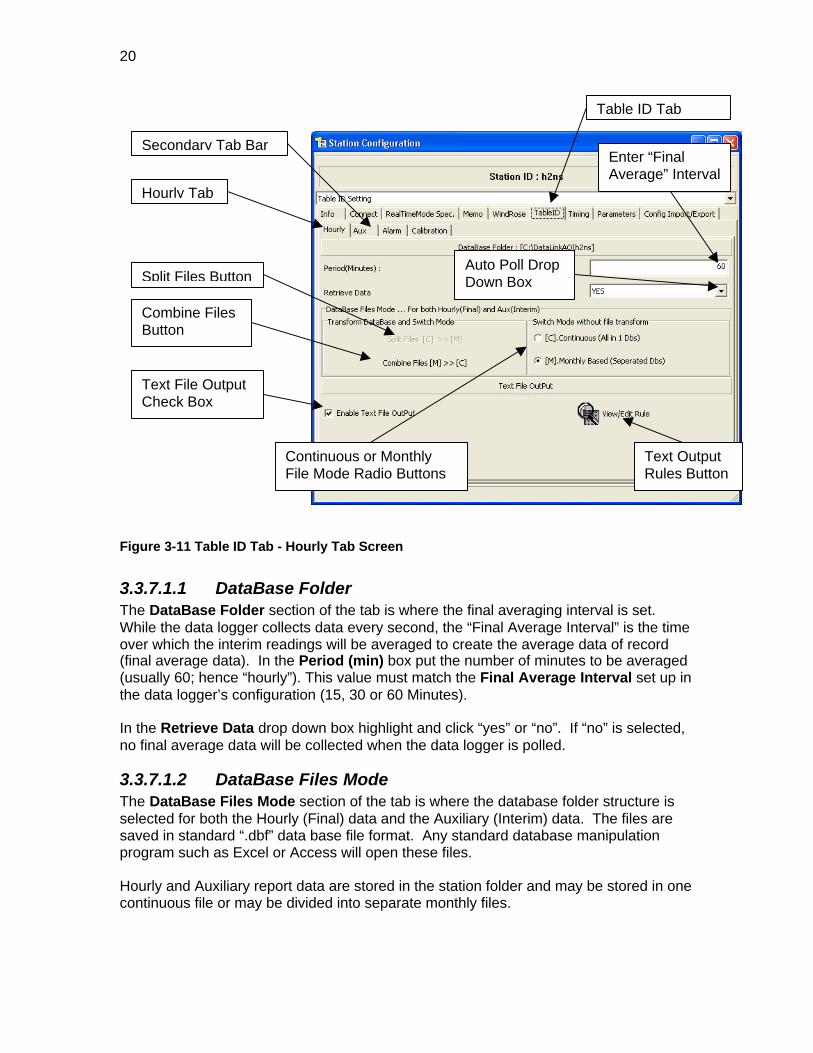
Figure 3-11 Table ID Tab - Hourly Tab Screen
3.3.7.1.1 DataBase FolderThe DataBase Folder section of the tab is where the final averaging interval is set.While the data logger collects data every second, the “Final Average Interval” is the timeover which the interim readings will be averaged to create the average data of record(final average data). In the Period (min) box put the number of minutes to be averaged(usually 60; hence “hourly”). This value must match the Final Average Interval set up inthe data logger’s configuration (15, 30 or 60 Minutes).
In the Retrieve Data drop down box highlight and click “yes” or “no”. If “no” is selected,no final average data will be collected when the data logger is polled.
3.3.7.1.2 DataBase Files ModeThe DataBase Files Mode section of the tab is where the database folder structure isselected for both the Hourly (Final) data and the Auxiliary (Interim) data. The files aresaved in standard “.dbf” data base file format. Any standard database manipulationprogram such as Excel or Access will open these files.
Hourly and Auxiliary report data are stored in the station folder and may be stored in onecontinuous file or may be divided into separate monthly files.
Table ID Tab
Secondary Tab Bar
Hourly Tab
Enter “FinalAverage” Interval
Auto Poll DropDown Box
Combine FilesButton
Split Files Button
Text File OutputCheck Box
Text OutputRules Button
Continuous or MonthlyFile Mode Radio Buttons

21
If the [C] Continuous (All in 1 Dbs) radio button is selected, the Hourly and Auxiliaryreport data files will be stored as C:\DataLink\Shortstationname\Hrept.dbf andC:\DataLink\Shortstationname\Auxrept.dbf respectfully.
If the [M] Monthly Based (separated Dbs) radio button is selected, a separate folder iscreated for each calendar year within which a folder is created for each month. Forexample, hourly data for May 2003 would be stored in a file namedC:\DataLink\$MonthlyDataBase\2003\05\Hrept.dbf).
The mode of storing files may be changed at any time. The new mode may begin “as ofnow” or may include all existing data in the new mode. For example, to change fromstoring files in monthly folders to continuous files without including previous records inthe new continuous files, click the [C] Continuous (All in 1 Dbs) radio button. Tochange to continuous files and include existing records in the file, click the CombineFiles [M] >> [C] button.
It is important to note that when the database file mode is changed the files, as theyexisted, will remain in the station’s folder, but will no longer be maintained. They willforever remain as they were, unless the file mode is changed back again.
3.3.7.1.3 Data ExportThe Text File Output section of this tab (and the same section of the Aux (Interim) tab)sets parameters for extracting and exporting selected data, in custom configured textfiles, from the polling computer’s data files to any desired location available on thepolling computer’s network such as a central repository or an operator or supervisor’spersonal computer. The extracted file is a delimited ASCII text file created from the datafiles created during regular polling of the data logger.
While on the Hourly (Final) tab, use of the Text File Output section will define Finaldata. If on the Aux (Interim) tab, the Text File Output defines Interim data. Thefollowing data selection steps are the same for both tabs.
To automatically export data after each poll, click Export Text File OutPut check box. Ifthis box is left blank, data can be extracted in “manual” mode.
Next, click the View/Edit Rule button. A new Text Output Rule / Channel windowopens with four additional tabs to allow you to configure “automatic” or “manual”exported data.
3.3.7.1.3.1 Output Rule / Channel; Type / Naming Rule Tab (Figure 3-12)The Record saved as: section allows selection of LAST record Only or Append to theexisting file by clicking the appropriate radio button. Selection of Last record Only willoverwrite previously extracted data with new data from the latest poll. Selection ofAppend to the existing file will add data to previously extracted data.
The Data Source section of the tab allows selection of either Actual (as collected) dataor Modified data if the extraction is being conducted manually. Only Actual data isavailable when automatically creating files during polling.

22
In the Devise\\Directory box enter the location to which the file will be exported. Clickthe browser button on the far right hand side of the box, highlight the network locationand then click OK. In Figure 3-12, the default location (C:\DataLinkAQ) was selected. Inthe FileName box the default filename which includes the station name and hourly oraux data designation was accepted.
Figure 3-12 Text Output Rules/Channels [Hourly Record] – Type/Naming Rule Screen
The OutPut File Naming Rule section allows for the selection of various sub- directorypaths and file naming conventions to separate data files into meaningful organization bytime and name. Up to three subdirectories can be selected below the Main directorywith the last box defining the final filename in the last sub-directory. All four levels neednot be used. Clicking the drop down list box in the far right of each selection box gives achoice of various time and filename + time options for each directory level. Once aselection is made that includes the filename created above, no lower levels areavailable. In Figure 3-12 a sub-directory named using the year and month will becreated under the DataLinkAQ directory and in it will be files named by including thedate in front of the filename selected.
The Select Date to Test OutPut FileName defaults to show the path to the file that willbe created as of today’s date. Clicking the calendar drop down button in the box wherethe date is displayed allows selection of another date and the example display will showwhat a file would be named on that date.
Click Last Record orAppend to File Radio Button
Use Browser Buttonto Change Directory
Title Bar includes [HourlyRecord] or [Aux Record]Type / Naming Rule Tab
Click Actual or Modifiedif in Manual Mode
Enter newfilename if desired
Use drop downbutton to choosesub folders
Sample of pathto filename
Use Drop Down Calendarbutton to change samplepath date

23
3.3.7.1.3.2 Text Output Rule / Channel; Channel Tab (Figure 3-13)
Click the Channels tab. This tab is where the data record to be extracted isconstructed. The Data logger’s actual configuration must have already beendownloaded. If this has not been done see Section 3.3.3.
Figure 3-13 Text Output Rule / Channel - Channel Tab Screen
All the Channels (data elements available) are listed in the left box. To select theChannels you wish to include in the record, highlight them in the left AvailableChannels box by clicking them and then either double click, click the green “move right”arrow between the Channels boxes, or drag and drop them into the Selected Channelsbox. You may select several channels at a time by holding down the “Ctrl” key as youclick the Channels you select.
The Channels will be in the extracted text record from left to right, based on the orderthey are from top to bottom in the Selected Channels box. To change the order,highlight the channel you wish to move up or down in the Selected Channels box andthen click the Up or Down Arrows at the bottom of the column between the two Channelsboxes.
If the Use Format check box is selected, the station code (station id) parameter will beset at a fixed length of 10 characters, regardless of whether or not the Field LengthFixed to: box is checked. Spaces will be added to the right of the station id if it is lessthan 10 characters long.
Title Bar includes [HourlyRecord] or [Aux Record]
Channels Tab
Left Panel: Channelsavailable for reporting
Right Panel: Channelsselected for reporting
Select arrow
Select all arrow
Remove arrow
Remove all arrow
Position selectionup or down arrows
Edit flagged datato ignore
Edit filler charactersfor missing data
Edit datadelimiter
First field fixed at10 charactersradio button
Delimiter selectradio button
Fixed Field lengthradio button Edit Field
Length boxand buttons
Click Test Record button toview an example of theselected record
24
Click the Separated by check box and type in the delimiter of choice in the box to theright. DataLink/AQM defaults to a comma (,), but any other recognized delimiter, suchas a semicolon, may be used. If a fixed field length is used, it is not necessary to selecta delimiter, though one may still be selected.
The extracted file will use field lengths equal to the actual data length. If a fixed fieldsize is desired, click the Field Length Fixed to: check box and then enter the number ofcharacters to which all data fields will be set in the box on the right.
When extracting data it may be desired to ignore certain data flagged with certain status.Data link defaults to ignore data associated with “F” (power failure), “C” (calibration), “S”(),“I” (initialization), “Z” (), “P” (), “D”(), and B() flags. The CPP or DSM manual containsall the status flags and definitions. Add or delete the flags desired, separated by asemicolon, in the Ignore data when FLAG is: box.
Finally determine what filler is to be used for data elements that do not exist for somereason. The default is three periods but, this may be changed to “xxx”, “NA”, or anyother character set desired in the Missing data Filler: box.
To check what each data record will look like in the text file, click the Blue Arrow in theTest Record section. A representative string of the data will be shown in the box to theright of the arrow (using today’s data and random number data.
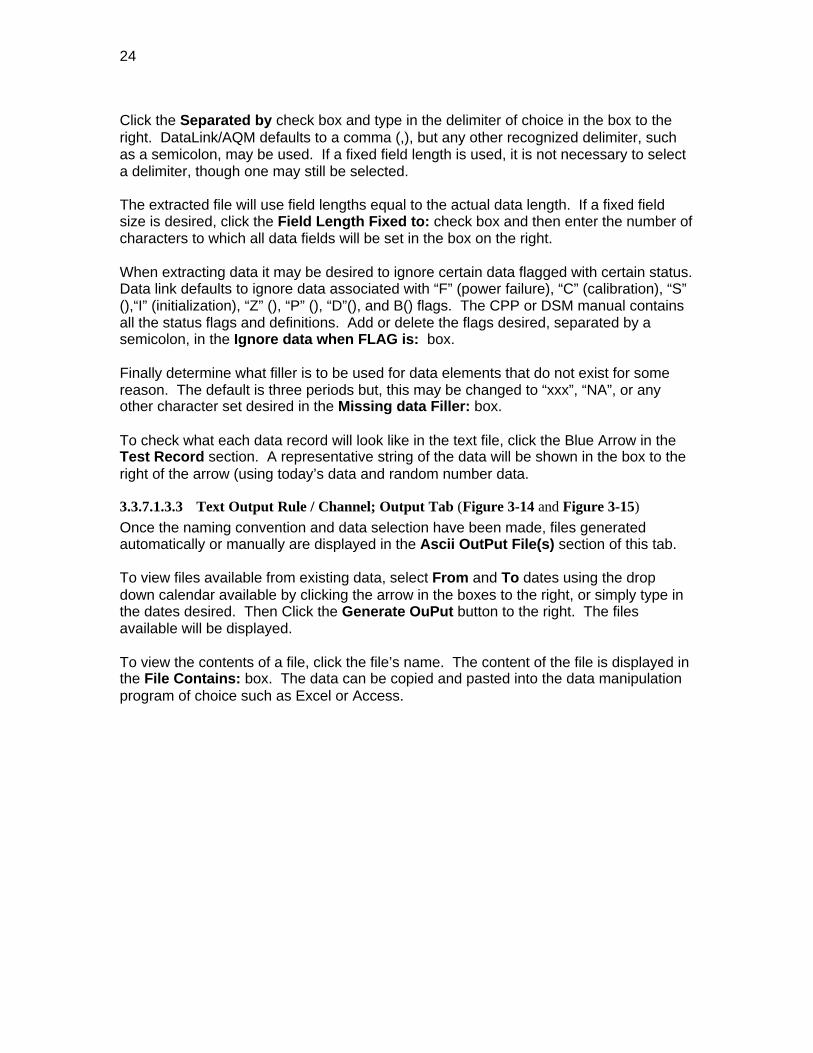
3.3.7.1.3.3 Text Output Rule / Channel; Output Tab (Figure 3-14 and Figure 3-15)
Once the naming convention and data selection have been made, files generatedautomatically or manually are displayed in the Ascii OutPut File(s) section of this tab.
To view files available from existing data, select From and To dates using the dropdown calendar available by clicking the arrow in the boxes to the right, or simply type inthe dates desired. Then Click the Generate OuPut button to the right. The filesavailable will be displayed.
To view the contents of a file, click the file’s name. The content of the file is displayed inthe File Contains: box. The data can be copied and pasted into the data manipulationprogram of choice such as Excel or Access.
25
Figure 3-14 Text Output Rule / Channel - Output Tab Screen
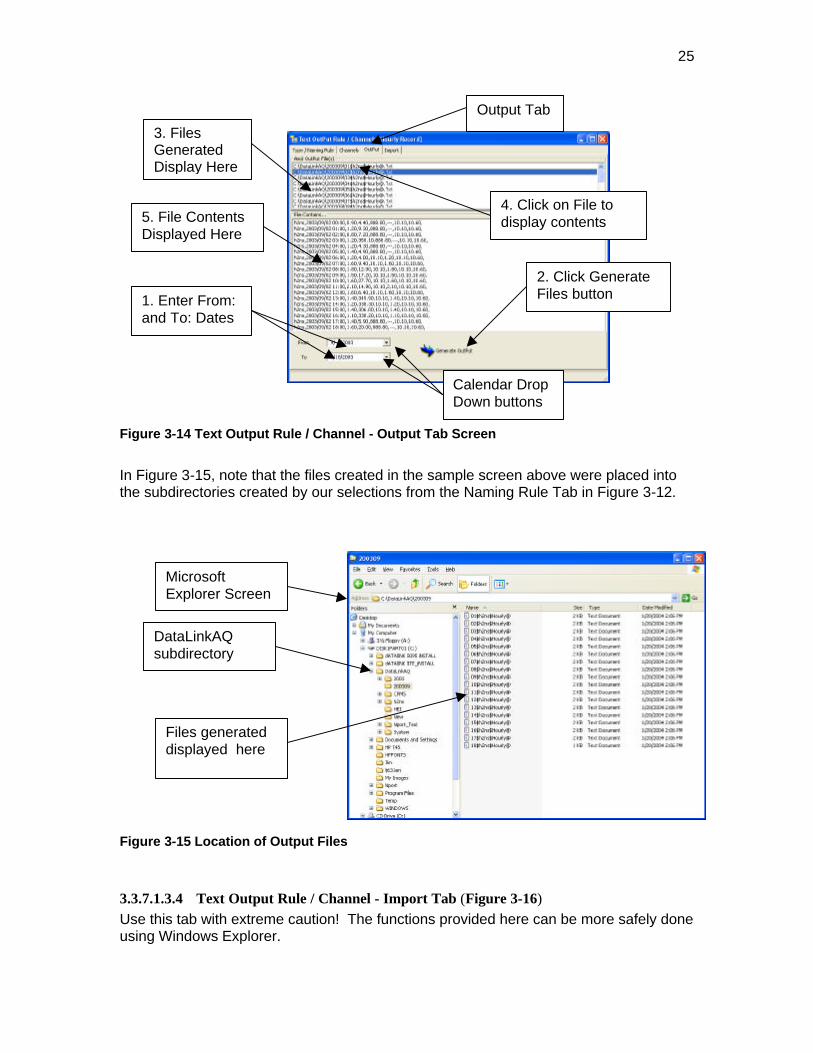
In Figure 3-15, note that the files created in the sample screen above were placed intothe subdirectories created by our selections from the Naming Rule Tab in Figure 3-12.
Figure 3-15 Location of Output Files
3.3.7.1.3.4 Text Output Rule / Channel - Import Tab (Figure 3-16)
Use this tab with extreme caution! The functions provided here can be more safely doneusing Windows Explorer.
Output Tab
1. Enter From:and To: Dates
4. Click on File todisplay contents
3. FilesGeneratedDisplay Here
5. File ContentsDisplayed Here
2. Click GenerateFiles button
Calendar DropDown buttons
DataLinkAQsubdirectory
Files generateddisplayed here
MicrosoftExplorer Screen

26
While the main purpose of this function is to import data files to the main data base, filesmay also be moved to any location on the user’s available network. Click the ImportTab of the “Text Output Rule / Channels” window. In the Device\\Directory box enterthe path to the directory where the files to be imported are located. This can be done byclicking the Browse button on the right side of the box.
Figure 3-16 Text Output Rule / Channel - Import Tab Screen
In the FileName Template box, enter the structure of the file names you wish to moveusing standard file search definitions (e.g. * or ?). Then click the Check Import File Listbutton on the right. The files matching the template will appear in the Ascii ImportFile(s) section of the window. Each file name will have a checked check box next to itsname. Uncheck the boxes next to the files NOT to be moved. If the list is long, usingthe Uncheck/Check All button on the right will uncheck all of the boxes. Then selectthe files you want by clicking the check box of the files to be imported.
Next go to the File Process mode After Import section. If the Delete Files AfterImport radio button is selected, the files will be erased from their location and will not besaved anywhere else. To select a location or two for the files to be sent, Click the MoveFile(s) to … After Import radio button. The default location is in a new “Save” sub-directory in the DataLinkAQ directory. You may select any other location using theBrowse button on the right of the box. The second box may be used to send the files toa second location.
When the file locations have been selected, click the Execute Data Import button on theright side of the window in the Ascii Import File(s) section. As the files are moved totheir new locations, the contents will flash in the File Contains section of the window.Once the files have been imported and moved, they will disappear from the Ascii Files
Import Tab
Import FromDirectory
File Name toImport SearchCriteria
Check (Create)Import File ListButton
Check/UncheckAll Button
Execute ImportButton
As File are imported,data is displayed here
Delete Files AfterImport Button
BrowserButtons
Move Files to …After Import Button
BrowserButton
Move Files to AfterImport Directory(s)

27
Import section of the window, and from their original location (unless that location wasselected as the move files to location).
When finished with the Text Output Rule / Channels window, close it by clicking the “x”close box in the upper right hand corner of the window.
3.3.7.2 Table ID - Aux Tab (Figure 3-17)Click the Aux Tab. This is where the parameters for retrieving preliminary or interimpolling data are set.
In the Period (Minute) box, enter the number of minutes over which Interim data isaveraged (5, 6 or 10 minutes). If a period other than one minute is used to averagepreliminary data it can be entered in this box. However, doing so would not allowretrieval of interim data.
Figure 3-17 Table ID Tab - Aux Tab Screen
Select whether or not you what to retrieve auxiliary data by clicking the drop down arrowin the Retrieve Data box and clicking yes or no. In the Data Source box, select Interimor Preliminary by clicking the drop down arrow and selecting the desired data type.
The Text File Output section of this window works exactly as it does on the Hourly tab.See Section 3.3.7.1.3 above. Close the Text Output Rule / Channels window byclicking the “x” close box in the upper right hand corner of the window.
3.3.7.3 Table ID - Alarm Tab (Figure 3-18)Click the alarm tab. Alarms are conditions encountered by the data logger duringoperation. An alarm may be based on exceeding pre-set value or a status signal from
Text FileOutputCheck Box
Aux Tab
Table ID Tab
Text OutputRules Button
Enter Minutes forInterim Average
Retrieve (Poll)Data Box Y/N
Interim orPreliminaryData Box
Drop DownArrows

28
an instrument. Click the Retrieve Data drop down arrow, highlight and click “YES” or“NO” for receiving alarm information with the exported data.
Figure 3-18 Table ID Tab - Alarm Tab Screen
If alarm data is being retrieved, and an alarm occurs after the last data poll, the StationIdentification bar below the Icon Bar will change to a yellow background and specify thelast alarm that occurred in red letters. It will also suggest checking the system log. Toview the details of the alarm either double click on the yellow alarm bar or click onSystemLOG in the left window of the main DataLink/AQM screen. The system log willappear and show all activity which has occurred including a description of the alarm(s).
Figure 3-19 Table ID Tab - Calibration Tab Screen
Drop DownArrowRetrieve Alarm
Data Y/N Box
Alarm Tab
Table ID Tab
Table ID Tab
Drop DownArrow
Calibration Tab
Retrieve CalibrationData Y/N Box
29
3.3.7.4 Table ID - Calibration Tab (Figure 3-19)Click the Calibration tab. Calibrations occur at preset intervals within the data logger.Calibration data typically include expected zero, span values and drift. Click the dropdown arrow in the Retrieve Data box, highlight and click "YES" or "NO" for collectingand archiving calibration files during the export of data.
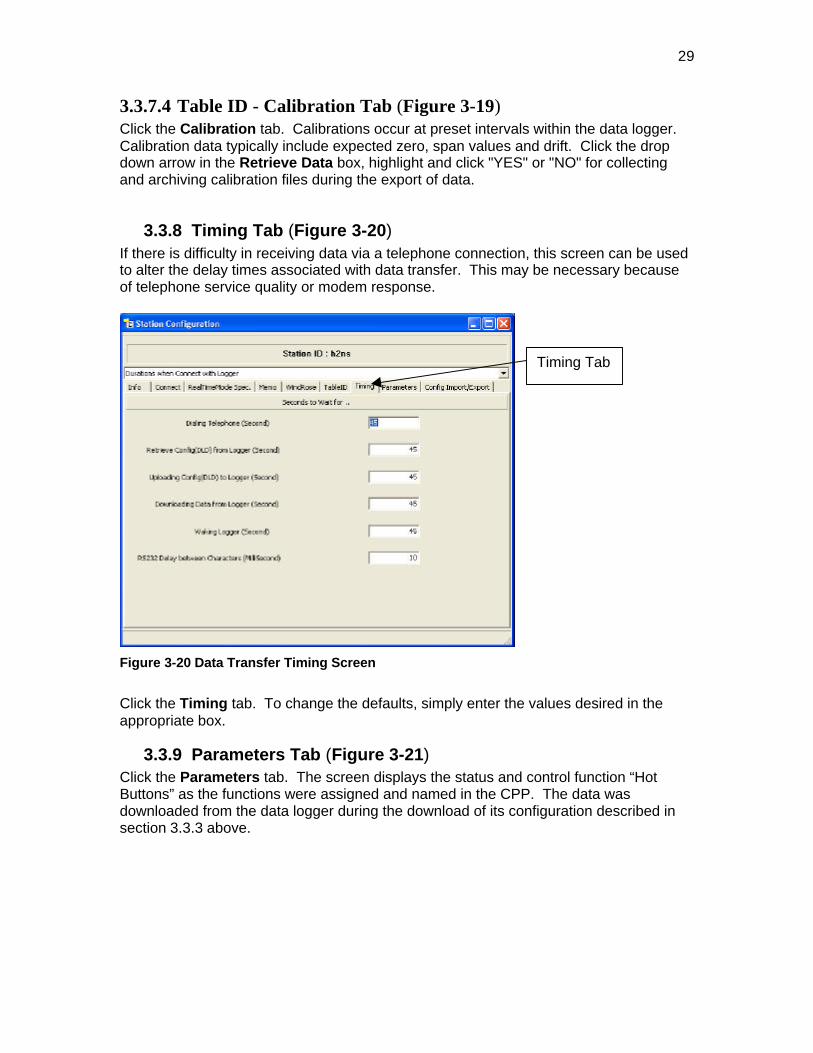
3.3.8 Timing Tab (Figure 3-20)If there is difficulty in receiving data via a telephone connection, this screen can be usedto alter the delay times associated with data transfer. This may be necessary becauseof telephone service quality or modem response.
Figure 3-20 Data Transfer Timing Screen
Click the Timing tab. To change the defaults, simply enter the values desired in theappropriate box.
3.3.9 Parameters Tab (Figure 3-21)Click the Parameters tab. The screen displays the status and control function “HotButtons” as the functions were assigned and named in the CPP. The data wasdownloaded from the data logger during the download of its configuration described insection 3.3.3 above.
Timing Tab

30
Figure 3-21 Hot Button Parameters Tab Screen
3.3.10 Config Import/Export TabIf an existing data logger is set up exactly as a new data logger is to be configured, theexisting configuration can be imported into DataLink/AQM and then exported to the newdata logger to assure consistency. Click the Config Import/Export tab.
3.3.10.1 Import an existing data logger’s configuration (Figure 3-22)Click the Import tab. In the Import Station Configuration From File box, the defaultstation configuration file (StationConfig.INI) is shown. If, for some customized reason,the file name needs to be changed use the browse button on the right to select theproper file name to be imported.
If not already connected, create a connection to the data logger whose configuration isto be imported.
Parameters Tab

31
Figure 3-22 Import a DataLinkAQM Configuration Screen
3.3.10.2 Export a DataLink/AQM configuration to set up a DataLogger (Figure 3-23)
Click the Export tab. The location of the configuration files is shown. If additional filesare to be exported to the data logger, they may be selected by using the browser buttonon the right of the box at the bottom of the screen. Use the Add File button to add ahighlighted file(s) to the list of additional files to be exported. If files are to be removedfrom the list, highlight them in the Files to go with Station Configuration File box andclick the Remove File button.
Figure 3-23 Export a DataLinkAQM Configuration Screen

32
3.4 Remove a Station from DataLink/AQMIf a station has been retired, it can be removed from DataLink/AQM. Click on the stationto be removed in the left panel of the main DataLink/AQM screen. Then click on Stationin the main menu and select RemoveStation.A Warning pop-up box appears. Click Ok to remove the highlighted group or Cancel toleave the group in place.
Figure 3-24 Remove a Station from DataLink/AQM
1. Click Stationto be removed
2. Click Stationand selectRemoveStation
3. Click Ok inpop-up box

33
4 Terminal Mode
Terminal mode allows communication directly with the data logger. In this modecommands may be issued directly to the data logger or passed through to digitizedinstruments. In addition, functions are available to easily reset the data logger’s clock,synchronize the pc clock with the data logger, import the data logger’s configuration toDataLink/AQM or upload a DataLink/AQM station configuration to the data logger. Also,Hot Buttons can be accessed and digital status bits and relays may be set and unset.
The data logger (CPP-3794 or DSM3260) must be connected either directly to the PC orto an active modem and the station setup in DataLink/AQM must include the connectionparameters (see Section 3.3.2). To enter Terminal Mode, click the logger to beaccessed in the left panel of the main DataLink /AQM screen (Figure 3-2, Page 9). It willbe highlighted. Click the Terminal Mode icon (telephone/monitor) on the tool bar (Item5, Figure 2-1, Page 8).
If DataLink/AQM is currently polling automatically, a pop up box will advise you that AutoJob is on and to turn off Auto Job before continuing. To do this, close the pop up box byclicking “OK”, then click the Toggle Auto Queue Job On/Off icon (Item 10, Figure 2-1,Page 8) at the far right of the tool bar. Then re-click the Terminal Mode icon on the toolbar.
The communications window opens and the modem telephone number configured inDataLink/AQM will be dialed. When connected the Logger Terminal window willappear and the last line on the screen will read "CPP-3794 Connected!" or "DSM3260Connected!” (Figure 4-1)Figure 4-1.
Figure 4-1 Terminal Mode Opening Screen
ConnectionStatus Lights
Disconnect Button
Connection Status Bar
Logger Clock Time
Activity Log Button
Extended Funtions Button

34
Click the Extended Func button in the lower right half of the screen. The Passwordpop up box appears. If the function requires a password, enter it and click Ok, otherwisesimply click Ok. To set or reset a password see Section 3.2.2 on page 11. The mainbody of the screen contracts and five buttons appear across the bottom; the extendedfunction bar (Figure 4-2).
Figure 4-2 Terminal Mode Extended Functions Screen
4.1 Set Data Logger ClockTo set or reset the data logger clock, click the Set Clock button at the left end of theextended function bar. A Warning pop up box appears (Figure 4-3). To continue, clickOk. The SetUp Datalogger Date & Time pop up box appears (Figure 4-4). In theDate: box, type in the date or select it from the calendar available by clicking the dropdown arrow at the right end of the box. Click the Time: box and enter the current time.Then click Ok. The data logger’s clock has been reset.
Figure 4-3 Set Logger Date/Time Warning Pop Up Box
Set Clock Button Get Config Button Send Config Button
Hot Buttons Button
Sync Logger & PCClocks Button
Ok Button
CancelButton

35
Figure 4-4 Set Logger Date/Time Pop Up Box
4.2 Synchronize PC ClockThe PC connected to the data logger may have its clock synchronized with the datalogger’s clock. While in terminal mode (Section 4 above), click the Sync PC button onthe right end of the extended function bar (Figure 4-2). A Warning pop up box appears(similar to Figure 4-3). To continue, click Ok. The body of the screen will show SyncComputer’s clock. Done, and the computer’s clock will show the new time.
4.3 Retrieve the Data Logger Configuration into DataLink/AQMWhile in terminal mode (Section 4 above), click the Get Config button on the extendedfunctions bar. The configuration’s data stream begins to scroll through the main body ofthe screen. When completed, the Report . . Default FileName : window appears.Click the Update Config Database button in the bottom center of the screen. Theconfiguration is updated and the window closes.
Figure 4-5 Report ... Default FileName Screen
Time IncrementUp/Down Arrows
Date Box
Time BoxOk Button CancelButton
Date DropDown Arrow
Update ConfigDatabase Button
Close Button
Save As Button

36
To verify the configuration, select the station in the left window of the DataLink/AQMmain menu and expand the tree by clicking the "+" in the box associated with thestation. Then click Channel. The configuration is displayed in the right window (Figure4-6).
Figure 4-6 Channel Subdirectory display on Main DataLink/AQM Screen
The configuration may also be saved as a text file for backup purposes. Before clickingthe Update Config Database button (which closes the window), click the Save Asbutton at the bottom right of the window (Figure 2-1). A Save As window appears(Figure 4-7). The default directory is the station subdirectory under the Datalink/AQsubdirectory. This may be changed if desired by typing or using the browse arrow toselect a different directory in the Save in: box. The default file name is “Config”. Thismay be changed if desired by typing a different filename in the File name: box. Clickthe Save button to save the file as specified. The default file can be found by going toDataLinkAQ/stationname/filename in windows explorer.
Figure 4-7 Configuration Save As Screen
Save in Directory box
File name box
File type box
Save Button
Cancel Button
Directory Browse Arrow
1. Click ChannelSubdirectory ofselected Station
2. StationConfigurationappears here

37
4.4 Configure a Data Logger with DataLink/AQM’s configuration
While in terminal mode (Section 4), click the Send Config button in the center of theextended functions bar at the bottom of the screen (Figure 4-2). A Warning boxappears (similar to Figure 4-3). To continue, click Ok. A Sending Config windowappears with the default file name showing in the Config FileName box at the top left ofthe window (Figure 4-8).
Figure 4-8 Send Configuration Screen
If another file, e.g. the configuration of different data logger is to be uploaded, click theBrowse button and find the appropriate file. When the file has been selected, click Goand the selected configuration will be uploaded to the data logger.
4.5 Hot ButtonsIf digital Hot Buttons have been configured in the data logger, they can be accessedfrom either the Terminal or Real Time connection modes. While in terminal mode (seeSection 4 above), click the Hot Buttons button on the extended functions bar. The
Ok Button
Browse Button Cancel Button
Config File name tobe Uploaded
Configuration will scrollin through this area untilcomplete

38
Logger Terminal screen appears and is set to the HotButtons tab on the right side ofthe main body of the window.
From this window, the Hot Buttons configured in the Data Logger appear with theircurrent status. These can be toggled simply by clicking on the appropriate button.
A click of the Digital Input Display tab below the Hot Buttons tab on the right side ofthe window displays the digital bit relays assigned a name in the data logger’sconfiguration. The digital relays are shown by their name assignment, not their digital bitnumber. These relays can be toggled on and off.
Switching to Real Time Mode (Section 11 page 71) allows observation of changesmade after toggling hot buttons and/or relays.
39
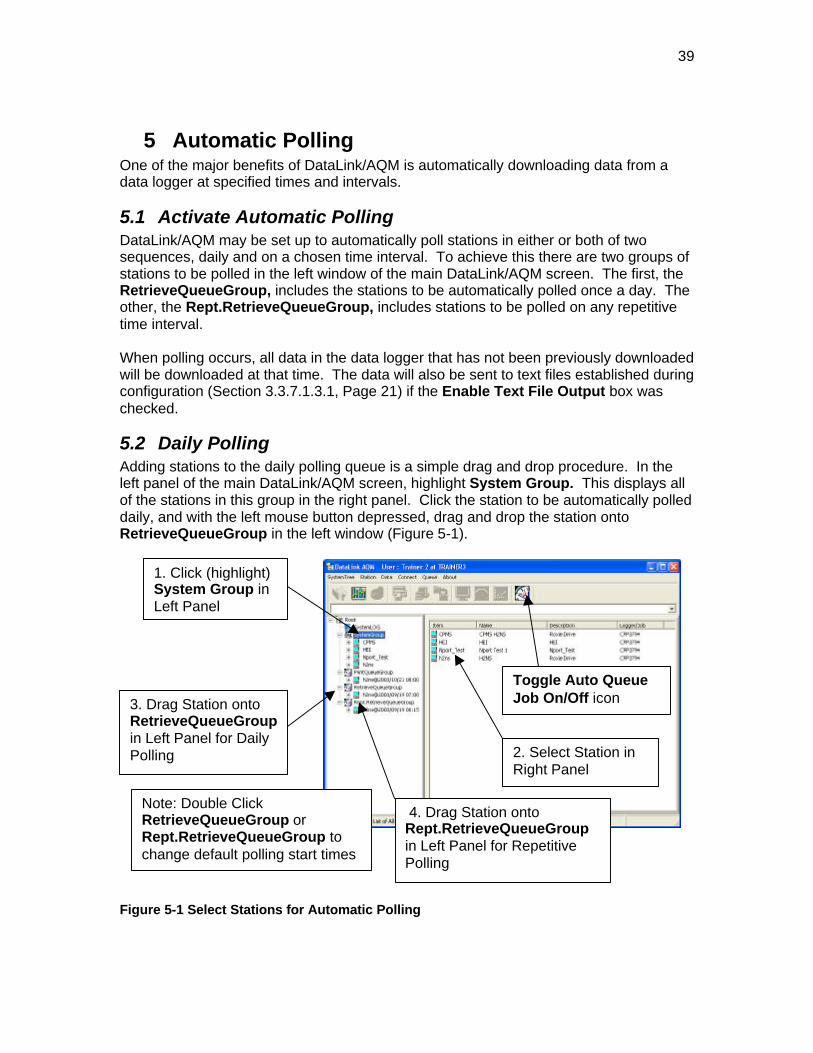
5 Automatic PollingOne of the major benefits of DataLink/AQM is automatically downloading data from adata logger at specified times and intervals.
5.1 Activate Automatic PollingDataLink/AQM may be set up to automatically poll stations in either or both of twosequences, daily and on a chosen time interval. To achieve this there are two groups ofstations to be polled in the left window of the main DataLink/AQM screen. The first, theRetrieveQueueGroup, includes the stations to be automatically polled once a day. Theother, the Rept.RetrieveQueueGroup, includes stations to be polled on any repetitivetime interval.
When polling occurs, all data in the data logger that has not been previously downloadedwill be downloaded at that time. The data will also be sent to text files established duringconfiguration (Section 3.3.7.1.3.1, Page 21) if the Enable Text File Output box waschecked.
5.2 Daily PollingAdding stations to the daily polling queue is a simple drag and drop procedure. In theleft panel of the main DataLink/AQM screen, highlight System Group. This displays allof the stations in this group in the right panel. Click the station to be automatically polleddaily, and with the left mouse button depressed, drag and drop the station ontoRetrieveQueueGroup in the left window (Figure 5-1).
Figure 5-1 Select Stations for Automatic Polling
1. Click (highlight)System Group inLeft Panel
2. Select Station inRight Panel
3. Drag Station ontoRetrieveQueueGroupin Left Panel for DailyPolling
4. Drag Station ontoRept.RetrieveQueueGroupin Left Panel for RepetitivePolling
Toggle Auto QueueJob On/Off icon
Note: Double ClickRetrieveQueueGroup orRept.RetrieveQueueGroup tochange default polling start times

40
All stations in the polling group will be polled consecutively at the specified time. Thedefault time is 07:00:00. To change the time of the daily poll, double clickRetrieveQueueGroup in the left panel to access the Change Execution Time pop-upbox. If the pop-up box does not appear, the computer is in “AutoJob On” mode. Thendouble click RetrieveQueueGroup again. Enter the time desired in 24-hour(HH:MM:SS) format and then click Ok (Figure 5-2).
Figure 5-2 Change Daily Poll Execution Time
5.3 Repetitive PollingTo obtain more current data, the computer needs to be polled more frequently than oncea day. The Rept.RetrieveQueueGroup allows polling stations at any interval from oneminute to twenty-three hours, 59 minutes. To add stations to this group, first clickSystem Group in the main screen’s left panel. Then click the station to be polledrepetitively in the right panel and, with the left mouse key depressed, drag and drop thestation onto Rept.RetrieveQueueGroup in the left panel (Figure 5-1). All stations in therepetitive poll group are polled at the same interval.
The default start time for repetitive polling is 15 minutes past the hour, beginning atmidnight. To Change the time the Repetitive Polling will begin, double click theRept.RetrieveQueueGroup in the left panel of the main DataLink/AQM screen. TheChange Execution Time pop-up box appears. If the pop-up box does not appear, thecomputer is in “Auto Job On” mode. To access the execution time pop-up box, first turnoff the automatic polling job by clicking the Toggle Auto Queue Job On/Off icon (Figure5-1) at the far right of the icon bar. Then double click Rept.RetrieveQueueGroupagain. Enter the hour and minutes after to begin polling and click Ok (Figure 5-3).
Figure 5-3 Change Repetitive Polling Start Time
1. Type desiredDaily Poll time
2. Click Ok
1. Type desired hour tostart Repetitive Polling 2. Type minutes after
the hour to startRepetitive Polling
3. Click Ok

41
5.4 Initiate Automatic PollingOnce stations have been moved to their respective polling groups, click the ToggleAuto Queue Job On/Off icon (Figure 5-1) to initiate polling. Daily and Repetitive pollswill commence at the time and date selected in Sections 5.2 and 0. The bottom centerof the main screen will show a status of “Auto Job On".
5.5 Remove a Station from a Polling GroupWhen a station in a polling group is selected in the left panel of the main DataLink/AQMscreen, a Delete Queue pop-up box appears in the lower right hand corner of thescreen. To remove the station from the polling group, simply hold the left mouse buttondown, drag the station onto the Delete Queue pop-up box, and drop it by releasing theleft mouse button (Figure 5-4). The station is removed from the polling group.
Figure 5-4 Remove a Station from a Polling Group
5.6 Create Additional Polling Groups (Figure 5-5 & Figure 5-6)To poll stations daily or repetitively at different times, new polling groups need to beadded to the systems group. To do so, click Root in the left panel of the mainDataLink/AQM screen (Figure 5-5). Next, click System Tree in the menu bar and selectNew Group.
An Add New Group pop-up box displays (Figure 5-6). Select the type of group to beadded, RetrieveQueueGroup for daily polling or Rept.RetrieveQueueGroup forrepetitive polling, by clicking the appropriate radio button. Then, in the Input QueueGroup Name: box type a name for the new Group. Finally, click Ok.
Figure 5-5 Create a New Polling Group
Drag a station from leftpanel of main screen ontothis pop-up box to removeit from a group
1. Click Root
2. Click System Treeand New Group
3. New Group appears atbottom of Root directory

42
Figure 5-6 Add New Group Pop-Up Box
The group now appears in the left panel of the main screen (Figure 5-5). Add stationsand set polling times for the new group using the procedures in Sections 5.2 and 0.
To move an existing station to the new group, click System Group. Select the station tobe added and while holding the left mouse button down, drag and drop it (by releasingthe left mouse button) on the new polling group in the left window.
5.7 Remove a Polling Group
If a new polling group is no longer required, it can be removed from DataLink/AQM.Click on the polling group to be removed in the left panel of the main DataLink/AQMscreen. Then click on SystemTree in the main menu and select RemoveGroup.A Warning pop-up box appears. Click Ok to remove the highlighted group or Cancel toleave the group in place.
Figure 5-7 Remove a Polling Group
3. Click radiobutton for typeof new group
4. Type newgroup name
5. Click Ok
1. Select Group tobe removed
2. Click SystemTreeand selectRemoveGroup
3. Click Ok inpop-up box

43
6 Automatically Print ReportsDataLink/AQM has the capability of automatically printing custom reports following eachdaily poll. Up to 10 different report formats of a station's data can be automaticallyprinted, each using the same or different data.
6.1 Add a Station to the Automatic Print QueueFrom the main DataLink/AQM screen, highlight Systems Group in the left panel. Clickthe station in the right panel for which reports will be generated. With the left mousebutton depressed drag the station onto PrintQueueGroup and drop it by releasing theleft mouse button.
Figure 6-1 Select Stations for Automatic Report Printing
Reports will be printed consecutively for all stations in the print queue group at aspecified time. The default time is 08:00:00. To change the time of daily reports, doubleclick PrintQueueGroup in the left window to access the Change Execution Time pop-up box (Figure 6-2).
Figure 6-2 Change Time Automatic Reports Print
1. Type desiredDaily Print time
2. Click Ok
1. Click (highlight)System Group inLeft Panel
2. Select Station inRight Panel
3. Drag Station ontoPrintQueueGroup inLeft Panel for DailyReporting
Toggle Auto QueueJob On/Off icon
Note: Double ClickPrintQueueGroup to changedefault daily print time
44
If the pop-up box does not appear, the computer is in “Auto Job On” mode. To accessthe execution time window first turn off “Auto Job” mode by clicking the Toggle AutoQueue Job On/Off icon (Figure 6-1) at the far right of the icon bar. Then double clickPrintQueueGroup again. Enter the time desired in 24-hour (HH:MM:SS) format andthen click Ok. Be certain that the selected time is AFTER the daily poll time.
6.2 Remove a Station from and Automatic Print QueueTo remove a station from an automatic print queue, follow the same procedure asremoving a station from an Automatic Polling Group in Section 5.5, Page 41.
6.3 Add or Remove Automatic Print QueuesTo print reports from different stations at different times, new Print Queue Groups mustbe added. Follow the same procedure as explained in Section 5.6, Page 41, for addingautomatic polling groups. To remove a Print Queue Group, follow the procedureexplained in Section 5.7, Page 42, for removing a polling group.
6.4 Create a Daily Report Template
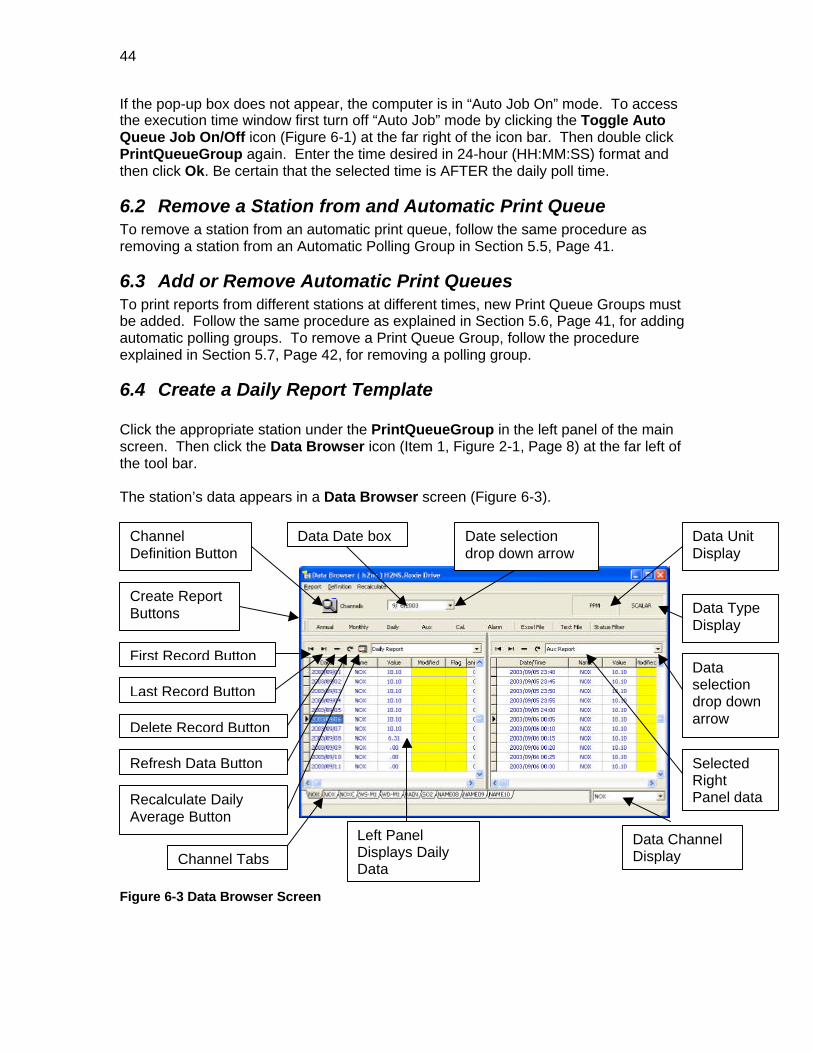
Click the appropriate station under the PrintQueueGroup in the left panel of the mainscreen. Then click the Data Browser icon (Item 1, Figure 2-1, Page 8) at the far left ofthe tool bar.
The station’s data appears in a Data Browser screen (Figure 6-3).
Figure 6-3 Data Browser Screen
Left PanelDisplays DailyData
Channel Tabs
Create ReportButtons
ChannelDefinition Button
Data Date box Date selectiondrop down arrow
Data UnitDisplay
Data TypeDisplay
Data ChannelDisplay
First Record Button
Last Record Button
Delete Record Button
Refresh Data Button
Recalculate DailyAverage Button
Dataselectiondrop downarrow
SelectedRightPanel data

45
Next, click the Daily button below the date box near the top of the screen. The DailyAverage Report screen appears with all the stations parameters listed in the left panel(Figure 6-4).
Figure 6-4 Daily Average Report Screen
6.4.1 Select Channels to ReportCustomizing a report is similar to selecting the channels for downloading text files fromDataLink/AQM (Section 3.3.7.1.3.2, Page 23). Select the parameters to be included inthe report in the left panel. More than one can be selected at a time by holding down the“Ctrl” key. Click the dark green arrow to move the parameter(s) to the “Selected” panelon the right. Alternately, you can click, drag, and drop parameters or double click them,to move them from one panel to the other.
The channels selected will print on the report from left to right in the order they are listedfrom top to bottom. To change the order of print, click the channel to be moved in theright column and then click the up or down arrow in the bar between the panels.
If the channels selected will not fit because of field size, the selected items in the rightcolumn will turn red. The number of characters that will fit and the number selected areshown just below the two panels.
6.4.2 Report OrientationThe print orientation of the printer will default to the orientation last selected on thecomputer sending the print job. To check or change the orientation, click the Setup
AvailableChannels
SelectedChannelsfor Report
Print SetupButton
Print ButtonSave to File Button
Actual orModified DataRadio Buttons
Field Widthbox
Report Width
Title Box
TemplateName Box
Save TemplateButton
Select Templatedrop down arrow
Available Width
Report Preview Button

46
button at the bottom left of the report window (Figure 6-4). The Print Setup screenappears (Figure 6-5).
Figure 6-5 Print Setup Screen
Of the printers available to the computer, select the printer where the reports are to beprinted by clicking the drop down arrow in the Name box and highlighting the appropriateprinter. Alternately, click the Network button in the lower left of the screen to add aprinter available through a network connection to the computer.
Click the Properties button in the top right of the screen to select other features;whether the pages are printed from front to back or back to front and other “advanced”properties. These are most often left in the default selections.
In the Paper section of the screen, select the proper paper size and location in theprinter using the drop down arrow and highlight method described above. Click theappropriate radio button in the Orientation section of the screen to select either Portraitor Landscape orientation. Then click OK to return to the template format page.
6.4.3 Name a Report and Assign a Template NameClick in the Title: box near the top of the screen. Type a name to be printed at the titleof the report.
Next assign a name to the template created. There are ten (10) automatic reporttemplates available for each station, AUTOPRINT0 through AUTOPRINT9. To seewhich template names have been used, click the drop down arrow in the SelectExisting Template Name box at the top of the screen. Click each report to see whichnames have been used. Note that any of these existing templates can be printed oredited as they appear.
Click in the Save Template Name As: box and type a template name. Templatenames must be in all CAPs without spaces (“AUTOPRINTX”).
Select Printerdrop down arrow
Portrait orLandscapeRadio Buttons
PropertiesButton
Paper SizeBox
PaperLocation Box
NetworkPrinters Button

47
6.4.4 Separate ReportsAs an automatic daily job, the Separated Reports radio button should be clicked.Printing manually allows the selection of a continuous report over several days, from andto the dates and times desired, by clicking the One Report radio button and completingthe date and time boxes.
Assure the date(s) is (are) accurate.
6.4.5 Data SourceRegardless of the radio button selected in the Data Source box below the SelectedChannels window, only ACTUAL data will be reported in automatically printed reports.This is because the Data Source defaults to Actual each time the Data Browser isaccessed and it is not saved along with the template.
6.4.6 Preview a ReportTo preview the report simply click the Preview button at the bottom of the screen. Thereport is shown. To rotate through three alternate view sizes of the report continue toclick the Zoom button at the bottom of the screen.
6.4.7 Save a Report TemplateIf the report is formatted as desired, save the template by clicking the Save Button tothe right of the Save Template Name As: box. Close the screen by clicking the Closebutton under the save button.

48
7 View Data and/or Manually Print ReportsData is accessed and reports may be selected by clicking the station of interest in theSystems Group in the left panel of the main DataLink/AQM window and then clicking theData Browser icon (Item 1, Figure 2-1, Page 8). The Data Browser Screen will appearwhich details the station’s data base (Figure 6-3, Page 44).
DataLink/AQM provides a variety of printable reports, flexible in both set up andexecution. The following reports are available:• Annual Report – A report of monthly averages and totals for a selected year.• Monthly Report – A report of daily averages and totals for each day of a month.• Daily Summary – An hourly average report for a selected date(s).• Aux Report – A report of data averaged over a selected time period.• Monthly Detail – Reports hourly averages, for a single channel, for each hour in a
month.• Channels Output Report – A monthly report of hourly averaged data for several
channels.• Alarm Report – A report of incidents or channel values exceeding those
programmed into the data logger.• Filtered Alarm Status Report – A report of selected incidents or channel values
exceeding those programmed into the data logger.• Calibration Report – A report of calibration times with actual and expected values.• Edited Report – A report that compares modified data values with actual values.
7.1 Channel Definition TableThe Channel Definition Table displays all of the channels available at the data logger.
Click the Channels button in the Data Browser screen (Figure 6-3, Page 44). Apassword box appears similar to Figure 3-4, Page 11. If a password has been set, enterit and then click Ok. Otherwise, simply click Ok. A password can be added or changedby clicking the Change button before clicking Ok (Section 3.2.2, Page 11).
When OK is clicked, the Channel Definition Table appears (Error! Reference sourcenot found.). This table defines the channels based on the data downloaded from thedata logger during configuration of DataLink/AQM.
The screen includes two different tabs at the top. The first, Data Channels, reflects rawdata definitions. The columns at the top list the Channel number, data Name, an Alias(or alternate name), the last valid date, the unit of measure, the number of decimalpoints in the data, the number of decimal points in the calibration data, the type of unit(Scalar, Vector, or Deviation), flags (yes or no), visible (yes or no), the input location,offset value, a multiplier, the maximum and minimum values for graphics, a High Highlimit, a High limit, an hourly average value limit, a daily average value limit, a monthlyaverage value limit, the expected zero calibration limit, and the expected span drift ofcalibration values.

49
Figure 7-1 Channel Definition Screen
Click the Calculated Channels tab to see the channels of calculated data and anyrelated channel definitions available at this station.
The channel editor at the bottom of the screen (when on either tab) allows the updatingand editing of values on any given channel. It consists of left and right arrows forselection of channels, plus and minus buttons for adding or deleting channels, an uparrow for allowing editing of a channel, a check for accepting an edit, an “x” for cancelingan edit and a circular arrow for restoring the previous data definition. It is stronglyrecommended that these functions not be used, since it increases the risk that the datalogger and DataLink/AQM are not synchronized. It is always better to update data linkby downloading the channel data from the data logger (Section 4.3, Page 35)
Close the Channel Definition Table by clicking the “X” in the upper right hand corner ofthe window. The Main Data Browser Screen returns.
7.2 Report DateIn the date box to the right of the Channels button on the Data Browser screen (Figure6-3, Page 44) select the date of the data to be viewed, edited, or on which a report willbe based. Click in the date box and change the month, day and/or year by either typingthe date or using the up and down arrows. Alternately, click the drop down arrow at theright side of the box and a calendar appears. Use the forward/reverse arrows to select amonth and then click a date.
7.3 View Channel DataThe available channels are listed as tabs at the bottom of the screen. Select the data tobe viewed or modified by clicking the appropriate tab. Note the upper right hand cornerof the screen displays the unit of measure and its type for easy reference.
DataChannel tab
ChannelDefinitionTable
CalculatedChannels tab

50
The data is divided into two panels. The left panel shows the daily average data, whilethe right panel defaults to display interim (auxiliary) data values for the date selected.Clicking the drop down arrow in the right panel’s title box, offers other data viewsincluding daily and hourly reporting, an Alarm report, an Alarm look up table (or Alarmcode definition) report, a Calibration Report and an Operator Memo report.
7.4 Modify DataOn occasion it may be necessary to modify data to reflect events that may have causedthe data logger to log inaccurate or suspect data. Either Auxiliary (preliminary or interimdepending on the chosen configuration in Section 3.3.7.2, Page 27) or Hourly data maybe modified. Also, all fields in the Calibration, Memo and Alarm Look Up Tablereports may be modified. No fields in the Alarm report may be modified.
From the main DataLink/AQM window click the station for which the report is desired.Then click the Data Browser icon (Item 1, Figure 2-1, Page 8). To modify data, use thedrop down arrow in the right data panel’s title box and select the type of data to bemodified. The appropriate data will be displayed in the data panel. Next, click the date ofdata to be modified in the left panel. The left arrow with a line on its left just above thewindow will move you to the first record of data. The right arrow with the line on its rightwill move you to the last available record. The up and down arrows on the keyboardmoves the selection among available dates in the left panel or data elements in the rightpanel. Alternately simply click in the box of the data to be modified in the right panel. Inthe “Modified” column type the value to be used. In the “Flag” column, type the desiredflag if any. Only these two fields in the right panel may be updated. To delete a recordcompletely, use the “-“ button above the panel in question. An entire date can bedeleted if it is selected in the left panel. Use caution!
While Daily data appears to allow direct modification, it may only be modified to theextent that daily values are recalculated to a new modified value based on modifiedHourly data. When Hourly data is modified, it is necessary to update the Daily reportdata. To do so, after completing modifications, click the Recalculate Daily Averageicon to the left of the title box in the left panel. This will recalculate the Daily report andplace the result in the “modified” column.
Modified data does not change original data values; it simply updates a second set of“modified” data. Therefore, reports offer a choice of “Actual” or “Modified” data. Reportsusing modified data use actual data for any time point for which data was not modified.A “Modified” report would be identical to an “Actual” report if no data was modified.
To report modified data, click the Modified radio button in the Data Source block to theright of the Print Width box below the Selected Channels data window. This selectionMUST be made before printing any modified data report since the data source is NOTsaved with any report template.
7.5 Reports Available
7.5.1 Annual Report (Figure 7-2)From the main DataLink/AQM window click the station for which the report is desired.Then click the Data Browser icon (Item 1, Figure 2-1, Page 8). The Data Browser
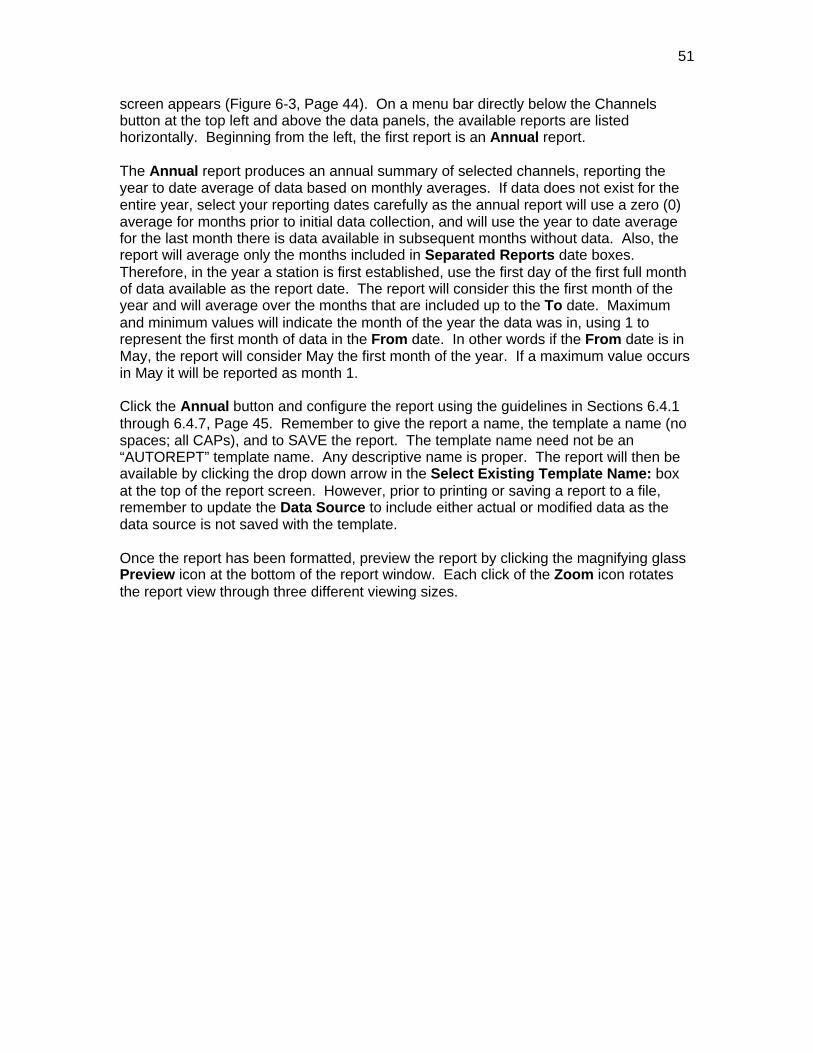
51
screen appears (Figure 6-3, Page 44). On a menu bar directly below the Channelsbutton at the top left and above the data panels, the available reports are listedhorizontally. Beginning from the left, the first report is an Annual report.
The Annual report produces an annual summary of selected channels, reporting theyear to date average of data based on monthly averages. If data does not exist for theentire year, select your reporting dates carefully as the annual report will use a zero (0)average for months prior to initial data collection, and will use the year to date averagefor the last month there is data available in subsequent months without data. Also, thereport will average only the months included in Separated Reports date boxes.Therefore, in the year a station is first established, use the first day of the first full monthof data available as the report date. The report will consider this the first month of theyear and will average over the months that are included up to the To date. Maximumand minimum values will indicate the month of the year the data was in, using 1 torepresent the first month of data in the From date. In other words if the From date is inMay, the report will consider May the first month of the year. If a maximum value occursin May it will be reported as month 1.
Click the Annual button and configure the report using the guidelines in Sections 6.4.1through 6.4.7, Page 45. Remember to give the report a name, the template a name (nospaces; all CAPs), and to SAVE the report. The template name need not be an“AUTOREPT” template name. Any descriptive name is proper. The report will then beavailable by clicking the drop down arrow in the Select Existing Template Name: boxat the top of the report screen. However, prior to printing or saving a report to a file,remember to update the Data Source to include either actual or modified data as thedata source is not saved with the template.
Once the report has been formatted, preview the report by clicking the magnifying glassPreview icon at the bottom of the report window. Each click of the Zoom icon rotatesthe report view through three different viewing sizes.
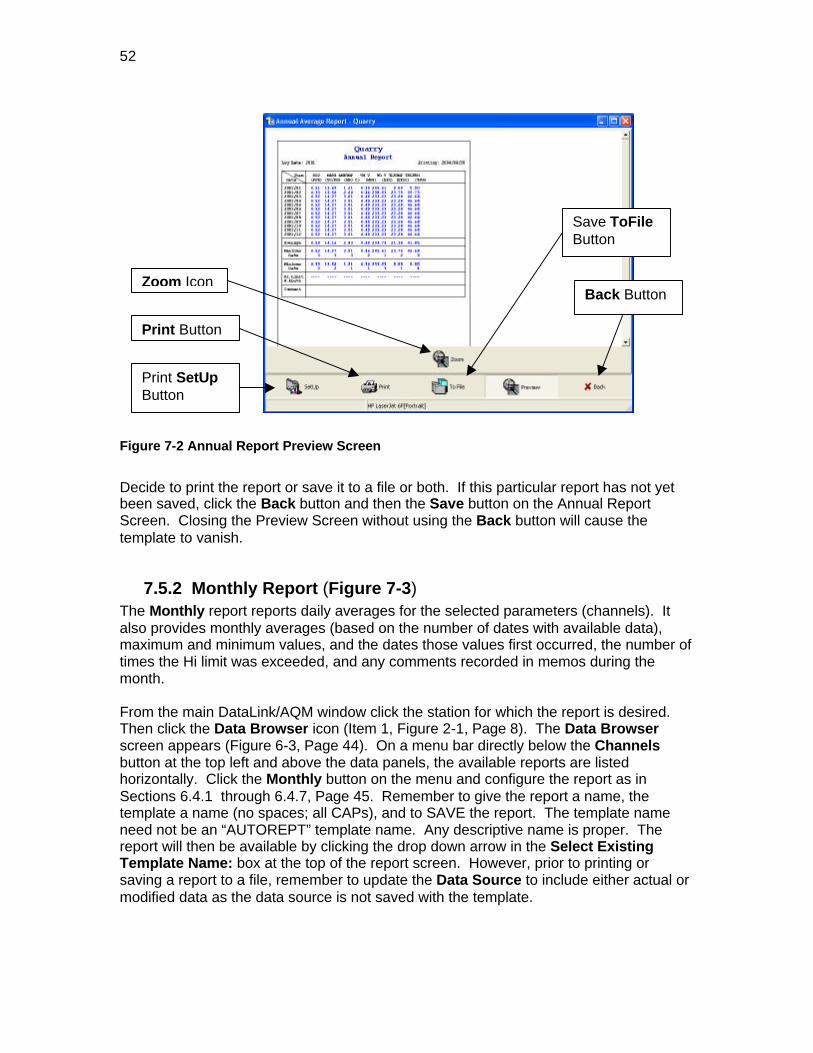
52
Figure 7-2 Annual Report Preview Screen
Decide to print the report or save it to a file or both. If this particular report has not yetbeen saved, click the Back button and then the Save button on the Annual ReportScreen. Closing the Preview Screen without using the Back button will cause thetemplate to vanish.
7.5.2 Monthly Report (Figure 7-3)The Monthly report reports daily averages for the selected parameters (channels). Italso provides monthly averages (based on the number of dates with available data),maximum and minimum values, and the dates those values first occurred, the number oftimes the Hi limit was exceeded, and any comments recorded in memos during themonth.
From the main DataLink/AQM window click the station for which the report is desired.Then click the Data Browser icon (Item 1, Figure 2-1, Page 8). The Data Browserscreen appears (Figure 6-3, Page 44). On a menu bar directly below the Channelsbutton at the top left and above the data panels, the available reports are listedhorizontally. Click the Monthly button on the menu and configure the report as inSections 6.4.1 through 6.4.7, Page 45. Remember to give the report a name, thetemplate a name (no spaces; all CAPs), and to SAVE the report. The template nameneed not be an “AUTOREPT” template name. Any descriptive name is proper. Thereport will then be available by clicking the drop down arrow in the Select ExistingTemplate Name: box at the top of the report screen. However, prior to printing orsaving a report to a file, remember to update the Data Source to include either actual ormodified data as the data source is not saved with the template.
Print Button
Print SetUpButton
Zoom Icon
Save ToFileButton
Back Button
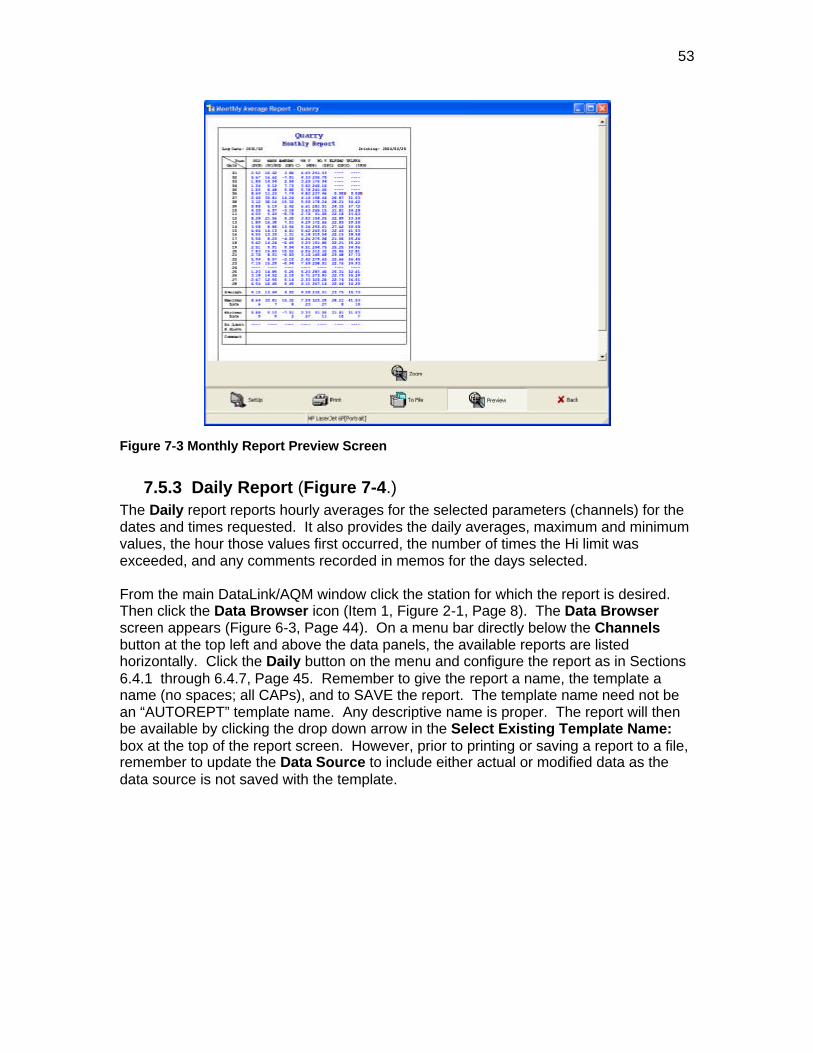
53
Figure 7-3 Monthly Report Preview Screen
7.5.3 Daily Report (Figure 7-4.)The Daily report reports hourly averages for the selected parameters (channels) for thedates and times requested. It also provides the daily averages, maximum and minimumvalues, the hour those values first occurred, the number of times the Hi limit wasexceeded, and any comments recorded in memos for the days selected.
From the main DataLink/AQM window click the station for which the report is desired.Then click the Data Browser icon (Item 1, Figure 2-1, Page 8). The Data Browserscreen appears (Figure 6-3, Page 44). On a menu bar directly below the Channelsbutton at the top left and above the data panels, the available reports are listedhorizontally. Click the Daily button on the menu and configure the report as in Sections6.4.1 through 6.4.7, Page 45. Remember to give the report a name, the template aname (no spaces; all CAPs), and to SAVE the report. The template name need not bean “AUTOREPT” template name. Any descriptive name is proper. The report will thenbe available by clicking the drop down arrow in the Select Existing Template Name:box at the top of the report screen. However, prior to printing or saving a report to a file,remember to update the Data Source to include either actual or modified data as thedata source is not saved with the template.

54
Figure 7-4 Daily Report Preview Screen
7.5.4 Aux (Interim) Report (Figure 7-5)The Aux report reports the interim averages (over the 5, 6, or 10 minute intervalsselected in configuration) for the dates and times selected. Because of this, an Auxreport can be quite lengthy. Consideration should be given to selecting particular hoursof a day in question. It also provides the daily averages, maximum and minimum values,the time those values first occurred, the number of times the Hi limit was exceeded, andany comments recorded in memos for the days selected.
From the main DataLink/AQM window click the station for which the report is desired.Then click the Data Browser icon (Item 1, Figure 2-1, Page 8). The Data Browserscreen appears (Figure 6-3, Page 44). On a menu bar directly below the Channelsbutton at the top left and above the data windows, the available reports are listedhorizontally. Click the Aux button on the menu and configure the report as in Sections6.4.1 through 6.4.7, Page 45. Remember to give the report a name, the template aname (no spaces; all CAPs), and to SAVE the report. The template name need not bean “AUTOREPT” template name. Any descriptive name is proper. The report will thenbe available by clicking the drop down arrow in the Select Existing Template Name:box at the top of the report screen. However, prior to printing or saving a report to a file,remember to update the Data Source to include either actual or modified data as thedata source is not saved with the template.

55
Figure 7-5 Aux (Interim) Data Report Preview Screen
7.5.5 Monthly Detail Report (Figure 7-6)The Monthly Detail Report reports the actual hourly average of a single parameter(channel) for each hour of a month. It reports the average of each hour, (based on thenumber of data points in the report), the number of hours included for the average, themaximum value for each hour, and the hourly total for the month. In addition, it reportsthe hourly average for each day in the month, the number of hours in the average, themaximum value for each day, and the total of each day’s readings.
From the main DataLink/AQM window click the station for which the report is desired.Then click the Data Browser icon (Item 1, Figure 2-1, Page 8). The Data Browserscreen appears (Figure 6-3, Page 44). On a menu bar directly below the Channelsbutton at the top left and above the data panels, the available reports are listedhorizontally. Click the Excel button on the menu. An Excel Report Output windowappears and defaults to the Monthly Detail tab near the top of the window.
In the Date Range section, select the beginning date of the report (usually the first dayof a month) by either typing the month, date, and year in the Start Date box or using thedrop down calendar by clicking the drop down arrow at the right of the box. Next selectthe last day to be reported (usually the last day of the month) using the same method inthe End Date box. The dates must be in the same month. If dates other than the firstand last day of the month are selected, only those dates will be reported, although thereport will still show every day in the month.
Next, in the Item section, click the drop down arrow of the box and select the channel tobe reported by clicking its name.

56
Finally, in the Out Put File Name box type the path and file name where the report willbe sent (a default name and location will appear). Alternately, use the browser button atthe right of the box to select a location. It is recommended a new folder be establishedto hold your reports and that reports be named to include the date of the report.
When complete, click the Ok button. While the report is calculated a “processing”message will appear. A “closing file” message will appear when the file is saved to thedesired location. To view the report, use “Windows Explorer” or “Excel” to locate the fileand open it.
Figure 7-6 Monthly Detail Report
7.5.6 Channels Output Report (Fig. x.x)The Channels Output Report will report hourly, daily, or auxiliary (interim) data for anynumber of channels available, over any date range. Either actual or modified data maybe reported. However, no averages or totals are reported.
From the main DataLink/AQM window click the station for which the report is desired.Then click the Data Browser icon (Item 1, Figure 2-1, Page 8). The Data Browserscreen appears (Figure 6-3, Page 44). On a menu bar directly below the Channelsbutton at the top left and above the data panels, the available reports are listedhorizontally. Click the Excel button on the menu. An Excel Report Output windowappears and defaults to the Monthly Detail tab near the top of the window. Click theChannels Output tab.
In the Date Range section, select the beginning date of the report by either typing themonth, date, and year in the Start Date box or using the drop down calendar by clicking
57
the drop down arrow at the right of the box. Next select the last day to be reported usingthe same method in the End Date box. The dates may span over a month’s end.
In the Data Type section, click the Hourly, Daily, or Aux radio button. In the DataSource section, click either the Actual or Modified radio button as desired.
Next select the channels desired by double clicking the desired channels in theAvailable panel. Select those in the order of preference as the first selected will be inthe first column of data, the second in the second column and so forth. As the channelsare selected they will appear in the Selected panel. Once the first is selected, the Okbutton at the bottom of the window will be activated.
Finally, in the Out Put File Name box type the path and file name where the report willbe sent (a default name and location will appear). Alternately, use the browser button atthe right of the box to select a location. It is recommended a new folder be establishedto hold your reports and that reports be named to include the date of the report.
When complete, click the Ok button. While the report is calculated a “processing”message will appear. A “closing file” message will appear when the file is saved to thedesired location. To view the report, use “Windows Explorer” or “Excel” to locate the fileand open it.
7.5.7 Calibration Report (Fig x.x)If the Data Logger is configured to perform calibrations, you can review the results ofselected calibration data for any period of time.
From the main DataLink/AQM window click the station for which the report is desired.Then click the Data Browser icon (Item 1, Figure 2-1, Page 8). The Data Browserscreen appears (Figure 6-3, Page 44). On a menu bar directly below the Channelsbutton at the top left and above the data panels, the available reports are listedhorizontally. Click the Cal. button on the menu. The Calibration Report windowappears.
The available calibration data is listed, with abbreviated names, in an Available panel inthe left center of the window. A list of abbreviations and there subject follows:Calibration Parameter Abbreviations DefinedName Channel NameZeroCal Actual Zero ValueZ.Diff Actual v. Expected DifferenceSTDZ.Cal(Data) Expected ZeroSpanCal Actual Span ValueSTDS.Cal(Data) Expected SpanSpan Ratio That value between the zero value and the span valueOffset Zero Value OffsetSlope Actual SlopeStatus Calibration Sequential Report of Digital Values vs. Time

58
Message Sequential Listing of Calibration Steps vs. TimeChannel Number The channel number being calibrated at the data logger
Configure the report as in Sections 6.4.1 through 6.4.7. Remember to give the report aname, the template a name (no spaces; all CAPs), and to SAVE the report. Thetemplate name need not be an “AUTOREPT” template name. Any descriptive name isproper. The report will then be available by clicking the drop down arrow in the SelectExisting Template Name: box at the top of the report screen. However, prior to printingor saving a report to a file, remember to update the Data Source to include either actualor modified data as the data source is not saved with the template.
7.5.8 Alarms and Alarm Reports (Fig. x.x)If the Data Logger is configured to report alarms, you can review alarms that have beenrecorded for any time period.
From the main DataLink/AQM window click the station for which the report is desired.Then click the Data Browser icon (Item 1, Figure 2-1, Page 8). The Data Browserscreen appears.
On a menu bar directly below the Channels button at the top left and above the datapanels, the available reports are listed horizontally. Click the Alarm button on the menu.The Alarm Report window appears.
Configure the report as in Sections 6.4.1 through 6.4.7 (move both Alarm and Msg tothe Selected column). Remember to give the report a name (e.g. Alarm Report), thetemplate a name (no spaces; all CAPs; e.g. ALARMREPT), and to SAVE the report.The report will then be available by clicking the drop down arrow in the Select ExistingTemplate Name: box at the top of the report screen.
For each instance, the Alarm Report will show the Time the alarm took place, a Typecode, a Subtype code and the Alarm Message associated with the Type code.
At this writing, there are 75 "Alarm Codes". The "Codes" should not be modified,however the accompanying "Message" can be changed to reflect site configuration.These "Messages" can be reviewed and modified from the Data Browser screen (seeSections 7.3 and 7.4).
7.5.9 Text File Reports (Fig x.x)Data may be extracted in an ASCII text file format. Daily, Hourly, Auxiliary or Alarm dataare available for extract.
From the main DataLink/AQM window click the station for which the report is desired.Then click the Data Browser icon (Item 1, Figure 2-1, Page 8). The Data Browserscreen appears (Figure 6-3, Page 44).
The data is divided into two panels. The left panel shows the daily average data, whilethe right panel defaults to display interim (auxiliary) data values for the date selected.Click the drop down arrow in the right panel’s title box, and select Daily Report, HourlyReport, Aux Report, or Alarm Report.
59
On a menu bar directly below the Channels button at the top left and above the datapanels, the available reports are listed horizontally. Click the Text File button on themenu. The Text Output Rule / Channels window appears.
Configure the report as in Section 3.3.7.1.3.
7.5.10 Alarm Status Report (Filtered) (Fig. x.x)A Filtered Alarm Status report provides information on selected incidents or channelvalues exceeding those programmed into the data logger over a selected time period.One or a combination of alarms may be selected. Unselected alarms will be left off thereport. The report provides the date and time of an alarm, the Channel alarmed, thealarm value, the alarm code, and a description of the alarm.
From the main DataLink/AQM window click the station for which the report is desired.Then click the Data Browser icon (Item 1, Figure 2-1, Page 8). The Data Browserscreen appears (Figure 6-3, Page 44).
The data is divided into two panels. The left panel shows the daily average data, whilethe right panel defaults to display interim (auxiliary) data values for the date selected.Click the drop down arrow in the right panel’s title box, and select Hourly Report, orAux Report.
On a menu bar directly below the Channels button at the top left and above the datapanels, the available reports are listed horizontally. Click the Status Filter button on themenu. The Alarm Filter screen appears. In the Condition SetUp section on the leftside of the screen, select the Date Begin of the report by either typing in the month, day,and year to begin the report or clicking the drop down arrow on the right side of the boxand then clicking the appropriate date in the drop down calendar. The left and rightarrows on the top of the drop down calendar will move forward and backward amongmonths. Provide the ending date in the Date End box in a similar manner.
Then, click the radio button(s) of the particular status(es) of interest. The choicesinclude Fail (F), Power Fail (P), Sample Criteria (<), Hi Alarm (+), Low Alarm (-), InvalidData (B), and Data in Cal (C).
Click the Search Data button. The selected alarms and values will appear in the rightpanel of the screen.
To print the report it must first be saved to a location on the network. Click theSave/Print button. A Save As screen appears. Update the File name box with anappropriate name, possibly including the dates and alarms in the report. It is notnecessary to select a Save as type as the file will be saved in a notepad text file. Clickthe Save button to the right of the File name box.
The report appears in a StatusRecord – Notepad screen. Print the report by selectingFile/Print in the menu bar in the window.

60
8 Trend ChartsDataLink/AQM supports two sets of Trend Charts to analyze collected data. One allowsdata trends for up to 18 channels from a mixture of stations and parameters (channels).The other allows display of data trends for up to 18 channels from a single station.
8.1 Multi Station/Multi Channel Trend ChartsOn the main DataLink/AQM screen click SystemGroup in the left window. Note thatonly the Trend Chart and the Toggle Auto Queue Job On/Off icons are available foruse in the icon bar. All other icons are “grayed” out.
Select the Trend Chart Icon (Item 2, Figure 2-1, Page 8). The Trend Chart(MultiStation) window appears with the Channels tab as default (Figure 8-1). In theupper left hand corner of the screen is a Stations/Channels section. There are twoempty boxes side by side. Click the drop down arrow of the box on the left and a list ofstations available in the Systems Group is shown. Select the first station from whichyou wish to chart data. In the second box on the right, the drop down arrow nowprovides a list of the channels (parameters) available at that station. Select the firstchannel you wish to chart. To add a second combination of Station and Channel, clickthe Add button to the right of the Stations/Channels section of the screen. A secondset of Station and Channel boxes appears. Repeat the process until all desired stationsand channels have been added (to a maximum of eighteen) for the trend chart. Once asecond channel has been added to the chart, a Remove button becomes active next tothe Add button. To remove a channel from the chart, click the channel twice to highlightit and then click the Remove button.

61
Figure 8-1 Trend Chart (Multi Station) Screen - Channels Tab (No Chart)
To the right of the Stations/Channels section there are Start Date / Day Count boxes.Select the date to begin the trend chart by either typing in the month, day, and year tobegin the report in the date box or clicking the drop down arrow on the right side of thebox and then clicking the appropriate date in the drop down calendar. The left and rightarrows on the top of the drop down calendar will move forward and backward amongmonths.
To the right of the day count box is the Data Type section. Click the radio button of thedesired data to trend. Note that the default type is Aux and the default day count is 1day. Also note in the Axis Section, below the Data Type section, the default number ofdata points for the day, or X-Count, is 1439 or one minute data for twenty-four hours. Ifone minute preliminary data is not collected in DataLink/AQM but, interim data iscollected and desired for the trend chart, click either the Hourly or Daily radio button
Station Box(es)
Channel Box(es)
Channel Tab Add Button Remove ButtonAuto UpdateButton
Start Date Box
No. Days Box Data Type RadioButtons
Data SourceRadio Buttons

62
and then back on Aux. Note that the X-count is adjusted to the number of data pointsactually available in the database. If the selected Data Type is Hourly the default daycount remains one and the X-Count defaults to 24. If the Data Type selected is Daily,both the default day count and X-Count become 31 (one month). If more days aredesired in the Trend Chart, either type the number of days desired in the Day Count boxto the right of the Start Date or click the up and down arrows in the right of the box toincrement to the appropriate number of days.
In the Data Source section to the right of Data Type click either the Actual or Modifiedradio button. See Section 7.4, Page 50 for a discussion on modified data.
Figure 8-2 Trend Chart (Multi Station) Screen - Channels Tab (Chart)
It is not necessary to adjust the Y-Axis minimum and maximum values as DataLink/AQMwill create a scale which will encompass all the data in the Trend Chart. If desired,adjustments may be made once an initial chart is viewed.
To chart the data, click the Go button on the function bar directly below theStations/Channels section of the screen (Figure 8-2). A line chart of the data over theselected time and intervals is prepared including an key box which indicates whichcolors represent which channels.
8.1.1 Alter Type of Trend ChartTrend charts may be line, bar or area charts. The default trend chart is a solid line chartwith a “square” pointer to identify each data point on the line. To show the line withoutthe “square” pointers, click the PointerOn button on the right end of the function bar
Chart Key
Go Button
Print to FileButton
Chart TypeDrop DownArrow
Pointer On/OffDrop DownArrow
Chart Body
X-Axis Length
Y-Axis Maximum
Y-Axis Minimum
Chart Title
Chart Editor Button
63
between the Trend Chart and the Sections/Channels section of the screen. Thefunction toggles to PointerOFF (Figure 8-2).
To change to a bar chart or area chart, click the Line button on the function bar just tothe left of the PointerOn/OFF function. The chart becomes a bar chart. Click the Barbutton and the chart rotates to an area chart. Click the Area button and the chart returnsto the line chart.
8.1.2 Alter Chart AppearanceTo make Trend Charts easier to read, many additional chart formatting features areavailable. Each channel can be independently represented by various types of lines,bars, or areas.
Access alternate formatting by clicking the ChartEditor button located at the top right ofthe screen (Figure 8-2). A Chart Parameters Inspector window appears on the rightside of the screen (Figure 8-3).
The station and channel selected is shown in the Channel Properties section of thewindow. The window will default to the last channel selected in the Stations/Channelssection.
Note that each of the parameters on the chart is drawn at a different depth on thescreen. Therefore, it is possible for “Area” channels to “hide” data from anotherparameter drawn deeper on the screen. To allow moving parameters to different depths,a Chart Position function is provided directly below the channel identification box.Clicking the arrows brings the selected channel forward or backward on the chart. Bymoving an area or bar channel further back, “hidden” data can appear in front of otherareas or bars.
The next section is the Chart Properties section of the window. By clicking the dropdown arrows to the right of each box, alternate choices are provided for colors (16),chart type (3), line style used to draw lines and bars (5), line size or thickness (virtuallyunlimited), and area types (7).
The next section is the Mark Value section. Clicking the check box will provide a boxwith the data point value for each data point available for the selected channel.

64
Figure 8-3 Chart Appearance Editor
The Pointer section provides a Show Pointer check box to allow toggling the pointer,which marks the actual data point on a line chart, on and off. This section also providesdrop down boxes to allow selection of different pointer styles (7), sizes (unlimited), andcolors (16). Click below the slide bar on the right of the window to show these optionsl
The above four functional sections are set for each parameter. To change to anotherparameter, simply double click the desired channel in the Stations/Channels section ofthe screen.
The last format option is the 3D Properties section. If the 3D Display check box ischecked, all channels will be shown in a simulated three dimensional chart. A slide baris provided to change the depth of the chart. Click the indicator on the slide bar and withthe left button held down; slide the indicator in either direction to increase or decreasethe perceived depth of the chart. Options are also provided to Change the color of thewalls of the chart.
Station/Channel ID
Channel Depth onChart Arrows
Line Thickness
Show all data values
Mark each data point
Click Slide for 3-DProperties (depth andwall colors) Section
Use Drop DownArrows to selectpreferred option

65
Experiment with various types and styles of charts until one is found that represents theselected data in the most informative way. Click the Go button each time selections arecompleted. Figs. x.x - x.x represent some of the myriad of styles available.
8.1.3 Print and Save Charts and Chart ConfigurationsA chart may be printed by simply clicking the Print button on the function bar betweenthe Stations/Channels section and the chart display. However, a Printer Property tabis provided for selecting printers and adjusting margins, orientation, and resolution of thebit map image.
Any chart may be saved in a location of choice simply by clicking the To File button onthe same function bar.
Finally, when closing out of the Trend Chart function (by clicking the “X” in the upperright hand corner of the window) an option is given to “Save Trend Chart Config?” If yesis selected, the configuration will be automatically recalled the next time the Trend Charticon is selected while on SystemGroup in the main DataLink/AQM screen.
8.1.4 Automatic Chart UpdateThere is a button next to the ChartEditor button that provides for automatically updatingthe trend chart whenever new data is available (Figure 8-1). To engage this feature,simply click the button. The button will recess indicating auto update is on. To turn thefeature off, click the button again.
8.2 Single Station/Multi Channel Trend ChartsOn the main DataLink/AQM screen, select the station to be charted. Click the TrendChart Icon (Item 2, Figure 2-1, Page 8). The single station Trend Chart screen appearswith the name and address of the station in the title box. The screen looks very muchlike the Trend Chart (Multi Station). The only difference is that there are no boxes forselecting a station.
Proceed to format the chart as in section 8.1 through 8.1.4.

66
9 Wind RoseDuring station configuration, in Section 3.3.6, the Wind Speed and Wind Directionchannels to be presented in a Wind Rose were identified. To review or change thisinformation, highlight the abbreviated Station Name of the data logger in the left windowof the main DataLink/AQM screen (Figure 3-2, Page 9). On the menu bar at the top ofthe screen, select Station and then ModifyStation. Enter a password, if necessary,and then click Ok. Click the Wind Rose tab on the Station Configuration screen (Fig.x.x).
The channel identifiers must be exactly the name reported in station configuration. Enterwind speed class boundaries and exit by clicking the top right “X”.
To view the Wind Rose Plot, highlight the abbreviated Station Name of the data logger inthe left window of the main DataLink/AQM screen. Click the Wind Rose icon (item 3,Figure 2-1, Page8). The Wind Rose Plot is displayed (Fig. x.x).
The colors on the plot describe the wind speed as coded at the bottom of the plot. Thewind direction is divided into 16 segments. The length of the wind direction pies or barsindicates the percentage of time the wind blew in a particular direction.
9.1 Wind Rose Plot SetupThe default Wind Rose Plot is for one day’s data on the last date data is available fromthe station. The left window of the plot window allows modification of the data shown inthe plot. The plot defaults to the Date tab for easy updating. However, the first time aWind Rose Plot is selected no data is displayed. This is because setup is not complete.
Click the SetUp tab at the bottom of the date information. The set up tab appears (seeFig. x.x). In the Wind Direction box, click the drop down arrow at the right end of thebox. A list of all available channels is shown. Highlight the proper wind directionchannel and click. In the Wind Speed box, click the drop down arrow at the right end ofthe box. Highlight the proper wind speed channel and click.
The Data Type section of the tab defaults to Aux(Interim). If Hourly or Dailyaverages are desired, click the radio button to the left of the data type desired.
The Data Source defaults to Actual. If Modified data is desired, click the radio buttonto its left.
Finally, the Graphics Type can be changed. The default is a pie slice for each of thesixteen directions which fans out as the percentage of wind from a given direction getslarger. A single width bar may be selected instead by clicking the radio button to the leftof Bar
9.2 Wind Rose Plot UpdateClick the Date tab. In the Start Date box, select the date to begin the plot by eithertyping in the month, day, and year to begin the report in the date box or clicking the dropdown arrow on the right side of the box and then clicking the appropriate date in the drop
67
down calendar. The left and right arrows on the top of the drop down calendar will moveforward and backward among months.
If more than one day’s data is to be viewed, change the number of days in the Count ofDays box by either typing in the number or using the up and down arrows at the rightend of the box.
If specific times are to be viewed, click the check mark in the Use Days Counter checkbox.
Once the date(s) have been selected, click the Go button below the Date section of theleft window to redraw the plot. The Go button becomes activated as soon as anything ischanged. To assure viewing the proper plot, check the parameters entered and click theGo button whenever it is activated.
The Percentage box allows for the outer boundary of the plot to be changed. Thedefault is 60%. However, if data is widely dispersed around the plot, this may be toolarge a percentage making estimating difficult. Conversely, if many of the winds camefrom a single direction, the pie extends beyond the boundary and a reading of thepercentage would be difficult. To change the boundary to view a more easily read chart,type a percentage in this box or use the up or down arrows at the right of the box tochange the percentage. Select a percentage slightly larger than the largest value onthe initial plot. Then click the Go button below the Date section of the left window toredraw the plot.
Buttons are provided to Print the plot, select the printer and set it up (Printer SetUp),and to save the plot To a File.
The colors used for the plot can be changed by right clicking the color to be changedand selecting Color. Clicking the color of choice on the color pallet that appears andclicking Ok will change the color.
Custom colors can be created by clicking Define Custom Colors >>. A rainbowappears to the right of the color pallet. To create a custom color, point to the color ofchoice by holding the left mouse button down to move the pointer around on the rainbowuntil the desired color appears in the Color|Solid block below the rainbow. Then clickthe Add to Custom Colors button. The color selected will be added to the CustomColors: pallet below the main color pallet. Then click the color and click Ok to changeto the custom color. Finally, click the Go button to redraw the plot with the new colors.
When the Wind Rose Plot window is closed by clicking the red X in the upper right handcorner, a Confirm box appears and asks if you wish to save this wind rose configuration.Clicking Yes will replace the last saved template with the wind rose configurationcurrently on screen. Clicking No will retain the previous wind rose template (the defaulttemplate if no other template has been previously saved).

68
10 Back-Up and RecoveryWhen the database file mode is set to Monthly Based (Separated Dbs) duringconfiguration (Section 3.3.7.1.2), data is kept in separate monthly files with only thecurrent file being updated regularly. Therefore the risk to database corruption andprocessing delays because of voluminous files is limited.
However, if Continuous (all in 1 Dbs) is the configured database, a single file containsall historical data and is continuously being updated. Therefore, as a precaution it iswise to periodically back-up the files. A back-up and recovery routine is provided inDataLink/AQM when in continuous database mode.
Figure 10-1 Password of BackUp Pop Up Box
Select the station that is to be backed up from or recovered to in the left panel of themain DataLink/AQM screen. Click the Back Up Data icon (Item 4, Figure 2-1, Page 8).A Password for BackUp pop up window appears (Figure 10-1Figure 2-1). Enter apassword, if necessary, and then click Ok. To add or change a password, use the sameprocedure as described in Section 3.2.2. The Data BackUp screen appears.
The left side of the screen indicates the data elements that may be backed up. Optionsinclude non date related data which need only be backed up when configurations to theoverall System or a particular Station occur. The date related data include the Daily,Hourly and Aux (Interim) Average Data and the Calibration and Alarm records. Simplyclick the check boxes of the data elements to be backed up.
The right side of the screen allows for either back-up (top half) or recovery (bottom half)..
In the Back Up Data section, select the beginning date of the back-up by either typingthe month, date, and year in the From: box or using the drop down calendar by clickingthe drop down arrow at the right of the box. Next select the last day to back-up using thesame method in the TO: box. Since backup is only allowed while in “Continuous File”mode, the dates may span over month ends. If the Remove after BackUp check box is
Enter Password (if necessary) orclick the Password Change Button
Password Change Button
Ok Button

69
selected, the data will be removed from the active database and the active database willbe reduced in size improving program performance time. If an existing backup file isbeing used as the destination, selecting the OverWrite Existing Records check box willoverwrite similar data in the destination file meaning all previous data in the file will belost.
Figure 10-2 Data BackUp Screen
The Destination section of the screen allows the selection of where the backup file willbe created. If System files are being backed up, enter a directory path and the name ofthe file to be created in the System Area box. Alternately, click the browser button onthe right side of the box to select an existing location anywhere on the computer’snetwork. Use the same technique to select a destination for station data elements in theStation Area box. It is a good idea to use a date in the destination filename (e.g.CalibratonRecordBackup20031031), thereby creating separate files for each backup.
When selection of data elements, dates, check box options and destination locationshave been completed, simply click on the BackUp icon. The backup files designatedwill be created where desired.
The lower right quarter of the Data BackUp screen provides for recovering data bymerging data from an exiting back-up file into the active data file. In the Merge Data Insection select the beginning date of data to be returned to active status by either typingthe month, date, and year in the From: box or using the drop down calendar by clicking
Title Box includes both Shortand Long Station NamesNon Date related data:
1. System
2. Station
Date relateddata

70
the drop down arrow at the right of the box. Next select the last day to return using thesame method in the TO: box. The dates may span over a month’s end. Selecting theOverwrite exiting records will overwrite similar records in the active file.
In the Source section of the Merge Data In section, select the back-up files from whichthe data is to be recovered by either typing the path in the boxes provided, or preferablyby using the browser on the right side of the System Area or Station Area boxes asapplicable.
When selection of data elements, dates, check box option and backup file sourcelocations have been completed, simply click the Merge icon. The backup files will bereincorporated into the active database.

71
11 Real Time Data AcquisitionThe Real time version of DataLink/AQM (DataLink AQM-RT) has a separate module tocontinuously update and display data . Highlight the station of choice in the MainDataLink/AQM screen. Click the Real Time Mode icon (Item 7, Figure 2-1, Page 8) toconnect to the station in “real time” mode. A green Logger Terminal screen appearsand after modem negotiation the words "CPP3794 Connected!” followed by a dataupdate (see Fig. x.x). A new set of data will appear based on the frequency rate setduring initial station configuration (Section 3.3.4 page 15). This rate can be adjusted,until the real time session is closed, by changing the rate of update in the Update Ratebox in the lower left of the screen. To permanently change the update rate, change thestation configuration (Section 3.3.4 page 15)
While in Real Time Mode DataLink/AQM will suspend Real Time Mode to retrieve finaland interim data to the main data base, as scheduled, and then return to Real TimeMode.
When in Real Time Mode a separate data base is created, using instantaneousinstrument readings collected by the data logger. If the update rate is every 10 seconds,the data base will contain instantaneous data with six updates per minute. The data canbe displayed in meter form, showing the latest “snapshot” readings, on a Real TimeTrend Chart over a selected number of data points, or in tabular form.
11.1 Meter SetupOn the main DataLink/AQM screen, select the station to be charted. Click the DisplayRealTime Meters icon (Item 8, Figure 2-1, Page 8). The RealTime Meters Display willappear (Fig. x.x ). There are two types of meters to display data; gauges and “LED”bars.
11.1.1 Gauge ConfigurationThe top left gauge is reserved for Wind Direction. Double click the gauge space andyou will get a depiction of a Wind Direction gauge (Fig. x.x).
Double click the Wind Direction gage. A WindDir window appears for set up (Fig. x.x).In the Channel Properties section, click the drop down arrow at the left of theChannelName box and then click the proper wind direction channel. The DisplayProperties section allows changing the meter’s default values. The MeterOuterColorbox allows selection of the gauge’s face color. The MeterScaleColor box allowsselecting the color of the color of the letters and dots on the meter’s face. TheMeterPinColor box allows selecting the color of the needle hand that indicates the winddirection. In addition to the gauge, the latest value is shown in a box in the center of thegauge.
Click and hold the button down on the slide to the right side of the window and pull itdown to show the remaining setup parameters. The MeterValueDec box is used toselect the number of decimal places to show in the “value” display box at the center ofthe gauge. The MeterValueDigit box determines the number of digits wide the “value”

72
display box is, including decimals. To change the font, click the Font button in theMeterFont section and then select the font type and other display characteristics of thefont.
Configuration of the other gauges is similar, but with more options. Double click theMeter 1 gauge space and a generic gauge appears. Double click the generic gauge andthe Meter 1 setup window appears. In the Channel Properties section, click the dropdown arrow at the left of the ChannelName box and then click the desired channel. Inthe Display Properties box, select the main color for the meter’s face by clicking theMeterOuterColor box’s drop down arrow and then clicking the color desired (default isblack). The center of the meter can be of a different color. Select the color of the centercircle by clicking the drop down arrow in the MeterInnerColor box and selecting thedesired color (default is green). An area of the display can be programmed to show asection of the face in an “alarm” color for readings greater than an alarm value. Choosethe alarm color from the MeterAlarmColor box (default is red). Next select the color ofthe numbers and dots used to delineate the scale on the meter (default is yellow). Thefinal color to be selected is the color of the needle used to show the last reading. Usethe MeterPinColor box to select its color (default is white).
The values to be shown are next to be configured. In the MeterMinValue box type theminimum expected value to be displayed. It may be a positive or negative value. In theMeterAlarmValue box type the value at which the alarm color will start on the gauge. Inthe MeterMaxValue box type the expected maximum value to be observed.
Click and hold the left mouse button down on the slide to the right side of the windowand pull it down to show the remaining setup parameters. The MeterDisplayAngle boxdetermines how many degrees of the circle will be used for the scale of the data. Typethe desired value or use the arrows on the right side of the box to increase or decreasethe value (default is 260 degrees). In the MeterValueGap box type the increments ofvalues to be displayed (default is 10). The MeterValueDec box is used to select thenumber of decimal places to show on both the scale and the “value” display box at thebottom center of the gauge. The MeterValueDigit box determines the number of digitswide the “value” display box is, including decimals.
The MeterDotType allows connecting the dots between meter readings with a circle byclicking the Dot and Circle check box. To change the font, click the Font button in theMeterFont section and then select the font type and other display characteristics of thefont for this meter.
The remaining gauges, desired for “real time” readings, are configured as Meter1.
11.1.2 LED Display SetupChannels may also be displayed using 6 “LED” bar indicators located below the roundGauges. Double click the empty bar below Meter1 and Meter 3. An empty bar isdisplayed. Double click on the bar, and the GaugeA setup window appears (Fig. x.x).The LED bars show three different spaces: a safe or green zone, a caution or yellowzone, and a danger or red zone. Select the channel (parameter) to be monitored andset the color and values for these zones in a manner similar to those used in section10.1.1 (Fig x.x). Setup other LED meters in the same manner as desired.

73
Fig. x.x is an example of a fully configured display panel.
11.2 Real Time Trend ChartsParameters (channels) of data can be displayed on a “real time” trend chart, updated atthe rate specified during “real time” setup (see Section 3.3.4). Each parameter trendedis individually set up allowing contrasting color assignment.
11.2.1 Initialize Trend ChartsOn the main DataLink/AQM screen, select the station to be charted. Click the TrendChart icon (Item 9, Figure 2-1, Page 8). The Real Time Trend screen appears (Fig.x.x). It is similar to the Single Station/Multi Channel Trend Chart discussed in Section8.2.
Format the chart as discussed in Sections 8.2 and 8.1– 8.1.3 with exceptions asdescribed below.
Since the chart is displaying instantaneous actual data, there is no Automatic Updatebutton. Also, there are no Start Date/Day Count, Data Type or Data Source selectionoptions. Instead there is Total Data Display section with a Count box to allow theselection of the number of data points to show on the “real time” display. In this box,type the number of data points desired or use the up and down arrows to the right of thebox to change the selection from the default.
Real time trend charts may only be line charts, and the pointer option does not exist.Therefore the Line and PointerOn buttons do not exist on the function bar between theTrend Chart itself and the Channels section of the screen. Also, the Chart Editorbutton does provide access to the Chart Parameters Inspector window but, only allowschanges relative to the salient functions of a line chart. It is recommended that the 3Dfunction be employed so that lines of equal value may be seen discretely from oneanother.
Finally, there is the addition of a DataBase tab at the top of the Real Time Trendwindow. Clicking this tab and then the Browse DataBase check box that appears,shows the data that exists in the limited “real time” data base described in Section 11and defined in Section 3.3.4 during DataLink/AQM configuration. This provides theability to view instantaneous data in “real time” mode in tabular form above the RealTime Trend Chart. Use the slide bars at the right and bottom of the table or use theFirst Record, Prior Record, Next Record, Last Record, and Refresh arrows belowthe bottom slide bar to browse through the database.
Finally, to change the amount of data shown, move the mouse arrow to the top border ofthe Trend Chart section until the arrow changes to two horizontal parallel lines with upand down arrows. Depress the left mouse button and slide the border up or down untilthe size of the windows is as desired.
When closing the Real Time Trend window by clicking the “X” in the upper right handcorner of the window, a Confirm pop up box asks “Save RealTime Chart Config?”Clicking the Yes button will save the parameters chosen. However, changes made tothrough the Chart Editor, other than color, will not be saved.

74
12 Retrieve Data ManuallyWhile automatic polling is the preferred method for updating DataLink/AQM data filesfrom a data logger, data can be downloaded for a specific set of dates.
On the main DataLink/AQM window, select the appropriate data logger. Make sureautomatic polling is turned off by clicking the Toggle Auto Queue Job On/Off icon (Item10, Figure 2-1, Page 8) if necessary. Click the Retrieve Data icon (Item 6, Figure 2-1,Page 8). A Specify Date Range pop up box appears. Select the beginning date of dataretrieval by either typing the month, date, and year in the Start Date box or using thedrop down calendar by clicking the drop down arrow at the right of the box. Next selectthe last day to retrieve using the same method in the End Date box. The dates mayspan over a month’s end. Click the Ok button. DataLink/AQM will connect with the datalogger and retrieve the data available for those dates. When complete, DataLink/AQMwill process the data and disconnect from the data logger.