Embed Size (px)
Citation preview

A damming report – Why are some
strategies for flood management more
sustainable than others?
Instructions
Record your answers in this booklet for revision – you are not allowed to
have anything in the exam except for the colour resource booklet.
The colour resource booklet remains in school and will be
distributed/collected at the start/end of each lesson.
Questions refer to the resource booklet but there is also extra information
to help give you a broader knowledge of the issues.
You must NOT write on the original colour SDME booklet.
Name: _______________________________________________________
Class: ________________ Teacher: ________________________________
I am sitting the Higher/Foundation paper

Instructions for Candidates The Sustainable Decision Making Exercise (SDME) is about the sustainability of flood management strategies. There are 7 resources discussing the characteristics of river basins and their effect on flooding, the impacts of flooding, human use of river floodplains, a variety of flood management strategies as well as a case study of a recent flood in an MEDC (Australia, January 2011). You will need to investigate the area, use atlases and maps to make sure that you know the areas well, carefully read these resources and then make a decision about the future. During the lessons before the exam you should:
Become thoroughly familiar with the resources
Extract ideas and issues from the text
Discuss reasons for patterns and new destinations
Consider the decision making process. There are 5 Resources dealing with the Background to the issue. These resources should be read carefully and used in the exam paper when told. Resource 6 deal with the options to attempt to manage flooding and resource 7 gives detailed information about a recent flooding incident. The questions in this booklet are designed to make sure that you are familiar with the resources and that you are able to answer questions in the examination. The examination is one hour long and you are required to answer all the questions. When writing answers make sure that you use black ink/pen, spend the right time on each section of the paper. When writing answers, Candidates make sure that they are answering the questions and avoid wasting time on irrelevant details and separate each answer from the rest of their answers. Marks will be awarded for spelling punctuation and grammar so you should make sure that you use the right vocabulary and focus specifically on the ‘command words’.

Hydrology Glossary
Bank Full Discharge The amount of water flowing down the river that will fill the channel to the top of the banks. Any more rain and discharge as a result will cause flooding.
Catchment area / Drainage basin
Defined area that a river and its networks of steams collect its water from. The boundary of the basin is called the watershed.
Condensation When water changes from gas (vapour) to liquid on cooling, clouds form
Deposition When sediment is laid down when the rivers ability to carry material reduces
Discharge/runoff The flow of the water at a point in a river. This is the velocity of the river multiplied by the cross sectional area (Width x depth) measured in m3 per sec.
Evapotranspiration The combination of evaporation and transpiration by vegetation that represents the movement of water vapour into the atmosphere.
Falling Limb A line on the storm hydrograph that represents the reduction in flow of the river as the river discharge declines.
Flood Plain The flat area either side of a river in the middle or lower course that can flow in times of high rainfall. Often the flood plain is used for agriculture as the soil is very fertile.
Ground water Flow The movement of water within the water table underground towards a river or the sea
Groundwater flow The movement of water below the surface
Hard Engineering The use of engineering, dams, levees and overflow channels to reduce the risk of the river flooding.
Hydrological cycle The continuous transfer and storage of water in the environment
Hydrosphere the water part of the global system
Infiltration The movement of water down through the soil to the water table.
Interception The mechanism where trees and other vegetation stop water moving towards a river by “soaking” it up either through roots, trunk or leaves.
Lag time Length of time between the peak rainfall and peak discharge of a river allowing planning and preparation to take place.
Levee A reinforced and raised bank. These can be natural but more often the result of hard engineering to increase the river’s capacity to carry water.
Overland Flow/Surface Flow
Movement of water over the land and surface because it cannot infiltrate (saturated/frozen/baked hard soil).
Peak Discharge The time when the river flow is at its’ greatest.
Peak Rainfall The time when the rainfall is at its most intense. Rainfall is measured in mm
Percolation The movement of water down through porous and pervious rocks until an impervious surface is reached.
Permeable/Impermeable allows / does not allow water to pass through
Porous Able to hold water in pore spaces, like a sponge
Precipitation Water (rain, snow, hail) transferred from the atmosphere to the surface
Reservoir A man-made lake used for storing water and sometimes producing hydroelectric power. Generally the Dam keeps the water back and is can be released slowly if required.
Rising Limb A line on the storm hydrograph that represents increasing flow of water into a river towards the peak discharge. A steep curve means that the river is likely to flood quickly.
River/ Stream The transfer, and temporary store, of water as it drains a catchment
Saturated Where all the space within the soil molecules is taken up by water and no more can be absorbed.
Soft Engineering The use of changes in the landscape to slow down water flow to prevent

flooding risk.
Store Any place where the water is not moving through the environment. Examples are a lake or reservoir, within vegetation such as trees, in clouds.
Through flow Movement of water through soil, usually laterally
Transpiration Loss of moisture by plants through their stomata, transferred to atmosphere
Transportation When matter (e.g sediment) is carried by a moving agent (e.g rivers)
Tributary Small river or stream joining the main channel
Water Table The top surface of the groundwater store.
Watershed The boundary of a catchment area
Key Command Words What it means
Compare Show similarities and differences. A balanced answer is required
Consider Describe and give your thoughts on the subject
Contrast Point out only the differences between two items
Define Explain the precise meaning of a concept. This should include any difficulties in defining the term
Describe Say what something is like, how it works, and so on
Discuss Explain an item or concept, and then give details about it, using the supportive info, examples, for and against. Give both sides and come to a conclusion.
Examine Investigate in details, offer evidence for and against
Explain Offer a detailed and exact explanation of an idea or principle
Identify/What/ name/state
Express the relevant points briefly and clearly without lengthy discussion
Illustrate Provide examples to demonstrate or prove the subject of the question
Justify Give only the reasons for a position or an argument, and the main objections
Summarise/Outline
Provide a summary of all the info about a subject.

General Resources Sustainabiltity Venn Diagram
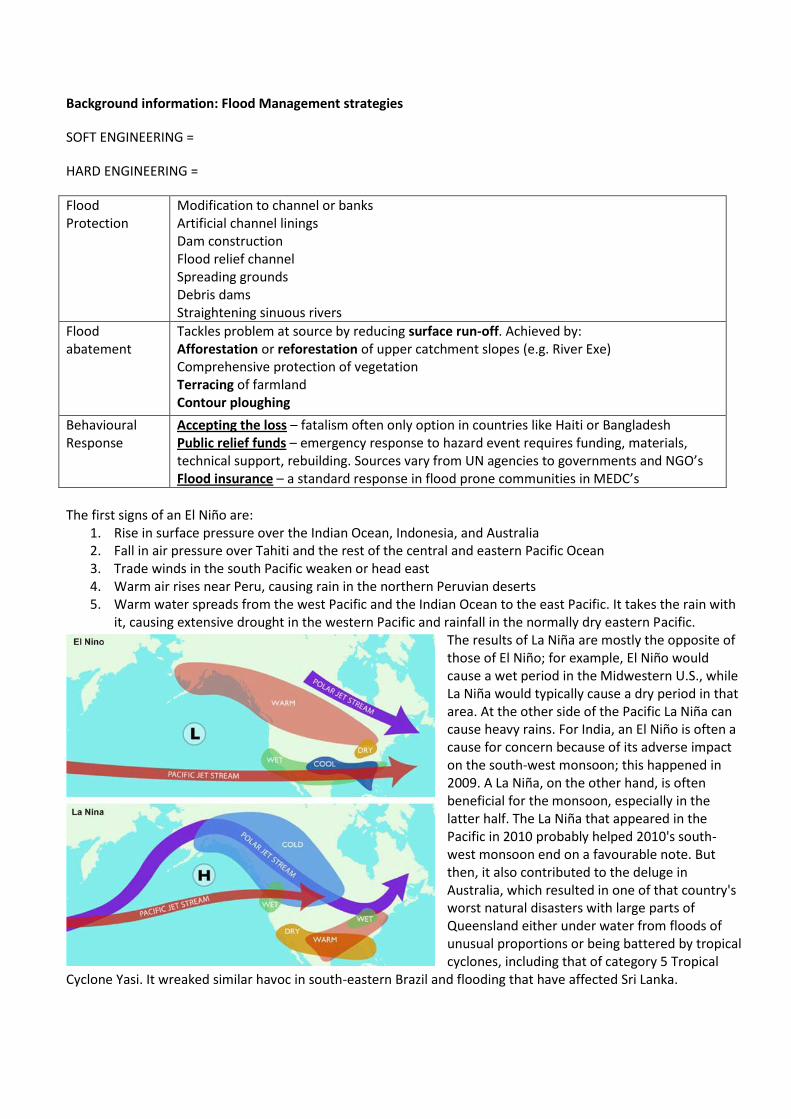
Background information: Flood Management strategies
SOFT ENGINEERING =
HARD ENGINEERING =
Flood Protection
Modification to channel or banks Artificial channel linings Dam construction Flood relief channel Spreading grounds Debris dams Straightening sinuous rivers
Flood abatement
Tackles problem at source by reducing surface run-off. Achieved by: Afforestation or reforestation of upper catchment slopes (e.g. River Exe) Comprehensive protection of vegetation Terracing of farmland Contour ploughing
Behavioural Response
Accepting the loss – fatalism often only option in countries like Haiti or Bangladesh Public relief funds – emergency response to hazard event requires funding, materials, technical support, rebuilding. Sources vary from UN agencies to governments and NGO’s Flood insurance – a standard response in flood prone communities in MEDC’s
The first signs of an El Niño are:
1. Rise in surface pressure over the Indian Ocean, Indonesia, and Australia 2. Fall in air pressure over Tahiti and the rest of the central and eastern Pacific Ocean 3. Trade winds in the south Pacific weaken or head east 4. Warm air rises near Peru, causing rain in the northern Peruvian deserts 5. Warm water spreads from the west Pacific and the Indian Ocean to the east Pacific. It takes the rain with
it, causing extensive drought in the western Pacific and rainfall in the normally dry eastern Pacific. The results of La Niña are mostly the opposite of those of El Niño; for example, El Niño would cause a wet period in the Midwestern U.S., while La Niña would typically cause a dry period in that area. At the other side of the Pacific La Niña can cause heavy rains. For India, an El Niño is often a cause for concern because of its adverse impact on the south-west monsoon; this happened in 2009. A La Niña, on the other hand, is often beneficial for the monsoon, especially in the latter half. The La Niña that appeared in the Pacific in 2010 probably helped 2010's south-west monsoon end on a favourable note. But then, it also contributed to the deluge in Australia, which resulted in one of that country's worst natural disasters with large parts of Queensland either under water from floods of unusual proportions or being battered by tropical cyclones, including that of category 5 Tropical
Cyclone Yasi. It wreaked similar havoc in south-eastern Brazil and flooding that have affected Sri Lanka.
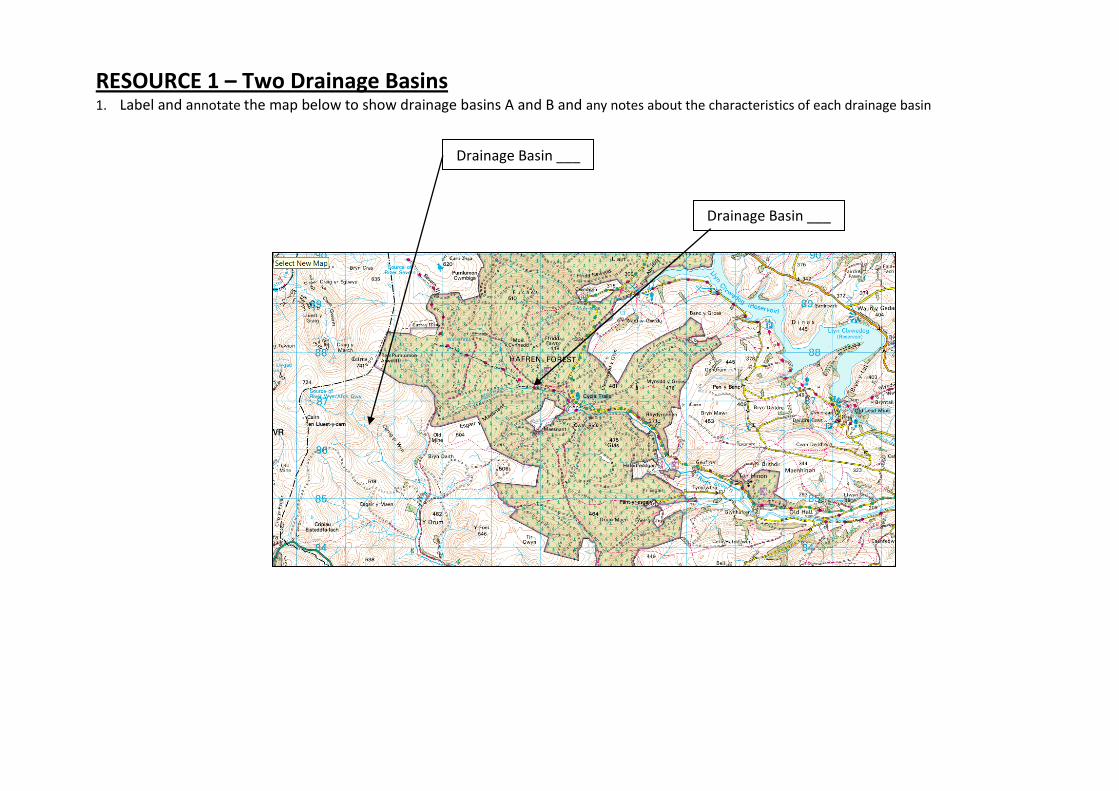
RESOURCE 1 – Two Drainage Basins 1. Label and annotate the map below to show drainage basins A and B and any notes about the characteristics of each drainage basin
Drainage Basin ___
Drainage Basin ___

2. Annotate a field sketch for each river basin
River Basin A
River Basin B

3. Complete the table below
Drainage Basin A Drainage Basin B Peak rainfall mm
Peak rainfall time
Peak discharge (m3/s) Peak discharge time
Lag time Description of rising
and falling limbs
Description of the photo – shape of land, land use size of river
Description of drainage basin from
OS map
Could this basin flood?
Explain your answer

4. Key Question: The landscape, vegetation and human uses of this landscape can have a huge effect on the way that the water reacts within the River Basin area. Using answers above describe how these factors change the way that the river reacts to flood events within the 2 basins. Use figures to back up your description. .........................................................................................................................................................................................................................................................................................................................................................................................................................................................................................................................................................................................................................................................................................................................................................................................................................................................................................................................................................................................................................................................................................................................................................................................................................................................................................................................................................................................................................................................................................................................................................................................................................................................................................................................................................................................................................................................................................................................................................................................................................................................................................................................................................................................

Resource 2 – Impacts of Flooding Impacts of flooding - Risk, disaster or hazard?
5. Read the definitions. Try to remember all three. Close the booklet. Only fill in the blanks when you can
remember all three correctly.
Flood - The probability of a flood happening.
Flood - Death or Damage caused when a flood happens.
Flood - A flood which can threaten life and property.
Probability means the likelihood of something happening. (E.g. Low Probability = less likely to happen)
Impact means the effect(s) that something will have. (E.g. High impact = serious effects)
6. Place the following floods /rivers in the “most likely” quarter of the graph. Write the description next to the
flood/river. (Low Probability, High Impact/ Low Probability, High Impact/ High Probability, High Impact / High
Probability Low Impact)
Ganges Delta, Bangladesh
Boscastle
Colorado River (Grand Canyon)
Somerset Levels

Resource 3 – Areas which could be affected by flooding
7. Spot the difference! Write a different letter next to each of the differences on Area 1. Describe those
differences below. (“In Area 1 there is ***** whereas in Area 2 there is ******”).
a. ................................................................................................................................................
b. ................................................................................................................................................
c. ................................................................................................................................................
d. ................................................................................................................................................
e. ................................................................................................................................................
8. Which are do you think is the most likely to flood? Circle your answer.
Area 1 / Area 2
9. State two differences between Area 1 and Area 2 (One human and one physical) and explain why you think
they would increase OR decrease the risk of flooding
10. Difference 1(Human)..................................................................................................... ................. ................. .
11. Developed Explanation (Why it will increase/reduce the risk of flooding)
.................................................................................................................................................................................
.................................................................................................................................................................................
.................................................................................................................................................................................
.................................................................................................................................................................................
.................................................................................................................................................................................
.................................................................................................................................. ................... ................... .....
12. Difference 2 (Physical)..................................................................................................... ................. ................. .
13. Developed Explanation (Why it will increase/reduce the risk of flooding)
.................................................................................................................................................................................
.................................................................................................................................................................................
....................................................................................................................................... ................... ...................
.................................................................................................................................................................................
.................................................................................................................................................................................
............................................................................................................. ............................................... ...................
.................................... ................... ................... ................... ................... ................... ................... .....................

Resource 4 – Floodplain hazard zones
14. What do we mean by a 100 year flood? .......................................................................................................................................................................................
.......................................................................................................................................................................................
.......................................................................................................................................................................................
........................................................................................................................... ................... ................... ...................
15. Complete the table below to show the flood risk presented by different floods.
Chances of a Major Flood in a Region
Return Period Chances
500-year
100-year 1 in 100 (1%)
50-year
25-year
10-year
5-year
2-year
16. Can a 500-year flood happen two years in a row? .......................................................................................................................................................................................
.......................................................................................................................................................................................
.......................................................................................................................................................................................
........................................................................................................................... ................... ................... ...................

Resource 4
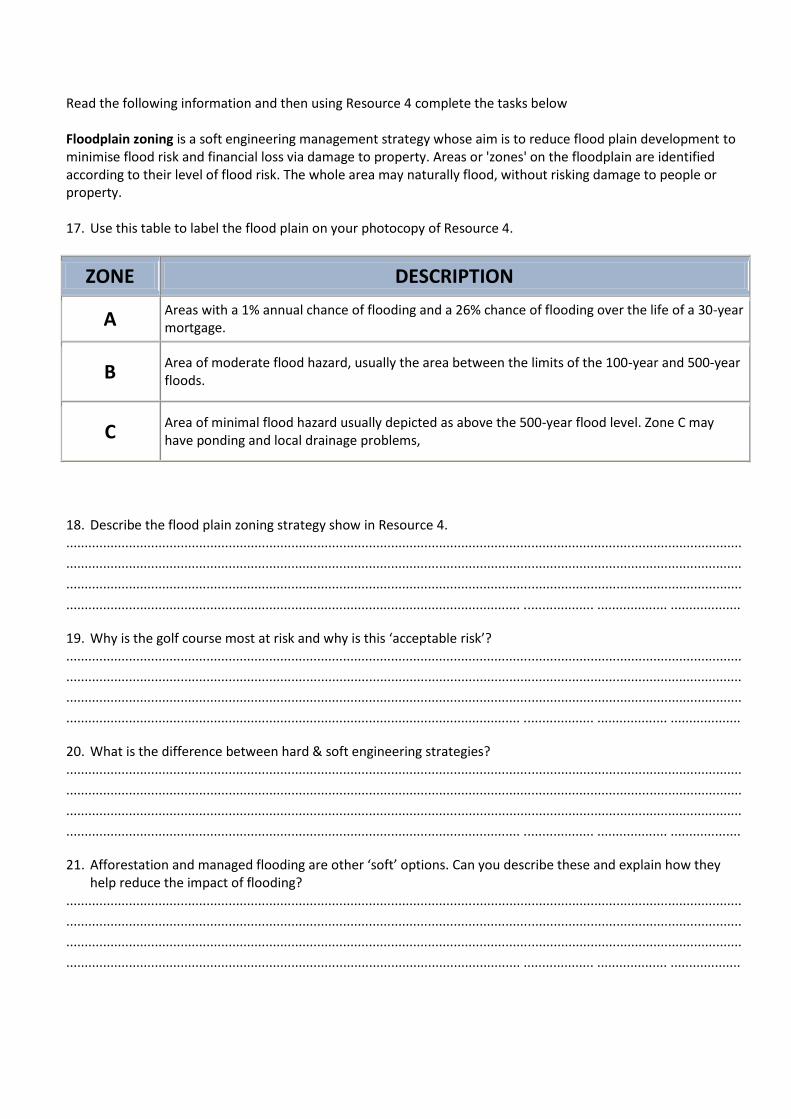
Read the following information and then using Resource 4 complete the tasks below
Floodplain zoning is a soft engineering management strategy whose aim is to reduce flood plain development to minimise flood risk and financial loss via damage to property. Areas or 'zones' on the floodplain are identified according to their level of flood risk. The whole area may naturally flood, without risking damage to people or property. 17. Use this table to label the flood plain on your photocopy of Resource 4.
ZONE DESCRIPTION
A Areas with a 1% annual chance of flooding and a 26% chance of flooding over the life of a 30-year mortgage.
B Area of moderate flood hazard, usually the area between the limits of the 100-year and 500-year floods.
C Area of minimal flood hazard usually depicted as above the 500-year flood level. Zone C may have ponding and local drainage problems,
18. Describe the flood plain zoning strategy show in Resource 4. .......................................................................................................................................................................................
.......................................................................................................................................................................................
.......................................................................................................................................................................................
........................................................................................................................... ................... ................... ...................
19. Why is the golf course most at risk and why is this ‘acceptable risk’? .......................................................................................................................................................................................
.......................................................................................................................................................................................
.......................................................................................................................................................................................
........................................................................................................................... ................... ................... ...................
20. What is the difference between hard & soft engineering strategies? .......................................................................................................................................................................................
.......................................................................................................................................................................................
.......................................................................................................................................................................................
........................................................................................................................... ................... ................... ...................
21. Afforestation and managed flooding are other ‘soft’ options. Can you describe these and explain how they help reduce the impact of flooding?
.......................................................................................................................................................................................
.......................................................................................................................................................................................
.......................................................................................................................................................................................
........................................................................................................................... ................... ................... ...................

22. Are ‘soft’ engineering strategies more sustainable? Discuss. ................................................................................................................................................................................................................................................................................................................................................................................................................................................................................................................................................................................................................................................................................................ ................... ................... ................... .......................................................................................................................................................................................
.......................................................................................................................................................................................
........................................................................................................................... ................... ................... ...................

Resource 5 – Human use of floodplains 23. Fill in the table below
Picture LEDC/ MEDC
Category of Activity Why are these activities on the
floodplain?
In which zone would these activities ideally be located?
(Resource 4)
Sustainability Ranking
1.Worcester, UK
2.Cuckmore, Sussex, UK
3.Warsaw, Poland
4.Uttar Pradesh, India
5.Shanghai, China
6.Thailand, South East Asia
7.St Katharines Dock, London
8.Boppard, Germany
9.Olkiluoto, Finland

24. Which of these images shows a floodplain use that is unsustainable?
……………………………………………………………………………………………………………………………………………………………
25. Give two reasons why the land use has been located there.
…………………………………………………………………………………………………………………………………………………………………
…………………………………………………………………………………………………………………………………………………………………
…………………………………………………………………………………………………………………………………………………………
26. Give two problems that could arise from having it located on the floodplain and suggest where this
should ideally be located.
…………………………………………………………………………………………………………………………………………………………………
…………………………………………………………………………………………………………………………………………………………………
…………………………………………………………………………………………………………………………………………………………………
……………..…………………………………………………………………………………………………………………………………………………
…………………………………………………………………………………………………………………………………………………………………
………………………………………………………………………………………………………………………………………………… (6 marks)
27. Which of these images shows a floodplain use that is sustainable?
……………………………………………………………………………………………………………………………………………………………
28. Explain why it is sustainable.
…………………………………………………………………………………………………………………………………………………………………
…………………………………………………………………………………………………………………………………………………………………
…………………………………………………………………………………………………………………………………………………………………
……………..…………………………………………………………………………………………………………………………………………………
…………………………………………………………………………………………………………………………………………………………………
…………………………………………………………………………………………………………………………………………………………………
…………………………………………………………………………………………………………………………………………………………………
…………………………………………………………………………………………………………………………………………………………………
………………………………………………………………………………………………………………………………………… (6 marks)
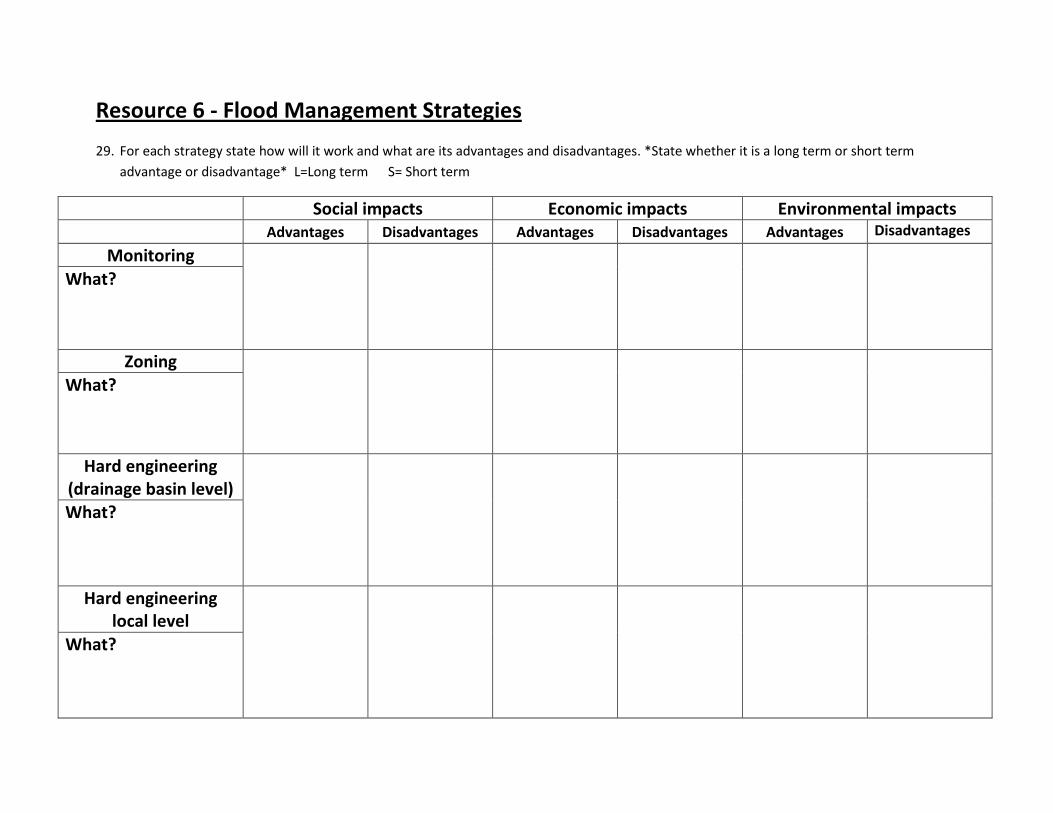
Resource 6 - Flood Management Strategies
29. For each strategy state how will it work and what are its advantages and disadvantages. *State whether it is a long term or short term
advantage or disadvantage* L=Long term S= Short term
Social impacts Economic impacts Environmental impacts Advantages Disadvantages Advantages Disadvantages Advantages Disadvantages
Monitoring
What?
Zoning
What?
Hard engineering (drainage basin level)
What?
Hard engineering local level
What?

30. Key question: Which type of flood management strategy is the most sustainable? *Hint-think
advantages!* (4 marks)
…………………………………………………………………………………………………………………………………………………………………………………………………………………………………………………………………………………………………………………………………… …………………………………………………………………………………………………………………………………………………………………………………………………………………………………………………………………………………………………………………………………………………………………………………………………………………………………………………………………………………………………………………………………………………………………………………………………………………………………………………………………………

Resource 7 – Flooding in Brisbane, Australia, January 2011
Brisbane: Newspaper article
31. Complete the table below
No of Homes with serious flood damage:
No of Homes partially damaged:
No of Businesses partially flooded:
Death toll:
Cost of rebuild £
32. Create a spider diagram of the reason the crisis presented an unprecedented challenge:
Using the map:
33. How large an area was affected by flooding?
…………………………………………………………………………………………………………………………………………………………………
…………………………………………………………………………………………………………………………………………………………………
34. Which areas appear to be worst affected?
…………………………………………………………………………………………………………………………………………………………………
…………………………………………………………………………………………………………………………………………………………………
35. Considering the amount of damage done in 2011 and the cause of the flooding do you believe that
strategies need to be put in place? Explain your answer
…………………………………………………………………………………………………………………………………………………………………………………………………………………………………………………………………………………………………………………………………………………..………………………………………………………………………………………………………………………………………………… …………………………………………………………………………………………………………………………………………………………………
…………………………………………………………………………………………………………………………………………………………………
…………………………………………………………………………………………………………………………………………………………………
……………..…………………………………………………………………………………………………………………………………………………
Reasons for Floods

36. Resource 7

37. Complete the table below
Stakeholders Which strategy are they likely to prefer and why
Local residents
Local businesses
Local Government
Environmentalists
National Government

38. What strategies could they consider for the area? Think about those in the original resource and
other possibilities
……………………………………………………………………………………………………………………………………………………………………………………………………………………………………………………………………………………………………………………………………………………………………………………………………………………………………………………………………………………………………………………..………………………………………………………………………………………………………………………………………………… …………………………………………………………………………………………………………………………………………………………………
…………………………………………………………………………………………………………………………………………………………………
…………………………………………………………………………………………………………………………………………………………………
39. Which would you recommend and why?
……………………………………………………………………………………………………………………………………………………………………………………………………………………………………………………………………………………………………………………………………………………………………………………………………………………………………………………………………………………………………………………..………………………………………………………………………………………………………………………………………………… …………………………………………………………………………………………………………………………………………………………………
…………………………………………………………………………………………………………………………………………………………………
…………………………………………………………………………………………………………………………………………………………………
40. Which wouldn’t you recommend and why?
……………………………………………………………………………………………………………………………………………………………………………………………………………………………………………………………………………………………………………………………………………………………………………………………………………………………………………………………………………………………………………………..………………………………………………………………………………………………………………………………………………… …………………………………………………………………………………………………………………………………………………………………
…………………………………………………………………………………………………………………………………………………………………
…………………………………………………………………………………………………………………………………………………………………
……………..…………………………………………………………………………………………………………………………………………………