Embed Size (px)
Citation preview
© 2003AdventNet Inc.A ll R ights Reserved.
Phone: +1-925-924-9500
Fax: +1-925-924-9600
Email:[email protected]
AdventNet, Inc.
5645 Gibraltar Drive
Pleasanton, C A 94588 USA
[email protected]://www.adventnet.com
Systems and ApplicationsMonitoring Feature Pack
AdventNet Web NMS
AdventNet Web NMS 4.5.0 – Systems & Applications Monitoring Feature Pack
AdventNet Inc. 1
Table Of Contents
SYSTEMS AND APPLICATIONS MONITORING USING WEB NMS....................... 2
DISCOVERING APPLICATIONS............................................................................... 7
Configuring Application Discovery ....................................................................................... 8 Managing Multiple Instances of an Application.................................................................. 16 Performing On-demand Application Discovery.................................................................. 17
USING THRESHOLDS ............................................................................................ 18
Configuring Thresholds...................................................................................................... 19 Applying Thresholds on System Resources ...................................................................... 22
POLLING APPLICATIONS FOR STATUS.............................................................. 25
Configuring Application Status Polling............................................................................... 26 Understanding and Configuring Test Properties................................................................ 29
MONITORING ORACLE APPLICATIONS .............................................................. 33
Need for Oracle Applications Monitoring ........................................................................... 34
Collecting Data for Oracle Applications ............................................................................. 35
MONITORING HOST RESOURCE DATA............................................................... 38
Need for Monitoring Host Resources................................................................................. 39 Collecting Data for Host Resources................................................................................... 40 Configuring System Resources and Parsers..................................................................... 44 Configuring New Process and Command.......................................................................... 47
Adding a New Device Type ............................................................................................... 50
TROUBLESHOOTING TIPS.................................................................................... 52
AdventNet Web NMS 4.5.0 – Systems & Applications Monitoring Feature Pack
AdventNet Inc. 2
Systems and Applications Monitoring Using Web NMS
• Introduction
• Features
• Prerequisites
• About WMI
• System Requirements
• Systems and Applications Monitoring Components
• How It Works in Web NMS?
• Application Monitoring in Web NMS RME
Introduction Monitoring the devices in a network can be complemented by monitoring system resources like CPU, Memory, and applications, like database servers, web servers, mail-servers that run in the network. A single console that provides details on network, systems, and applications is a great value addition to the network administrator. AdventNet Web NMS provides an easy-to-install-and-use feature pack to perform applications and system resources monitoring. The feature pack called 'Systems and Applications Monitoring Feature Pack' can applied over any edition of Web NMS, i.e Standard, Professional, Remote Management Edition . The system resources and applications monitoring is configured using the Runtime Administration tool available with the feature pack. Systems and Applications Monitoring Features Out-of-the-box support for the following standard applications:
o Oracle DB server o Web server o SMTP server o POP server o IMAP server o MAIL server o NTP server o WebLogic server o FTP server o Exchange server o MSSQL DB server
AdventNet Web NMS 4.5.0 – Systems & Applications Monitoring Feature Pack
AdventNet Inc. 3
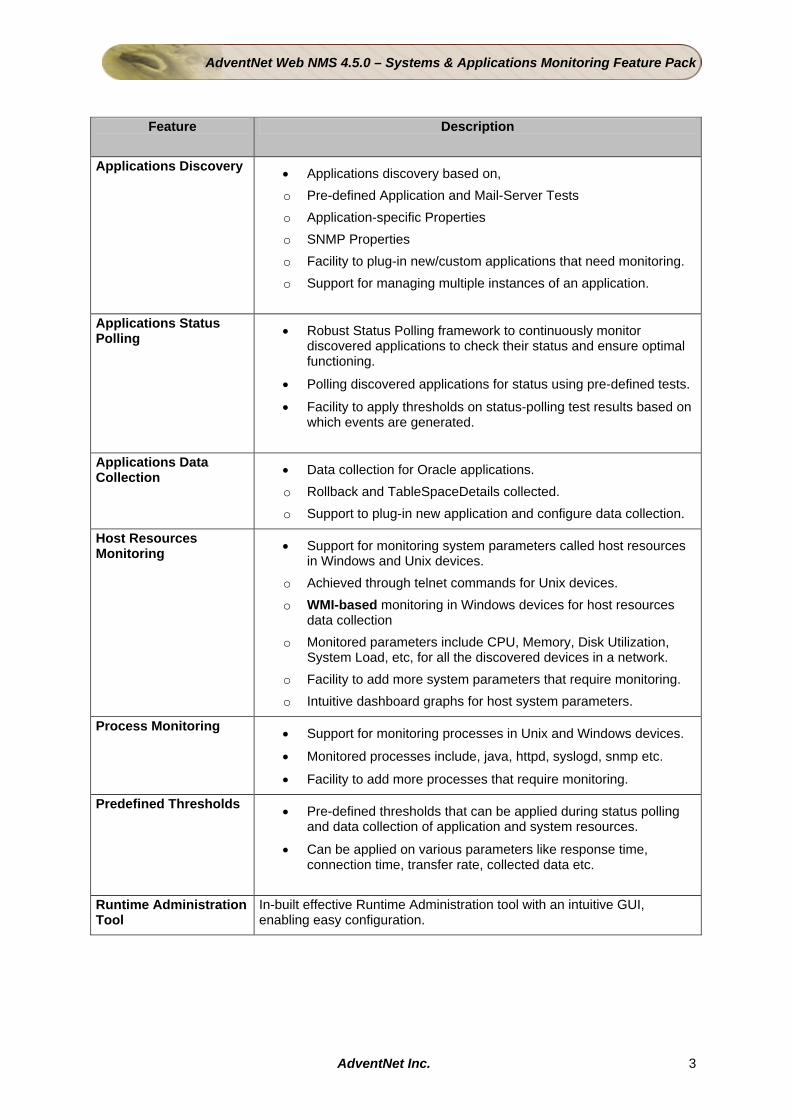
Feature Description
Applications Discovery • Applications discovery based on, o Pre-defined Application and Mail-Server Tests o Application-specific Properties o SNMP Properties o Facility to plug-in new/custom applications that need monitoring. o Support for managing multiple instances of an application.
Applications Status Polling • Robust Status Polling framework to continuously monitor
discovered applications to check their status and ensure optimal functioning.
• Polling discovered applications for status using pre-defined tests.
• Facility to apply thresholds on status-polling test results based on which events are generated.
Applications Data Collection • Data collection for Oracle applications.
o Rollback and TableSpaceDetails collected. o Support to plug-in new application and configure data collection.
Host Resources Monitoring • Support for monitoring system parameters called host resources
in Windows and Unix devices. o Achieved through telnet commands for Unix devices. o WMI-based monitoring in Windows devices for host resources
data collection o Monitored parameters include CPU, Memory, Disk Utilization,
System Load, etc, for all the discovered devices in a network. o Facility to add more system parameters that require monitoring. o Intuitive dashboard graphs for host system parameters.
Process Monitoring • Support for monitoring processes in Unix and Windows devices.
• Monitored processes include, java, httpd, syslogd, snmp etc.
• Facility to add more processes that require monitoring.
Predefined Thresholds • Pre-defined thresholds that can be applied during status polling and data collection of application and system resources.
• Can be applied on various parameters like response time, connection time, transfer rate, collected data etc.
Runtime Administration Tool
In-built effective Runtime Administration tool with an intuitive GUI, enabling easy configuration.
AdventNet Web NMS 4.5.0 – Systems & Applications Monitoring Feature Pack
AdventNet Inc. 4
Prerequisites • For system resources monitoring (CPU, memory, disk etc.) in Windows, WMI must be
installed. By default, this is available in Windows 2000 and higher versions. This needs to be installed separately in Windows NT.
About WMI
• WMI refers to Windows Management Instrumentation.
• It is an implementation for Web-Based Enterprise Management (WBEM).
• It uses Common Information Model (CIM) industry standard to represent systems, applications, networks, devices, and other managed components in an enterprise environment.
• Through WMI, a client application can request information from managed object and send instructions to the managed object
System Requirements The hardware and software requirements for the Systems and Applications Monitoring Feature Pack are same as that of AdventNet Web NMS. For more information on the supported system requirements, refer to Hardware Requirements and Software Requirements pages in the Installation Guide of Web NMS.
Note: Database schema is currently available only for MySQL, Oracle, and Sybase. Support will be extended for other databases on a need basis.
Systems and Applications Monitoring Components The components in the application monitoring framework are
• Application Discovery Engine: Discovers applications and their properties in a smart way.
• Status Polling Engine: Polls the applications for status, taking into account a number of parameters including connection time, data transfer rate, query time, and execution time to determine the availability and the state of an application.
• Threshold Mechanism: Triggers alarms or events when the status of an application changes.
• Data Collection Engine: Collects and stores application and server statistics on a periodic basis, enabling reporting and trend analysis.
o Data collection for HostResource parameters such as CPU utilization, memory utilization, disk space, etc. can be done for Windows, Linux and Solaris machines.
o Information about RollBack, SGA, Tablespace, etc. from an Oracle server can be collected.
o It supports the collection of number of in octects & out octects (Traffic Utilization).
• Intuitive Runtime Administration GUI: Enables runtime configuration of applications discovery, status polling, data collection, adding new applications for discovery, etc.

AdventNet Web NMS 4.5.0 – Systems & Applications Monitoring Feature Pack
AdventNet Inc. 5
How It Works in Web NMS? The complete process of Application Management comprises application discovery, application status polling and application data collection. Application discovery begins after device discovery. The discovered applications are persisted in the database and continuous monitoring is done for the status and health of the applications
1. After the interfaces are discovered in a network, notifications are sent to the Application Discovery module.
2. Each discovered interface is tested for the presence of applications through predefined tests specified in <Web NMS Home>/conf/application/ApplicationDiscovery.xml file.
3. The discovered applications are continuously monitored for their status. The input for status polling of applications is got from <Web NMS Home>/conf/application/ ApplicationStatusPoll.xml file.
4. The severity information is captured as an Event or an Alert, based on the threshold specified, and updated in the database.
5. Data collection is performed to determine the health of the application being monitored. Data Collection is performed for applications and non-SNMP nodes and the configurations are made in <Web NMS Home>/conf/application/ ApplicationDataCollection.xml file
AdventNet Web NMS 4.5.0 – Systems & Applications Monitoring Feature Pack
AdventNet Inc. 6
Application Monitoring in Web NMS RME Web NMS RME is the distributed edition of Web NMS. The Mediation Server is the distributed component. This edition, facilitates remote monitoring of network resources from a single console. Contact [email protected] for more details on Distributed Mediation Server. In Web NMS RME, the Distributed Mediation Server (DMS) performs the network facing functionality. Multiple DMS can be deployed in the remote sites depending on the scalability needs. Tests are defined to discover applications in the devices that are already discovered by the DMS. The DMS periodically updates the Central Server with the data like discovered InetService objects, application performance data etc. .

AdventNet Web NMS 4.5.0 – Systems & Applications Monitoring Feature Pack
AdventNet Inc. 7
Discovering Applications
• Configuring Application Discovery
• Managing Multiple Instances of Applications
• Performing On-demand Application Discovery
AdventNet Web NMS 4.5.0 – Systems & Applications Monitoring Feature Pack
AdventNet Inc. 8
Configuring Application Discovery
• Discovery Flow Diagram
• Viewing Discovered Services
• Configuring Applications Discovery
• Configuring Discovery Using Application Tests
• Configuring Discovery Using SNMP Properties
• Configuring Discovery Using Object Properties
• Configuring Discovery Using Mail Server Tests
• Adding a New Application at Runtime
• Deleting an Application (Resource Type)
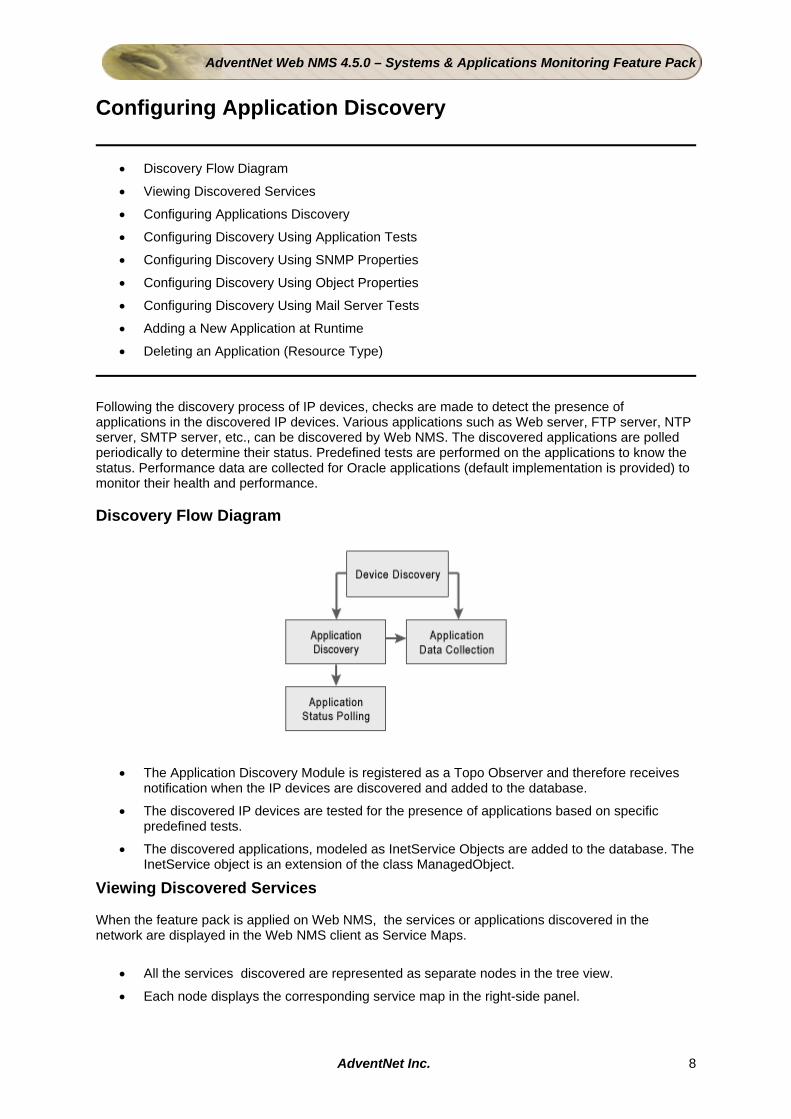
Following the discovery process of IP devices, checks are made to detect the presence of applications in the discovered IP devices. Various applications such as Web server, FTP server, NTP server, SMTP server, etc., can be discovered by Web NMS. The discovered applications are polled periodically to determine their status. Predefined tests are performed on the applications to know the status. Performance data are collected for Oracle applications (default implementation is provided) to monitor their health and performance. Discovery Flow Diagram
• The Application Discovery Module is registered as a Topo Observer and therefore receives notification when the IP devices are discovered and added to the database.
• The discovered IP devices are tested for the presence of applications based on specific predefined tests.
• The discovered applications, modeled as InetService Objects are added to the database. The InetService object is an extension of the class ManagedObject.
Viewing Discovered Services When the feature pack is applied on Web NMS, the services or applications discovered in the network are displayed in the Web NMS client as Service Maps.
• All the services discovered are represented as separate nodes in the tree view.
• Each node displays the corresponding service map in the right-side panel.
AdventNet Web NMS 4.5.0 – Systems & Applications Monitoring Feature Pack
AdventNet Inc. 9
• A symbol representing the service in a particular device, is displayed in the corresponding service map.
• The symbols also show the status of the service.
• The object-specific menu, i.e., Service-Menu appears on the menu bar, when an object symbol is selected from any one of the Services Maps.
• You can also access Service-Menu by doing a right-click operation on a selected object symbol in any of the Services Maps.
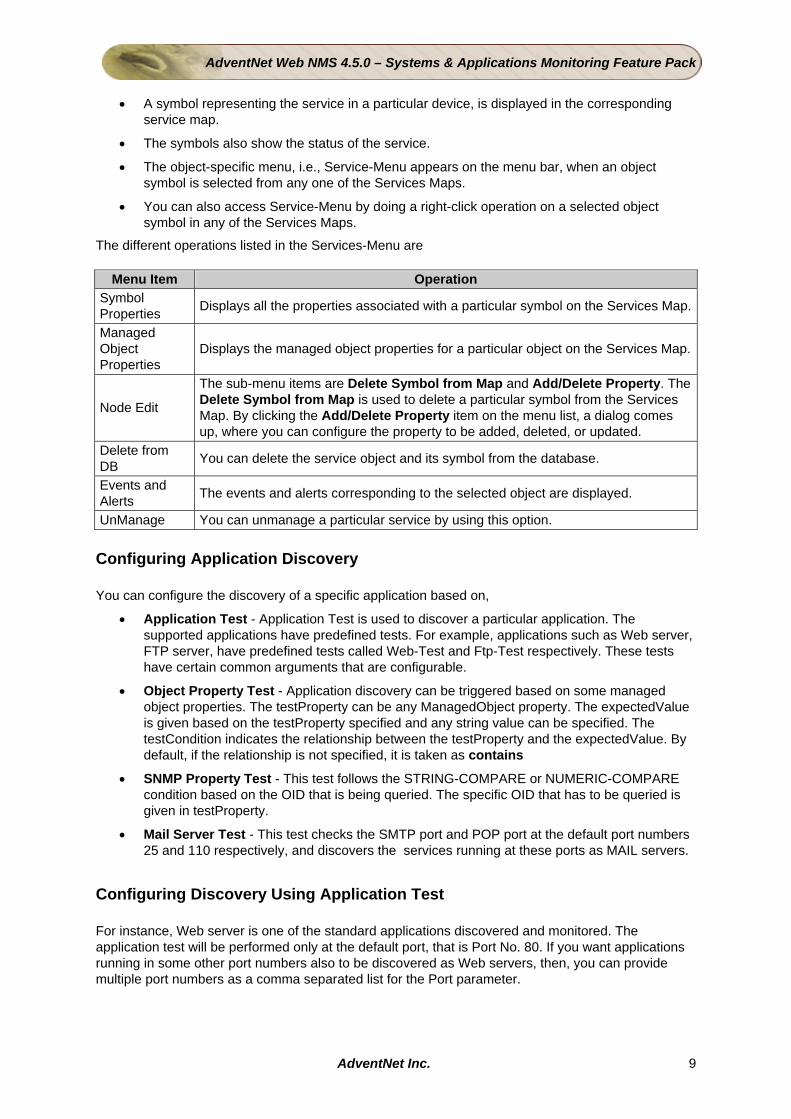
The different operations listed in the Services-Menu are
Menu Item Operation Symbol Properties Displays all the properties associated with a particular symbol on the Services Map.
Managed Object Properties
Displays the managed object properties for a particular object on the Services Map.
Node Edit
The sub-menu items are Delete Symbol from Map and Add/Delete Property. The Delete Symbol from Map is used to delete a particular symbol from the Services Map. By clicking the Add/Delete Property item on the menu list, a dialog comes up, where you can configure the property to be added, deleted, or updated.
Delete from DB You can delete the service object and its symbol from the database.
Events and Alerts The events and alerts corresponding to the selected object are displayed.
UnManage You can unmanage a particular service by using this option. Configuring Application Discovery
You can configure the discovery of a specific application based on,
• Application Test - Application Test is used to discover a particular application. The supported applications have predefined tests. For example, applications such as Web server, FTP server, have predefined tests called Web-Test and Ftp-Test respectively. These tests have certain common arguments that are configurable.
• Object Property Test - Application discovery can be triggered based on some managed object properties. The testProperty can be any ManagedObject property. The expectedValue is given based on the testProperty specified and any string value can be specified. The testCondition indicates the relationship between the testProperty and the expectedValue. By default, if the relationship is not specified, it is taken as contains
• SNMP Property Test - This test follows the STRING-COMPARE or NUMERIC-COMPARE condition based on the OID that is being queried. The specific OID that has to be queried is given in testProperty.
• Mail Server Test - This test checks the SMTP port and POP port at the default port numbers 25 and 110 respectively, and discovers the services running at these ports as MAIL servers.
Configuring Discovery Using Application Test For instance, Web server is one of the standard applications discovered and monitored. The application test will be performed only at the default port, that is Port No. 80. If you want applications running in some other port numbers also to be discovered as Web servers, then, you can provide multiple port numbers as a comma separated list for the Port parameter.

AdventNet Web NMS 4.5.0 – Systems & Applications Monitoring Feature Pack
AdventNet Inc. 10
Example:
1. Go to Runtime UI (Tools --> Runtime Administration --> Application -->Application Discovery).
2. From the list of displayed application names, select Web Server. The corresponding test type is displayed at the right as Web-Test. The corresponding test properties and their values are displayed in the column below. The displayed properties are className, timeout, Port.
3. Click Modify button in the right panel. A wizard pops up displaying the test details.
4. Click Next. The test properties are displayed. For the Port Number field, enter additional port numbers, for example 8080 and 9090 as a comma separated list as shown in the screenshot below and click Finish to exit the wizard.
5. Click the Advanced Properties button in the RTA UI. Advanced Properties dialog pops up.
6. In the Advanced Properties dialog, select Discover All Instances check box and click OK.
7. Click Apply.
Result: Any applications discovered in the specified ports will be discovered as Web Servers. Similarly, you can change the className and timeout value. Configuring Discovery Using SNMP Properties
1. Go to Runtime UI (Tools --> Runtime Administration --> Application -->Application Discovery)
2. From the list of displayed application names, select any application
3. Click Add button. A wizard pops up.
4. Click Next in this wizard. The Options screen is displayed. Select the Test radio button and click Next.
5. A list of tests is displayed. Select the radio button corresponding to SNMP Property Test and click Next. SNMP test properties are displayed in this screen.
AdventNet Web NMS 4.5.0 – Systems & Applications Monitoring Feature Pack
AdventNet Inc. 11
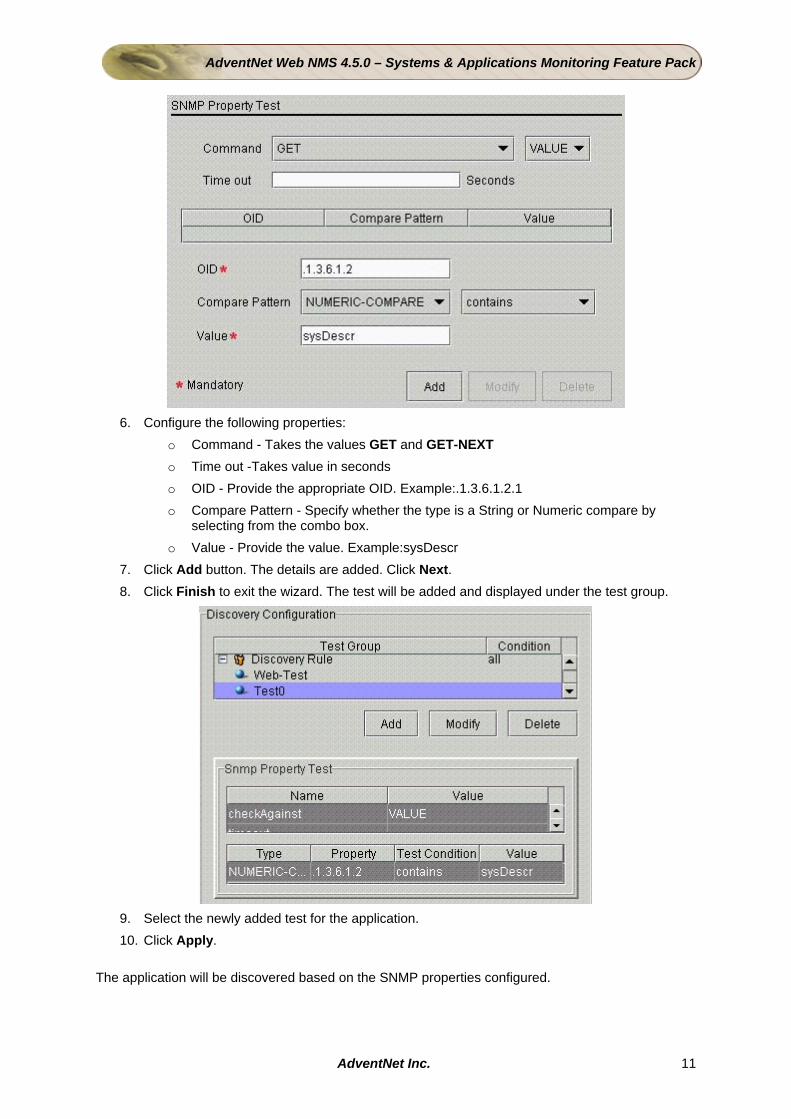
6. Configure the following properties:
o Command - Takes the values GET and GET-NEXT o Time out -Takes value in seconds o OID - Provide the appropriate OID. Example:.1.3.6.1.2.1 o Compare Pattern - Specify whether the type is a String or Numeric compare by
selecting from the combo box. o Value - Provide the value. Example:sysDescr
7. Click Add button. The details are added. Click Next. 8. Click Finish to exit the wizard. The test will be added and displayed under the test group.
9. Select the newly added test for the application. 10. Click Apply.
The application will be discovered based on the SNMP properties configured.

AdventNet Web NMS 4.5.0 – Systems & Applications Monitoring Feature Pack
AdventNet Inc. 12
Configuring Discovery Using Object Properties
Note:
• To configure discovery using object properties, specify the properties of the interface object and not that of the node.
• Changes made to the existing applications will take effect only for the objects discovered thereafter.
1. Go to Runtime UI (Tools --> Runtime Administration --> Application -->Application Discovery) 2. From the list of displayed application names, select any application 3. Click the Add button. A wizard pops up. 4. Click Next in this wizard. The Options screen is displayed. Select the Test radio button and
click Next. 5. A list of tests is displayed. Select the radio button corresponding to Object Property Test and
click Next. The test properties are displayed in this screen.
6. Configure the following parameters:
1. Property: Specify the property using which you want to discover. Example:IsInterface
2. Test Condition: Select the relevant test condition from the corresponding combo box. Example:equals
3. Value: Provide the appropriate value for the property. Example:true 7. Click Add. Similarly, you can add few more properties if required. 8. Click Next. Then, click Finish to exit the wizard. 9. Select the newly added test for the application. 10. Click Apply.
The configured discovery test is applied on the objects with the specified properties. Applications are discovered if the specified conditions are satisfied. Configuring Discovery of Mail-Servers
1. Go to Runtime UI (Tools --> Runtime Administration --> Application -->Application Discovery) 2. From the list of displayed application names, select any application 3. Click Add Test button. A wizard pops up.
AdventNet Web NMS 4.5.0 – Systems & Applications Monitoring Feature Pack
AdventNet Inc. 13
4. Click Next in this wizard. The Options screen is displayed. Select Test radio button and click Next.
5. A list of tests are displayed. Select the radio button corresponding to Mail Server Test and click Next. The test properties are displayed in this screen.
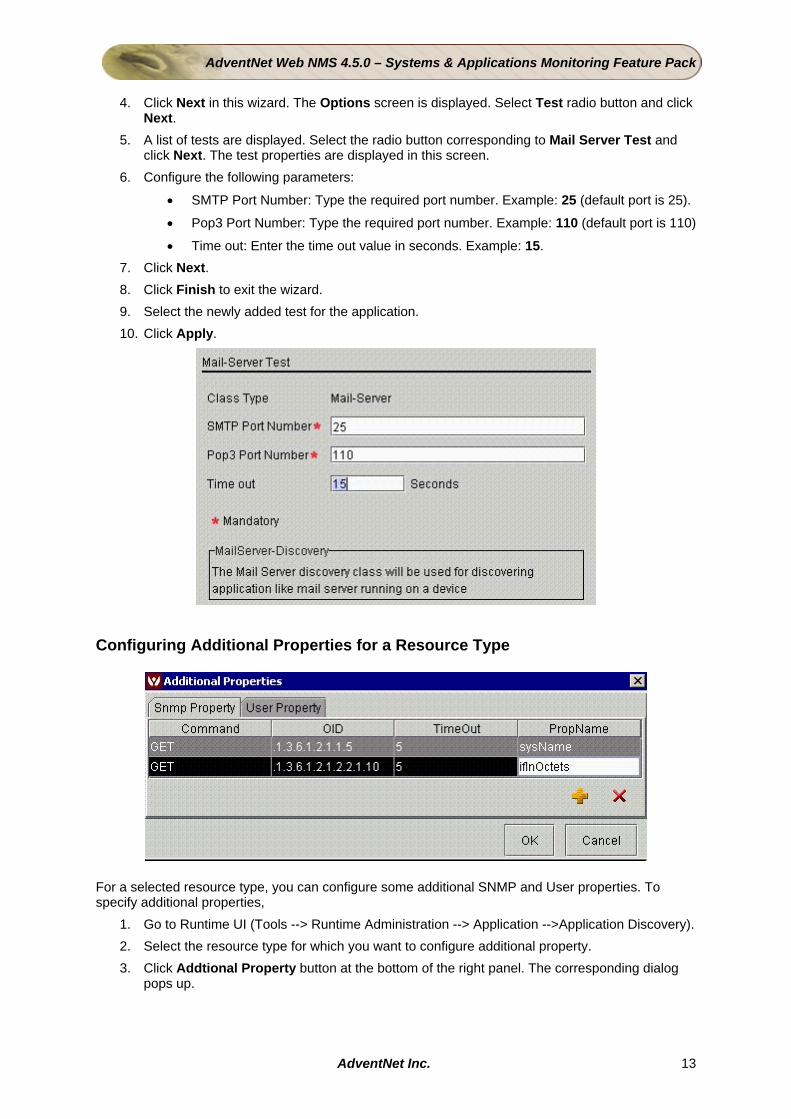
6. Configure the following parameters:
• SMTP Port Number: Type the required port number. Example: 25 (default port is 25).
• Pop3 Port Number: Type the required port number. Example: 110 (default port is 110)
• Time out: Enter the time out value in seconds. Example: 15. 7. Click Next. 8. Click Finish to exit the wizard. 9. Select the newly added test for the application. 10. Click Apply.
Configuring Additional Properties for a Resource Type
For a selected resource type, you can configure some additional SNMP and User properties. To specify additional properties,
1. Go to Runtime UI (Tools --> Runtime Administration --> Application -->Application Discovery). 2. Select the resource type for which you want to configure additional property. 3. Click Addtional Property button at the bottom of the right panel. The corresponding dialog
pops up.

AdventNet Web NMS 4.5.0 – Systems & Applications Monitoring Feature Pack
AdventNet Inc. 14
4. Select Snmp Property tab to configure SNMP properties and select User Property tab to configure User properties.
5. Click the button in this dialog to add the required properties. Example: Select Snmp Property tab. Provide the following values:
o Command: Select the GET command from the combo-box o OID: Enter the OID value as .1.3.6.1.2.1.1.5 o TimeOut: Enter the timeout value as 5 seconds o PropName: Enter the SNMP property name as sysName
You can add more properties as shown in the above screen shot. Applications matching these properties are discovered. Adding a New Application at Runtime You can also add new applications at runtime. These applications are then discovered by Web NMS and are monitored. This is achieved easily through the Runtime Administration UI. Let us consider an example of discovering the Web NMS servers running in some devices in a network. To add the Web NMS application and define discovery tests,
1. Go to Runtime UI (Tools --> Runtime Administration --> Application -->Application Discovery)
2. Click the at the bottom of the Application Names list in the UI 3. A new node called NewName1 gets added to the tree. See screen shot below for reference 4. Enter the name of the application here, say WebNMS-Server, as shown in the screen shot
below and press Enter.
5. An entry in the name 'Discovery Rule' is displayed in the right. You can add the required test
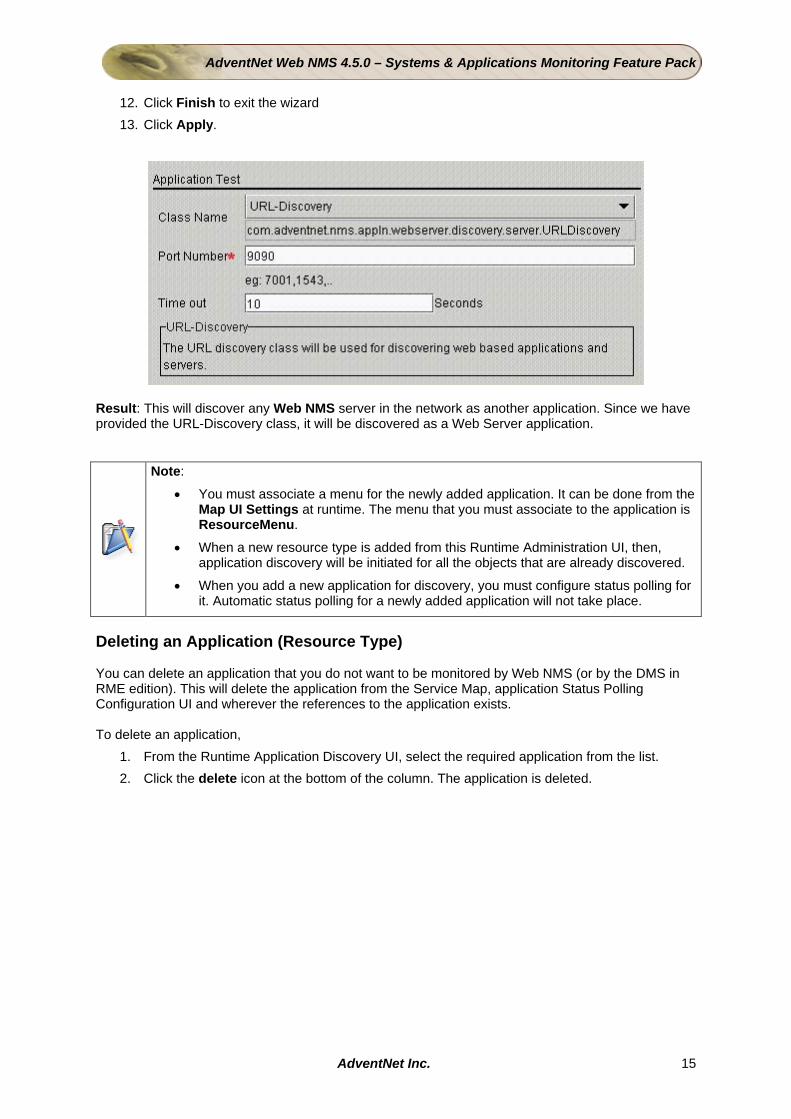
for the new application. Click Add button. A wizard pops up. 6. Click Next in the 'Introduction' and 'Options' screen in the wizard. 7. Select the required test, say Application Test and click Next. 8. In the Application Test properties screen, select the Class Name as URL-Discovery. 9. Provide the port number as 9090 (default port). 10. Provide the timeout value as 10 seconds. 11. Click Next.
AdventNet Web NMS 4.5.0 – Systems & Applications Monitoring Feature Pack
AdventNet Inc. 15
12. Click Finish to exit the wizard 13. Click Apply.
Result: This will discover any Web NMS server in the network as another application. Since we have provided the URL-Discovery class, it will be discovered as a Web Server application.
Note:
• You must associate a menu for the newly added application. It can be done from the Map UI Settings at runtime. The menu that you must associate to the application is ResourceMenu.
• When a new resource type is added from this Runtime Administration UI, then, application discovery will be initiated for all the objects that are already discovered.
• When you add a new application for discovery, you must configure status polling for it. Automatic status polling for a newly added application will not take place.
Deleting an Application (Resource Type) You can delete an application that you do not want to be monitored by Web NMS (or by the DMS in RME edition). This will delete the application from the Service Map, application Status Polling Configuration UI and wherever the references to the application exists. To delete an application,
1. From the Runtime Application Discovery UI, select the required application from the list. 2. Click the delete icon at the bottom of the column. The application is deleted.

AdventNet Web NMS 4.5.0 – Systems & Applications Monitoring Feature Pack
AdventNet Inc. 16
Managing Multiple Instances of an Application It is possible that more than one instance of an application is running in the same machine. All the instances must be discovered and monitored. Web NMS allows multiple instances discovery. You can manage and monitor multiple instances of an application as explained below: Configuring Multiple Instances Discovery
To discover multiple instances of an application
1. Go to Tools-->Runtime Administration-->Application-->Application Discovery. 2. The applications are listed on the left. Select the application whose instances you want to
discover. 3. The test type is displayed on the right. Click Modify. 4. In the wizard that pops up, click Next. 5. The test properties are displayed. In the Port Number field, enter the port numbers as a
comma separated list. 6. Click Finish to exit the wizard. 7. Now, click the Advanced Properties button. The Advanced Properties dialog pops up. 8. Select the check box that corresponds to Discover All Instances. 9. Click OK. 10. Click Apply.
The instances running in the specified ports are discovered.

AdventNet Web NMS 4.5.0 – Systems & Applications Monitoring Feature Pack
AdventNet Inc. 17
Performing On-demand Application Discovery You can discover a particular application in a device on demand. That is, an application may not be up and running in a particular device during discovery. If the application is started after some time, it will not be discovered unless configured. To discover such applications in a device, a device specific menu is provided. See the example given below.
To discover a particular application in a device,
1. From the Client tree in the UI, select the node Network Database --> Nodes. The list of nodes in the network(s) will be displayed.
2. From this list, select the node (device) in which you want to discover a particular application that is not discovered already. For instance, let us assume that you want to discover FTP service in a Windows device.
3. Right-click the selected node and click the menu Node (or SNMP Node) --> Discover Application.
4. The corresponding UI pops up. The list of supported applications that are not discovered in that device, is displayed. From this list, select the required application. Example: FTP Server
5. If there are multiple interfaces, select the required interface from the corresponding combo box.
6. Click OK. The selected application will be discovered if it is running.

AdventNet Web NMS 4.5.0 – Systems & Applications Monitoring Feature Pack
AdventNet Inc. 18
Using Thresholds
• Configuring Thresholds
• Applying Thresholds on Applications
AdventNet Web NMS 4.5.0 – Systems & Applications Monitoring Feature Pack
AdventNet Inc. 19
Configuring Thresholds
• Overview
• Threshold Types
• Modifying Thresholds
• Adding New Thresholds
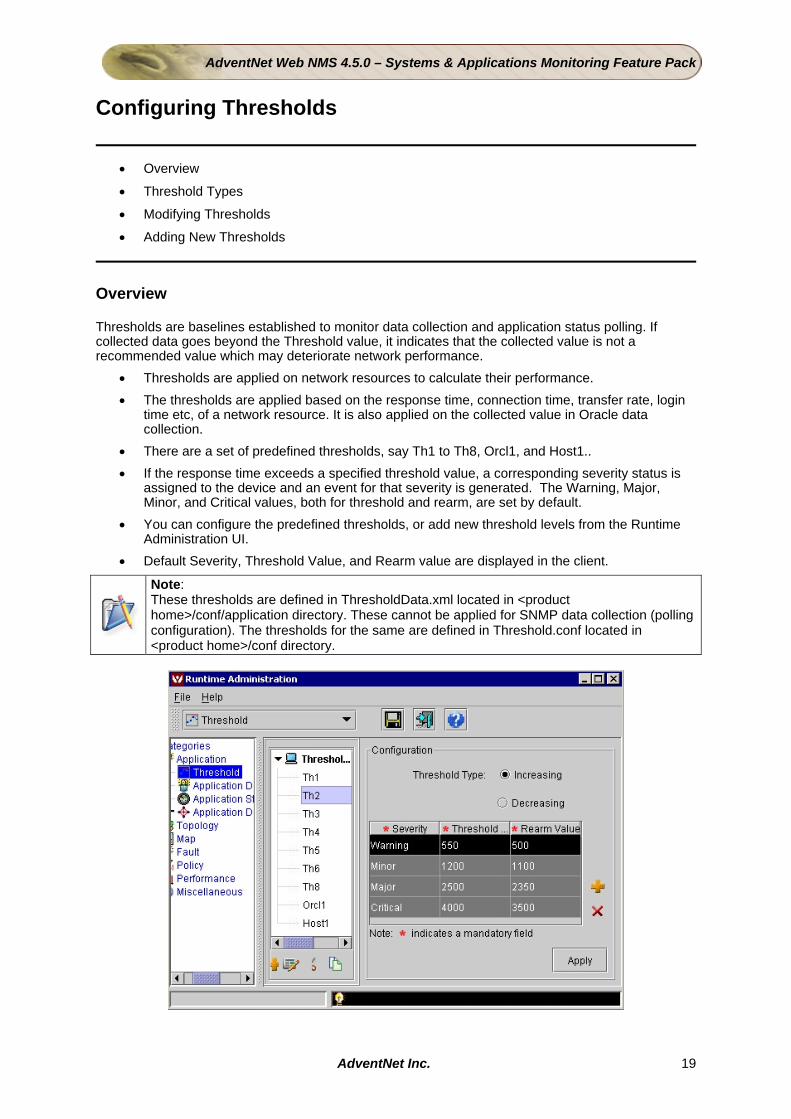
Overview Thresholds are baselines established to monitor data collection and application status polling. If collected data goes beyond the Threshold value, it indicates that the collected value is not a recommended value which may deteriorate network performance.
• Thresholds are applied on network resources to calculate their performance. • The thresholds are applied based on the response time, connection time, transfer rate, login
time etc, of a network resource. It is also applied on the collected value in Oracle data collection.
• There are a set of predefined thresholds, say Th1 to Th8, Orcl1, and Host1.. • If the response time exceeds a specified threshold value, a corresponding severity status is
assigned to the device and an event for that severity is generated. The Warning, Major, Minor, and Critical values, both for threshold and rearm, are set by default.
• You can configure the predefined thresholds, or add new threshold levels from the Runtime Administration UI.
• Default Severity, Threshold Value, and Rearm value are displayed in the client.
Note: These thresholds are defined in ThresholdData.xml located in <product home>/conf/application directory. These cannot be applied for SNMP data collection (polling configuration). The thresholds for the same are defined in Threshold.conf located in <product home>/conf directory.

AdventNet Web NMS 4.5.0 – Systems & Applications Monitoring Feature Pack
AdventNet Inc. 20
Threshold Types There are two threshold types, namely
• Increasing Threshold: An example for Increasing Threshold type can be response time test. That is, Web NMS checks for the response time of a particular resource. If the resource takes more time of respond to the Web NMS server, the test is considered to have failed. Based on the Threshold and Rearm values set for Warning to Critical, the test result will be assigned a status. Example: For the Web NMS server to assign a warning status for the result of a test, the response time must be more than the Warning threshold value 300 seconds (but less than the Critical threshold value 600 seconds, because if it crosses this value, status will be assigned critical).
• Decreasing Threshold: An example of Decreasing Threshold type can be bandwidth test. The Web NMS server conducts a test for bandwidth for transmission. If the bandwidth available is found to be less than a particular value, then the test is considered failed. Based on the Threshold and Rearm values set for Warning to Critical, the test result will be assigned a status. In this case, the threshold values for Warning status will be the highest and for Critical it will be the least of all.
Modifying Thresholds To modify the predefined thresholds
1. From the client menu bar, select Tools-->Runtime Administration-->Application -->Threshold>. The left panel displays the different threshold levels.
2. Select any threshold node from the list of thresholds on the left panel. For instance, Th1 node. 3. In the right panel, select the Threshold type as Increasing. 4. From the Severity column, select any one severity and change the default threshold and
rearm value. 5. For instance, select Warning severity, enter the threshold value as 30 and rearm value as 20 6. Click Apply.
Result
• The new threshold and rearm value are applied for Warning severity. That is, a warning event is generated if the response time crosses 30 seconds and the rearm value for the same will be 20 seconds.
• You will see a Warning severity being generated for a resource if the response time crosses 30 seconds. You can see a message to this effect in the client in the message field.
Adding New Thresholds To add or define new thresholds
1. From the menu bar, select Tools-->Runtime Administration-->Application -->Threshold. The left panel displays the different threshold levels.
2. Click the button at the bottom of the list. 3. A new threshold is added to the list as NewName1. 4. Rename the added threshold by double-clicking the particular node. It becomes editable.
Rename and press Enter.
AdventNet Web NMS 4.5.0 – Systems & Applications Monitoring Feature Pack
AdventNet Inc. 21
5. By default, the new threshold node will now be highlighted and the corresponding configuration parameters will be displayed on the right side.
6. Select the threshold type as either increasing or decreasing depending on the threshold you want to define.
7. Click the button on the right. 8. Select the required severity from the combo box and configure the threshold and rearm value
(double-click the fields to edit the default values). 9. After you add all the required severity levels with the corresponding values, click Apply.
Result The new threshold will be applied on the response time of a network resource.
Note: Rearm Value: The rearm value is used to prevent assigning of same status to a resource every time it is tested. If a resource is assigned Warning state as it has crossed the Warning threshold value, it will be assigned a Clear state only if it goes below the Warning rearm value in the subsequent tests.

AdventNet Web NMS 4.5.0 – Systems & Applications Monitoring Feature Pack
AdventNet Inc. 22
Applying Thresholds on System Resources
• Applying Thresholds During Application Status Polling
• Applying Thresholds During Oracle Data Collection
• Applying Thresholds During Host Resources Data Collection
There is a need to manage and monitor various applications based on priority. That is, some mission-critical applications may require constant check. The availability of the service may be crucial. According to the priority of the services required, you can define thresholds. For instance, you can define a threshold on applying which an event is generated after the specific response time, and that can be 300 seconds or even 30000 seconds. Thresholds can be applied during status polling and data collection of the applications. Applying Thresholds During Application Status Polling You can apply thresholds on the discovered applications that are scheduled for status polling. Events will be generated during status polling of the applications, based on the defined thresholds.
1. From the menu bar, select Tools --> Runtime Administration. The Runtime UI opens. 2. Select Application -->Application Status Polling. The applications scheduled for status polling
are listed in the left column. 3. Select any application for which you want to associate a threshold. Example: MYSQL-DB-
server. The status polling test properties are displayed on the right. 4. Click the Advanced button to configure the parameter on which you want to apply threshold. A
dialog pops up. Select the required parameter from ApplyThresholdOver combo-box. For this application, the parameter available is responseTime. (For database applications, you can even configure the required driver name and the url).
5. From the properties list, select the Value field adjacent to thresholdName property. 6. Select the required threshold from the combo box. Example: Th8 7. Select the check-box corresponding to Apply changes to discovered nodes option. This will
apply the changed threshold to the discovered applications during subsequent status polls. 8. Click Apply.
AdventNet Web NMS 4.5.0 – Systems & Applications Monitoring Feature Pack
AdventNet Inc. 23
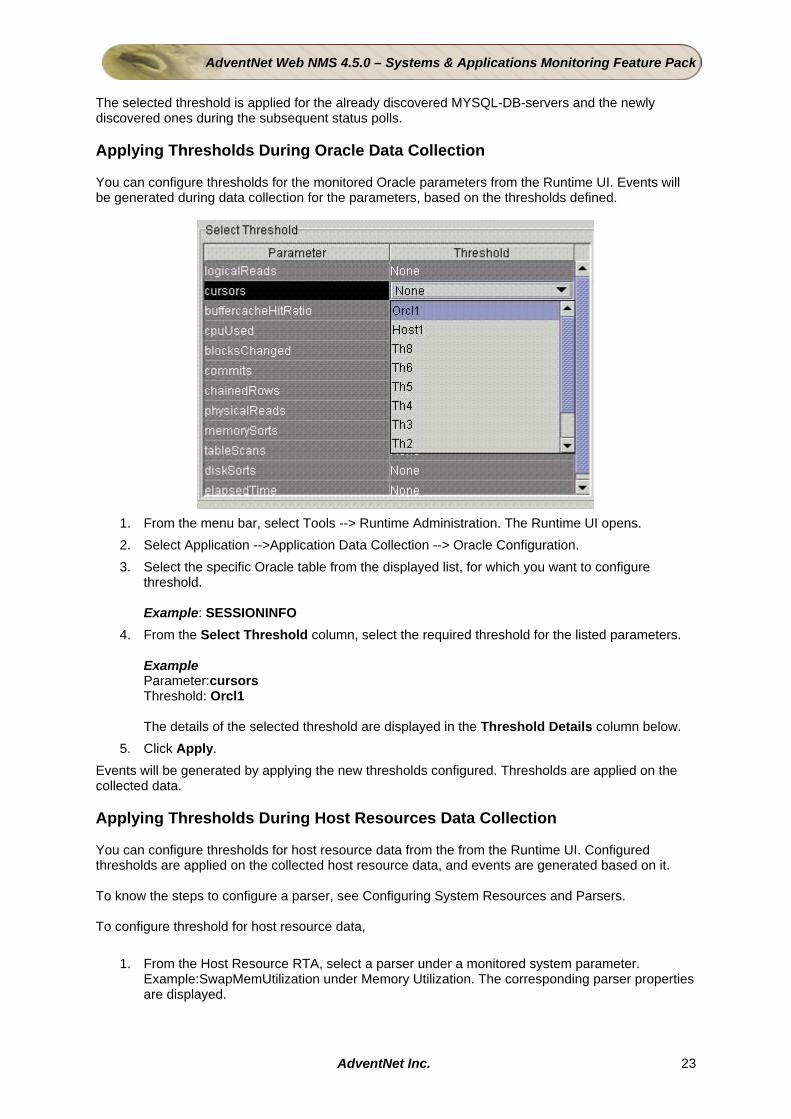
The selected threshold is applied for the already discovered MYSQL-DB-servers and the newly discovered ones during the subsequent status polls. Applying Thresholds During Oracle Data Collection You can configure thresholds for the monitored Oracle parameters from the Runtime UI. Events will be generated during data collection for the parameters, based on the thresholds defined.
1. From the menu bar, select Tools --> Runtime Administration. The Runtime UI opens. 2. Select Application -->Application Data Collection --> Oracle Configuration. 3. Select the specific Oracle table from the displayed list, for which you want to configure
threshold. Example: SESSIONINFO
4. From the Select Threshold column, select the required threshold for the listed parameters. Example Parameter:cursors Threshold: Orcl1 The details of the selected threshold are displayed in the Threshold Details column below.
5. Click Apply. Events will be generated by applying the new thresholds configured. Thresholds are applied on the collected data. Applying Thresholds During Host Resources Data Collection You can configure thresholds for host resource data from the from the Runtime UI. Configured thresholds are applied on the collected host resource data, and events are generated based on it. To know the steps to configure a parser, see Configuring System Resources and Parsers. To configure threshold for host resource data,
1. From the Host Resource RTA, select a parser under a monitored system parameter. Example:SwapMemUtilization under Memory Utilization. The corresponding parser properties are displayed.
AdventNet Web NMS 4.5.0 – Systems & Applications Monitoring Feature Pack
AdventNet Inc. 24
2. Click Modify. 3. Click Next >Next in the subsequent configuration screens that pop up. 4. In the Event Generation column in the configuration screen, select Threshold from Compare
With combo-box. 5. From the Select Threshold combo-box, select the required threshold. Example Host1 6. Click Finish. 7. Click Apply.
The new threshold will be applied on the host resource data collected for the specific parameter (in this example, for SwapMemUtilization in Memory Utilization). Events are generated based on the threshold applied.

AdventNet Web NMS 4.5.0 – Systems & Applications Monitoring Feature Pack
AdventNet Inc. 25
Polling Applications for Status
• Polling Applications to Determine Their Status
• Understanding and Configuring Test Properties

AdventNet Web NMS 4.5.0 – Systems & Applications Monitoring Feature Pack
AdventNet Inc. 26
Configuring Application Status Polling
• Overview
• Configuring Predefined Tests for Application Status Polling
• Adding a New Application and Configuring a Test for It
Overview The applications that have been discovered are continuously monitored for their status and optimal functioning through the Status Polling Framework. The discovered applications are scheduled for status polling. Predefined tests are available to perform status polling of these applications. You can configure the existing properties of a particular test for an application. You can add, modify, delete, cut, and copy an application using the right-click menu available. Configuring Predefined Tests for Application Status Polling As mentioned earlier, predefined tests are available for the support applications. The test properties have default values. You can configure the property values to meet your specific requirement. For instance, let us assume you want to
• poll the status of a Web-server once in 30 minutes, instead of polling it every 5 minutes.
• configure a different user name and password since the web page requires authentication
• traverse three links (depth) from that web page
So, you need to change the default values for the corresponding properties. The steps are,
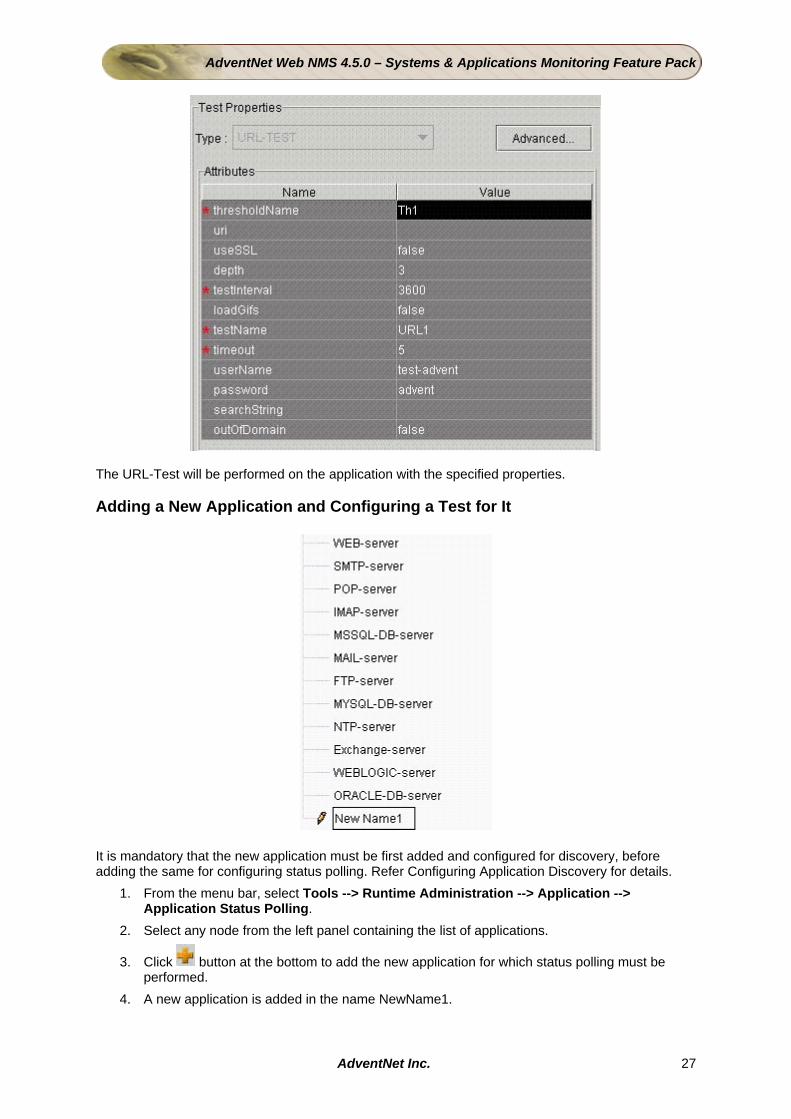
1. Select Web-server application from the list. The predefined test for this application is URL-Test. The test properties are displayed in the 'attributes' column.
2. Provide the value for depth field as 3.
3. Provide the value for the testInterval field as 3600
4. Provide the required user name in the relevant field. Example:test-advent
5. Provide the password for the user. Example:advent
6. Select the check-box corresponding to Apply changes to existing nodes (this option enables you the apply the changes made in the test to the nodes that are already discovered. If this option is not selected, the changes will be applied only to the applications discovered thereafter).
7. Click Apply.
AdventNet Web NMS 4.5.0 – Systems & Applications Monitoring Feature Pack
AdventNet Inc. 27
The URL-Test will be performed on the application with the specified properties. Adding a New Application and Configuring a Test for It
It is mandatory that the new application must be first added and configured for discovery, before adding the same for configuring status polling. Refer Configuring Application Discovery for details.
1. From the menu bar, select Tools --> Runtime Administration --> Application --> Application Status Polling.
2. Select any node from the left panel containing the list of applications.
3. Click button at the bottom to add the new application for which status polling must be performed.
4. A new application is added in the name NewName1.

AdventNet Web NMS 4.5.0 – Systems & Applications Monitoring Feature Pack
AdventNet Inc. 28
5. Double-click the new application node and enter the required application name. 6. From the right panel, select the type of test to be performed from the corresponding combo-
box. The attributes of the selected test type are displayed in a table below. Configure the required attributes.
7. To configure some other user-defined test class name, click the Advanced button. 8. In the Advanced Properties dialog, enter the Test Class Name in the corresponding field. 9. Select the criteria on which threshold is to be applied (response time, TransferRate etc) and
click OK. 10. After configuring the other test properties, click Apply for the changes to take effect.

AdventNet Web NMS 4.5.0 – Systems & Applications Monitoring Feature Pack
AdventNet Inc. 29
Understanding and Configuring Test Properties
• Predefined Test Names and Their Descriptions
• Configurable Attributes of Predefined Tests
Predefined Test Names and Their Descriptions Test Name Description
URL-Test
The URL Test is used to determine the status of the Web server. Monitoring of the Web server can include checking for
• availability of service
• loading time of the page
• efficient functioning of the links
• efficiency of navigation, etc
The URL Test tests the Http connectivity, data transfer rate, and time taken to connect to a URL. Test Class name: com.adventnet.nms.spp.application.statuspoll.URLTest
DNS-Test
For scheduling a DNS server for status polling, ensure the application has been scheduled for discovery in the ApplicationDiscovery.xml file and uncomment the entires for DNS server in the ApplicationStatusPoll.xml file. The DNS test is performed for status polling of the DNS server. For a given domain name server and the lookUpAddress, the response time is calculated. Tests are done to check if the expected value is returned for a given domain name. Test Class name: com.adventnet.nms.spp.application.statuspoll.DNSTest
SMTP-Test
Different mail servers, such as SMTP server, POP server, IMAP server and MAIL server can be continuously monitored and their status determined using this test. In SMTP test, checks are made to ascertain if the target given is an SMTP server and the performance of the SMTP server is calculated in terms of its response time. Test Class name: com.adventnet.nms.spp.application.statuspoll.SmtpTest
POP-Test
The test used for status polling of POP3 server is POP3Test. In this test, it is checked if the target is a POP3 server and its performance is calculated in terms of the response time. Test Class name: com.adventnet.nms.spp.application.statuspoll.Pop3Test
Imap-Test
USER TEST is used for testing the IMAP server. In USER TEST, you can specify the Test Case based on which the status polling has to be done. For monitoring the IMAP server, two test cases are configured. Test Class name: com.adventnet.nms.spp.application.statuspoll.ImapTest
MAIL-TEST
The test used for monitoring this application is the MailTest. This test is used to check if the server connected is a mail server and its performance is calculated in terms of the response time. Test Class name: com.adventnet.nms.spp.application.statuspoll.MailTest
AdventNet Web NMS 4.5.0 – Systems & Applications Monitoring Feature Pack
AdventNet Inc. 30
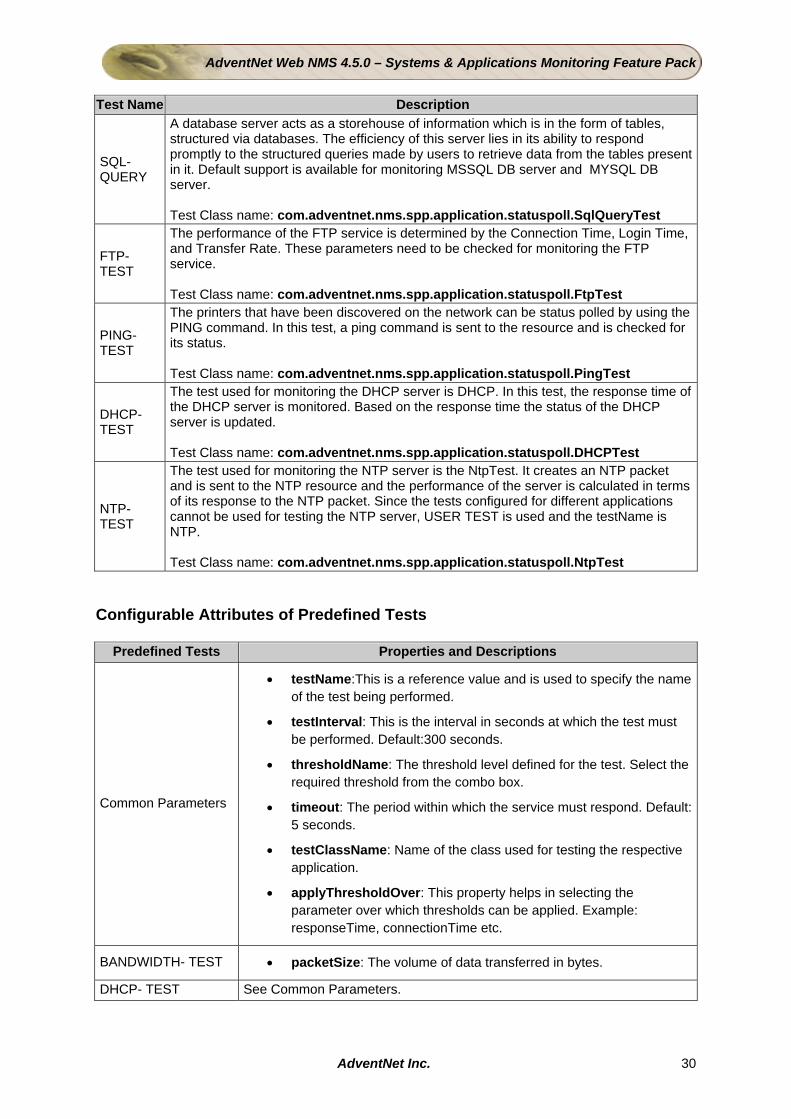
Test Name Description
SQL-QUERY
A database server acts as a storehouse of information which is in the form of tables, structured via databases. The efficiency of this server lies in its ability to respond promptly to the structured queries made by users to retrieve data from the tables present in it. Default support is available for monitoring MSSQL DB server and MYSQL DB server. Test Class name: com.adventnet.nms.spp.application.statuspoll.SqlQueryTest
FTP-TEST
The performance of the FTP service is determined by the Connection Time, Login Time, and Transfer Rate. These parameters need to be checked for monitoring the FTP service. Test Class name: com.adventnet.nms.spp.application.statuspoll.FtpTest
PING-TEST
The printers that have been discovered on the network can be status polled by using the PING command. In this test, a ping command is sent to the resource and is checked for its status. Test Class name: com.adventnet.nms.spp.application.statuspoll.PingTest
DHCP-TEST
The test used for monitoring the DHCP server is DHCP. In this test, the response time of the DHCP server is monitored. Based on the response time the status of the DHCP server is updated. Test Class name: com.adventnet.nms.spp.application.statuspoll.DHCPTest
NTP-TEST
The test used for monitoring the NTP server is the NtpTest. It creates an NTP packet and is sent to the NTP resource and the performance of the server is calculated in terms of its response to the NTP packet. Since the tests configured for different applications cannot be used for testing the NTP server, USER TEST is used and the testName is NTP. Test Class name: com.adventnet.nms.spp.application.statuspoll.NtpTest
Configurable Attributes of Predefined Tests
Predefined Tests Properties and Descriptions
Common Parameters
• testName:This is a reference value and is used to specify the name of the test being performed.
• testInterval: This is the interval in seconds at which the test must be performed. Default:300 seconds.
• thresholdName: The threshold level defined for the test. Select the required threshold from the combo box.
• timeout: The period within which the service must respond. Default: 5 seconds.
• testClassName: Name of the class used for testing the respective application.
• applyThresholdOver: This property helps in selecting the parameter over which thresholds can be applied. Example: responseTime, connectionTime etc.
BANDWIDTH- TEST • packetSize: The volume of data transferred in bytes.
DHCP- TEST See Common Parameters.

AdventNet Web NMS 4.5.0 – Systems & Applications Monitoring Feature Pack
AdventNet Inc. 31
Predefined Tests Properties and Descriptions
FTP-TEST
• password: The corresponding password for the specified user name is given here. By default it is guest.
• command: The command that has to be executed after the connection has been established is specified here.
• userName: This is the user information and the user name that is used to log into the mail server is specified here. By default it is guest.
• binaryMode: Specifies the mode of transfer of files. Set the value as true for binary mode file transfer. Set the value as false for ASCII mode transfer.
• srcFileName: Name of file that needs to be transferred to another device from the sending device.
• destFileName: Name in which the transferred file needs to be stored in the receiving device.
MAIL_ TEST
• password: The corresponding password for the specified user name is given here. By default it is guest.
• userName: This is the user information and the user name that is used to log into the mail server is specified here. By default it is guest.
• message: Message to be e-mailed to test the specified application. Default value –Thanks
PING- TEST See Common Parameters.
POP- TEST
• password: The corresponding password for the specified user name is given here. By default it is guest.
• userName:This is the user information and the user name that is used to log into the mail server is specified here. By default it is guest.
SNMP- EXPRESSION
• command: The command that has to be executed.
• snmpRetries: Refers to the number of times the snmp query must be executed.
• snmpCommunity: Refers to the SNMP Community
SNMP- QUERY
• command The command that has to be executed
• snmpRetries: Refers to the number of times the snmp query must be made
• snmpCommunity: Refers to the SNMP Community
• oidList: List of OIDs to be queried
SMTP- TEST
• fromAddress: E-mail address of the source device from which message is sent.
• toAddress: Email Address of the destination device to which the message must be sent.
• message: E-mail message sent to test the specified application. Default value - Thanks.
AdventNet Web NMS 4.5.0 – Systems & Applications Monitoring Feature Pack
AdventNet Inc. 32
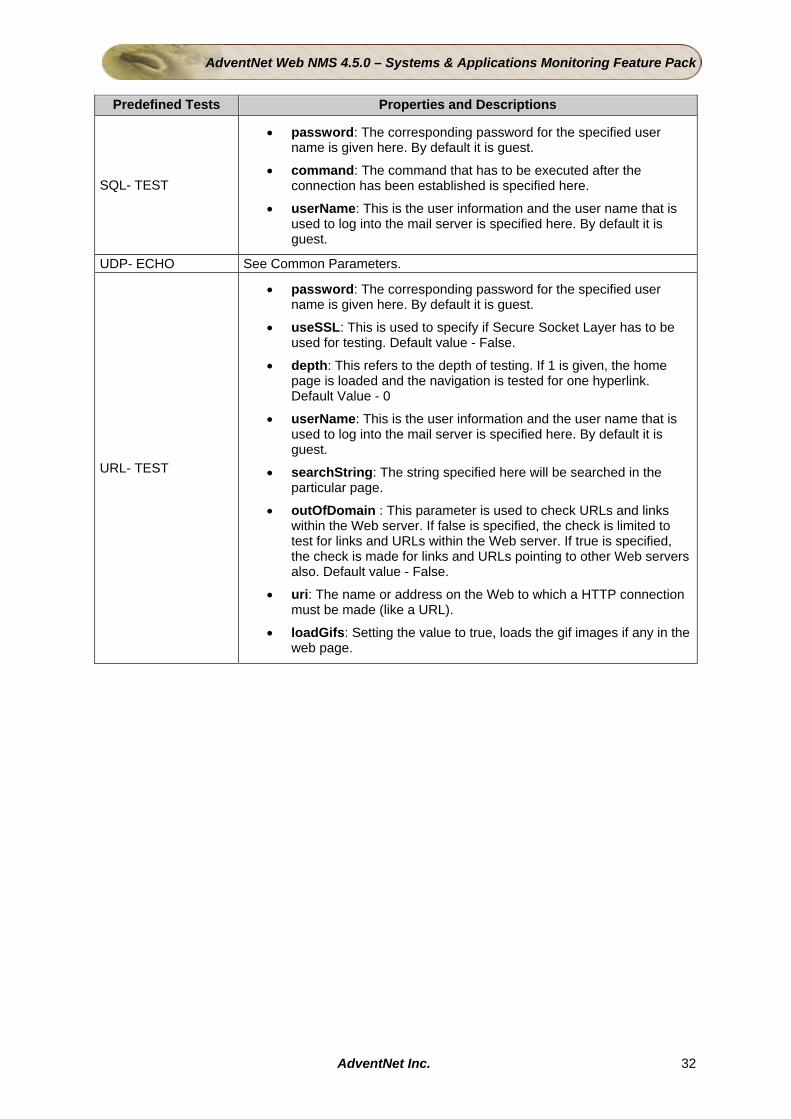
Predefined Tests Properties and Descriptions
SQL- TEST
• password: The corresponding password for the specified user name is given here. By default it is guest.
• command: The command that has to be executed after the connection has been established is specified here.
• userName: This is the user information and the user name that is used to log into the mail server is specified here. By default it is guest.
UDP- ECHO See Common Parameters.
URL- TEST
• password: The corresponding password for the specified user name is given here. By default it is guest.
• useSSL: This is used to specify if Secure Socket Layer has to be used for testing. Default value - False.
• depth: This refers to the depth of testing. If 1 is given, the home page is loaded and the navigation is tested for one hyperlink. Default Value - 0
• userName: This is the user information and the user name that is used to log into the mail server is specified here. By default it is guest.
• searchString: The string specified here will be searched in the particular page.
• outOfDomain : This parameter is used to check URLs and links within the Web server. If false is specified, the check is limited to test for links and URLs within the Web server. If true is specified, the check is made for links and URLs pointing to other Web servers also. Default value - False.
• uri: The name or address on the Web to which a HTTP connection must be made (like a URL).
• loadGifs: Setting the value to true, loads the gif images if any in the web page.
AdventNet Web NMS 4.5.0 – Systems & Applications Monitoring Feature Pack
AdventNet Inc. 33
Monitoring Oracle Applications
• Need for Oracle Application Monitoring
• Collecting Data for Oracle Applications
AdventNet Web NMS 4.5.0 – Systems & Applications Monitoring Feature Pack
AdventNet Inc. 34
Need for Oracle Applications Monitoring
• Overview
• Scope
Overview Oracle Performance monitoring makes DBA/System Administrator's job easier. The databases are getting much larger and very complex that require tuning which necessitates a readily available user-built interface tool to monitor the administration tasks. The DBA must have regular database information to manage mission-critical databases and identify technical problems without any bottleneck. The monitoring tools give us an insight into the flow of processes within an Oracle instance which helps us identify database activity at any given time. It identifies bottlenecks with extensive drill-down capabilities in the form of alerts and events. The drill-downs give us detailed information about the specific problems. The database must be monitored in a fashion that takes its specific structure and usage into account. Scope The scope of monitoring involves defining
• A set of metrics that gauge the health of the database.
• A systematic method for making those measurements and determining trends The common problem areas include
• Running out of free space in a tablespace
• Insufficient space for temporary segments
• Rollback segments that have reached their maximum extension
• Fragmentation of data segments and free space
• Improperly sized System Global Areas (SGA) An effective database monitoring system must detect unacceptable values for each of the areas mentioned above.
Note: If Oracle database servers are to be monitored, ensure that classesXX.zip (database driver for Oracle) is installed in your systems and the classpath for the same has to be set in the startnms.bat /sh file located in <Product Home>/bin directory.

AdventNet Web NMS 4.5.0 – Systems & Applications Monitoring Feature Pack
AdventNet Inc. 35
Collecting Data for Oracle Applications
• Parameters Monitored
• Configuring Oracle Application Data Collection
Parameters Monitored The discovered Oracle applications will be monitored. The monitored parameters are listed below:
INSTANCEDETAILS
version startupTime created openMode logMode
SGADETAILS
libraryCacheSize dataDictCacheSize redologBufferSize bufferCachesize sqlAreaSize fixedSize sharedPoolsize
TABLESPACEDETAILS tableSpaceName allocatedBlocks allocatedBytes dataFiles
SGASTATUS dictionaryHitRatio libraryHitRatio freeMemorySize bufferHitRatio
TABLESPACESTATUS
TableSpaceName Status reads freeBytes readTime writes freeBlocks writeTime
REDOLOGS
GroupName thread bytes members sequence Archive Status FirstTime Member MStatus
SESSIONINFO
SessionId Status Machine UserName logicalReads cursors buffercacheHitRatio

AdventNet Web NMS 4.5.0 – Systems & Applications Monitoring Feature Pack
AdventNet Inc. 36
cpuUsed blocksChanged commits chainedRows memorySorts physicalReads tableScans elapsedTime diskSorts
ROLLBACKDATA
segmentName tableSpaceName status blocks wraps hwmSize nextExtent shrinks initialExtent extend gets waits currentSize maxExtent minExtent
DATAFILES
fileName tableSpaceName Status reads createBytes avgrdTime avgwrTime writes
INSTANCESTATUS
reads avgUsers avgExecs blockSize writes dbsize
Configuring Oracle Application Data Collection Ensure that classesXX.zip (database driver for Oracle) is available in your system and the classpath for the same has to be set in the startnms.bat /sh file located in the <Web NMS Home>/bin directory. If the server is running, stop and restart. Example: DB_CLASSPATH=<PATH>/classes12.zip Here, <PATH> is the location where classes12.zip is present. If the Web NMS server is already started, then do a proper and normal shutdown of the server. Do not terminate the process abruptly.
1. From the main tree in the Client UI, invoke the OracleSystems node from the tree. 2. In the right panel, provide the following details:
• User Name • Password • Instance Name
• Data Collection Interval
AdventNet Web NMS 4.5.0 – Systems & Applications Monitoring Feature Pack
AdventNet Inc. 37
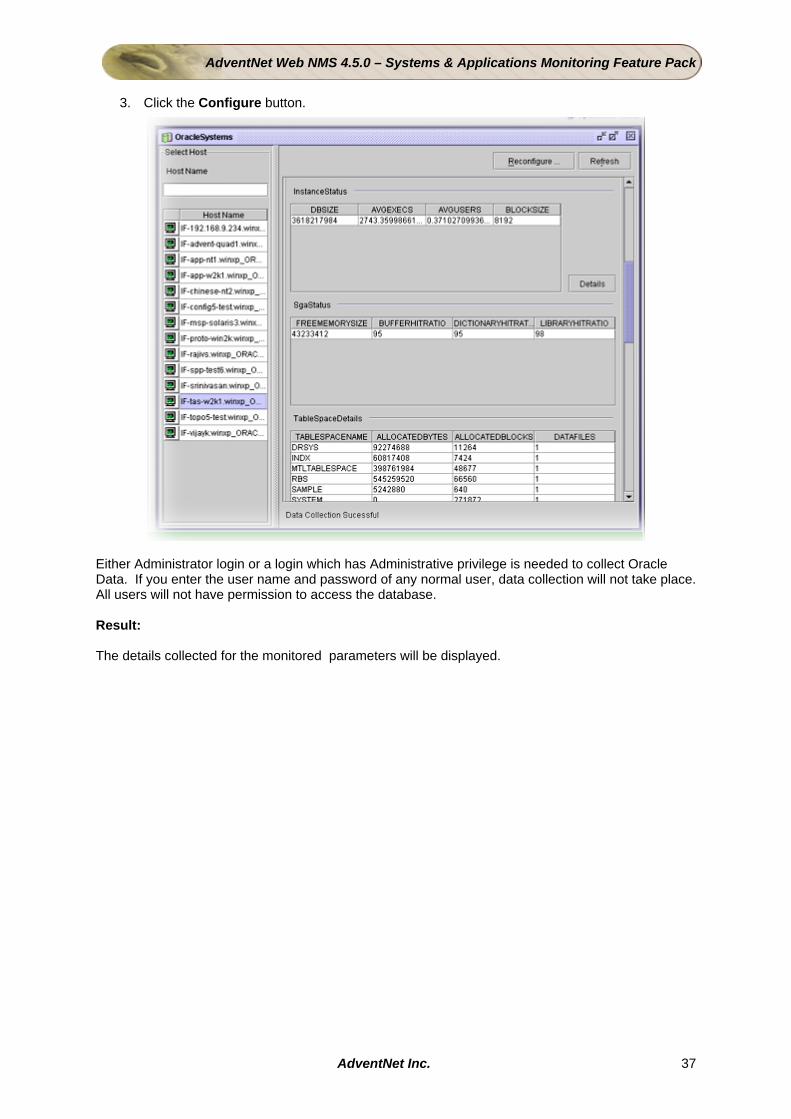
3. Click the Configure button.
Either Administrator login or a login which has Administrative privilege is needed to collect Oracle Data. If you enter the user name and password of any normal user, data collection will not take place. All users will not have permission to access the database. Result: The details collected for the monitored parameters will be displayed.
AdventNet Web NMS 4.5.0 – Systems & Applications Monitoring Feature Pack
AdventNet Inc. 38
Monitoring Host Resource Data
• Need for Monitoring Host Resource Data
• Collecting Data for Host Resources
• Configuring Command and Parse Rules
• Adding a New Process to Be Monitored
• Adding a New Device Type

AdventNet Web NMS 4.5.0 – Systems & Applications Monitoring Feature Pack
AdventNet Inc. 39
Need for Monitoring Host Resources
• What Are Host Resources?
• Need for Monitoring the Resources
What Are Host Resources? Host Resources are system performance components such as CPU, Memory, Disk, System Load, etc. Applying the Systems and Applications Monitoring feature pack enables host resources monitoring functionality using Web NMS. Need for Monitoring the Resources Network-level management, maintaining the status, and connectivity of the network is crucial in large/small enterprises, service providers, etc. It is of prime importance to know the status of the machines in the network, how overloaded they are and how efficiently they are utilized, to enable necessary corrective administrative measures on the identified overloaded/poorly performing systems. System-level management involves a lot of manual intervention, human resources, and administrative tasks to be performed. To achieve such goals and to ease the process of configuration management of Hosts, we provide a system-level monitoring/management functionality called Host Resource Monitoring. An effective runtime administration GUI is provided for configuring new system parameters to be monitored, or to modify existing ones. Host Resource Monitoring meets the following needs:
• This is of extensive use to system administrators who want to track all Hosts in their Domain from a single console.
• Servers whose downtime is not acceptable/affordable.
• Critical Systems, whose performances are related to the functionality of the other systems in the network.
Managing these resources pro-actively, before occurrence of any fault, is the main scope of Host Resource Monitoring.
AdventNet Web NMS 4.5.0 – Systems & Applications Monitoring Feature Pack
AdventNet Inc. 40
Collecting Data for Host Resources
• Default System Parameters Monitored
• Monitoring Host Resources for Unix Devices
• Monitoring Host Resources for Windows Devices
• Monitoring Processes
• Configuring Data Collection for Host Resource
• Accessing Graphs Reports
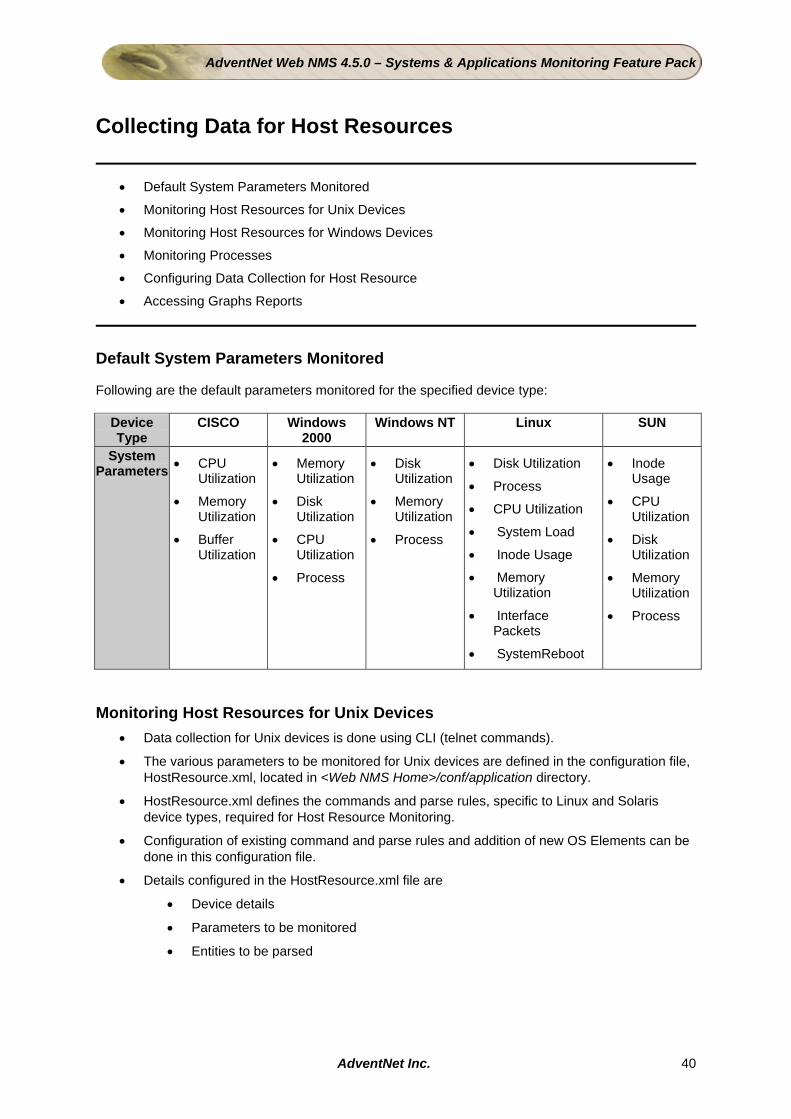
Default System Parameters Monitored Following are the default parameters monitored for the specified device type:
Device Type
CISCO Windows 2000
Windows NT Linux SUN
System Parameters • CPU
Utilization
• Memory Utilization
• Buffer Utilization
• Memory Utilization
• Disk Utilization
• CPU Utilization
• Process
• Disk Utilization
• Memory Utilization
• Process
• Disk Utilization
• Process
• CPU Utilization
• System Load
• Inode Usage
• Memory Utilization
• Interface Packets
• SystemReboot
• Inode Usage
• CPU Utilization
• Disk Utilization
• Memory Utilization
• Process
Monitoring Host Resources for Unix Devices
• Data collection for Unix devices is done using CLI (telnet commands).
• The various parameters to be monitored for Unix devices are defined in the configuration file, HostResource.xml, located in <Web NMS Home>/conf/application directory.
• HostResource.xml defines the commands and parse rules, specific to Linux and Solaris device types, required for Host Resource Monitoring.
• Configuration of existing command and parse rules and addition of new OS Elements can be done in this configuration file.
• Details configured in the HostResource.xml file are
• Device details
• Parameters to be monitored
• Entities to be parsed
AdventNet Web NMS 4.5.0 – Systems & Applications Monitoring Feature Pack
AdventNet Inc. 41
Monitoring Host Resources for Windows Devices • For monitoring host resource details for Windows, you need to have WMI installed in the Web
NMS server and the monitored devices.
• WMI is available by default in Windows 2000.
• You need to install this separately if it is a Windows NT device.
The VB script files located in <Web NMS Home>/conf/application/scripts directory use the WMI Scripting API to access some device-specific details. Example: memory, cpu etc., of the Windows machine. So, the prerequisites for monitoring system parameters for Windows are
• The Web NMS server must be running in a WMI-enabled machines.
• The devices monitored must also be WMI-enabled.
Monitoring Processes
• You can also configure and monitor the various processes running in a system such as httpd, syslogd etc.
• For Unix devices, process monitoring is achieved through telnet commands.
• For Windows devices, it is achieved through WMI.
• You can define the command and parse rules from the Runtime Administration UI.
• You can add new process and also define the command and parse rules for it.
Configuring Data Collection for Host Resources To configure host resource data collection for a device
1. Select Performance --> Host Resource node in the tree on the left panel .
2. The host devices discovered by Web NMS are listed on the left panel. From this list, select any device. The configuration parameters are listed on the right.
3. Select the Resource Type from the combo box.
4. Enter the user name and password of the device for which you want to collect data.
5. The default data collection interval is 300 seconds. So, data collection for the parameters takes place every 300 seconds. You can configure a required interval.
6. Select the required parameters for which data need to be collected, for example, Memory Usage, Disk Usage, CPU Utilization, Memory Utilization, etc
7. Click the Configure button at the bottom of the screen Result
• The collected data will be displayed in a table for each configured parameter.
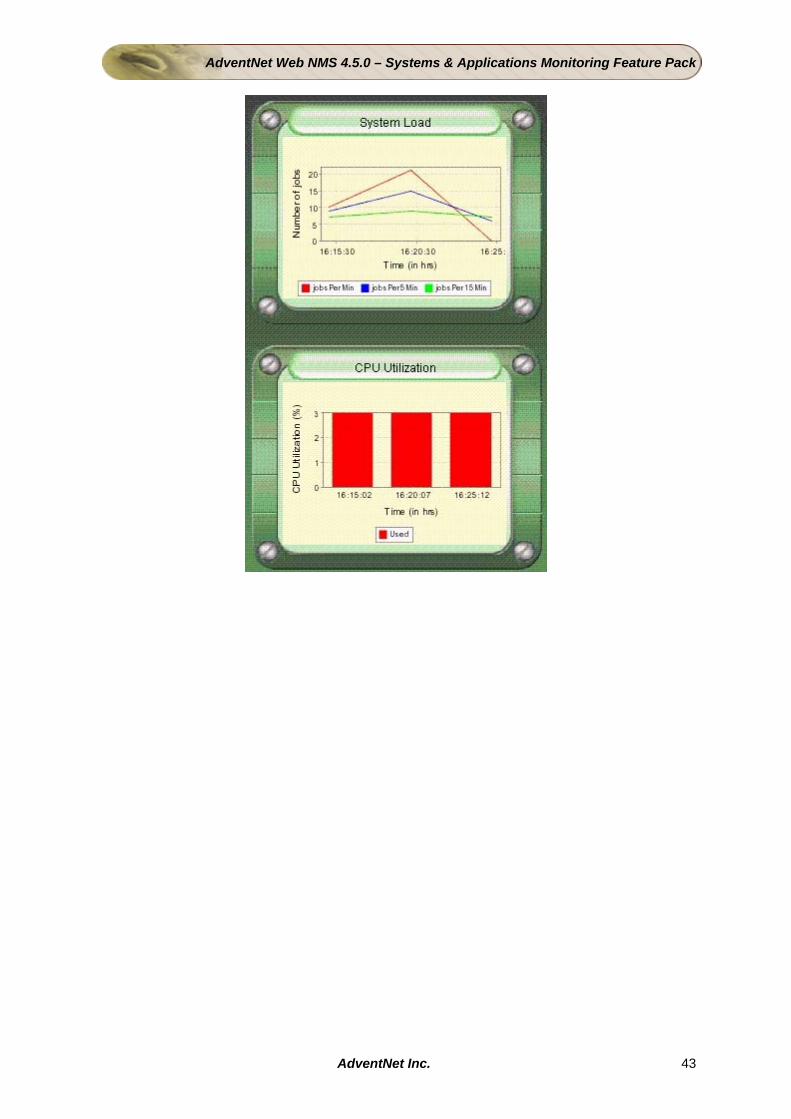
• A collective dashboard graph view for a maximum of six system parameters is displayed when you click the Graph View button. Graphs are not displayed for SystemReboot and Processes parameters.
• Individual dashboard graph for each parameter is displayed when you click the Graph button adjacent to each parameter details..

AdventNet Web NMS 4.5.0 – Systems & Applications Monitoring Feature Pack
AdventNet Inc. 42
Note: For Unix devices, you can configure System Prompt, Login Prompt, and Password Prompt. Click Advanced button in this screen to configure these parameters.
Accessing Graph Reports The parameters that have been configured for data collection for a particular host resource can be viewed either in the Table View or in the Graph View. To access the dashboard graphs
• In the Host Resource screen for a device for which data is collected, click the Graph View button. A dashboard graph containing graphs for the data for all system parameters is displayed.
• For individual graphs, click the Graph button corresponding to the system parameter. A dashboard graph for that particular parameter is displayed.
AdventNet Web NMS 4.5.0 – Systems & Applications Monitoring Feature Pack
AdventNet Inc. 43
AdventNet Web NMS 4.5.0 – Systems & Applications Monitoring Feature Pack
AdventNet Inc. 44
Configuring System Resources and Parsers
• Overview
• Adding New System Resources To Be Monitored for a Device
• Configuring Parser for the System Resource
• Parsing All Lines in the Output
Overview You can define your own command and parse rules for the data collection of host resources. This can be achieved from the Runtime Administration UI. Based on the resource type ( Unix / Windows), the corresponding protocol class will be loaded. That is, for Unix devices, data collection is performed using telnet commands to the remote devices. For windows, WMI API is used. Adding New System Resources To Be Monitored for a Device Type
1. From the menu bar, select Tools-->Runtime Administration. The corresponding UI opens. 2. From the Runtime Administration UI, select the Application-->Application Data Collection--
>HostResource node. 3. The corresponding UI is displayed on the right-side. The left-side tree contains the device
type list. 4. Select any resource type, say Linux. The corresponding protocol must be loaded in the
Resource Type Properties column in the right, in the Select Protocol combo box. For Unix devices, select the Telnet and for Windows devices, select WMl. The protocol class specifies whether the data collection must be performed through CLI commands (for Unix devices), or through WMI (for Windows devices). If the wrong protocol is chosen for a resource type, then data collection does not take place.
5. Click Add to add a new system resource to be monitored for the device. A wizard pops up. 6. Select System Resource radio button and click Next. 7. In the System Resource Configuration screen, provide the following details:
o System Resource Name: Provide the new system resource name. Example: Memory o Description: Provide the description of the resource. Example: Available Memory o Command: Provide the command that needs to be executed. Example: /bin/cat
/proc/meminfo o Unit for Collected Data: Provide the unit in which the output must be displayed.
Example: bytes 8. To parse all the lines on the output of the command, select Parse all lines in the output
check box. For this example, do not select the check box. If this option is selected, the Ignore Lines text field is enabled,
9. If you do not want to parse a few specific lines in the output, specify the line numbers from the beginning of the output as a comma-separated list. This must be specified only if you have selected the option to parse all lines.
10. Click Next. Configuring Parser for the System Resource
1. Provide the parser name in the corresponding text field. Example: MemFree 2. Provide the parser description in the corresponding field. Example: Parsers Memory

AdventNet Web NMS 4.5.0 – Systems & Applications Monitoring Feature Pack
AdventNet Inc. 45
3. Click Next. 4. Configure the following Data Extraction Details:
o Column Number: The column to be parsed. Example: 2 o Line Number: The line that needs to be parsed. Example: 5 o Extract data till character: Specify the character till which you want the data to be
extracted. Example: KB o Name for Extracted Data: Provide a name for the extracted data. Example: m o Calibrate Extracted Data: Provide the required expression using which you want to
manipulate the extracted data. Example: m 5. Click Add. 6. Repeat step 4 for the other columns that need to be parsed and click Next. 7. Enter the data that need to be persisted in the Data to be Stored field. In this example, m.
8. Configure the following Event Generation Criterion:
o Criterion: The criterion for which the event is generated. In this example, m o Compare Criterion: The value with which the criterion must be compared to generate
the appropriate event. In this example, With previous data. You can select the With threshold option depending on the type of system resource.
o Select Threshold: You can select the required threshold that will be applied. This option is disabled if you have selected With previous data option above.
o Severity: Select the required severity for the event to be generated if the specified criterion is met. Example: Critical
9. Click Finish to exit the wizard. 10. Click Apply for the changes to be applied to the server.
The new system resource will be added for the linux devices, and will be monitored.
You can configure data collection for this parameter as follows:
1. From the main client tree in the left panel, select the node Performance-->Host Resource. 2. A list of host names is displayed on the right-side. Select any Linux device. 3. Select the resource type as Linux from the combo box. 4. Provide the user name and password for the machine. Example: username - guest,
password - guest 5. Set the required data collection interval. Example: 300 seconds 6. Click Configure.
Data are collected after the configured interval.
AdventNet Web NMS 4.5.0 – Systems & Applications Monitoring Feature Pack
AdventNet Inc. 46
Parsing All Lines in the Output If the option Parse all lines in the output is enabled, then the Ignore Lines field is enabled, where you can specify the lines to be ignored. In such case, the option to specify the lines to be parsed, will not be available. Example Let us take the example of a parameter monitored by default, Disk Utilization.
• Command executed: /bin/df • Output is as seen below:
Filesystem 1k-blocks Used Available Use% Mounted on /dev/hda1 5045104 3293332 1495492 69% / /dev/hda5 10082852 1830964 7739700 20% /advent /dev/hda6 12039832 6409012 5019220 57% /advent1 /dev/hda3 10082884 3672336 5898360 39% /home none 256652 0 256652 0% /dev/shm
When the Parse all the lines in the output option is enabled, the Ignore Lines option is also enabled. Here, the line to be ignored is specified as 1. So, the first line in the output (Filesystem 1k-blocks Used Available Use% Mounted on) is ignored. The specified column (in this case, the column specified is 1) is parsed. When data collection is configured for this parameter, the data collection is performed based on the specified lines and columns.
AdventNet Web NMS 4.5.0 – Systems & Applications Monitoring Feature Pack
AdventNet Inc. 47
Configuring New Process and Command
• Adding a New Process to be Monitored
• Configuring a Command for a Process in Unix
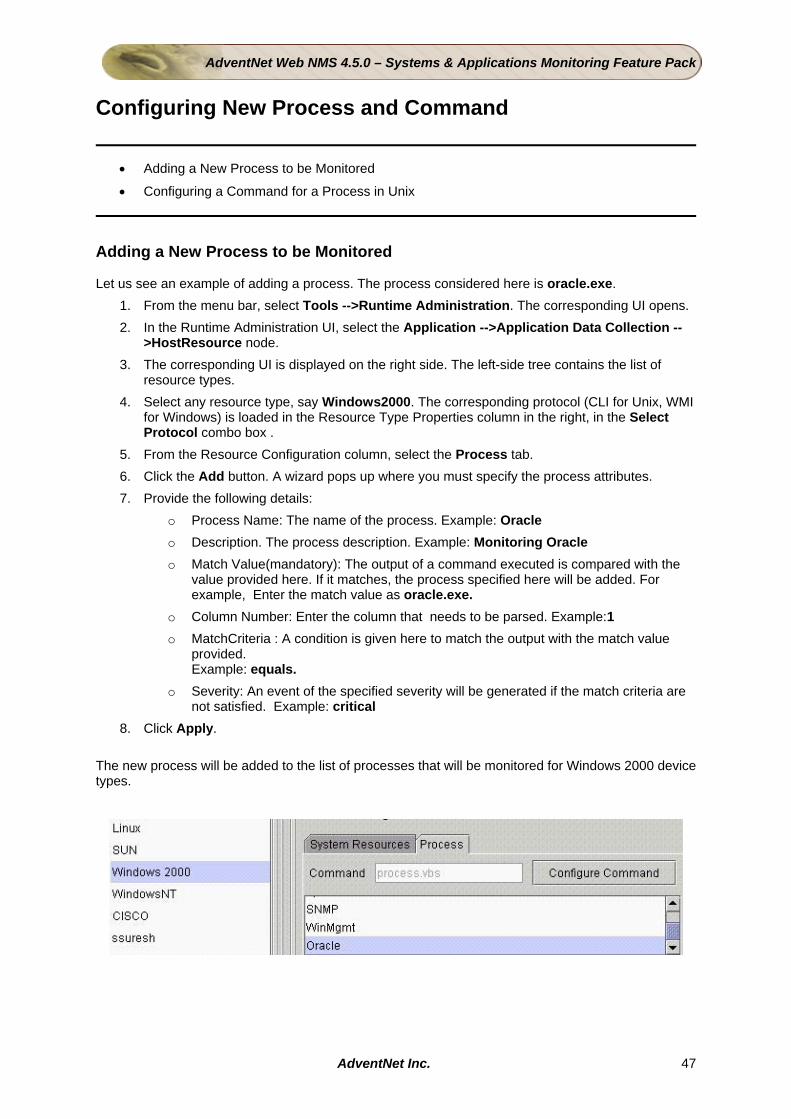
Adding a New Process to be Monitored Let us see an example of adding a process. The process considered here is oracle.exe.
1. From the menu bar, select Tools -->Runtime Administration. The corresponding UI opens. 2. In the Runtime Administration UI, select the Application -->Application Data Collection --
>HostResource node. 3. The corresponding UI is displayed on the right side. The left-side tree contains the list of
resource types. 4. Select any resource type, say Windows2000. The corresponding protocol (CLI for Unix, WMI
for Windows) is loaded in the Resource Type Properties column in the right, in the Select Protocol combo box .
5. From the Resource Configuration column, select the Process tab. 6. Click the Add button. A wizard pops up where you must specify the process attributes. 7. Provide the following details:
o Process Name: The name of the process. Example: Oracle o Description. The process description. Example: Monitoring Oracle o Match Value(mandatory): The output of a command executed is compared with the
value provided here. If it matches, the process specified here will be added. For example, Enter the match value as oracle.exe.
o Column Number: Enter the column that needs to be parsed. Example:1 o MatchCriteria : A condition is given here to match the output with the match value
provided. Example: equals.
o Severity: An event of the specified severity will be generated if the match criteria are not satisfied. Example: critical
8. Click Apply. The new process will be added to the list of processes that will be monitored for Windows 2000 device types.
AdventNet Web NMS 4.5.0 – Systems & Applications Monitoring Feature Pack
AdventNet Inc. 48
Note: The command for process monitoring is displayed in the UI. These are VB script files incase of Windows devices, and telnet commands for Unix devices. For windows, if you want to configure some other command, you must write the required VB script and place it in <Web NMS Home>/conf/application/scripts directory. Then, from the runtime process monitoring UI, select the Configure Command option and configure the required command.
1. In the Client UI, select the tree node, Performance -->Host Resource. 2. Select any device from the list of discovered devices. 3. Select the resource type as Windows 2000 from the corresponding combo box in the
configuration parameters. 4. The host resource parameters and the processes that are monitored will be listed. 5. In the list of processes, Oracle will be added. You can select this process and configure data
collection. The newly added Oracle process is monitored and data is collected for the configured parameters. Configuring a Command for a Process in Unix Let us assume that you want to add and monitor a process in a Linux device, to check if the process is up or down . Following are the steps:
1. Add the Process to be monitored 2. Configure a command for the Process
Add the Process To Be Monitored Let us add the process Unix, to be monitored. To add the process,
1. In the Host Resource RTA, select Linux as the host-type from the list. 2. Select the protocol as Telnet from the corresponding combo-box. 3. In the Resource Configuration column, select the Process tab. 4. Click Add button at the bottom of this column. 5. In the Porcess Attributes screen, provide the following details:
o Process Name: Unix o Description: Unix Process o Match Value: unix o Column Number: 1 o Match Criteria: equals o Severity: Warning
6. Click Finish. The Unix process is added to the list of processes already available. Configure a Command for the Process To configure the command for the Unix process,
1. Select the Unix process from the list, 2. Click Configure Command button. A corresponding dialog pops up.

AdventNet Web NMS 4.5.0 – Systems & Applications Monitoring Feature Pack
AdventNet Inc. 49
3. Provide the following details: o Command: Type the required command in this field. Example: netstat -na o Description: Type the required description. Example: The status of the process.
4. Click Finish. 5. Click Apply.
Now configure now select any Linux device and configure data collection for the newly added process. The status of the Unix process will be displayed.

AdventNet Web NMS 4.5.0 – Systems & Applications Monitoring Feature Pack
AdventNet Inc. 50
Adding a New Device Type The configuration file HostResource.xml, located in <Web NMS Home>/conf/application, by default, defines commands and parse rules applicable to the device types specified earlier. You can add your own device type and monitor the parameters/process from the Runtime Administration UI. You must know the commands specific to that device type. The parameters of that device type will be displayed in the configuration screen in the Client. Let us see an example of adding a new device type which is actually a grouping of all the devices in which the Firewall applications are running. But it is mandatory that the IP where the firewall application is running is already discovered by Web NMS. Let the device type be called NetFirewall.
1. In the Runtime Administration, click the button at the bottom of the list. A new device is added. Edit the name of the device as NetFirewall and press Enter.
2. Click the Add button in the Resource Configuration column to add a command for the device. 3. In the configuration wizard that pops up, select System Resource radio button and click
Next. 4. In the System Resource Configuration screen, provide the following details:
o System Resource Name: Provide the new system resource name. Example: Memory o Description: Provide the description of the resource. Example: Available Memory o Command: Provide the command that needs to be executed. Example: /bin/cat
/proc/meminfo o Unit for Collected Data: Provide the unit in which the output must be displayed.
Example: bytes 5. Click Next. 6. In the parser configuration screen, provide the parser name in the corresponding text field.
Example: Parser1 7. Provide the parser description in the corresponding field. Example: Parsers Command 8. Click Next. 9. Configure the following Data Extraction Details: o Column Number: 5 o Line Number: 1 o Name for Extracted Data: Provide a name for the extracted data. Example: curValue o Calibrate Extracted Data: Provide the required expression using which you want to
manipulate the extracted data. Example: curValue 10. Click Add. 11. Repeat step 4 for the other columns that needs to be parsed and click Next. 12. Enter the data that needs to be persisted in the Data to be Stored field. In this example,
curValue. 13. Configure the following Event Generation Criterion:
o Criterion: The criterion for which the event is generated. In this example, curValue o Compare Criterion: The value with which the criterion must be compared to generate
the appropriate event. In this example, With previous data. You can select the With threshold option depending on the type of system resource.
o Select Threshold: You can select the required threshold that will be applied. This option is disabled if you have selected With previous data option above.
o Severity: Select the required severity for the event to be generated if the specified criterion is met. Example: Critical

AdventNet Web NMS 4.5.0 – Systems & Applications Monitoring Feature Pack
AdventNet Inc. 51
14. Click Finish to exit the wizard. 15. Click Apply
Result The new device type will be added to the list of available Resource Types. In the Client UI, you can view this in the Resource Type combo box in Performance -->Host Resource UI (in the right panel).

AdventNet Web NMS 4.5.0 – Systems & Applications Monitoring Feature Pack
AdventNet Inc. 52
Troubleshooting Tips The following table lists the possible problems you may encounter when configuring applications or host resources monitoring. Sl.NO Problems/Error Messages Solution
1. After adding a new application, status polling or data collection does not take place for that application.
For any new application that is added for discovery, you must also configure status polling through the Runtime Administration UI. Status Polling is not triggered by default for the newly added applications.
2. Data collection does not happen for Oracle applications.
Check if
• correct user name, password, and Oracle instance name are provided as input.
• Oracle driver is in the classpath. If not, set the driver in classpath.
3. Host resources monitoring does not happen for Windows devices.
The Web NMS server must run in a WMI-enabled Windows device. In Web NMS RME, the Distributed Mediation Server (DMS) must be running in a WMI-enabled Windows device