Embed Size (px)
Citation preview
A. D. Henderson University School/ FAU High School
Teacher Performance Evaluation System
Revised 8/4/2015
Dr. Joel Herbst, Assistant Dean PK-12 Schools and Educational Programs
Dr. Tammy Ferguson, Principal/Director
Dr. Rudolph Collum, Associate Director
Mrs. Maggie Ellis, Assistant Principal
Dr. Cynthia McDade , Assistant Principal
Mrs. Alyson Rodriguez, Assistant Principal
1
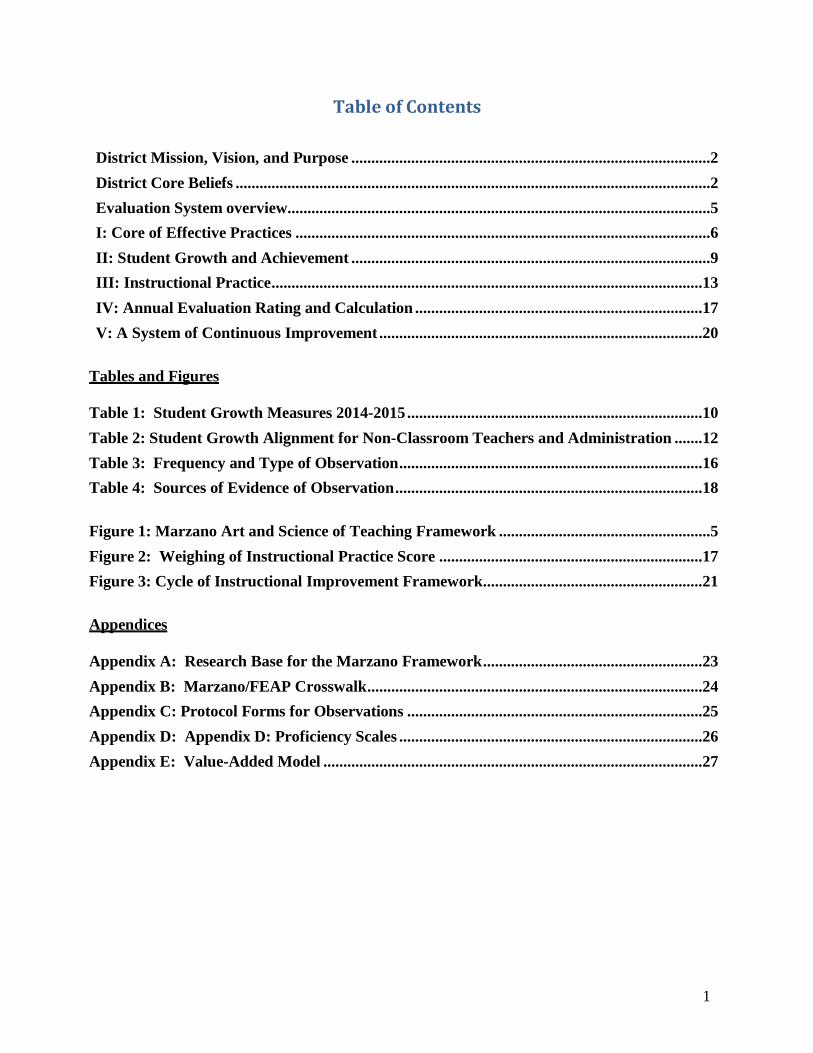
Table of Contents
District Mission, Vision, and Purpose ..........................................................................................2
District Core Beliefs .......................................................................................................................2
Evaluation System overview..........................................................................................................5
I: Core of Effective Practices ........................................................................................................6
II: Student Growth and Achievement ..........................................................................................9
III: Instructional Practice ............................................................................................................13
IV: Annual Evaluation Rating and Calculation ........................................................................17
V: A System of Continuous Improvement .................................................................................20
Tables and Figures
Table 1: Student Growth Measures 2014-2015 ..........................................................................10
Table 2: Student Growth Alignment for Non-Classroom Teachers and Administration .......12
Table 3: Frequency and Type of Observation ............................................................................16
Table 4: Sources of Evidence of Observation .............................................................................18
Figure 1: Marzano Art and Science of Teaching Framework .....................................................5
Figure 2: Weighing of Instructional Practice Score ..................................................................17
Figure 3: Cycle of Instructional Improvement Framework .......................................................21
Appendices
Appendix A: Research Base for the Marzano Framework .......................................................23
Appendix B: Marzano/FEAP Crosswalk ....................................................................................24
Appendix C: Protocol Forms for Observations ..........................................................................25
Appendix D: Appendix D: Proficiency Scales ............................................................................26
Appendix E: Value-Added Model ...............................................................................................27

2
A. D. Henderson University School
FAU High School College of Education 777 Glades Road
Boca Raton, FL 33431-0991
tel: 561.297.3970
fax: 561.297.3939
www.adhus.fau.edu and www.fauhigh.fau.edu
A. D. HENDERSON UNIVERSITY SCHOOL/FAU HIGH SCHOOL TEACHER
EVALUATION SYSTEM
District Mission: The school has a three-fold mission of (1) being a demonstration site for
teacher education; (2) developing curricula; (3) conducting research (F.S. 228.053).
District Vision: The Alexander D. Henderson University School/FAU High School is a national
exemplary model for school systems and teacher preparation programs improving education for
diverse student populations through innovative, faculty-developed research and curriculum.
District Purpose: The purpose of this redeveloped Performance Evaluation
System is to increase student learning growth by improving the quality of instructional,
administrative, and supervisory services (1012.34(1)(a), F.S. and MOU (D)(2)(ii)2. To that end,
A. D. Henderson University School/FAU High School (ADHUS/FAUHS) is committed to a
cycle of continually updating the evaluation system to reflect state models, emerging best
practices, and policy changes.
District Core Beliefs:
Our system will support interdependence among faculty and administrators, as well as
individual accountability, for teacher learning and growth.
Our system will support interdependence (vertically and horizontally) among faculty and
administrators, as well as individual accountability, for student learning and academic
growth and the development of the whole child.
Our system will be designed to actively engage all faculty and administrators to
collectively deepen knowledge and improve skills that result in improved student
learning.
Our system for measuring student growth and learning will include content knowledge
based on the Florida Standards.(Common Core Standards), Next Generation Sunshine
State Standards, course descriptions, 21st century skills.
For courses and subject areas not measured by statewide assessments, ADHUS/FAUHS will
identify, acquire, or design course description-aligned performance assessments and will
include a percentage of state-testing measures.
We will continue to strengthen our learning-goals-driven, formative assessment system to
align with student learning goals.

3
Our system will be designed to support collective responsibility for student success post- HS
graduation.
Evaluation System Overview
The Race to the Top MOU sections (D)(2)(ii) and 1012.34(1)(b) require that the school district’s
instructional personnel and school administrator evaluation systems be approved by the
Department of Education. State Board Rule 6B‐4.010, F.A.C. requires that where a district “…makes substantive modifications to an approved school district instructional personnel assessment system, the modified system shall be submitted to the Department of Education for
review and approval.”
The primary purpose of the FAUS performance-feedback process is to provide a sound basis for
teacher improvement and professional growth that will increase student learning. This is
accomplished through an evaluation of teacher effectiveness and subsequent discussions between
the teacher and a supervisor or other observer. The process assumes the competence of the
majority of teachers and focuses on professional development in the context of student
performance gains first, while documenting competency on an annual basis. The entire model for
teacher evaluations is based around a common language of instruction. The common language is
available on the Florida Department of Education website:
http://www.fldoe.org/profdev/pdf/CommonLanguage.pdf
At the core of the professional development continuum are three key elements. One is the belief
that, at all levels, the professional educator is engaged in a process of continuous improvement
through deliberate practice seeking to provide better learning for current and future students. The
nature of the improvement experiences will vary, but they include self-reflection, feedback on
performance from peers, parents and administrators, improvement in student performance,
professional development activities, and participation in school improvement efforts. The
purpose of any performance appraisal process must be the support of continuous professional
growth.
Another critical key element is a focus on improvement in student performance. Teacher
expectations, their ability to motivate students, the quality of instruction, and the monitoring of
student growth of important academic and social outcomes are critical factors in student learning.
Helping students learn essential skills and content, and develop the ability to continue learning
throughout their lives, is the core of educator professional development.
The third key element includes the Florida Educator Accomplished Practices (FEAPS) revised
December, 2010 and adopted by the State Board of Education. These standards and expectations
along with the locally developed sample key indicators provide high expectations for all
professionals based upon the study of effective teachers in Florida and the research (see
Appendix A) on effective teaching practices. With the use of accomplished practices, the goal of
teacher evaluation shifts from minimum competencies to demonstrating highly effective
instructional practices as the best ways for teachers to impact student learning.
4
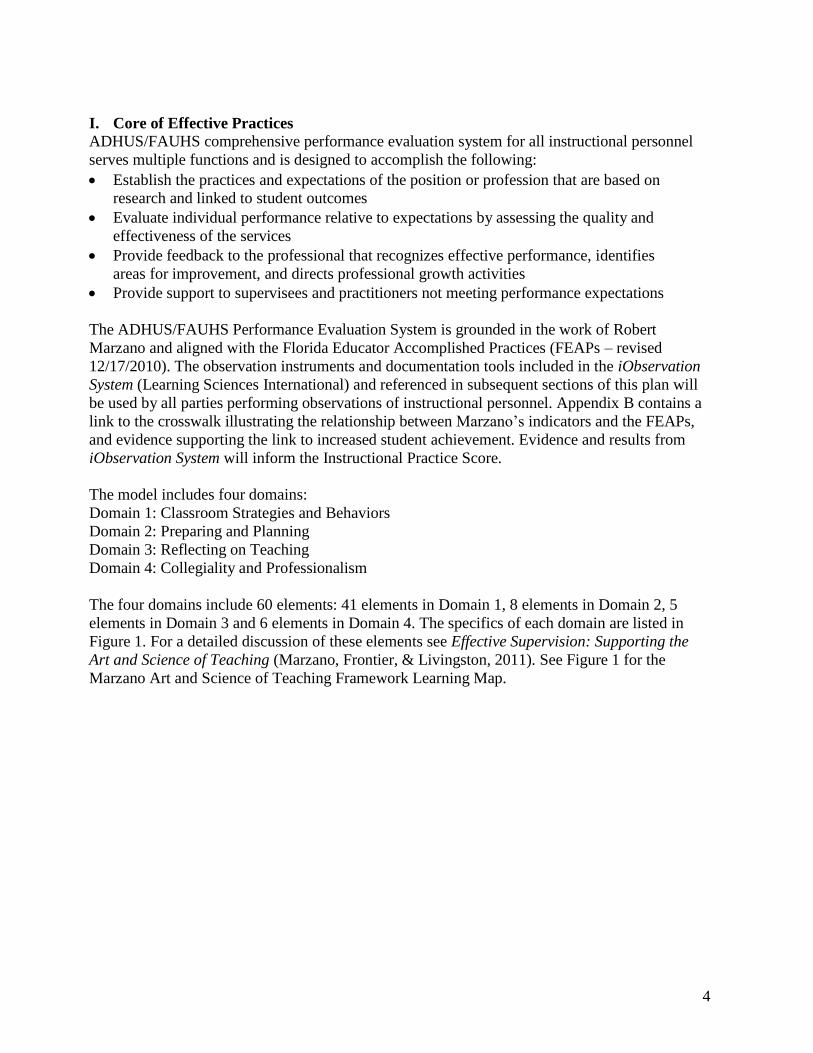
I. Core of Effective Practices ADHUS/FAUHS comprehensive performance evaluation system for all instructional personnel
serves multiple functions and is designed to accomplish the following:
Establish the practices and expectations of the position or profession that are based on
research and linked to student outcomes
Evaluate individual performance relative to expectations by assessing the quality and
effectiveness of the services
Provide feedback to the professional that recognizes effective performance, identifies
areas for improvement, and directs professional growth activities
Provide support to supervisees and practitioners not meeting performance expectations
The ADHUS/FAUHS Performance Evaluation System is grounded in the work of Robert
Marzano and aligned with the Florida Educator Accomplished Practices (FEAPs – revised
12/17/2010). The observation instruments and documentation tools included in the iObservation
System (Learning Sciences International) and referenced in subsequent sections of this plan will
be used by all parties performing observations of instructional personnel. Appendix B contains a
link to the crosswalk illustrating the relationship between Marzano’s indicators and the FEAPs,
and evidence supporting the link to increased student achievement. Evidence and results from
iObservation System will inform the Instructional Practice Score.
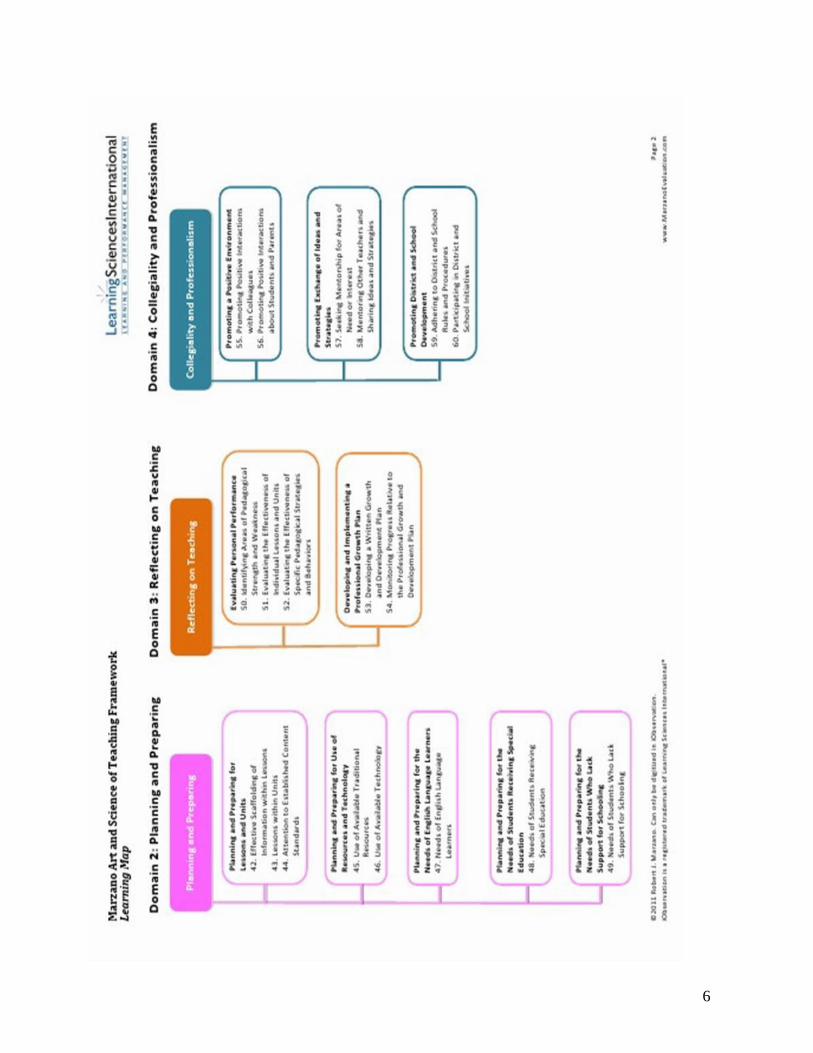
The model includes four domains:
Domain 1: Classroom Strategies and Behaviors
Domain 2: Preparing and Planning
Domain 3: Reflecting on Teaching
Domain 4: Collegiality and Professionalism
The four domains include 60 elements: 41 elements in Domain 1, 8 elements in Domain 2, 5
elements in Domain 3 and 6 elements in Domain 4. The specifics of each domain are listed in
Figure 1. For a detailed discussion of these elements see Effective Supervision: Supporting the
Art and Science of Teaching (Marzano, Frontier, & Livingston, 2011). See Figure 1 for the
Marzano Art and Science of Teaching Framework Learning Map.
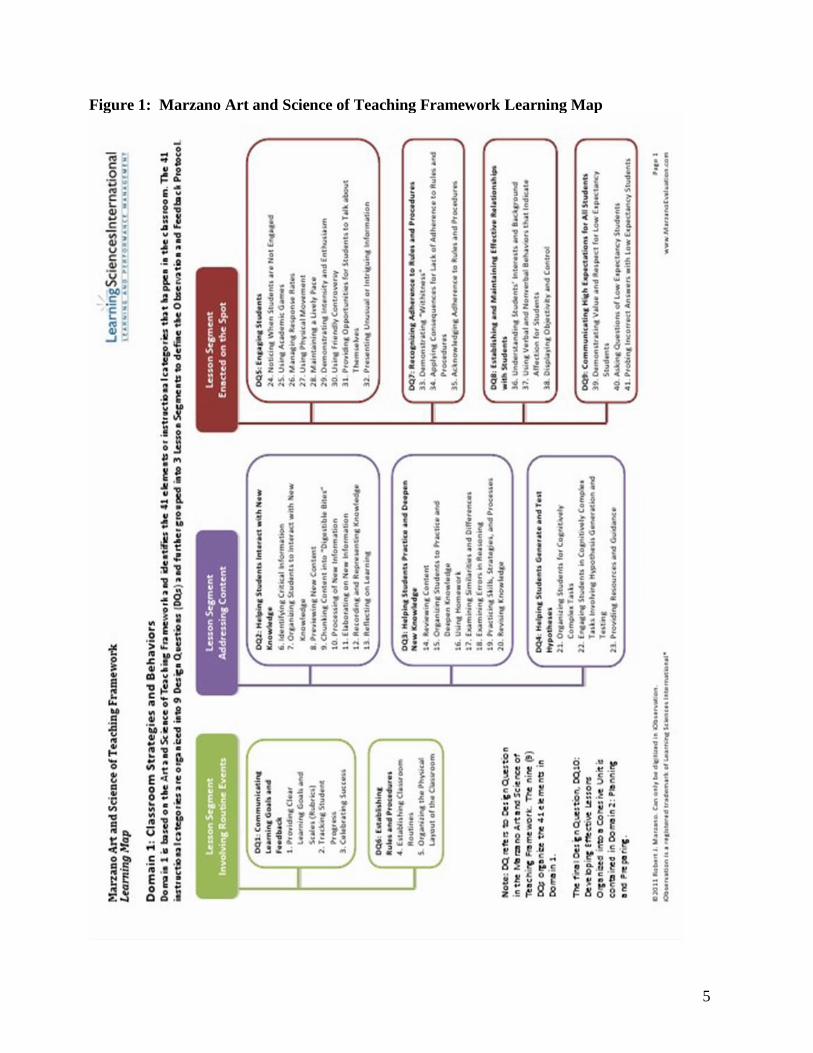
5
Figure 1: Marzano Art and Science of Teaching Framework Learning Map
6
7
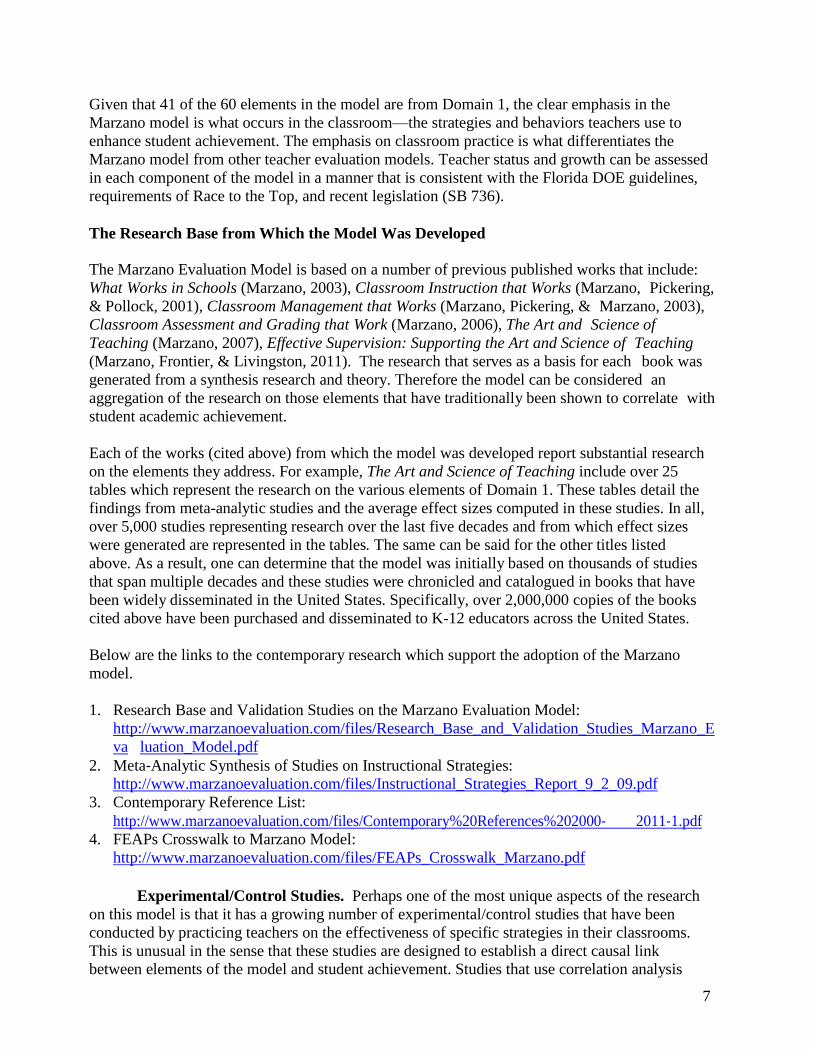
Given that 41 of the 60 elements in the model are from Domain 1, the clear emphasis in the
Marzano model is what occurs in the classroom—the strategies and behaviors teachers use to
enhance student achievement. The emphasis on classroom practice is what differentiates the
Marzano model from other teacher evaluation models. Teacher status and growth can be assessed
in each component of the model in a manner that is consistent with the Florida DOE guidelines,
requirements of Race to the Top, and recent legislation (SB 736).
The Research Base from Which the Model Was Developed
The Marzano Evaluation Model is based on a number of previous published works that include:
What Works in Schools (Marzano, 2003), Classroom Instruction that Works (Marzano, Pickering,
& Pollock, 2001), Classroom Management that Works (Marzano, Pickering, & Marzano, 2003),
Classroom Assessment and Grading that Work (Marzano, 2006), The Art and Science of
Teaching (Marzano, 2007), Effective Supervision: Supporting the Art and Science of Teaching
(Marzano, Frontier, & Livingston, 2011). The research that serves as a basis for each book was
generated from a synthesis research and theory. Therefore the model can be considered an
aggregation of the research on those elements that have traditionally been shown to correlate with
student academic achievement.
Each of the works (cited above) from which the model was developed report substantial research
on the elements they address. For example, The Art and Science of Teaching include over 25
tables which represent the research on the various elements of Domain 1. These tables detail the
findings from meta-analytic studies and the average effect sizes computed in these studies. In all,
over 5,000 studies representing research over the last five decades and from which effect sizes
were generated are represented in the tables. The same can be said for the other titles listed
above. As a result, one can determine that the model was initially based on thousands of studies
that span multiple decades and these studies were chronicled and catalogued in books that have
been widely disseminated in the United States. Specifically, over 2,000,000 copies of the books
cited above have been purchased and disseminated to K-12 educators across the United States.
Below are the links to the contemporary research which support the adoption of the Marzano
model.
1. Research Base and Validation Studies on the Marzano Evaluation Model:
http://www.marzanoevaluation.com/files/Research_Base_and_Validation_Studies_Marzano_E
va luation_Model.pdf
2. Meta‐Analytic Synthesis of Studies on Instructional Strategies:
http://www.marzanoevaluation.com/files/Instructional_Strategies_Report_9_2_09.pdf
3. Contemporary Reference List:
http://www.marzanoevaluation.com/files/Contemporary%20References%202000‐ 2011‐1.pdf
4. FEAPs Crosswalk to Marzano Model:
http://www.marzanoevaluation.com/files/FEAPs_Crosswalk_Marzano.pdf
Experimental/Control Studies. Perhaps one of the most unique aspects of the research
on this model is that it has a growing number of experimental/control studies that have been
conducted by practicing teachers on the effectiveness of specific strategies in their classrooms.
This is unusual in the sense that these studies are designed to establish a direct causal link
between elements of the model and student achievement. Studies that use correlation analysis
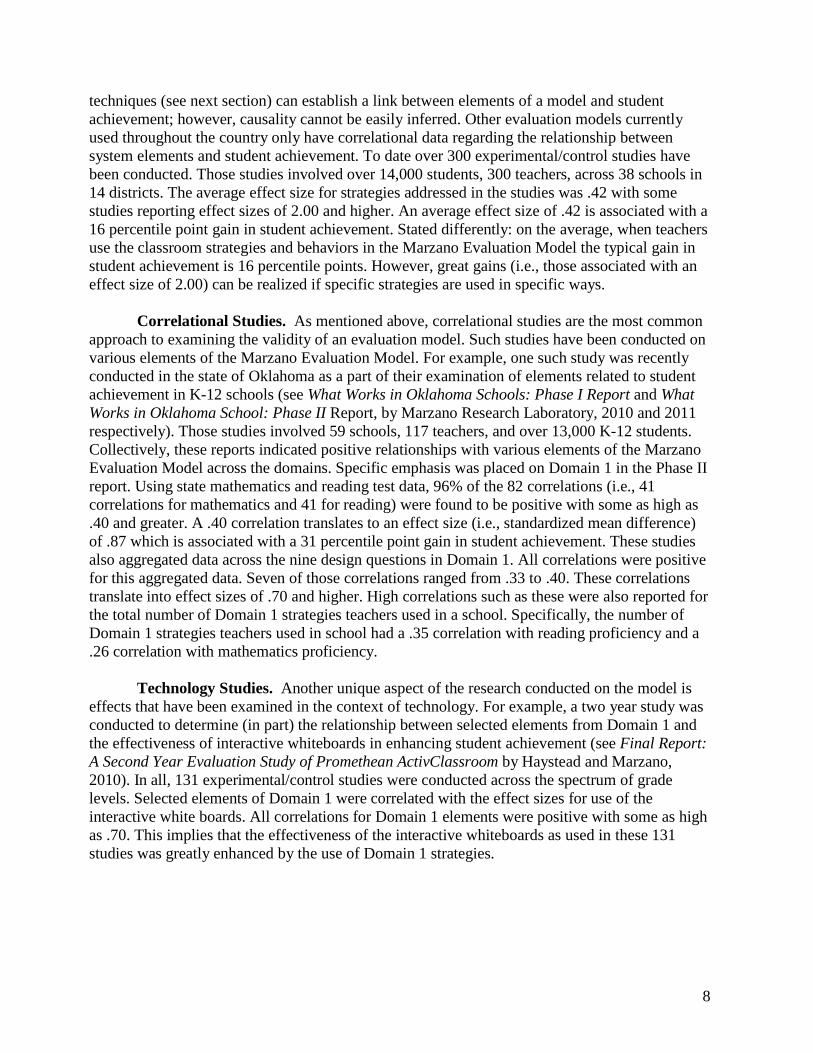
8
techniques (see next section) can establish a link between elements of a model and student
achievement; however, causality cannot be easily inferred. Other evaluation models currently
used throughout the country only have correlational data regarding the relationship between
system elements and student achievement. To date over 300 experimental/control studies have
been conducted. Those studies involved over 14,000 students, 300 teachers, across 38 schools in
14 districts. The average effect size for strategies addressed in the studies was .42 with some
studies reporting effect sizes of 2.00 and higher. An average effect size of .42 is associated with a
16 percentile point gain in student achievement. Stated differently: on the average, when teachers
use the classroom strategies and behaviors in the Marzano Evaluation Model the typical gain in
student achievement is 16 percentile points. However, great gains (i.e., those associated with an
effect size of 2.00) can be realized if specific strategies are used in specific ways.
Correlational Studies. As mentioned above, correlational studies are the most common
approach to examining the validity of an evaluation model. Such studies have been conducted on
various elements of the Marzano Evaluation Model. For example, one such study was recently
conducted in the state of Oklahoma as a part of their examination of elements related to student
achievement in K-12 schools (see What Works in Oklahoma Schools: Phase I Report and What
Works in Oklahoma School: Phase II Report, by Marzano Research Laboratory, 2010 and 2011
respectively). Those studies involved 59 schools, 117 teachers, and over 13,000 K-12 students.
Collectively, these reports indicated positive relationships with various elements of the Marzano
Evaluation Model across the domains. Specific emphasis was placed on Domain 1 in the Phase II
report. Using state mathematics and reading test data, 96% of the 82 correlations (i.e., 41
correlations for mathematics and 41 for reading) were found to be positive with some as high as
.40 and greater. A .40 correlation translates to an effect size (i.e., standardized mean difference)
of .87 which is associated with a 31 percentile point gain in student achievement. These studies
also aggregated data across the nine design questions in Domain 1. All correlations were positive
for this aggregated data. Seven of those correlations ranged from .33 to .40. These correlations
translate into effect sizes of .70 and higher. High correlations such as these were also reported for
the total number of Domain 1 strategies teachers used in a school. Specifically, the number of
Domain 1 strategies teachers used in school had a .35 correlation with reading proficiency and a
.26 correlation with mathematics proficiency.
Technology Studies. Another unique aspect of the research conducted on the model is
effects that have been examined in the context of technology. For example, a two year study was
conducted to determine (in part) the relationship between selected elements from Domain 1 and
the effectiveness of interactive whiteboards in enhancing student achievement (see Final Report:
A Second Year Evaluation Study of Promethean ActivClassroom by Haystead and Marzano,
2010). In all, 131 experimental/control studies were conducted across the spectrum of grade
levels. Selected elements of Domain 1 were correlated with the effect sizes for use of the
interactive white boards. All correlations for Domain 1 elements were positive with some as high
as .70. This implies that the effectiveness of the interactive whiteboards as used in these 131
studies was greatly enhanced by the use of Domain 1 strategies.

9
II. Student Growth and Achievement
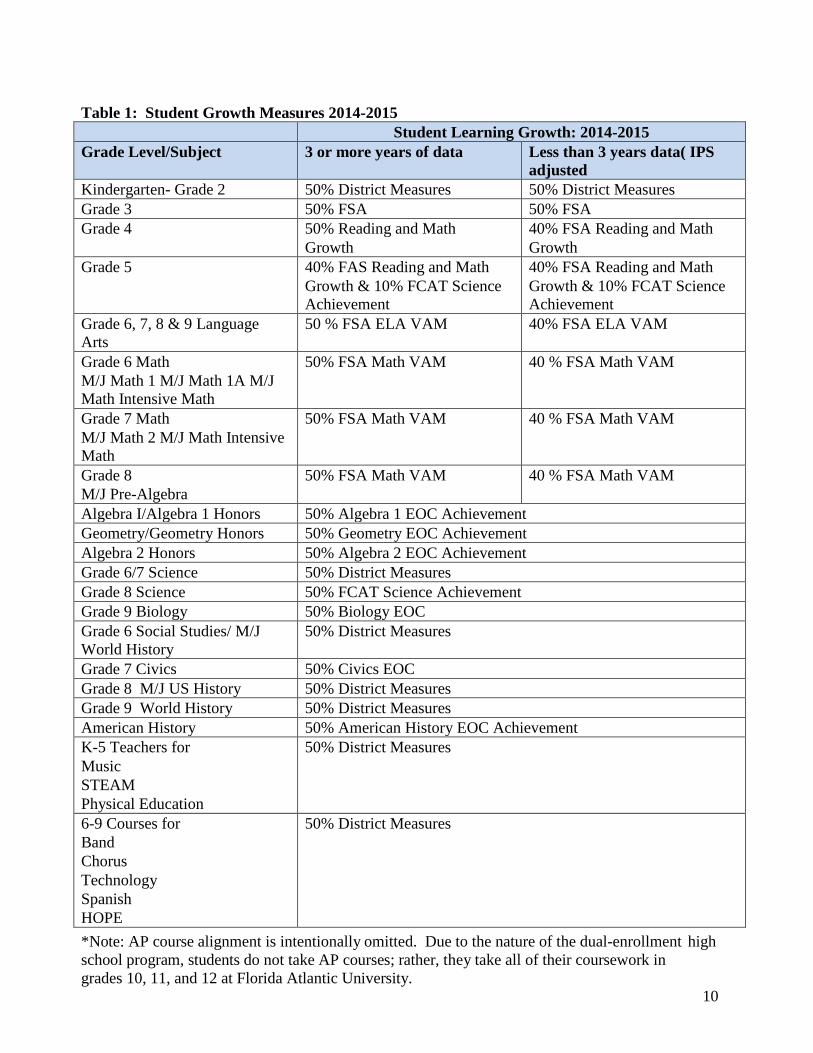
An instructional employee’s annual evaluation will consist of two parts: 50% Student Learning
Growth Score (or achievement, in some cases) and 50% Instructional Practice Score. For most
instructional employees, these parts will count equally as indicated and will be combined to
identify an overall rating.
For classroom teachers (throughout this document the term “teachers” excludes substitutes),
Assessment alignments in Table 1 will be used to determine the Student Growth/Achievement
component. This component will count for 50% of the teacher’s overall evaluation score
unless three years of data are not available for that teacher. In the case that less than three
years of data are available, the percentage will be reduced to 40% and the Instructional
Practice Score component increased to 60%. Table 1 also serves as a tool for organizing and
weighting student achievement scores for teachers with multiple classes/courses. The
weighting will be reflective on the percentage of students in each course in relationship to the
total number of students assigned to the teacher. Table 1 will be updated through the revision
process to reflect state models, state assessments, state provided item banks, and other
resources as they become available.
Annual evaluations of instructional personnel who are not classroom teachers will include
student growth from statewide assessments for students assigned to the instructional personnel.
This measure will count for 50% of the overall evaluation score provided that three years of
data are available. In the case that less than three years of data are available, this measure will
constitute 40% of the evaluation. The Instructional Practice Score (IPS) will be adjusted
accordingly. This is also reflected in the Non-classroom Teacher Evaluation Plan.
Where possible, district calculations will parallel state rules, policies, and procedures for
determining student inclusion in calculations.
10
Table 1: Student Growth Measures 2014-2015
Student Learning Growth: 2014-2015
Grade Level/Subject 3 or more years of data Less than 3 years data( IPS
adjusted
Kindergarten- Grade 2 50% District Measures 50% District Measures
Grade 3 50% FSA 50% FSA
Grade 4 50% Reading and Math
Growth
40% FSA Reading and Math
Growth
Grade 5 40% FAS Reading and Math
Growth & 10% FCAT Science
Achievement
40% FSA Reading and Math
Growth & 10% FCAT Science
Achievement
Grade 6, 7, 8 & 9 Language
Arts
50 % FSA ELA VAM 40% FSA ELA VAM
Grade 6 Math
M/J Math 1 M/J Math 1A M/J
Math Intensive Math
50% FSA Math VAM 40 % FSA Math VAM
Grade 7 Math
M/J Math 2 M/J Math Intensive
Math
50% FSA Math VAM 40 % FSA Math VAM
Grade 8
M/J Pre-Algebra
50% FSA Math VAM 40 % FSA Math VAM
Algebra I/Algebra 1 Honors 50% Algebra 1 EOC Achievement
Geometry/Geometry Honors 50% Geometry EOC Achievement
Algebra 2 Honors 50% Algebra 2 EOC Achievement
Grade 6/7 Science 50% District Measures
Grade 8 Science 50% FCAT Science Achievement
Grade 9 Biology 50% Biology EOC
Grade 6 Social Studies/ M/J
World History
50% District Measures
Grade 7 Civics 50% Civics EOC
Grade 8 M/J US History 50% District Measures
Grade 9 World History 50% District Measures
American History 50% American History EOC Achievement
K-5 Teachers for
Music
STEAM
Physical Education
50% District Measures
6-9 Courses for
Band
Chorus
Technology
Spanish
HOPE
50% District Measures
*Note: AP course alignment is intentionally omitted. Due to the nature of the dual-enrollment high
school program, students do not take AP courses; rather, they take all of their coursework in
grades 10, 11, and 12 at Florida Atlantic University.
11
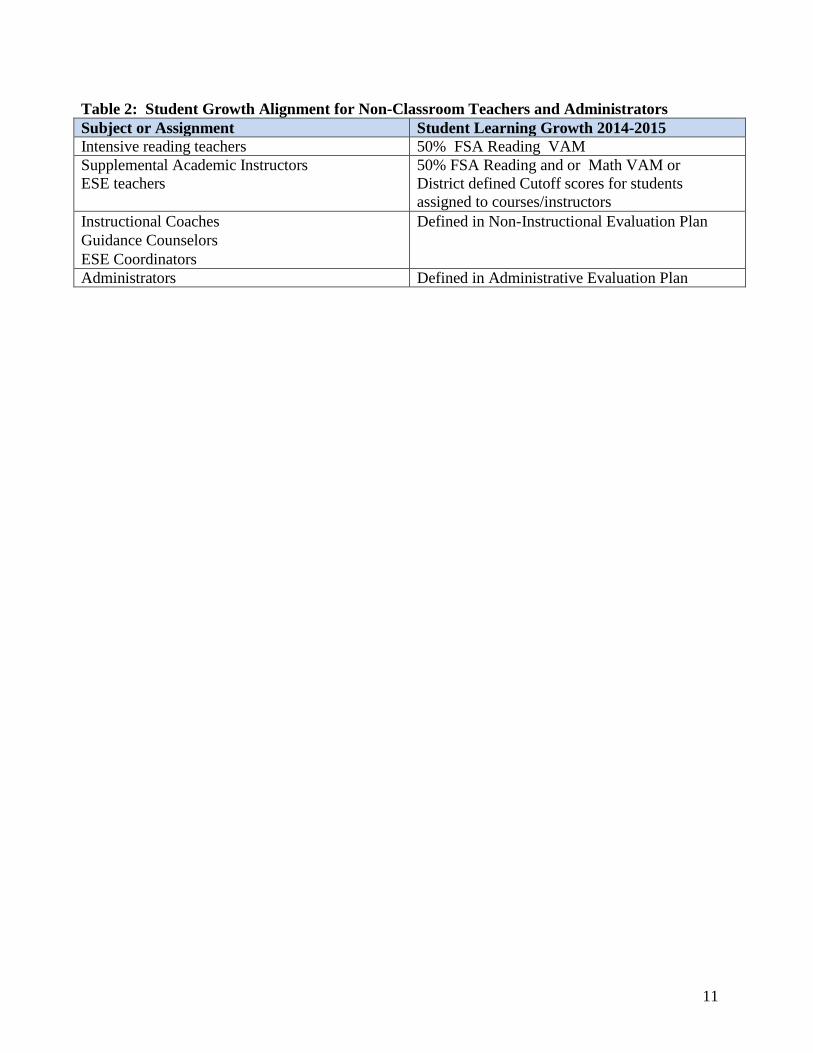
Table 2: Student Growth Alignment for Non-Classroom Teachers and Administrators
Subject or Assignment Student Learning Growth 2014-2015
Intensive reading teachers 50% FSA Reading VAM
Supplemental Academic Instructors
ESE teachers
50% FSA Reading and or Math VAM or
District defined Cutoff scores for students
assigned to courses/instructors
Instructional Coaches
Guidance Counselors
ESE Coordinators
Defined in Non-Instructional Evaluation Plan
Administrators Defined in Administrative Evaluation Plan
12
III. INSTRUCTIONAL PRACTICE
An Instructional Practice score will be computed for all instructional personnel. Florida’s
Evaluation Model, Marzano’s Art and Science of Teaching Framework, will be used. This Model:
Reflects teachers’ performance across all elements within the framework (Domains 1- 4)
Accounts for teachers’ experience levels (Categories A, B, C, and D)
Assigns weight to the domain with greatest impact on student achievement (Domain 1)
Acknowledges teachers’ focus on deliberate practice by measuring teacher
improvement over time on specific elements within the framework
An Instructional Practice score will consist of two elements: an Instructional Status score and a
Deliberate Practice score.
An Instructional Status Score:
Measures teachers’ proficiency against all 4 domains in the Marzano Model
Recognizes teachers’ use of research based strategies in the complete instructional
framework
A Deliberate Practice Score:
Measures progress against specifically targeted elements for improvement
Recognizes teacher’s deliberate practice
Supports annual growth in teacher practice
Informs the development of the Individual Professional Development Plan (IPDP)
For evaluation purposes, teachers are assigned to one of four categories:
Category A: First year of teaching or experienced teacher new to the district
Category B: Teachers in second or third year of teaching
Category C: Experienced teachers with at least 3 years of experience (4th year of
teaching)
Category D: Teachers beyond their 3rd
year of teaching and who are identified as a
struggling teacher.
Multiple observations (as reflected in Table 2) provide ongoing feedback to support teachers’
professional growth and gather sufficient evidence to measure effectiveness as teacher’s transition
to the district. Multiple formal observations provide regular opportunities and support for teacher
reflection and growth through the planning, observation and reflection conference process.
Domain 1cannot be documented and measured during one observation session.
Therefore, observers will work with teachers to establish a clear focus for each observation.
Design Questions previously addressed during a formal observation can be revisited at the request
of the teacher or the observer in future observations. In subsequent years, the formal observation
schedule for Category A and B teachers would follow a similar pattern with each observation
focusing on two to three Design Questions identified by the observer and the teacher during the
preconference.

13
Category A. All formal observations of Category A teachers will include a review of data
appropriate to the Design Question(s) focus for that observation. Appropriate data may include
but are not limited to:
Curriculum-based measures
Grade distributions
Mastery checklists
Student work samples
Discipline data
Informal Observations will focus on the Deliberate Practice elements of each teacher as indicated
on the Deliberate Practice Plan (DPP). Feedback for first-year teachers includes pre- and post-
observation conferences for all formal observations as well as other written feedback. In addition,
new teachers are provided feedback from mentor or peer-to-peer observations.
Any observations (formal, informal and walkthroughs) completed by the administration may be
used for the evaluative instrument. Administration will be responsible for all formal observations.
Observations (informal and walkthroughs) completed by the Peer Review Team (when
established) may only be used for formative purposes. These assessments will guide professional
development, lesson study focus, and mentor-mentee collaboration.
New teachers will participate in the new teacher program, Guiding Accelerated Teacher
Effectiveness (GATE). Through program participation, new teachers will learn to implement
effective strategies in their classrooms based on feedback received by the administrators,
members of the Peer Review Team, and their mentor. The administrator will meet with the new
teacher for a pre-observation conference before a formal observation and a post-observation
conference to discuss results. In addition, the iObservation system will be used to provide the
new teacher with instant feedback of all observations.
The observation instruments adopted will be used by all teachers; new teachers will not use a
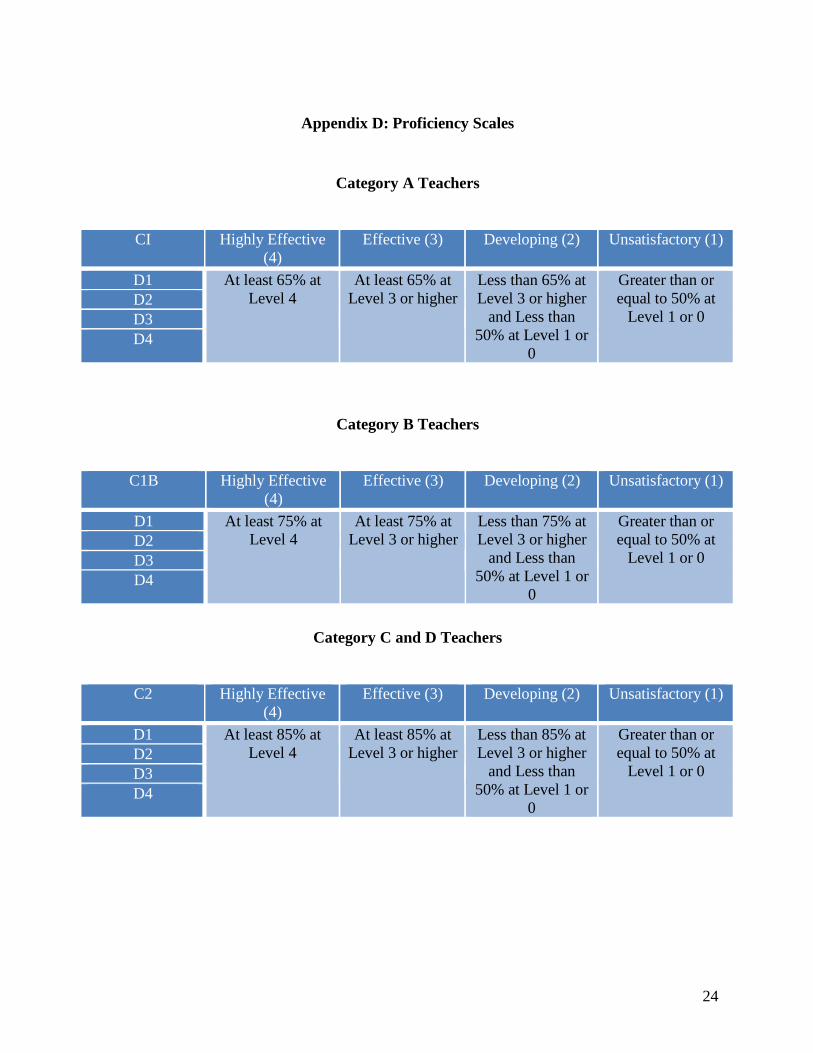
modified instrument. However, a modified rating scale is utilized for all Category A teachers. In
order to achieve a rating of Highly Effective, a teacher in Category A must have 65% of
evaluation scores at level 4 and 0% at level 1 or 0. Effective ratings occur if at least 65% are at
level 3 or higher. A developing rating includes less than 65% at level 3 or higher and less than
50% at level 1 or 0. Unsatisfactory ratings occur if greater than 50% of observed elements are at
level 1.0. See the Proficiency Scales in Appendix D for more information of final ratings.
Peer Review Option
Input from other personnel for the purposes of evaluation will not occur during year 1 of
implementation. All Peer Review Team observations will be used for formative purposes only
and will not contribute to the employee’s final evaluation in year 1 or 2. However, a Peer Review
Team may be established in subsequent years of implementation. Personnel that may participate
in this team will consist of experience, Category C teachers who have themselves earned
Effective and/or Highly Effective Ratings and are selected by the school administrator to support
the observation/ evaluation cycle. This team may consist of instructional coaches and/or teacher
leaders.
14
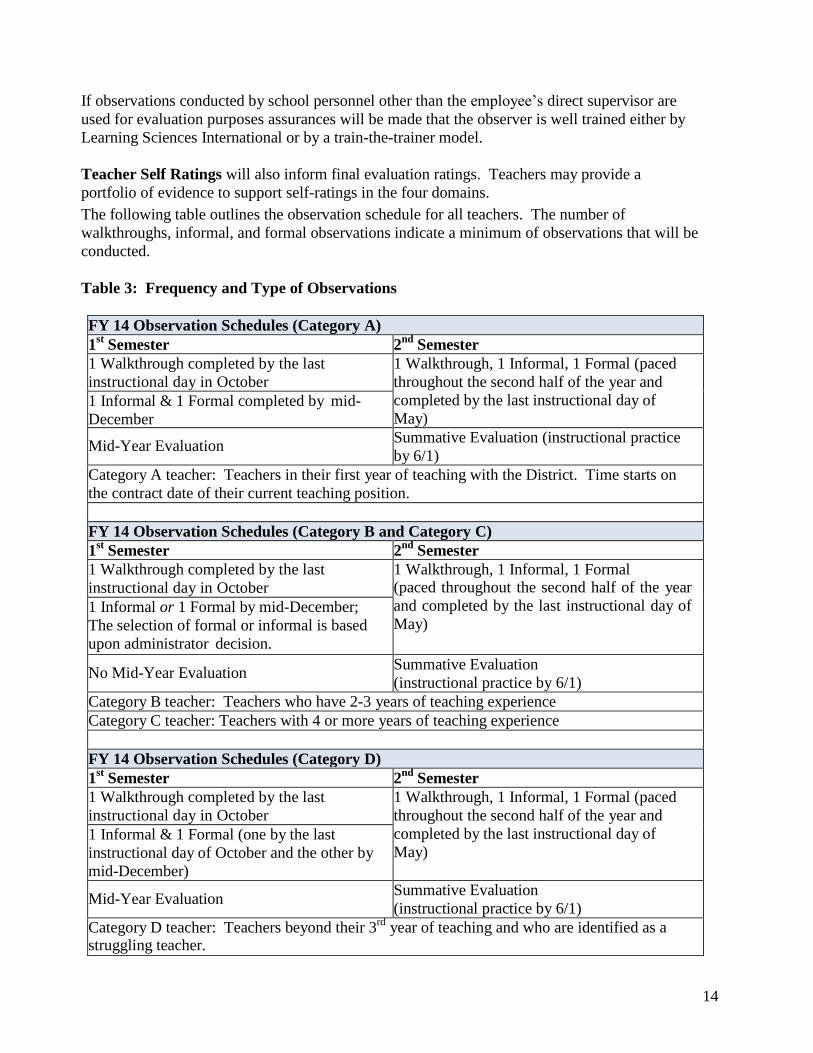
If observations conducted by school personnel other than the employee’s direct supervisor are
used for evaluation purposes assurances will be made that the observer is well trained either by
Learning Sciences International or by a train-the-trainer model.
Teacher Self Ratings will also inform final evaluation ratings. Teachers may provide a
portfolio of evidence to support self-ratings in the four domains.
The following table outlines the observation schedule for all teachers. The number of
walkthroughs, informal, and formal observations indicate a minimum of observations that will be
conducted.
Table 3: Frequency and Type of Observations
FY 14 Observation Schedules (Category A)
1st
Semester 2nd
Semester
1 Walkthrough completed by the last
instructional day in October
1 Walkthrough, 1 Informal, 1 Formal (paced
throughout the second half of the year and
completed by the last instructional day of
May) 1 Informal & 1 Formal completed by mid-
December
Mid-Year Evaluation Summative Evaluation (instructional practice
by 6/1)
Category A teacher: Teachers in their first year of teaching with the District. Time starts on
the contract date of their current teaching position.
FY 14 Observation Schedules (Category B and Category C)
1st
Semester 2nd
Semester
1 Walkthrough completed by the last
instructional day in October
1 Walkthrough, 1 Informal, 1 Formal (paced throughout the second half of the year
and completed by the last instructional day of
May) 1 Informal or 1 Formal by mid-December;
The selection of formal or informal is based
upon administrator decision.
No Mid-Year Evaluation Summative Evaluation
(instructional practice by 6/1)
Category B teacher: Teachers who have 2-3 years of teaching experience
Category C teacher: Teachers with 4 or more years of teaching experience
FY 14 Observation Schedules (Category D)
1st
Semester 2nd
Semester
1 Walkthrough completed by the last
instructional day in October
1 Walkthrough, 1 Informal, 1 Formal (paced
throughout the second half of the year and
completed by the last instructional day of
May) 1 Informal & 1 Formal (one by the last
instructional day of October and the other by
mid-December)
Mid-Year Evaluation Summative Evaluation
(instructional practice by 6/1)
Category D teacher: Teachers beyond their 3rd
year of teaching and who are identified as a struggling teacher.
15
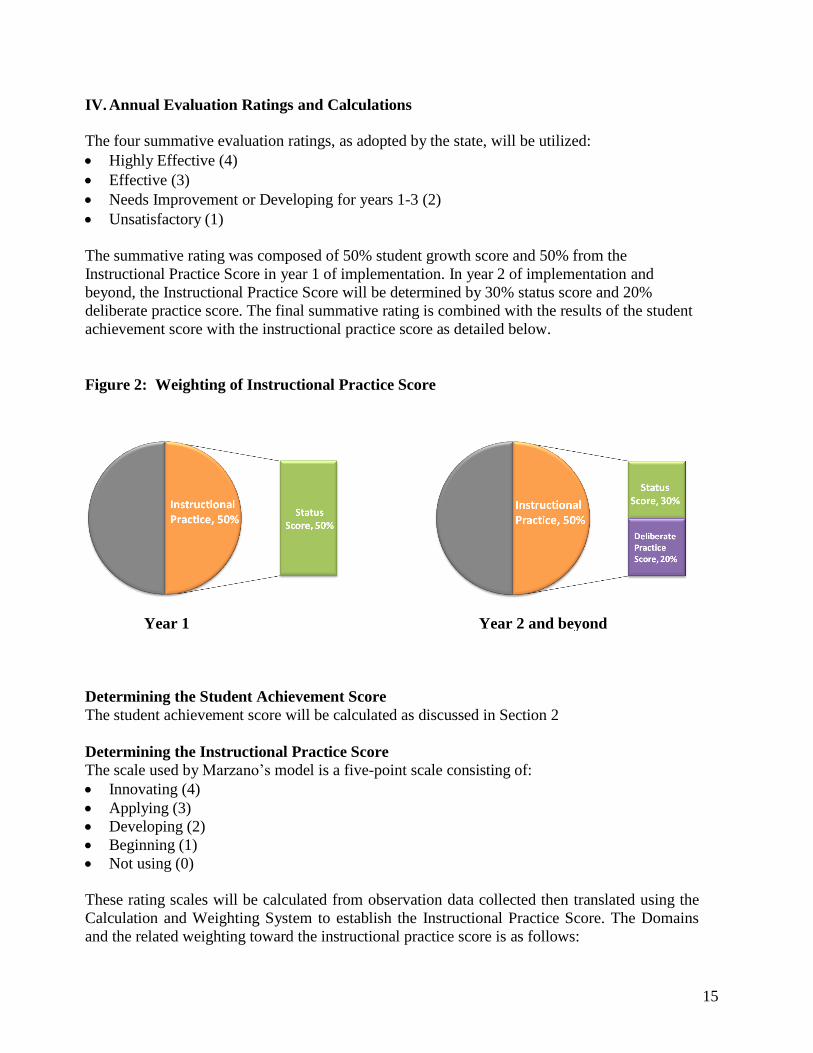
IV. Annual Evaluation Ratings and Calculations
The four summative evaluation ratings, as adopted by the state, will be utilized:
Highly Effective (4)
Effective (3)
Needs Improvement or Developing for years 1-3 (2)
Unsatisfactory (1)
The summative rating was composed of 50% student growth score and 50% from the
Instructional Practice Score in year 1 of implementation. In year 2 of implementation and
beyond, the Instructional Practice Score will be determined by 30% status score and 20%
deliberate practice score. The final summative rating is combined with the results of the student
achievement score with the instructional practice score as detailed below.
Figure 2: Weighting of Instructional Practice Score
Determining the Student Achievement Score
The student achievement score will be calculated as discussed in Section 2
Determining the Instructional Practice Score
The scale used by Marzano’s model is a five-point scale consisting of:
Innovating (4)
Applying (3)
Developing (2)
Beginning (1)
Not using (0)
These rating scales will be calculated from observation data collected then translated using the
Calculation and Weighting System to establish the Instructional Practice Score. The Domains
and the related weighting toward the instructional practice score is as follows:
Year 1 Year 2 and beyond
16
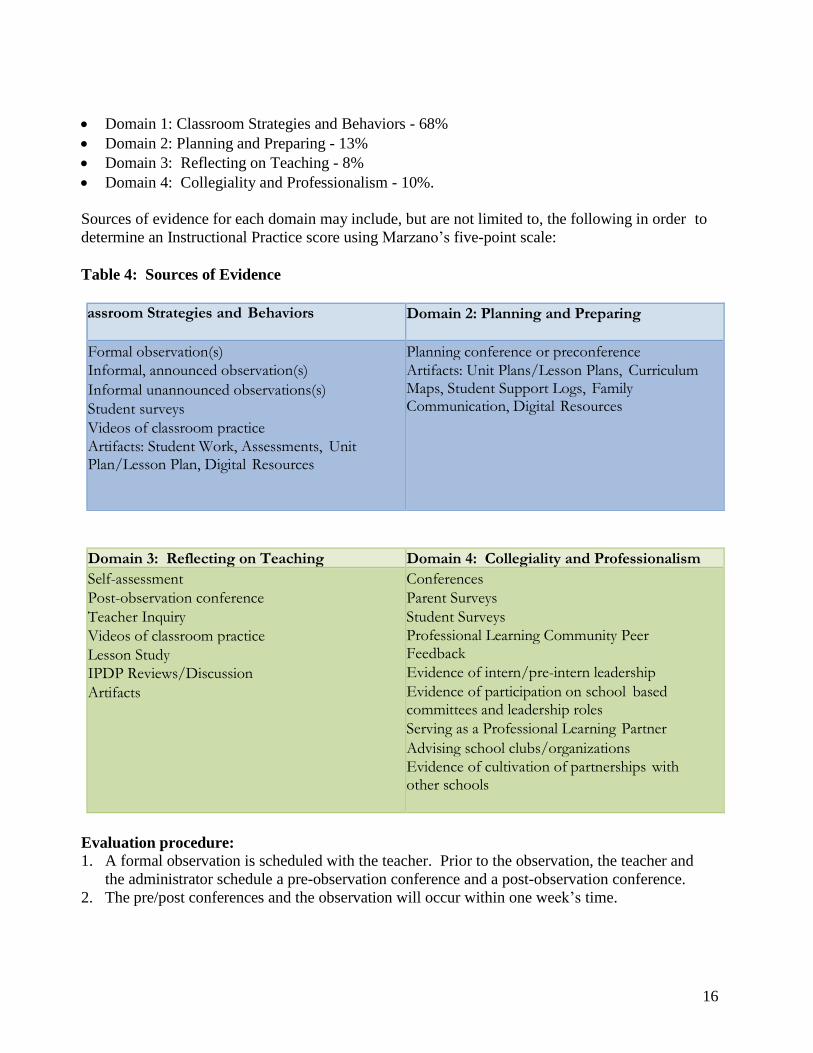
Domain 1: Classroom Strategies and Behaviors - 68%
Domain 2: Planning and Preparing - 13%
Domain 3: Reflecting on Teaching - 8%
Domain 4: Collegiality and Professionalism - 10%.
Sources of evidence for each domain may include, but are not limited to, the following in order to
determine an Instructional Practice score using Marzano’s five-point scale:
Table 4: Sources of Evidence
Domain 1: Classroom Strategies and Behaviors Domain 2: Planning and Preparing
• Formal observation(s)
• Informal, announced observation(s)
• Informal unannounced observations(s)
• Student surveys
• Videos of classroom practice
• Artifacts: Student Work, Assessments, Unit Plan/Lesson Plan, Digital Resources
• Planning conference or preconference
• Artifacts: Unit Plans/Lesson Plans, Curriculum Maps, Student Support Logs, Family Communication, Digital Resources
Domain 3: Reflecting on Teaching Domain 4: Collegiality and Professionalism
• Self-assessment
• Post-observation conference
• Teacher Inquiry
• Videos of classroom practice
• Lesson Study
• IPDP Reviews/Discussion
• Artifacts
• Conferences
• Parent Surveys
• Student Surveys
• Professional Learning Community Peer Feedback
• Evidence of intern/pre-intern leadership
• Evidence of participation on school based committees and leadership roles
• Serving as a Professional Learning Partner
• Advising school clubs/organizations
• Evidence of cultivation of partnerships with other schools
Evaluation procedure: 1. A formal observation is scheduled with the teacher. Prior to the observation, the teacher and
the administrator schedule a pre-observation conference and a post-observation conference.
2. The pre/post conferences and the observation will occur within one week’s time.

17
3. New teachers and teachers who have been identified as struggling will have future formal
observations scheduled during the post-observation conference.
4. Feedback from informal conferences should be made available to teachers within two
working days of the observation by the observer as well as through the iObservation data
system, which will be employed.
5. The administrator will conduct a summative evaluation with all teachers each year utilizing
the Instructional Practice Score and the Student Growth Score.
The rubric(s) and weighting scales/scoring systems defined by the Marzano Model will be used to
define and assign the summative evaluation rating. The 5-level rubric used to rate and provide
feedback to teachers on their use of the 60 elements of the Art and Science of Teaching
Framework are translated through the Calculation and Weighting System to the four rating labels
as defined at the state. These calculation translations, for all teachers in all categories, can be
found on the Learning Science International website within the Florida Model Material section
located at this web address:
http://www.marzanoevaluation.com/members_area/florida_model_materials/#Summative
The administrators at the school level will assign the final rating for each teacher. It may include
the scores from all formal, informal, and/or walk-through observations conducted by an
administrator. Currently, any observations conducted by the Peer Review Team will be used for
formative purposes, to identify trends, and to identify areas of professional development needed.
The employee’s final evaluation rating was determined by the Instructional Practice Score (50%)
and the Student Growth Score (50%) in year 1. In year 2 and beyond, the summative score will be
established by the Instructional Practice Score as determined by the Status Score (30%) and the
Deliberate Practice Score (20%), and the Student Growth Score (50%).
Combining the Student Growth Score and Instructional Practice Score for a Final
Summative Teacher Evaluation Score and Rating
Once the Student Growth Score and an Instructional Practice score have been determined, it is
necessary to combine these scores into a final Summative Teacher Evaluation Score and Rating.
Unless otherwise indicated by availability of data as outlined previously, both the Student
Growth and Instructional Practice Scores will each count for 50% of the final Summative Teacher
Evaluation Score.
The scale score for each rating is below:
Highly Effective Effective Needs
Improvement/Developing
Unsatisfactory
3.5 – 4 2.5 – 3.4 1.5 – 2.4 below 1.5
However, if the student growth score is unsatisfactory, the evaluation is deemed unsatisfactory
regardless of the Instructional Practice Score.

18
Evaluator Training
Learning Sciences International trainers provided initial training prior to the start of the 2011-
2012 school year. The training included the research base behind the Domain 1 elements
outlined by Marzano, the use of the observation forms, conducting objective observations and
“look for” evidence, and use of the technology through the iObservation platform. Participants
learned how to use the protocol, provide meaningful feedback, and to support teachers' growth
through a revised teacher performance evaluation system. Two summer institutes for
administrators and teacher leaders provided more training on the use of the protocols and inter
rater reliability. All administrators received Marzano’s The Art and Science of Teaching and
Effective Supervision. In addition, a common language of instruction has been adopted and well
documented throughout the school year and beyond which include procedures, policies, and
processes of the Teacher Evaluation System.
After the initial training, opportunities for continuous improvement may be provided through the
iObservation platform for practice using the observation forms. Instructional rounds may be
implemented in order to strive toward inter-rater reliability. Embedded within the iObservation
platform are professional development segments, research, and video that will help to further
guide observers as they move toward proficiency in conducting observations.
The process for monitoring evaluator performance will include ongoing dialogue and feedback
from stakeholders. The evaluators will collaborate, conduct instructional rounds, review all
observation forms, and check for inter-rater reliability.
Amending Evaluations
According to 1012.34 (3)(d), the evaluator may amend an evaluation based upon assessment data
from the current school year if the data becomes available within 90 days after the close of the
school year. The evaluator will comply with the notification procedures set forth. The principal
will notify the employee in person of any changes based on new data. Data to be considered will
consist of only those data approved as student growth measures.
V. A System of Continuous Improvement
The purpose of the Florida Atlantic University Lab School’s redeveloped Performance
Evaluation System is to establish an overall system of continuous improvement focused on
increasing student learning growth by improving the quality of instructional, administrative, and
supervisory service (1012.34 (1)(a), F.S. and MOU (D)(2)(ii)2.
School improvement goals are informed by data based on student learning outcomes and trends
in instructional practice as captured and aggregated in iObservation. These same data are used to
measure teacher effectiveness and inform decisions about classroom practice, staffing, and
professional learning needs. Instructional evaluation results will be used to identify both
challenge areas and possible solutions to be addressed in school/district improvement plans.
19
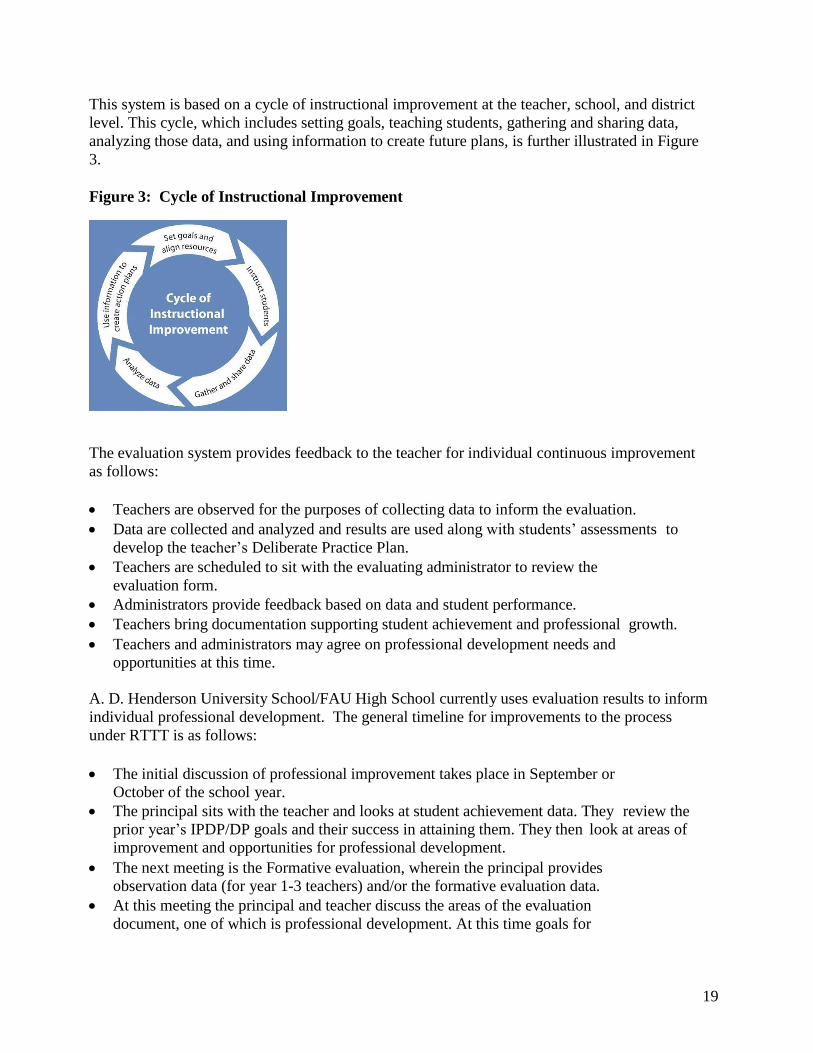
This system is based on a cycle of instructional improvement at the teacher, school, and district
level. This cycle, which includes setting goals, teaching students, gathering and sharing data,
analyzing those data, and using information to create future plans, is further illustrated in Figure
3.
Figure 3: Cycle of Instructional Improvement
The evaluation system provides feedback to the teacher for individual continuous improvement
as follows:
Teachers are observed for the purposes of collecting data to inform the evaluation.
Data are collected and analyzed and results are used along with students’ assessments to
develop the teacher’s Deliberate Practice Plan.
Teachers are scheduled to sit with the evaluating administrator to review the
evaluation form.
Administrators provide feedback based on data and student performance.
Teachers bring documentation supporting student achievement and professional growth.
Teachers and administrators may agree on professional development needs and
opportunities at this time.
A. D. Henderson University School/FAU High School currently uses evaluation results to inform
individual professional development. The general timeline for improvements to the process
under RTTT is as follows:
The initial discussion of professional improvement takes place in September or
October of the school year.
The principal sits with the teacher and looks at student achievement data. They review the
prior year’s IPDP/DP goals and their success in attaining them. They then look at areas of
improvement and opportunities for professional development.
The next meeting is the Formative evaluation, wherein the principal provides
observation data (for year 1-3 teachers) and/or the formative evaluation data.
At this meeting the principal and teacher discuss the areas of the evaluation
document, one of which is professional development. At this time goals for

20
professional improvement are set. The principal may suggest ways in which the teacher may
seek assistance and documentation that the teacher may bring to the summative evaluation
that shows growth.
The final meeting, the summative evaluation discussion, occurs at the end of each school
year. The teacher and the principal sit and evaluate the teacher’s performance during the
school year. At this time the principal will look at student performance data and other
documentation that shows teacher performance and professional growth.
Employees who are new to the district will be informed of the Teacher Evaluation System
through the New Teacher Orientation meeting and through the district’s new teacher program,
Guiding Accelerated Teacher Effectiveness (GATE). This group meets every month with
teacher leaders and mentors during the first two years of employment. In addition, new
employees will work with a mentor to ensure understanding of teacher practice, school policy,
and teacher evaluation.
School Improvement Plans
The evaluation system supports the district and school improvement plan as follows:
The school improvement plan is developed based on student achievement data,
Gaps in achievement data and areas needing improvement are identified.
The evaluation system helps to identify research-based instructional practices through
observations that are shown to improve student achievement.
Results from observations guide teachers’ professional development at the school level.
Evaluation results are used when developing school and district improvement plans as outlined
below:
Observation data are used for evaluation purposes, to provide formative feedback, and to
collect trend data.
Administrators and/or observers may identify school-wide and individual classroom
strategies and behaviors in need of improvement.
These data are used to drive the School Improvement Plan, the school/district
Professional Development Plan, and teachers’ Deliberate Practice Plan.
21
Appendix A: Research Base for the Marzano Framework
Haystead, M. W. & Marzano, R.J. (2010) Final Report: A Second Year Evaluation Study of
Promethean ActivClassroom. Englewood, CO: Marzano Research Laboratory
(marzanoresearch.com)
Haystead, M. W. & Marzano, R.J. (2010). Meta-Analytic Synthesis of Studies Conducted at
Marzano Research Laboratory on instructional Strategies. Englewood, CO: Marzano
Research Laboratory (marzanoresearch.com)
Marzano, R.J. (2003). What works in schools. Alexandria, VA: ASCD
Marzano, R. J. (2006). Classroom assessment and grading that work. Alexandria, VA: ASCD.
Marzano, R.J. (2007). The art and science of teaching. Alexandria, VA: ASCD
Marzano, R. J., Frontier, T., & Livingston, D. (2011). Effective supervision: Supporting the art
And science of teaching. Alexandria VA: ASCD
Marzano, R. J., Pickering, D. J., & Pollock, J. E. (2001). Classroom instruction that works.
Alexandria, VA: ASCD.
Marzano, R.J., Marzano, J. S., & Pickering, D. J. (2003). Classroom management that works.
Alexandria, VA: ASCD
Marzano Research Laboratory. (2010) What Works in Oklahoma Schools: Phase I Report.
Englewood, CO: Marzano Research Laboratory (marzanoresearch.com)
Marzano Research Laboratory. (2011) What Works in Oklahoma Schools: Phase II Report.
Englewood, CO: Marzano Research Laboratory (marzanoresearch.com)

22
Appendix B: Marzano/FEAP Crosswalk
The state crosswalk illustrating the relationship between Marzano’s domain segments and the
Florida Educator Accomplished Practices can be found at:
http://www.marzanoevaluation.com/files/FEAPs_Crosswalk_Marzano.pdf
23
Appendix C: Protocol Forms for Observations
All forms are available within the iObservation System and contain the same content as the
forms below:
Domain 1: Classroom Strategies and Behaviors
o Long Form, Routine Segments
o Long Form, Content Segments
o Long Form, On the Spot Segments
Domain 2: Planning and Preparing
o Long Form
o Planning (Pre) Conference Form A
o Planning (Pre) Conference Form B
o Reflection (Post) Conference Form A
Domain 3: Planning and Preparing
o Long Form
Domain 4: Collegiality and Professionalism
o Long Form
24
Appendix D: Proficiency Scales
Category A Teachers
CI Highly Effective
(4)
Effective (3) Developing (2) Unsatisfactory (1)
D1 At least 65% at
Level 4
At least 65% at
Level 3 or higher
Less than 65% at
Level 3 or higher
and Less than
50% at Level 1 or
0
Greater than or
equal to 50% at
Level 1 or 0 D2
D3
D4
Category B Teachers
C1B Highly Effective
(4)
Effective (3) Developing (2) Unsatisfactory (1)
D1 At least 75% at
Level 4
At least 75% at
Level 3 or higher
Less than 75% at
Level 3 or higher
and Less than
50% at Level 1 or
0
Greater than or
equal to 50% at
Level 1 or 0 D2
D3
D4
Category C and D Teachers
C2 Highly Effective
(4)
Effective (3) Developing (2) Unsatisfactory (1)
D1 At least 85% at
Level 4
At least 85% at
Level 3 or higher
Less than 85% at
Level 3 or higher
and Less than
50% at Level 1 or
0
Greater than or
equal to 50% at
Level 1 or 0 D2
D3
D4
25
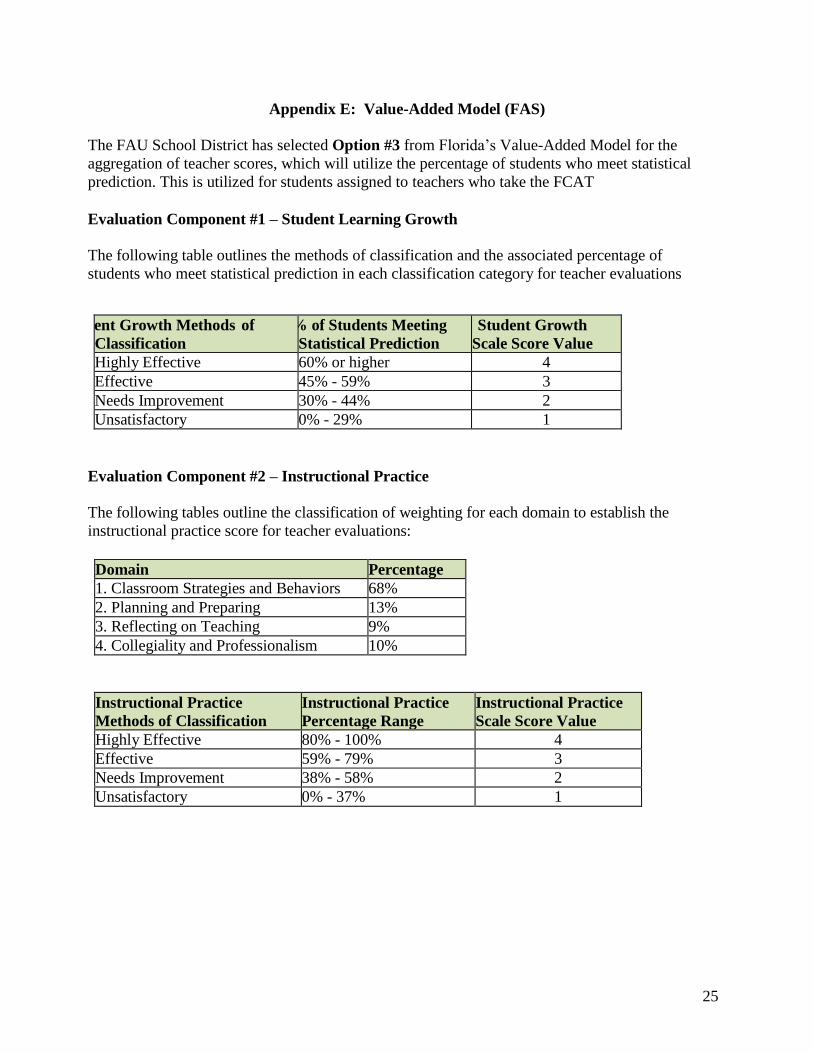
Appendix E: Value-Added Model (FAS)
The FAU School District has selected Option #3 from Florida’s Value-Added Model for the
aggregation of teacher scores, which will utilize the percentage of students who meet statistical
prediction. This is utilized for students assigned to teachers who take the FCAT
Evaluation Component #1 – Student Learning Growth
The following table outlines the methods of classification and the associated percentage of
students who meet statistical prediction in each classification category for teacher evaluations
Student Growth Methods of
Classification
% of Students Meeting
Statistical Prediction
Student Growth
Scale Score Value
Highly Effective 60% or higher 4
Effective 45% - 59% 3
Needs Improvement 30% - 44% 2
Unsatisfactory 0% - 29% 1
Evaluation Component #2 – Instructional Practice
The following tables outline the classification of weighting for each domain to establish the
instructional practice score for teacher evaluations:
Domain Percentage
1. Classroom Strategies and Behaviors 68%
2. Planning and Preparing 13%
3. Reflecting on Teaching 9%
4. Collegiality and Professionalism 10%
Instructional Practice
Methods of Classification
Instructional Practice
Percentage Range
Instructional Practice
Scale Score Value
Highly Effective 80% - 100% 4
Effective 59% - 79% 3
Needs Improvement 38% - 58% 2
Unsatisfactory 0% - 37% 1
26
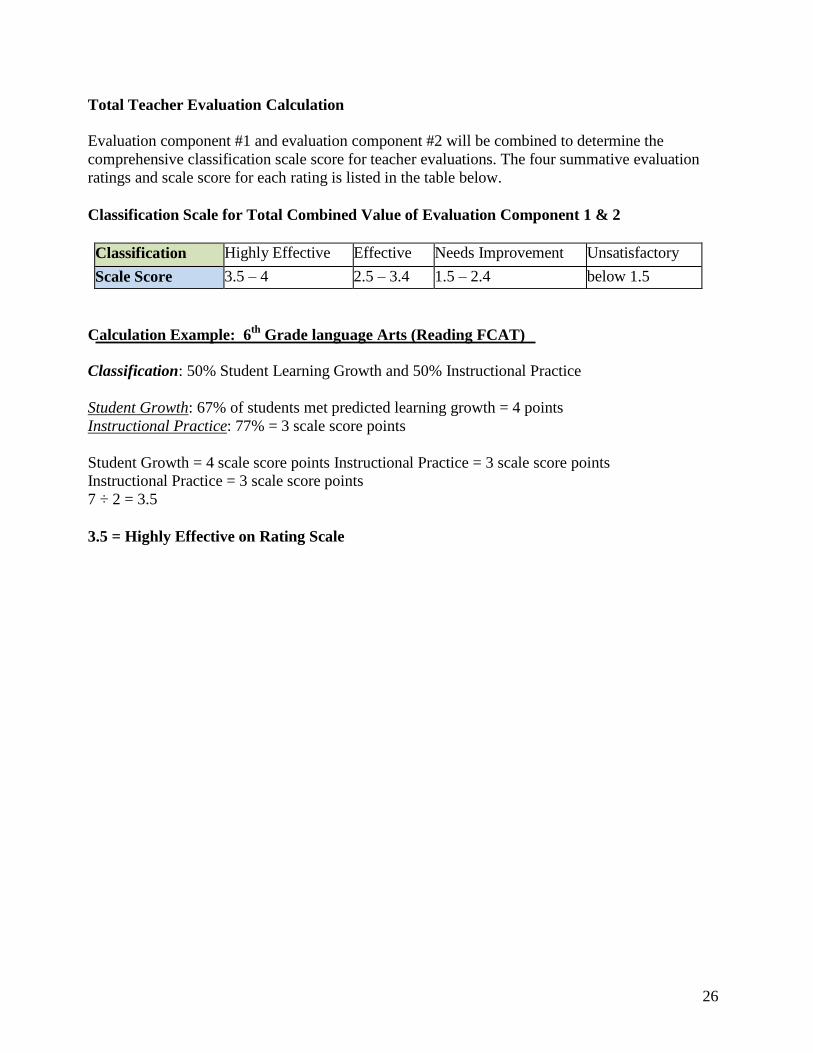
Total Teacher Evaluation Calculation
Evaluation component #1 and evaluation component #2 will be combined to determine the
comprehensive classification scale score for teacher evaluations. The four summative evaluation
ratings and scale score for each rating is listed in the table below.
Classification Scale for Total Combined Value of Evaluation Component 1 & 2
Classification Highly Effective Effective Needs Improvement Unsatisfactory
Scale Score 3.5 – 4 2.5 – 3.4 1.5 – 2.4 below 1.5
Calculation Example: 6th
Grade language Arts (Reading FCAT)
Classification: 50% Student Learning Growth and 50% Instructional Practice
Student Growth: 67% of students met predicted learning growth = 4 points
Instructional Practice: 77% = 3 scale score points
Student Growth = 4 scale score points Instructional Practice = 3 scale score points
Instructional Practice = 3 scale score points
7 ÷ 2 = 3.5
3.5 = Highly Effective on Rating Scale