Embed Size (px)
Citation preview

Nikolenko et al., p. 1
1
Submitted to Methods, 11.11.02
A custom two-photon and second-harmonic microscope
Volodymyr Nikolenko, Boaz Nemet and Rafael Yuste.
Dept. of Biological Sciences, Columbia University, New York, NY 10027
Running title: Building a two-photon/SHG microscope Address correspondence to: Volodymyr Nikolenko Dept. Biological Sciences Columbia University 1212 Amsterdam Avenue, Box 2435 New York, NY 10027 (212) 854-5023 phone (212) 865-8246 fax vn59@ columbia.edu

Nikolenko et al., p. 2
2
Abstract
The introduction of two-photon microscopy has revolutionized life sciences
by enabling long-term imaging of living preparations in highly scattering tissue
while minimizing photodamage. At the same time, commercial two-photon
microscopes are expensive and this has prevented the widespread distribution of
this technique to the biological community. As an alternative to commercial
systems, we provide an update of our efforts designing custom-built two-photon
instruments by modifying the Olympus Fluoview laser scanning confocal
microscope. With the newer version of our instrument we modulate the intensity of
the laser beam using a Pockel’s cell in arbitrary spatiotemporal patterns, perform
simultaneous optical imaging and optical stimulation experiments and also can
combine them with second harmonic generation measurements.
Keywords: GFP, Imaging, Pockels, Uncaging

Nikolenko et al., p. 3
3
Introduction
The introduction of two-photon excitation [1] to life sciences has opened novel
experimental territories [2]. Two-photon excitation occurs when two low-energy photons
are simultaneously absorbed by a molecule in the ground state, resulting in a similar
excitation to that produced by a single high-energy photon [3]. This process has
important consequences for microscopy because it enables fluorescence with infrared
excitation light, which can penetrate without major scatter through living tissue [4]. In
addition, the non-linear reaction confines the excitation essentially to the focal point [1],
thus effectively solving a major problem in optical microscopy, that of out of focus
excitation. These improvements of two-photon excitation over conventional fluorescence
microscopy have proven to be of great practical advantages: two-photon microscopy have
enable, among other things, physiological analysis of dendritic spines [5, 6] and direct
functional mapping of synaptic receptors [7] or channels [8] on living neurons in brain
slices.
The spread of two-photon microscopy, however, has been hampered by the high
costs associated with commercially available two-photon systems. As a solution to this,
over the last seven years our laboratory has designed and built two-photon microscopes
based on modifying relatively low-cost confocal systems. We find that this strikes a good
compromise between cost, flexibility and ease of engineering the system. In a previous
publication we describe in detail our initial design of a custom-build two-photon
microscope based on the Olympus FLUOVIEW scanning system [9]. The large interest
generated by this first publication in the neuroscience community has stimulated us to
provide an update to the modifications and further improvements of our system, so that
other investigators can also profit from them. In this manuscript, we specifically describe
Nikolenko et al., p. 4
4
how we have implemented the control of the beam positioning and intensity which is
essential for fast imaging or photostimulation experiments, as well as the modifications
of the microscope to enable the simultaneous measurement of second-harmonic
generation (SHG) [10, 11], a novel non-linear microscopy technique which could have
major implications for life sciences.
Description of the system-
Our current instrument consists of two commercial lasers, an external light path, a
scanning head and an optical microscope (Figure 1). We proceed to describe in detail
each part of it and the rationale behind each of our choices in design.
Laser and laser diagnostics
The lasers we are currently using are the Mira 900 basic – tunable Ti: Sapphire
lasers from Coherent pumped by 5-W solid-state pump lasers (Verdi, Coherent) as
described in previous publication [9]. As beam diagnostic devices we use a spectrum
analyzer (Rees) and a power meter (Powermax 500A from Molectron, Portland OR; or
FieldMaster with LM-1 detector head from Coherent). In previous publication [9] it was
described that a coverslip reflects a small portion of the beam (<2 mW) at its exit from
the cavity and sends it into the Rees for analysis. We found that it is not an optimal
solution because the glass coverslip distorts the beam. Instead, we placed the detector of
Rees spectrum analyzer inside the Mira module, replacing the internal fast photodiode
originally designed by Coherent for detection of mode-locking. A high-quality
semitransparent mirror deflects small portion of the beam to Rees.
Nikolenko et al., p. 5
5
These two instruments (power meter and spectrum analyzer) proved to be
sufficient for proper alignment of laser cavity, maintaining mode locking, tuning the
wavelength and determining approximate pulse durations.
Modifications of optical pathway before scanning unit
In our new system, it became necessary to modify the laser excitation pathway
since we found that the laser beam, in reaching the back aperture of the objective, was
not collimated (the Olympus BX50WI microscope is designed for infinity corrected
objective lens). We diagnosed this problem by monitoring the beam profile at different
points in the light path with a WM100 Omega Meter from Thorlabs (Newton, NJ). The
lack of collimation is probably caused by incompatibility of our BX50WI upright
microscope with the modified FLUOVIEW scanning head. This problem theoretically
can be solved by moving the pupil transfer lens (a complex lens right after the scanning
mirrors – see beam path on Figure 2) but we found that the available range of movement
was not large enough to correct the problem.
As an alternative solution, we used a system of additional lenses – a simple
telescope of two plano-convex lenses - to make the beam divergent before the scanning
mirrors and thus compensate for the strong convergence in the microscope between the
tube lens and objective lens (Figure 2). In practice this is achieved with our external
telescope by adjusting it to make the beam slightly convergent such that it comes to a
focus before the scanning mirrors, and then starts to diverge. Special attention must be
paid to ensure that the beam is not focused on the surface of one of the intermediate
optical elements, like dielectric mirrors and filters, since intense focused laser light can
damage their coating.
Nikolenko et al., p. 6
6
Our external lens optical system was designed to easily allow the adjustment of
laser beam before objective. We not only ensure its collimation but also its appropriate
size by choosing the magnification of the telescope to slightly overfill the back aperture
of the objective lens. This is necessary for carefully designed optical system for laser
scanning microscopy: to ensure that the system uses all the possible numerical aperture
of the objective lens, and thus achieving diffraction limited spot size at the object plane,
which is important for the highest optical resolution. This also minimizes the power loss
of laser light and provides minimal variations in the power of the excitation light across
the image during scanning [12].
Our system of correction of laser beam before scanning head also performs the
function of a spatial filter: it is a system of two lenses and pinhole. The pinhole is placed
at the focal plane of the first lens. This spatial filter is a convenient way to remove
random spatial deviations from the intensity profile of a Gaussian laser beam, which are
picked up by scattering from optical defects and particles in air [13]; See ‘spatial filter’
section in Mells Griot or Newport catalog for practical choice of components -
http://www.newport.com/store/xq/ASP/lone.Optics/ltwo.Technical+Reference/lthree.Spa
tial+Filters/lfour./id.3873/lang.1/qx/product.htm). The beam, after passing the pinhole,
has a smooth intensity profile and, in addition, any pointing fluctuations in its direction
are removed. This comes at the expense of reduced laser power (~10% loss), which is not
a major problem since for most practical cases of two-photon microscopy we do not use
the laser at full power but rather use a neutral density filter to reduce power. It therefore
provides the best beam conditions for laser scanning microscopy and improves the image
quality. In addition, the spatial coherence of the beam (the phase distribution along the

Nikolenko et al., p. 7
7
beam cross section) is restored, which is important for second harmonic generation
microscopy (see below).
The scanning head and beam pathway
We used a modified FLUOVIEW confocal unit, which we find ideal for conversion to
two-photon microscopy [9]. It has a simple beam path, is easy to align and the unit is
fully accessible, making it easy to modify without disturbing essential components. A full
description of our scanning head modifications is found in [9]. Briefly, the minimal
modifications for its conversion to two-photon microscopy are:
1. The side panel in the laser input port has to be removed and a hole drilled into the
casing to accommodate the beam from Ti-Sapphire laser without clipping.
2. The entrance dichroic should be removed completely in order to allow the beam
to enter the body of the confocal box.
3. In the case of using an external photomultiplier tube (PMT) in whole-area
detection configuration (see below) the second dichroic has to be changed to a
regular mirror of appropriate size or another dichroic with good reflectivity in
near IR to allow the beam to be reflected onto the galvanometers.
A description of the light path follows (Figure 2). After entering the confocal box
through the drilled hole, the laser beam encounters a shutter, under control from the
FLUOVIEW software, which prevents the laser from entering the microscope when the
unit is not scanning. The galvanometers scan the beam into the upright microscope
(BX50WI, Olympus) through a pupil transfer lens. In order to increase the power
throughput of the unit, the pupil transfer lens was substituted with a lens that has high
transmission in the IR (available from Olympus). Another dichroic (Chroma Inc.;

Nikolenko et al., p. 8
8
650DCSP which reflects IR and transmits 95% between 425 nm and 640 nm) inside the
trinocular head then directs the beam downward towards the sample through the
microscope tube lens and objective. The visible fluorescent light returns back from the
sample through the objective and microscope tube lens and then is transmitted to an
external PMT by the same dichroic in the trinocular head. Additional IR blocking filters
(BG39 from Chroma Inc. or similar – see [9]) are placed in front of the external detector
(PMT).
PMTs
In our previous study [9] we report the major improvement in the signal using
external PMTs, which we use routinely. For the common applications of two-photon
fluorescence imaging we use this external PMT in whole-area detection configuration, by
mounting it to the camera port of the trinocular head of our Olympus BX50WI upright
microscope. The signal to noise ratio can be additionally increased by placing detector
right after objective with special holder [9] but this configuration is not very convenient
for everyday work because of its position. We use it only in special cases that require
very high sensitivity or simultaneous PMT/camera imaging with a CCD camera attached
to camera port usually occupied by external PMT. The PMT that we prefer is the HC125-
02 (Hamamatsu). It is a self-contained assembly of a head-on bi-alkali PMT with
wideband amplifier (bandwidth 8MHz) and a high voltage power supply. Although this is
useful as it avoids the necessity for the user to deal with high voltages, it requires a
custom-made low voltage power supply. Our custom-made power supply allows the
regulation of the bias voltage of the PMT by changing the position of knob of the
variable resistor.
Nikolenko et al., p. 9
9
We found that the uncorrelated dark noise of the HC125-02 PMT (primarily of
thermal origin) has a strong dependence on the applied bias voltage (see Figure 3C). It is
therefore important to correctly choose the bias voltage in order to balance the resulting
gain of the PMT versus noise. In most cases, the normal charge of PMT is ~750V, but it
is possible to increase bias voltage of PMT if active methods of averaging are used, such
as Kalman filtering available in standard FLUOVIEW software package.
Care must be taken to ensure that the external PMT is compatible with the
FLUOVIEW hardware and software as it was described earlier [9] by introducing an
additional custom made signal amplifier, which is absolutely necessary for the correct
detection of low light intensity signals (see Figure 3A and 3B for available dynamic
range of FLUOVIEW hardware input signals). It is worth mentioning that this
intermediate amplifier requires a battery power supply, because available power supplies
working with AC power usually introduce additional noise.
Direct software control over Olympus FLUOVIEW
To gain flexibility in the scanning, we have created a program that interfaces with
the FLUOVIEW software, by taken advantage of the Olympus application note
“Restricted-Area Laser Scanning” which describes how to control the FLUOVIEW
software in order to expose small selected regions of a specimen to laser light. This
application note is the first phase of direct programmatic control of FLUOVIEW
functions and initially was designed to provide an example of how to scan an image,
target an area, expose it to light, and then scan again to measure visible results. But in
practice this note explains how to obtain control and gain direct program access to the
FLUOVIEW functions. This note and its accompanying sample software described how
Nikolenko et al., p. 10
10
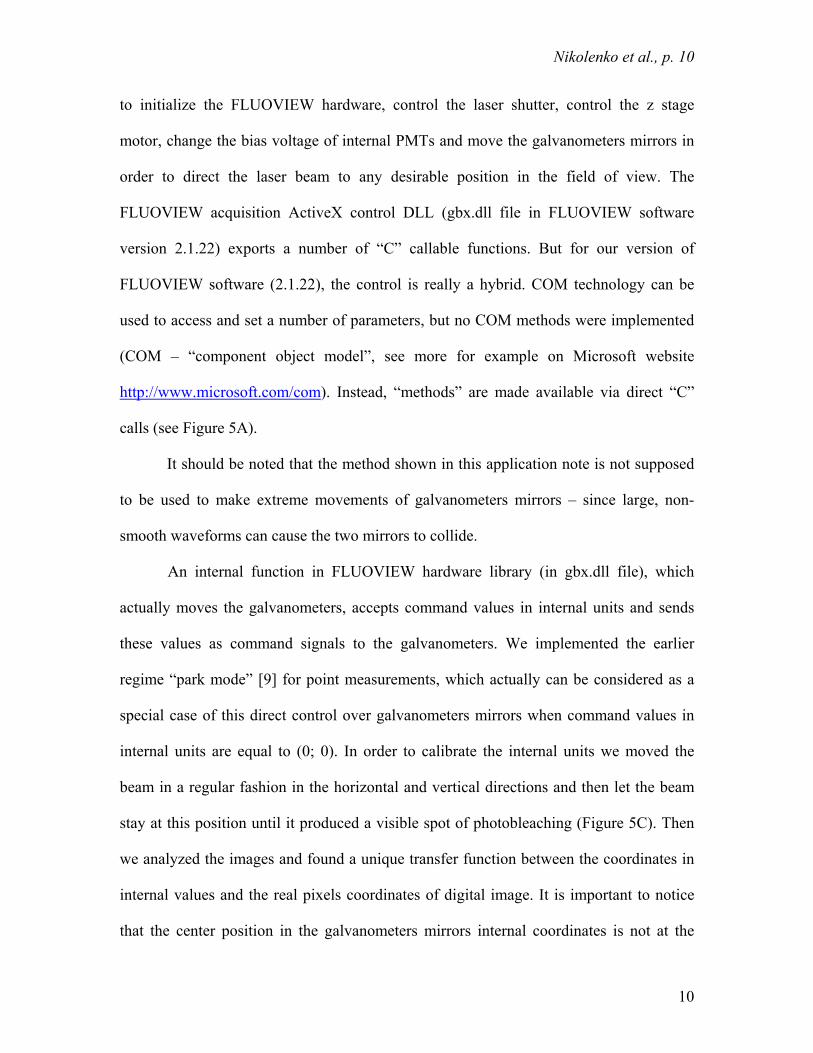
to initialize the FLUOVIEW hardware, control the laser shutter, control the z stage
motor, change the bias voltage of internal PMTs and move the galvanometers mirrors in
order to direct the laser beam to any desirable position in the field of view. The
FLUOVIEW acquisition ActiveX control DLL (gbx.dll file in FLUOVIEW software
version 2.1.22) exports a number of “C” callable functions. But for our version of
FLUOVIEW software (2.1.22), the control is really a hybrid. COM technology can be
used to access and set a number of parameters, but no COM methods were implemented
(COM – “component object model”, see more for example on Microsoft website
http://www.microsoft.com/com). Instead, “methods” are made available via direct “C”
calls (see Figure 5A).
It should be noted that the method shown in this application note is not supposed
to be used to make extreme movements of galvanometers mirrors – since large, non-
smooth waveforms can cause the two mirrors to collide.
An internal function in FLUOVIEW hardware library (in gbx.dll file), which
actually moves the galvanometers, accepts command values in internal units and sends
these values as command signals to the galvanometers. We implemented the earlier
regime “park mode” [9] for point measurements, which actually can be considered as a
special case of this direct control over galvanometers mirrors when command values in
internal units are equal to (0; 0). In order to calibrate the internal units we moved the
beam in a regular fashion in the horizontal and vertical directions and then let the beam
stay at this position until it produced a visible spot of photobleaching (Figure 5C). Then
we analyzed the images and found a unique transfer function between the coordinates in
internal values and the real pixels coordinates of digital image. It is important to notice
that the center position in the galvanometers mirrors internal coordinates is not at the

Nikolenko et al., p. 11
11
geometrical center of digital image: for 800x600 scanning mode, the coordinates (0; 0) in
internal units translates to coordinates ~(350,300) in the digital image, mainly because
the sampling period for each line (region of linear movement) starts not far from the left
edge.
The simplest forms of direct control of the FLUOVIEW hardware by the manual
modification file gbscasn.ini (regime “Park Mode”) and direct calls of hardware
functions from gbx.dll by sample software has been used extensively for fluorescence
measurements with microsecond time resolution ([14, 15]; Mansvelder and Yuste,
unpublished observations). However, to reach a higher degree of control, we created our
custom software for direct access to FLUOVIEW hardware functions by using
LabViewTM graphical programming interface (National Instruments, Austin, TX), which
combines low-level programming tools with simplicity of development application with
convenient user interface (Figures 5B and 5D). We should mention that this kind of
custom software can be created by using any modern programming language which
supports direct “C”-calls or COM technology in general such as C++, Visual Basic, etc.
Basic and Advanced versions of custom software and Windows scripting
Our initial version of this software (“basic version”, Figure 5B) gives full access
to the following hardware functions of our FLUOVIEW system: move z-motor,
lock/unlock fine focus manipulator, open/close shutter, move galvanometers mirrors with
maximum available accuracy to direct laser beam to any desirable point on the pre-
scanned image pointed by cursor or even to track beam cursor movement over the image
in real time. This version is fully functional for point measurements of fluorescence
or/and SHG signals.
Nikolenko et al., p. 12
12
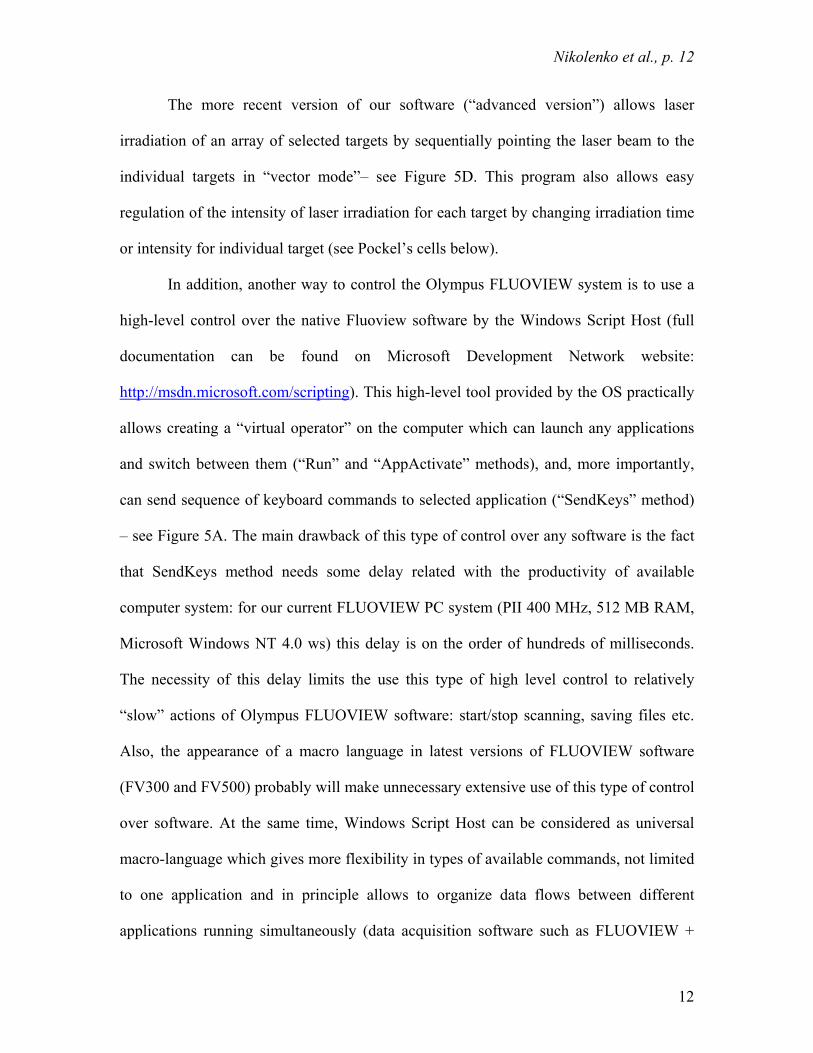
The more recent version of our software (“advanced version”) allows laser
irradiation of an array of selected targets by sequentially pointing the laser beam to the
individual targets in “vector mode”– see Figure 5D. This program also allows easy
regulation of the intensity of laser irradiation for each target by changing irradiation time
or intensity for individual target (see Pockel’s cells below).
In addition, another way to control the Olympus FLUOVIEW system is to use a
high-level control over the native Fluoview software by the Windows Script Host (full
documentation can be found on Microsoft Development Network website:
http://msdn.microsoft.com/scripting). This high-level tool provided by the OS practically
allows creating a “virtual operator” on the computer which can launch any applications
and switch between them (“Run” and “AppActivate” methods), and, more importantly,
can send sequence of keyboard commands to selected application (“SendKeys” method)
– see Figure 5A. The main drawback of this type of control over any software is the fact
that SendKeys method needs some delay related with the productivity of available
computer system: for our current FLUOVIEW PC system (PII 400 MHz, 512 MB RAM,
Microsoft Windows NT 4.0 ws) this delay is on the order of hundreds of milliseconds.
The necessity of this delay limits the use this type of high level control to relatively
“slow” actions of Olympus FLUOVIEW software: start/stop scanning, saving files etc.
Also, the appearance of a macro language in latest versions of FLUOVIEW software
(FV300 and FV500) probably will make unnecessary extensive use of this type of control
over software. At the same time, Windows Script Host can be considered as universal
macro-language which gives more flexibility in types of available commands, not limited
to one application and in principle allows to organize data flows between different
applications running simultaneously (data acquisition software such as FLUOVIEW +
Nikolenko et al., p. 13
13
data processing software such as ImageJ (http://rsb.info.nih.gov/ij/) or Matlab
(MathWorks, Inc., Natick, MA) – software packages widely used for off-line data
processing in our group).
Pockel’s cell
We extensively use a Pockel’s cell – an electro-optical modulator [9], as a fast
neutral density filter for the dynamic regulation of laser light intensity. The original
model (Pockel’s cell model 350-50 and high-voltage driver model 302 from Conoptics
Inc., Danbury CT) gave us limited flexibility in wavelength and bandwidth. Recently, we
obtained a newer model of the Pockel’s cell (model 327) and high-voltage driver (model
3030C) from Quantum Technology, Inc. (Lake Mary, FL) which allows modulation laser
light intensity with 0.1 µs time resolution and maximum contrast ratio as good as 600:1.
A Pockel’s cell is probably the best choice for modulation of pulsed femtosecond lasers
used in non-linear optical microscopy (multi-photon fluorescence (MPF), second-
harmonic generation (SHG), coherent anti-stokes Raman microscopy (CARS), etc.
Another solution, which is the one implemented by Olympus in the latest versions of
FLUOVIEW confocal laser scanning systems, is to use an acousto-optical tunable filter
(AOTF) [16]. Nevertheless, an AOTF has limited use as fast modulator/deflector for
near-infrared femtosecond pulsed lasers because of significant pulse broadening,
although it can be compensated at least partially by introducing of additional optics in
laser pathway, albeit at the expense of laser power [17].
In simplest case, we use a Pockel’s cell in everyday work, when our system works
in a regular scanning regime, for blocking the laser beam in “flyback movement” –
because the system does not collect data but the sample is irradiated [9]. This flyback

Nikolenko et al., p. 14
14
time accounts for ~40% of the scanning time, so blocking the laser during flyback allows
to increase the average irradiation power (and thus obtain a better fluorescence signal to
noise ratio) without increasing the average level of photodamage and photobleaching. For
conventional, single photon laser scanning microscopes, this flyback problem can be
corrected with AOTFs but again, this is not practical for pulsed femtosecond lasers,
necessary for two-photon excitation. Another solution is the bi-directional scanning
mode, in which data is also collected during flyback. Bidirectional scanning, available in
the latest versions of Olympus FLUOVIEW, leads to a two-fold improvement in the time
resolution, but also produces a degraded spatial resolution and is generally not
recommended for imaging of fine structures (Yiwei Jia, personal communication). Also,
most custom-made laser scanning microscopes [12], use unidirectional X-scanning for
simplification of adjusting parameters of moving in Y-axis.
Laser light was blocked during flyback by using a Master 8 stimulator (A.M.P.I.,
Jerusalem, Israel) – a computer-independent, RS232 programmable externally triggerable
square pulse generator, which was synchronized with scanning by FLUOVIEW
generated TTL pulses (“line active”) corresponding to regions of sampling in each line
[9]. We find that these TTL synchronization pulses cannot be used directly for
modulating of Pockel’s cell because of the incorrect length of the pulses in case of 2-
channel data acquisition and because of the impedance mismatch between the TTL
output of the FLUOVIEW hardware and the signal input of the Pockel’s cell driver. Also,
the use of external square-pulses generator of adjustable amplitude provides a lot of
flexibility in the use of the Pockel’s cell.
Nikolenko et al., p. 15
15
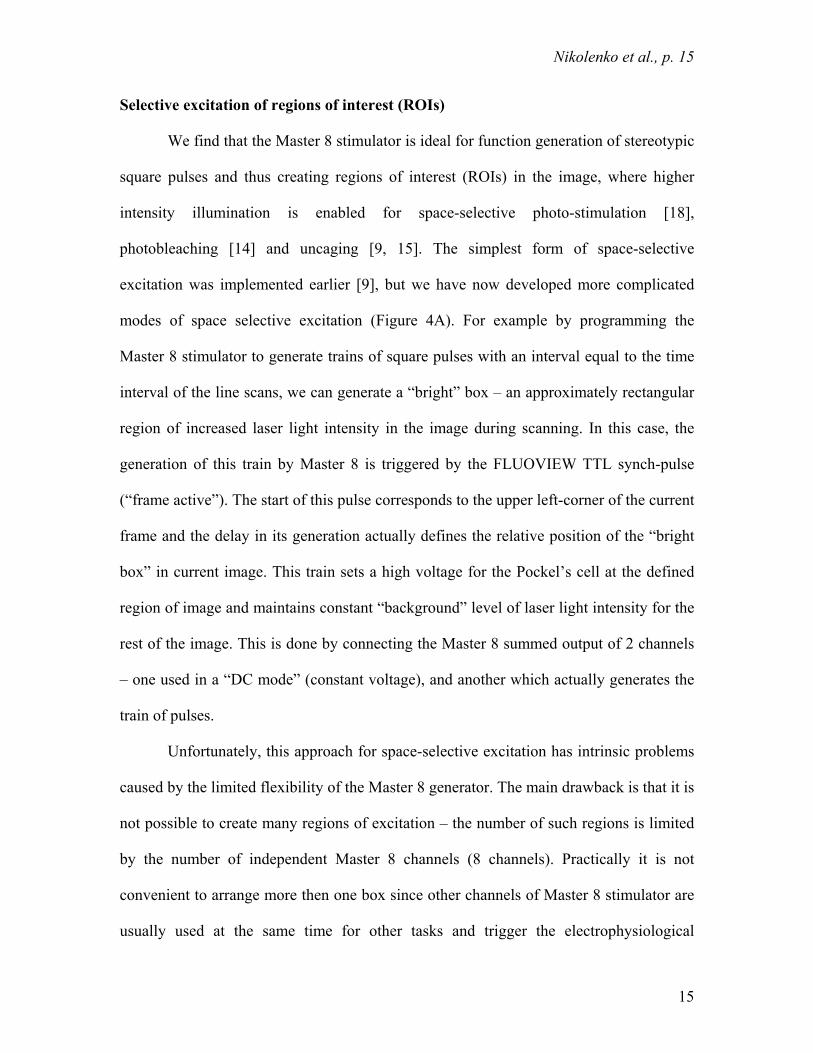
Selective excitation of regions of interest (ROIs)
We find that the Master 8 stimulator is ideal for function generation of stereotypic
square pulses and thus creating regions of interest (ROIs) in the image, where higher
intensity illumination is enabled for space-selective photo-stimulation [18],
photobleaching [14] and uncaging [9, 15]. The simplest form of space-selective
excitation was implemented earlier [9], but we have now developed more complicated
modes of space selective excitation (Figure 4A). For example by programming the
Master 8 stimulator to generate trains of square pulses with an interval equal to the time
interval of the line scans, we can generate a “bright” box – an approximately rectangular
region of increased laser light intensity in the image during scanning. In this case, the
generation of this train by Master 8 is triggered by the FLUOVIEW TTL synch-pulse
(“frame active”). The start of this pulse corresponds to the upper left-corner of the current
frame and the delay in its generation actually defines the relative position of the “bright
box” in current image. This train sets a high voltage for the Pockel’s cell at the defined
region of image and maintains constant “background” level of laser light intensity for the
rest of the image. This is done by connecting the Master 8 summed output of 2 channels
– one used in a “DC mode” (constant voltage), and another which actually generates the
train of pulses.
Unfortunately, this approach for space-selective excitation has intrinsic problems
caused by the limited flexibility of the Master 8 generator. The main drawback is that it is
not possible to create many regions of excitation – the number of such regions is limited
by the number of independent Master 8 channels (8 channels). Practically it is not
convenient to arrange more then one box since other channels of Master 8 stimulator are
usually used at the same time for other tasks and trigger the electrophysiological

Nikolenko et al., p. 16
16
protocols. Also, the numerical parameters of “boxes” such as size and position cannot be
precisely adjusted because the Master 8 has only 4-digits precision for the numerical
parameters of pulses. This is not enough precision to define the interval in pulses train to
generate a perfectly rectangular box, or to create a box at the arbitrary part of the image.
Although the last problem can be solved by using additional independent channel of
Master 8 stimulator, in practice this limits the freedom to arrange “bright boxes” at any
desirable part of image. Finally, the Master 8 stimulator cannot be reprogrammed very
fast, because it uses a serial RS232 interface and sending command takes some time
limited by the bandwidth of the RS232 standard.
To solve these problems, a generic data acquisition board with buffer memory and
externally triggered output can be used for the purpose of creating any appropriate
waveform synchronized with FLUOVIEW “scan active” signal. We have used PCI-
6052E data acquisition board from National Instruments (Austin, TX). By programming
appropriate waveform as command for the electro-optical modulator it is possible to
create any arbitrary distribution of light intensity at the image. Custom written software
(“advanced version”) in simplest case allows defining the set of arbitrary placed “boxes”
of increased light intensity at the image for space-selective excitation (Figure 4B) –
“raster mode” of selective excitation.
Second harmonic generation (SHG) microscopy
The Olympus Fluoview/BX50WI microscope can also be modified with a
minimum amount of effort to have the capability to acquire images of SHG, either from
special chromophores [11, 19] [20] et al 2001, Kobayashi et al 2002) or from endogenous
structures in biological tissue such as oriented collagen fibers [21]. SHG, which like two-
Nikolenko et al., p. 17
17
photon fluorescence is a nonlinear optical effect, is gaining recognition as an important
mode of microscopy that allows researchers to probe biological cell’s trans-membrane
potential [10] and monitor the electrical activity of nerve cells [22, 23]. Unlike
fluorescence, in which emitted photons are best detected with epi-illumination, SHG
photons, which result from coherent scattering, are best detected in the transmission path
of the microscope. One might think of the process in a simplistic picture as the partial
conversion of the stimulating light (the IR beam) into an electromagnetic wave at twice
the incident frequency (half the wavelength) with a similar bandwidth (actually times
√2). The SHG photons, generated at the focal spot of the laser in the sample, are collected
by the condenser lens which has to be of equal or greater numerical aperture (NA) than
the objective lens NA in order to collect the whole cone of light. This is important since
the SHG radiation in the forward direction is restricted to certain off-axis angles [20]. We
used the Olympus Aplanat Achromat oil immersion condenser with a variable NA of up
to 1.4 (one does not have to use the oil for NA values of less than 1). A PMT
(Hamamatsu HC125-05) with the appropriate (blue) filter was placed in the auxiliary port
(see schematic Figures 1b and 2) instead of the diffuser and fiber bundle, originally
designed for imaging DIC in transmission mode in the FLUOVIEW confocal scanner. By
moving a handle connected to a mirror (part of the original microscope) the user can
choose to engage the path either for bright field illumination (with the white light lamp)
as is usually done when viewing the sample through the eye-piece, or for SHG (in which
case the PMT is switched on and the lamp should be switched off or at least turned down
in order not to saturate the PMT that is placed just beyond the mirror).
The SHG filter is chosen according to the operating wavelength. For instance, for
an operating wavelength of 840nm an interference filter centered at 420nm with a band
Nikolenko et al., p. 18
18
of 20nm appears a good choice. One needs to ensure that the filter is fully blocked in the
IR. The narrower the bandwidth of this filter, the less susceptible it is to noise from
ambient light or residual two-photon fluorescence. However, since the light is directed to
the PMT by the condenser lens, any room light which contains blue light will be detected
and hinder the experiment by adding noise. Therefore one must darken the room lighting
when performing SHG microscopy with this type of detection, or alternatively optically
isolate the microscope by other means. Finally, since two channels can be detected
simultaneously by the FLUOVIEW hardware, two-photon and SHG images can be
acquired and displayed as a composite image by the FLUOVIEW native software. Figure
6 is an example of such a composite image, which shows two live C. elegans nematodes
expressing a YFP (yellow fluorescent protein) tagged mec4 protein (mec4::YFP), where
the SHG signal comes presumably from the muscle (blue) and the two-photon
fluorescence (green) is an auto-fluorescence from endogenous granules in the intestines
of the worm as well as the YFP signal - a central green spot in the upper nematode,
emitted from a neuron expressing the mec4 protein (the anterior part of the upper worm is
towards the right and of the lower one is towards the left. The worms were paralyzed by
Levamisole prior to taking the image. The blue and green colors are pseudo-colors to
distinguish the two separate channels). Note how, although both SHG and TPEF signals
come from the same location of the laser spot at the same time during the scanning, they
do not overlap and show different structures –for example the YFP does not produce
SHG signal. The laser power needed in this case to show this intrinsic SHG signal was
quite high compared to the power used with bright fluorescent dyes - 270mw before the
scanning head at 870nm with 1x digital zoom and a 40x water immersion objective lens
0.8 NA. Finally, the SHG signal is strongly dependent on the state of polarization of the

Nikolenko et al., p. 19
19
laser light and the orientation of the dipole moment in the molecules that interact with
that light. It is therefore advantageous to be able to control the laser state of polarization,
for example in order to determine molecular orientation, or to maximize SHG. We
therefore chose to add a retardation plate (half and/or quarter wave plates depending on
the type of experiment one does) at the position 11c shown in figure 2 where the laser
beam is fairly collimated.
Summary
In this work we provide an update on the modification of our two-photon
microscope since the Majewska et al. publication [9]. The major improvements are
spatial filtering and refocusing of the incident laser beam, direct control of the scanners
via custom-made software to enable imaging or photostimulation of any arbitrary number
of ROIs and, finally, implementation of SHG imaging. This system is flexible and can be
easily used for many different type of experiments and does not require large expenses,
other than those associated with the laser system.
Acknowledgments
We thank members of the laboratory and Hajime Hirase for their help; Kenji
Matsuba and Yiwei Jia from Olympus USA for FLUOVIEW documentation; Huibert
Mansvelder for his point measurements; Robert O’Hagan, Dattananda Chelur and Martin
Chalfie for supplying the worm samples; and Lesley Loew and Aaron Lewis for
encouragement to explore SHG. This work was supported by the Merck Fund, the NEI

Nikolenko et al., p. 20
20
(EY 111787 and EY13237) and the NINDS (NS40726). Email request for the software
components to [email protected]
Nikolenko et al., p. 21
21
References
1. Denk, W., J.H. Strickler, and W.W. Webb, Two-photon laser scanning
fluorescence microscopy. Science, 1990. 248: p. 73-76.
2. Denk, W., et al., Anatomical and functional imaging of neurons using 2-photon
laser scanning microscopy. J. Neurosci. Meth., 1994. 54: p. 151-162.
3. Goeppert-Mayer, M., Ueber Elementareakte mit zwei Quantensprungen. Ann. der
Physik, 1931. 9: p. 273-283.
4. Svaaland, L.O. and R. Ellingsen, Optical properties of human brain. Photochem.
and Photobiol., 1983. 38(3): p. 293-299.
5. Yuste, R. and W. Denk, Dendritic spines as basic units of synaptic integration.
Nature, 1995. 375(22 jun): p. 682-684.
6. Yuste, R., A. Majewska, and K. Holthoff, From form to function: calcium
compartmentalization in dendritic spines. Nature Neurosci., 2000. 3(7): p. 653 -
659.
7. Matsuzaki, M., et al., Dendritic spine geometry is critical for AMPA receptor
expression in hippocampal CA1 pyramidal neurons. Nat Neurosci, 2001. 4(11): p.
1086-92.
8. Sabatini, B.L. and K. Svoboda, Analysis of calcium channels in single spines
using optical fluctuation analysis. Nature, 2000. 408(6812): p. 589-93.
9. Majewska, A., G. Yiu, and R. Yuste, A custom-made two-photon microscope and
deconvolution system. Pflügers Archiv - Eur. J. Physiol., 2000. 441(2-3): p. 398-
409.
10. Lewis, A., et al., Second Harmonic Generation of Biological Interfaces: Probing
Membrane Proteins and Imaging Membrane Potential Around GFP Molecules at
Nikolenko et al., p. 22
22
Specific Sites in Neuronal Cells of C. elegans. Chemical Physics, 1999. 245: p.
133-144.
11. Campagnola, P.J., et al., Second-harmonic imaging microscopy of living cells. J
Biomed Opt, 2001. 6(3): p. 277-86.
12. Tsai, P.S., et al., Principles, design and constructionof a two-photon laser
scanning microscope for in vitro and invivo brain imaging., in Methods for in
vivo optical imaging., R. Frostig, Editor. 2002, CRC Press: New York. p. (in
press).
13. Fowles, G.R., Introduction to modern optics. 2nd Edition ed. 1968, New York,:
Dover Publications.
14. Majewska, A., et al., Mechanisms of Calcium Decay Kinetics in Hippocampal
Spines: Role of Spine Calcium Pumps and Calcium Diffusion through the Spine
Neck in Biochemical Compartmentalization. J Neurosci, 2000. 20(5): p. 1722-
1734.
15. Majewska, A., A. Tashiro, and R. Yuste, Regulation of spine calcium
compartmentalization by rapid spine motility. J. Neurosci., 2000. 20: p. 8262-
8268.
16. Wachman, E., AOTFs for Microscopy, in Imaging Neurons: a laboratory manual,
R. Yuste, F. Lanni, and A. Konnerth, Editors. 2000, Cold Spring Harbor Press:
Cold Spring Harbor. p. 4.1-8.
17. Ng, M., et al., Transmission of Olfactory Information between Three Populations
of Neurons in the Antennal Lobe of the Fly. Neuron, 2002. 36(3): p. 463-74.
18. Hirase, H., et al., Multiphoton stimulation of neurons. J Neurobiol, 2002. 51(3): p.
237-47.
Nikolenko et al., p. 23
23
19. Campagnola, P.J., et al., High-resolution nonlinear optical imaging of live cells
by second harmonic generation. Biophys J, 1999. 77(6): p. 3341-9.
20. Moreaux, L., et al., Coherent scattering in multi-harmonic light microscopy.
Biophys J, 2001. 80(3): p. 1568-74.
21. Campagnola, P.J., et al., Three-dimensional high-resolution second-harmonic
generation imaging of endogenous structural proteins in biological tissues.
Biophys J, 2002. 82(1 Pt 1): p. 493-508.
22. Peleg, G., et al., Nonlinear optical measurement of membrane potential around
single molecules at selected cellular sites. Proc Natl Acad Sci U S A, 1999.
96(12): p. 6700-4.
23. Bouevitch, O., et al., Probing membrane potential with nonlinear optics. Biophys
J, 1993. 65(2): p. 672-9.
24. Yuste, R., Loading populations neurons in slices with AM calcium indicators, in
Imaging Neurons: a laboratory manual, R. Yuste, F. Lanni, and A. Konnerth, Editors.
2000, Cold Spring Harbor Press: Cold Spring Harbor. p. 34.1-34.9.
Nikolenko et al., p. 24
24
Figures Legends:
Figure 1: Diagram of the instrument and part list
A: Recent photograph of our setup, showing the basic features of beam pathway. Part
numbers of elements used in the beam path between laser and confocal unit. (Neat New
England Affiliated Technologies, NF New Focus, NP Newport, S&H Spindler and
Hoyer, Th Thorlabs, Ch Coherent Inc., QT Quantum Technology, Inc.
1. “Verdi” pumping laser, Ch
2. Mira 900-F Ti:Sapphire femtosecond pulsed laser, Ch
3. Dielectric mirrors (10B20UF.25 ultrafast broadband 45 degrees mirrors, NP)
mounted on combination of following components: mirror mounts: Th KM1 or NF
9891 (NF mirror mounts can be flipped); post: Th TR-2; post holder: Th PH2-ST;
base: Th BA1 (more flexible bases are available but more expensive: NF 9910+NF
9909).
4. Polarizer (05FC16PB.5 polarizing cube beam splitter, NP) mounted on (KM-PM, Th)
prism platform with (PM1 Th) mounting hardware; post: Th TR-2; post holder: Th
PH2-ST; base: Th BA1.
5. Pockel’s cell (Model 327 with 19GLE polarizer installed at end of modulator, QT)
mounted on holder (MTM-1000 QT)
6. Pockel’s cell high-voltage driver (Model 3030C QT)
7. Custom made block for fine adjustment of Pockel’s cell driver input signal
8. Spectrum analyzer and oscilloscope of spectrum analyzer (Rees optical spectrum
analyzer). Detector of spectrum analyzer is not visible – it is placed inside the Mira
unit. Instead of the fast photodiode provided by Coherent, we use a semi-transparent

Nikolenko et al., p. 25
25
mirror which deflects small portion of output laser light to this detector without
distortion of beam.
9. Laser light power meter (FieldMaster with LM-1 detector head Ch)
10. Fast photodiode (DET110 Si PIN detector, Th) mounted to MB175 magnetic base
(Th) – used for diagnostics
11. Beam expander/contractor and spatial filter and (all components are from Thorlabs):
a. Two coated plano-convex lenses (LA1131-B AR and LA1134-B AR) mounted to
Z-translators (SM1Z) by SM1L05 lens tube and SM1 retaining rings
b. Pinhole (P50S) mounted to XY translator with micrometer drives (ST1XY-S) and
pinhole mounting cell (SM1L03)
c. Half-wave plate (WPH05M-830, zero order) mounted to rotational mount
(CRM1) – for certain experiments we also used quarter-wave plate (WP05-830
zero order) on rotation mount (CT-104)
d. Iris diaphragms (SM1D12 used in SM1 series) mounted to threaded caged plates
(CP02);
e. Other components used in spatial filter: extension rods (ER6, ER8); posts: Th TR-
2; post holders: Th PH2-ST; bases: Th BA1. Center hole alignment tool (CPA1)
was also helpful in alignment of spatial filter.
12. Neutral density gradient filter for coarse adjustment of excitation power (Edmund
Industrial Optics, Barrington NJ)
13. Periscope:
a. Stand: S&H 02 6106; stand cover plate: S&H 02 6212;
b. mounting plate (mounts stand to air table): S&H 02 4330;

Nikolenko et al., p. 26
26
c. carrier (attaches to stand and linear stage): S&H 02 6421; linear stage (attaches to
circular plate): Neat 1122075C (bottom one for horizontal movement; top one for
vertical movement); circular plate (attaches to mirror mount): S&H 02 4972;
mirror mount: S&H 08 5811; mirror: 10B20UF.25 ultrafast broadband 45 degrees
mirrors, NP
14. Olympus FLUOVIEW confocal scanning block.
15. Trinocular tube of Olympus upright BX50WI microscope
16. External PMT attached to camera port of trinocular tube via custom made adaptor
(custom made parts, threaded caged plates (CP02 Th), retaining rings (SM1 Th), rods
(ER2 Th)). IR blocking filter [9] is placed in front of photocathode of PMT. PMT
usually additionally protected from light with black rubberized fabric (BK5 Th) and
black masking tape (T137-1.0)
17. Epi-fluorescent illuminator of BX50WI.
Figure 1B: SHG detection block, view from the back of Olympus upright BX50WI
microscope Epi-fluorescent illuminator of BX50WI (17) is also shown.
18. Olympus FVX-TD-BX transmission detection module (cover removed for
illustration) allows switching between halogen lamp for bright field illumination and
additional detector port. Originally Olympus placed a diffuser and fiber-optics bundle
in order to simultaneously perform bright-field and DIC images with FLUOVIEW
confocal scanner. These parts were removed in our system.
19. Hamamatsu HC125-05 PMT was placed to transmission detection port instead of
fiber bundle via custom-made adaptor.
Nikolenko et al., p. 27
27
20. Custom made adaptor (custom made parts, threaded caged plates (CP02 Th), retaining
rings (SM1 Th), rods (ER2 Th)). D425/50M fully blocked filter from Chroma
Technology Corp. is placed before photocathode of PMT inside custom made adaptor
to protect it from fundamental IR beam and remove residual two-photon fluorescence
signal.
21. PMT battery-powered custom made power supply.
22. Halogen lamp of BX50WI for conventional bright-field imaging and DIC.
Figure 2: Drawing of the light path
Part numbering same as on Figure 1. Some non-essential elements are omitted.
The fluorescence beam pathway to internal detector of FLUOVIEW is not shown (it is
practically not used). Additional lenses in transmission detection pathway also are not
shown for simplicity (these lenses are not serviceable in BX50WI and we did not change
them). Red arrows show propagation directions of excitation near infra-red beam. Green
arrows show pathway of two-photon fluorescence emission to external detector. Blue
arrows show pathway for SHG light. For an ideal system, an infinity corrected set of
lenses should provide a collimated excitation beam at the back aperture of objective, and
in case of collimated laser light at the input of scanning head, pupil transfer and tube
lenses work as telescope which forms image of scanning mirrors approximately at the
back aperture of objective [12].
Figure 3: Measurements of PMT dark noise and linearity.
A & B: Response of FLUOVIEW data acquisition module to a simulated signal input. In
order to check reliability of using FLUOVIEW data acquisition system for quantitative

Nikolenko et al., p. 28
28
image analysis and verify linearity of analog circuits before analog/digital converter,
signal input of FLUOVIEW data acquisition block was supplied with series of voltages
and output digital image was analyzed. Our system shows good linearity in respect to
analog gain and offset. The variable gain allows accommodating wide range of
amplitudes from external signal sources (custom attached external PMTs, PMTs +
additional amplifier, etc.).
C: Dependence of not-correlated dark noise of external PMT (Hamamatsu HC125-02)
versus bias voltage.
Figure 4: Photostimulation of ROIs.
A: ROI excitation created via the temporal modulation of laser light intensity by gating
the Pockel’s cell during scanning. The Master 8 square pulse generator has been used as
source of train of pulses (see text). The “bright box at the center of scanned field is not
perfectly rectangular because of hardware limitation of Master 8 stimulator (see text).
The sample is a postnatal day 12 mouse cortical slice loaded with the Ca2+ fluorescent
indicator fura-2 AM [24]. Two-photon fluorescence image acquired with 800 nm
excitation wavelength. The scale bar is 20µm.
B: Illustration of regions of space-selective excitation regime in “raster mode” of custom
software (“advanced version” – see text for details). The current version of our custom
software allows users to manually define (or read coordinates of origins from file) a set of
rectangular regions of excitation – the regions of increased laser light intensity.
Figure 5: Software design, interface and calibration of scanning head
Nikolenko et al., p. 29
29
A: General scheme of the software control over the FLUOVIEW software/hardware by
our custom-made software. Basically, the FLUOVIEW software can be represented as a
container with a graphical user interface module and a module which controls hardware
recourses. The user can have low level access to the FLUOVIEW hardware via “C-calls”
of functions in the FLUOVIEW hardware dynamic-linked library (file “gbx.dll” for
version 2.1). The Windows Scripting Host works as a universal macro language at the
higher level and allows access to FLUOVIEW via its standard user interface.
B: User interface of the basic version of custom-made software which illustrates the
direct control of FLUOVIEW hardware: it initializes the hardware and provides direct
access to basic hardware resources: galvanometers mirror positioning, shutter and z-axis
motor.
C: Calibration of internal coordinates of galvanometers mirrors. Note that the center of
the scanning does not coincide with the geometrical center of the scanned digital image.
D: Example of user interface in custom-written software which allows to select “targets”
(“vector mode” – see text) for space selective point photostimulation, uncaging or multi-
points measurements. User can define the number of targets and the duration of the
excitation for each target.
Figure 6: Second harmonic Generation imaging of c. elegans.
Two live nematodes imaged with SHG (blue) and two-photon excitated fluorescence
(green). The scale bar is 20µm. See text for more details.