Embed Size (px)
Citation preview

A Curvature-Tensor-Based Perceptual Quality Metric for
3D Triangular Meshes
Fakhri Torkhani, Kai Wang, and Jean-Marc ChasseryGipsa-lab, CNRS UMR 5216, Universite de Grenoble
11 rue des Mathematiques, F-38042 Saint Martin d’Heres, France
{fakhri.torkhani, kai.wang, jean-marc.chassery}@gipsa-lab.grenoble-inp.fr
Abstract. Perceptual quality assessment of 3D triangular meshes is crucial for a variety of applica-
tions. In this paper, we present a new objective metric for assessing the visual difference between a
reference triangular mesh and its distorted version produced by lossy operations, such as noise addition,
simplification, compression and watermarking. The proposed metric is based on the measurement of
the distance between curvature tensors of the two meshes under comparison. Our algorithm uses not
only tensor eigenvalues (i.e., curvature amplitudes) but also tensor eigenvectors (i.e., principal curva-
ture directions) to derive a perceptually-oriented tensor distance. The proposed metric also accounts
for the visual masking effect of the human visual system, through a roughness-based weighting of the
local tensor distance. A final score that reflects the visual difference between two meshes is obtained
via a Minkowski pooling of the weighted local tensor distances over the mesh surface. We validate the
performance of our algorithm on four subjectively-rated visual mesh quality databases, and compare the
proposed method with state-of-the-art objective metrics. Experimental results show that our approach
achieves high correlation between objective scores and subjective assessments.
Key words: 3D triangular mesh, perceptual quality, human visual system, objective metric, cur-
vature tensor, visual masking.
1. Introduction
Three-dimensional (3D) triangular meshes have become the de facto standard for digitalrepresentation of 3D objects, and by now have found wide use in various applications,such as digital entertainment, medical imaging and computer-aided design [30]. As a rule,3D triangular meshes undergo some lossy operations, like simplification, compression andwatermarking. Although these operations are necessary to speed up and facilitate thetransmission, storage and rendering of 3D meshes, or to enforce the copyright protection,they inevitably introduce distortion to the original, unprocessed mesh. However, suchdistortion might degrade the quality of service associated with the mesh model. Sinceend users of 3D triangular meshes are often human beings, it is thus important to derivesome means to faithfully evaluate the degree of visual distortion introduced to a 3D mesh.Directly asking human subjects to evaluate the visual distortion is obviously unpracticalin most real-world applications, as such subjective evaluation is time-consuming and
Machine GRAPHICS & VISION vol. 23, no. 1/2, 2014 pp. 59–82

60 A curvature-tensor-based perceptual quality metric for 3D triangular meshes
costly. Therefore, it is necessary to develop objective metrics (i.e., software tools) thatcan accurately predict the result of a subjective visual quality assessment of the for 3Dtriangular meshes [39].
Although during the last decade we have seen tremendous advance in objective imagevisual quality assessment [19, 34], the research on objective mesh visual quality (MVQ)assessment is still at its early stage, with very few metrics proposed [39]. A possibleway to evaluate the perceptual quality of 3D meshes is to apply image quality metricson 2D images generated through 3D model rendering under several pre-selected viewingpositions. The first problem with this so-called image-based approach is how to selectthe viewing positions that the 2D image projections are generated from. In our opinion,a both optimum and automatic selection of such viewing positions is a very difficultproblem in itself. Furthermore, researchers wonder whether it is appropriate to use 2Dimage quality metrics to evaluate the visual quality of 3D meshes. In order to answerthis question, Rogowitz and Rushmeier [10] investigated the reliability of the image-based approach by conducting a series of experiments to compare the perceived qualityof simplified 3D meshes (as presented in a series of continuous viewing positions) and oftheir corresponding 2D image projections. The experimental results seem to imply thatthe perceptual quality of 3D meshes is in general not equivalent to the visual quality oftheir 2D image projections.
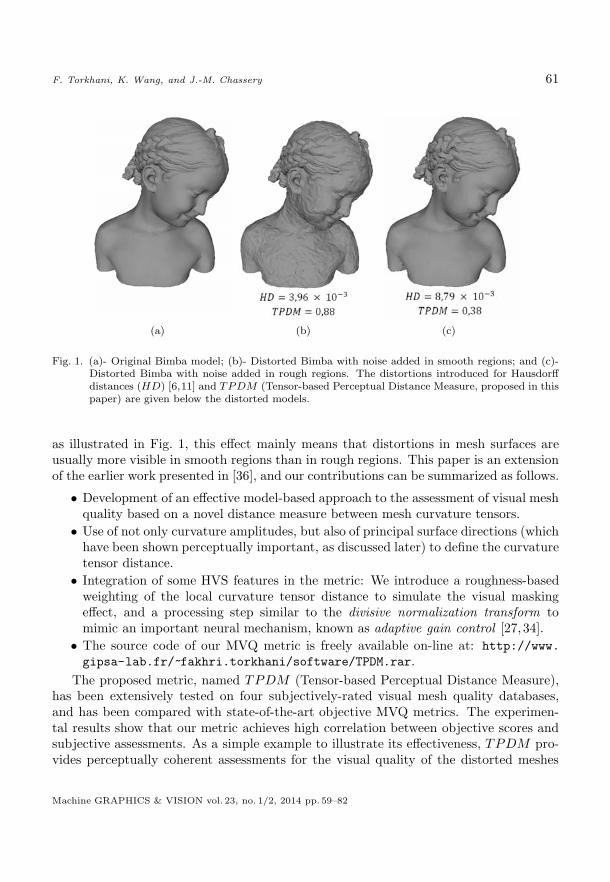
Inspired and motivated by the results of Rogowitz’s and Rushmeier’s experiments,the research community is now paying more attention to the development of model-basedMVQ metrics. This approach suggests that it would be more reasonable to relate MVQdirectly to the 3D shape of the mesh model than to its 2D image projections. Similarlyto the fact that PSNR (peak signal-to-noise ratio) and MSE (mean squared error) failto capture the visual quality of an image [29], it is not surprising to see that classicalmesh geometric distances (e.g., root mean squared error and Hausdorff distance) [6, 11]have been demonstrated to be irrelevant to human visual perception, and thus failing topredict the visual difference between an original mesh (also called reference mesh) andthe distorted one [39]. In Fig. 1, we show an example where the Hausdorff distance (HD)fails to provide correct MVQ assessments: The Hausdorff distance between the originalmesh in Fig. 1(a) and the distorted mesh in Fig. 1(b) is smaller than that between theoriginal mesh and the distorted mesh in Fig. 1(c); however, connversely, the model ofFig. 1(c) has obviously better perceptual quality than the one shown in Fig. 1(b).
In order to develop an effective objective MVQ metric, it is necessary to make use ofperceptually relevant features, and take into account some important properties of thehuman visual system (HVS). In this paper, we choose surface curvature amplitudes andprincipal curvature directions as perceptually relevant features. As discussed later, bothfeatures are important properties of the mesh surface that can be derived from eigende-composition of the curvature tensor. Meanwhile, we integrate some HVS properties inthe metric, in particular the visual masking effect. In the case of MVQ assessment and
Machine GRAPHICS & VISION vol. 23, no. 1/2, 2014 pp. 59–82
F. Torkhani, K. Wang, and J.-M. Chassery 61
(a) (b) (c)
Fig. 1. (a)- Original Bimba model; (b)- Distorted Bimba with noise added in smooth regions; and (c)-Distorted Bimba with noise added in rough regions. The distortions introduced for Hausdorffdistances (HD) [6,11] and TPDM (Tensor-based Perceptual Distance Measure, proposed in thispaper) are given below the distorted models.
as illustrated in Fig. 1, this effect mainly means that distortions in mesh surfaces areusually more visible in smooth regions than in rough regions. This paper is an extensionof the earlier work presented in [36], and our contributions can be summarized as follows.
• Development of an effective model-based approach to the assessment of visual meshquality based on a novel distance measure between mesh curvature tensors.
• Use of not only curvature amplitudes, but also of principal surface directions (whichhave been shown perceptually important, as discussed later) to define the curvaturetensor distance.
• Integration of some HVS features in the metric: We introduce a roughness-basedweighting of the local curvature tensor distance to simulate the visual maskingeffect, and a processing step similar to the divisive normalization transform tomimic an important neural mechanism, known as adaptive gain control [27, 34].
• The source code of our MVQ metric is freely available on-line at: http://www.
gipsa-lab.fr/~fakhri.torkhani/software/TPDM.rar.
The proposed metric, named TPDM (Tensor-based Perceptual Distance Measure),has been extensively tested on four subjectively-rated visual mesh quality databases,and has been compared with state-of-the-art objective MVQ metrics. The experimen-tal results show that our metric achieves high correlation between objective scores andsubjective assessments. As a simple example to illustrate its effectiveness, TPDM pro-vides perceptually coherent assessments for the visual quality of the distorted meshes
Machine GRAPHICS & VISION vol. 23, no. 1/2, 2014 pp. 59–82
62 A curvature-tensor-based perceptual quality metric for 3D triangular meshes
shown in Figs. 1(b) and 1(c) (a lower TPDM value implies a better visual quality ofthe distorted model): The TPDM distance between the original mesh and the distortedmesh in Fig. 1(b) is 0.88, while that between the original mesh and the distorted mesh inFig. 1(c) is 0.38. The proposed metric has the potential to be used, for instance, in thebenchmarking of a variety of mesh processing algorithms (e.g., compression, watermark-ing, remeshing, etc.), or to guide the design of new perceptually-oriented algorithms.
The remainder of this paper is organized as follows. Related work on model-basedMVQ assessment and our motivation for the design of TPDM are presented in Section 2.Section 3 details the pipeline of the proposed MVQ metric. The experimental results arepresented in Section 4, including performance evaluation of TPDM , comparison withstate-of-the-art MVQ metrics, and two simple examples to illustrate potential applica-tions of the proposed metric. Finally, we draw the conclusion and suggest several futurework directions in Section 5.
2. Related Work and Motivation
2.1. Model-based MVQ assessment
During the last decade, there has been increasing interest in the research on perceptualquality assessment of 3D meshes. To our knowledge, the first perceptually-orientedmodel-based MVQ metric was introduced by Karni and Gotsman [9] for the evaluationof their mesh compression algorithm. That metric is actually a weighted combination ofroot mean squared errors in vertex positions and errors in mesh Laplacian coordinates.Based on the fact that the local smoothness measure has a more important visual effect,Sorkine et al. [14] enhanced Karni and Gotsman’s metric by assigning a greater weightto the errors in mesh Laplacian coordinates. Although initially proposed as by-productsfor evaluating mesh compression algorithms, these two metrics have triggered promisingstudies focusing on the perceptual quality assessment of 3D meshes.
Corsini et al. [22] developed two perceptual metrics for the visual quality assessmentof watermarked meshes, named, respectively, 3DWPM1 and 3DWPM2. The visualdistortion is evaluated in these two metrics as the roughness difference between theoriginal and watermarked meshes. Two roughness measures were proposed: The firstone is based on statistics (within multiscale local windows) of dihedral angles over themesh surface, while the second roughness measure is defined as the geometric differencebetween a mesh model and its carefully smoothed version.
A physically-inspired MVQ metric was proposed by Bian et al. [25]. They considered3D meshes as objects with elasticity, and assumed that the visual difference between apair of meshes is related to the strain energy that is required to induce the deformationbetween them. It was shown in [25] that this metric was effective in assessing small
Machine GRAPHICS & VISION vol. 23, no. 1/2, 2014 pp. 59–82

F. Torkhani, K. Wang, and J.-M. Chassery 63
visual differences between meshes with constant connectivity (i.e., the same adjacencyrelationship between the bmesh vertices).
The research on MVQ assessment could benefit from the much more fruitful literatureon image visual quality assessment. Following this line of research, Lavoue et al. [17]proposed a metric called structural mesh distortion measure (MSDM), which can beconsidered as an extension of the well-known structure similarity index for 2D images [16]to the case of 3D triangular meshes. MSDM relates the visual degradation to thealteration of local statistics (i.e., mean, variance and covariance) of mesh curvatureamplitudes. An improved multiscale version MSDM2 [32] has been proposed, whichalso integrates a vertex matching preprocessing step to allow the comparison of twomeshes with different vertex connectivities.
Vasa and Rus [37] proposed a dihedral angle mesh error (DAME) metric to comparetriangular meshes sharing the same connectivity. DAME relies on the oriented surfacedihedral angles to evaluate the perceptual distortion, and integrates the visual maskingeffect, as well as the visibility model which accounts for the probable viewing positionsand directions of the models to be compared. This metric is computationally efficient,and has a good correlation with subjective assessment.
Recently, Wang et al. [38] introduced the fast mesh perceptual distance (FMPD)measure. This metric is based on a local roughness measure derived from the Gaussiancurvature of the mesh surface. FMPD estimates the perceptual distance as the differ-ence between the global roughness values of the two meshes under comparison. There-fore, the metric does not require a mesh correspondence or registration preprocessingstep, and can be applied to compare meshes with different connectivities. FMPD is inessence a reduced-reference metric, since only the global roughness of the original meshand some parameter values are required to carry out the visual quality assessment ofa distorted mesh. In contrast, full-reference MVQ metrics, such as MSDM , MSDM2and DAME, require the availability of full information about the original mesh.
A summary of the most representative model-based MVQ metrics, along with ourTPDM metric, is presented in Tab. 1. In that table, we also list two popular mesh geo-metric distances RMS (root mean squared error) and HD (Hausdorff distance). Despitetheir poor correlation with human visual perception [39], nowadays RMS and HD arestill largely used in the evaluation of various mesh processing algorithms. The metricsare summarized according to three different algorithmic aspects: the mesh feature usedfor MVQ assessment, the information about the reference mesh required (i.e., whetherthe metric is classified as full-reference or reduced-reference one), and whether the metricrequires the two meshes under comparison to have the same connectivity. Quantitativecomparisons of these metrics are presented in Section 4.
Machine GRAPHICS & VISION vol. 23, no. 1/2, 2014 pp. 59–82

64 A curvature-tensor-based perceptual quality metric for 3D triangular meshes
Tab. 1. Summary of model-based mesh perceptual quality metrics.
Metric FeatureInformation about Connectivityreference mesh constraint
RMS [6, 11] Surface-to-surface distance Full-reference No
HD [6, 11] Surface-to-surface distance Full-reference No
3DWPM [22] Global roughness Reduced-reference Yes
MSDM [17] Curvature amplitude Full-reference Yes
MSDM2 [32] Multiscale curvature amplitude Full-reference No
DAME [37] Dihedral angle Full-reference Yes
FMPD [38] Global roughness Reduced-reference No
TPDM Curvature tensor distance Full-reference No
2.2. Motivation for tensor-based MVQ assessment
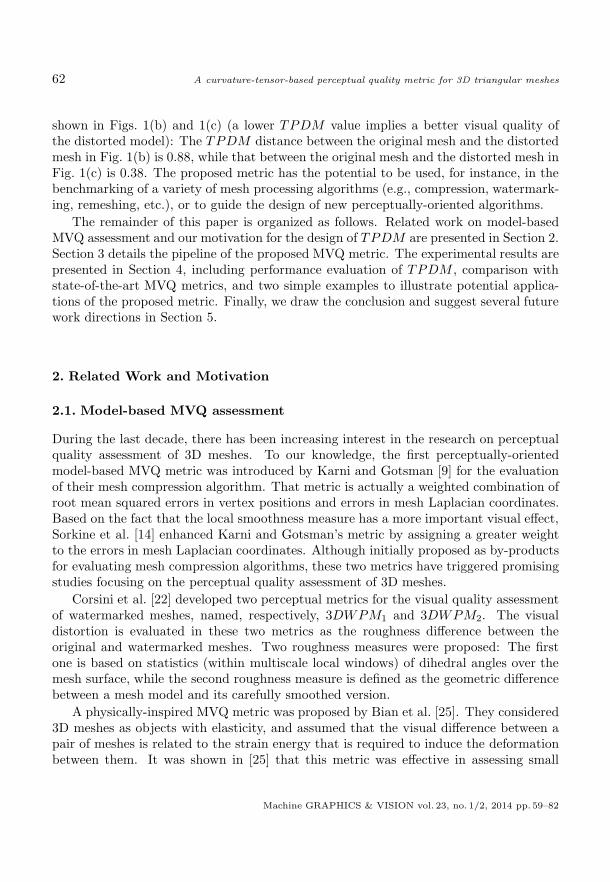
MSDM2 has a good correlation with subjective scores [32], though by considering onlythe modification in mesh curvature amplitudes. We argue that a modification in theprincipal surface directions as defined by the orthogonal directions of minimum and max-imum curvatures is also important for MVQ assessment. As shown in Fig. 2, maximumand minimum curvature directions represent salient structural features of the surfaceand thus should be visually important. Indeed, when drawing a 3D object, one strategyof caricaturists is to draw strokes on these lines of curvatures [23]. For example, we mayexpect that the drawings of either trained artists or untrained amateurs, when asked tocomplete a line drawing of the Bimba model shown in Fig. 2(a), would be similar to theimages shown in Figs. 2(b) and 2(c). The perceptual importance of principal surface di-rections have been noticed by computer graphics and geometry processing experts: Theyhave been successfully used for describing [3] and illustrating [8] complex 3D objects, aswell as for guiding a high-performance anisotropic remeshing algorithm [12].
Motivated by the above observation, in this paper we introduce a new MVQ metricTPDM which makes use of more information that can be extracted from mesh curvaturetensors, i.e., both the curvature amplitudes and the principal surface directions. InSection 4, we will show that experimentally our tensor-based metric achieves a highcorrelation with the subjective scores of mesh visual quality. In particular, the useof information on principal surface directions in TPDM appears to help improve theassessment performance when compared to the state-of-the-art metric MSDM2 thatuses only curvature amplitudes. Before presenting the technical details of the proposedmetric in Section 3, in the next subsection we will briefly introduce a technique for theestimation of mesh curvature tensors, and explain how to obtain curvature amplitudesand principal curvature directions from the tensor.
Machine GRAPHICS & VISION vol. 23, no. 1/2, 2014 pp. 59–82
F. Torkhani, K. Wang, and J.-M. Chassery 65
(a) (b) (c)
Fig. 2. (a)- Bimba’s model; (b)- Maximum curvature directions of Bimba scaled by maximum curvaturevalues; and (c)- Minimum curvature directions of Bimba scaled by minimum curvature values.
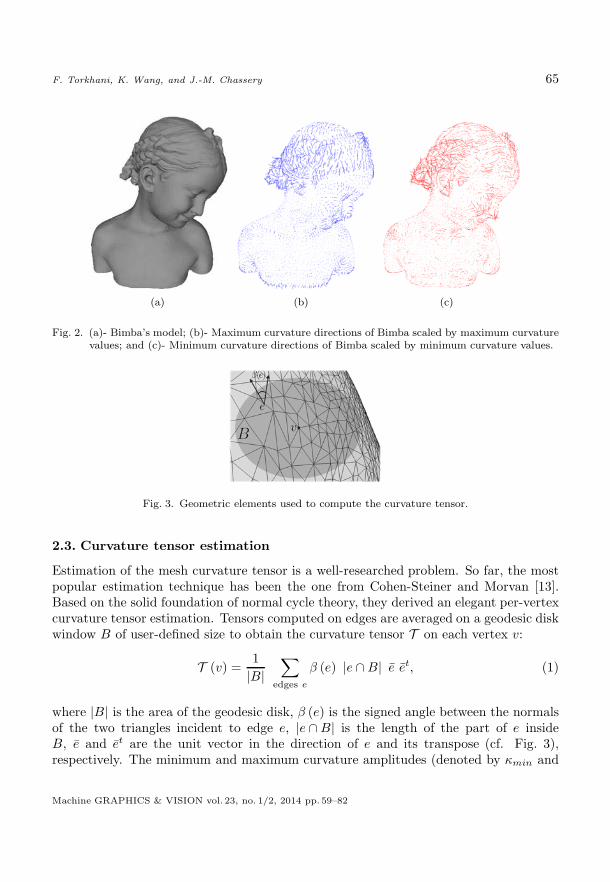
Fig. 3. Geometric elements used to compute the curvature tensor.
2.3. Curvature tensor estimation
Estimation of the mesh curvature tensor is a well-researched problem. So far, the mostpopular estimation technique has been the one from Cohen-Steiner and Morvan [13].Based on the solid foundation of normal cycle theory, they derived an elegant per-vertexcurvature tensor estimation. Tensors computed on edges are averaged on a geodesic diskwindow B of user-defined size to obtain the curvature tensor T on each vertex v:
T (v) =1
|B|∑
edges e
β (e) |e ∩B| e et, (1)
where |B| is the area of the geodesic disk, β (e) is the signed angle between the normalsof the two triangles incident to edge e, |e ∩B| is the length of the part of e insideB, e and et are the unit vector in the direction of e and its transpose (cf. Fig. 3),respectively. The minimum and maximum curvature amplitudes (denoted by κmin and
Machine GRAPHICS & VISION vol. 23, no. 1/2, 2014 pp. 59–82

66 A curvature-tensor-based perceptual quality metric for 3D triangular meshes
Fig. 4. Block diagram of the pipeline of TPDM (Tensor-based Perceptual Distance Measure). In theroughness map within the block of “Step 3: Roughness-based weighting”; warmer colors representlarger values (i.e., where the local surface is rougher).
κmax), respectively) are the absolute values of the two non-zero eigenvalues of the tensorT , and the principal surface directions are the associated two eigenvectors (denoted by3D vectors γmin and γmax, respectively). In Section 3, we will derive a perceptually-oriented distance between curvature tensors by incorporating the information from boththeir eigenvalues and their eigenvectors, and will use this distance to conduct the MVQassessment.
3. MVQ Assessment Based on Curvature Tensor Distance
An overview of the processing pipeline for the proposed MVQ metric TPDM is illus-trated in Fig. 4. First of all, in order to compare two meshes with potentially differentconnectivities, we perform a preprocessing step of vertex matching between the twomeshes under comparison, based on the AABB tree data structure implemented in theCGAL library [35]. The objective of this step is to find, for each vertex of the referencemesh, a corresponding point on the surface of the distorted mesh. The second step isto compute a curvature tensor at each vertex of the two meshes, and then to derive thedistance between the tensors of each vertex in the reference mesh and its counterpartin the distorted mesh. Both the curvature amplitudes and the principal curvature di-rections are involved in the tensor distance calculation. Before this local tensor distancecomputation, a correspondence relationship has to be established between the principalcurvature directions and the curvature amplitudes of the two tensors to be compared,
Machine GRAPHICS & VISION vol. 23, no. 1/2, 2014 pp. 59–82
F. Torkhani, K. Wang, and J.-M. Chassery 67
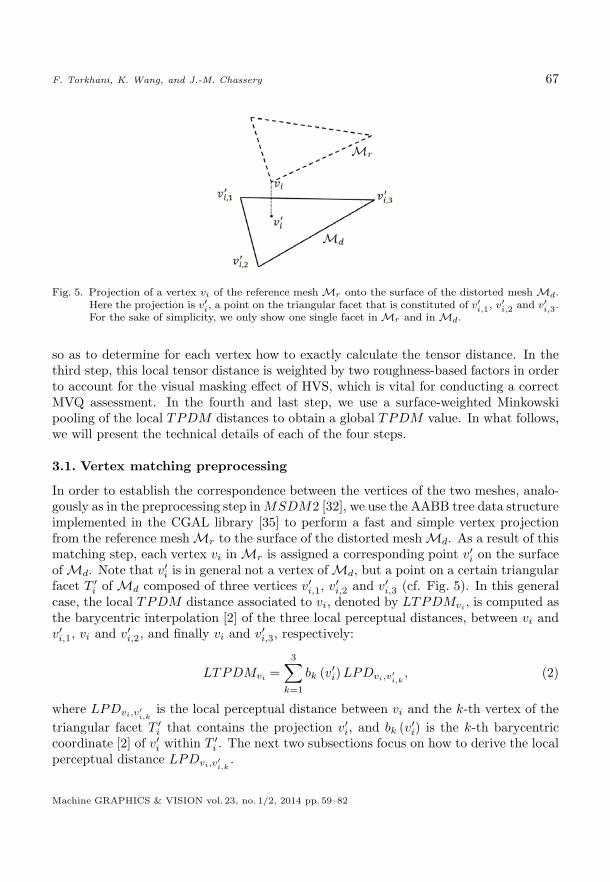
Fig. 5. Projection of a vertex vi of the reference mesh Mr onto the surface of the distorted mesh Md.Here the projection is v′i, a point on the triangular facet that is constituted of v′i,1, v
′i,2 and v′i,3.
For the sake of simplicity, we only show one single facet in Mr and in Md.
so as to determine for each vertex how to exactly calculate the tensor distance. In thethird step, this local tensor distance is weighted by two roughness-based factors in orderto account for the visual masking effect of HVS, which is vital for conducting a correctMVQ assessment. In the fourth and last step, we use a surface-weighted Minkowskipooling of the local TPDM distances to obtain a global TPDM value. In what follows,we will present the technical details of each of the four steps.
3.1. Vertex matching preprocessing
In order to establish the correspondence between the vertices of the two meshes, analo-gously as in the preprocessing step inMSDM2 [32], we use the AABB tree data structureimplemented in the CGAL library [35] to perform a fast and simple vertex projectionfrom the reference mesh Mr to the surface of the distorted mesh Md. As a result of thismatching step, each vertex vi in Mr is assigned a corresponding point v′i on the surfaceof Md. Note that v
′i is in general not a vertex of Md, but a point on a certain triangular
facet T ′i of Md composed of three vertices v′i,1, v
′i,2 and v′i,3 (cf. Fig. 5). In this general
case, the local TPDM distance associated to vi, denoted by LTPDMvi, is computed asthe barycentric interpolation [2] of the three local perceptual distances, between vi andv′i,1, vi and v′i,2, and finally vi and v′i,3, respectively:
LTPDMvi =
3∑k=1
bk (v′i)LPDvi,v′
i,k, (2)
where LPDvi,v′i,k
is the local perceptual distance between vi and the k-th vertex of the
triangular facet T ′i that contains the projection v′i, and bk (v
′i) is the k-th barycentric
coordinate [2] of v′i within T ′i . The next two subsections focus on how to derive the local
perceptual distance LPDvi,v′i,k.
Machine GRAPHICS & VISION vol. 23, no. 1/2, 2014 pp. 59–82
68 A curvature-tensor-based perceptual quality metric for 3D triangular meshes
3.2. Local tensor distance
The derivation of the local perceptual distances LPDvi,v′i,k
is based on the local tensor
distances between vi and v′i,k, denoted by LTDvi,v′i,k
for k = 1, 2, 3. For this purpose,
we first estimate the curvature tensors at each vertex of Mr and Md. The tensors onthe two vertices vi and v′i,k are hereafter denoted by Tvi and Tv′
i,k, respectively. They
are computed using Equation (1), with a local window established as the intersection ofthe mesh surface and the Euclidean sphere [13] that is centered on the vertex and has,experimentally, a radius equal to 0.5% of the bounding box diagonal of Mr.
As mentioned earlier, we want to use the differences between both the curvatureamplitudes (i.e., tensor eigenvalues) and the principal curvature directions (i.e., tensoreigenvectors) to derive the local tensor distance. We should first of all decide betweenwhich curvature amplitudes/directions we will compute the differences. The straightfor-ward choice is to derive the difference between the minimum curvature of Tvi and theminimum curvature of Tv′
i,k(the same for the differences in the maximum curvature am-
plitudes, in the minimum curvature directions and inthe maximum curvature directions).Then we can combine the obtained four differences to derive the local tensor distance.However, we find that this simple “min→min, max→max” correspondence between thetensor elements results in poor MVQ assessments, especially in the situations wherethe principal directions are severely disturbed after medium and strong distortions, andwhere the mesh contains a large portion of locally isotropic regions (in these regions, thevalues of minimum and maximum curvature amplitudes are close to each other, so thatthe minimum and maximum curvatures may change roles even after small-amplitudedistortions).
Motivated by this observation, we adopt another rule for establishing the correspon-dence relationship between the curvature amplitudes/directions of Tvi and Tv′
i,k, which
is based on the minimum angular distance criterion between the principle curvaturedirections. More precisely, for γmin (i.e., the minimum curvature direction) of Tvi , wefind the principal direction of Tv′
i,kthat has the smallest angular distance to it (this
direction is denoted by γ′1), and then relate γmin to γ′
1. Accordingly, κmin (i.e., theminimum curvature amplitude) of Tvi is related to the curvature amplitude associatedto γ′
1 (denoted by κ′1). That is, if γ
′1 is the minimum (or maximum) curvature direction
of Tv′i,k, then κ′
1 is the minimum (or maximum) curvature amplitude of Tv′i,k. Under the
proposed correspondence rule, γ′1 can be either the minimum or the maximum curvature
direction of Tv′i,k, as long as this minimum or maximum curvature direction has the
smallest angular distance to γmin. Similarly, the following correspondence relationshipsare established: κmax → κ′
2 and γmax → γ′2. It is easy to see that γ′
1 and γ′2 (and κ′
1 andκ′2, respectively) are distinct principal curvature directions (distinct principal curvature
amplitudes, respectively) of Tv′i,k. In practice, the above correspondence, which is based
Machine GRAPHICS & VISION vol. 23, no. 1/2, 2014 pp. 59–82

F. Torkhani, K. Wang, and J.-M. Chassery 69
on the minimum angular distance criterion, yields better MVQ assessment results thanthe straightforward “min→min, max→max” correspondence discussed above.
The local tensor distance is computed for each pair of vi and v′i,k as
LTDvi,v′i,k
=θmin
(π/2)δκmin +
θmax
(π/2)δκmax , (3)
where θmin ∈ [0, π/2] is the angle between the curvature lines of γmin and γ′1 (similarly,
θmax ∈ [0, π/2] is the angle between the lines of γmax and γ′2), and δκmin is a Michelson-
like contrast [1] of the curvature amplitudes κmin and κ′1, i.e., δκmin =
∣∣∣ κmin−κ′1
κmin+κ′1+ε
∣∣∣ withε a stabilization constant fixed as 5% of the avarage mean curvature of Mr (similarly,
δκmax =∣∣∣ κmax−κ′
2
κmax+κ′2+ε
∣∣∣). Both the differences in the curvature amplitudes and in the
principal surface directions are involved in the derivation of the local tensor distance.Besides its perceptual relevance [4, 5], another reason to use the Michelson-like contrastto evaluate the difference between curvature amplitudes is that in this way both thedifference the principal directions (after the normalization by a factor of π/2) and in thecurvature amplitudes are in the same range of [0, 1], so that these two kinds of differencescan be easily combined together.
3.3. Roughness-based weighting of local tensor distance
For the development of an effective MVQ metric, we should take into account someHVS features, in particular the visual masking effect [20]. In the context of MVQassessment, this effect mainly means that the same distortion is less visible in roughregions of the mesh surface than in the smooth regions. In order to account for the visualmasking effect, our solution is to modulate the values of LTDvi,v′
i,kby two roughness-
based weights (the rougher the local surface is, the smaller the weights are). The localperceptual distance between vi and v′i,k, which incorporates the visual masking effect, iscomputed as:
LPDvi,v′i,k
= RW(γ)i .RW
(κ)i .LTDvi,v′
i,k, (4)
with RW(γ)i , RW
(κ)i ∈ [0.1, 1.0]. They are, respectively, the roughness-based weights
derived from the principal surface directions and the curvature amplitudes in the 1-ring
neighborhood of vi. For RW(γ)i , we first project all the principal curvature directions
at the 1-ring neighbors of vi on the tangent plane of vi, and then take the sum of thetwo angular standard deviations of the projected minimum and maximum curvature di-rections as the local roughness value. This value is then linearly mapped to [0.1, 1.0] to
obtain RW(γ)i : The higher the sum of the two angular standard deviations is, the lower
the mapped value is. Similarly, to get RW(κ)i , we compute the ratio of the Laplacian for
the mean curvatures in the 1-ring neighborhood of vi and the mean curvature at vi as the
Machine GRAPHICS & VISION vol. 23, no. 1/2, 2014 pp. 59–82
70 A curvature-tensor-based perceptual quality metric for 3D triangular meshes
local roughness measure. The Laplacian of the mean curvatures in the 1-ring neighbor-hood of vi describes the local variation of the mesh curvature amplitudes. In our metric,we use the cotangent-based mesh Laplacian due to its solid theoretical foundation and itsexcellent performance in practical applications [18,24]. This curvature-amplitude-based
roughness value is then linearly mapped to [0.1, 1.0] to obtain RW(κ)i : The higher the
roughness is, the lower the mapped value is. It is worth mentioning that the derivation
of the roughness weight RW(κ)i includes a divisive normalization (i.e., the normalization
of the Laplacian for mean curvatures by the mean curvature on vi itself), which is sim-ilar to that in the neural mechanism of HVS that partially explains the visual maskingeffect [27,34]. Also note that vertices in isotropic regions, i.e., where κmin and κmax areclose to each other, are treated differently. An anisotropy coefficient ρvi is first computedas:
ρvi =κ(vi)max − κ
(vi)min
κ(vi)max + κ
(vi)min + ε
, (5)
where κ(vi)min and κ
(vi)max are, respectively, the minimum and maximum curvatures at vertex
vi, and ε is a stabilization constant set as 5% of the average mean curvature of Mr. Weconsider that the vertices at which ρvi is smaller than 0.5 belong to relatively isotropic
regions. For these vertices, we set RW(γ)i equal to 1, and accordingly the final roughness-
based weight is determined by the value of RW(κ)i . The reason is that in isotropic
regions, the principal curvature directions are not well-defined and their estimation isnot reliable. It is therefore safer to use only the curvatur-amplitude-based roughness
weight RW(κ)i for the local tensor distance modulation. A roughness map that combines
both weights RW(γ)i and RW
(κ)i is shown in the “Step 3” block of Fig. 4, where warmer
colors represent higher roughness values (i.e., lower roughness-based weights).
Finally, as described by Equation (2), the local tensor-based perceptual distancemeasure at vertex vi, LTPDMvi, is computed as the barycentric interpolation of thethree local perceptual distances LPDvi,v′
i,1, LPDvi,v′
i,2and LPDvi,v′
i,3.
3.4. Global perceptual distance
The global tensor-based perceptual distance measure TPDM from the reference meshMr to the distorted mesh Md is computed as the weighted Minkowski sum of the localdistances LTPDMvi, i = 1, 2, ..., N :
TPDM =
(N∑i=1
wi |LTPDMvi|p
) 1p
, (6)
where wi = si/∑N
i=1 si with si one third of the total area of all the incident facets of vi,and p = 2.5. The surface-based weighting can, to some extent, enhance the stability of
Machine GRAPHICS & VISION vol. 23, no. 1/2, 2014 pp. 59–82

F. Torkhani, K. Wang, and J.-M. Chassery 71
the metric to the variation of vertex sampling density over the mesh surface. Comparedto the standard mean-squared error where p = 2.0, the choice of p = 2.5 can increasethe importance of the local high amplitude distances of in the calculation of the globalperceptual distance [15]. This is perceptually relevant, since the part of mesh with high-amplitude distortion experimentally attracts more attention from human observers, andthus has more impact on the result of subjective assessment.
4. Experimental Results
4.1. Performance evaluation and comparisons
In order to verify its efficacy, the proposed metric TPDM has been extensively testedand compared with the existing metrics on four subjectively-rated visual mesh qualitydatabases:
• The LIRIS/EPFL general-purpose database1 [17]: Contains 4 reference meshes andthe total of 84 distorted models. The distortion types include noise addition andsmoothing, applied either locally or globally to the reference mesh. Subjectiveevaluations were made by 12 observers.
• The LIRIS masking database2 [26]: Contains 4 reference meshes and the total of24 distorted models. The local noise addition distortion included in this databasewas designed specifically for testing the capability of MVQ metrics to capture thevisual masking effect. 11 observers participated in the subjective tests.
• The IEETA simplification database3 [28]: Contains 5 reference meshes and thetotal of 30 simplified models. 65 observers participated in the subjective study.
• The UWB compression database4 [37]: Contains 5 reference meshes and the totalof 64 distorted models. Subjective evaluations were made by 69 observers.
TPDM has been compared with seven state-of-the-art metrics, i.e., the Hausdorffdistance (HD) [6, 11], the root mean squared error (RMS) [6, 11], 3DWPM1 and3DWPM2 [22], MSDM2 [32], DAME [37] and FMPD [38]. The coherence betweenthe objective values produced by the MVQ metrics and the mean opinion scores (MOS)provided by subjective databases is measured using two different correlation kinds: ThePearson linear correlation coefficient (PLCC or rp), which measures the prediction ac-curacy of the objective metrics, and the Spearman rank-order correlation coefficient(SROCC or rs), which measures the prediction monotonicity [19,34]. Before computingthe correlation values, especially the PLCC, it is recommended to conduct a psycho-metric fitting between the objective scores and the MOS values, in order to partially
1http://liris.cnrs.fr/guillaume.lavoue/data/datasets.html2http://liris.cnrs.fr/guillaume.lavoue/data/datasets.html3http://www.ieeta.pt/~sss/index.php/perceivedquality/repository4http://compression.kiv.zcu.cz/
Machine GRAPHICS & VISION vol. 23, no. 1/2, 2014 pp. 59–82

72 A curvature-tensor-based perceptual quality metric for 3D triangular meshes
remove the non-linearity between them. Another effect of psychometric fitting is that af-terwards we obtain objective MVQ values belonging to the [0, 1] interval, which are easierfor the users to understand. In our tests, we apply a cumulative Gaussian psychometricfunction [7] for the fitting:
g(a, b, R) =1√2π
∫ ∞
a+bR
e−(t2/2)dt, (7)
where R is the raw TPDM value. The two parameters a = −1.14 and b = 11.47are obtained through a non-linear least squares fitting (under Matlab, with the curvefitting toolbox) using the raw TPDM values and the corresponding MOS for the groupof Dinosaur models in the general-purpose database. As shown in Fig. 6, the samepsychometric function is used for models in other subjective databases. From the plotswe can see that the fitted psychometric function has a good generalization capability forother databases, as the psychometric curve is close to the TPDM -MOS pairs.
The tables 2 to 5 present, respectively, the evaluation and comparison results forthe general-purpose, masking, simplification and compression databases. Analogouslyto the comparisons in [39], the overall correlations (last two columns in the tables) arecomputed for the whole database (i.e., we compute the statistical linear or non-lineardependence between all objective scores and MOS values of all models in each database),except the compression database, where per-model averages are used. This is becausethe data acquisition procedure of the compression database does not take into accountinter-model coherence [37, 39]. The results for the existing metrics shown in Tabs. 2 to5 are either extracted from published papers [31,37–39] and the related erratum [40], orcollected from our own tests.
The geometric distance metrics HD and RMS in general fail to evaluate the percep-tual mesh quality: The overall Pearson and Spearman correlations are quite low for allthe four databases. HD even results in a negative correlation on some difficult models,i.e., Jessy and James from the compression database (cf. Tab. 5). In the following wewill focus on the comparison of our approach with state-of-the-art perceptually-drivenMVQ metrics for each database.
For the general-purpose database (cf. Tab. 2), TPDM has high PLCC and SROCCvalues for almost every individual model, as well as for the whole repository. TPDMhas the highest overall PLCC and SROCC values among all the MVQ metrics tested(the last two columns). In particular, there is a noticeable improvement in terms ofoverall correlations compared to the second best metric FMPD. For example, theoverall SROCC has improved from 81.9% for FMPD to 89.6% for TPDM . Since thegeneral-purpose database has the highest number of distorted models among the fouravailable databases, as well as a variety of distortion types, the high correlation valuesof TPDM for this database appear to be promising evidence for the good performanceof TPDM in assessing visual mesh quality.
Machine GRAPHICS & VISION vol. 23, no. 1/2, 2014 pp. 59–82

F. Torkhani, K. Wang, and J.-M. Chassery 73
0 0.05 0.1 0.15 0.20
0.1
0.2
0.3
0.4
0.5
0.6
0.7
0.8
0.9
1
TPDM
MO
S
(a)− LIRIS/EPFL general purpose database: psychometric curve with TPDM/MOS values
Psychometric functionArmadillo TPDM vs. MOSDinosaur TPDM vs. MOSRockerArm TPDM vs. MOSVenus TPDM vs. MOS
0 0.05 0.1 0.15 0.20
0.1
0.2
0.3
0.4
0.5
0.6
0.7
0.8
0.9
1
TPDM
MO
S
(b)− LIRIS masking database: psychometric curve with TPDM/MOS values
Psychometric functionArmadillo TPDM vs. MOSDinosaur TPDM vs. MOSLionVase TPDM vs. MOSBimba TPDM vs. MOS
0 0.05 0.1 0.15 0.20
0.1
0.2
0.3
0.4
0.5
0.6
0.7
0.8
0.9
1
TPDM
MO
S
(c)− IEETA simplification database: psychometric curve with TPDM/MOS values
Psychometric functionBunny TPDM vs. MOSBones TPDM vs. MOSHead TPDM vs. MOSLung TPDM vs. MOSStrange TPDM vs. MOS
Fig. 6. Psychometric function curve plotted with TPDM -MOS pairs of all the reference and distortedmodels in: (a)- the LIRIS/EPFL general-purpose database; (b)- the LIRIS masking database;and (c)- the IEETA simplification database.
Machine GRAPHICS & VISION vol. 23, no. 1/2, 2014 pp. 59–82

74 A curvature-tensor-based perceptual quality metric for 3D triangular meshes
Tab. 2. PLCC (rp) and SROCC (rs) (%) of different objective metrics on the general-purpose database.
MetricArmadillo Dinosaur RockerArm Venus All modelsrp rs rp rs rp rs rp rs rp rs
HD [6, 11] 54.9 69.5 47.5 30.9 23.4 18.1 8.9 1.6 11.4 13.8RMS [6, 11] 56.7 62.7 0.0 0.3 17.3 7.3 87.9 90.1 28.1 26.8
3DWPM1 [22] 59.7 65.8 59.7 62.7 72.9 87.5 68.3 71.6 61.9 69.33DWPM2 [22] 65.6 74.1 44.6 52.4 54.7 37.8 40.5 34.8 49.6 49.0MSDM2 [32] 85.3 81.6 85.7 85.9 87.2 89.6 87.5 89.3 81.4 80.4DAME [37] 76.3 60.3 88.9 92.8 80.1 85.0 83.9 91.0 75.2 76.6FMPD [38] 83.2 75.4 88.9 89.6 84.7 88.8 83.9 87.5 83.5 81.9
TPDM 78.8 84.5 89.0 92.2 91.4 92.2 91.0 90.6 86.2 89.6
Tab. 3. PLCC (rp) and SROCC (rs) (%) of different objective metrics on the masking database.
MetricArmadillo Bimba Dinosaur LionVase All modelsrp rs rp rs rp rs rp rs rp rs
HD [6, 11] 61.4 48.6 27.4 25.7 55.8 48.6 50.1 71.4 20.2 26.6RMS [6, 11] 66.8 65.7 46.7 71.4 70.9 71.4 48.8 71.4 41.2 48.8
3DWPM1 [22] 64.6 58.0 29.0 20.0 67.3 66.7 31.1 20.0 31.9 29.43DWPM2 [22] 61.6 48.6 37.9 37.1 70.8 71.4 46.9 38.3 42.7 37.4MSDM2 [32] 81.1 88.6 96.8 100 95.6 100 93.5 94.3 87.3 89.6DAME [37] 96.0 94.3 88.0 97.7 89.4 82.9 99.5 100 58.6 68.1FMPD [38] 94.2 88.6 98.9 100 96.9 94.3 93.5 94.3 80.8 80.2
TPDM 91.4 88.6 97.2 100 97.1 100 88.4 82.9 88.6 90.0
From the results forthe masking database (cf. Tab. 3), we can see that in gen-eral TPDM captures the visual masking effect well, as reflected by the high individualand overall PLCC and SROCC values for that database. The same applies to theresults for the general-purpose database: TPDM has the highest overall PLCC andSROCC values among all the metrics tested. Another observation is that although thereduced-reference metric FMPD performs quite well for each individual model, its over-all PLCC and SROCC values are not that high when compared to the full-referencemetrics MSDM2 and TPDM . Hence, it seems that in order to capture the visual mask-ing effect well in the case of MVQ assessment, it would be advantageous to conduct aprecise vertex-to-vertex local analysis, with the availability of the full information aboutthe reference mesh.
Compared to other connectivity-independent metrics (cf. Tab. 1), TPDM has com-parable performance with MSDM2 and FMPD for the simplification database (cf.Tab. 4). The results of 3DWPM1, 3DWPM2 and DAME are missing because thosemetrics have the mesh connectivity constraint, and therefore cannot be applied to com-pare two meshes with different connectivities. For the Head model, the correlation of
Machine GRAPHICS & VISION vol. 23, no. 1/2, 2014 pp. 59–82

F. Torkhani, K. Wang, and J.-M. Chassery 75
Tab. 4. PLCC (rp) and SROCC (rs) (%) of different objective metrics on the simplification database.
MetricBones Bunny Head Lung Strange All models
rp rs rp rs rp rs rp rs rp rs rp rs
HD [6, 11] 92.0 94.3 37.8 39.5 72.8 88.6 80.6 88.6 52.3 37.1 50.5 49.4RMS [6, 11] 86.4 94.3 94.5 77.1 49.6 42.9 89.0 100 90.4 88.6 59.6 70.2MSDM2 [32] 98.3 94.3 98.1 77.1 88.9 88.6 92.3 60.0 99.0 94.3 89.2 86.7FMPD [38] 96.0 88.6 98.0 94.3 70.4 65.7 95.5 88.6 96.0 65.7 89.3 87.2
TPDM 99.0 94.3 98.0 94.3 63.1 65.7 98.6 94.3 98.7 94.3 86.9 88.2
Tab. 5. PLCC (rp) and SROCC (rs) (%) of different objective metrics on the compression database.
MetricBunny James Jessy Nissan Helix All models
rp rs rp rs rp rs rp rs rp rs rp rs
HD [6, 11] 34.1 52.2 -16.8 6.8 -23.6 12.5 14.4 23.6 45.1 46.4 10.6 28.3RMS [6, 11] 34.2 20.9 14.0 10.8 0.0 14.8 17.8 29.7 46.9 44.6 22.0 24.1
3DWPM1 [22] 94.7 93.4 77.3 72.3 87.2 89.5 63.6 59.3 98.0 95.2 84.1 81.93DWPM2 [22] 96.0 91.2 76.9 65.3 86.9 85.9 56.3 67.6 95.5 94.3 82.3 80.9MSDM2 [32] 97.4 90.1 82.6 69.2 84.3 63.1 84.4 73.1 98.1 94.7 89.3 78.0DAME [37] 96.8 93.4 95.7 93.4 84.4 70.5 93.9 75.3 96.6 95.2 93.5 85.6FMPD [38] 94.2 89.6 95.3 91.2 63.3 60.0 92.4 77.5 98.4 90.8 88.8 81.8
TPDM 95.1 96.5 90.8 73.6 85.8 75.8 82.7 73.4 98.7 95.0 91.5 82.9
TPDM is rather low. This is because TPDM has difficulties in distinguishing the qual-ity of simplified Head meshes generated by different simplification algorithms but withthe same vertex reduction ratio. FMPD is more or less affected by the same prob-lem. The simplification database is a relatively simple dataset. MSDM2, FMPD andTPDM all have very high overall correlation on this database, and even HD and RMShave very good performance on some individual models. This observation implies thenecessity of constructing a comprehensive subjectively-rated MVQ database which in-corporates more models and more types of lossy operations affecting mesh connectivity,e.g., other simplification algorithms, remeshing or even subdivision.
For the compression database (cf. Tab. 5), DAME has the highest overall PLCCand SROCC: 93.5% and 85.6% for DAME against respectively 91.5% and 82.9% forTPDM , the second best metric for this database. Initially, we encountered difficulties intesting TPDM on the James, Jessi and Nissan models, which consist of many spatiallynon-connected components ( 70, 138 and 212, respectively). Some of the componentshave null Euclidean distance to each other, so that the vertex matching preprocessingfails since a vertex may be incorrectly projected onto a different nearby component, evenwithout any introduced distortion. A simple solution has been adopted to resolve thisproblem. We first identify such incorrectly projected vertices on the reference mesh by
Machine GRAPHICS & VISION vol. 23, no. 1/2, 2014 pp. 59–82

76 A curvature-tensor-based perceptual quality metric for 3D triangular meshes
conducting the TPDM comparison between the reference mesh and itself. The incor-rectly projected vertices are those with non-zero LTPDM values. When performing acomparison with a distorted mesh, the LTPDM distances for these vertices are deducedfrom the distance values of its 1-ring neighbors, via simple median filtering. This alsodemonstrates that in order to conduct an effective MVQ assessment (especially for thedevelopment of full-reference MVQ metrics), it is important to develop a robust, or ide-ally perceptually-driven, mesh correspondence algorithm. The development of such analgorithm remains an open research problem.
All in all, TPDM shows quite good performance on all the available subjectively-rated mesh visual quality databases, as reflected by its high correlation with subjectivescores on most individual models, as well as on the whole repositories. In particular,TPDM has the highest overall SROCC (the last column in the tables) on the general-purpose, masking and simplification databases, and it is the second best performingmetric on the compression database. Furthermore, TPDM has always higher SROCCthan MSDM2 on all the four databases, and also under three cases out of four higherPLCC values (the exception is the simplification database). It appears that the injectionof the information on the principal surface directions helps improve the MVQ assessmentperformance.
TPDM also allows us to obtain a perceptually coherent distance map between twomeshes. Figure 7 illustrates the distance maps produced by TPDM and RMS betweenthe original Bimba model and a distorted Bimba after uniform random noise addition.The map of TPDM is quite consistent with human perception (i.e., the perceived dis-tortion is higher in smooth regions than in rough regions), while the map of RMS ispurely geometric and fails to capture the visual masking effect.
Fig. 7. From left to right: the original Bimba model, the distorted Bimba model after uniform randomnoise addition, the distance map of TPDM between the two meshes, and the distance map ofRMS. In the distances maps, warmer colors represent higher local distance values.
Machine GRAPHICS & VISION vol. 23, no. 1/2, 2014 pp. 59–82

F. Torkhani, K. Wang, and J.-M. Chassery 77
(a) (b) (c) (d)
(e) (f) (g) (h)
Fig. 8. Application of TPDM to the perceptual evaluation of robust mesh watermarking: (a)- originalBunny model; (b)- Bunny watermarked by using the method in [33]; (c)- and (d)- modelswatermarked by the method in [21] giving, respectively, the same MRMS and TPDM distortionas (b); (e)- original Venus model; (f)- Venus watermarked by the method in [33]; (g)- and (h)-models watermarked by the method in [21], giving, respectively, the same MRMS and TPDMdistortion as (f). The TPDM values are those obtained after psychometric fitting.
4.2. Applications
In this subsection, we show two simple examples to illustrate the potential of TPDMin practical mesh applications. The two examples concern, respectively, the qualityevaluation of watermarked meshes and the optimum quantization level selection for meshvertex coordinates.
Figure 8 shows the potential application of our metric TPDM in the visual qualityassessment of watermarked meshes or, more generally, in the benchmarking of robustmesh watermarking algorithms. Indeed, when comparing two robust watermarking al-gorithms, a common strategy is to first of all fix the amount of distortion induced bywatermark embedding, and then compare the robustness of watermarks against a series
Machine GRAPHICS & VISION vol. 23, no. 1/2, 2014 pp. 59–82

78 A curvature-tensor-based perceptual quality metric for 3D triangular meshes
5 6 7 8 9 10 11 12 13 14 150.1
0.2
0.3
0.4
0.5
0.6
0.7
0.8
0.9
1
Quantization levels (bpc)
TP
DM
TPDM measures vs. quantization levels
ChinchillaHorseLionVaseBimba
(a)
5 6 7 8 9 10 11 12 13 14 150.1
0.2
0.3
0.4
0.5
0.6
0.7
0.8
0.9
1
Quantization levels (bpc)
LTP
DM
95−
th p
erce
ntile
s
LTPDM 95−th percentiles vs. quantization levels
ChinchillaHorseLionVaseBimba
(b)
Fig. 9. Application of TPDM for the selection of optimum quantization level of mesh vertex coordinates:(a)- TPDM versus quantization levels, with threshold τTPDM = 0.40; and (b)- 95-th percentilesof LTPDM versus quantization levels, with threshold τLTPDM = 0.40.
of attacks, such as noise addition, smoothing and simplification. The question comes tohow to quantify the induced distortion. We consider that using classical mesh geometricdistances (e.g., maximum root mean squared error, MRMS [6, 11]) is not appropriate,at least when the watermarked meshes are used in applications having human beings asusers. In Figs. 8(b) and 8(f) (second column of the figure) we show two watermarkedmodels generated by the method of Wang et al. [33]. We show in Figs. 8(c) and 8(g)(third column) the corresponding watermarked models produced by the method of Choet al. [21] that have exactly the same MRMS as Wang et al.’s models. Despite havingthe same MRMS values, the watermarked models produced by the two methods areof significantly different visual quality, and so it would be unfair to conduct robustnesscomparison on these models. In contrast, the comparison would be fair enough, at leastfor applications where the visual quality of watermarked mesh is very important, if wefix the amount of TPDM distortion induced by the two methods. We show in Figs. 8(d)and 8(h) (last column) the watermarked models produced by the method of Cho etal. [21] that have exactly the same TPDM values as the models of Wang et al. Thewatermarked meshes are of comparable and good visual quality.
The second potential application of TPDM shown here is automatic selection of theoptimum quantization level of mesh vertex coordinates, defined as the minimum numberof bits allocated for representing each quantized coordinate that does not introduce un-acceptable visual distortion. Vertex coordinate quantization is almost a mandatory stepin lossy mesh compression, but the selection of optimum quantization level is in generalmesh-dependent and tedious, which often requires efforts of human observers. TPDMcould help us facilitate this task. For this purpose, we introduce two kinds of thresholds,as explained below. The first threshold τTPDM is defined on the global TPDM value,which guarantees good global visual quality of the mesh after quantization. In Fig. 9(a)
Machine GRAPHICS & VISION vol. 23, no. 1/2, 2014 pp. 59–82

F. Torkhani, K. Wang, and J.-M. Chassery 79
we plot TPDM values versus quantization levels for four meshes of different geomet-ric complexity, and the threshold (i.e., the maximum allowable TPDM introduced byquantization) is fixed as 0.40. The second threshold τLTPDM is defined on the localtensor-based perceptual distance measures, so as to ensure precise control of the localdistortion. For this local control, we first compute the 95-th percentile of the LTPDMdistances after quantization (i.e., the value below which 95 percent of LTPDM dis-tances may be found in a quantized mesh), and then compare this percentile value withτLTPDM . In Fig. 9(b) we show the 95-th percentiles of LTPDM versus quantizationlevels, and the threshold τLTPDM is fixed as 0.40, the same value as τTPDM . Comparedto the global threshold, the local threshold appears to be a more strict metric for thecontrol of introduced distortion. We show the quantization results in Fig. 10. For Chin-chilla and Bimba, both global and local thresholds select the same level as the optimum,i.e., 10 bpc (bits per coordinate) for Chinchilla and 11 bpc for Bimba, which are consistentwith human perception. For Horse, after applying the global threshold, a relatively lowquantization level 10 bpc is selected, which results in a mesh of rather globally acceptablevisual quality, but with some high-amplitude local distortions (especially on the head);the local threshold is stricter and selects 11 bpc as the optimum, so as to avoid visuallyunacceptable local distortion. Another remark is that TPDM may result in unstableassessment results for meshes with relatively few vertices. As shown in Fig. 9(a), forChinchilla, which has 4307 vertices, the distorted mesh obtained after 10-bit quantiza-tion is of better quality than the mesh obtained after 11-bit quantization, according tothe TPDM values. Although the two meshes are of rather comparable visual quality(cf. Figs. 10(b) and 10(c)), we think that this is a drawback of the proposed metric, andan improvement on this point will be part of our future work.
5. Conclusion and Future Work
A new curvature-tensor-based approach to objective evaluation of visual mesh qualityhas been proposed. We show that it is beneficial to use the information on both thecurvature amplitudes and the principal curvature directions for MVQ assessment. Thelocal tensor distance that we propose may be found useful in other mesh applications,such as mesh segmentation and shape matching. Experimental results show that ourTPDM metric has high correlation with subjective scores and performance comparablewith the best performing MVQ metrics proposed so far. Finally, two simple examplesillustrate the potential applications of the proposed metric.
TPDM implementation is freely available on-line at http://www.gipsa-lab.fr/
~fakhri.torkhani/software/TPDM.rar. Future work will consists mainly in integrat-ing more HVS features into the metric (e.g., the contrast sensitivity function), extendingthe metric to perceptual evaluation of triangular meshes with photometric properties(i.e., with color and textures), and developing a curvature-tensor-based visual quality
Machine GRAPHICS & VISION vol. 23, no. 1/2, 2014 pp. 59–82

80 A curvature-tensor-based perceptual quality metric for 3D triangular meshes
(a) Q = 9 bpc (b) Q = 10 bpc (c) Q = 11 bpc
(d) Q = 10 bpc (e) Q = 11 bpc (f) Q = 12 bpc
(g) Q = 9 bpc (h) Q = 10 bpc (i) Q = 11 bpc
Fig. 10. Application of TPDM to the selection of optimum quantization level of mesh vertex coordi-nates. For Chinchilla (first row, (a)-(c)), both global and local thresholds select 10 bpc as theoptimum level (Q in bits per coordinate). For Bimba (second row, (d)-(f)), both global and localthresholds select 11 bpc as the optimum level. For Horse (third row, (g)-(i)), the global thresholdselects 10 bpc as the optimum level while the local threshold selects 11 bpc as the optimum level.
Machine GRAPHICS & VISION vol. 23, no. 1/2, 2014 pp. 59–82

F. Torkhani, K. Wang, and J.-M. Chassery 81
metric for dynamic meshes. In particular, for perceptual evaluation of dynamic meshes,it would be interesting to derive a spatial-temporal perceptually-oriented curvature ten-sor distance that accounts for both the spatial visual masking effect (as shown in thispaper) and the temporal visual masking effect due to the movement of the 3D mesh.
References
1927[1] A. Michelson. Studies in Optics. Univ. of Chicago Press.
1969[2] H. S. M. Coxeter. Introduction to Geometry, 2nd Ed. Wiley.
1985[3] M. Brady, J. Ponce, A. L. Yuille, and H. Asada. Describing surfaces. Comput. Vision, Graphics,
and Image Process., 32(1):1–28.
1993[4] H. Kukkonen, J. Rovamo, K. Tiippana, and R. Nasanen. Michelson contrast, RMS contrast and
energy of various spatial stimuli at threshold. Vision Research, 33(10):1431–1436.
1995[5] M. C. Morrone, D. C. Burr, and L. M. Vaina. Two stages of visual processing for radial and circular
motion. Nature, 376(6540):507–509.
1998[6] P. Cignoni, C. Rocchini, and R. Scopigno. Metro: measuring error on simplified surfaces. Comput.
Graphics Forum, 17(2):167–174.
2000[7] P. G. Engeldrum. Psychometric Scaling: A Toolkit for Imaging Systems Development. Imcotek
Press.[8] A. Hertzmann and D. Zorin. Illustrating smooth surfaces. In Proc. of ACM Siggraph, pages 517–526.[9] Z. Karni and C. Gotsman. Spectral compression of mesh geometry. In Proc. of ACM Siggraph, pages
279–286.
2001[10] B.-E. Rogowitz and H.-E. Rushmeier. Are image quality metrics adequate to evaluate the quality
of geometric objects. In Proc. of Human Vision and Electronic Imaging, pages 340–348.
2002[11] N. Aspert, D. Santa-Cruz, and T. Ebrahimi. MESH: measuring errors between surfaces using the
Hausdorff distance. In Proc. of IEEE Int. Conf. on Multimedia & Expo, pages 705–708.
2003[12] P. Alliez, D. Cohen-Steiner, O. Devillers, B. Levy, and M. Desbrun. Anisotropic polygonal remeshing.
ACM Trans. on Graphics, 22(3):485–493.[13] D. Cohen-Steiner and J. M. Morvan. Restricted Delaunay triangulations and normal cycle. In Symp.
on Computational Geometry, pages 312–321.[14] O. Sorkine, D. Cohen-Or, and S. Toledo. High-pass quantization for mesh encoding. In Proc. of
Eurographics/ACM Siggraph Symp. on Geometry Process., pages 42–51.[15] Z. Wang and X. Shang. Spatial pooling strategies for perceptual image quality assessment. In Proc.
of IEEE Int. Conf. on Image Process., pages 2945–2948.
2004[16] Z. Wang, A. C. Bovik, H. R. Sheikh, and E. P. Simoncelli. Image quality assessment: From error
visibility to structural similarity. IEEE Trans. on Image Process., 13(4):600–612.
2006[17] G. Lavoue, E. Drelie Gelasca, F. Dupont, A. Baskurt, and T. Ebrahimi. Perceptually driven 3D
distance metrics with application to watermarking. In Proc. of SPIE Electronic Imaging, pages63120L.1–63120L.12.
Machine GRAPHICS & VISION vol. 23, no. 1/2, 2014 pp. 59–82

82 A curvature-tensor-based perceptual quality metric for 3D triangular meshes
[18] O. Sorkine. Differential representations for mesh processing. Comput. Graphics Forum, 25(4):789–807.
[19] Z. Wang and A. C. Bovik. Modern Image Quality Assessment. Morgan & Claypool.
2007[20] B. G. Breitmeyer. Visual masking: past accomplishments, present status, future developments.
Advances in Cognitive Psychology, 3(1-2):9–20.[21] J.-W. Cho, R. Prost, and H.-Y. Jung. An oblivious watermarking for 3-D polygonal meshes using
distribution of vertex norms. IEEE Trans. on Signal Process., 55(1):142–155.[22] M. Corsini, E. Drelie Gelasca, T. Ebrahimi, and M. Barni. Watermarked 3-D mesh quality assess-
ment. IEEE Trans. on Multimedia, 9(2):247–256.
2008[23] F. Cole, A. Golovinskiy, A. Limpaecher, H.-S. Barros, A. Finkelstein, T. Funkhouser, and
S. Rusinkiewicz. Where do people draw lines? ACM Trans. on Graphics, 27(3):88:1–88:11.[24] B. Vallet and B. Levy. Spectral geometry processing with manifold harmonics. Comput. Graphics
Forum, 27(2):251–260.
2009[25] Z. Bian, S.-M. Hu, and R. R. Martin. Evaluation for small visual difference between conforming
meshes on strain field. J. of Comput. Sci. and Technol., 24(1):65–75.[26] G. Lavoue. A local roughness measure for 3D meshes and its application to visual masking. ACM
Trans. on Appl. Perception, 5(4):21:1–21:23.[27] Q. Li and Z. Wang. Reduced-reference image quality assessment using divisive normalization-based
image representation. IEEE J. Sel. Topics Signal Process., 3(2):202–211.[28] S. Silva, B. S. Santos, C. Ferreira, and J. Madeira. A perceptual data repository for polygonal
meshes. In Proc. of Int. Conf. in Visualization, pages 207–212.[29] Z. Wang and A. C. Bovik. Mean squared error: love it or leave it? — A new look at signal fidelity
measures. IEEE Signal Process. Magazine, 26(1):98–117.
2010[30] M. Botsch, L. Kobbelt, M. Pauly, P. Alliez, and B. Levy. Polygon Mesh Processing. AK Peters,
2010.[31] G. Lavoue and M. Corsini. A comparison of perceptually-based metrics for objective evaluation of
geometry processing. IEEE Trans. on Multimedia, 12(7):636–649.
2011[32] G. Lavoue. A multiscale metric for 3D mesh visual quality assessment. Comput. Graphics Forum,
30(5):1427–1437.[33] K. Wang, G. Lavoue, F. Denis, and A. Baskurt. Robust and blind mesh watermarking based on
volume moments. Comput. & Graphics, 35(1):1–19.[34] Z. Wang and A. C. Bovik. Reduced- and no-reference image quality assessment. IEEE Signal
Process. Magazine, 28(6):29–40.
2012[35] P. Alliez, S. Tayeb, and C. Wormser. 3D fast intersection and distance computation (AABB tree).
In CGAL User and Reference Manual.[36] F. Torkhani, K. Wang, and J.-M. Chassery. A curvature tensor distance for mesh visual quality
assessment. In Proc. of Int. Conf. on Computer Vision and Graphics, pages 253–263.[37] L. Vasa and J. Rus. Dihedral angle mesh error: a fast perception correlated distortion measure for
fixed connectivity triangle meshes. Comput. Graphics Forum, 31(5):1715–1724.[38] K. Wang, F. Torkhani, and A. Montanvert. A fast roughness-based approach to the assessment of
3D mesh visual quality. Comput. & Graphics, 36(7):808–818, 2012.
2013[39] M. Corsini, M.C. Larabi, G. Lavoue, O. Petrık, L. Vasa, and K. Wang. Perceptual metrics for
static and dynamic triangle meshes. Comput. Graphics Forum, 32(1):101–125. (Improved version ofEurographics 2012 state-of-the-art report).
[40] G. Lavoue. Erratum of the Results of Mesh Visual Quality Metrics (Available on-line at http:
//liris.cnrs.fr/glavoue/travaux/Erratum.html), 2013.
Machine GRAPHICS & VISION vol. 23, no. 1/2, 2014 pp. 59–82


![Riemannian GeometryRiemannian Geometry Dr Emma Carberry Semester 2, 2015 Lecture 15 [Riemannian Geometry – Lecture 15]Riemannian Geometry – Lecture 15 Riemann Curvature Tensor](https://img.pdfslide.us/doc/110x75/5eaeb2e645c7213d450b3d20/riemannian-riemannian-geometry-dr-emma-carberry-semester-2-2015-lecture-15-riemannian.jpg)