Embed Size (px)
Citation preview
A cross-country analysis of electricity market reforms:
potential contribution of New Institutional Economics
Erkan Erdogdu
June 2012
CWPE 1232 & EPRG 1216
www.eprg.group.cam.ac.uk
EP
RG
WO
RK
ING
PA
PE
R
Abstract
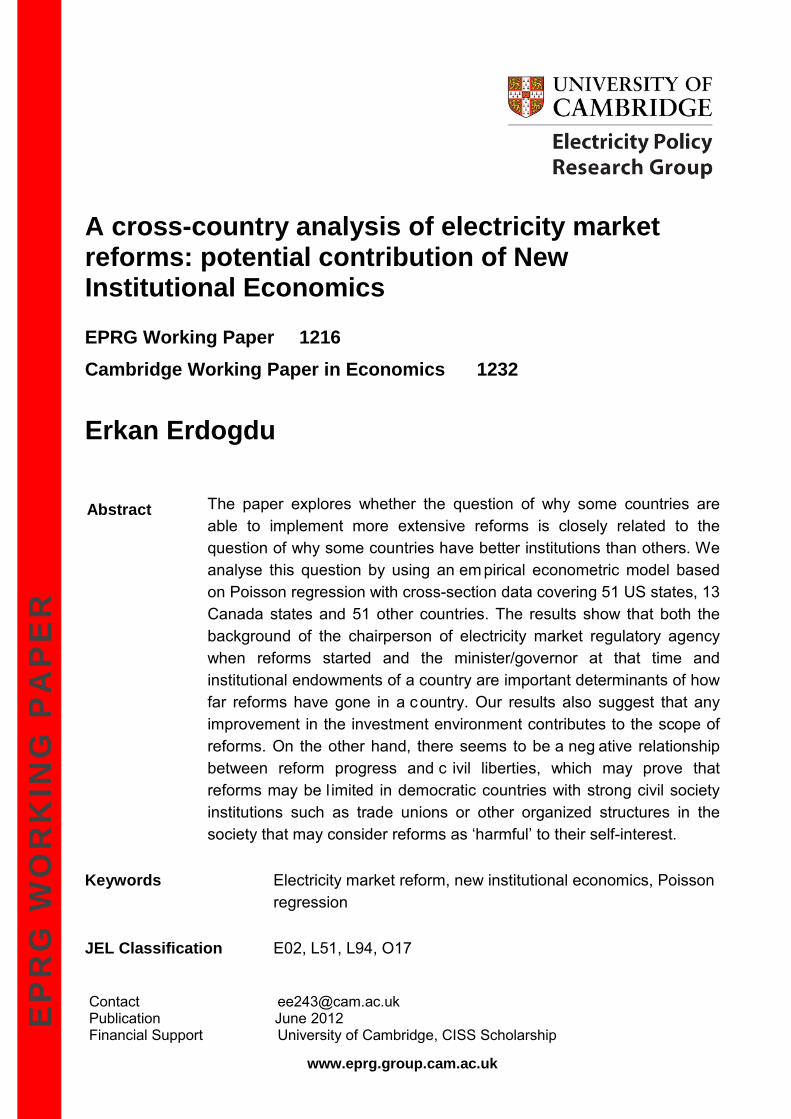
A cross-country analysis of electricity market reforms: potential contribution of New Institutional Economics
EPRG Working Paper 1216 Cambridge Working Paper in Economics 1232
Erkan Erdogdu
The paper explores whether the question of why some countries are able to implement more extensive reforms is closely related to the question of why some countries have better institutions than others. We analyse this question by using an em pirical econometric model based on Poisson regression with cross-section data covering 51 US states, 13 Canada states and 51 other countries. The results show that both the background of the chairperson of electricity market regulatory agency when reforms started and the minister/governor at that time and institutional endowments of a country are important determinants of how far reforms have gone in a country. Our results also suggest that any improvement in the investment environment contributes to the scope of reforms. On the other hand, there seems to be a neg ative relationship between reform progress and c ivil liberties, which may prove that reforms may be l imited in democratic countries with strong civil society institutions such as trade unions or other organized structures in the society that may consider reforms as ‘harmful’ to their self-interest.
Keywords Electricity market reform, new institutional economics, Poisson regression
JEL Classification E02, L51, L94, O17
Contact [email protected] Publication June 2012 Financial Support University of Cambridge, CISS Scholarship
EPRG WP 1216
1
A cross-country analysis of electricity market
reforms: potential contribution of New
Institutional Economics1
Erkan Erdogdu*
Judge Business School, University of Cambridge
Trumpington Street, Cambridge, CB2 1AG, UK
13 June 2012
Abstract
The paper explores whether the question of why some countries are able to
implement more extensive reforms is closely related to the question of why some
countries have better institutions than others. We analyse this question by using
an empirical econometric model based on Poisson regression with cross-section
data covering 51 US states, 13 Canada states and 51 other countries. The results
show that both the background of the chairperson of electricity market
regulatory agency when reforms started and the minister/governor at that time
and institutional endowments of a country are important determinants of how
far reforms have gone in a country. Our results also suggest that any
improvement in the investment environment positively contributes to the scope
of reforms. On the other hand, there seems to be a negative relationship between
reform progress and civil liberties, which may prove that reforms may be limited
in democratic countries with strong civil society institutions such as trade unions
or other organized structures in the society that may consider reforms as
‘harmful’ to their self-interest.
1 This paper is a part of the author’s PhD thesis.
* Corresponding author. Tel.: +44(0)787-6063091
E-mail: [email protected] & [email protected]
EPRG WP 1216
2
Keywords: Electricity market reform, new institutional economics, Poisson
regression
JEL Classification: E02, L51, L94, O17
1. Introduction
One of the main objectives of any economic reform is to bring changes in the
institutional arrangement so that economic activities can be performed more
efficiently. Besides, reforming any sector in an economy requires changing the
institutional environment, changing the organisational structure and modifying
the governance mechanism. Since the late 1980s, power market reform has
become the standard prescription of the multilateral donor agencies like the IMF
and the World Bank and the reform program has been implemented vigorously
for about three decades now. Although the content of each reform program has
differed from one country to another, the policy of functional disintegration, the
establishment of regulatory authorities, the formation of wholesale and retail
power markets and the privatization of the electricity industry have been
generally regarded as the natural components of a reform program without
paying much attention to the institutional environment of the country.
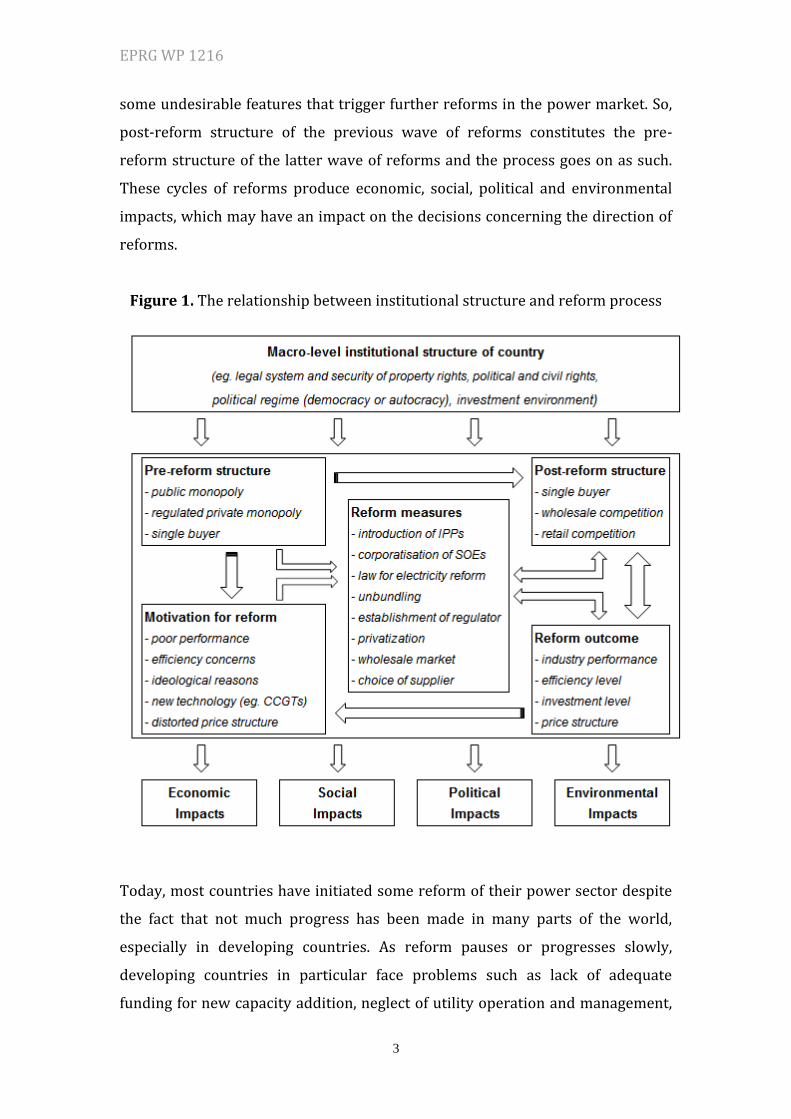
Figure 1 presents the relationship between institutional structure and reform
process. As can be seen in Figure 1, whole reform process takes place and is
directly affected by the macro level institutional structure of the country in
which reforms are put into practice. The examples of macro level institutional
structure of a country include its legal system, measures that guarantee security
of property rights in this country, the degree of political and civil rights provided
by the political regime, investment environment in the country and so on.
Through reform measures, the pre-reform structure of power market is
transformed into post-reform structure. In general, pre-reform structure
corresponds to public monopolies or regulated private monopolies and post-
reform structure refers to a competitive electricity market where competition at
retail or, at least, wholesale level is possible. Usually, post-reform structure has
EPRG WP 1216
3
some undesirable features that trigger further reforms in the power market. So,
post-reform structure of the previous wave of reforms constitutes the pre-
reform structure of the latter wave of reforms and the process goes on as such.
These cycles of reforms produce economic, social, political and environmental
impacts, which may have an impact on the decisions concerning the direction of
reforms.
Figure 1. The relationship between institutional structure and reform process
Today, most countries have initiated some reform of their power sector despite
the fact that not much progress has been made in many parts of the world,
especially in developing countries. As reform pauses or progresses slowly,
developing countries in particular face problems such as lack of adequate
funding for new capacity addition, neglect of utility operation and management,
EPRG WP 1216
4
and increase in government involvement in the management and decision-
making of the industry, contrary to the expected objectives of the reform
(Bhattacharyya, 2007). The purpose of this paper is to find out whether the
institutional endowments of a specific country constitute a strong, or a weak,
constraint on how far the power market reform has gone in that country. So, we
try to check whether the question of why some countries are able to implement
more extensive reforms is closely related to the question of why some countries
have better institutions than others. This paper develops the empirical case that
differences in institutions are the fundamental cause of differences in the extent
of the reforms implemented in each country.
The interest and motivation for this topic arises from the relatively recent
agreement that has emerged among scholars in regarding institutions as a key
factor shaping the outcome of an economic transformation. This objective is
pursued by discussing implications of the conceptual framework proposed by
the New Institutional Economics for power market reform. Besides, evidence
resulting from an econometric empirical analysis that investigates the
relationship between institutions and reforms is presented as well.
The reform experience so far (especially in developing countries) suggests two
consistent findings. First, institutional endowments of a country (such as judicial
independence, integrity of the legal system, protection of property rights, legal
enforcement of contracts and degree of polity) largely determine the extent of
the reforms. Second, despite the different approaches in the design of regulatory
institutions, a separate agency from the government with reasonable levels of
autonomy and technical expertise has emerged as the preferred model for a
regulatory institution. Due to path dependency, the chairperson of electricity
market regulatory agency when reforms started or were considered and the
governor/minister responsible for energy policy at that time play a critical role
in the process. Therefore, in this study, we focus on these macro (general
institutional endowments) and micro (background of the chairperson and the
minister/governor) variables as key factors explaining differences in the extent
of the reforms implemented in various countries.
EPRG WP 1216
5
We try to answer the following research questions: (i) do differences in
institutional structures of countries play an important role in explaining how far
reforms have gone in these countries? (ii) if they do, how do specific institutional
endowments of a country affect its reform performance? (iii) does the
background of the chairperson of the regulatory agency when reforms started or
were considered or that of the governor or minister responsible for energy
policy at that time have an impact on reform progress?
The paper proceeds as follows. The next section provides a conceptual
framework and literature review on the New Institutional Economics. Section 3
focuses on what we have learned from NIE for electricity market reform. Section
4 summarizes the methodological framework. Section 5 describes data.
Following section presents empirical analysis and discusses the results. The last
section concludes.
2. Conceptual framework and literature review
In recent years the role of institutions in promoting and sustaining economic
change has been an issue of interest for both theoretical and empirical analyses.
The main question is “what determines the divergent patterns of evolution of
countries or economies over time?” Africa’s disappointing economic
performance, the East Asian financial crisis, and the weak record of the former
Soviet Union have also contributed to an increasing focus on the role of
institutions in determining a country’s economic growth and performance (Aron,
2000). Within this context, New Institutional Economics (NIE) has emerged as
the body of economic thought that considers institutions to be relevant to
economic theory, and criticizes the neo-classical mainstream for having pushed
them out of the discipline; it deals especially with the nature, origin and
evolution of institutions, and their effects on economic performance (Chavance,
2009).
EPRG WP 1216
6
The increasing focus on NIE is also evident in World Bank publications. World
Bank (1997, 2002) recommends that states develop strong regulatory
mechanisms to encourage legal accountability, minimize corruption, and foster
competition via privatization. The World Bank regards privatization as a solution
to rent-seeking behaviour of corrupt officials. In response to the bureaucracy’s
drain on public resources, competition, it is argued, will raise the transaction cost
of seeking protection and subsidy from the state, and henceforth promote
efficiency between firms.
Presenting an extensive literature review on NIE is both outside the scope of this
paper and not possible given limitations on the length of the study. Therefore, in
this section, we summarize the main characteristics of NIE, mention its
difference from “old” institutional economics, review central themes in NIE (such
as property rights, transaction costs, path dependency and the difference
between institutions and organizations), cite main criticisms against it, and
finally provide some principal examples of empirical work based on NIE.
Although there is some academic work that investigates the impact of
institutions on electricity market reform outcome (e.g. Haney & Pollitt (2011));
to the best of our knowledge, this study constitutes the first empirical work that
focuses on the possible implications of NIE for electricity market reform.
Oliver Williamson is the inventor (in 1975) of the term ‘new institutional
economics’, which from the 1990s on came to refer to idea that ‘institutions
matter’ and that these can be analysed (Chavance, 2009). New institutional
economics abandons the standard neoclassical assumptions that individuals
have perfect information and unbounded rationality and that transactions are
costless and instantaneous (Ménard & Shirley, 2008). The NIE starts from the
reality that information is rarely complete, and transactions thus have costs
associated with them, such as costs of finding out what the relevant prices are, of
negotiating and of concluding contracts, and then of monitoring and enforcing
them. Institutions are broadly defined as means of reducing these information
and transaction costs (Harriss, Hunter, & Lewis, 1997). So, the NIE can be seen as
a development of neo-classical economics to include the role of transaction costs

EPRG WP 1216
7
in exchange and so to take account of institutions as critical constraints on
economic performance. For new institutionalists, the performance of a market
economy (or scale and scope of an economic reform process) depends upon the
formal and informal institutions and modes of organization that facilitate private
transactions and cooperative behaviour.
Douglass North is a particularly significant exponent of the NIE. The main
message stemming from North’s analysis is that institutions affect economic
performance by influencing the level of transaction costs and, hence, the
feasibility and profitability of engaging in economic activity. In other words,
institutions determine the opportunity set and provide a stable structure to
human interaction by reducing uncertainty (North, 1990). For him, institutions
are not necessarily or even usually created to be socially efficient; rather they are
created to serve the interests of those with greater political and economic power
(Acemoglu, Johnson, & Robinson, 2005).
The NIE is ‘new’ because there is an older school of institutionalism in
economics. According to many scholars, the origins of institutional economics
can be traced back to Coase (1937), whose most important message was that
when it is costly to transact, institutions matter (Gagliardi, 2008). The
assumption of standard economic theory that transaction costs were zero was a
great analytical convenience and, for a long time, went unquestioned. Upon
pushing the logic of zero transaction costs to completion, however, serious gaps,
errors, and anomalies were exposed by Ronald Coase, who was the first to
perceive and demonstrate the conceptual problems that resided therein
(Ghertman & Ménard, 2009). However, unlike old institutional economics, NIE
does not abandon neoclassical economic theory. While new institutionalists
reject the neoclassical assumption of perfect information and instrumental
rationality, they accept orthodox assumptions of scarcity and competition.
Having briefly mentioned the basic idea behind NIE let me focus on central
themes in it. NIE assumes the existence of a fundamental relationship between
property rights and transaction costs, on the one hand, and property rights and
EPRG WP 1216
8
institutions, on the other. The establishment and maintenance of property rights
entail transaction costs and property rights are institutions by themselves
(Musole, 2009). So, property rights, which define the use, income rights and
transferability of assets, constitute the core of the economic institutions; and the
concept of transaction costs is central to the discussion of property rights. When
rights are not clearly defined, transaction costs increase and market failures
occur. For new institutionalists, the aim of institutions is to reduce transaction
costs so as to allow agents to seize on economic opportunities, and an efficient
institution is simply an arrangement that minimizes such costs, or one which
maximizes the joint wealth of all the parties concerned net of transaction costs
(Brousseau & Glachant, 2008).
Actually, there is no consensus on how transaction costs should be defined.
Instead, several definitions exist in the literature. For example, transaction costs
have variously been defined as the cost of using the price mechanism; the costs
of exchanging ownership titles; the costs of running the economic system; the
costs associated with the transfer, capture and protection of rights; the costs of
measuring valuable attributes of that which is being exchanged, as well as the
costs of monitoring and enforcing agreements; the ex-ante costs of drafting,
negotiating and safeguarding an agreement and the ex-post costs of haggling,
contract governance, and bonding costs to secure commitment, the resources
used to establish and maintain property rights; or simply the ‘economic
equivalent of friction in physical systems’ (Musole, 2009).
North (1990) considers transaction costs as partly market costs and partly the
costs of time that each party must devote to gathering information, to searching,
and so on. In addition to this categorisation, North mentions a type of transaction
cost that does not go through the marketplace, called “non-market transaction
costs”. This type of transaction cost includes the high costs of searching where
information is not efficiently distributed, and the substantial costs of undertaking
economic activity in compliance with rules and regulations. This type of
transaction cost includes costs of queuing, bribing officials, cutting through red
tape, time involved in obtaining permits to do business, and so forth. Besides, it is
EPRG WP 1216
9
argued that transaction costs not only exist but also they are huge. It is thought
that transaction costs may represent about 50-60% of net national product of
modern market economies. In less developed economies, transaction costs are
thought to make up an even higher fraction of the overall GDP, and sometimes no
exchange takes place due to these high costs (Musole, 2009).
Another central theme in NIE is path dependency. For institutionalists, the
process of institutional change is incremental and largely path dependent. Path
dependence implies that if the process that leads to the emergence of a particular
set of institutions is relevant and constraints future choice, then not only history
matters but, more important, poor performance and long-run divergent patterns
of development are determined by the same source. Path dependence may
explain why some countries succeed and others do not (Gagliardi, 2008).
Therefore, getting the institutions right is critical because getting them wrong
can lead to path-dependency, whereby inefficient economic systems persist.
Relatively inefficient paths can, for example, be persistently followed over fairly
long historical periods. In fact, according to North, this is the case most
frequently found in history (North, 1990). The NIE approach suggests that the
differences in economic performance are related to institutional endowments.
The economic performance of a country depends on whether an independent
judiciary, clearly defined property rights, control structures for enforcing
property rights and enforceable contracting arrangements exist or not. Given the
institutional environment, the opportunities provided by the institutional
environment will be reflected in the nature and performance of organisations
that develop. Hence transition from one state to another is constrained by the
institutional arrangements (Bhattacharyya, 2007). In short, NIE maintains that
once an economy is on an “inefficient” path that produces stagnation it can
persist (and historically has persisted) because of the nature of path dependence.
Unlike ‘old’ institutional economics, North (1990) states that it is essential to
distinguish institutions from organizations. For him, if institutions are the rules
of the game, organizations and their entrepreneurs are the players.
Organizations are groups of individuals bound by some common purpose to
EPRG WP 1216
10
achieve objectives. They include political bodies (e.g. political parties), economic
bodies (e.g. firms, trade unions, regulatory agencies), social bodies (e.g. clubs,
associations) and educational bodies (e.g. schools, universities). Moreover, North
(1990) argues that institutions and organizations are interdependent entities.
The institutional framework determines the opportunities in a society and the
emergence and evolution of certain organizations. In turn, organizations
influence how institutions evolve, thus being agents of institutional change.
Despite recognizing that inefficient institutions are difficult to surmount once
they become path-dependent, the critics of NIE argue, the NIE fails to explain
how to overcome this path dependency. Institutions are important determinants
of economic performance. But when it comes to new general insights about how
that determination works, the NIE adds nothing to what we already have. No
new predictions are derived; no new policies are recommended (Harriss et al.,
1997).
As mentioned before, there is no previous empirical study that applies NIE
approach to the analysis of power market reforms, so we cannot provide a
review of previous studies similar to this one. Instead, we will mention some
examples of applied work based on the NIE approach. Appendix 1 presents
details of these econometric studies including hypotheses tested, dependent
variables, explanatory variables, results, data and methodology. Appendix 2
classifies previous econometric studies by their focus. Besides, in applied NIE
studies, various variables are used to measure different aspects of institutional
structure. Basically, there are three aspects of institutions: the presence of
institutions, the organization (or form) of institutions and the outcome of
institutions. The presence of institutions concerns whether specific institutions
exist, without paying attention to their organization or outcome. The
organization (or form) of institutions is to do with the way institutions are
actually operated. The outcome of institutions is to do with an overall
assessment of the impact of the institutions on the performance of the countries
or industries (Green, Lorenzoni, Pérez, & Pollitt, 2009). Variables in previous
studies either measure one of these aspects or are used as control variables.
EPRG WP 1216
11
Appendix 3 presents variables employed in previous econometric studies by
what they measure.
In their papers, Acemoglu et al. (2008; 2001) and Nunn (2008) focus on the
relationship between historical institutions and present economic performance.
Acemoglu et al. (2008) draw a distinction between economic and political
inequality. They point out that while land inequality is negatively correlated with
school enrolment in the data for US states in the early part of the twentieth
century, it is positively correlated across areas in the state of Cundinamarca in
Colombia. They ask whether political inequality could have played a role in
driving inequality in schooling. The answer they found is that it did. Acemoglu et
al. (2008) also propose an explanation of why land inequality may affect
outcomes differently, arguing that the relationship depends on whether the
polities are weakly or strongly institutionalized. In weakly institutionalized
polities, in which formal political institutions do not adequately constrain the
executive, economic inequality may generate an effective counterweight to the
executive. In strongly institutionalized polities, economic inequality may enable
the few rich to capture politics to the detriment of the general public. On the
other hand, Acemoglu et al. (2001) use differences in European mortality rates to
estimate the effect of institutions on economic performance. Europeans adopted
very different colonization policies in different colonies, with different associated
institutions. In places where Europeans faced high mortality rates, they could not
settle and were more likely to set up extractive institutions. These institutions
persisted to the present. Exploiting differences in European mortality rates as an
instrument for current institutions, Acemoglu et al. (2001) estimate large effects
of institutions on income per capita. They find that once the effect of institutions
is controlled for, countries in Africa or those closer to the equator do not have
lower incomes. The empirical evidence stemming from Acemoglu et al. (2001)
seems to provide support to the idea that current institutions, inherited from the
past, have a large effect on current income per capita. In a similar way, Nunn
(2008) estimated the impact of the fraction of slaves in a country’s population
circa 1750 on its per capita gross domestic product (GDP) in the year 2000. He
finds that, within the group of New World countries, those that had larger
EPRG WP 1216
12
fractions of slaves in the mid-eighteenth century were poorer at the end of the
twentieth century. A similar relationship holds for a smaller sample of countries
from the British West Indies, for which Nunn (2008) uses slavery data from
1830. He also finds a negative impact of slavery on economic development across
U.S. states.
In the literature, there are many applied papers that investigate the relationship
between political institutions and economic growth. The primary examples
include Persson and Tabellini (2008), Besley and Kudamatsu (2008), Aghion et
al. (2008), Drury et al. (2006), Isham et al. (1997), Alesina et al. (1996), Caselli et
al. (1996), Clague et al. (1996), Mauro (1995), Alesina and Rodrik (1994),
Helliwell (1994) and Scully (1988). Persson and Tabellini (2008) propose an
empirical method for estimating the impact of regime change on the growth rate
of income per capita, in the wake of heterogeneous effects of regime change.
Their nonparametric matching estimates suggest that previous studies
underestimated the growth effects of democracy. They also argue that the two
types of regime change are asymmetric, in that a switch from democracy to
autocracy has a bigger negative impact on growth than the positive impact of a
switch from autocracy to democracy. Besley and Kudamatsu (2008) start with
the observation that autocratic regimes do not always perform badly, at least as
judged by economic indicators, such as the growth rate of income per capita or
other components of the human development index, that is, health and
education. They argue that economic performance depends on the accountability
of political leaders, such as heads of states, and that this property can be
achieved in different ways in different political regimes. They show that
autocracy performs better than democracy if the selectorate is powerful and the
distributional conflict is significant yet not too salient. In all other cases,
democracy yields better results. Aghion et al. (2008) also focus on the impact of
democracy on growth and argue that the lack of robustness of this relationship
may be due to the fact that democratic institutions differentially impact sectoral
growth rates, depending on a sector’s level of technological development and, in
particular, depending on whether the sector is close or far away from the
technology frontier. They develop a model to illustrate this dependence. Without
EPRG WP 1216
13
controlling for the interaction between democracy and sectoral characteristics,
they find no significant impact of democracy on growth. But once democracy is
interacted with sectoral distance to the technology frontier, they find that
democracy has a larger impact on the growth of sectors that are closer to the
technology frontier and that the level of democracy has then also an independent
positive effect on growth.
Drury et al. (2006) argue that one of democracy’s indirect benefits is its ability to
mitigate the detrimental effect of corruption on economic growth. They maintain
that although corruption certainly occurs in democracies, the electoral
mechanism inhibits politicians from engaging in corrupt acts that damage overall
economic performance and thereby jeopardize their political survival. Using
time-series cross-section data for more than 100 countries for the period 1982-
97, they show that corruption has no significant effect on economic growth in
democracies, while non-democracies suffer significant economic harm from
corruption. Isham et al. (1997) use a cross-national data set on the performance
of government investment projects financed by the World Bank to examine the
link between government efficiency and governance. They find a strong
empirical link between civil liberties and the performance of government
projects. They show that even after controlling for other determinants of
performance, countries with the strongest civil liberties have projects with an
economic rate of return 8-22 percentage points higher than countries with the
weakest civil liberties.
Alesina et al. (1996) investigate the relationship between political instability and
per capita GDP growth in a sample of 113 countries for the period 1950 through
1982. They find that in countries and time periods with a high propensity of
government collapse, growth is significantly lower than otherwise. They also
discuss the effects of different types of government changes on growth. Caselli et
al. (1996) argue that there are two sources of inconsistency in existing cross-
country empirical work on growth: correlated individual effects and endogenous
explanatory variables. They estimate a variety of cross-country growth
regressions using a generalized method of moments estimator that eliminates
EPRG WP 1216
14
both problems. In one application, they find that per capita incomes converge to
their steady-state levels at a rate of approximately 10 percent per year. They
maintain that this result stands in sharp contrast to the current consensus, which
places the convergence rate at 2 percent.
Clague et al. (1996) present and test empirically a theory of property and
contract rights. They test whether any incentive an autocrat has to respect such
rights comes from his interest in future tax collections and national income, and
increases with his planning horizon. They find an empirical relationship between
property and contract rights and an autocrat’s time in power. They uncover that
in lasting (but not in new) democracies, the same rule of law and individual
rights that ensure continued free elections entail extensive property and contract
rights. They also show that the age of a democratic system is strongly correlated
with property and contract rights. Mauro (1995) analyses a data set consisting of
subjective indices of corruption, the amount of red tape, the efficiency of the
judicial system, and various categories of political stability for a cross section of
countries. Corruption is found to lower investment, thereby lowering economic
growth. Mauro (1995) argues that the results are robust to controlling for
endogeneity by using an index of ethnolinguistic fractionalization as an
instrument.
Alesina and Rodrik (1994) study the relationship between politics and economic
growth in a simple model of endogenous growth with distributive conflict among
agents endowed with varying capital/labour shares. They show that the greater
the inequality of wealth and income, the higher the rate of taxation, and the
lower growth. Their empirical results imply that inequality in land and income
ownership is negatively correlated with subsequent economic growth. Similarly,
using cross-sectional and pooled data for up to 125 countries over the period
from 1960 to 1985, Helliwell (1994) evaluates the two-way linkages between
democracy and economic growth. The effects of income on democracy are found
to be robust and positive. The study assesses the effects of several measures of
democracy and personal freedoms on growth in a comparative growth
framework. The general result from the paper is that it is still not possible to
EPRG WP 1216
15
identify any systematic net effects of democracy on subsequent economic
growth.
Finally, Scully (1988) compares the growth rates of per capita output and
efficiency measures for 115 market economies over the period 1960-80 with
measures of political, civil, and economic liberty. The study finds that the
institutional framework has significant and large effects on the efficiency and
growth rate of economies. The findings suggest that politically open societies,
which subscribe to the rule of law, private property, and the market allocation of
resources, grow at three times the rate and are two and one-half times as
efficient as societies in which these freedoms are abridged.
P. Keefer and Knack (2002), Easterly and Levine (1997) and Knack and Keefer
(1997) concentrate on the relationship between social structure and economic
growth. P. Keefer and Knack (2002) argue that social polarization reduces the
security of property and contract rights and, through this channel, reduces
growth. Their first hypothesis is supported by cross-country evidence indicating
that polarization in the form of income inequality, land inequality, and ethnic
tensions is inversely related to a commonly-used index of the security of
contractual and property rights. They find that when the security of property
rights is controlled for in cross-country growth regressions, the relationship
between inequality and growth diminishes considerably. They maintain that this
and other evidence provide support for their second hypothesis that inequality
reduces growth in part through its effect on the security of property rights.
Easterly and Levine (1997) argue that explaining cross-country differences in
growth rates requires not only an understanding of the link between growth and
public policies, but also an understanding of why countries choose different
public policies. Their paper shows that ethnic diversity helps explain cross-
country differences in public policies and other economic indicators. In the case
of Sub-Saharan Africa, they find that economic growth is associated with low
schooling, political instability, underdeveloped financial systems, distorted
foreign exchange markets, high government deficits, and insufficient
EPRG WP 1216
16
infrastructure. They show that Africa’s high ethnic fragmentation explains a
significant part of these characteristics.
Knack and Keefer (1997) also present evidence that “social capital” matters for
measurable economic performance, using indicators of trust and civic norms
from the World Values Surveys for a sample of 29 market economies. They reveal
that membership in formal groups is not associated with trust or with improved
economic performance. They find trust and civic norms are stronger in nations
with higher and more equal incomes, with institutions that restrain predatory
actions of chief executives, and with better-educated and ethnically
homogeneous populations.
The relationship between economic institutions (economic equality, protection
of property rights etc.) and economic growth are investigated by various authors
like Assane and Grammy (2003), Barro (1991, 1996, 2000), Keefer and Knack
(1997), Vanssay and Spindler (1994), Persson and Tabellini (1994) and Spindler
(1991). Assane and Grammy (2003) examine the effect of “quality” of the
institutional framework on economic development. Their empirical results
support the hypothesis that “good” institutions improve efficiency and accelerate
growth. The positive effect of institutional “quality” is more pronounced with
mutually reinforcing support of economic freedom. Their results also indicate
that “good” institutions help developing countries grow faster to achieve
conditional convergence. They infer from the results that economic development
requires not only physical and human capital formation, but also freedom to
choose and institutional support.
Barro (1991) shows that, for 98 countries in the period 1960-1985, the growth
rate of real per capita GDP is positively related to initial human capital (proxied
by 1960 school enrolment rates) and negatively related to the initial (1960) level
of real per capita GDP. It is found that countries with higher human capital also
have lower fertility rates and higher ratios of physical investment to GDP. The
study uncovers that growth is inversely related to the share of government
consumption in GDP but insignificantly related to the share of public investment,
EPRG WP 1216
17
and that growth rates are positively related to measures of political stability and
inversely related to a proxy for market distortions. Barro (1996) analyses
growth and democracy for a panel of about 100 countries from 1960 to 1990.
The study finds that the favourable effects on growth include maintenance of the
rule of law, free markets, small government consumption, and high human
capital. Once these kinds of variables and the initial level of real per capita GDP
are held constant, it is found that the overall effect of democracy on growth is
weakly negative. Barro (1996) suggests a nonlinear relationship in which more
democracy enhances growth at low levels of political freedom but depresses
growth when a moderate level of freedom has already been attained. It is also
seen that improvements in the standard of living -measured by GDP, health
status, and education- substantially raise the probability that political freedoms
will grow. Barro (2000) finds little evidence from a broad panel of countries
concerning overall relation between income inequality and rates of growth and
investment. The study reveals that higher inequality tends to retard growth in
poor countries and encourage growth in richer places. According to the results,
the Kuznets curve -whereby inequality first increases and later decreases during
the process of economic development- emerges as a clear empirical regularity.
Keefer and Knack (1997) question the early neoclassical prediction that poor
countries would grow faster than wealthy countries, because of technological
advances and diminishing returns to capital in the latter. They argue that the
reverse has occurred: poor countries are falling back rather than catching up.
They suggest that deficient institutions underlie this divergence. Employing
various indicators of institutional quality, including the rule of law, the
pervasiveness of corruption, and the risk of expropriation and contract
repudiation, they show that the ability of poor countries to catch up is
determined in large part by the institutional environment in which economic
activity in these countries takes place.
Vanssay and Spindler (1994) use an augmented Solow model, with cross section
data, to measure the effect on per-capita income of the entrenchment of various
rights in a country’s constitution and the level of economic freedom in a country.
EPRG WP 1216
18
Their results suggest that entrenchment of any single right seldom has a
significant general economic effect, while the effect of economic freedom is
significant and substantial. The paper then considers whether such evidence
could support the proposition that “constitutions do not matter.” While it
concludes otherwise, it does caution against incurring excessive negotiation
costs to obtain entrenchment of a comprehensive “wish list” of rights.
Persson and Tabellini (1994) question whether inequality is harmful for growth.
They argue that in a society where distributional conflict is important, political
decisions produce economic policies that tax investment and growth-promoting
activities in order to redistribute income. The paper formulates a theoretical
model that captures this idea. They support their model’s implications by the
evidence. They show that both historical panel data and post-war cross sections
indicate a significant and large negative relation between inequality and growth.
Finally, Spindler (1991) uses the Wright ratings of economic freedom to
investigate the relationship between economic freedom and economic
development for most countries in the world. The study finds that relationship is
apparently strong and direct for such economic freedoms as freedom of property
and freedom of movement but inverse for freedom of association.
The examples mentioned above confirm the idea that NIE approach has the
potential for application in very diverse areas. In the following sections, we will
present the first empirical study that analyses electricity market reforms with
tools supplied by NIE.
3. What we have learned from NIE for electricity market reform
New institutional economics contributes to the analysis of power sector reforms
in multiple ways. First of all, the literature that we summarized above clearly
shows that institutions matter for any economic reform and electricity market
reform is not an exception. In essence, electricity market reform is an
institutional reform that necessitates de facto or de jure regime change, creation
of new institutional structures and rearrangement or removal of existing ones.
EPRG WP 1216
19
Institutions may determine the divergent patterns of evolution of reform
processes in various countries over time. In the literature, the relationship
between institutions and economic transformations has been investigated by
many scholars. For instance, the link between political institutions and economic
change is explored by Aghion et al. (2008), Alesina et al. (1996), Alesina and
Rodrik (1994), Besley and Kudamatsu (2008), Caselli et al. (1996), Clague et al.
(1996), Drury et al. (2006), Helliwell (1994), Isham et al. (1997), Mauro (1995),
Persson and Tabellini (2008) and Scully (1988); while the impact of economic
institutions on economic change is investigated by Assane and Grammy (2003),
Barro (1991, 1996, 2000), Philip Keefer and Knack (1997), Persson and Tabellini
(1994), Spindler (1991) and Vanssay and Spindler (1994).
Second, while analysing reforms in electricity markets, we need to abandon the
standard neoclassical assumptions that we have perfect information and
unbounded rationality and that transactions are costless and instantaneous. The
NIE implies that information during whole reform process is rarely complete,
and transactions related to reform process have costs associated with them, such
as costs of finding out what and how to reform, of negotiating the reform
direction with interested parties, of passing necessary legislation, and then of
monitoring and enforcing it.
The third contribution of NIE is its suggestion that reformers should see
institutions as means of reducing information and transaction costs related to
reform design and implementation; and never forget that institutions may easily
turn into critical constraints on reform performance if not taken into account
properly. Simply, the performance of a reform program largely depends upon the
formal and informal institutions, which affect the reforms by influencing the level
of transaction costs and, hence, the feasibility of engaging in a reform initiative.
Fourth, NIE maintains that there is a fundamental relationship between property
rights, transaction costs and institutions. When property rights are not clearly
defined in the course of an electricity market reform, transaction costs increase
and reforms may fail.
EPRG WP 1216
20
The fifth advise from NIE for electricity market reform is that policy makers
should pay due attention to non-market transaction costs faced by the firms in
the market and do their best to eliminate or, at least, minimize them.
The sixth repercussion of NIE relevant to electricity reform is that the process of
electricity market reform is largely path dependent, which may explain why
some countries succeed and others do not in reforming their power sectors. So,
getting the institutions right is critical to reform success as getting them wrong
can lead to path-dependency, whereby inefficient electricity markets may
persist. So, to prevent inefficient institutional structures in the subsequent
reform phases, the utmost attention should be paid to arrangements at the very
beginning of the reform programs. Right people should set up right structures. In
this context, the chairperson of the electricity market regulator and the minister
responsible for energy policy when reforms started may have an important
impact on subsequent reform progress.
To sum up, the NIE approach suggests that the differences in performances of
different reform processes are related to institutional endowments. The success
or failure of a power market reform initiative depends to some extent on
whether a strong legal system, a proper investment environment, clearly defined
property rights, control structures for enforcing necessary legislation and
enforceable contracting arrangements exist or not. When we take into account
the notion that democratic systems encourage and support private participation
and free enterprise in the economy, we may assume that democratic countries
advance more rapidly in terms of power market reform process than those with
less democratic systems. Given the institutional environment, the opportunities
provided by the institutional environment will be reflected in the nature and
performance of reform process.
EPRG WP 1216
21
4. Methodology
In our study, we focus on the background of the chairperson of electricity market
regulatory agency when reforms started or were considered, that of the governor
or minister responsible for energy policy at that time and macro institutional
indicators to explain the progress in reform process in a country.
The ministers responsible for energy-related issues in countries or governors in
US or Canadian states set general policies for electricity industry and the
regulatory agencies put these policies into practice. Both policy setting and
policy implementation are crucial factors that explain the reform progress in any
country. Besides, path dependency implies that the chairperson of electricity
market regulatory agency when reforms started or were considered and the
governor or minister responsible for energy policy at that time play a critical role
in the progress of subsequent reform process. For instance, in Argentina, Carlos
Bastos, Secretary of Energy between 1991-96, led the privatisation of the
electricity sector within the general policy framework of the Minister of
Economy. Bastos was formerly an electrical engineer, researcher and a
consultant on electricity issues for the Inter-American Development Bank and
the Harvard Institute for International Economic Development. He brought the
conceptual vision and insistence on a reformed, privately owned and competitive
sector. He gave general direction and control to the privatisation of the energy
sector, and took on the political battles, including with parties from the existing
industry. The reform was along similar lines to the UK, and even went further
with respect to restructuring (Littlechild & Skerk, 2004).
Similarly, UK has been successful in market reform because it managed to find a
set of quite able, fair-minded regulators. Prof. Stephen C. Littlechild was Director
General of Electricity Supply (DGES), in charge of the Office of Electricity
Regulation (OFFER), from its foundation in September 1989 to 1998. Littlechild,
one of the architects of the successful UK electricity reform, has been a true
believer in competition in electricity markets. Before the appointment, he was
Professor of Commerce and Head of Department of Industrial Economics and
EPRG WP 1216
22
Business Studies at the University of Birmingham from 1975 to 1989, and a
member of the Monopolies and Mergers Commission from 1983 to 1989. In
response to the apparent problems of the cost-recovery methods, in 1983,
Professor Littlechild proposed a “high-powered” incentive scheme, popularly
known as RPI-X or price cap, in which the regulator caps the allowable price or
revenue for each firm for a pre-determined period. Thus far, in terms of
economic efficiency, RPI-X has been a clear success. In the United Kingdom, the
RPI-X regulatory approach has induced cost reductions well beyond
expectations. Electricity companies have been able to greatly reduce operating
costs in large part through substantial work force reductions. In short, the
educational and professional backgrounds of energy minister and regulator
played an important role in the reform progress in Argentina and the UK,
respectively. Within this framework, our first hypothesis is as follows:
Hypothesis 1: Due to path-dependency, the background of the
chairperson of the regulator and that of the governor or minister
responsible for energy policy when reforms started or were considered
have an impact on overall reform progress.
As in the case of any competitive market, a competitive electricity market
requires a liberal economy with strong democratic institutions. Hence, we also
test for following hypotheses:
Hypothesis 2: In countries with strong legal systems that secure
property rights, reforms go further.
Hypothesis 3: Democratic countries advance more rapidly in terms of
power market reform process than those with less democratic systems.
So, expansion of civil liberties and political rights contribute to power
market reform progress.
Hypothesis 4: The reform progresses more rapidly in countries where
there are few obstacles to investment and less corruption than in those
EPRG WP 1216
23
where investment is hindered by bureaucratic, structural or political
reasons.
In our study, the scope of the reforms in each country is represented by the
electricity market reform score variable. Therefore, in our analysis, we describe
the electricity market reform score as a function of
(a) the background of the chairperson of electricity market regulatory agency
when reforms started or were considered (his/her experience in
electricity industry, his/her length of term, his/her education level,
his/her educational background in business or economics, in engineering
or in law);
(b) the background of the governor or minister who was responsible for
energy policy at that time (his/her experience in electricity industry,
his/her length of term after reforms started or were considered, his/her
education level, his/her educational background in business or
economics, in engineering or in law);
(c) macro variables representing the institutional endowments of the
countries (namely, investment freedom index, polity score, corruption
perceptions index, property rights index, civil liberties and political rights
scores);
(d) control variables (i.e. population, GDP per capita, dummy variable for
being an OECD country).
In our analysis, our dependent variable is limited, that is, it is a count variable,
which can take on nonnegative integer values, . We cannot
take the logarithm of a count variable because it takes on the value zero. An
appropriate approach is to model the expected value as an exponential function
(1)
Since is always positive, the predicted values for y will also be positive.
Although this is more complicated than a linear model, we know how to interpret
the coefficients. Taking the log of Equation 1 shows that
(2)
{0,1, 2,3, 4,5,6,7,8}Yi
1 2 0 1 1( | , ,..., ) exp( ... )k k ky x x x x x
exp( )
1 2 0 1 1log[ ( | , ,..., )] ...k k ky x x x x x
EPRG WP 1216
24
so that the log of the expected value is linear. Using the approximation properties
of the log function, we write
(3)
In other words, is roughly the percentage change in E(y|x), given a one-
unit increase in xi.
Because Equation 1 is nonlinear in its parameters, we cannot use linear
regression methods. We could use nonlinear least squares, which, just as with
OLS, minimizes the sum of squared residuals. It turns out, however, that all
standard count data distributions exhibit heteroskedasticity and nonlinear least
squares does not exploit this. Instead, we will rely on maximum likelihood and
the important related method of quasi-maximum likelihood estimation. Besides,
as we know, normality is the standard distributional assumption for linear
regression. The normality assumption is reasonable for continuous dependent
variables that can take on a large range of values. A count variable cannot have a
normal distribution (because the normal distribution is for continuous variables
that can take on all values), and if it takes on very few values, the distribution can
be very different from normal. Instead, the nominal distribution for count data is
the Poisson distribution. A random variable Y, which only takes on nonnegative
integer values, follows the Poisson distribution if, for k = 0, 1, 2, ...
(4)
where . The mean and variance of Poisson random variable is and
(5)
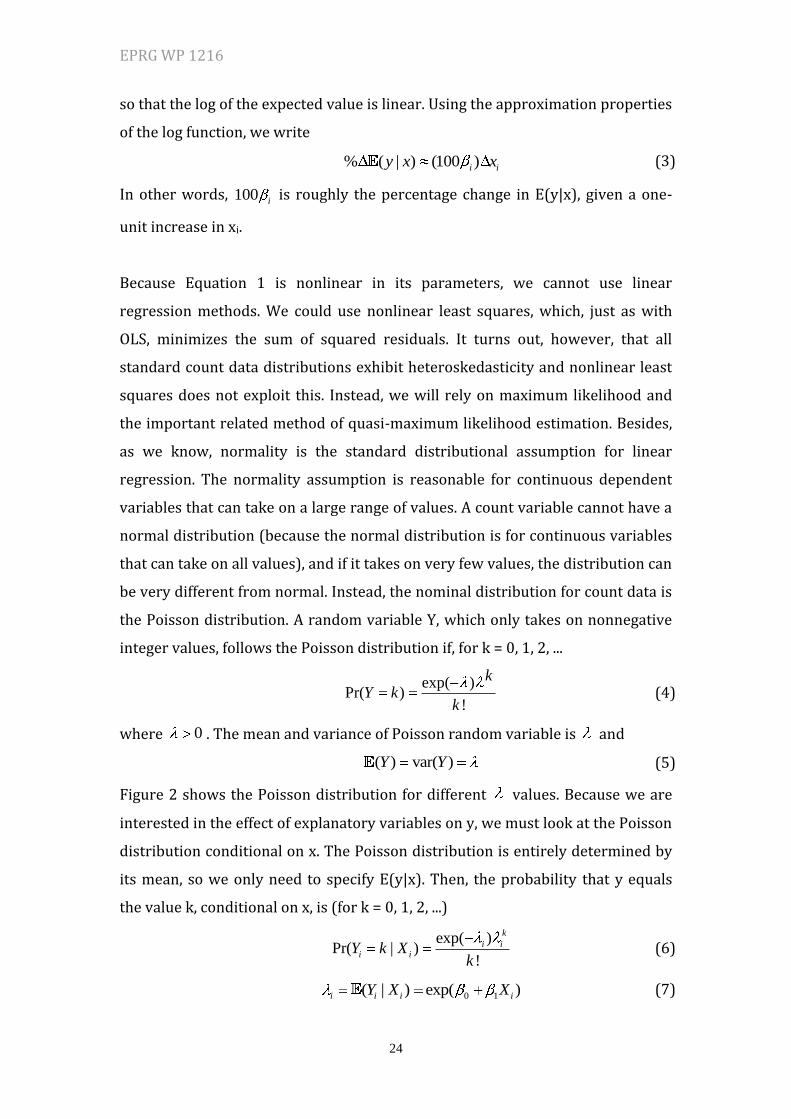
Figure 2 shows the Poisson distribution for different values. Because we are
interested in the effect of explanatory variables on y, we must look at the Poisson
distribution conditional on x. The Poisson distribution is entirely determined by
its mean, so we only need to specify E(y|x). Then, the probability that y equals
the value k, conditional on x, is (for k = 0, 1, 2, ...)
(6)
(7)
% ( | ) (100 )i iy x x
100 i
exp( )Pr( )
!
kY k
k
0
( ) var( )Y Y
exp( )Pr( | )
!
k
i ii iY k X
k
0 1( | ) exp( )i i i iY X X
EPRG WP 1216
25
(8)
Here, the interpretation of is that when there is a one unit increase in Xi, the
percentage change of is 100 x . This distribution, which is the basis for
the Poisson regression model, allows us to find conditional probabilities for any
values of the explanatory variables.
Figure 2. Poisson distribution for different values
In principle, the Poisson model is simply a nonlinear regression. It is much easier
to estimate the parameter with a maximum likelihood method. The log-
likelihood function is
(9)
(10)
(11)
where we can drop the term because it does not depend on . So, we
get
(12)
0 1ln( )i iX
1
( | )Y X1
0 1( , ;{ | } )1
NInL Y Xi i i
1
Pr( | )N
i i i
i
Ln Y y X
0 1 0 1
1
[ exp( ) ( ) ( !)]N
i i i i
i
X Y X Ln Y
( !)iLn Y
0 1 0 1
1
[ exp( ) ( )]N
i i i
i
X Y X
EPRG WP 1216
26
While employing Poisson regression, we should keep in mind two important
points. First, we cannot directly compare the magnitudes of the Poisson
estimates of an exponential function with the OLS estimates of a linear function.
Second, although Poisson analysis is a natural first step for count data, it may be
restrictive. All of the probabilities and higher moments of the Poisson
distribution are determined entirely by the mean. In particular, the variance is
expected to be equal to the mean. This is restrictive but, fortunately, the Poisson
distribution has a very nice robustness property: whether or not the Poisson
distribution holds, we still get consistent, asymptotically normal estimators of
the .
Because of the restrictions on the length of the paper and because it is not one of
the aims of this paper, further details of Poisson regression is not presented here
but available from Winkelmann (2008), Cameron and Trivedi (1998) and
Wooldridge (2009).
5. Overview of data
Our data set is cross-section and covers 51 states in US, 13 states in Canada and
51 other countries2. In total, we have 115 potential observations for each
variable. We have some missing observations in our dataset. The sample
countries and states in our analysis are determined by data availability. There
are two main reasons for the limited nature of the dataset. First, since our
analysis requires data on the chairperson of the regulatory agency when reforms
started or were considered, we automatically exclude all countries without a
regulatory agency for electricity industry. We could detect the existence of
electricity market regulatory agencies in 135 countries. Second, out of these 135
2 Albania, Argentina, Armenia, Australia, Austria, Bangladesh, Belgium, Bosnia and Herzegovina,
Brazil, Bulgaria, Cambodia, China, Colombia, Croatia, Cyprus, Czech Republic, Denmark, Estonia,
Finland, France, Germany, Greece, India, Ireland, Italy, Jamaica, Kenya, Latvia, Lithuania,
Luxembourg, Macedonia, Malaysia, Mexico, Netherlands, New Zealand, Nigeria, Norway, Pakistan,
Philippines, Poland, Portugal, Romania, Russia, Serbia, Singapore, South Africa, Spain, Thailand,
Turkey, Uganda, United Kingdom.
i
EPRG WP 1216
27
countries, we could include only those for which we could obtain data on all
variables in our model. If excluded countries have some characteristics that
cause them to be less likely to be included than others, that is, if the sampling of
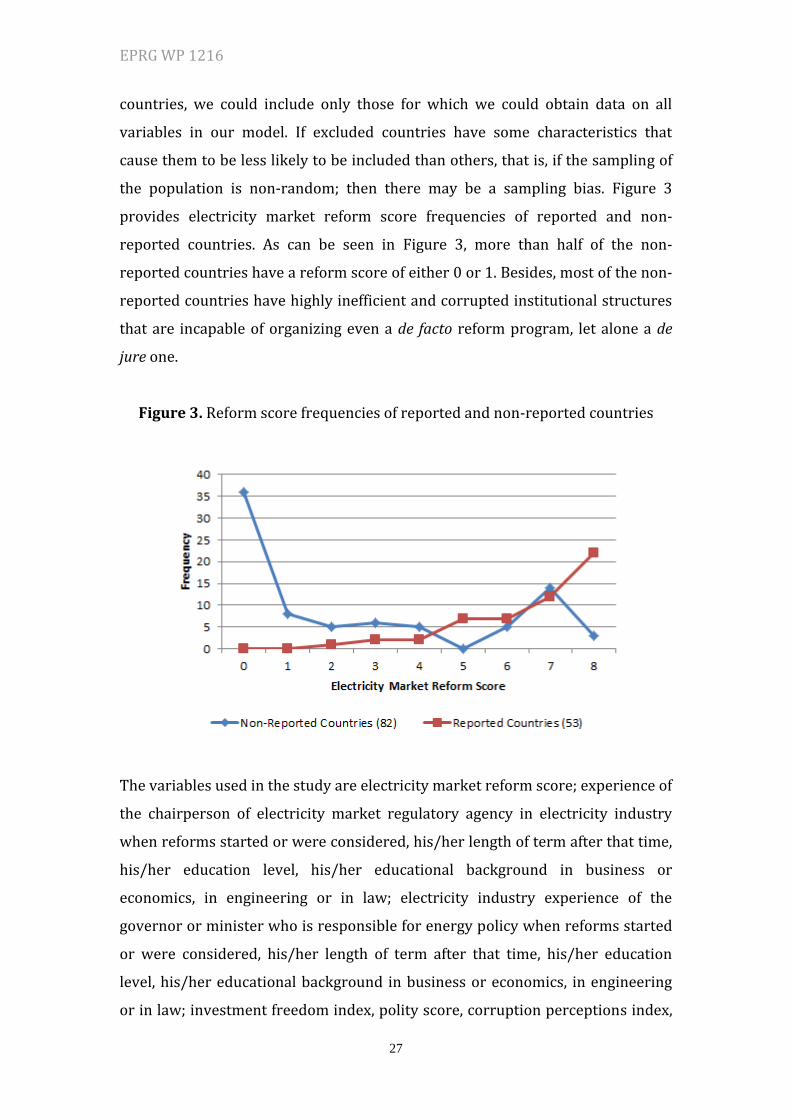
the population is non-random; then there may be a sampling bias. Figure 3
provides electricity market reform score frequencies of reported and non-
reported countries. As can be seen in Figure 3, more than half of the non-
reported countries have a reform score of either 0 or 1. Besides, most of the non-
reported countries have highly inefficient and corrupted institutional structures
that are incapable of organizing even a de facto reform program, let alone a de
jure one.
Figure 3. Reform score frequencies of reported and non-reported countries
The variables used in the study are electricity market reform score; experience of
the chairperson of electricity market regulatory agency in electricity industry
when reforms started or were considered, his/her length of term after that time,
his/her education level, his/her educational background in business or
economics, in engineering or in law; electricity industry experience of the
governor or minister who is responsible for energy policy when reforms started
or were considered, his/her length of term after that time, his/her education
level, his/her educational background in business or economics, in engineering
or in law; investment freedom index, polity score, corruption perceptions index,
EPRG WP 1216
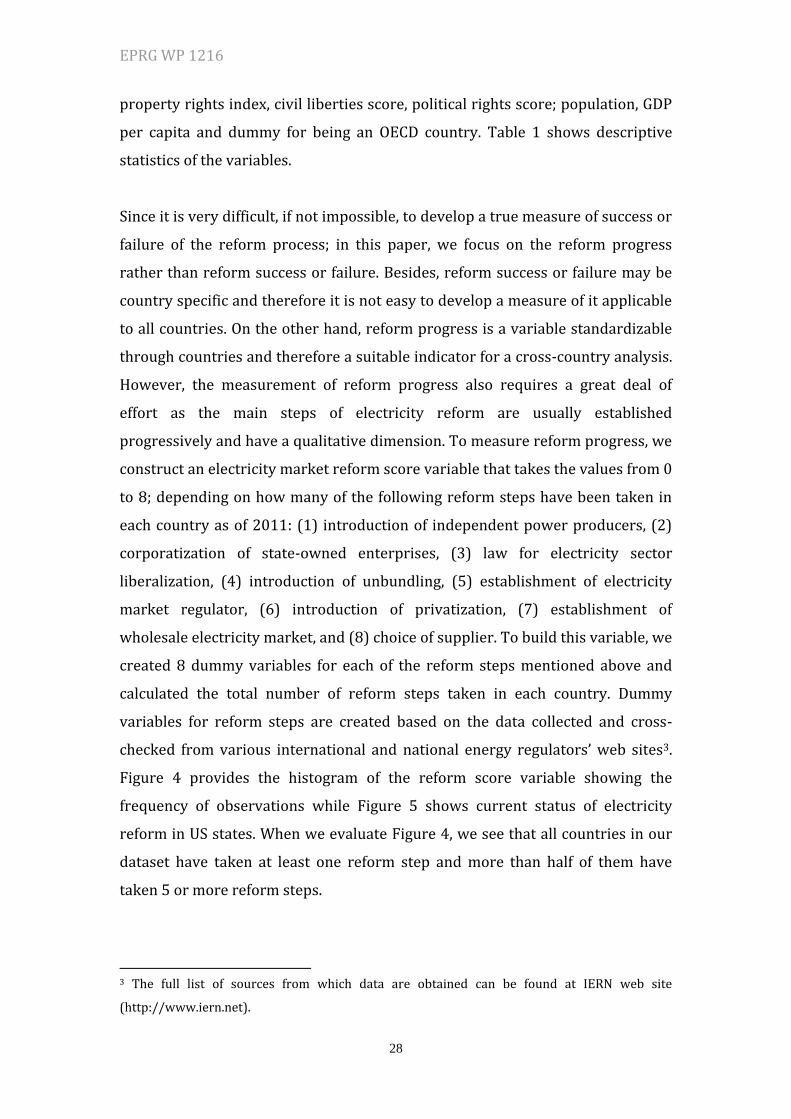
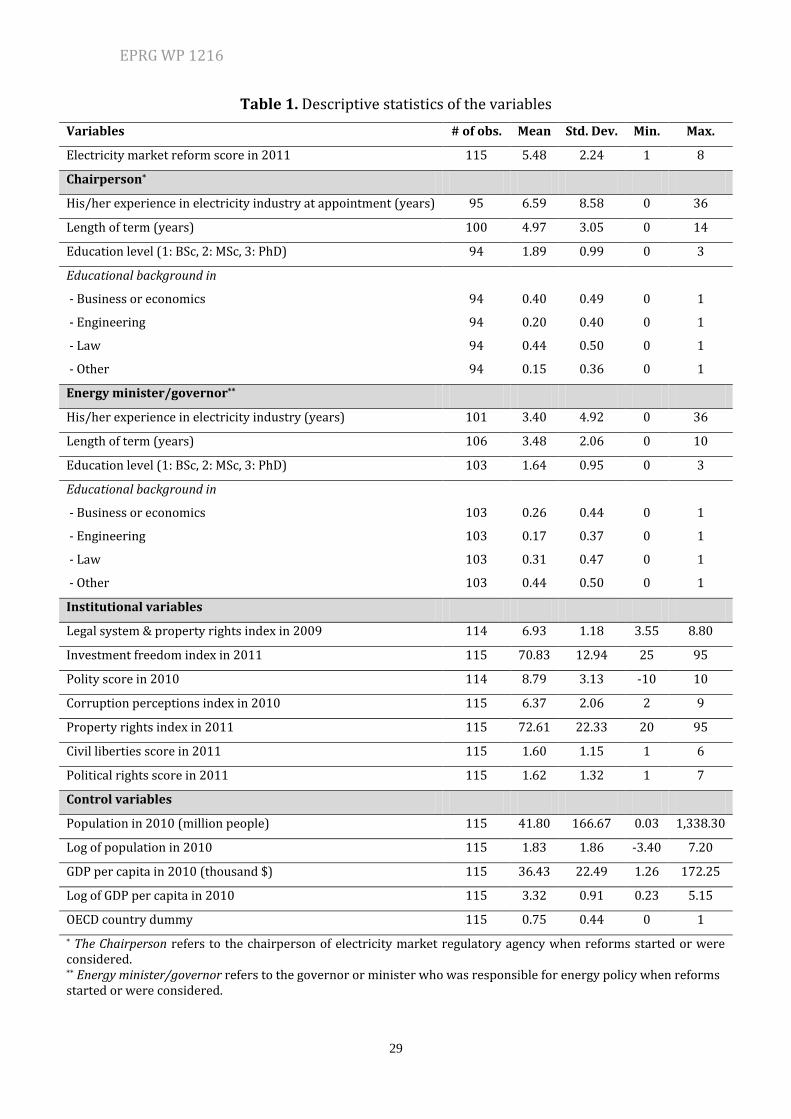
28
property rights index, civil liberties score, political rights score; population, GDP
per capita and dummy for being an OECD country. Table 1 shows descriptive
statistics of the variables.
Since it is very difficult, if not impossible, to develop a true measure of success or
failure of the reform process; in this paper, we focus on the reform progress
rather than reform success or failure. Besides, reform success or failure may be
country specific and therefore it is not easy to develop a measure of it applicable
to all countries. On the other hand, reform progress is a variable standardizable
through countries and therefore a suitable indicator for a cross-country analysis.
However, the measurement of reform progress also requires a great deal of
effort as the main steps of electricity reform are usually established
progressively and have a qualitative dimension. To measure reform progress, we
construct an electricity market reform score variable that takes the values from 0
to 8; depending on how many of the following reform steps have been taken in
each country as of 2011: (1) introduction of independent power producers, (2)
corporatization of state-owned enterprises, (3) law for electricity sector
liberalization, (4) introduction of unbundling, (5) establishment of electricity
market regulator, (6) introduction of privatization, (7) establishment of
wholesale electricity market, and (8) choice of supplier. To build this variable, we
created 8 dummy variables for each of the reform steps mentioned above and
calculated the total number of reform steps taken in each country. Dummy
variables for reform steps are created based on the data collected and cross-
checked from various international and national energy regulators’ web sites3.
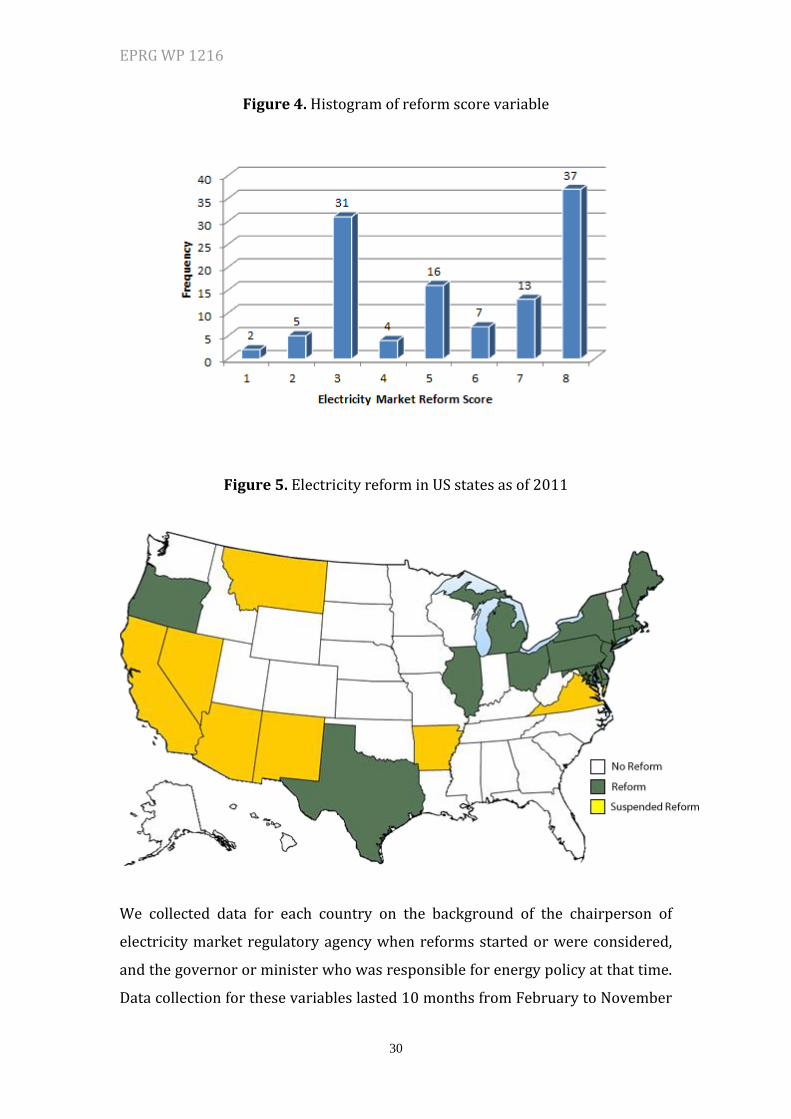
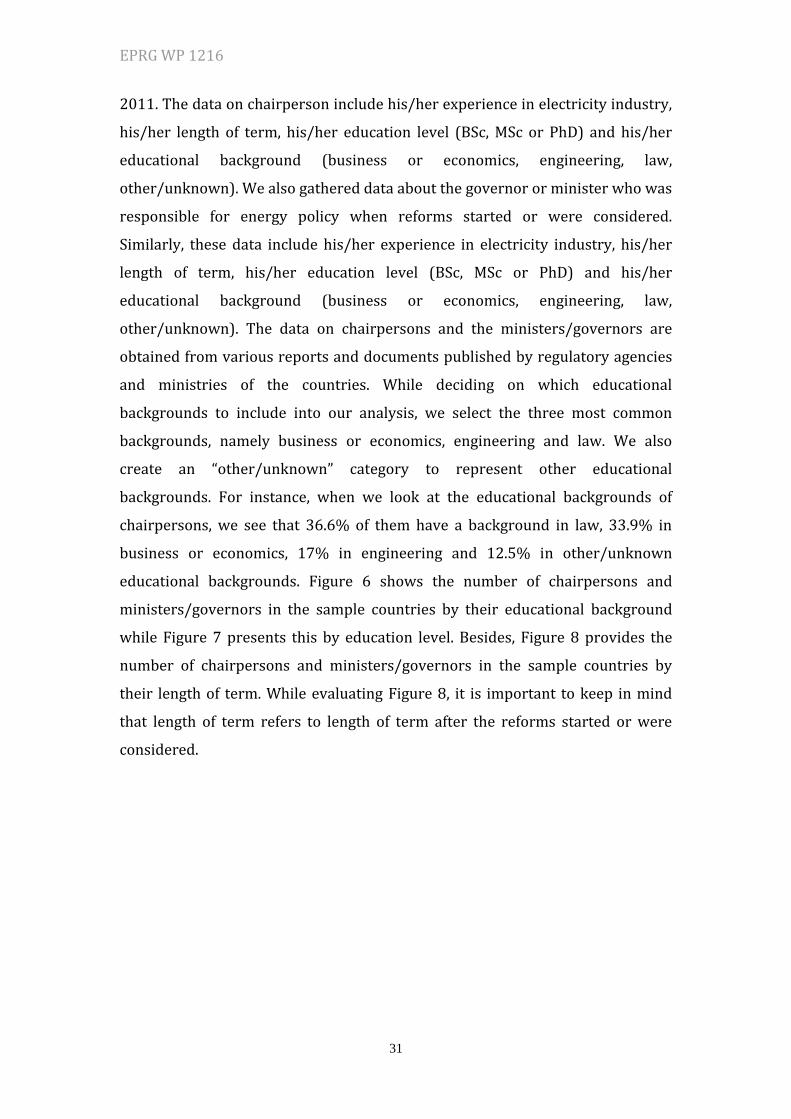
Figure 4 provides the histogram of the reform score variable showing the
frequency of observations while Figure 5 shows current status of electricity
reform in US states. When we evaluate Figure 4, we see that all countries in our
dataset have taken at least one reform step and more than half of them have
taken 5 or more reform steps.
3 The full list of sources from which data are obtained can be found at IERN web site
(http://www.iern.net).
EPRG WP 1216
29
Table 1. Descriptive statistics of the variables
Variables # of obs. Mean Std. Dev. Min. Max.
Electricity market reform score in 2011 115 5.48 2.24 1 8
Chairperson*
His/her experience in electricity industry at appointment (years) 95 6.59 8.58 0 36
Length of term (years) 100 4.97 3.05 0 14
Education level (1: BSc, 2: MSc, 3: PhD) 94 1.89 0.99 0 3
Educational background in
- Business or economics 94 0.40 0.49 0 1
- Engineering 94 0.20 0.40 0 1
- Law 94 0.44 0.50 0 1
- Other 94 0.15 0.36 0 1
Energy minister/governor**
His/her experience in electricity industry (years) 101 3.40 4.92 0 36
Length of term (years) 106 3.48 2.06 0 10
Education level (1: BSc, 2: MSc, 3: PhD) 103 1.64 0.95 0 3
Educational background in
- Business or economics 103 0.26 0.44 0 1
- Engineering 103 0.17 0.37 0 1
- Law 103 0.31 0.47 0 1
- Other 103 0.44 0.50 0 1
Institutional variables
Legal system & property rights index in 2009 114 6.93 1.18 3.55 8.80
Investment freedom index in 2011 115 70.83 12.94 25 95
Polity score in 2010 114 8.79 3.13 -10 10
Corruption perceptions index in 2010 115 6.37 2.06 2 9
Property rights index in 2011 115 72.61 22.33 20 95
Civil liberties score in 2011 115 1.60 1.15 1 6
Political rights score in 2011 115 1.62 1.32 1 7
Control variables
Population in 2010 (million people) 115 41.80 166.67 0.03 1,338.30
Log of population in 2010 115 1.83 1.86 -3.40 7.20
GDP per capita in 2010 (thousand $) 115 36.43 22.49 1.26 172.25
Log of GDP per capita in 2010 115 3.32 0.91 0.23 5.15
OECD country dummy 115 0.75 0.44 0 1
* The Chairperson refers to the chairperson of electricity market regulatory agency when reforms started or were considered. ** Energy minister/governor refers to the governor or minister who was responsible for energy policy when reforms started or were considered.
EPRG WP 1216
30
Figure 4. Histogram of reform score variable
Figure 5. Electricity reform in US states as of 2011
We collected data for each country on the background of the chairperson of
electricity market regulatory agency when reforms started or were considered,
and the governor or minister who was responsible for energy policy at that time.
Data collection for these variables lasted 10 months from February to November
EPRG WP 1216
31
2011. The data on chairperson include his/her experience in electricity industry,
his/her length of term, his/her education level (BSc, MSc or PhD) and his/her
educational background (business or economics, engineering, law,
other/unknown). We also gathered data about the governor or minister who was
responsible for energy policy when reforms started or were considered.
Similarly, these data include his/her experience in electricity industry, his/her
length of term, his/her education level (BSc, MSc or PhD) and his/her
educational background (business or economics, engineering, law,
other/unknown). The data on chairpersons and the ministers/governors are
obtained from various reports and documents published by regulatory agencies
and ministries of the countries. While deciding on which educational
backgrounds to include into our analysis, we select the three most common
backgrounds, namely business or economics, engineering and law. We also
create an “other/unknown” category to represent other educational
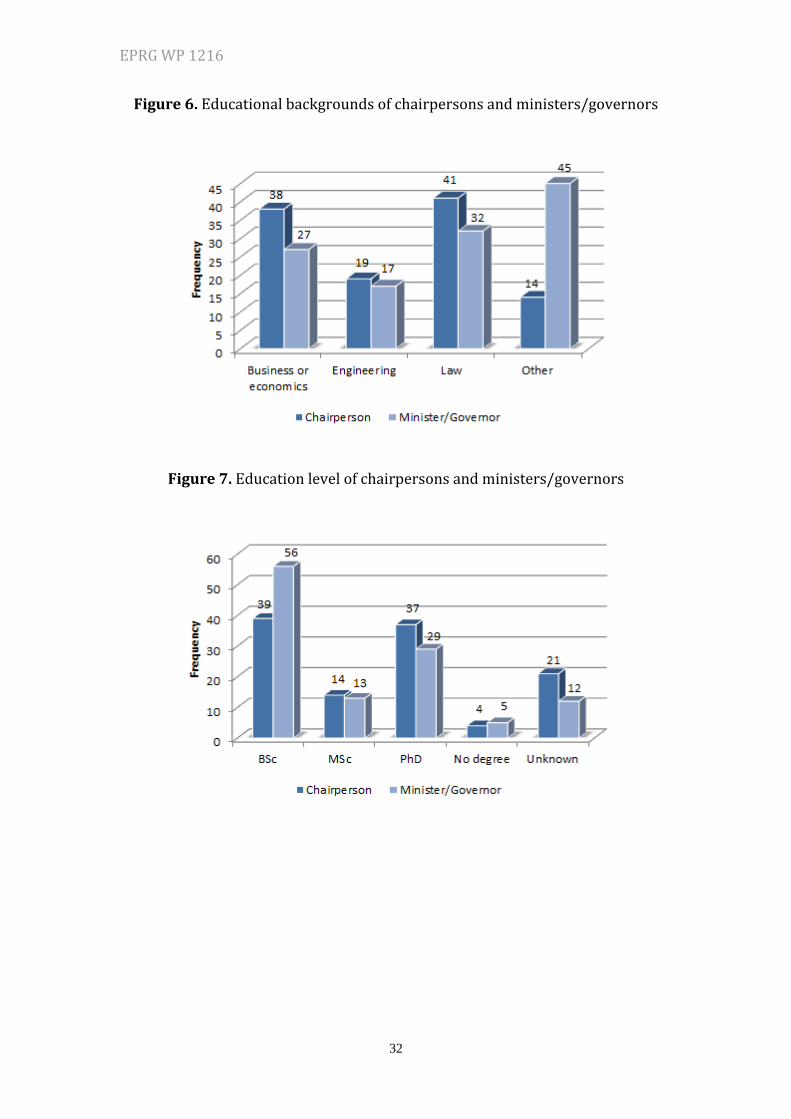
backgrounds. For instance, when we look at the educational backgrounds of
chairpersons, we see that 36.6% of them have a background in law, 33.9% in
business or economics, 17% in engineering and 12.5% in other/unknown
educational backgrounds. Figure 6 shows the number of chairpersons and
ministers/governors in the sample countries by their educational background
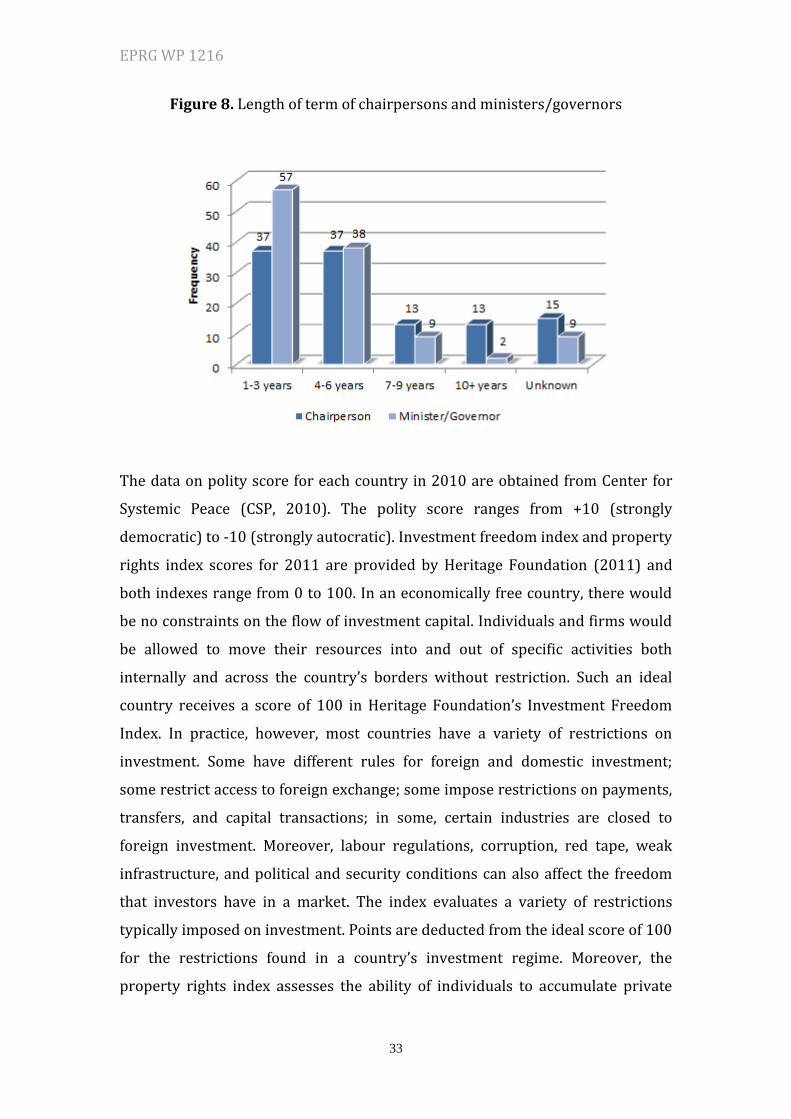
while Figure 7 presents this by education level. Besides, Figure 8 provides the
number of chairpersons and ministers/governors in the sample countries by
their length of term. While evaluating Figure 8, it is important to keep in mind
that length of term refers to length of term after the reforms started or were
considered.
EPRG WP 1216
32
Figure 6. Educational backgrounds of chairpersons and ministers/governors
Figure 7. Education level of chairpersons and ministers/governors
EPRG WP 1216
33
Figure 8. Length of term of chairpersons and ministers/governors
The data on polity score for each country in 2010 are obtained from Center for
Systemic Peace (CSP, 2010). The polity score ranges from +10 (strongly
democratic) to -10 (strongly autocratic). Investment freedom index and property
rights index scores for 2011 are provided by Heritage Foundation (2011) and
both indexes range from 0 to 100. In an economically free country, there would
be no constraints on the flow of investment capital. Individuals and firms would
be allowed to move their resources into and out of specific activities both
internally and across the country’s borders without restriction. Such an ideal
country receives a score of 100 in Heritage Foundation’s Investment Freedom
Index. In practice, however, most countries have a variety of restrictions on
investment. Some have different rules for foreign and domestic investment;
some restrict access to foreign exchange; some impose restrictions on payments,
transfers, and capital transactions; in some, certain industries are closed to
foreign investment. Moreover, labour regulations, corruption, red tape, weak
infrastructure, and political and security conditions can also affect the freedom
that investors have in a market. The index evaluates a variety of restrictions
typically imposed on investment. Points are deducted from the ideal score of 100
for the restrictions found in a country’s investment regime. Moreover, the
property rights index assesses the ability of individuals to accumulate private
EPRG WP 1216
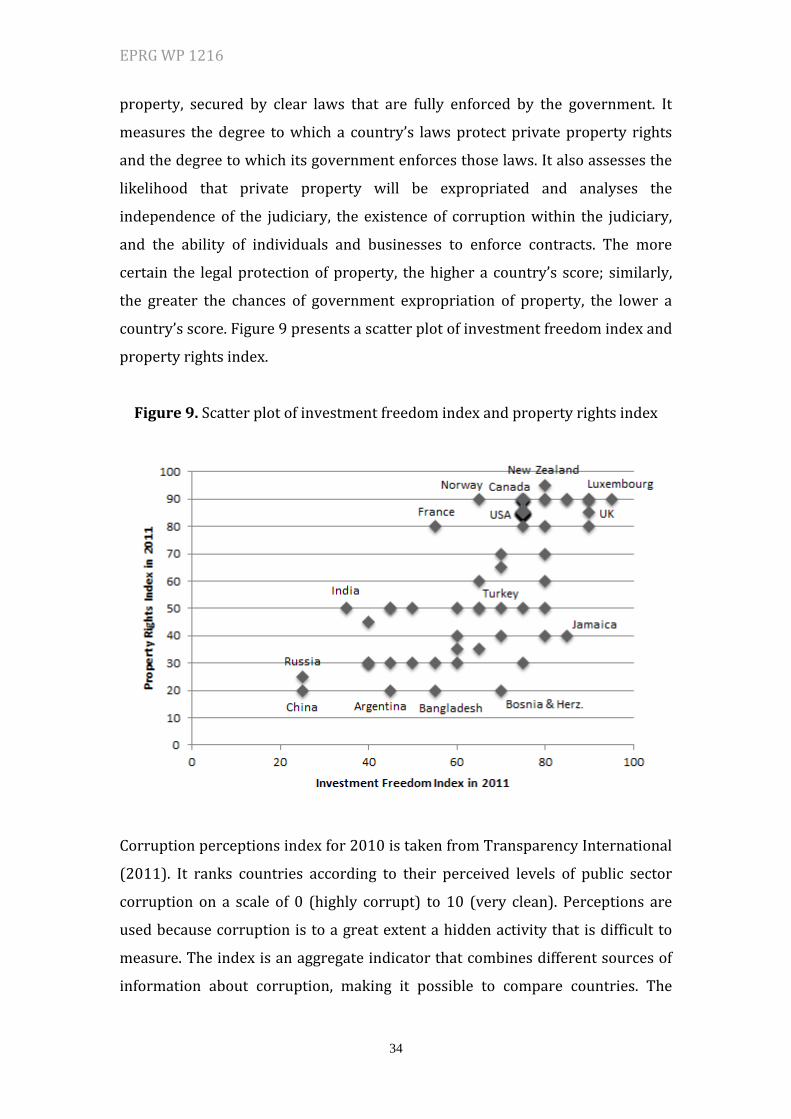
34
property, secured by clear laws that are fully enforced by the government. It
measures the degree to which a country’s laws protect private property rights
and the degree to which its government enforces those laws. It also assesses the
likelihood that private property will be expropriated and analyses the
independence of the judiciary, the existence of corruption within the judiciary,
and the ability of individuals and businesses to enforce contracts. The more
certain the legal protection of property, the higher a country’s score; similarly,
the greater the chances of government expropriation of property, the lower a
country’s score. Figure 9 presents a scatter plot of investment freedom index and
property rights index.
Figure 9. Scatter plot of investment freedom index and property rights index
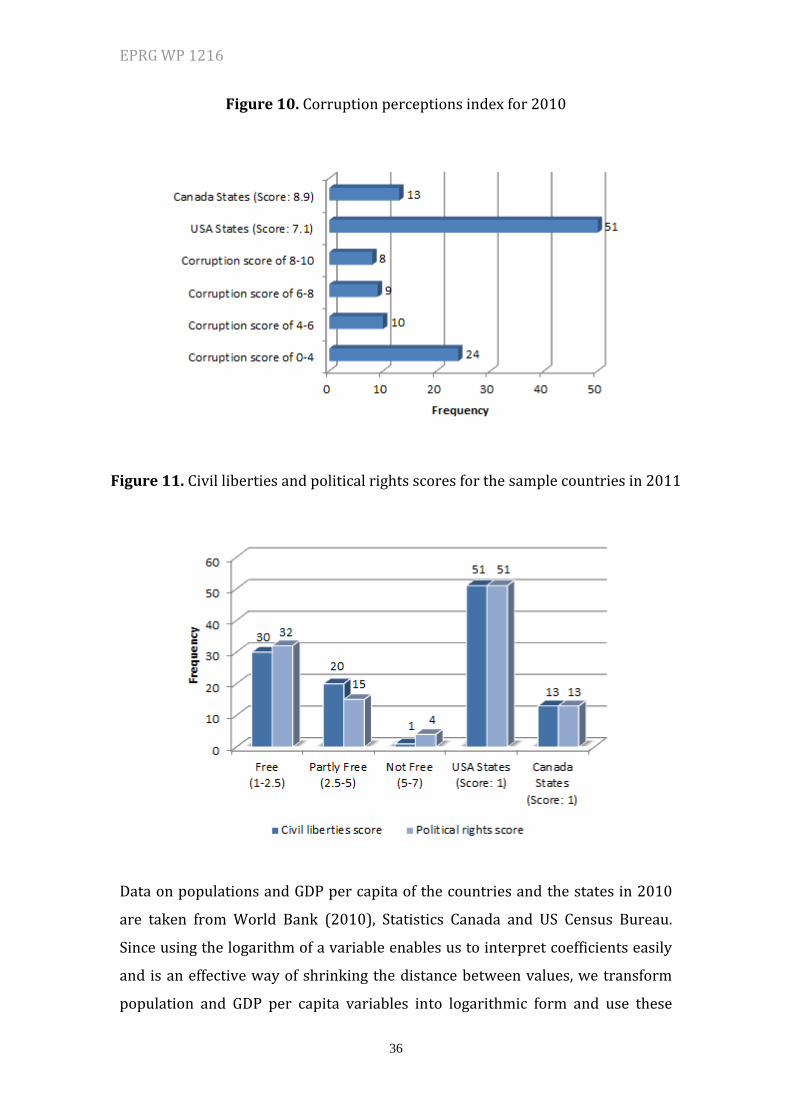
Corruption perceptions index for 2010 is taken from Transparency International
(2011). It ranks countries according to their perceived levels of public sector
corruption on a scale of 0 (highly corrupt) to 10 (very clean). Perceptions are
used because corruption is to a great extent a hidden activity that is difficult to
measure. The index is an aggregate indicator that combines different sources of
information about corruption, making it possible to compare countries. The

EPRG WP 1216
35
index draws on assessments and opinion surveys carried out by independent
and reputable institutions. These surveys and assessments include questions
related to the bribery of public officials, kickbacks in public procurement,
embezzlement of public funds, and the effectiveness of public sector anti-
corruption efforts. Figure 10 provides a visual plot of corruption perceptions
index for 2010.
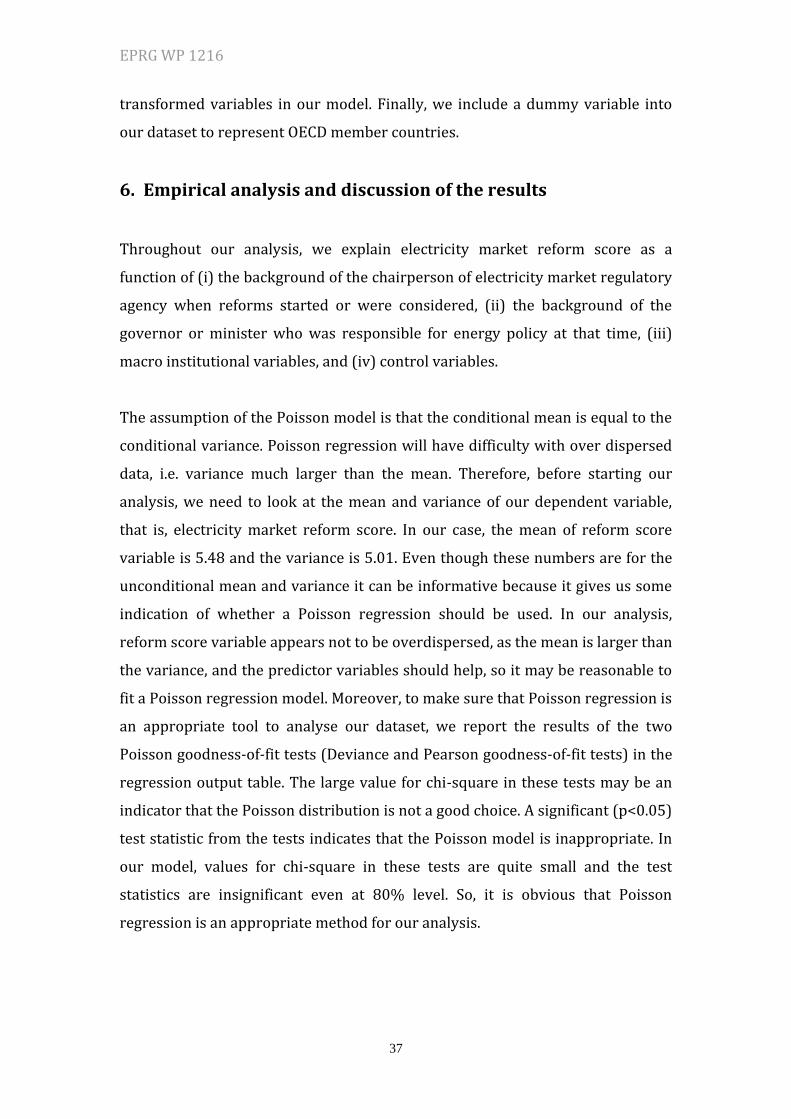
Civil liberties and political rights scores for 2011 are taken from Freedom House
(2011). The Freedom in the World survey conducted by Freedom House
provides an annual evaluation of the state of global freedom as experienced by
individuals. The survey measures freedom -the opportunity to act spontaneously
in a variety of fields outside the control of the government and other centres of
potential domination- according to two broad categories: political rights and civil
liberties. Political rights enable people to participate freely in the political
process, including the right to vote freely for distinct alternatives in legitimate
elections, compete for public office, join political parties and organizations, and
elect representatives who have a decisive impact on public policies and are
accountable to the electorate. Civil liberties allow for the freedoms of expression
and belief, associational and organizational rights, rule of law, and personal
autonomy without interference from the state. Political rights and civil liberties
scores range from 1 to 7, with 1 representing the highest and 7 the lowest level
of freedom. Figure 11 shows the number of countries and states in the sample by
their civil liberties and political rights scores.
EPRG WP 1216
36
Figure 10. Corruption perceptions index for 2010
Figure 11. Civil liberties and political rights scores for the sample countries in 2011
Data on populations and GDP per capita of the countries and the states in 2010
are taken from World Bank (2010), Statistics Canada and US Census Bureau.
Since using the logarithm of a variable enables us to interpret coefficients easily
and is an effective way of shrinking the distance between values, we transform
population and GDP per capita variables into logarithmic form and use these
EPRG WP 1216
37
transformed variables in our model. Finally, we include a dummy variable into
our dataset to represent OECD member countries.
6. Empirical analysis and discussion of the results
Throughout our analysis, we explain electricity market reform score as a
function of (i) the background of the chairperson of electricity market regulatory
agency when reforms started or were considered, (ii) the background of the
governor or minister who was responsible for energy policy at that time, (iii)
macro institutional variables, and (iv) control variables.
The assumption of the Poisson model is that the conditional mean is equal to the
conditional variance. Poisson regression will have difficulty with over dispersed
data, i.e. variance much larger than the mean. Therefore, before starting our
analysis, we need to look at the mean and variance of our dependent variable,
that is, electricity market reform score. In our case, the mean of reform score
variable is 5.48 and the variance is 5.01. Even though these numbers are for the
unconditional mean and variance it can be informative because it gives us some
indication of whether a Poisson regression should be used. In our analysis,
reform score variable appears not to be overdispersed, as the mean is larger than
the variance, and the predictor variables should help, so it may be reasonable to
fit a Poisson regression model. Moreover, to make sure that Poisson regression is
an appropriate tool to analyse our dataset, we report the results of the two
Poisson goodness-of-fit tests (Deviance and Pearson goodness-of-fit tests) in the
regression output table. The large value for chi-square in these tests may be an
indicator that the Poisson distribution is not a good choice. A significant (p<0.05)
test statistic from the tests indicates that the Poisson model is inappropriate. In
our model, values for chi-square in these tests are quite small and the test
statistics are insignificant even at 80% level. So, it is obvious that Poisson
regression is an appropriate method for our analysis.
EPRG WP 1216
38
We start the empirical analysis by estimating a Poisson regression for our
model4. Cameron and Trivedi (2009) recommend the use of robust standard
errors when estimating a Poisson model, so we use robust standard errors for
the parameter estimates. Table 2 presents Poisson estimation results. In the
output table, we also report “Log pseudolikelihood”, which is the log likelihood of
the fitted model. It is used in the calculation of the Likelihood Ratio (LR) chi-
square test of whether all predictor variables’ regression coefficients are
simultaneously zero. Moreover, we provide the number of observations. This is
the number of observations used in the Poisson regression. It may be less than
the number of cases in the dataset if there are missing values for some variables
in the model. By default, Stata and Eviews do a listwise deletion of incomplete
cases. Besides, we also report Wald chi2 value, which is the LR test statistic for
the omnibus test that at least one predictor variable regression coefficient is not
equal to zero in the model. The degrees of freedom (the number in parenthesis)
of the LR test statistic are defined by the number of predictor variables. Finally,
“Prob>chi2” value indicates the probability of getting a LR test statistic as
extreme as, or more so, than the one observed under the null hypothesis that all
of the regression coefficients are simultaneously equal to zero. In other words,
this is the probability of obtaining this chi-square test statistic if there is in fact
no effect of the predictor variables. This p-value is compared to a specified alpha
level, our willingness to accept a Type I error, which is typically set at 0.05 or
0.01. The small p-value from the LR test, p < 0.0001, would lead us to conclude
that at least one of the regression coefficients in the model is not equal to zero.
While analysing the estimated Poisson regression coefficients, we should keep in
mind that the dependent variable is a count variable, and Poisson regression
models the log of the expected count as a function of the predictor variables. We
can interpret the Poisson regression coefficient as follows: for a one unit change
in the predictor variable, the difference in the logs of expected counts is expected
to change by the respective regression coefficient, given the other predictor
variables in the model are held constant. For instance, the coefficient of the
4 Throughout the paper, model estimations are carried out and cross-checked by Stata 12.0 and
Eviews 7.1.
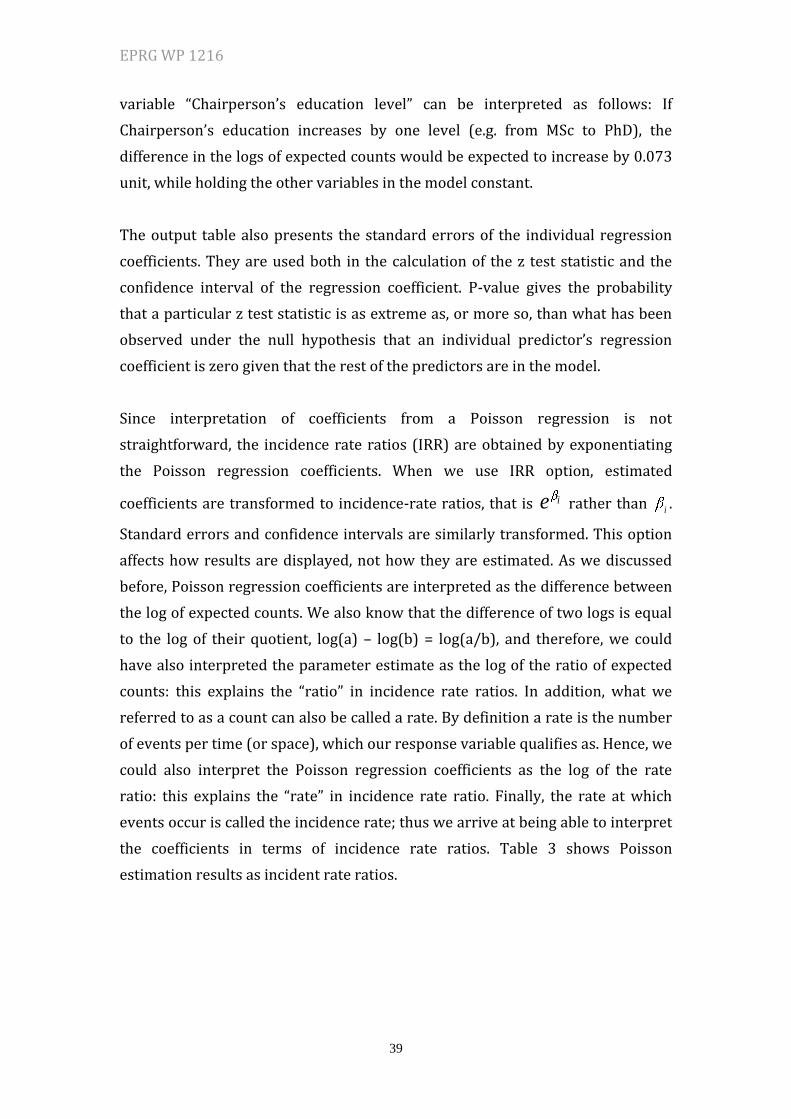
EPRG WP 1216
39
variable “Chairperson’s education level” can be interpreted as follows: If
Chairperson’s education increases by one level (e.g. from MSc to PhD), the
difference in the logs of expected counts would be expected to increase by 0.073
unit, while holding the other variables in the model constant.
The output table also presents the standard errors of the individual regression
coefficients. They are used both in the calculation of the z test statistic and the
confidence interval of the regression coefficient. P-value gives the probability
that a particular z test statistic is as extreme as, or more so, than what has been
observed under the null hypothesis that an individual predictor’s regression
coefficient is zero given that the rest of the predictors are in the model.
Since interpretation of coefficients from a Poisson regression is not
straightforward, the incidence rate ratios (IRR) are obtained by exponentiating
the Poisson regression coefficients. When we use IRR option, estimated
coefficients are transformed to incidence-rate ratios, that is ie rather than i .
Standard errors and confidence intervals are similarly transformed. This option
affects how results are displayed, not how they are estimated. As we discussed
before, Poisson regression coefficients are interpreted as the difference between
the log of expected counts. We also know that the difference of two logs is equal
to the log of their quotient, log(a) – log(b) = log(a/b), and therefore, we could
have also interpreted the parameter estimate as the log of the ratio of expected
counts: this explains the “ratio” in incidence rate ratios. In addition, what we
referred to as a count can also be called a rate. By definition a rate is the number
of events per time (or space), which our response variable qualifies as. Hence, we
could also interpret the Poisson regression coefficients as the log of the rate
ratio: this explains the “rate” in incidence rate ratio. Finally, the rate at which
events occur is called the incidence rate; thus we arrive at being able to interpret
the coefficients in terms of incidence rate ratios. Table 3 shows Poisson
estimation results as incident rate ratios.
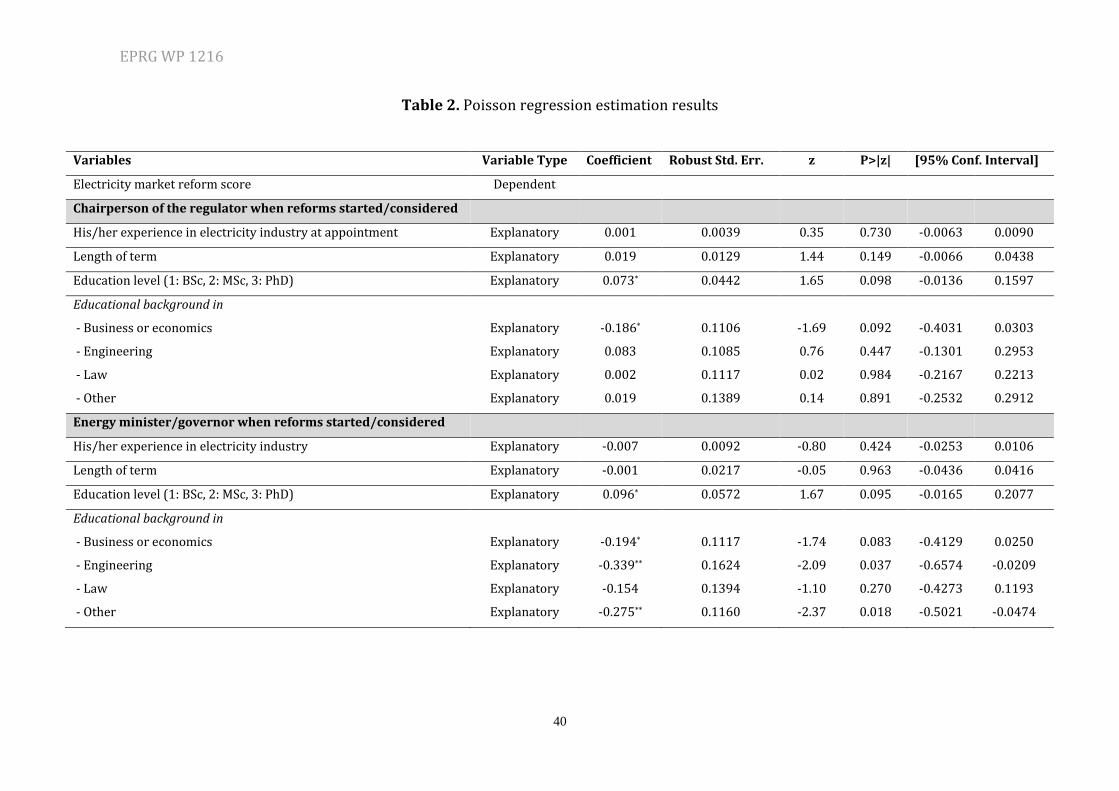
EPRG WP 1216
40
Table 2. Poisson regression estimation results
Variables Variable Type Coefficient Robust Std. Err. z P>|z| [95% Conf. Interval]
Electricity market reform score Dependent
Chairperson of the regulator when reforms started/considered
His/her experience in electricity industry at appointment Explanatory 0.001 0.0039 0.35 0.730 -0.0063 0.0090
Length of term Explanatory 0.019 0.0129 1.44 0.149 -0.0066 0.0438
Education level (1: BSc, 2: MSc, 3: PhD) Explanatory 0.073* 0.0442 1.65 0.098 -0.0136 0.1597
Educational background in
- Business or economics Explanatory -0.186* 0.1106 -1.69 0.092 -0.4031 0.0303
- Engineering Explanatory 0.083 0.1085 0.76 0.447 -0.1301 0.2953
- Law Explanatory 0.002 0.1117 0.02 0.984 -0.2167 0.2213
- Other Explanatory 0.019 0.1389 0.14 0.891 -0.2532 0.2912
Energy minister/governor when reforms started/considered
His/her experience in electricity industry Explanatory -0.007 0.0092 -0.80 0.424 -0.0253 0.0106
Length of term Explanatory -0.001 0.0217 -0.05 0.963 -0.0436 0.0416
Education level (1: BSc, 2: MSc, 3: PhD) Explanatory 0.096* 0.0572 1.67 0.095 -0.0165 0.2077
Educational background in
- Business or economics Explanatory -0.194* 0.1117 -1.74 0.083 -0.4129 0.0250
- Engineering Explanatory -0.339** 0.1624 -2.09 0.037 -0.6574 -0.0209
- Law Explanatory -0.154 0.1394 -1.10 0.270 -0.4273 0.1193
- Other Explanatory -0.275** 0.1160 -2.37 0.018 -0.5021 -0.0474

EPRG WP 1216
41
Variables Variable Type Coefficient Robust Std. Err. z P>|z| [95% Conf. Interval]
Institutional variables
Investment freedom index in 2011 Explanatory 0.012*** 0.0043 2.87 0.004 0.0039 0.0207
Polity score in 2010 Explanatory 0.045 0.0328 1.38 0.167 -0.0189 0.1097
Corruption perceptions index in 2010 Explanatory 0.203*** 0.0772 2.63 0.008 0.0520 0.3546
Property rights index in 2011 Explanatory -0.021*** 0.0062 -3.43 0.001 -0.0332 -0.0090
Civil liberties score in 2011 Explanatory 0.281*** 0.1071 2.62 0.009 0.0711 0.4910
Political rights score in 2011 Explanatory -0.148 0.0926 -1.59 0.111 -0.3290 0.0339
Control variables
Log of population in 2010 Control 0.177*** 0.0330 5.37 0.000 0.1126 0.2421
Log of GDP per capita in 2010 Control 0.315*** 0.0943 3.34 0.001 0.1300 0.4997
Dummy (1: OECD country, 0: non-OECD country) Control -0.306* 0.1567 -1.95 0.051 -0.6134 0.0010
Constant Constant -0.772 0.8297 -0.93 0.352 -2.3986 0.8539
Note: Log pseudolikelihood: -173.87, Number of obs: 86 Wald chi2(23): 107.98, Prob > chi2: 0.000 Deviance goodness-of-fit: 48.87, Prob > chi2(62): 0.8876 Pearson goodness-of-fit: 48.28, Prob > chi2(62): 0.8989
*** Significant at 1% level, ** Significant at 5% level, * Significant at 10% level.
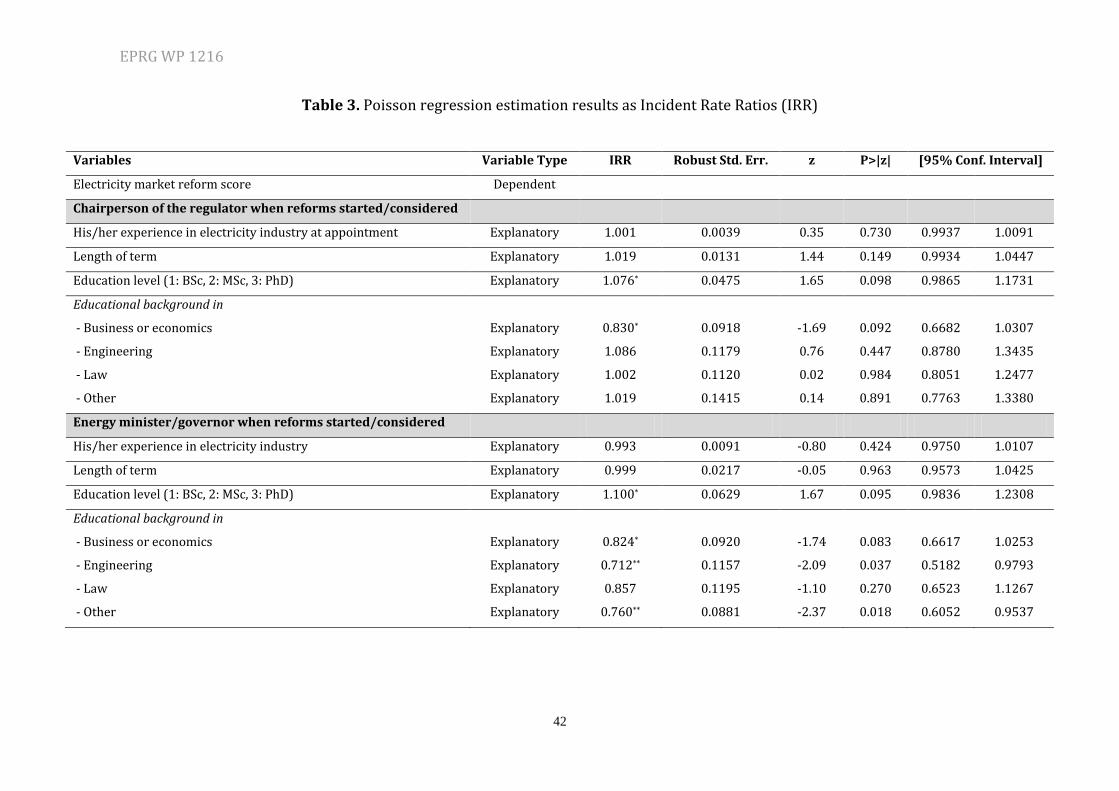
EPRG WP 1216
42
Table 3. Poisson regression estimation results as Incident Rate Ratios (IRR)
Variables Variable Type IRR Robust Std. Err. z P>|z| [95% Conf. Interval]
Electricity market reform score Dependent
Chairperson of the regulator when reforms started/considered
His/her experience in electricity industry at appointment Explanatory 1.001 0.0039 0.35 0.730 0.9937 1.0091
Length of term Explanatory 1.019 0.0131 1.44 0.149 0.9934 1.0447
Education level (1: BSc, 2: MSc, 3: PhD) Explanatory 1.076* 0.0475 1.65 0.098 0.9865 1.1731
Educational background in
- Business or economics Explanatory 0.830* 0.0918 -1.69 0.092 0.6682 1.0307
- Engineering Explanatory 1.086 0.1179 0.76 0.447 0.8780 1.3435
- Law Explanatory 1.002 0.1120 0.02 0.984 0.8051 1.2477
- Other Explanatory 1.019 0.1415 0.14 0.891 0.7763 1.3380
Energy minister/governor when reforms started/considered
His/her experience in electricity industry Explanatory 0.993 0.0091 -0.80 0.424 0.9750 1.0107
Length of term Explanatory 0.999 0.0217 -0.05 0.963 0.9573 1.0425
Education level (1: BSc, 2: MSc, 3: PhD) Explanatory 1.100* 0.0629 1.67 0.095 0.9836 1.2308
Educational background in
- Business or economics Explanatory 0.824* 0.0920 -1.74 0.083 0.6617 1.0253
- Engineering Explanatory 0.712** 0.1157 -2.09 0.037 0.5182 0.9793
- Law Explanatory 0.857 0.1195 -1.10 0.270 0.6523 1.1267
- Other Explanatory 0.760** 0.0881 -2.37 0.018 0.6052 0.9537
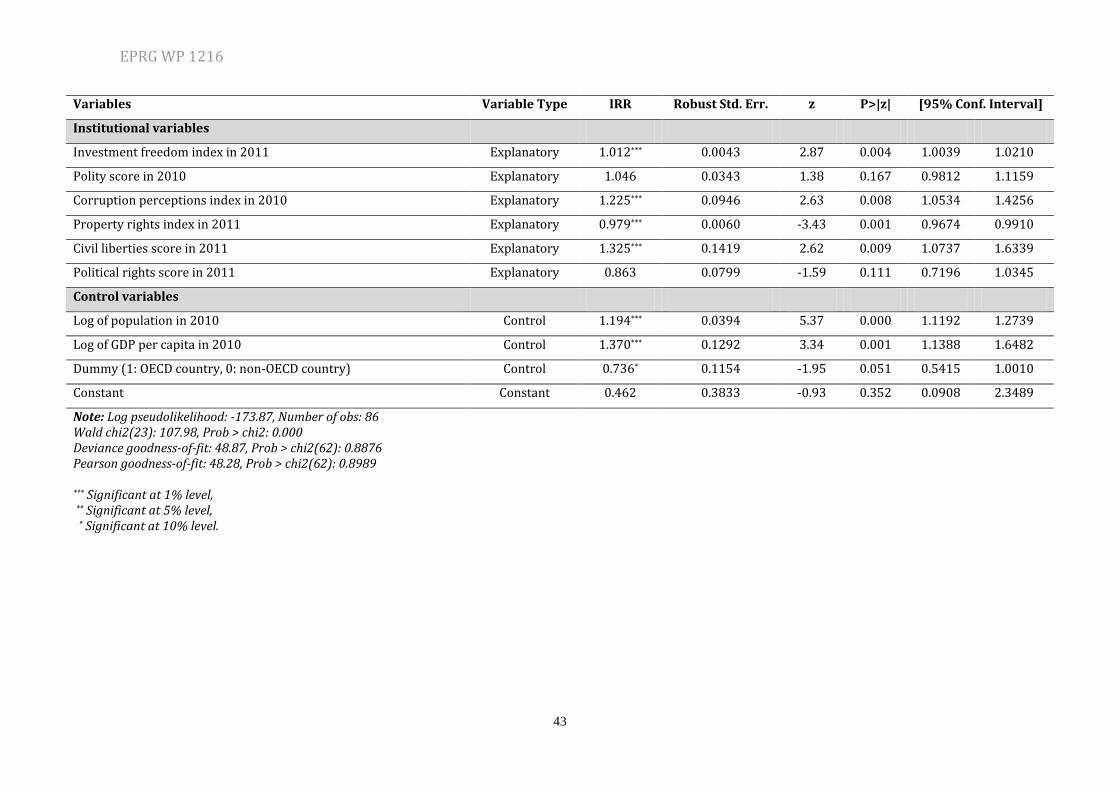
EPRG WP 1216
43
Variables Variable Type IRR Robust Std. Err. z P>|z| [95% Conf. Interval]
Institutional variables
Investment freedom index in 2011 Explanatory 1.012*** 0.0043 2.87 0.004 1.0039 1.0210
Polity score in 2010 Explanatory 1.046 0.0343 1.38 0.167 0.9812 1.1159
Corruption perceptions index in 2010 Explanatory 1.225*** 0.0946 2.63 0.008 1.0534 1.4256
Property rights index in 2011 Explanatory 0.979*** 0.0060 -3.43 0.001 0.9674 0.9910
Civil liberties score in 2011 Explanatory 1.325*** 0.1419 2.62 0.009 1.0737 1.6339
Political rights score in 2011 Explanatory 0.863 0.0799 -1.59 0.111 0.7196 1.0345
Control variables
Log of population in 2010 Control 1.194*** 0.0394 5.37 0.000 1.1192 1.2739
Log of GDP per capita in 2010 Control 1.370*** 0.1292 3.34 0.001 1.1388 1.6482
Dummy (1: OECD country, 0: non-OECD country) Control 0.736* 0.1154 -1.95 0.051 0.5415 1.0010
Constant Constant 0.462 0.3833 -0.93 0.352 0.0908 2.3489
Note: Log pseudolikelihood: -173.87, Number of obs: 86 Wald chi2(23): 107.98, Prob > chi2: 0.000 Deviance goodness-of-fit: 48.87, Prob > chi2(62): 0.8876 Pearson goodness-of-fit: 48.28, Prob > chi2(62): 0.8989
*** Significant at 1% level, ** Significant at 5% level, * Significant at 10% level.
EPRG WP 1216
44
Having presented the study results let me interpret them in detail as follows.
Results for the chairperson of electricity market regulatory agency when the
reforms started or were considered:
Our empirical findings suggest that the educational background and education
level of the chairperson of the electricity market regulatory agency are two
determinants of the scope of power industry reform in a country. We could not
detect any statistically significant relationship between experience or length of
term of the chairperson and scope of reforms. We find that if the chairperson’s
education were to increase by one level (e.g. from MSc to PhD), its rate ratio for
reform score would be expected to increase by a factor 1.076, while holding all
other variables in the model constant. Besides, we detect a negative relationship
between educational background of the chairperson in business or economics
and scope of reforms. Our results imply that if the chairperson holds a degree in
business or economics, the reform score is expected to decrease by a factor
0.830, while holding all other variables in the model constant (see Table 3).
Let me illustrate these results using data from our dataset. In 2004, South Africa
started a reform process in its electricity market and set up its regulatory agency
(National Energy Regulator, NERSA) and its first chair held an MSc degree. One
year later, Nigeria also started a reform process and established its regulatory
agency (Nigerian Electricity Regulatory Commission, NERC) and its first chair
had a PhD degree. For 2011, the electricity market reform scores of South Africa
and Nigeria are 5 and 6, respectively. Our results suggest that if the chairperson’s
education in a country were to increase by one level, its rate ratio for reform
score would be expected to increase by a factor 1.076. Therefore, holding all
other variables constant and assuming that two countries are the same apart
from the education levels of chairpersons of their regulatory agencies when
reforms started, our results require that South Africa’s reform score would be
5.38 (5*1.076) if the education of the first chairperson of South Africa’s
regulatory agency were to increase by 1 level (from MSc to PhD). So, our findings
imply that 0.38 point of 1 point difference between the reform scores of two

EPRG WP 1216
45
countries may be explained by the difference between education levels of two
chairpersons.
Results for the governor or minister responsible for energy policy when the reforms
started or were considered:
The educational background and education level of the governor or minister
responsible for energy policy when the reforms started or were considered seem
to be other important determinants of the scope of power industry reform in a
country. We could not detect any statistically significant relationship between
length of term or experience of the minister/governor and scope of reforms. Our
findings show that if the minister/governor’s education were to increase by one
level, its rate ratio for reform score would be expected to increase by a factor 1.1,
while holding all other variables in the model constant. This result implies that a
minister/governor’s education level positively contributes to the reform process.
The results also show that if the minister/governor holds a degree in
business/economics or engineering, reform score is expected to be 0.824 and
0.712 times less, respectively (see Table 3).
To illustrate these results, we may use data from our dataset. In 1996,
Pennsylvania State of US considered whether to initiate a reform process. The
Governor of Pennsylvania at that time held a non-engineering (law) university
degree. Four years later, Kentucky State also considered the reforms in its
electricity market and, at that time, the Governor of Kentucky had a degree in
engineering. In 2011, the electricity market reform scores of Pennsylvania and
Kentucky were 8 and 3, respectively. Our results suggest that if the governor
holds a degree in engineering, reform score is expected to be 0.712 times less.
Therefore, holding all other variables constant and assuming that two states are
the same apart from educational background of the governors when the reforms
were considered, our results require that reform score of Pennsylvania would be
5.7 (8*0.712) if the Governor of Pennsylvania were to have an educational
background in engineering. So, our findings imply that 2.3 (8-5.7) points of 5
EPRG WP 1216
46
points difference between the reform scores of two states may be explained by
the difference between educational backgrounds of two governors.
Results for macro institutional variables:
Most of the institutional variables in our analysis have a strong impact on the
reform progress. 4 (out of 6) coefficients of institutional variables are significant
even at 1% level. We find that reform progress is highly correlated with
investment freedom index, corruption perceptions index, property rights index
and civil liberties score. We could not detect a statistically meaningful
relationship between reform score and polity score or political rights score. First
of all, our findings suggest a positive relationship between investment freedom
index and reform progress. If investment freedom index of a country were to
increase by one unit, its rate ratio for reform score would be expected to increase
by a factor 1.012, while holding all other variables in the model constant.
Similarly, we see a positive relationship between reform progress and corruption
perceptions index (which increases as corruption declines in a county). If
corruption perceptions index of a country were to increase by one unit, its rate
ratio for reform score would be expected to increase by a factor 1.225, while
holding all other variables in the model constant. Moreover, we detect a negative
relationship between property rights index and reform score. Although this
negative relationship is statistically significant, its impact is extremely limited. If
property rights index of a country were to increase by one unit, its rate ratio for
reform score would be expected to decrease by a factor 0,979, while holding all
other variables in the model constant. While evaluating these results, it is better
to keep in mind that investment freedom index and property rights index are
indicators based on a scale from 0 to 100, while corruption perceptions index
ranges from 0 to 10. So, a one unit increase does not mean the same in all
variables. The most unexpected result from our study is that any improvement in
civil liberties score of a country results in a decline in reform score of that
country. Civil liberties score ranges from 1 to 7, 1 representing the highest and 7
the lowest level of freedom. If civil liberties score of a country were to increase
EPRG WP 1216
47
by one unit (that is when civil liberties become more limited), its rate ratio for
reform score would be expected to increase by a factor 1.325 (see Table 3).
Results for control variables:
Population and per capita income of a country seem to be other important
factors in the reform progress. According to our results, population and GDP per
capita of a country are positively correlated with its reform score. Moreover,
being an OECD country has a significant negative impact on reform progress. If a
country is a member of OECD, then the reform score in this country is expected
to be 0.736 times less (see Table 3). This result may be regarded as an indication
that in countries with well-established institutions the backgrounds of the
chairpersons and the ministers/governors are much less important than in those
with weaker institutions in terms of reform progress.
To illustrate the results above, we again use data from our dataset. Malaysia and
Australia started a reform process in their electricity markets in 2001 and 2005,
respectively. Malaysia is a non-OECD country with an investment freedom index
score of 45 in 2011. On the other hand, Australia is an OECD country and its
investment freedom index score is 80 for 2011. For 2011, the electricity market
reform scores of Malaysia and Australia are 6 and 8, respectively. Our results
suggest that if a country is a member of OECD, reform score is expected to be
0.736 times smaller. Similarly, our findings imply that if investment freedom
index of a country were to increase by one unit, its rate ratio for reform score
would be expected to increase by a factor 1.012. Therefore, holding all other
variables constant and assuming that two countries are the same apart from
their OECD membership status and investment freedom index scores, our results
require that Malaysia’s reform score would be 6.7 [6*0.736*1.012(80-45)] if
Malaysia were to be an OECD country and its investment freedom index score
were to be equal to that of Australia (i.e. 80). So, our findings imply that 0.7
points of 2 points difference between the reform scores of two countries may be
explained by OECD membership status and investment freedom index score.
EPRG WP 1216
48
In our analysis above, we used observations from countries together with those
from the states in US and Canada. Although the states in US and Canada are
usually free to decide whether to initiate a reform process in their power
industries, their discretion may be restricted by the central government in some
instances. Besides, the states in US and Canada are similar in terms of their
geographical location (i.e. North America) and income level (i.e. high income
group), which implies that they may have common tendencies towards
electricity market reform. Taking into account also the fact that the observations
from the states in US and Canada constitute more than half of the observations in
our dataset, our results may be dominated by common characteristics of the
states in US and Canada that may or may not be relevant to reform process.
Therefore, re-estimating our models without the states in US and Canada may
produce useful insights for our analysis. In this second phase of estimation, we
look at micro and macro institutional determinants of the reform progress
separately. Table 4 presents Poisson regression estimation results without the
states in US and Canada as Incident Rate Ratios (IRR) for micro institutional
determinants of the reform progress while Table 5 does the same for macro
determinants. In Table 6, we replace “civil liberties score” with “political rights
score” and estimate the model again.
The empirical findings from the second phase of estimation suggest that the
length of term and educational background of the chairperson of the electricity
market regulatory agency are two determinants of the scope of power industry
reform in a country. We could not detect any statistically significant relationship
between experience in electricity industry or education level of the chairperson
and scope of reforms in a country. We find that if the chairperson’s length of
term in a country were to increase by one year, its rate ratio for reform score
would be expected to increase by a factor 1.042, while holding all other variables
in the model constant. Moreover, we detect a positive relationship between
educational background of the chairperson in engineering and law and scope of
reforms in a country. Our results imply that if the chairperson holds a degree in
engineering or law, the reform score is expected to be 1.459 or 1.477 times
greater, respectively; while holding all other variables in the model constant.
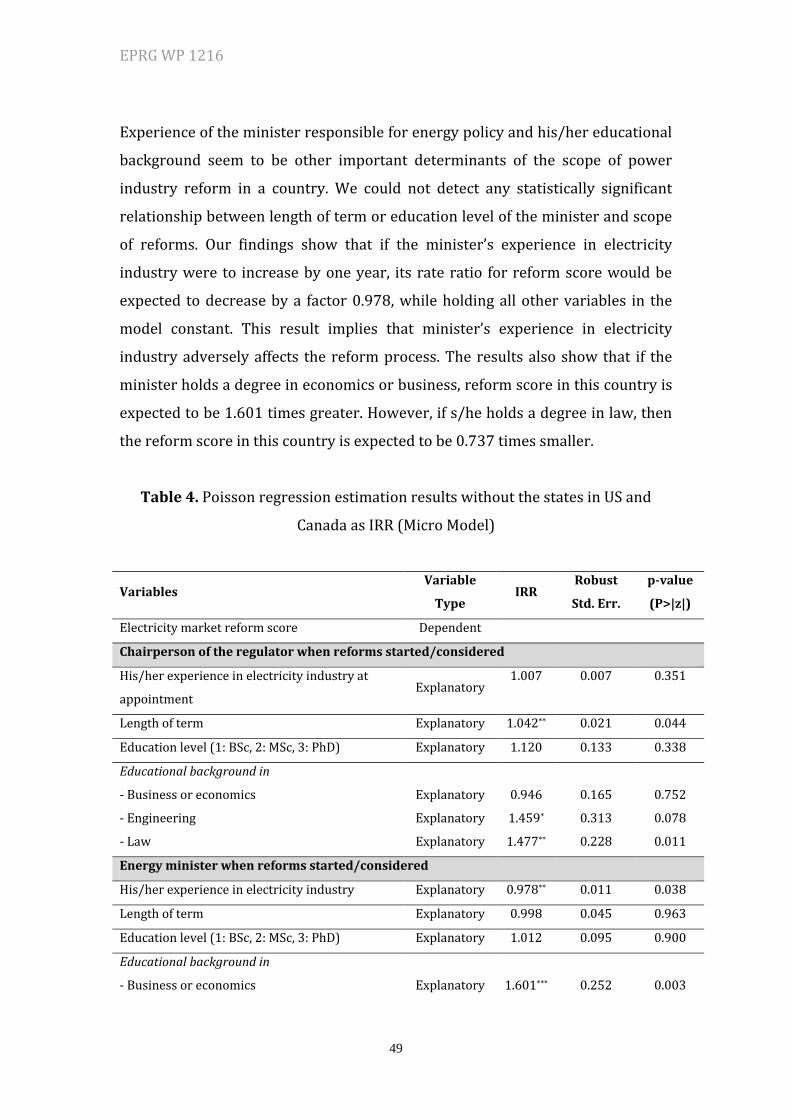
EPRG WP 1216
49
Experience of the minister responsible for energy policy and his/her educational
background seem to be other important determinants of the scope of power
industry reform in a country. We could not detect any statistically significant
relationship between length of term or education level of the minister and scope
of reforms. Our findings show that if the minister’s experience in electricity
industry were to increase by one year, its rate ratio for reform score would be
expected to decrease by a factor 0.978, while holding all other variables in the
model constant. This result implies that minister’s experience in electricity
industry adversely affects the reform process. The results also show that if the
minister holds a degree in economics or business, reform score in this country is
expected to be 1.601 times greater. However, if s/he holds a degree in law, then
the reform score in this country is expected to be 0.737 times smaller.
Table 4. Poisson regression estimation results without the states in US and
Canada as IRR (Micro Model)
Variables Variable
Type IRR
Robust
Std. Err.
p-value
(P>|z|)
Electricity market reform score Dependent
Chairperson of the regulator when reforms started/considered
His/her experience in electricity industry at
appointment Explanatory
1.007 0.007 0.351
Length of term Explanatory 1.042** 0.021 0.044
Education level (1: BSc, 2: MSc, 3: PhD) Explanatory 1.120 0.133 0.338
Educational background in
- Business or economics Explanatory 0.946 0.165 0.752
- Engineering Explanatory 1.459* 0.313 0.078
- Law Explanatory 1.477** 0.228 0.011
Energy minister when reforms started/considered
His/her experience in electricity industry Explanatory 0.978** 0.011 0.038
Length of term Explanatory 0.998 0.045 0.963
Education level (1: BSc, 2: MSc, 3: PhD) Explanatory 1.012 0.095 0.900
Educational background in
- Business or economics Explanatory 1.601*** 0.252 0.003
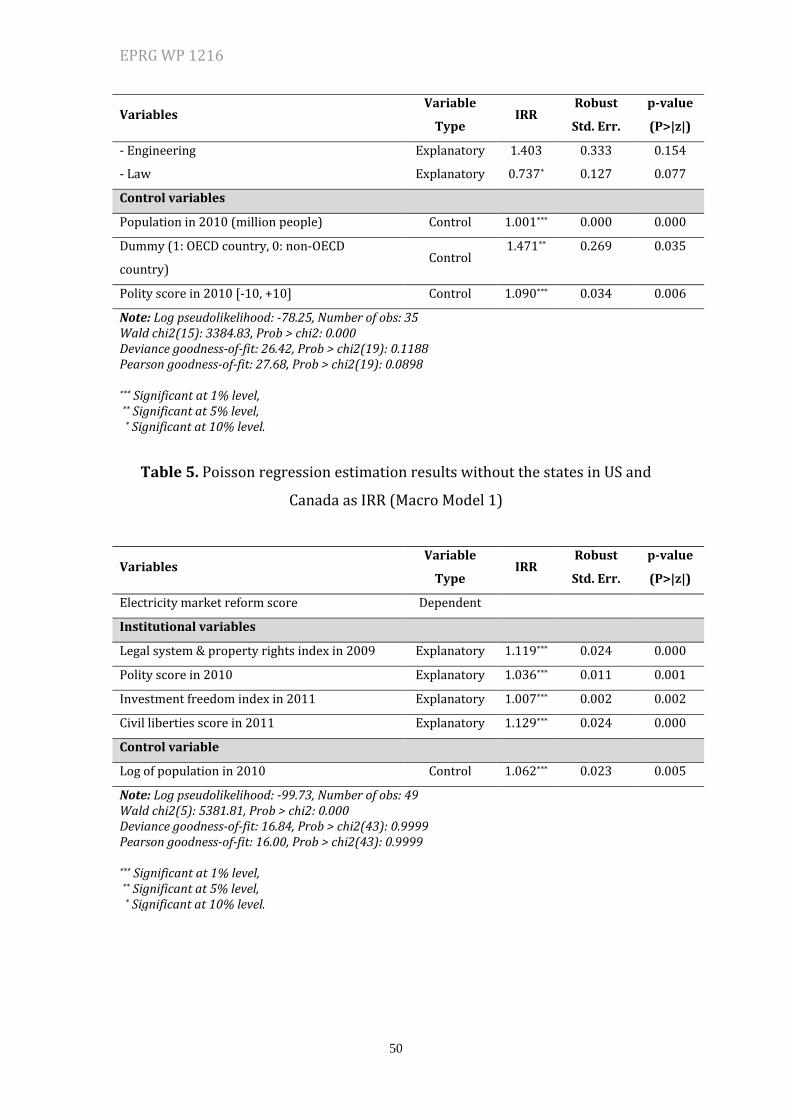
EPRG WP 1216
50
Variables Variable
Type IRR
Robust
Std. Err.
p-value
(P>|z|)
- Engineering Explanatory 1.403 0.333 0.154
- Law Explanatory 0.737* 0.127 0.077
Control variables
Population in 2010 (million people) Control 1.001*** 0.000 0.000
Dummy (1: OECD country, 0: non-OECD
country) Control
1.471** 0.269 0.035
Polity score in 2010 [-10, +10] Control 1.090*** 0.034 0.006
Note: Log pseudolikelihood: -78.25, Number of obs: 35 Wald chi2(15): 3384.83, Prob > chi2: 0.000 Deviance goodness-of-fit: 26.42, Prob > chi2(19): 0.1188 Pearson goodness-of-fit: 27.68, Prob > chi2(19): 0.0898
*** Significant at 1% level, ** Significant at 5% level, * Significant at 10% level.
Table 5. Poisson regression estimation results without the states in US and
Canada as IRR (Macro Model 1)
Variables Variable
Type IRR
Robust
Std. Err.
p-value
(P>|z|)
Electricity market reform score Dependent
Institutional variables
Legal system & property rights index in 2009 Explanatory 1.119*** 0.024 0.000
Polity score in 2010 Explanatory 1.036*** 0.011 0.001
Investment freedom index in 2011 Explanatory 1.007*** 0.002 0.002
Civil liberties score in 2011 Explanatory 1.129*** 0.024 0.000
Control variable
Log of population in 2010 Control 1.062*** 0.023 0.005
Note: Log pseudolikelihood: -99.73, Number of obs: 49 Wald chi2(5): 5381.81, Prob > chi2: 0.000 Deviance goodness-of-fit: 16.84, Prob > chi2(43): 0.9999 Pearson goodness-of-fit: 16.00, Prob > chi2(43): 0.9999
*** Significant at 1% level, ** Significant at 5% level, * Significant at 10% level.
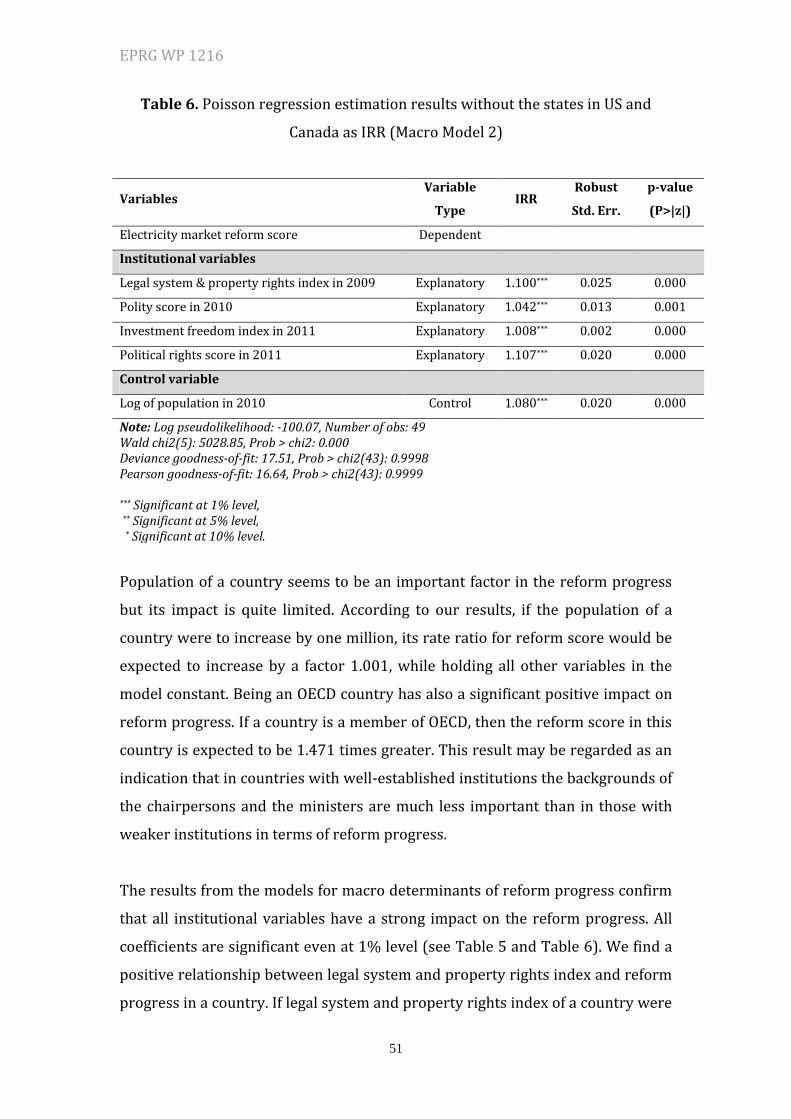
EPRG WP 1216
51
Table 6. Poisson regression estimation results without the states in US and
Canada as IRR (Macro Model 2)
Variables Variable
Type IRR
Robust
Std. Err.
p-value
(P>|z|)
Electricity market reform score Dependent
Institutional variables
Legal system & property rights index in 2009 Explanatory 1.100*** 0.025 0.000
Polity score in 2010 Explanatory 1.042*** 0.013 0.001
Investment freedom index in 2011 Explanatory 1.008*** 0.002 0.000
Political rights score in 2011 Explanatory 1.107*** 0.020 0.000
Control variable
Log of population in 2010 Control 1.080*** 0.020 0.000
Note: Log pseudolikelihood: -100.07, Number of obs: 49 Wald chi2(5): 5028.85, Prob > chi2: 0.000 Deviance goodness-of-fit: 17.51, Prob > chi2(43): 0.9998 Pearson goodness-of-fit: 16.64, Prob > chi2(43): 0.9999
*** Significant at 1% level, ** Significant at 5% level, * Significant at 10% level.
Population of a country seems to be an important factor in the reform progress
but its impact is quite limited. According to our results, if the population of a
country were to increase by one million, its rate ratio for reform score would be
expected to increase by a factor 1.001, while holding all other variables in the
model constant. Being an OECD country has also a significant positive impact on
reform progress. If a country is a member of OECD, then the reform score in this
country is expected to be 1.471 times greater. This result may be regarded as an
indication that in countries with well-established institutions the backgrounds of
the chairpersons and the ministers are much less important than in those with
weaker institutions in terms of reform progress.
The results from the models for macro determinants of reform progress confirm
that all institutional variables have a strong impact on the reform progress. All
coefficients are significant even at 1% level (see Table 5 and Table 6). We find a
positive relationship between legal system and property rights index and reform
progress in a country. If legal system and property rights index of a country were
EPRG WP 1216
52
to increase by one unit, its rate ratio for reform score would be expected to
increase by a factor 1.119, while holding all other variables in the model constant
(see Table 5). Similarly, we see a positive relationship between reform progress
and polity score and investment freedom index. If polity score or investment
freedom index of a country were to increase by one unit, its rate ratio for reform
score would be expected to increase by a factor 1.036 or 1.007 respectively,
while holding all other variables in the model constant. While evaluating these
results, it is better to keep in mind that polity score is an indicator based on a
scale from -10 to +10, while investment freedom index ranges from 0 to 100. So,
a one unit increase in these variables does not mean the same.
As in the case of the first phase of estimations, the results from the second phase
verify that any improvement in civil liberties or political rights score of a country
results in a decline in reform score of that country. As mentioned before, civil
liberties score and political rights score range from 1 to 7, 1 representing the
highest and 7 the lowest level of freedom. If civil liberties score of a country were
to increase by one unit (that is when civil liberties become more limited), its rate
ratio for reform score would be expected to increase by a factor 1.129 (see Table
5). In the same way, if the political rights score of a country were to increase by
one unit (that is when political rights become more limited), its rate ratio for
reform score would be expected to increase by a factor 1.107 (see Table 6).
Table 7 compares the results from the first and second phase of estimations. It
presents statistically significant coefficients only. As can be seen in Table 7, the
results from two groups of estimations are similar in general with some slight
differences in details. In both groups of estimations, we see that characteristics of
chairperson and minister/governor and institutional variables have a
statistically significant impact on reform progress.
To sum up, based on our results, we reject Hypotheses 2 and 3 but fail to reject
Hypotheses 1 and 4. Our results clearly show that both the background of the
chairperson and the minister/governor and institutional endowments are
important determinants of how far reforms have gone in a country. It should also
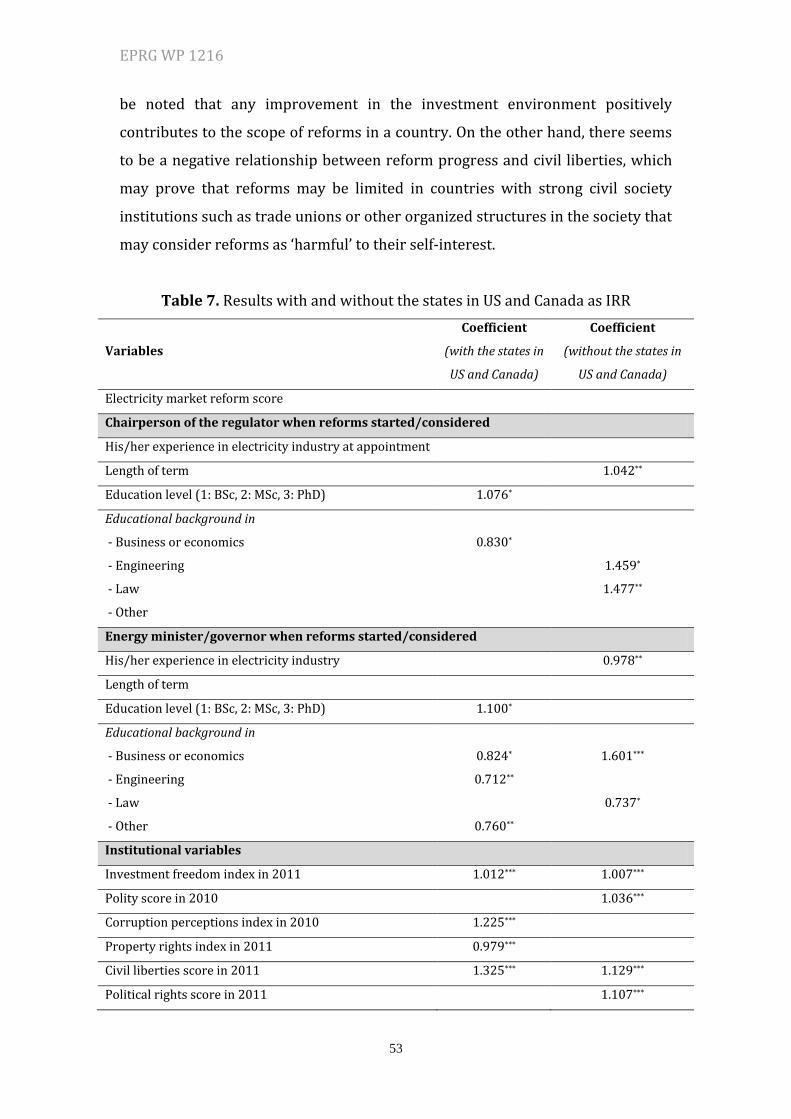
EPRG WP 1216
53
be noted that any improvement in the investment environment positively
contributes to the scope of reforms in a country. On the other hand, there seems
to be a negative relationship between reform progress and civil liberties, which
may prove that reforms may be limited in countries with strong civil society
institutions such as trade unions or other organized structures in the society that
may consider reforms as ‘harmful’ to their self-interest.
Table 7. Results with and without the states in US and Canada as IRR
Variables
Coefficient
(with the states in
US and Canada)
Coefficient
(without the states in
US and Canada)
Electricity market reform score
Chairperson of the regulator when reforms started/considered
His/her experience in electricity industry at appointment
Length of term 1.042**
Education level (1: BSc, 2: MSc, 3: PhD) 1.076*
Educational background in
- Business or economics 0.830*
- Engineering 1.459*
- Law 1.477**
- Other
Energy minister/governor when reforms started/considered
His/her experience in electricity industry 0.978**
Length of term
Education level (1: BSc, 2: MSc, 3: PhD) 1.100*
Educational background in
- Business or economics 0.824* 1.601***
- Engineering 0.712**
- Law 0.737*
- Other 0.760**
Institutional variables
Investment freedom index in 2011 1.012*** 1.007***
Polity score in 2010 1.036***
Corruption perceptions index in 2010 1.225***
Property rights index in 2011 0.979***
Civil liberties score in 2011 1.325*** 1.129***
Political rights score in 2011 1.107***
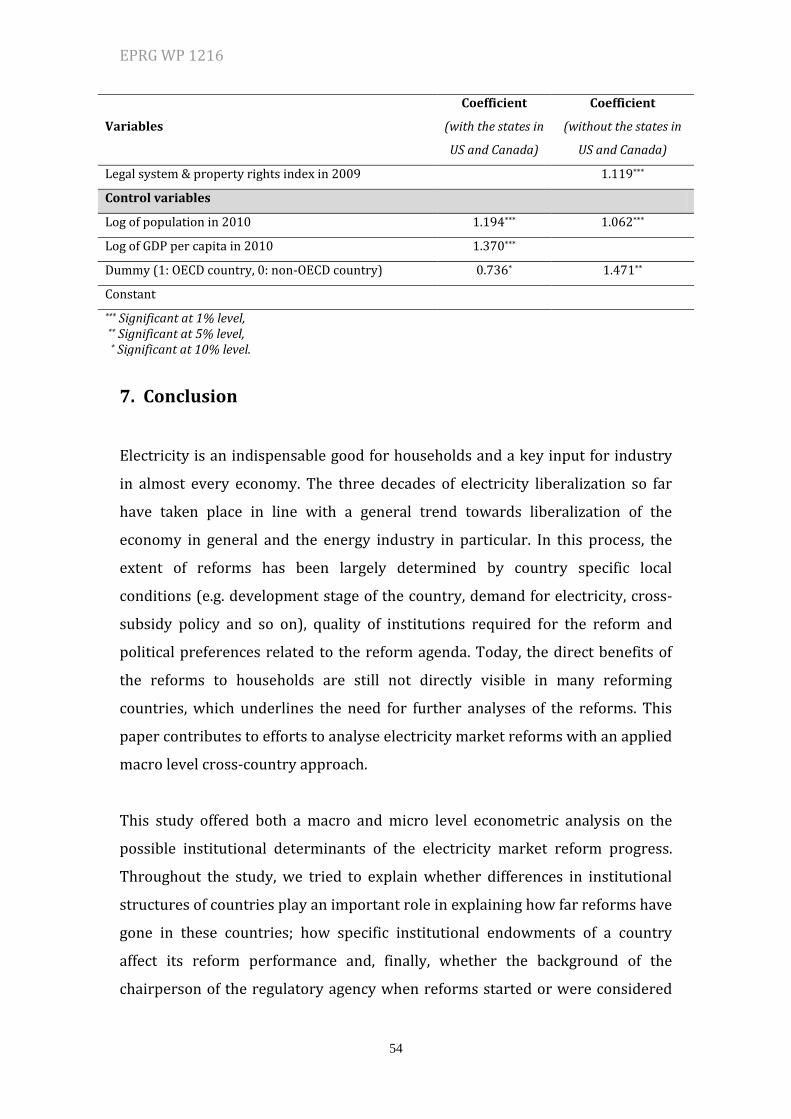
EPRG WP 1216
54
Variables
Coefficient
(with the states in
US and Canada)
Coefficient
(without the states in
US and Canada)
Legal system & property rights index in 2009 1.119***
Control variables
Log of population in 2010 1.194*** 1.062***
Log of GDP per capita in 2010 1.370***
Dummy (1: OECD country, 0: non-OECD country) 0.736* 1.471**
Constant
*** Significant at 1% level, ** Significant at 5% level, * Significant at 10% level.
7. Conclusion
Electricity is an indispensable good for households and a key input for industry
in almost every economy. The three decades of electricity liberalization so far
have taken place in line with a general trend towards liberalization of the
economy in general and the energy industry in particular. In this process, the
extent of reforms has been largely determined by country specific local
conditions (e.g. development stage of the country, demand for electricity, cross-
subsidy policy and so on), quality of institutions required for the reform and
political preferences related to the reform agenda. Today, the direct benefits of
the reforms to households are still not directly visible in many reforming
countries, which underlines the need for further analyses of the reforms. This
paper contributes to efforts to analyse electricity market reforms with an applied
macro level cross-country approach.
This study offered both a macro and micro level econometric analysis on the
possible institutional determinants of the electricity market reform progress.
Throughout the study, we tried to explain whether differences in institutional
structures of countries play an important role in explaining how far reforms have
gone in these countries; how specific institutional endowments of a country
affect its reform performance and, finally, whether the background of the
chairperson of the regulatory agency when reforms started or were considered
EPRG WP 1216
55
or that of the governor/minister responsible for energy policy at that time has an
impact on reform progress. We focused on these issues by using an empirical
econometric model to observe the impact of institutional variables on the reform
progress. Cross-section data from 51 states in US, 13 states in Canada and 51
other countries were employed. As a result of the study, we found that both the
background of the chairperson and the minister/governor and institutional
endowments of a country are important determinants of how far reforms have
gone in a country. Our results imply that any improvement in the investment
environment positively contributes to the scope of reforms in a country. On the
other hand, there seems to be a negative relationship between reform progress
and civil liberties, which indicates that democracy may delay or hinder the
reforms by magnifying the voices of anti-reform interest groups.
We hope that future research will continue developing econometric models to
analyse electricity market reforms. We suggest the following for future research.
First of all, due to lack of essential data, we focused on the reform progress
rather than reform success or failure. However, there is a definite need for
identifying the determinants of reform success or failure. So, future research on
electricity market reforms should focus on identifying what successful reform is
and developing new variables that measure the relative success of reforms.
The second possible extension in future research may be the identification of
suitable instrumental variables (IV) to overcome the possible endogeneity
problem. Despite our efforts, we could not find any suitable instrumental
variable in this research and, therefore, did not use IV methods in the paper. As
we know credibility of the estimates from a regression using IV methods hinges
on the selection of suitable instruments. Utilization of IV methods with
inappropriate instruments creates more problems than it solves. If suitable
instrumental variables exist for the analysis of electricity market reforms and
they are used in the future research, our understanding of the reforms may
improve.
EPRG WP 1216
56
The third task for future research should be the extension of the data set in terms
of number of countries, time period, frequency of data and number (and quality)
of variables. In this paper, we employed data from 53 countries. There may be
sample selection bias if the countries making this data available have differing
results for the dependent variables than those which do not make data available.
Besides, due to lack of data, we could not properly account for the impact of
some other variables on reform progress in our analysis. Future research should
focus on developing techniques to overcome data-related problems.
The fourth extension may be realized by taking into account the fact that
electricity reform is a part of wider economic reform (or liberalization) in
general and energy industry reform in particular. In the period 1990-2011, total
private investments in the infrastructure industries (energy, telecom, transport,
water and sewerage) were about $1,695 billion. Out of this figure, $573 billion
(33.8%) went to energy industry in general and $508 billion (30%) to electricity
industry in particular. Power market reform affects and is affected by reforms in
other energy and non-energy sectors. For instance, it is obvious that the progress
in telecommunication reform has facilitated electricity reform, which in turn has
contributed to the progress in gas market reform. As observed by Pollitt (2009),
the link between electricity reform and institutions more generally remains
poorly explored. Electricity reform, Pollitt (2009) argues, requires fundamental
change of the institutions in the electricity sector (e.g. the creation of an
independent regulator and an Independent System Operator); however, these
institutional changes occur in the context of ‘deeper’ institutions such as
competition policy, the judiciary, political fora, and so on. The extent to which
electricity reform can make up for deficiencies in these ‘deeper’ institutions is
limited. Moreover, Nepal and Jamasb (2012) investigate the link between power
sector reforms and wider institutional reforms in the economy across different
groups of transition countries. Their results indicate that power sector reform is
highly inter-dependent with wider reforms in other sectors of the economy and
failure to harmonize inter-sector reforms leads to power sector reform measures
being ineffective. They argue that the success of power sector reforms in
developing countries largely depend on the extent to which they synchronize
EPRG WP 1216
57
inter-sector reforms in the economy. In this research, we did not take into
account possible spill-over effects from or to other energy and non-energy
sectors but inter-reform relationship is clearly an important research area that is
open to exploration.
Finally, we studied certain aspects of institutional quality. Of course, there
remain many other characteristics of institutions that we did not investigate.
They may constitute possible topics for future research if data on them become
available.

EPRG WP 1216
58
Acknowledgements
I would like to take this opportunity to thank various people and institutions
without whose extremely generous support this paper would have hardly been
prepared. First of all, I would like to thank my supervisors, Dr. Michael Pollitt and
Prof. David Newbery, for all their helpful comments and suggestions. Special
thanks are due to Dr. Paul Kattuman, who provided me with the econometrics
background that I have extensively exploited to prepare the paper. I would like
to extend my sincere thanks and appreciation to Mr. Anthony Haynes, who
helped me to improve the language of the paper. I am also grateful to the
Cambridge Overseas Trust for awarding me a full scholarship that has financed
my doctoral studies.
This research has benefited greatly throughout the years from comments and
suggestions by many participants of the conferences or seminars such as EPRG
Energy & Environment seminars, the Cambridge Judge Business School doctoral
conferences and PhD research lunches. Their contribution is sincerely
appreciated. Besides, this paper is a part of the author’s PhD thesis. In March
2012, on the occasion of the 10 year anniversary of the Austrian energy regulator
(E-Control), the thesis as a whole was granted a research award by E-Control in
recognition for its contribution to research in the area of electricity market
liberalization. I would like to express my gratitude to anonymous referees who
took part in the review processes of the thesis.
Last but not least, I owe many thanks to my loving wife who has been by my side
through all my ups and downs, who has supported me and helped me, during the
entire course of my PhD, which has been a very challenging journey. Without her,
things would not be the same.
EPRG WP 1216
59
References
Acemoglu, D., Bautista, M. A., Querubin, P., & Robinson, J. A. (2008). Economic and
Political Inequality in Development: The Case of Cundinamarca, Colombia. In E.
Helpman (Ed.), Institutions and economic performance. Cambridge, Mass.:
Harvard University Press.
Acemoglu, D., Johnson, S., & Robinson, J. A. (2001). The Colonial Origins of Comparative
Development: An Empirical Investigation. American Economic Review, 91(5),
1369-1401. doi: 10.1257/aer.91.5.1369
Acemoglu, D., Johnson, S., & Robinson, J. A. (2005). Chapter 6 Institutions as a
Fundamental Cause of Long-Run Growth. In A. Philippe & N. D. Steven (Eds.),
Handbook of Economic Growth (Vol. Volume 1, Part 1, pp. 385-472): Elsevier.
Aghion, P., Alesina, A., & Trebbi, F. (2008). Democrary, Technology, and Growth. In E.
Helpman (Ed.), Institutions and economic performance. Cambridge, Mass.:
Harvard University Press.
Alesina, A., Özler, S., Roubini, N., & Swagel, P. (1996). Political instability and economic
growth. Journal of Economic Growth, 1(2), 189-211. doi: 10.1007/bf00138862
Alesina, A., & Rodrik, D. (1994). Distributive Politics and Economic Growth. The
Quarterly Journal of Economics, 109(2), 465-490.
Aron, J. (2000). Growth and Institutions: A Review of the Evidence. The World Bank
Research Observer, 15(1), 99-135.
Assane, D., & Grammy, A. (2003). Institutional framework and economic development:
international evidence. Applied Economics, 35(17), 1811-1817.
Barro, R. J. (1991). Economic Growth in a Cross Section of Countries. The Quarterly
Journal of Economics, 106(2), 407-443.
Barro, R. J. (1996). Democracy and growth. Journal of Economic Growth, 1(1), 1-27. doi:
10.1007/bf00163340
Barro, R. J. (2000). Inequality and Growth in a Panel of Countries. Journal of Economic
Growth, 5(1), 5-32. doi: 10.1023/a:1009850119329
Besley, T., & Kudamatsu, M. (2008). Making Autocracy Work. In E. Helpman (Ed.),
Institutions and economic performance. Cambridge, Mass.: Harvard University
Press.
Bhattacharyya, S. C. (2007). Power sector reform in South Asia: Why slow and limited so
far? Energy Policy, 35(1), 317-332. doi: 10.1016/j.enpol.2005.11.028
Brousseau, E., & Glachant, J.-M. (2008). New institutional economics: a guidebook.
Cambridge, UK; New York: Cambridge University Press.
EPRG WP 1216
60
Cameron, A. C., & Trivedi, P. K. (1998). Regression analysis of count data. Cambridge, UK;
New York, USA: Cambridge University Press.
Cameron, A. C., & Trivedi, P. K. (2009). Microeconometrics using Stata. College Station,
Tex.: Stata Press.
Caselli, F., Esquivel, G., & Lefort, F. (1996). Reopening the convergence debate: A new
look at cross-country growth empirics. Journal of Economic Growth, 1(3), 363-
389. doi: 10.1007/bf00141044
Chavance, B. (2009). Institutional economics. London; New York: Routledge.
Clague, C., Keefer, P., Knack, S., & Olson, M. (1996). Property and contract rights in
autocracies and democracies. Journal of Economic Growth, 1(2), 243-276. doi:
10.1007/bf00138864
Coase, R. H. (1937). The Nature of the Firm. Economica, 4(16), 386-405. doi:
10.1111/j.1468-0335.1937.tb00002.x
CSP. (2010). Center for Systemic Peace, Polity IV Project: Political Regime
Characteristics and Transitions, 1800-2009, from
http://www.systemicpeace.org/polity/polity4.htm
Drury, A. C., Krieckhaus, J., & Lusztig, M. (2006). Corruption, Democracy, and Economic
Growth. International Political Science Review / Revue internationale de science
politique, 27(2), 121-136.
Easterly, W., & Levine, R. (1997). Africa's Growth Tragedy: Policies and Ethnic Divisions.
The Quarterly Journal of Economics, 112(4), 1203-1250.
Freedom House. (2011). Map of Freedom in the World, 2008 Edition. Retrieved
23.01.2011, from Freedom House http://www.freedomhouse.org
Gagliardi, F. (2008). Institutions and economic change: A critical survey of the new
institutional approaches and empirical evidence. Journal of Socio-Economics,
37(1), 416-443. doi: 10.1016/j.socec.2007.03.001
Ghertman, M., & Ménard, C. (2009). Regulation, deregulation, reregulation: institutional
perspectives. Cheltenham, UK; Northampton, MA: Edward Elgar.
Green, R., Lorenzoni, A., Pérez, Y., & Pollitt, M. (2009). Policy assessment and good
practices. In J.-M. Glachant & F. Lévêque (Eds.), Electricity reform in Europe:
towards a single energy market (pp. 172-204). Cheltenham, UK; Northampton,
MA: Edward Elgar.
Haney, A. B., & Pollitt, M. G. (2011). Exploring the determinants of “best practice”
benchmarking in electricity network regulation. Energy Policy, 39(12), 7739-
7746. doi: 10.1016/j.enpol.2011.09.018
EPRG WP 1216
61
Harriss, J., Hunter, J., & Lewis, C. M. (Eds.). (1997). The new institutional economics and
Third World development. London; New York: Routledge.
Helliwell, J. F. (1994). Empirical Linkages between Democracy and Economic Growth.
British Journal of Political Science, 24(2), 225-248.
Heritage Foundation. (2011). The 2011 Index of Economic Freedom. Retrieved
23.10.2011, from Heritage Foundation http://www.heritage.org/index
Isham, J., Kaufmann, D., & Pritchett, L. H. (1997). Civil Liberties, Democracy, and the
Performance of Government Projects. The World Bank Economic Review, 11(2),
219-242.
Keefer, P., & Knack, S. (1997). Why don't poor countries catch up? A cross-national test
of an institutional explanation. Economic Inquiry, 35(3), 590-602. doi:
10.1111/j.1465-7295.1997.tb02035.x
Keefer, P., & Knack, S. (2002). Polarization, politics and property rights: Links between
inequality and growth. Public Choice, 111(1-2), 127-154.
Knack, S., & Keefer, P. (1997). Does social capital have an economic payoff? A cross-
country investigation. Quarterly Journal of Economics, 112(4), 1251.
Littlechild, S. C., & Skerk, C. J. (2004). Regulation of transmission expansion in Argentina
Part I: State ownership, reform and the Fourth Line. Cambridge Working Papers
in Economics, CWPE 0464: Faculty of Economics, University of Cambridge.
Mauro, P. (1995). Corruption and Growth. The Quarterly Journal of Economics, 110(3),
681-712.
Ménard, C., & Shirley, M. M. (2008). Handbook of new institutional economics. Berlin:
Springer.
Musole, M. (2009). Property rights, transaction costs and institutional change:
Conceptual framework and literature review. Progress in Planning, 71(2), 43-85.
doi: 10.1016/j.progress.2008.09.002
Nepal, R., & Jamasb, T. (2012). Reforming the power sector in transition: Do institutions
matter? Energy Economics(0). doi: 10.1016/j.eneco.2012.02.002
North, D. C. (1990). Institutions, institutional change, and economic performance.
Cambridge; New York: Cambridge University Press.
Nunn, N. (2008). Slavery, Inequality and Economic Development in the Americas: An
Examination of the Engerman-Sokoloff Hypothesis. In E. Helpman (Ed.),
Institutions and economic performance. Cambridge, Mass.: Harvard University
Press.
Persson, T., & Tabellini, G. (1994). Is Inequality Harmful for Growth? The American
Economic Review, 84(3), 600-621.
EPRG WP 1216
62
Persson, T., & Tabellini, G. (2008). The Growth Effect of Democracy. In E. Helpman (Ed.),
Institutions and economic performance. Cambridge, Mass.: Harvard University
Press.
Pollitt, M. (2009). Evaluating the evidence on electricity reform: Lessons for the South
East Europe (SEE) market. Utilities Policy, 17(1), 13-23. doi:
10.1016/j.jup.2008.02.006
Scully, G. W. (1988). The Institutional Framework and Economic Development. The
Journal of Political Economy, 96(3), 652-662.
Spindler, Z. A. (1991). Liberty and Development: A Further Empirical Perspective. Public
Choice, 69(2), 197-210.
Transparency International. (2011). Corruption Perceptions Index 2010. Retrieved
23.10.2011, from Transparency International
http://cpi.transparency.org/cpi2011/
Vanssay, X. D., & Spindler, Z. A. (1994). Freedom and Growth: Do Constitutions Matter?
Public Choice, 78(3/4), 359-372.
Winkelmann, R. (2008). Econometric analysis of count data (5th ed.). Berlin: Springer.
Wooldridge, J. M. (2009). Introductory econometrics: a modern approach (4th ed.).
Mason, OH: South Western, Cengage Learning.
World Bank. (1997). World Development Report 1997: The State in a Changing World.
Washington, US.
World Bank. (2002). World Development Report 2002: Building Institutions for
Markets. Washington, US.
World Bank. (2010). World Development Indicators (Edition: April 2010).
http://data.worldbank.org
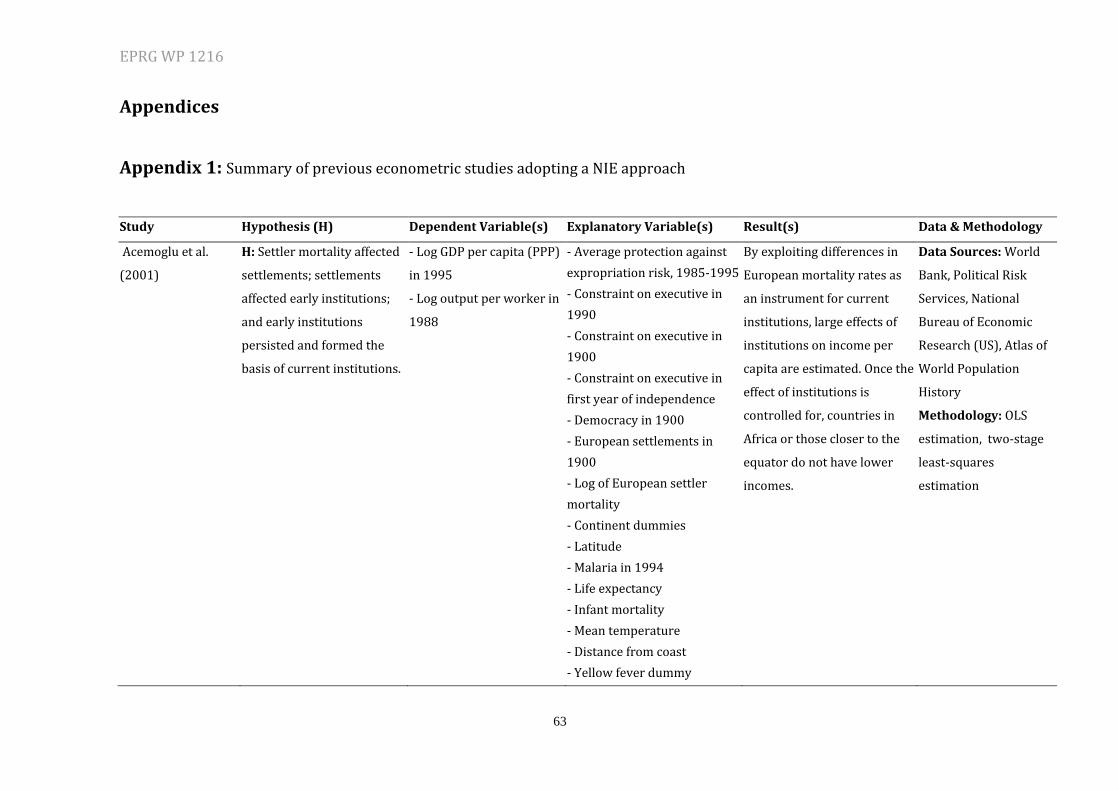
EPRG WP 1216
63
Appendices
Appendix 1: Summary of previous econometric studies adopting a NIE approach
Study Hypothesis (H) Dependent Variable(s) Explanatory Variable(s) Result(s) Data & Methodology
Acemoglu et al.
(2001)
H: Settler mortality affected
settlements; settlements
affected early institutions;
and early institutions
persisted and formed the
basis of current institutions.
- Log GDP per capita (PPP)
in 1995
- Log output per worker in
1988
- Average protection against
expropriation risk, 1985-1995
- Constraint on executive in
1990
- Constraint on executive in
1900
- Constraint on executive in
first year of independence
- Democracy in 1900
- European settlements in
1900
- Log of European settler
mortality
- Continent dummies
- Latitude
- Malaria in 1994
- Life expectancy
- Infant mortality
- Mean temperature
- Distance from coast
- Yellow fever dummy
By exploiting differences in
European mortality rates as
an instrument for current
institutions, large effects of
institutions on income per
capita are estimated. Once the
effect of institutions is
controlled for, countries in
Africa or those closer to the
equator do not have lower
incomes.
Data Sources: World
Bank, Political Risk
Services, National
Bureau of Economic
Research (US), Atlas of
World Population
History
Methodology: OLS
estimation, two-stage
least-squares
estimation
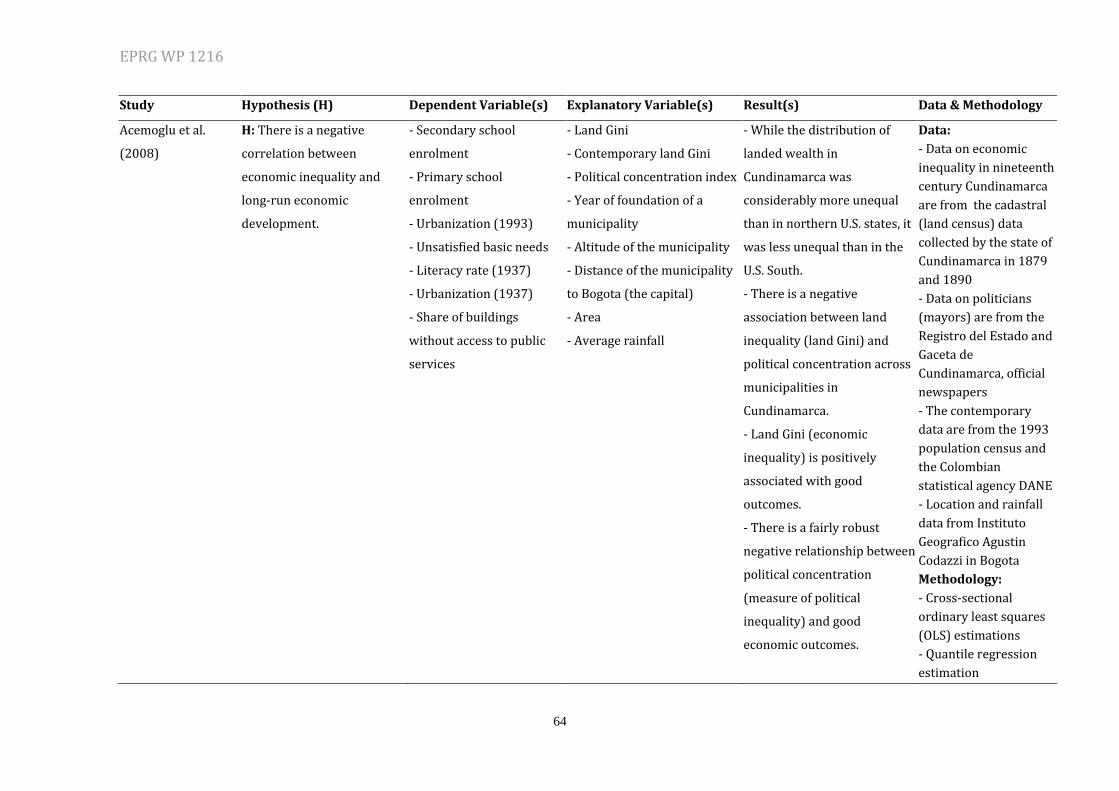
EPRG WP 1216
64
Study Hypothesis (H) Dependent Variable(s) Explanatory Variable(s) Result(s) Data & Methodology
Acemoglu et al.
(2008)
H: There is a negative
correlation between
economic inequality and
long-run economic
development.
- Secondary school
enrolment
- Primary school
enrolment
- Urbanization (1993)
- Unsatisfied basic needs
- Literacy rate (1937)
- Urbanization (1937)
- Share of buildings
without access to public
services
- Land Gini
- Contemporary land Gini
- Political concentration index
- Year of foundation of a
municipality
- Altitude of the municipality
- Distance of the municipality
to Bogota (the capital)
- Area
- Average rainfall
- While the distribution of
landed wealth in
Cundinamarca was
considerably more unequal
than in northern U.S. states, it
was less unequal than in the
U.S. South.
- There is a negative
association between land
inequality (land Gini) and
political concentration across
municipalities in
Cundinamarca.
- Land Gini (economic
inequality) is positively
associated with good
outcomes.
- There is a fairly robust
negative relationship between
political concentration
(measure of political
inequality) and good
economic outcomes.
Data:
- Data on economic
inequality in nineteenth
century Cundinamarca
are from the cadastral
(land census) data
collected by the state of
Cundinamarca in 1879
and 1890
- Data on politicians
(mayors) are from the
Registro del Estado and
Gaceta de
Cundinamarca, official
newspapers
- The contemporary
data are from the 1993
population census and
the Colombian
statistical agency DANE
- Location and rainfall
data from Instituto
Geografico Agustin
Codazzi in Bogota
Methodology:
- Cross-sectional
ordinary least squares
(OLS) estimations
- Quantile regression
estimation
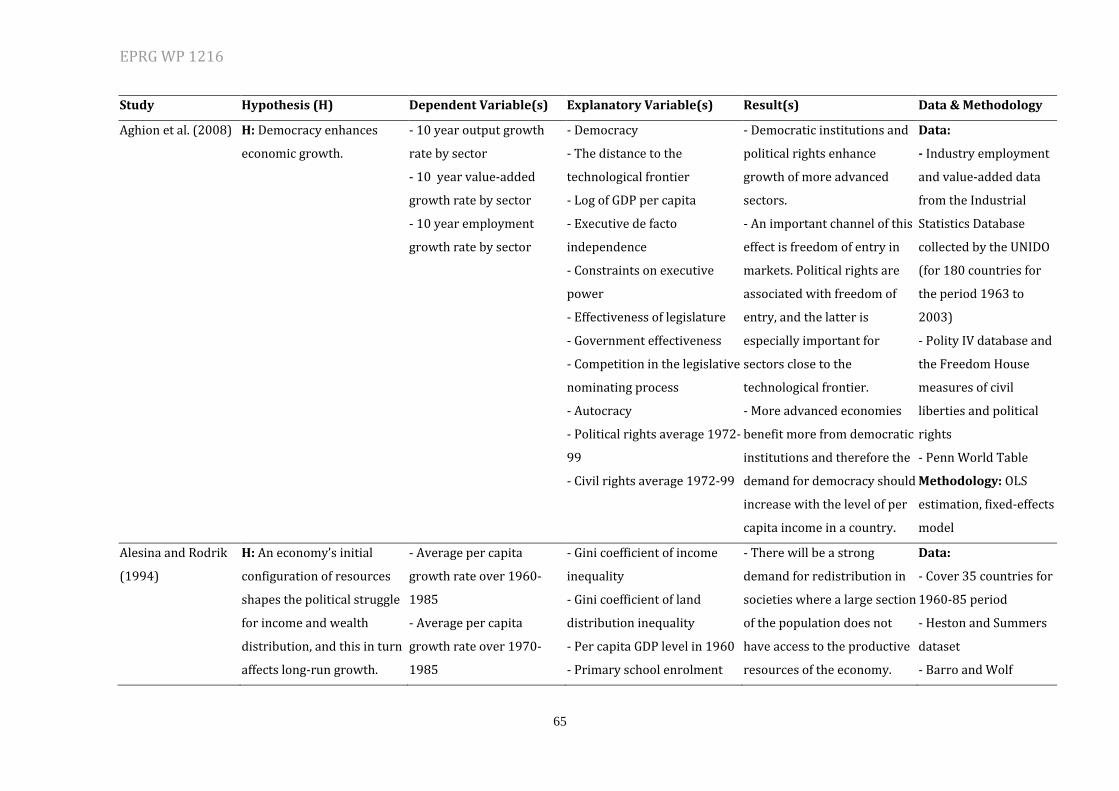
EPRG WP 1216
65
Study Hypothesis (H) Dependent Variable(s) Explanatory Variable(s) Result(s) Data & Methodology
Aghion et al. (2008) H: Democracy enhances
economic growth.
- 10 year output growth
rate by sector
- 10 year value-added
growth rate by sector
- 10 year employment
growth rate by sector
- Democracy
- The distance to the
technological frontier
- Log of GDP per capita
- Executive de facto
independence
- Constraints on executive
power
- Effectiveness of legislature
- Government effectiveness
- Competition in the legislative
nominating process
- Autocracy
- Political rights average 1972-
99
- Civil rights average 1972-99
- Democratic institutions and
political rights enhance
growth of more advanced
sectors.
- An important channel of this
effect is freedom of entry in
markets. Political rights are
associated with freedom of
entry, and the latter is
especially important for
sectors close to the
technological frontier.
- More advanced economies
benefit more from democratic
institutions and therefore the
demand for democracy should
increase with the level of per
capita income in a country.
Data:
- Industry employment
and value-added data
from the Industrial
Statistics Database
collected by the UNIDO
(for 180 countries for
the period 1963 to
2003)
- Polity IV database and
the Freedom House
measures of civil
liberties and political
rights
- Penn World Table
Methodology: OLS
estimation, fixed-effects
model
Alesina and Rodrik
(1994)
H: An economy’s initial
configuration of resources
shapes the political struggle
for income and wealth
distribution, and this in turn
affects long-run growth.
- Average per capita
growth rate over 1960-
1985
- Average per capita
growth rate over 1970-
1985
- Gini coefficient of income
inequality
- Gini coefficient of land
distribution inequality
- Per capita GDP level in 1960
- Primary school enrolment
- There will be a strong
demand for redistribution in
societies where a large section
of the population does not
have access to the productive
resources of the economy.
Data:
- Cover 35 countries for
1960-85 period
- Heston and Summers
dataset
- Barro and Wolf
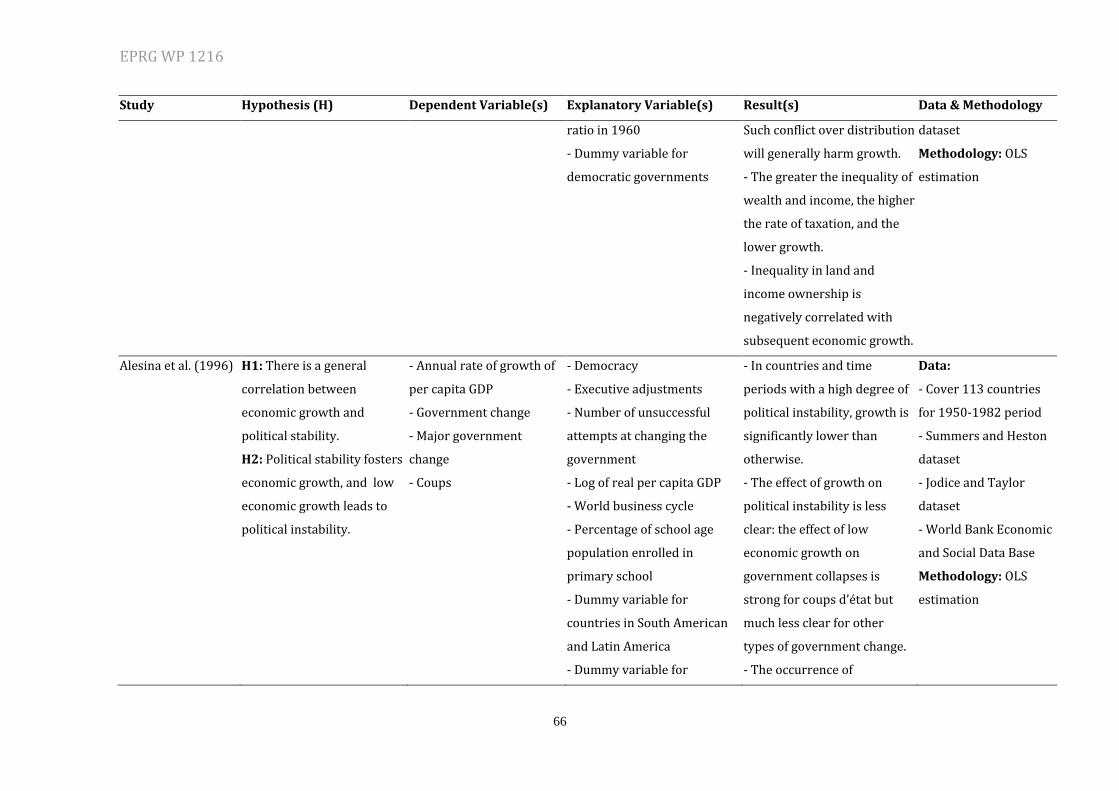
EPRG WP 1216
66
Study Hypothesis (H) Dependent Variable(s) Explanatory Variable(s) Result(s) Data & Methodology
ratio in 1960
- Dummy variable for
democratic governments
Such conflict over distribution
will generally harm growth.
- The greater the inequality of
wealth and income, the higher
the rate of taxation, and the
lower growth.
- Inequality in land and
income ownership is
negatively correlated with
subsequent economic growth.
dataset
Methodology: OLS
estimation
Alesina et al. (1996) H1: There is a general
correlation between
economic growth and
political stability.
H2: Political stability fosters
economic growth, and low
economic growth leads to
political instability.
- Annual rate of growth of
per capita GDP
- Government change
- Major government
change
- Coups
- Democracy
- Executive adjustments
- Number of unsuccessful
attempts at changing the
government
- Log of real per capita GDP
- World business cycle
- Percentage of school age
population enrolled in
primary school
- Dummy variable for
countries in South American
and Latin America
- Dummy variable for
- In countries and time
periods with a high degree of
political instability, growth is
significantly lower than
otherwise.
- The effect of growth on
political instability is less
clear: the effect of low
economic growth on
government collapses is
strong for coups d’état but
much less clear for other
types of government change.
- The occurrence of
Data:
- Cover 113 countries
for 1950-1982 period
- Summers and Heston
dataset
- Jodice and Taylor
dataset
- World Bank Economic
and Social Data Base
Methodology: OLS
estimation
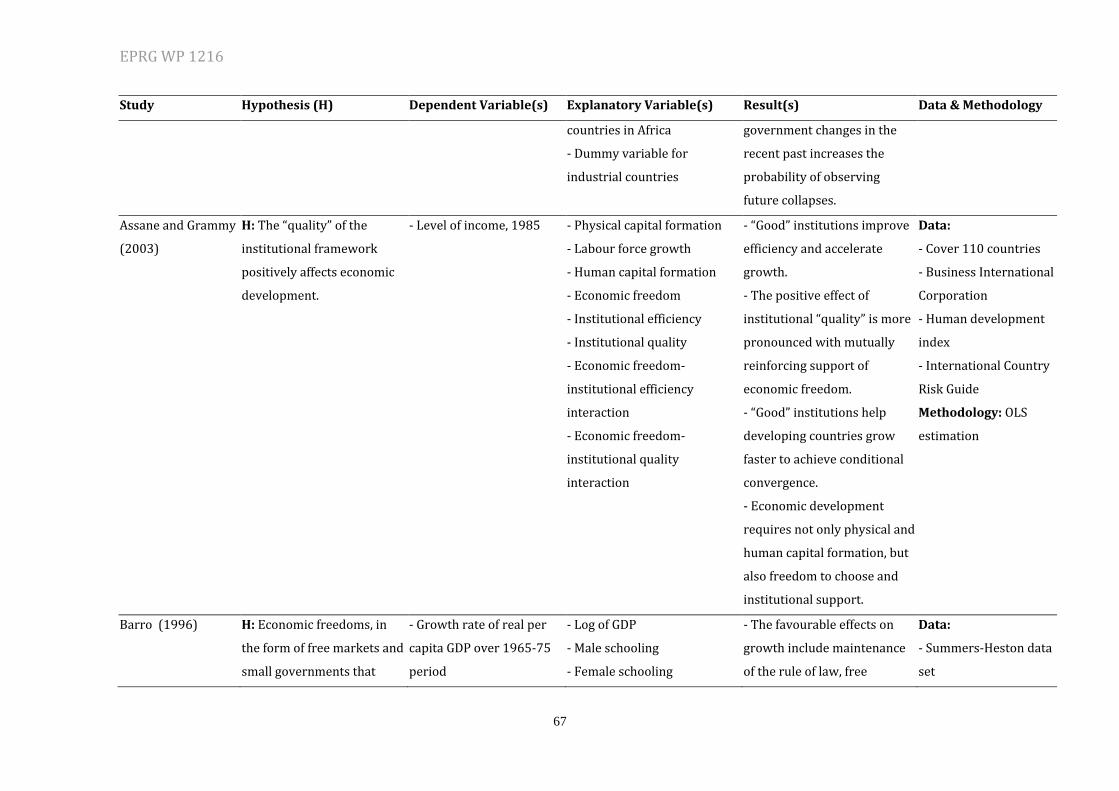
EPRG WP 1216
67
Study Hypothesis (H) Dependent Variable(s) Explanatory Variable(s) Result(s) Data & Methodology
countries in Africa
- Dummy variable for
industrial countries
government changes in the
recent past increases the
probability of observing
future collapses.
Assane and Grammy
(2003)
H: The “quality” of the
institutional framework
positively affects economic
development.
- Level of income, 1985 - Physical capital formation
- Labour force growth
- Human capital formation
- Economic freedom
- Institutional efficiency
- Institutional quality
- Economic freedom-
institutional efficiency
interaction
- Economic freedom-
institutional quality
interaction
- “Good” institutions improve
efficiency and accelerate
growth.
- The positive effect of
institutional “quality” is more
pronounced with mutually
reinforcing support of
economic freedom.
- “Good” institutions help
developing countries grow
faster to achieve conditional
convergence.
- Economic development
requires not only physical and
human capital formation, but
also freedom to choose and
institutional support.
Data:
- Cover 110 countries
- Business International
Corporation
- Human development
index
- International Country
Risk Guide
Methodology: OLS
estimation
Barro (1996)
H: Economic freedoms, in
the form of free markets and
small governments that
- Growth rate of real per
capita GDP over 1965-75
period
- Log of GDP
- Male schooling
- Female schooling
- The favourable effects on
growth include maintenance
of the rule of law, free
Data:
- Summers-Heston data
set
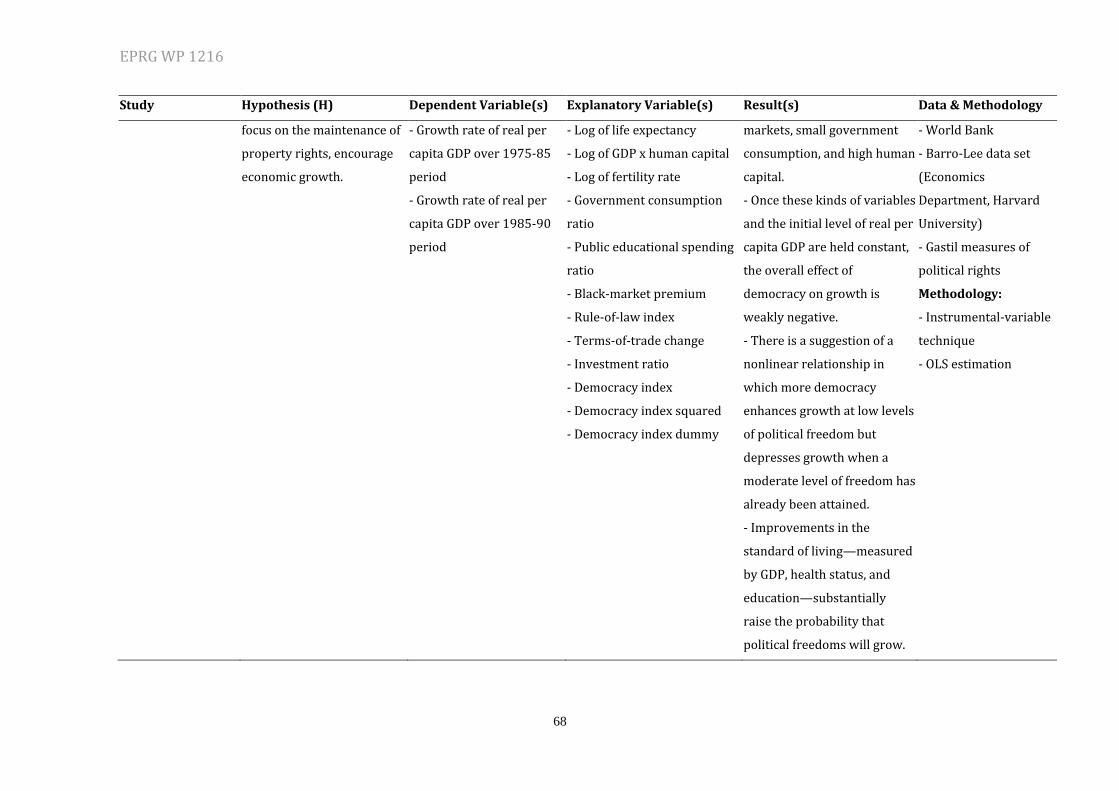
EPRG WP 1216
68
Study Hypothesis (H) Dependent Variable(s) Explanatory Variable(s) Result(s) Data & Methodology
focus on the maintenance of
property rights, encourage
economic growth.
- Growth rate of real per
capita GDP over 1975-85
period
- Growth rate of real per
capita GDP over 1985-90
period
- Log of life expectancy
- Log of GDP x human capital
- Log of fertility rate
- Government consumption
ratio
- Public educational spending
ratio
- Black-market premium
- Rule-of-law index
- Terms-of-trade change
- Investment ratio
- Democracy index
- Democracy index squared
- Democracy index dummy
markets, small government
consumption, and high human
capital.
- Once these kinds of variables
and the initial level of real per
capita GDP are held constant,
the overall effect of
democracy on growth is
weakly negative.
- There is a suggestion of a
nonlinear relationship in
which more democracy
enhances growth at low levels
of political freedom but
depresses growth when a
moderate level of freedom has
already been attained.
- Improvements in the
standard of living—measured
by GDP, health status, and
education—substantially
raise the probability that
political freedoms will grow.
- World Bank
- Barro-Lee data set
(Economics
Department, Harvard
University)
- Gastil measures of
political rights
Methodology:
- Instrumental-variable
technique
- OLS estimation
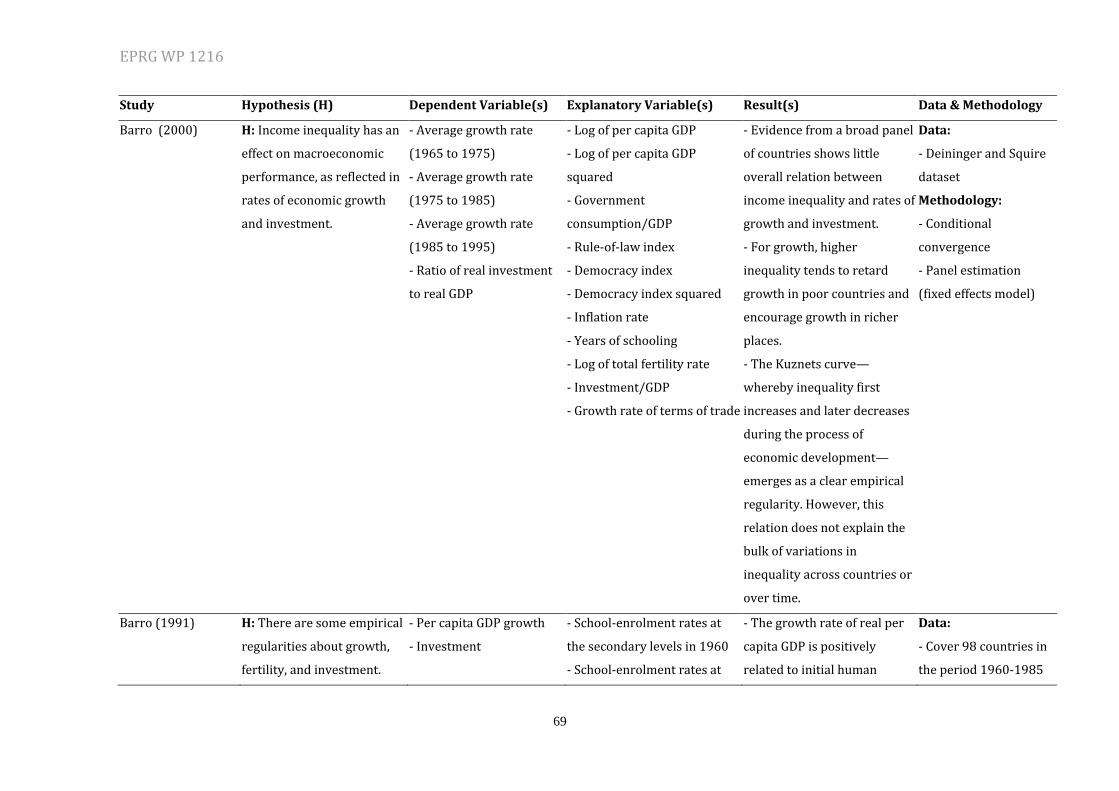
EPRG WP 1216
69
Study Hypothesis (H) Dependent Variable(s) Explanatory Variable(s) Result(s) Data & Methodology
Barro (2000) H: Income inequality has an
effect on macroeconomic
performance, as reflected in
rates of economic growth
and investment.
- Average growth rate
(1965 to 1975)
- Average growth rate
(1975 to 1985)
- Average growth rate
(1985 to 1995)
- Ratio of real investment
to real GDP
- Log of per capita GDP
- Log of per capita GDP
squared
- Government
consumption/GDP
- Rule-of-law index
- Democracy index
- Democracy index squared
- Inflation rate
- Years of schooling
- Log of total fertility rate
- Investment/GDP
- Growth rate of terms of trade
- Evidence from a broad panel
of countries shows little
overall relation between
income inequality and rates of
growth and investment.
- For growth, higher
inequality tends to retard
growth in poor countries and
encourage growth in richer
places.
- The Kuznets curve—
whereby inequality first
increases and later decreases
during the process of
economic development—
emerges as a clear empirical
regularity. However, this
relation does not explain the
bulk of variations in
inequality across countries or
over time.
Data:
- Deininger and Squire
dataset
Methodology:
- Conditional
convergence
- Panel estimation
(fixed effects model)
Barro (1991) H: There are some empirical
regularities about growth,
fertility, and investment.
- Per capita GDP growth
- Investment
- School-enrolment rates at
the secondary levels in 1960
- School-enrolment rates at
- The growth rate of real per
capita GDP is positively
related to initial human
Data:
- Cover 98 countries in
the period 1960-1985
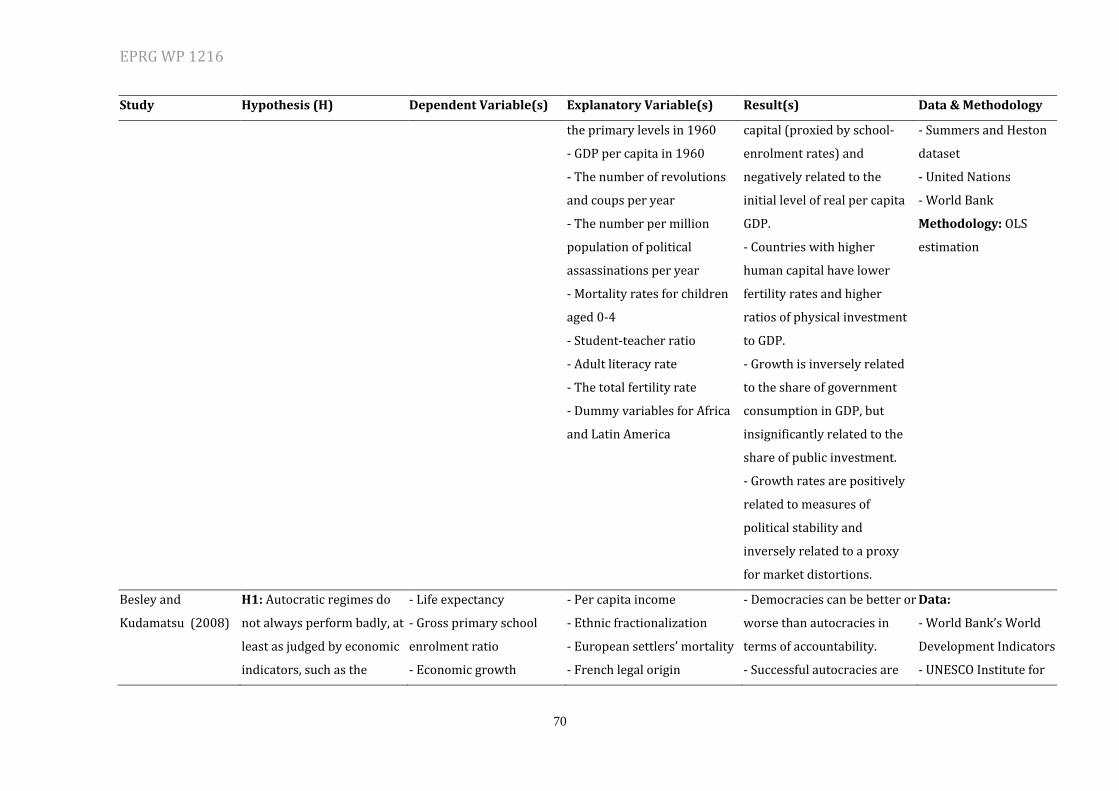
EPRG WP 1216
70
Study Hypothesis (H) Dependent Variable(s) Explanatory Variable(s) Result(s) Data & Methodology
the primary levels in 1960
- GDP per capita in 1960
- The number of revolutions
and coups per year
- The number per million
population of political
assassinations per year
- Mortality rates for children
aged 0-4
- Student-teacher ratio
- Adult literacy rate
- The total fertility rate
- Dummy variables for Africa
and Latin America
capital (proxied by school-
enrolment rates) and
negatively related to the
initial level of real per capita
GDP.
- Countries with higher
human capital have lower
fertility rates and higher
ratios of physical investment
to GDP.
- Growth is inversely related
to the share of government
consumption in GDP, but
insignificantly related to the
share of public investment.
- Growth rates are positively
related to measures of
political stability and
inversely related to a proxy
for market distortions.
- Summers and Heston
dataset
- United Nations
- World Bank
Methodology: OLS
estimation
Besley and
Kudamatsu (2008)
H1: Autocratic regimes do
not always perform badly, at
least as judged by economic
indicators, such as the
- Life expectancy
- Gross primary school
enrolment ratio
- Economic growth
- Per capita income
- Ethnic fractionalization
- European settlers’ mortality
- French legal origin
- Democracies can be better or
worse than autocracies in
terms of accountability.
- Successful autocracies are
Data:
- World Bank’s World
Development Indicators
- UNESCO Institute for
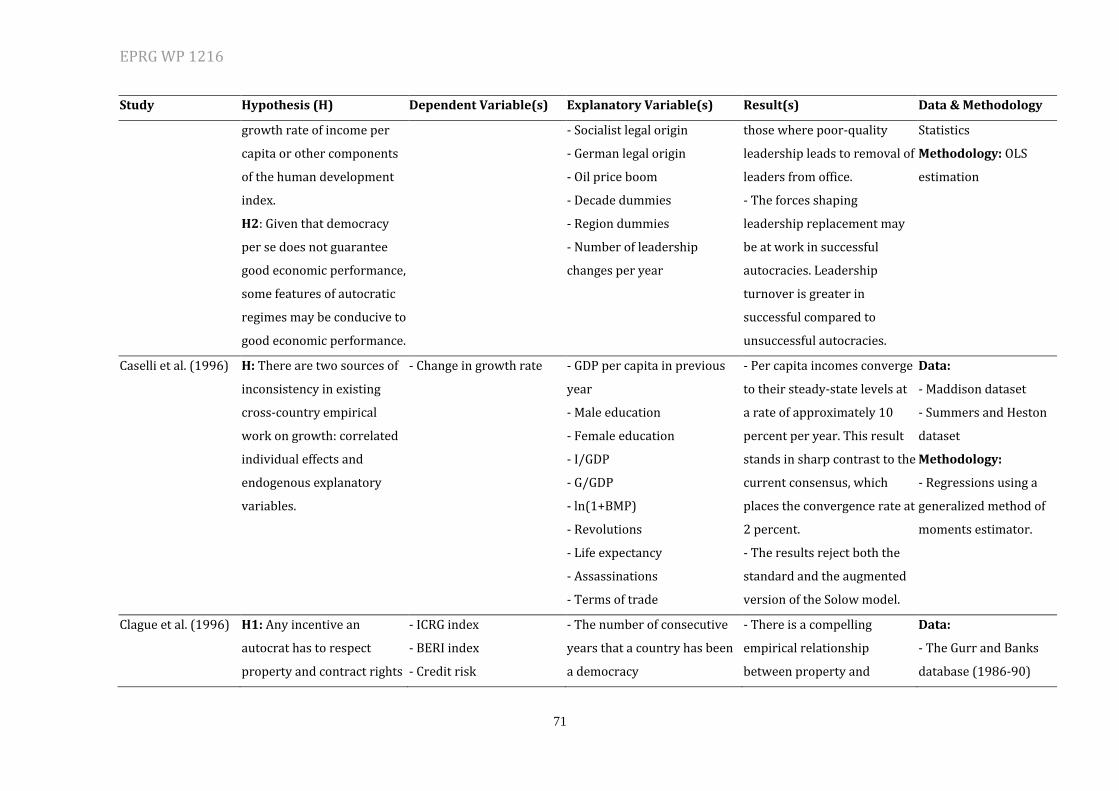
EPRG WP 1216
71
Study Hypothesis (H) Dependent Variable(s) Explanatory Variable(s) Result(s) Data & Methodology
growth rate of income per
capita or other components
of the human development
index.
H2: Given that democracy
per se does not guarantee
good economic performance,
some features of autocratic
regimes may be conducive to
good economic performance.
- Socialist legal origin
- German legal origin
- Oil price boom
- Decade dummies
- Region dummies
- Number of leadership
changes per year
those where poor-quality
leadership leads to removal of
leaders from office.
- The forces shaping
leadership replacement may
be at work in successful
autocracies. Leadership
turnover is greater in
successful compared to
unsuccessful autocracies.
Statistics
Methodology: OLS
estimation
Caselli et al. (1996) H: There are two sources of
inconsistency in existing
cross-country empirical
work on growth: correlated
individual effects and
endogenous explanatory
variables.
- Change in growth rate - GDP per capita in previous
year
- Male education
- Female education
- I/GDP
- G/GDP
- ln(1+BMP)
- Revolutions
- Life expectancy
- Assassinations
- Terms of trade
- Per capita incomes converge
to their steady-state levels at
a rate of approximately 10
percent per year. This result
stands in sharp contrast to the
current consensus, which
places the convergence rate at
2 percent.
- The results reject both the
standard and the augmented
version of the Solow model.
Data:
- Maddison dataset
- Summers and Heston
dataset
Methodology:
- Regressions using a
generalized method of
moments estimator.
Clague et al. (1996)
H1: Any incentive an
autocrat has to respect
property and contract rights
- ICRG index
- BERI index
- Credit risk
- The number of consecutive
years that a country has been
a democracy
- There is a compelling
empirical relationship
between property and
Data:
- The Gurr and Banks
database (1986-90)
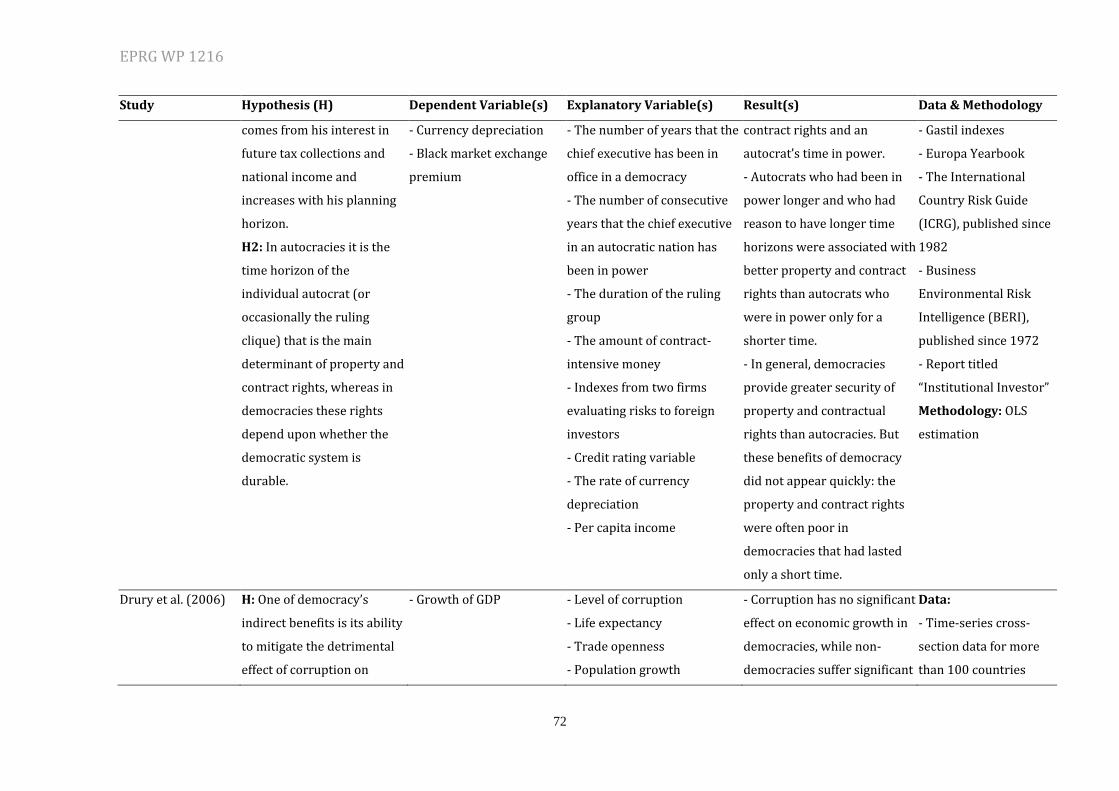
EPRG WP 1216
72
Study Hypothesis (H) Dependent Variable(s) Explanatory Variable(s) Result(s) Data & Methodology
comes from his interest in
future tax collections and
national income and
increases with his planning
horizon.
H2: In autocracies it is the
time horizon of the
individual autocrat (or
occasionally the ruling
clique) that is the main
determinant of property and
contract rights, whereas in
democracies these rights
depend upon whether the
democratic system is
durable.
- Currency depreciation
- Black market exchange
premium
- The number of years that the
chief executive has been in
office in a democracy
- The number of consecutive
years that the chief executive
in an autocratic nation has
been in power
- The duration of the ruling
group
- The amount of contract-
intensive money
- Indexes from two firms
evaluating risks to foreign
investors
- Credit rating variable
- The rate of currency
depreciation
- Per capita income
contract rights and an
autocrat’s time in power.
- Autocrats who had been in
power longer and who had
reason to have longer time
horizons were associated with
better property and contract
rights than autocrats who
were in power only for a
shorter time.
- In general, democracies
provide greater security of
property and contractual
rights than autocracies. But
these benefits of democracy
did not appear quickly: the
property and contract rights
were often poor in
democracies that had lasted
only a short time.
- Gastil indexes
- Europa Yearbook
- The International
Country Risk Guide
(ICRG), published since
1982
- Business
Environmental Risk
Intelligence (BERI),
published since 1972
- Report titled
“Institutional Investor”
Methodology: OLS
estimation
Drury et al. (2006) H: One of democracy’s
indirect benefits is its ability
to mitigate the detrimental
effect of corruption on
- Growth of GDP - Level of corruption
- Life expectancy
- Trade openness
- Population growth
- Corruption has no significant
effect on economic growth in
democracies, while non-
democracies suffer significant
Data:
- Time-series cross-
section data for more
than 100 countries
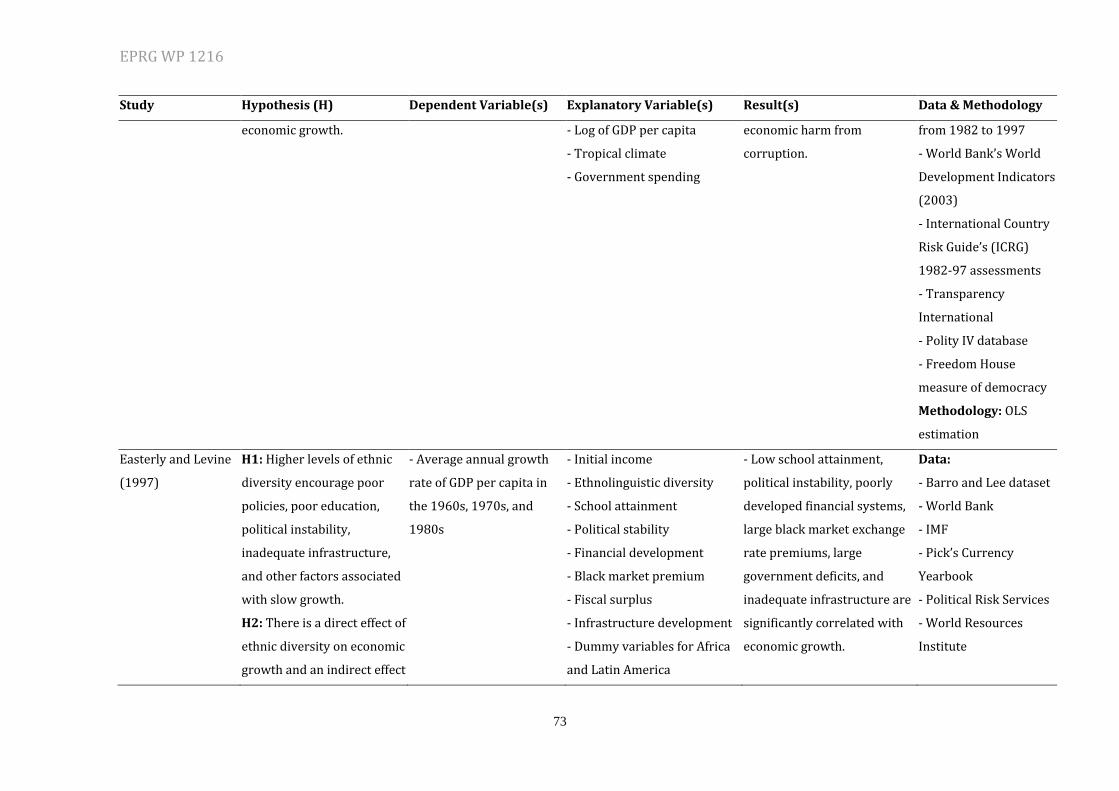
EPRG WP 1216
73
Study Hypothesis (H) Dependent Variable(s) Explanatory Variable(s) Result(s) Data & Methodology
economic growth. - Log of GDP per capita
- Tropical climate
- Government spending
economic harm from
corruption.
from 1982 to 1997
- World Bank’s World
Development Indicators
(2003)
- International Country
Risk Guide’s (ICRG)
1982-97 assessments
- Transparency
International
- Polity IV database
- Freedom House
measure of democracy
Methodology: OLS
estimation
Easterly and Levine
(1997)
H1: Higher levels of ethnic
diversity encourage poor
policies, poor education,
political instability,
inadequate infrastructure,
and other factors associated
with slow growth.
H2: There is a direct effect of
ethnic diversity on economic
growth and an indirect effect
- Average annual growth
rate of GDP per capita in
the 1960s, 1970s, and
1980s
- Initial income
- Ethnolinguistic diversity
- School attainment
- Political stability
- Financial development
- Black market premium
- Fiscal surplus
- Infrastructure development
- Dummy variables for Africa
and Latin America
- Low school attainment,
political instability, poorly
developed financial systems,
large black market exchange
rate premiums, large
government deficits, and
inadequate infrastructure are
significantly correlated with
economic growth.
Data:
- Barro and Lee dataset
- World Bank
- IMF
- Pick’s Currency
Yearbook
- Political Risk Services
- World Resources
Institute
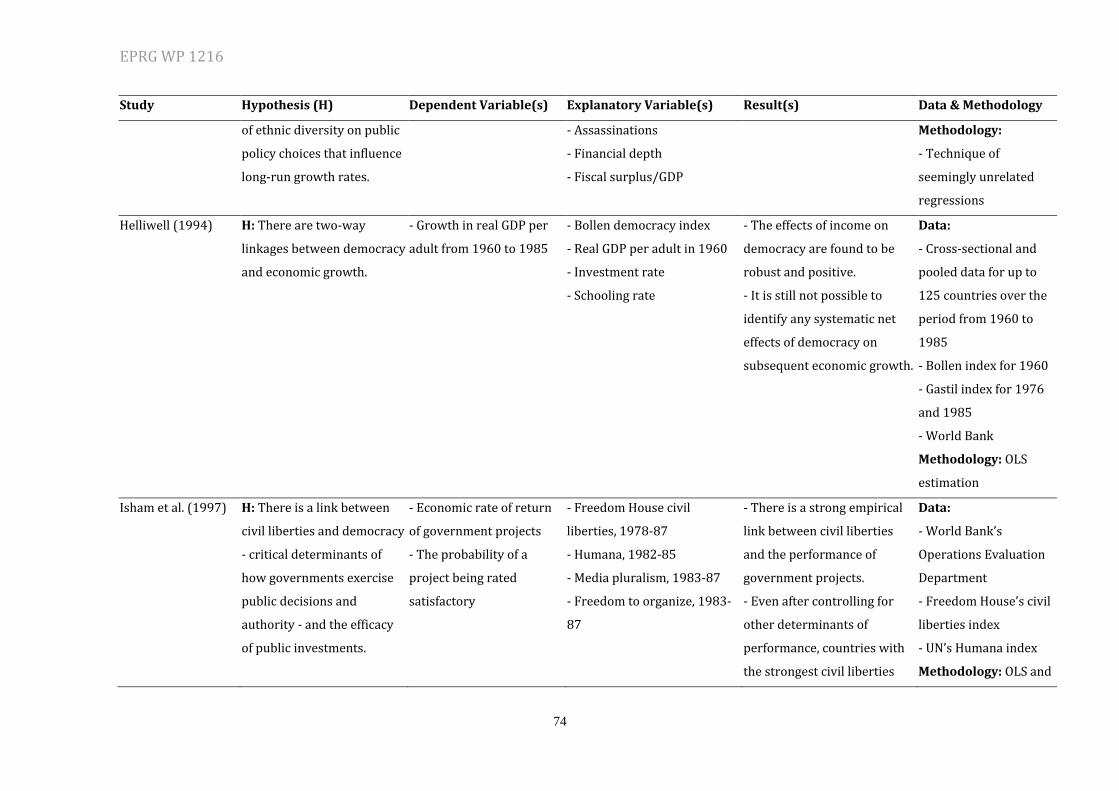
EPRG WP 1216
74
Study Hypothesis (H) Dependent Variable(s) Explanatory Variable(s) Result(s) Data & Methodology
of ethnic diversity on public
policy choices that influence
long-run growth rates.
- Assassinations
- Financial depth
- Fiscal surplus/GDP
Methodology:
- Technique of
seemingly unrelated
regressions
Helliwell (1994) H: There are two-way
linkages between democracy
and economic growth.
- Growth in real GDP per
adult from 1960 to 1985
- Bollen democracy index
- Real GDP per adult in 1960
- Investment rate
- Schooling rate
- The effects of income on
democracy are found to be
robust and positive.
- It is still not possible to
identify any systematic net
effects of democracy on
subsequent economic growth.
Data:
- Cross-sectional and
pooled data for up to
125 countries over the
period from 1960 to
1985
- Bollen index for 1960
- Gastil index for 1976
and 1985
- World Bank
Methodology: OLS
estimation
Isham et al. (1997) H: There is a link between
civil liberties and democracy
- critical determinants of
how governments exercise
public decisions and
authority - and the efficacy
of public investments.
- Economic rate of return
of government projects
- The probability of a
project being rated
satisfactory
- Freedom House civil
liberties, 1978-87
- Humana, 1982-85
- Media pluralism, 1983-87
- Freedom to organize, 1983-
87
- There is a strong empirical
link between civil liberties
and the performance of
government projects.
- Even after controlling for
other determinants of
performance, countries with
the strongest civil liberties
Data:
- World Bank’s
Operations Evaluation
Department
- Freedom House’s civil
liberties index
- UN’s Humana index
Methodology: OLS and
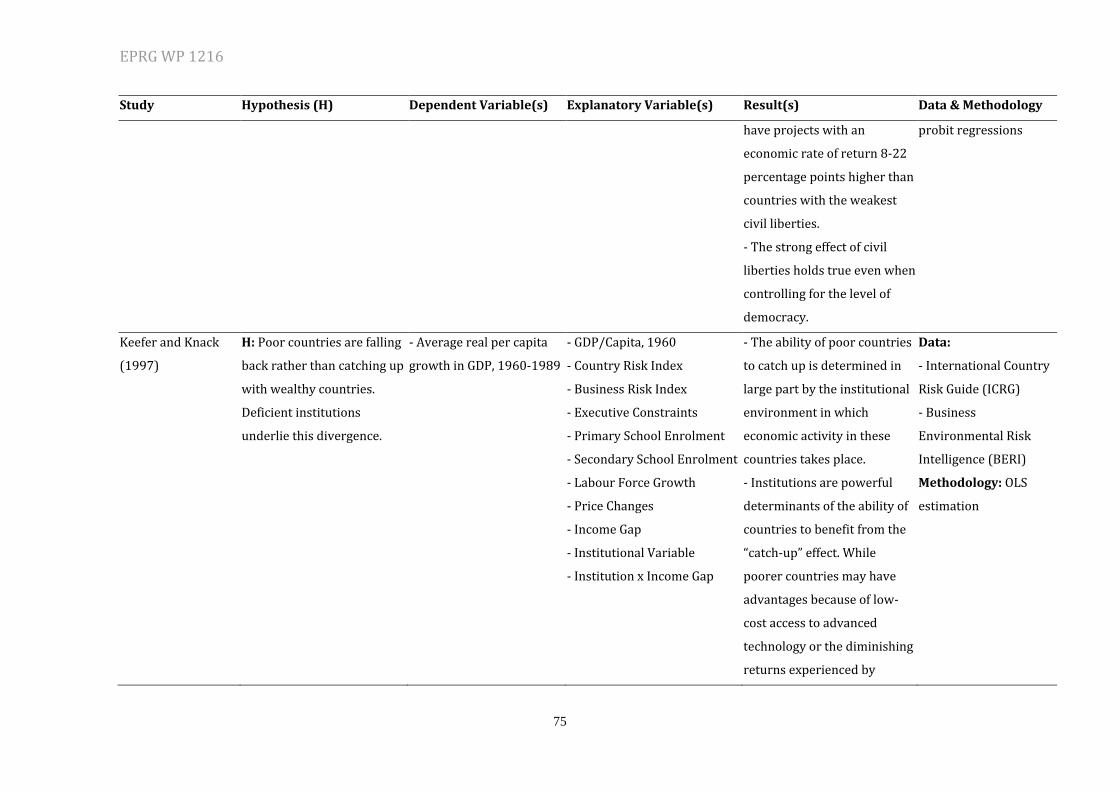
EPRG WP 1216
75
Study Hypothesis (H) Dependent Variable(s) Explanatory Variable(s) Result(s) Data & Methodology
have projects with an
economic rate of return 8-22
percentage points higher than
countries with the weakest
civil liberties.
- The strong effect of civil
liberties holds true even when
controlling for the level of
democracy.
probit regressions
Keefer and Knack
(1997)
H: Poor countries are falling
back rather than catching up
with wealthy countries.
Deficient institutions
underlie this divergence.
- Average real per capita
growth in GDP, 1960-1989
- GDP/Capita, 1960
- Country Risk Index
- Business Risk Index
- Executive Constraints
- Primary School Enrolment
- Secondary School Enrolment
- Labour Force Growth
- Price Changes
- Income Gap
- Institutional Variable
- Institution x Income Gap
- The ability of poor countries
to catch up is determined in
large part by the institutional
environment in which
economic activity in these
countries takes place.
- Institutions are powerful
determinants of the ability of
countries to benefit from the
“catch-up” effect. While
poorer countries may have
advantages because of low-
cost access to advanced
technology or the diminishing
returns experienced by
Data:
- International Country
Risk Guide (ICRG)
- Business
Environmental Risk
Intelligence (BERI)
Methodology: OLS
estimation
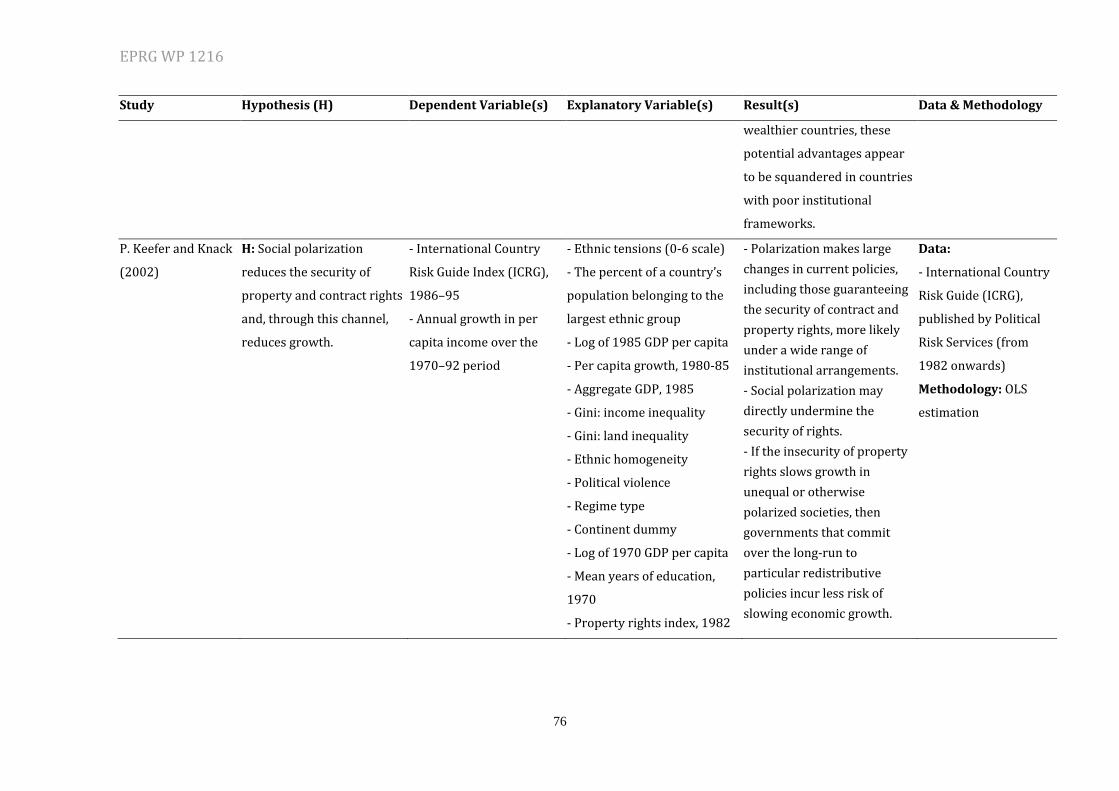
EPRG WP 1216
76
Study Hypothesis (H) Dependent Variable(s) Explanatory Variable(s) Result(s) Data & Methodology
wealthier countries, these
potential advantages appear
to be squandered in countries
with poor institutional
frameworks.
P. Keefer and Knack
(2002)
H: Social polarization
reduces the security of
property and contract rights
and, through this channel,
reduces growth.
- International Country
Risk Guide Index (ICRG),
1986–95
- Annual growth in per
capita income over the
1970–92 period
- Ethnic tensions (0-6 scale)
- The percent of a country’s
population belonging to the
largest ethnic group
- Log of 1985 GDP per capita
- Per capita growth, 1980-85
- Aggregate GDP, 1985
- Gini: income inequality
- Gini: land inequality
- Ethnic homogeneity
- Political violence
- Regime type
- Continent dummy
- Log of 1970 GDP per capita
- Mean years of education,
1970
- Property rights index, 1982
- Polarization makes large
changes in current policies,
including those guaranteeing
the security of contract and
property rights, more likely
under a wide range of
institutional arrangements.
- Social polarization may
directly undermine the
security of rights.
- If the insecurity of property
rights slows growth in
unequal or otherwise
polarized societies, then
governments that commit
over the long-run to
particular redistributive
policies incur less risk of
slowing economic growth.
Data:
- International Country
Risk Guide (ICRG),
published by Political
Risk Services (from
1982 onwards)
Methodology: OLS
estimation
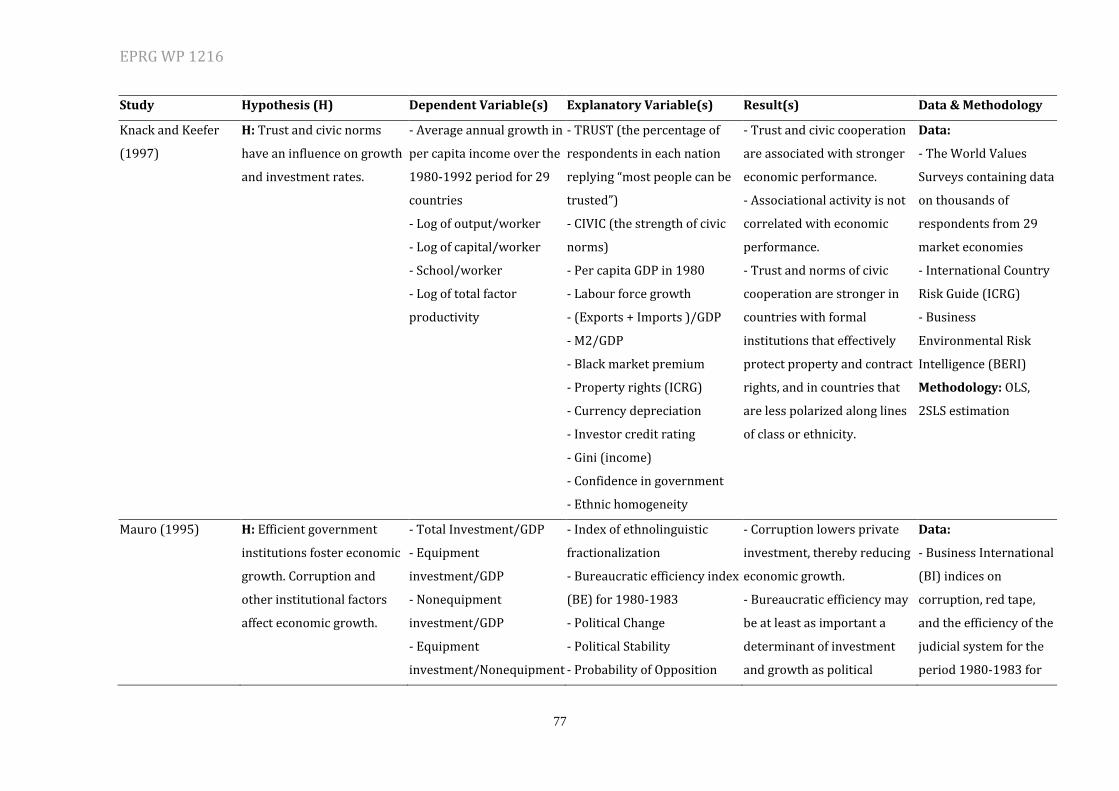
EPRG WP 1216
77
Study Hypothesis (H) Dependent Variable(s) Explanatory Variable(s) Result(s) Data & Methodology
Knack and Keefer
(1997)
H: Trust and civic norms
have an influence on growth
and investment rates.
- Average annual growth in
per capita income over the
1980-1992 period for 29
countries
- Log of output/worker
- Log of capital/worker
- School/worker
- Log of total factor
productivity
- TRUST (the percentage of
respondents in each nation
replying “most people can be
trusted”)
- CIVIC (the strength of civic
norms)
- Per capita GDP in 1980
- Labour force growth
- (Exports + Imports )/GDP
- M2/GDP
- Black market premium
- Property rights (ICRG)
- Currency depreciation
- Investor credit rating
- Gini (income)
- Confidence in government
- Ethnic homogeneity
- Trust and civic cooperation
are associated with stronger
economic performance.
- Associational activity is not
correlated with economic
performance.
- Trust and norms of civic
cooperation are stronger in
countries with formal
institutions that effectively
protect property and contract
rights, and in countries that
are less polarized along lines
of class or ethnicity.
Data:
- The World Values
Surveys containing data
on thousands of
respondents from 29
market economies
- International Country
Risk Guide (ICRG)
- Business
Environmental Risk
Intelligence (BERI)
Methodology: OLS,
2SLS estimation
Mauro (1995) H: Efficient government
institutions foster economic
growth. Corruption and
other institutional factors
affect economic growth.
- Total Investment/GDP
- Equipment
investment/GDP
- Nonequipment
investment/GDP
- Equipment
investment/Nonequipment
- Index of ethnolinguistic
fractionalization
- Bureaucratic efficiency index
(BE) for 1980-1983
- Political Change
- Political Stability
- Probability of Opposition
- Corruption lowers private
investment, thereby reducing
economic growth.
- Bureaucratic efficiency may
be at least as important a
determinant of investment
and growth as political
Data:
- Business International
(BI) indices on
corruption, red tape,
and the efficiency of the
judicial system for the
period 1980-1983 for
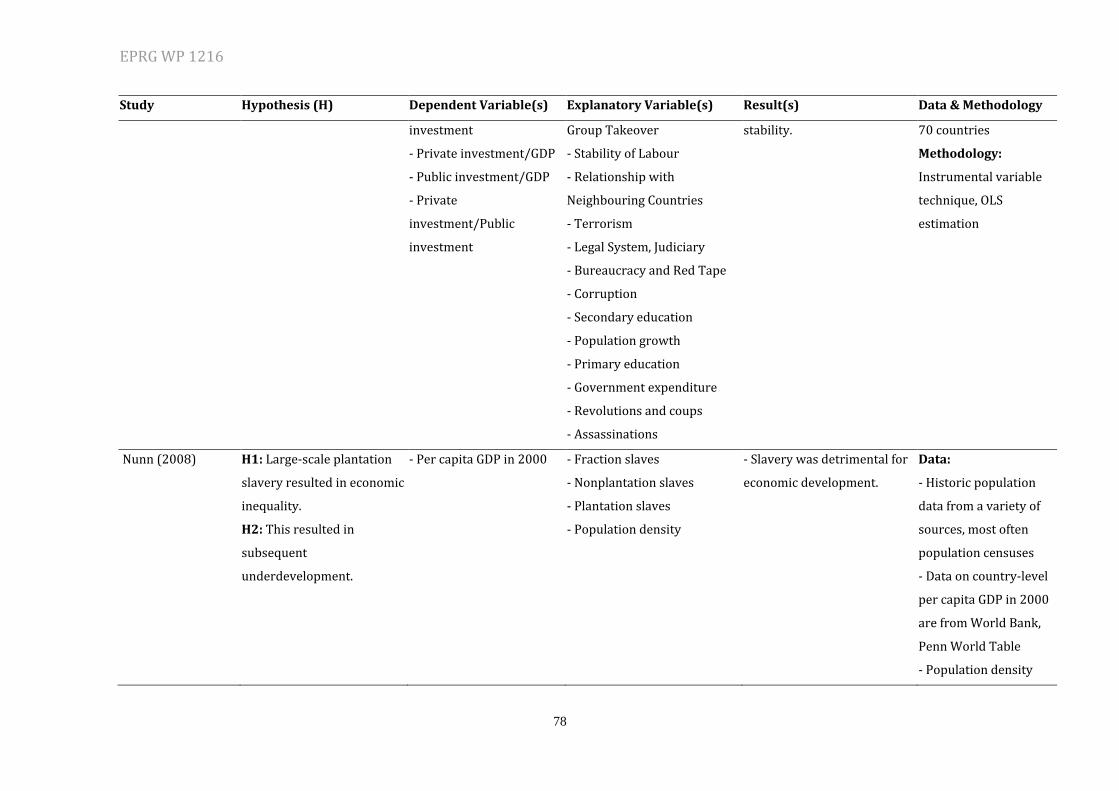
EPRG WP 1216
78
Study Hypothesis (H) Dependent Variable(s) Explanatory Variable(s) Result(s) Data & Methodology
investment
- Private investment/GDP
- Public investment/GDP
- Private
investment/Public
investment
Group Takeover
- Stability of Labour
- Relationship with
Neighbouring Countries
- Terrorism
- Legal System, Judiciary
- Bureaucracy and Red Tape
- Corruption
- Secondary education
- Population growth
- Primary education
- Government expenditure
- Revolutions and coups
- Assassinations
stability. 70 countries
Methodology:
Instrumental variable
technique, OLS
estimation
Nunn (2008) H1: Large-scale plantation
slavery resulted in economic
inequality.
H2: This resulted in
subsequent
underdevelopment.
- Per capita GDP in 2000 - Fraction slaves
- Nonplantation slaves
- Plantation slaves
- Population density
- Slavery was detrimental for
economic development.
Data:
- Historic population
data from a variety of
sources, most often
population censuses
- Data on country-level
per capita GDP in 2000
are from World Bank,
Penn World Table
- Population density
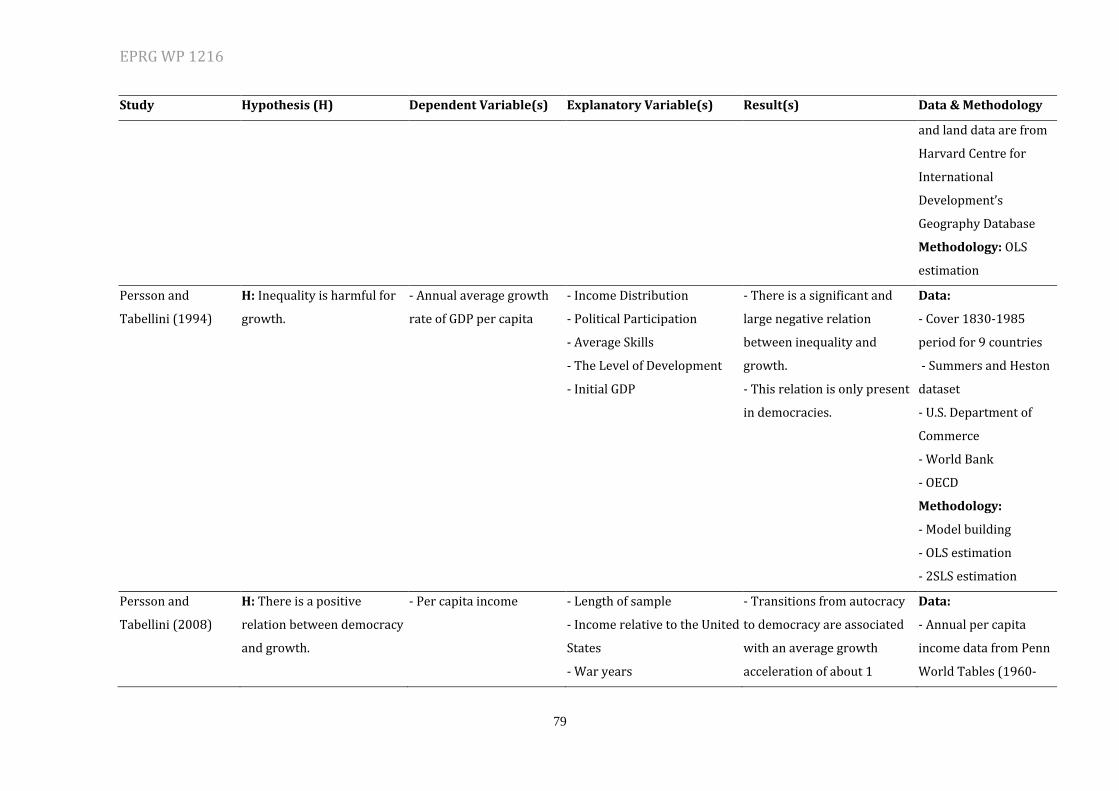
EPRG WP 1216
79
Study Hypothesis (H) Dependent Variable(s) Explanatory Variable(s) Result(s) Data & Methodology
and land data are from
Harvard Centre for
International
Development’s
Geography Database
Methodology: OLS
estimation
Persson and
Tabellini (1994)
H: Inequality is harmful for
growth.
- Annual average growth
rate of GDP per capita
- Income Distribution
- Political Participation
- Average Skills
- The Level of Development
- Initial GDP
- There is a significant and
large negative relation
between inequality and
growth.
- This relation is only present
in democracies.
Data:
- Cover 1830-1985
period for 9 countries
- Summers and Heston
dataset
- U.S. Department of
Commerce
- World Bank
- OECD
Methodology:
- Model building
- OLS estimation
- 2SLS estimation
Persson and
Tabellini (2008)
H: There is a positive
relation between democracy
and growth.
- Per capita income - Length of sample
- Income relative to the United
States
- War years
- Transitions from autocracy
to democracy are associated
with an average growth
acceleration of about 1
Data:
- Annual per capita
income data from Penn
World Tables (1960-
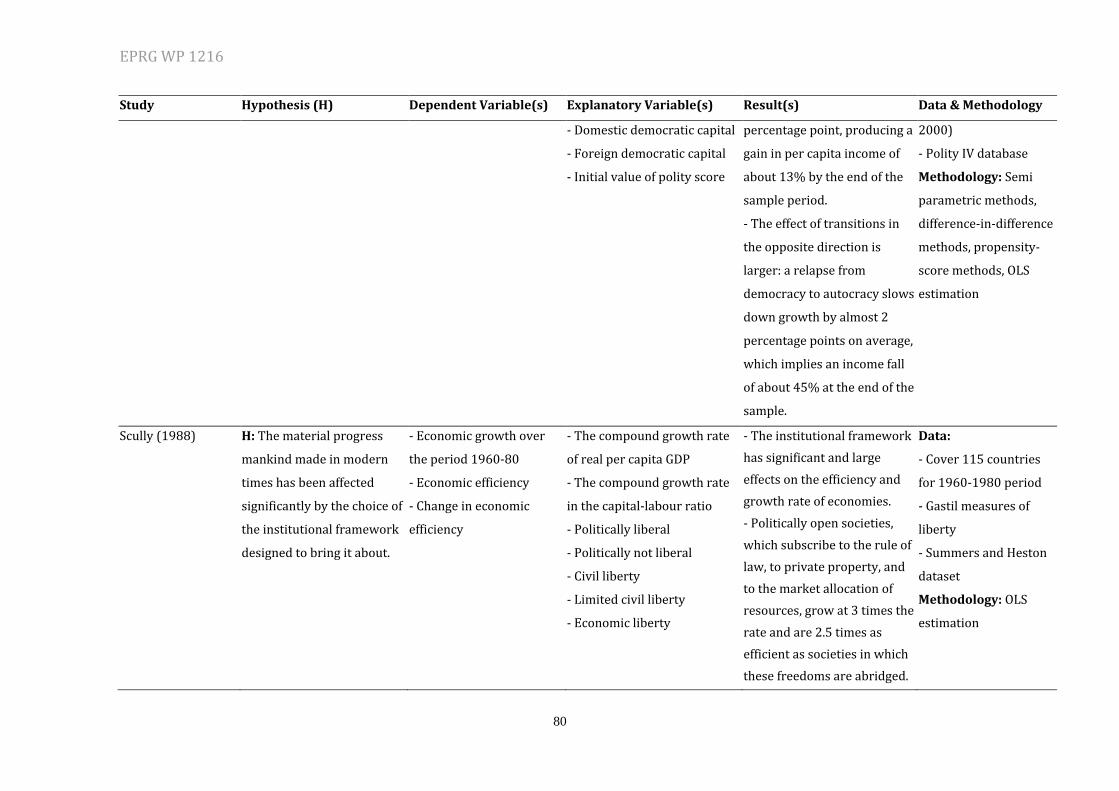
EPRG WP 1216
80
Study Hypothesis (H) Dependent Variable(s) Explanatory Variable(s) Result(s) Data & Methodology
- Domestic democratic capital
- Foreign democratic capital
- Initial value of polity score
percentage point, producing a
gain in per capita income of
about 13% by the end of the
sample period.
- The effect of transitions in
the opposite direction is
larger: a relapse from
democracy to autocracy slows
down growth by almost 2
percentage points on average,
which implies an income fall
of about 45% at the end of the
sample.
2000)
- Polity IV database
Methodology: Semi
parametric methods,
difference-in-difference
methods, propensity-
score methods, OLS
estimation
Scully (1988) H: The material progress
mankind made in modern
times has been affected
significantly by the choice of
the institutional framework
designed to bring it about.
- Economic growth over
the period 1960-80
- Economic efficiency
- Change in economic
efficiency
- The compound growth rate
of real per capita GDP
- The compound growth rate
in the capital-labour ratio
- Politically liberal
- Politically not liberal
- Civil liberty
- Limited civil liberty
- Economic liberty
- The institutional framework
has significant and large
effects on the efficiency and
growth rate of economies.
- Politically open societies,
which subscribe to the rule of
law, to private property, and
to the market allocation of
resources, grow at 3 times the
rate and are 2.5 times as
efficient as societies in which
these freedoms are abridged.
Data:
- Cover 115 countries
for 1960-1980 period
- Gastil measures of
liberty
- Summers and Heston
dataset
Methodology: OLS
estimation
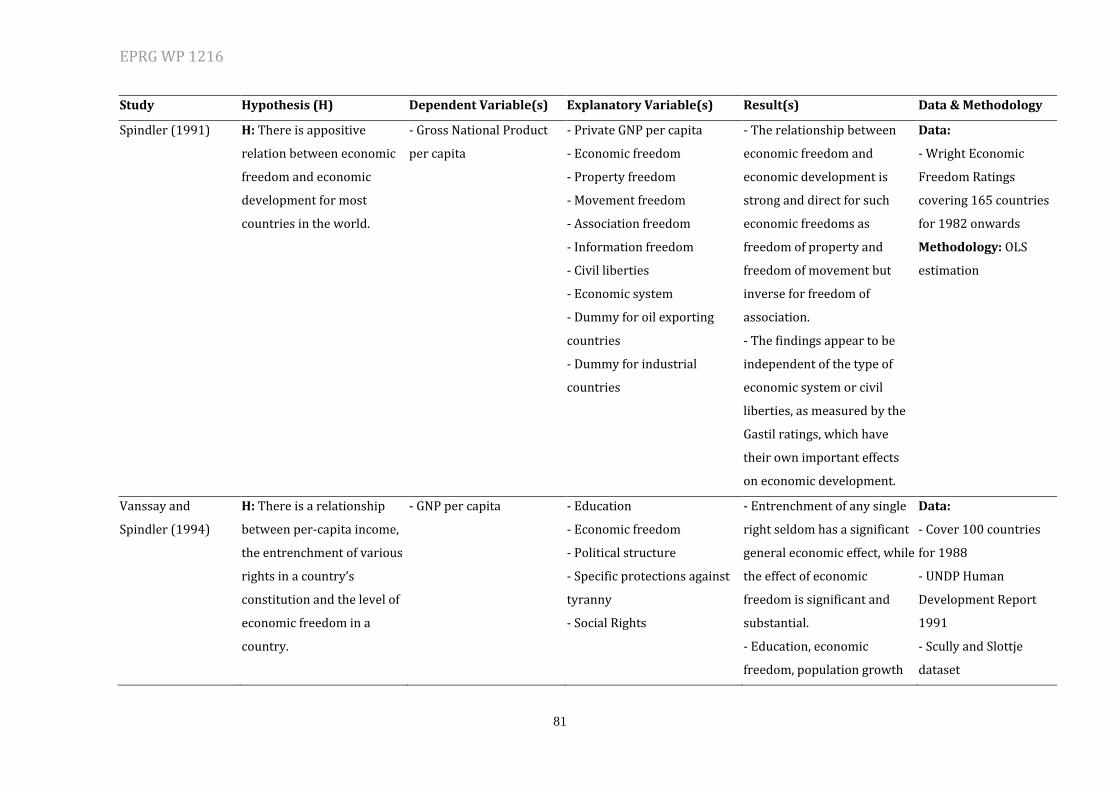
EPRG WP 1216
81
Study Hypothesis (H) Dependent Variable(s) Explanatory Variable(s) Result(s) Data & Methodology
Spindler (1991) H: There is appositive
relation between economic
freedom and economic
development for most
countries in the world.
- Gross National Product
per capita
- Private GNP per capita
- Economic freedom
- Property freedom
- Movement freedom
- Association freedom
- Information freedom
- Civil liberties
- Economic system
- Dummy for oil exporting
countries
- Dummy for industrial
countries
- The relationship between
economic freedom and
economic development is
strong and direct for such
economic freedoms as
freedom of property and
freedom of movement but
inverse for freedom of
association.
- The findings appear to be
independent of the type of
economic system or civil
liberties, as measured by the
Gastil ratings, which have
their own important effects
on economic development.
Data:
- Wright Economic
Freedom Ratings
covering 165 countries
for 1982 onwards
Methodology: OLS
estimation
Vanssay and
Spindler (1994)
H: There is a relationship
between per-capita income,
the entrenchment of various
rights in a country’s
constitution and the level of
economic freedom in a
country.
- GNP per capita - Education
- Economic freedom
- Political structure
- Specific protections against
tyranny
- Social Rights
- Entrenchment of any single
right seldom has a significant
general economic effect, while
the effect of economic
freedom is significant and
substantial.
- Education, economic
freedom, population growth
Data:
- Cover 100 countries
for 1988
- UNDP Human
Development Report
1991
- Scully and Slottje
dataset
EPRG WP 1216
82
Study Hypothesis (H) Dependent Variable(s) Explanatory Variable(s) Result(s) Data & Methodology
and the saving ratio together
explain more than 75% of the
cross-country variation in per
capita income.
- The entrenched elements of
“Political structure”,
“Protections from tyranny”, or
“Social Charter” are not
revealed as important
explanatory variables.
- Taubenfel dataset
Methodology: OLS
estimation
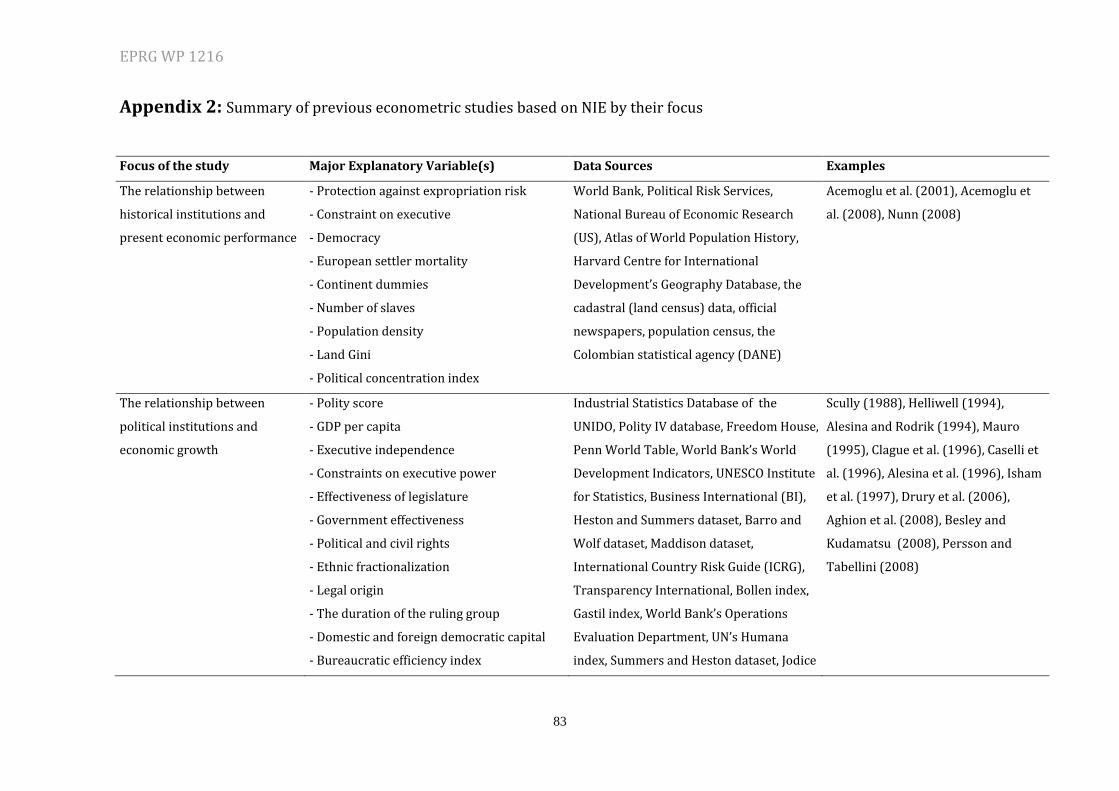
EPRG WP 1216
83
Appendix 2: Summary of previous econometric studies based on NIE by their focus
Focus of the study Major Explanatory Variable(s) Data Sources Examples
The relationship between
historical institutions and
present economic performance
- Protection against expropriation risk
- Constraint on executive
- Democracy
- European settler mortality
- Continent dummies
- Number of slaves
- Population density
- Land Gini
- Political concentration index
World Bank, Political Risk Services,
National Bureau of Economic Research
(US), Atlas of World Population History,
Harvard Centre for International
Development’s Geography Database, the
cadastral (land census) data, official
newspapers, population census, the
Colombian statistical agency (DANE)
Acemoglu et al. (2001), Acemoglu et
al. (2008), Nunn (2008)
The relationship between
political institutions and
economic growth
- Polity score
- GDP per capita
- Executive independence
- Constraints on executive power
- Effectiveness of legislature
- Government effectiveness
- Political and civil rights
- Ethnic fractionalization
- Legal origin
- The duration of the ruling group
- Domestic and foreign democratic capital
- Bureaucratic efficiency index
Industrial Statistics Database of the
UNIDO, Polity IV database, Freedom House,
Penn World Table, World Bank’s World
Development Indicators, UNESCO Institute
for Statistics, Business International (BI),
Heston and Summers dataset, Barro and
Wolf dataset, Maddison dataset,
International Country Risk Guide (ICRG),
Transparency International, Bollen index,
Gastil index, World Bank’s Operations
Evaluation Department, UN’s Humana
index, Summers and Heston dataset, Jodice
Scully (1988), Helliwell (1994),
Alesina and Rodrik (1994), Mauro
(1995), Clague et al. (1996), Caselli et
al. (1996), Alesina et al. (1996), Isham
et al. (1997), Drury et al. (2006),
Aghion et al. (2008), Besley and
Kudamatsu (2008), Persson and
Tabellini (2008)
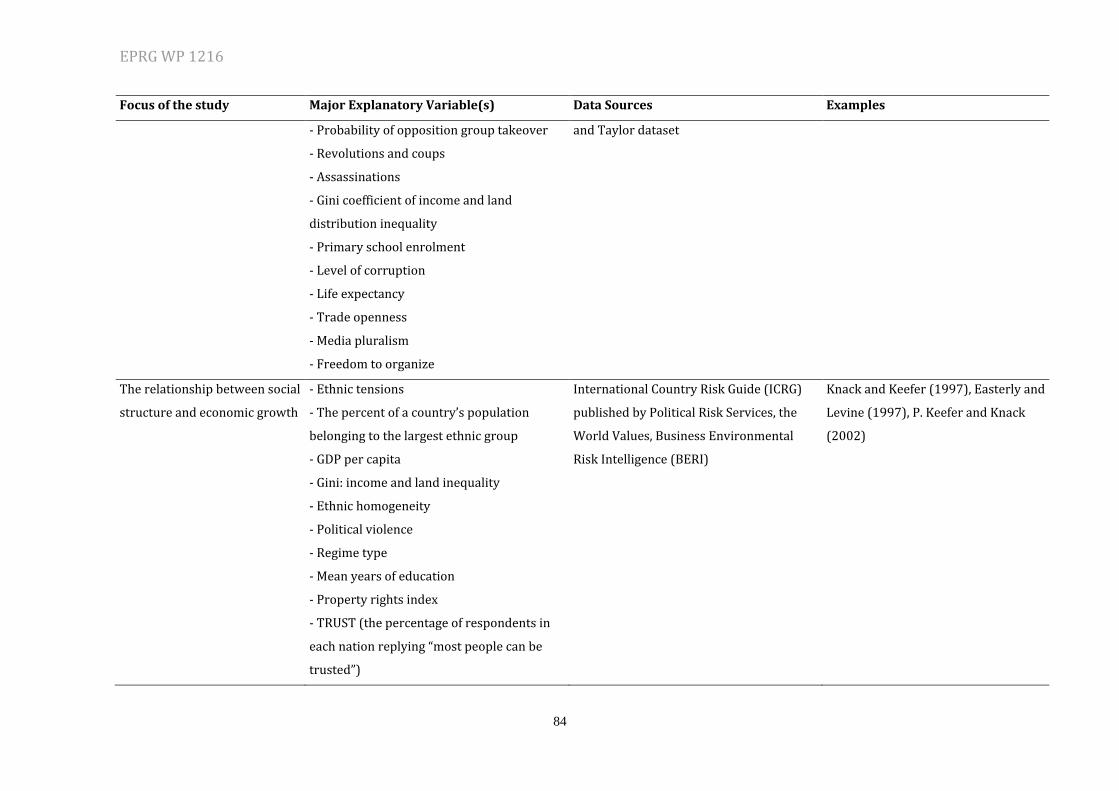
EPRG WP 1216
84
Focus of the study Major Explanatory Variable(s) Data Sources Examples
- Probability of opposition group takeover
- Revolutions and coups
- Assassinations
- Gini coefficient of income and land
distribution inequality
- Primary school enrolment
- Level of corruption
- Life expectancy
- Trade openness
- Media pluralism
- Freedom to organize
and Taylor dataset
The relationship between social
structure and economic growth
- Ethnic tensions
- The percent of a country’s population
belonging to the largest ethnic group
- GDP per capita
- Gini: income and land inequality
- Ethnic homogeneity
- Political violence
- Regime type
- Mean years of education
- Property rights index
- TRUST (the percentage of respondents in
each nation replying “most people can be
trusted”)
International Country Risk Guide (ICRG)
published by Political Risk Services, the
World Values, Business Environmental
Risk Intelligence (BERI)
Knack and Keefer (1997), Easterly and
Levine (1997), P. Keefer and Knack
(2002)
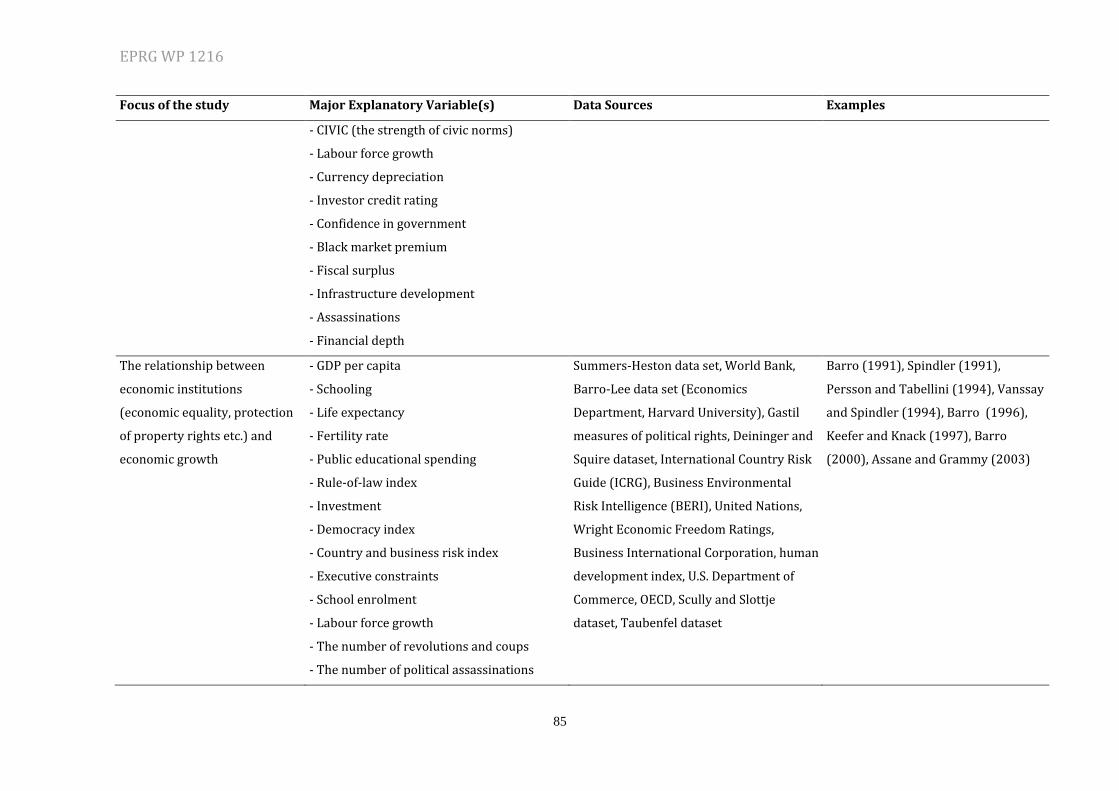
EPRG WP 1216
85
Focus of the study Major Explanatory Variable(s) Data Sources Examples
- CIVIC (the strength of civic norms)
- Labour force growth
- Currency depreciation
- Investor credit rating
- Confidence in government
- Black market premium
- Fiscal surplus
- Infrastructure development
- Assassinations
- Financial depth
The relationship between
economic institutions
(economic equality, protection
of property rights etc.) and
economic growth
- GDP per capita
- Schooling
- Life expectancy
- Fertility rate
- Public educational spending
- Rule-of-law index
- Investment
- Democracy index
- Country and business risk index
- Executive constraints
- School enrolment
- Labour force growth
- The number of revolutions and coups
- The number of political assassinations
Summers-Heston data set, World Bank,
Barro-Lee data set (Economics
Department, Harvard University), Gastil
measures of political rights, Deininger and
Squire dataset, International Country Risk
Guide (ICRG), Business Environmental
Risk Intelligence (BERI), United Nations,
Wright Economic Freedom Ratings,
Business International Corporation, human
development index, U.S. Department of
Commerce, OECD, Scully and Slottje
dataset, Taubenfel dataset
Barro (1991), Spindler (1991),
Persson and Tabellini (1994), Vanssay
and Spindler (1994), Barro (1996),
Keefer and Knack (1997), Barro
(2000), Assane and Grammy (2003)
EPRG WP 1216
86
Focus of the study Major Explanatory Variable(s) Data Sources Examples
- Mortality rates for children aged 0-4
- Student-teacher ratio
- Adult literacy rate
- Economic freedom
- Property freedom
- Movement freedom
- Association freedom
- Information freedom
- Civil liberties
- Physical capital formation
- Labour force growth
- Human capital formation
- Income Distribution
- Political Participation
- Average Skills
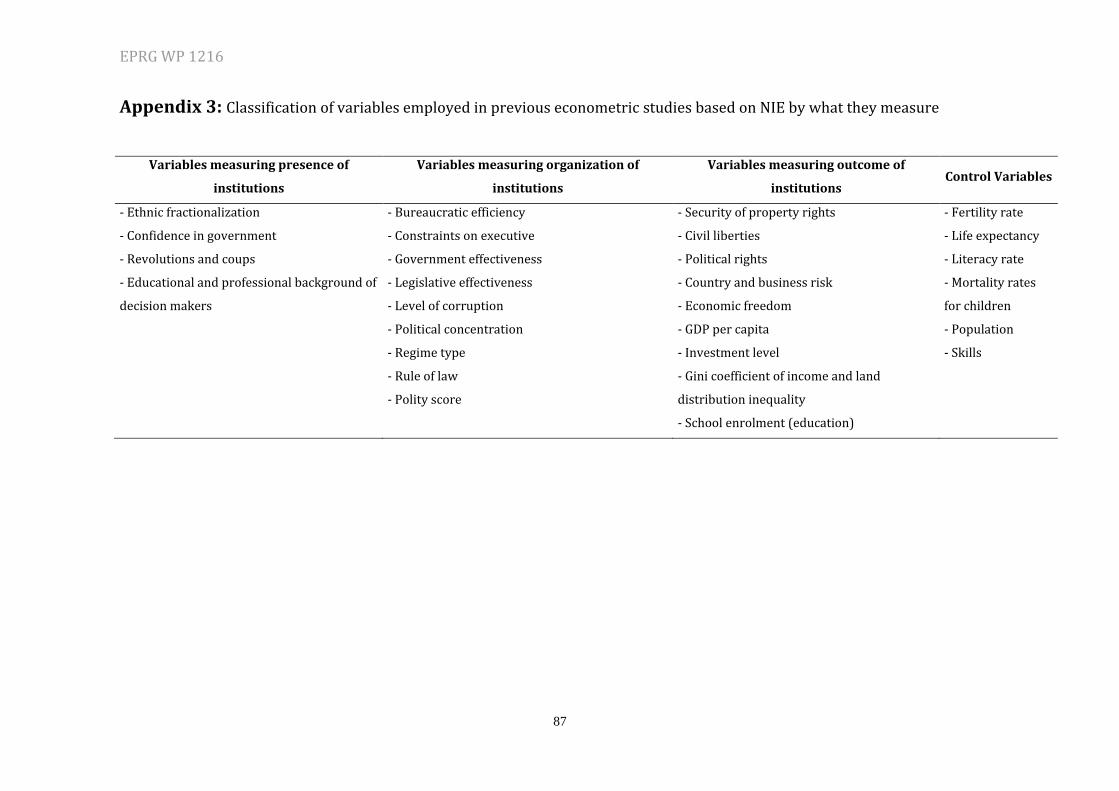
EPRG WP 1216
87
Appendix 3: Classification of variables employed in previous econometric studies based on NIE by what they measure
Variables measuring presence of
institutions
Variables measuring organization of
institutions
Variables measuring outcome of
institutions Control Variables
- Ethnic fractionalization
- Confidence in government
- Revolutions and coups
- Educational and professional background of
decision makers
- Bureaucratic efficiency
- Constraints on executive
- Government effectiveness
- Legislative effectiveness
- Level of corruption
- Political concentration
- Regime type
- Rule of law
- Polity score
- Security of property rights
- Civil liberties
- Political rights
- Country and business risk
- Economic freedom
- GDP per capita
- Investment level
- Gini coefficient of income and land
distribution inequality
- School enrolment (education)
- Fertility rate
- Life expectancy
- Literacy rate
- Mortality rates
for children
- Population
- Skills