Embed Size (px)
Citation preview

A CRITICAL TABLE: PRICING CRITICAL
ILLNESS IN THE UK ON A NEW INSURED
LIVES TABLE
Paul Brett and Johann du ToitPaul Brett, Regional Chief Actuary and Assistant General Manager, Gen Re LifeHealth UK. Email: [email protected]
Johann duToit, Product Research Actuary, Gen Re LifeHealth UK. Email: [email protected]
IAAHS COLLOQUIUM, CAPE TOWN, MAY 2007
1
Content 1 Executive Summary................................................................................................................... 4
1.1 Introduction ...................................................................................................................... 4 1.2 Results ............................................................................................................................... 5 1.3 Points of Interest................................................................................................................ 5 1.4 Credits and Thanks ............................................................................................................ 7 1.5 Disclaimer.......................................................................................................................... 7
2 Abbreviations Used in the Paper ................................................................................................ 8 3 CIIT00 Tables ............................................................................................................................ 9 4 Background............................................................................................................................. 14
4.1 CMI Experience................................................................................................................ 14 4.1.1 The CMI ................................................................................................................... 14 4.1.2 CI Investigation for the 1999-2002 Quadrennium .................................................... 14 4.1.3 Claim Date ............................................................................................................... 15 4.1.4 Structure of the Data ................................................................................................ 16 4.1.5 Date of Settlement ................................................................................................... 16 4.1.6 The SDA Adjustment ................................................................................................ 17 4.1.7 CMI Results .............................................................................................................. 18
4.2 The UK Standard CI Definitions ........................................................................................ 18 4.2.1 The First SoBP for CI ................................................................................................. 18 4.2.2 The Second SoBP for CI ............................................................................................ 19 4.2.3 The Fourth SoBP for CI ............................................................................................. 19
4.3 CIBT02 ............................................................................................................................ 19 4.3.1 Background ............................................................................................................. 19 4.3.2 Adjustments for Coma ............................................................................................. 20 4.3.3 Benign Brain Tumour ............................................................................................... 21
5 Data from the CMI .................................................................................................................. 22 5.1 Overview......................................................................................................................... 22 5.2 Estimates for Date of Diagnosis ........................................................................................ 22 5.3 Differences in Methodologies........................................................................................... 23
5.3.1 Calculation of Exposure............................................................................................ 23 5.3.2 Age Definition .......................................................................................................... 23
5.4 Comparison of Our Results and the CMI’s Results ............................................................ 24 5.4.1 Verification of Claims Data and Exposure Calculation ............................................... 24 5.4.2 Comparison of A/E Calculation................................................................................. 24
5.5 Summary of Data............................................................................................................. 25 5.5.1 Claims Data by Cause............................................................................................... 25 5.5.2 Distribution of Exposure........................................................................................... 26
6 Adjustments to CMI’s Claims Data .......................................................................................... 28 6.1 Overview......................................................................................................................... 28 6.2 Adjustments to Claims Data to reflect Diagnosed Claims.................................................. 29
6.2.1 Overall SDA.............................................................................................................. 29 6.2.2 Different SDA factors by Condition and Duration...................................................... 29

2
6.3 Further Adjustments to Claims Data................................................................................. 32 6.3.1 Removal from Data of Cases with Smoker Status Unknown ...................................... 32 6.3.2 Respreading of Unknown claim cause ...................................................................... 32 6.3.3 Adjustment for under representation ....................................................................... 32 6.3.4 Removal of Claims from Non-ABI Conditions............................................................ 33
6.4 Modified Claims Data ...................................................................................................... 33 7 Construction of CIIT00 ............................................................................................................ 34
7.1 Overview......................................................................................................................... 34 7.2 Data Used........................................................................................................................ 34
7.2.1 ACI experience versus SCI experience....................................................................... 34 7.2.2 Which data to use?................................................................................................... 35
7.3 Calculation of Raw I/P Adjustment ................................................................................... 35 7.3.1 Raw I/P adjustment formula ..................................................................................... 35 7.3.2 Grouped Raw I/P Adjustments.................................................................................. 36 7.3.3 Refining the Grouped Raw I/P Adjustments .............................................................. 38 7.3.4 Smoothing the raw I/P Adjustments ......................................................................... 38 7.3.5 Initial Rates............................................................................................................... 39
7.4 Selection Adjustments ..................................................................................................... 39 7.5 ACI and SCI Rates ............................................................................................................ 41
7.5.1 Recalibration for ACI................................................................................................. 41 7.5.2 Adjustments required for SCI ................................................................................... 41
8 Goodness of Fit ....................................................................................................................... 43 8.1 Overview......................................................................................................................... 43 8.2 Explanation of the statistical tests..................................................................................... 44
8.2.1 Chi-square test ......................................................................................................... 44 8.2.2 Individual Standardised Deviations test .................................................................... 44 8.2.3 Runs test .................................................................................................................. 45 8.2.4 Normal(0,1) Confidence Interval Test ....................................................................... 45
8.3 Goodness of fit for all conditions...................................................................................... 45 8.3.1 Goodness of fit of the “All Conditions” ACI table ...................................................... 46 8.3.2 Goodness of fit of the “All Conditions” SCI table ...................................................... 46
8.4 Goodness of fit by condition ............................................................................................ 46 8.5 Goodness of fit for “All Conditions” ACI table against anonymised client data ....................................................................................... 47
9 Points to note about CIIT00..................................................................................................... 49 9.1 Age Definition.................................................................................................................. 49 9.2 Overall Level.................................................................................................................... 49 9.3 Different Definitions......................................................................................................... 49 9.4 Date of Diagnosis............................................................................................................. 50 9.5 Using CIIT00 for Experience Analysis ................................................................................ 50 9.6 Applicability of CIIT00 for the 2006 ABI Definitions .......................................................... 50
9.6.1 Troponins ................................................................................................................ 50 9.6.2 ABI Increases Scope of Cancer Definition .................................................................. 51
9.7 Child CI ........................................................................................................................... 51 9.8 The TPD definition ........................................................................................................... 51

3
Appendix 1 – CIIT00 Select tables for ACI and SCI ................................................................ 52 Appendix 2 – CMI 1999-2002 contributing offices................................................................ 56 Appendix 3 – ABI CI Definitions ............................................................................................ 57 Appendix 4 – Verification of Our Analysis.............................................................................. 62 Appendix 5 – ABI Research into Coverage of Conditions in the UK CI Market ........................ 64 Appendix 6 – Modified Data ................................................................................................. 66 Appendix 7 – CIBT02(adj)..................................................................................................... 68 Appendix 8 – Smoothed I/P adjustments .............................................................................. 71 Appendix 9 – Anonymised Client data against CIIT00 ........................................................... 72 Appendix 10 – References .................................................................................................... 74
4
1 Executive Summary
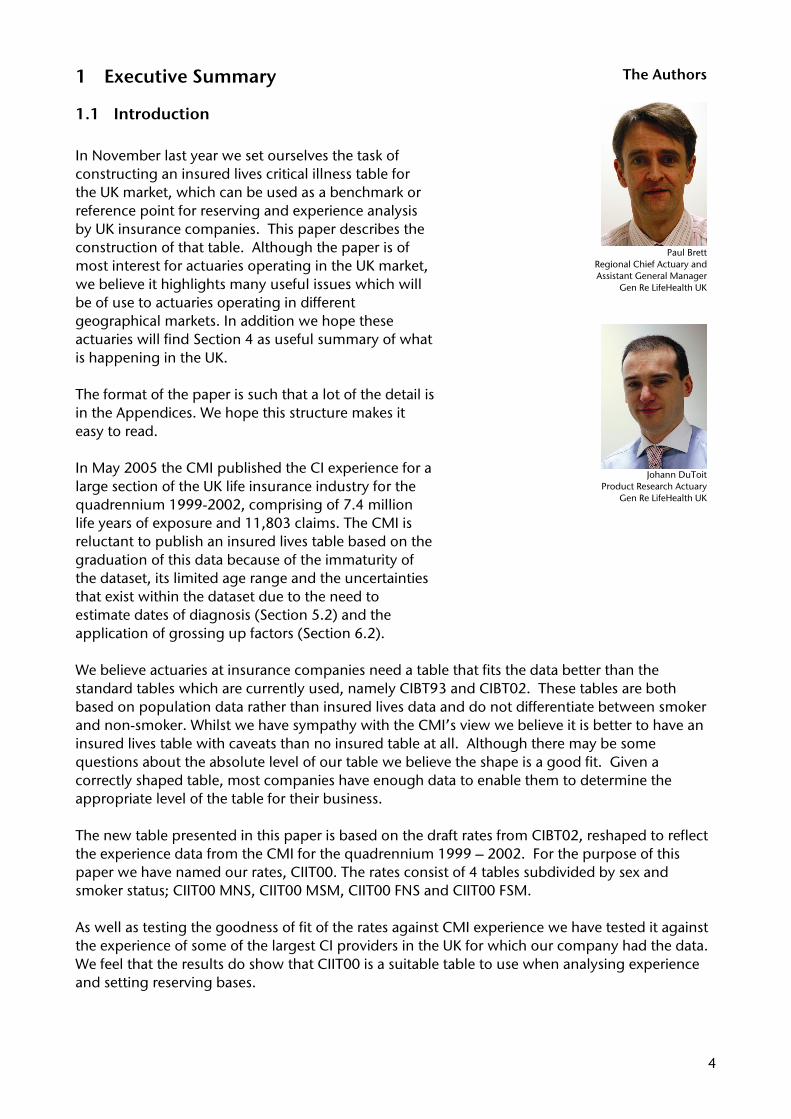
1.1 Introduction In November last year we set ourselves the task of constructing an insured lives critical illness table for the UK market, which can be used as a benchmark or reference point for reserving and experience analysis by UK insurance companies. This paper describes the construction of that table. Although the paper is of most interest for actuaries operating in the UK market, we believe it highlights many useful issues which will be of use to actuaries operating in different geographical markets. In addition we hope these actuaries will find Section 4 as useful summary of what is happening in the UK. The format of the paper is such that a lot of the detail is in the Appendices. We hope this structure makes it easy to read. In May 2005 the CMI published the CI experience for a large section of the UK life insurance industry for the quadrennium 1999-2002, comprising of 7.4 million life years of exposure and 11,803 claims. The CMI is reluctant to publish an insured lives table based on the graduation of this data because of the immaturity of the dataset, its limited age range and the uncertainties that exist within the dataset due to the need to estimate dates of diagnosis (Section 5.2) and the application of grossing up factors (Section 6.2). We believe actuaries at insurance companies need a table that fits the data better than the standard tables which are currently used, namely CIBT93 and CIBT02. These tables are both based on population data rather than insured lives data and do not differentiate between smoker and non-smoker. Whilst we have sympathy with the CMI’s view we believe it is better to have an insured lives table with caveats than no insured table at all. Although there may be some questions about the absolute level of our table we believe the shape is a good fit. Given a correctly shaped table, most companies have enough data to enable them to determine the appropriate level of the table for their business. The new table presented in this paper is based on the draft rates from CIBT02, reshaped to reflect the experience data from the CMI for the quadrennium 1999 – 2002. For the purpose of this paper we have named our rates, CIIT00. The rates consist of 4 tables subdivided by sex and smoker status; CIIT00 MNS, CIIT00 MSM, CIIT00 FNS and CIIT00 FSM. As well as testing the goodness of fit of the rates against CMI experience we have tested it against the experience of some of the largest CI providers in the UK for which our company had the data. We feel that the results do show that CIIT00 is a suitable table to use when analysing experience and setting reserving bases.
The Authors
Paul BrettRegional Chief Actuary and Assistant General Manager
Gen Re LifeHealth UK
Johann DuToitProduct Research Actuary
Gen Re LifeHealth UK
5
There are two main reasons why it is particularly important to have a good quality standard table now: • the introduction of regulations which are pushing companies more towards realistic balance
sheets. • the introduction of the Sex Equality Directive which only allows the use of sex differentials in
insurance rates based on published research.
1.2 Results This paper introduces a new Insured Lives table for the pricing of CI in the UK. The CIIT00 tables were based on a lives investigation and contain insured rates for 23 individual CI conditions. The tables also include selection discounts for each condition to reflect the effect of underwriting in the early years of a contract. The tables are a good fit to the CMI ACI 1999-2002 data, as well as the insured data from four major UK CI providers. Individual companies may need to change the level of the CIIT00 tables based on their own data. However, the shape appears to be a good fit for the offices that we have tested. We have noticed that the experience on a lives basis for policies with a sum assured of below £10,000 is very poor. When we removed these policies from the experience, the overall level of the CIIT00 table compares well to the individual anonymised companies that we have tested in Section 8.5. In constructing the CIIT00 table, we have also analysed the CMI 1999-2002 experience by sum assured band. The experience deteriorates as sum assured increases over £100,000 and is particularly poor for benefits over £250,000.
1.3 Points of Interest We thought it would be useful here to summarise issues we came across during this project which we feel will be of interest to readers of this paper. • Age definition
There has recently been confusion about the age definition that should be used with the CIBT93 table. The CMI uses an “age nearest” definition. If an office incorrectly assumes that the CMI results are on an “age exact” basis, then the results will be understated by around 5% (see Table 8 in Section 5.3.2).
• Adjustments to claims
There claims in the CMI 1999-2002 data understates the true claims that should be used when constructing an insured lives table. This is due to the following reasons:
The CMI collects CI claims on a “claims settled in a year” basis. This understates the diagnosed claims when CI business volumes are growing. (See Section 6.2).
The contributing offices do not cover all of the ABI conditions in their policies. The number of claims for some causes is therefore understated, since although the policy is in the exposure, the office won’t pay out in the event of contracting such an illness.
The cause of claim has not always been recorded. We have increased the claims from known causes to reflect the fact that the “unknown” claims could have come from any of these illnesses. However, we have not increased the death claims, since we could see from the data that these claims were CI claims.
The CIIT00 table provides rates for ABI conditions only. We have removed claims from non-ABI conditions.
6
• ACI and SCI experience This paper primarily focussed on producing insured rates for ACI, since the UK CI market sells mainly ACI products. However, we have noted that SCI experience is worse than ACI experience; probably because some ACI deaths should have been coded as a critical illness. We have therefore expressed the extra SCI experience as 26.4% of the ACI deaths rates. This allows SCI rates to be calculated and avoids any possibility that SCI rates may exceed ACI rates.
• Date of Diagnosis
The date of diagnosis is only recorded in 56.3% of 1999-2002 claims. In the remaining 43.7% of claims, we have estimated the date of diagnosis based on the patterns observed in the cases where date of diagnosis is known. The CMI has encouraged offices to start recording date of diagnosis and the proportion of claims where the date of diagnosis is filled in has been increasing in the most recent submissions.
• Coma rates The draft CIBT02 table does not contain any rates for coma, since the authors argue that a payout will eventually be made under TPD or death. However, the CMI data 44 coma payouts and we have therefore included insured rates for coma in the CIIT00 table. (See Section 4.3.2)
• Benign Brain Tumour Our research has shown that there are more benign brain tumour claims in the CMI 1999-2002 data, than the draft CIBT02 table predicts for the population. We believe the main reason for this is that CIBT02 does not include incidence from tumours in the meninges in the benign brain tumour rate. This could understate the population rate by up to 75%. Another reason may be that claim staff code some malignant tumours as benign. (See Section 4.3.3)
• Grouping of conditions with similar characteristics Although the 1999-2002 data volume is significant, the credibility of the claims becomes less when subdividing the data by condition. This is especially true for some of the minor conditions. However, some conditions are very closely related e.g. cardiovascular conditions such as heart attack, angioplasty and coronary artery by-pass surgery. Instead of scaling the draft CIBT02 rates by the incidences of individual illnesses, we have grouped similar conditions together to give more credible adjustments. The groups are discussed in Section 7.3.2.
• Select discounts Underwriting is less efficient at identifying the risk factors for some illnesses (e.g. cancers) than for other illnesses (e.g. heart attack). It is therefore to be expected that different illnesses would exhibit select periods of different lengths. In particular accidents should show a very short select period, while deaths should show a long select period. We have calculated different select periods for each of the illness groups to reflect the effect of underwriting. The “all conditions” select table is calculated by summing the select tables from the individual conditions. (See Section 7.4)
• Experience deteriorates with an increase in Sum Assured The CIIT00 table is a lives table. However, we have noted that the experience deteriorates significantly when the sum assured increases. This is particularly true for policies with a sum assured of more than £250,000. This suggests anti-selection at higher sums assured and that the additional underwriting at these higher sums assured is not sufficient.

7
1.4 Credits and Thanks We would like to express our sincere thanks to all the people involved in producing and reviewing this paper. In particular we would like to thank the CMI for providing us with the data and producing results against the CIIT00 table. We would like to thank the peer reviewers, Dave Grimshaw, Paul Lewis and Sue Elliott, for their helpful comments. We are also indebted to our Gen Re LifeHealth UK colleagues, in particular Crystal Lam and Simon Hoskins, who have checked our spreadsheets and reviewed this paper. Finally we would like to thank Gen Re LifeHealth UK for allowing us the time to research this topic.
1.5 Legal Disclaimer We would like to stress that the views expressed in this paper are the authors' and not those of Gen Re LifeHealth UK. This document is not, and is not intended to be legal advice. The content of this document is for general information purposes only. It is not supplied with any guarantee, representation or warranty, express or implied, as to the validity, accuracy or completeness of its content, including any formula or calculation contained therein. Gen Re LifeHealth UK will not be liable in any way for reliance on or use of the content of this document by the recipient.
8
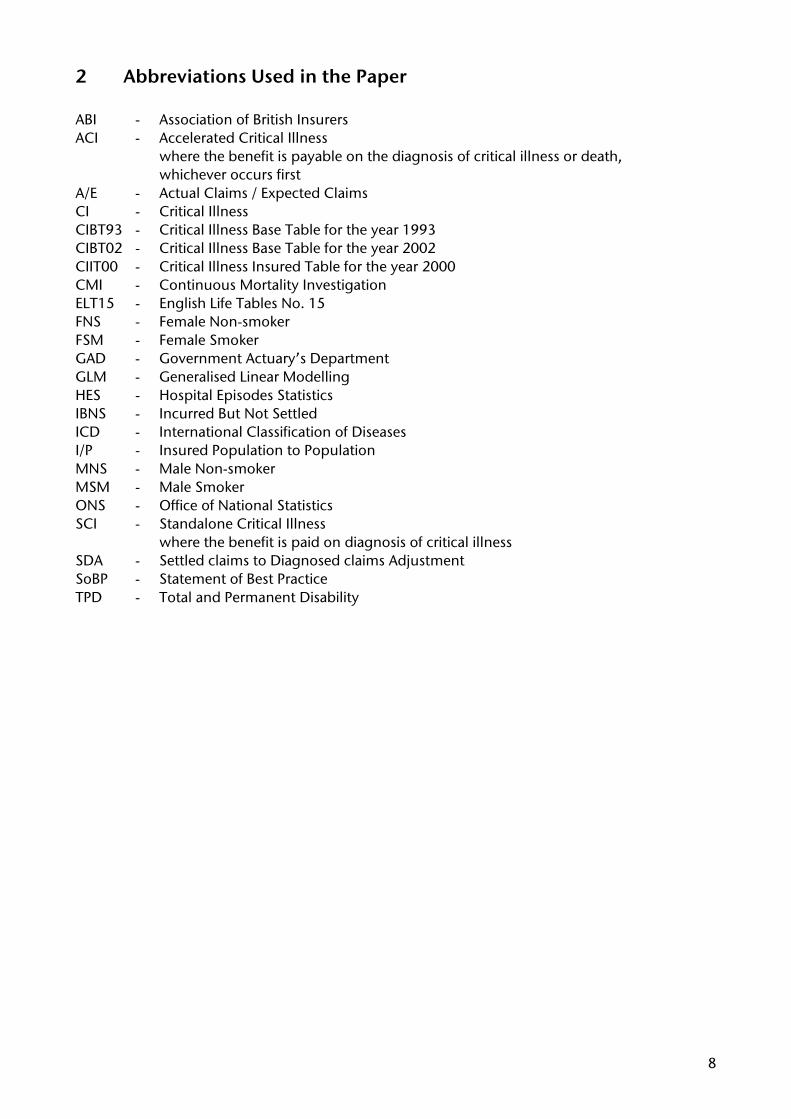
2 Abbreviations Used in the Paper ABI - Association of British Insurers ACI - Accelerated Critical Illness where the benefit is payable on the diagnosis of critical illness or death, whichever occurs first A/E - Actual Claims / Expected Claims CI - Critical Illness CIBT93 - Critical Illness Base Table for the year 1993 CIBT02 - Critical Illness Base Table for the year 2002 CIIT00 - Critical Illness Insured Table for the year 2000 CMI - Continuous Mortality Investigation ELT15 - English Life Tables No. 15 FNS - Female Non-smoker FSM - Female Smoker GAD - Government Actuary’s Department GLM - Generalised Linear Modelling HES - Hospital Episodes Statistics IBNS - Incurred But Not Settled ICD - International Classification of Diseases I/P - Insured Population to Population MNS - Male Non-smoker MSM - Male Smoker ONS - Office of National Statistics SCI - Standalone Critical Illness where the benefit is paid on diagnosis of critical illness SDA - Settled claims to Diagnosed claims Adjustment SoBP - Statement of Best Practice TPD - Total and Permanent Disability

9
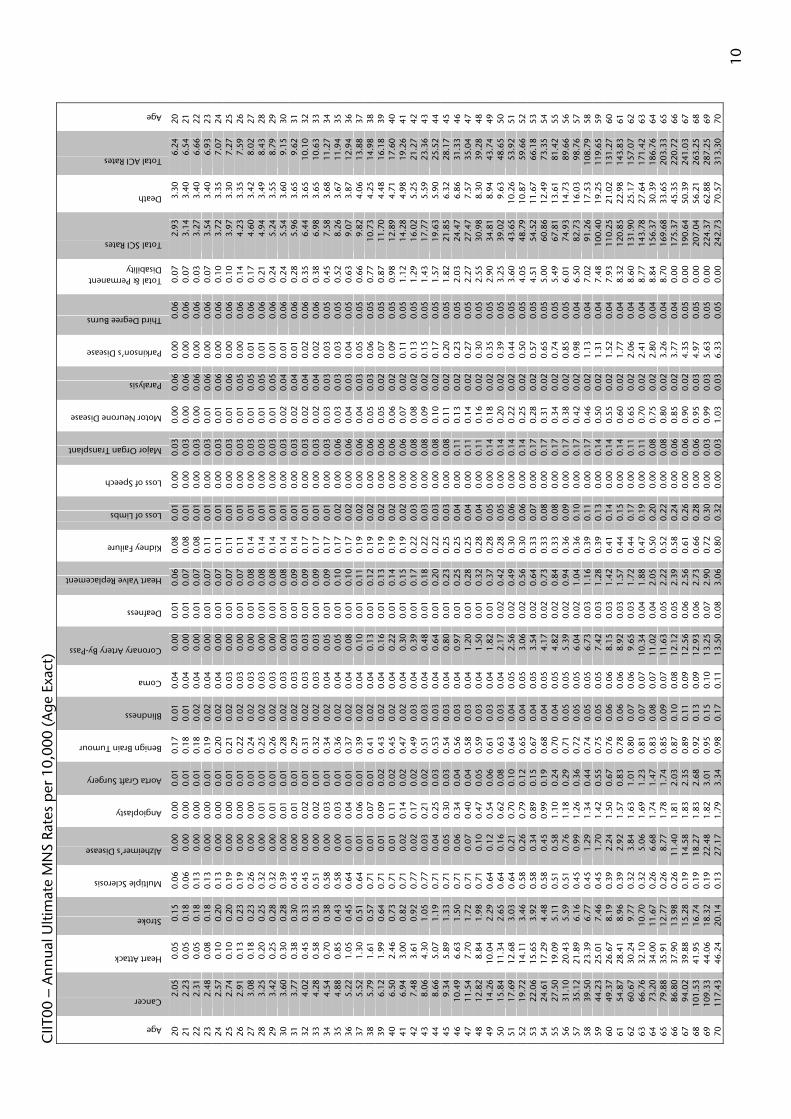
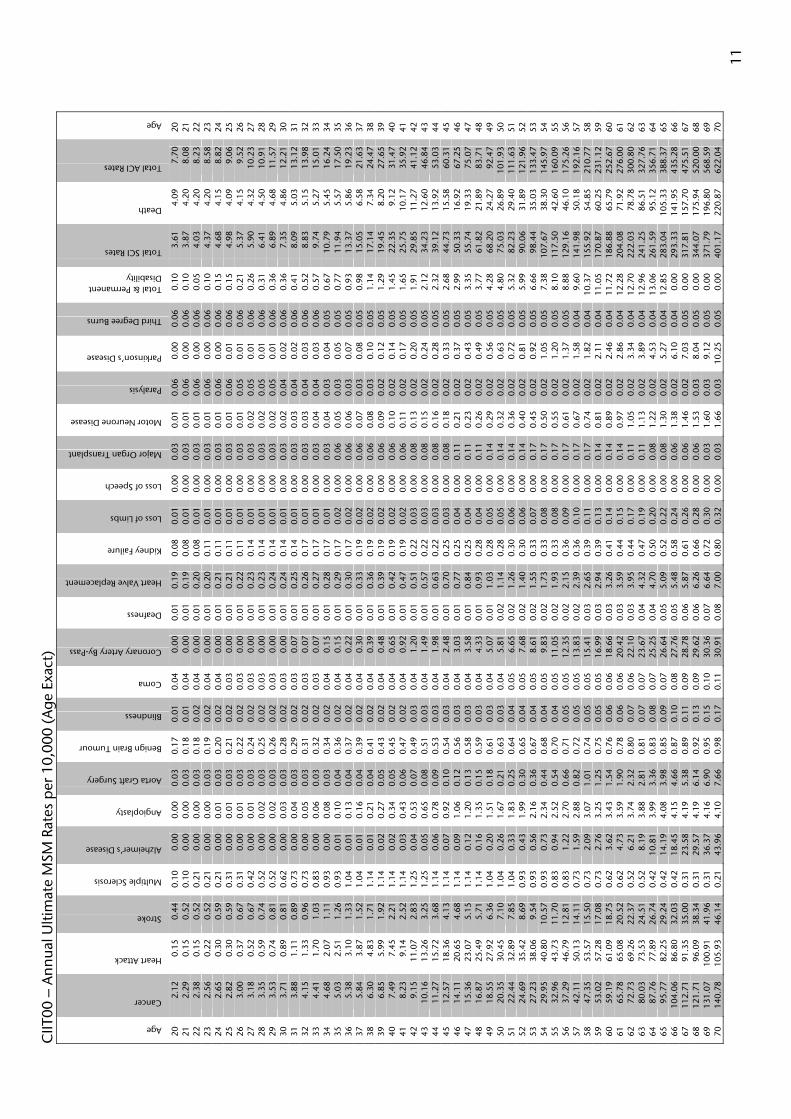
3 CIIT00 Tables On the next four pages are the results of our work, namely the four CI tables for insured lives: CIIT00 MNS, CIIT00 MSM, CIIT00 FNS and CIIT00 FSM. The rates are annual qx’s that apply to the exact ages in the tables. The tables can be downloaded in Excel format from the Gen Re UK website: www.genrelifehealth.com/uk The following select discounts should be applied to the ultimate illness rates to construct a select table. The “All Conditions” select tables are shown in Appendix 1 and are constructed by summing the individual conditions by duration.
Table 1 - Selection Discounts by Condition
Condition Sex / Smoker Duration 0 Duration 1 Duration 2 UltimateCancer MNS 17.2% - - - MSM 13.9% - - - FNS 5.0% - - - FSM 5.0% - - - Heart Attack All 22.4% 4.5% - - Stroke All 22.4% 4.5% - - Multiple Sclerosis All 48.9% - - - Alzheimer’s Disease All 48.9% - - - Angioplasty All 22.4% 4.5% - - Aorta Graft Surgery All 22.4% 4.5% - - Benign Brain Tumour All 26.9% - - - Blindness All 0% - - - Coma All 0% - - - Coronary Artery Bypass All 22.4% 4.5% - - Deafness All 0% - - - Heart Valve Replacement All 22.4% 4.5% - - Kidney Failure All 45.0% 42.1% 7.7% - Loss of Limbs All 0% - - - Loss of Speech MNS 17.2% - - - MSM 13.9% - - - FNS 5.0% - - - FSM 5.0% - - - Major Organ Transplant All 45.0% 42.1% 7.7% - Motor Neurone Disease All 48.9% - - - Paralysis All 0% - - - Parkinson’s Disease All 48.9% - - - Third Degree Burns All 0% - - - Total & Permanent Disability All 77.9% 47.7% 15.8% - Death MNS 23.0% 18.4% 15.4% - MSM 16.1% 13.3% - - FNS 22.7% 22.7% - - FSM 16.2% 12.0% - -
10
CIIT
00 –
Ann
ual U
ltim
ate
MN
S Ra
tes
per
10,
000
(Age
Exa
ct)
Age
Cancer
Heart Attack
Stroke
Multiple Sclerosis
Alzheimer’s Disease
Angioplasty
Aorta Graft Surgery
Benign Brain Tumour
Blindness
Coma
Coronary Artery By-Pass
Deafness
Heart Valve Replacement
Kidney Failure
Loss of Limbs
Loss of Speech
Major Organ Transplant
Motor Neurone Disease
Paralysis
Parkinson’s Disease
Third Degree Burns
Total & Permanent Disability
Total SCI Rates
Death
Total ACI Rates
Age
20
2.05
0.
05
0.15
0.
06
0.00
0.
00
0.01
0.
17
0.01
0.
04
0.00
0.
01
0.06
0.
08
0.01
0.
00
0.03
0.
00
0.06
0.
00
0.06
0.
07
2.93
3.
30
6.24
20
21
2.
23
0.05
0.
18
0.06
0.
00
0.00
0.
01
0.18
0.
01
0.04
0.
00
0.01
0.
07
0.08
0.
01
0.00
0.
03
0.00
0.
06
0.00
0.
06
0.07
3.
14
3.40
6.
54
21
22
2.31
0.
05
0.18
0.
13
0.00
0.
00
0.01
0.
18
0.02
0.
04
0.00
0.
01
0.07
0.
08
0.01
0.
00
0.03
0.
00
0.06
0.
00
0.06
0.
03
3.27
3.
40
6.66
22
23
2.
48
0.08
0.
18
0.13
0.
00
0.00
0.
01
0.19
0.
02
0.04
0.
00
0.01
0.
07
0.11
0.
01
0.00
0.
03
0.01
0.
06
0.00
0.
06
0.07
3.
54
3.40
6.
93
23
24
2.57
0.
10
0.20
0.
13
0.00
0.
00
0.01
0.
20
0.02
0.
04
0.00
0.
01
0.07
0.
11
0.01
0.
00
0.03
0.
01
0.06
0.
00
0.06
0.
10
3.72
3.
35
7.07
24
25
2.
74
0.10
0.
20
0.19
0.
00
0.00
0.
01
0.21
0.
02
0.03
0.
00
0.01
0.
07
0.11
0.
01
0.00
0.
03
0.01
0.
06
0.00
0.
06
0.10
3.
97
3.30
7.
27
25
26
2.91
0.
13
0.23
0.
19
0.00
0.
00
0.01
0.
22
0.02
0.
03
0.00
0.
01
0.07
0.
11
0.01
0.
00
0.03
0.
01
0.05
0.
00
0.06
0.
14
4.23
3.
35
7.59
26
27
3.
08
0.18
0.
23
0.26
0.
00
0.00
0.
01
0.24
0.
02
0.03
0.
00
0.01
0.
08
0.14
0.
01
0.00
0.
03
0.01
0.
05
0.01
0.
06
0.17
4.
60
3.42
8.
02
27
28
3.25
0.
20
0.25
0.
32
0.00
0.
01
0.01
0.
25
0.02
0.
03
0.00
0.
01
0.08
0.
14
0.01
0.
00
0.03
0.
01
0.05
0.
01
0.06
0.
21
4.94
3.
49
8.43
28
29
3.
42
0.25
0.
28
0.32
0.
00
0.01
0.
01
0.26
0.
02
0.03
0.
00
0.01
0.
08
0.14
0.
01
0.00
0.
03
0.01
0.
05
0.01
0.
06
0.24
5.
24
3.55
8.
79
29
30
3.60
0.
30
0.28
0.
39
0.00
0.
01
0.01
0.
28
0.02
0.
03
0.00
0.
01
0.08
0.
14
0.01
0.
00
0.03
0.
02
0.04
0.
01
0.06
0.
24
5.54
3.
60
9.15
30
31
3.
77
0.38
0.
30
0.45
0.
00
0.01
0.
01
0.29
0.
02
0.03
0.
03
0.01
0.
09
0.14
0.
01
0.00
0.
03
0.02
0.
04
0.01
0.
06
0.28
5.
96
3.65
9.
62
31
32
4.02
0.
45
0.33
0.
45
0.00
0.
02
0.01
0.
31
0.02
0.
03
0.03
0.
01
0.09
0.
17
0.01
0.
00
0.03
0.
02
0.04
0.
02
0.06
0.
35
6.44
3.
65
10.1
0 32
33
4.
28
0.58
0.
35
0.51
0.
00
0.02
0.
01
0.32
0.
02
0.03
0.
03
0.01
0.
09
0.17
0.
01
0.00
0.
03
0.02
0.
04
0.02
0.
06
0.38
6.
98
3.65
10
.63
33
34
4.54
0.
70
0.38
0.
58
0.00
0.
03
0.01
0.
34
0.02
0.
04
0.05
0.
01
0.09
0.
17
0.01
0.
00
0.03
0.
03
0.03
0.
03
0.05
0.
45
7.58
3.
68
11.2
7 34
35
4.
88
0.85
0.
43
0.58
0.
00
0.03
0.
01
0.36
0.
02
0.04
0.
05
0.01
0.
10
0.17
0.
02
0.00
0.
06
0.03
0.
03
0.03
0.
05
0.52
8.
26
3.67
11
.94
35
36
5.22
1.
05
0.45
0.
64
0.01
0.
04
0.01
0.
37
0.02
0.
04
0.08
0.
01
0.10
0.
17
0.02
0.
00
0.06
0.
04
0.03
0.
04
0.05
0.
63
9.07
3.
87
12.9
4 36
37
5.
52
1.30
0.
51
0.64
0.
01
0.06
0.
01
0.39
0.
02
0.04
0.
10
0.01
0.
11
0.19
0.
02
0.00
0.
06
0.04
0.
03
0.05
0.
05
0.66
9.
82
4.06
13
.88
37
38
5.79
1.
61
0.57
0.
71
0.01
0.
07
0.01
0.
41
0.02
0.
04
0.13
0.
01
0.12
0.
19
0.02
0.
00
0.06
0.
05
0.03
0.
06
0.05
0.
77
10.7
3 4.
25
14.9
8 38
39
6.
12
1.99
0.
64
0.71
0.
01
0.09
0.
02
0.43
0.
02
0.04
0.
16
0.01
0.
13
0.19
0.
02
0.00
0.
06
0.05
0.
02
0.07
0.
05
0.87
11
.70
4.48
16
.18
39
40
6.50
2.
46
0.73
0.
71
0.01
0.
11
0.02
0.
45
0.02
0.
04
0.22
0.
01
0.14
0.
19
0.02
0.
00
0.06
0.
06
0.02
0.
09
0.05
0.
98
12.8
9 4.
71
17.6
0 40
41
6.
94
3.00
0.
82
0.71
0.
02
0.14
0.
02
0.47
0.
02
0.04
0.
30
0.01
0.
15
0.19
0.
02
0.00
0.
06
0.07
0.
02
0.11
0.
05
1.12
14
.28
4.98
19
.26
41
42
7.48
3.
61
0.92
0.
77
0.02
0.
17
0.02
0.
49
0.03
0.
04
0.39
0.
01
0.17
0.
22
0.03
0.
00
0.08
0.
08
0.02
0.
13
0.05
1.
29
16.0
2 5.
25
21.2
7 42
43
8.
06
4.30
1.
05
0.77
0.
03
0.21
0.
02
0.51
0.
03
0.04
0.
48
0.01
0.
18
0.22
0.
03
0.00
0.
08
0.09
0.
02
0.15
0.
05
1.43
17
.77
5.59
23
.36
43
44
8.66
5.
07
1.19
0.
71
0.04
0.
25
0.03
0.
53
0.03
0.
04
0.64
0.
01
0.20
0.
22
0.03
0.
00
0.08
0.
10
0.02
0.
17
0.05
1.
57
19.6
3 5.
90
25.5
2 44
45
9.
34
5.89
1.
33
0.71
0.
05
0.30
0.
03
0.54
0.
03
0.04
0.
80
0.01
0.
23
0.25
0.
03
0.00
0.
08
0.11
0.
02
0.20
0.
05
1.82
21
.85
6.32
28
.17
45
46
10.4
9 6.
63
1.50
0.
71
0.06
0.
34
0.04
0.
56
0.03
0.
04
0.97
0.
01
0.25
0.
25
0.04
0.
00
0.11
0.
13
0.02
0.
23
0.05
2.
03
24.4
7 6.
86
31.3
3 46
47
11
.54
7.70
1.
72
0.71
0.
07
0.40
0.
04
0.58
0.
03
0.04
1.
20
0.01
0.
28
0.25
0.
04
0.00
0.
11
0.14
0.
02
0.27
0.
05
2.27
27
.47
7.57
35
.04
47
48
12.8
2 8.
84
1.98
0.
71
0.10
0.
47
0.05
0.
59
0.03
0.
04
1.50
0.
01
0.32
0.
28
0.04
0.
00
0.11
0.
16
0.02
0.
30
0.05
2.
55
30.9
8 8.
30
39.2
8 48
49
14
.26
10.0
4 2.
29
0.64
0.
12
0.54
0.
06
0.61
0.
03
0.04
1.
82
0.01
0.
37
0.28
0.
05
0.00
0.
14
0.18
0.
02
0.35
0.
05
2.90
34
.81
8.94
43
.74
49
50
15.8
4 11
.34
2.65
0.
64
0.16
0.
62
0.08
0.
63
0.03
0.
04
2.17
0.
02
0.42
0.
28
0.05
0.
00
0.14
0.
20
0.02
0.
39
0.05
3.
25
39.0
2 9.
63
48.6
5 50
51
17
.69
12.6
8 3.
03
0.64
0.
21
0.70
0.
10
0.64
0.
04
0.05
2.
56
0.02
0.
49
0.30
0.
06
0.00
0.
14
0.22
0.
02
0.44
0.
05
3.60
43
.65
10.2
6 53
.92
51
52
19.7
2 14
.11
3.46
0.
58
0.26
0.
79
0.12
0.
65
0.04
0.
05
3.06
0.
02
0.56
0.
30
0.06
0.
00
0.14
0.
25
0.02
0.
50
0.05
4.
05
48.7
9 10
.87
59.6
6 52
53
22
.06
15.6
5 3.
92
0.58
0.
34
0.89
0.
15
0.67
0.
04
0.05
3.
54
0.02
0.
64
0.33
0.
07
0.00
0.
17
0.28
0.
02
0.57
0.
05
4.51
54
.52
11.6
7 66
.18
53
54
24.6
1 17
.29
4.48
0.
58
0.45
0.
99
0.19
0.
68
0.04
0.
05
4.17
0.
02
0.73
0.
33
0.08
0.
00
0.17
0.
31
0.02
0.
65
0.05
5.
00
60.8
6 12
.49
73.3
5 54
55
27
.50
19.0
9 5.
11
0.51
0.
58
1.10
0.
24
0.70
0.
04
0.05
4.
82
0.02
0.
84
0.33
0.
08
0.00
0.
17
0.34
0.
02
0.74
0.
05
5.49
67
.81
13.6
1 81
.42
55
56
31.1
0 20
.43
5.59
0.
51
0.76
1.
18
0.29
0.
71
0.05
0.
05
5.39
0.
02
0.94
0.
36
0.09
0.
00
0.17
0.
38
0.02
0.
85
0.05
6.
01
74.9
3 14
.73
89.6
6 56
57
35
.12
21.8
9 6.
16
0.45
0.
99
1.26
0.
36
0.72
0.
05
0.05
6.
04
0.02
1.
04
0.36
0.
10
0.00
0.
17
0.42
0.
02
0.98
0.
04
6.50
82
.73
16.0
3 98
.76
57
58
39.5
0 23
.39
6.77
0.
45
1.29
1.
34
0.44
0.
74
0.05
0.
05
6.73
0.
03
1.16
0.
39
0.11
0.
00
0.17
0.
46
0.02
1.
13
0.04
7.
02
91.2
6 17
.53
108.
79
58
59
44.2
3 25
.01
7.46
0.
45
1.70
1.
42
0.55
0.
75
0.05
0.
05
7.42
0.
03
1.28
0.
39
0.13
0.
00
0.14
0.
50
0.02
1.
31
0.04
7.
48
100.
40
19.2
5 11
9.65
59
60
49
.37
26.6
7 8.
19
0.39
2.
24
1.50
0.
67
0.76
0.
06
0.06
8.
15
0.03
1.
42
0.41
0.
14
0.00
0.
14
0.55
0.
02
1.52
0.
04
7.93
11
0.25
21
.02
131.
27
60
61
54.8
7 28
.41
8.96
0.
39
2.92
1.
57
0.83
0.
78
0.06
0.
06
8.92
0.
03
1.57
0.
44
0.15
0.
00
0.14
0.
60
0.02
1.
77
0.04
8.
32
120.
85
22.9
8 14
3.83
61
62
60
.67
30.2
4 9.
77
0.32
3.
84
1.63
1.
01
0.80
0.
07
0.06
9.
65
0.03
1.
72
0.44
0.
17
0.00
0.
11
0.65
0.
02
2.06
0.
04
8.60
13
1.90
25
.17
157.
07
62
63
66.7
6 32
.10
10.7
0 0.
32
5.06
1.
69
1.23
0.
81
0.07
0.
07
10.3
4 0.
04
1.88
0.
47
0.19
0.
00
0.11
0.
70
0.02
2.
41
0.04
8.
77
143.
78
27.6
4 17
1.42
63
64
73
.20
34.0
0 11
.67
0.26
6.
68
1.74
1.
47
0.83
0.
08
0.07
11
.02
0.04
2.
05
0.50
0.
20
0.00
0.
08
0.75
0.
02
2.80
0.
04
8.84
15
6.37
30
.39
186.
76
64
65
79.8
8 35
.91
12.7
7 0.
26
8.77
1.
78
1.74
0.
85
0.09
0.
07
11.6
3 0.
05
2.22
0.
52
0.22
0.
00
0.08
0.
80
0.02
3.
26
0.04
8.
70
169.
68
33.6
5 20
3.33
65
66
86
.80
37.9
0 13
.98
0.26
11
.40
1.81
2.
03
0.87
0.
10
0.08
12
.12
0.05
2.
39
0.58
0.
24
0.00
0.
06
0.85
0.
02
3.77
0.
04
0.00
17
5.37
45
.35
220.
72
66
67
94.0
2 39
.88
15.2
8 0.
19
14.5
8 1.
83
2.35
0.
89
0.11
0.
09
12.5
6 0.
06
2.56
0.
61
0.26
0.
00
0.06
0.
90
0.02
4.
35
0.05
0.
00
190.
64
50.3
9 24
1.03
67
68
10
1.53
41
.95
16.7
4 0.
19
18.2
7 1.
83
2.68
0.
92
0.13
0.
09
12.9
3 0.
06
2.73
0.
66
0.28
0.
00
0.06
0.
95
0.03
4.
97
0.05
0.
00
207.
04
56.2
1 26
3.25
68
69
10
9.33
44
.06
18.3
2 0.
19
22.4
8 1.
82
3.01
0.
95
0.15
0.
10
13.2
5 0.
07
2.90
0.
72
0.30
0.
00
0.03
0.
99
0.03
5.
63
0.05
0.
00
224.
37
62.8
8 28
7.25
69
70
11
7.43
46
.24
20.1
4 0.
13
27.1
7 1.
79
3.34
0.
98
0.17
0.
11
13.5
0 0.
08
3.06
0.
80
0.32
0.
00
0.03
1.
03
0.03
6.
33
0.05
0.
00
242.
73
70.5
7 31
3.30
70
11
CIIT
00 –
Ann
ual U
ltim
ate
MSM
Rat
es p
er 1
0,00
0 (A
ge E
xact
)
Age
Cancer
Heart Attack
Stroke
Multiple Sclerosis
Alzheimer’s Disease
Angioplasty
Aorta Graft Surgery
Benign Brain Tumour
Blindness
Coma
Coronary Artery By-Pass
Deafness
Heart Valve Replacement
Kidney Failure
Loss of Limbs
Loss of Speech
Major Organ Transplant
Motor Neurone Disease
Paralysis
Parkinson’s Disease
Third Degree Burns
Total & Permanent Disability
Total SCI Rates
Death
Total ACI Rates
Age
20
2.12
0.
15
0.44
0.
10
0.00
0.
00
0.03
0.
17
0.01
0.
04
0.00
0.
01
0.19
0.
08
0.01
0.
00
0.03
0.
01
0.06
0.
00
0.06
0.
10
3.61
4.
09
7.70
20
21
2.
29
0.15
0.
52
0.10
0.
00
0.00
0.
03
0.18
0.
01
0.04
0.
00
0.01
0.
19
0.08
0.
01
0.00
0.
03
0.01
0.
06
0.00
0.
06
0.10
3.
87
4.20
8.
08
21
22
2.38
0.
15
0.52
0.
21
0.00
0.
00
0.03
0.
18
0.02
0.
04
0.00
0.
01
0.20
0.
08
0.01
0.
00
0.03
0.
01
0.06
0.
00
0.06
0.
05
4.03
4.
20
8.23
22
23
2.
56
0.22
0.
52
0.21
0.
00
0.00
0.
03
0.19
0.
02
0.04
0.
00
0.01
0.
20
0.11
0.
01
0.00
0.
03
0.01
0.
06
0.00
0.
06
0.10
4.
37
4.20
8.
58
23
24
2.65
0.
30
0.59
0.
21
0.00
0.
01
0.03
0.
20
0.02
0.
04
0.00
0.
01
0.21
0.
11
0.01
0.
00
0.03
0.
01
0.06
0.
00
0.06
0.
15
4.68
4.
15
8.82
24
25
2.
82
0.30
0.
59
0.31
0.
00
0.01
0.
03
0.21
0.
02
0.03
0.
00
0.01
0.
21
0.11
0.
01
0.00
0.
03
0.01
0.
06
0.01
0.
06
0.15
4.
98
4.09
9.
06
25
26
3.00
0.
37
0.67
0.
31
0.00
0.
01
0.03
0.
22
0.02
0.
03
0.00
0.
01
0.22
0.
11
0.01
0.
00
0.03
0.
01
0.05
0.
01
0.06
0.
21
5.37
4.
15
9.52
26
27
3.
18
0.52
0.
67
0.42
0.
00
0.01
0.
03
0.24
0.
02
0.03
0.
00
0.01
0.
23
0.14
0.
01
0.00
0.
03
0.02
0.
05
0.01
0.
06
0.26
5.
90
4.32
10
.23
27
28
3.35
0.
59
0.74
0.
52
0.00
0.
02
0.03
0.
25
0.02
0.
03
0.00
0.
01
0.23
0.
14
0.01
0.
00
0.03
0.
02
0.05
0.
01
0.06
0.
31
6.41
4.
50
10.9
1 28
29
3.
53
0.74
0.
81
0.52
0.
00
0.02
0.
03
0.26
0.
02
0.03
0.
00
0.01
0.
24
0.14
0.
01
0.00
0.
03
0.02
0.
05
0.01
0.
06
0.36
6.
89
4.68
11
.57
29
30
3.71
0.
89
0.81
0.
62
0.00
0.
03
0.03
0.
28
0.02
0.
03
0.00
0.
01
0.24
0.
14
0.01
0.
00
0.03
0.
02
0.04
0.
02
0.06
0.
36
7.35
4.
86
12.2
1 30
31
3.
88
1.11
0.
89
0.73
0.
00
0.04
0.
03
0.29
0.
02
0.03
0.
07
0.01
0.
25
0.14
0.
01
0.00
0.
03
0.03
0.
04
0.02
0.
06
0.41
8.
09
5.03
13
.12
31
32
4.15
1.
33
0.96
0.
73
0.00
0.
05
0.03
0.
31
0.02
0.
03
0.07
0.
01
0.26
0.
17
0.01
0.
00
0.03
0.
03
0.04
0.
03
0.06
0.
52
8.83
5.
15
13.9
8 32
33
4.
41
1.70
1.
03
0.83
0.
00
0.06
0.
03
0.32
0.
02
0.03
0.
07
0.01
0.
27
0.17
0.
01
0.00
0.
03
0.04
0.
04
0.03
0.
06
0.57
9.
74
5.27
15
.01
33
34
4.68
2.
07
1.11
0.
93
0.00
0.
08
0.03
0.
34
0.02
0.
04
0.15
0.
01
0.28
0.
17
0.01
0.
00
0.03
0.
04
0.03
0.
04
0.05
0.
67
10.7
9 5.
45
16.2
4 34
35
5.
03
2.51
1.
26
0.93
0.
01
0.10
0.
04
0.36
0.
02
0.04
0.
15
0.01
0.
29
0.17
0.
02
0.00
0.
06
0.05
0.
03
0.05
0.
05
0.77
11
.94
5.57
17
.50
35
36
5.38
3.
10
1.33
1.
04
0.01
0.
13
0.04
0.
37
0.02
0.
04
0.22
0.
01
0.30
0.
17
0.02
0.
00
0.06
0.
06
0.03
0.
07
0.05
0.
93
13.3
7 5.
86
19.2
3 36
37
5.
84
3.87
1.
52
1.04
0.
01
0.16
0.
04
0.39
0.
02
0.04
0.
30
0.01
0.
33
0.19
0.
02
0.00
0.
06
0.07
0.
03
0.08
0.
05
0.98
15
.05
6.58
21
.63
37
38
6.30
4.
83
1.71
1.
14
0.01
0.
21
0.04
0.
41
0.02
0.
04
0.39
0.
01
0.36
0.
19
0.02
0.
00
0.06
0.
08
0.03
0.
10
0.05
1.
14
17.1
4 7.
34
24.4
7 38
39
6.
85
5.99
1.
92
1.14
0.
02
0.27
0.
05
0.43
0.
02
0.04
0.
48
0.01
0.
39
0.19
0.
02
0.00
0.
06
0.09
0.
02
0.12
0.
05
1.29
19
.45
8.20
27
.65
39
40
7.49
7.
45
2.21
1.
14
0.02
0.
34
0.05
0.
45
0.02
0.
04
0.65
0.
01
0.42
0.
19
0.02
0.
00
0.06
0.
10
0.02
0.
14
0.05
1.
45
22.3
5 9.
12
31.4
7 40
41
8.
23
9.14
2.
52
1.14
0.
03
0.43
0.
06
0.47
0.
02
0.04
0.
92
0.01
0.
47
0.19
0.
02
0.00
0.
06
0.11
0.
02
0.17
0.
05
1.65
25
.75
10.1
7 35
.92
41
42
9.15
11
.07
2.83
1.
25
0.04
0.
53
0.07
0.
49
0.03
0.
04
1.20
0.
01
0.51
0.
22
0.03
0.
00
0.08
0.
13
0.02
0.
20
0.05
1.
91
29.8
5 11
.27
41.1
2 42
43
10
.16
13.2
6 3.
25
1.25
0.
05
0.65
0.
08
0.51
0.
03
0.04
1.
49
0.01
0.
57
0.22
0.
03
0.00
0.
08
0.15
0.
02
0.24
0.
05
2.12
34
.23
12.6
0 46
.84
43
44
11.2
7 15
.72
3.68
1.
14
0.06
0.
78
0.09
0.
53
0.03
0.
04
1.98
0.
01
0.63
0.
22
0.03
0.
00
0.08
0.
16
0.02
0.
28
0.05
2.
32
39.1
2 13
.92
53.0
3 44
45
12
.57
18.3
6 4.
13
1.14
0.
07
0.92
0.
10
0.54
0.
03
0.04
2.
48
0.01
0.
70
0.25
0.
03
0.00
0.
08
0.18
0.
02
0.33
0.
05
2.68
44
.73
15.5
8 60
.31
45
46
14.1
1 20
.65
4.68
1.
14
0.09
1.
06
0.12
0.
56
0.03
0.
04
3.03
0.
01
0.77
0.
25
0.04
0.
00
0.11
0.
21
0.02
0.
37
0.05
2.
99
50.3
3 16
.92
67.2
5 46
47
15
.36
23.0
7 5.
15
1.14
0.
12
1.20
0.
13
0.58
0.
03
0.04
3.
58
0.01
0.
84
0.25
0.
04
0.00
0.
11
0.23
0.
02
0.43
0.
05
3.35
55
.74
19.3
3 75
.07
47
48
16.8
7 25
.49
5.71
1.
14
0.16
1.
35
0.15
0.
59
0.03
0.
04
4.33
0.
01
0.93
0.
28
0.04
0.
00
0.11
0.
26
0.02
0.
49
0.05
3.
77
61.8
2 21
.89
83.7
1 48
49
18
.55
27.9
2 6.
36
1.04
0.
20
1.51
0.
18
0.61
0.
03
0.04
5.
07
0.01
1.
03
0.28
0.
05
0.00
0.
14
0.29
0.
02
0.56
0.
05
4.28
68
.20
24.2
7 92
.47
49
50
20.3
5 30
.45
7.10
1.
04
0.26
1.
67
0.21
0.
63
0.03
0.
04
5.81
0.
02
1.14
0.
28
0.05
0.
00
0.14
0.
32
0.02
0.
63
0.05
4.
80
75.0
3 26
.89
101.
93
50
51
22.4
4 32
.89
7.85
1.
04
0.33
1.
83
0.25
0.
64
0.04
0.
05
6.65
0.
02
1.26
0.
30
0.06
0.
00
0.14
0.
36
0.02
0.
72
0.05
5.
32
82.2
3 29
.40
111.
63
51
52
24.6
9 35
.42
8.69
0.
93
0.43
1.
99
0.30
0.
65
0.04
0.
05
7.68
0.
02
1.40
0.
30
0.06
0.
00
0.14
0.
40
0.02
0.
81
0.05
5.
99
90.0
6 31
.89
121.
96
52
53
27.2
3 38
.06
9.54
0.
93
0.56
2.
16
0.36
0.
67
0.04
0.
05
8.61
0.
02
1.55
0.
33
0.07
0.
00
0.17
0.
45
0.02
0.
92
0.05
6.
66
98.4
4 35
.03
133.
47
53
54
29.9
5 40
.80
10.5
7 0.
93
0.73
2.
34
0.44
0.
68
0.04
0.
05
9.83
0.
02
1.73
0.
33
0.08
0.
00
0.17
0.
50
0.02
1.
05
0.05
7.
38
107.
67
38.3
0 14
5.97
54
55
32
.96
43.7
3 11
.70
0.83
0.
94
2.52
0.
54
0.70
0.
04
0.05
11
.05
0.02
1.
93
0.33
0.
08
0.00
0.
17
0.55
0.
02
1.20
0.
05
8.10
11
7.50
42
.60
160.
09
55
56
37.2
9 46
.79
12.8
1 0.
83
1.22
2.
70
0.66
0.
71
0.05
0.
05
12.3
5 0.
02
2.15
0.
36
0.09
0.
00
0.17
0.
61
0.02
1.
37
0.05
8.
88
129.
16
46.1
0 17
5.26
56
57
42
.11
50.1
3 14
.11
0.73
1.
59
2.88
0.
82
0.72
0.
05
0.05
13
.83
0.02
2.
39
0.36
0.
10
0.00
0.
17
0.67
0.
02
1.58
0.
04
9.60
14
1.98
50
.18
192.
16
57
58
47.3
5 53
.57
15.5
0 0.
73
2.09
3.
07
1.01
0.
74
0.05
0.
05
15.4
1 0.
03
2.65
0.
39
0.11
0.
00
0.17
0.
74
0.02
1.
82
0.04
10
.37
155.
92
54.8
5 21
0.77
58
59
53
.02
57.2
8 17
.08
0.73
2.
76
3.25
1.
25
0.75
0.
05
0.05
16
.99
0.03
2.
94
0.39
0.
13
0.00
0.
14
0.81
0.
02
2.11
0.
04
11.0
5 17
0.87
60
.25
231.
12
59
60
59.1
9 61
.09
18.7
5 0.
62
3.62
3.
43
1.54
0.
76
0.06
0.
06
18.6
6 0.
03
3.26
0.
41
0.14
0.
00
0.14
0.
89
0.02
2.
46
0.04
11
.72
186.
88
65.7
9 25
2.67
60
61
65
.78
65.0
8 20
.52
0.62
4.
73
3.59
1.
90
0.78
0.
06
0.06
20
.42
0.03
3.
59
0.44
0.
15
0.00
0.
14
0.97
0.
02
2.86
0.
04
12.2
8 20
4.08
71
.92
276.
00
61
62
72.7
3 69
.26
22.3
7 0.
52
6.21
3.
74
2.32
0.
80
0.07
0.
06
22.1
0 0.
03
3.95
0.
44
0.17
0.
00
0.11
1.
05
0.02
3.
34
0.04
12
.70
222.
03
78.7
8 30
0.80
62
63
80
.03
73.5
3 24
.51
0.52
8.
19
3.88
2.
81
0.81
0.
07
0.07
23
.67
0.04
4.
32
0.47
0.
19
0.00
0.
11
1.13
0.
02
3.89
0.
04
12.9
6 24
1.25
86
.51
327.
76
63
64
87.7
6 77
.89
26.7
4 0.
42
10.8
1 3.
99
3.36
0.
83
0.08
0.
07
25.2
5 0.
04
4.70
0.
50
0.20
0.
00
0.08
1.
22
0.02
4.
53
0.04
13
.06
261.
59
95.1
2 35
6.71
64
65
95
.77
82.2
5 29
.24
0.42
14
.19
4.08
3.
98
0.85
0.
09
0.07
26
.64
0.05
5.
09
0.52
0.
22
0.00
0.
08
1.30
0.
02
5.27
0.
04
12.8
5 28
3.04
10
5.33
38
8.37
65
66
10
4.06
86
.80
32.0
3 0.
42
18.4
5 4.
15
4.66
0.
87
0.10
0.
08
27.7
6 0.
05
5.48
0.
58
0.24
0.
00
0.06
1.
38
0.02
6.
10
0.04
0.
00
293.
33
141.
95
435.
28
66
67
112.
71
91.3
5 35
.00
0.31
23
.58
4.19
5.
38
0.89
0.
11
0.09
28
.78
0.06
5.
87
0.61
0.
26
0.00
0.
06
1.46
0.
02
7.03
0.
05
0.00
31
7.81
15
7.70
47
5.51
67
68
12
1.71
96
.09
38.3
4 0.
31
29.5
7 4.
19
6.14
0.
92
0.13
0.
09
29.6
2 0.
06
6.26
0.
66
0.28
0.
00
0.06
1.
53
0.03
8.
04
0.05
0.
00
344.
07
175.
94
520.
00
68
69
131.
07
100.
91
41.9
6 0.
31
36.3
7 4.
16
6.90
0.
95
0.15
0.
10
30.3
6 0.
07
6.64
0.
72
0.30
0.
00
0.03
1.
60
0.03
9.
12
0.05
0.
00
371.
79
196.
80
568.
59
69
70
140.
78
105.
93
46.1
4 0.
21
43.9
6 4.
10
7.66
0.
98
0.17
0.
11
30.9
1 0.
08
7.00
0.
80
0.32
0.
00
0.03
1.
66
0.03
10
.25
0.05
0.
00
401.
17
220.
87
622.
04
70

12
CIIT
00 –
Ann
ual U
ltim
ate
FNS
Rate
s p
er 1
0,00
0 (A
ge E
xact
)
Age
Cancer
Heart Attack
Stroke
Multiple Sclerosis
Alzheimer’s Disease
Angioplasty
Aorta Graft Surgery
Benign Brain Tumour
Blindness
Coma
Coronary Artery By-Pass
Deafness
Heart Valve Replacement
Kidney Failure
Loss of Limbs
Loss of Speech
Major Organ Transplant
Motor Neurone Disease
Paralysis
Parkinson’s Disease
Third Degree Burns
Total & Permanent Disability
Total SCI Rates
Death
Total ACI Rates
Age
20
1.43
0.
00
0.14
0.
19
0.00
0.
00
0.00
0.
11
0.01
0.
03
0.00
0.
01
0.04
0.
03
0.00
0.
00
0.03
0.
00
0.02
0.
00
0.03
0.
10
2.18
0.
85
3.03
20
21
1.
56
0.03
0.
14
0.19
0.
00
0.00
0.
00
0.12
0.
01
0.03
0.
00
0.01
0.
04
0.06
0.
00
0.00
0.
03
0.00
0.
02
0.00
0.
03
0.12
2.
39
0.85
3.
24
21
22
1.77
0.
03
0.16
0.
26
0.00
0.
00
0.00
0.
12
0.02
0.
03
0.00
0.
01
0.04
0.
06
0.00
0.
00
0.03
0.
00
0.02
0.
00
0.03
0.
13
2.71
0.
85
3.56
22
23
2.
04
0.03
0.
16
0.32
0.
00
0.00
0.
00
0.13
0.
02
0.03
0.
00
0.01
0.
04
0.06
0.
00
0.00
0.
03
0.00
0.
02
0.00
0.
03
0.15
3.
07
0.85
3.
91
23
24
2.24
0.
03
0.19
0.
39
0.00
0.
00
0.00
0.
14
0.02
0.
02
0.00
0.
01
0.04
0.
06
0.00
0.
00
0.03
0.
00
0.02
0.
00
0.03
0.
18
3.40
0.
85
4.24
24
25
2.
58
0.03
0.
19
0.45
0.
00
0.00
0.
00
0.14
0.
02
0.02
0.
00
0.01
0.
04
0.06
0.
00
0.00
0.
03
0.00
0.
02
0.00
0.
03
0.19
3.
82
0.88
4.
70
25
26
2.85
0.
03
0.22
0.
58
0.00
0.
00
0.00
0.
15
0.02
0.
02
0.00
0.
01
0.04
0.
06
0.00
0.
00
0.03
0.
00
0.02
0.
00
0.03
0.
22
4.29
0.
88
5.17
26
27
3.
29
0.05
0.
22
0.65
0.
00
0.00
0.
00
0.16
0.
02
0.02
0.
00
0.01
0.
05
0.08
0.
00
0.00
0.
03
0.00
0.
02
0.01
0.
03
0.25
4.
88
0.92
5.
80
27
28
3.67
0.
05
0.25
0.
77
0.00
0.
00
0.00
0.
16
0.02
0.
02
0.00
0.
01
0.05
0.
08
0.00
0.
00
0.03
0.
00
0.02
0.
01
0.03
0.
28
5.45
0.
96
6.41
28
29
4.
19
0.05
0.
25
0.84
0.
00
0.00
0.
00
0.17
0.
02
0.02
0.
00
0.01
0.
05
0.08
0.
00
0.00
0.
03
0.00
0.
02
0.01
0.
03
0.33
6.
09
0.99
7.
09
29
30
4.72
0.
08
0.27
0.
97
0.00
0.
00
0.00
0.
18
0.02
0.
02
0.00
0.
01
0.05
0.
08
0.00
0.
00
0.03
0.
00
0.02
0.
01
0.03
0.
37
6.86
1.
03
7.89
30
31
5.
25
0.11
0.
30
1.03
0.
00
0.00
0.
00
0.19
0.
02
0.02
0.
00
0.01
0.
05
0.08
0.
00
0.00
0.
03
0.01
0.
02
0.01
0.
03
0.41
7.
58
1.10
8.
68
31
32
5.94
0.
11
0.33
1.
16
0.00
0.
00
0.00
0.
20
0.02
0.
02
0.00
0.
01
0.05
0.
08
0.00
0.
00
0.03
0.
01
0.02
0.
01
0.03
0.
47
8.50
1.
14
9.64
32
33
6.
57
0.14
0.
35
1.23
0.
00
0.00
0.
00
0.21
0.
02
0.02
0.
00
0.01
0.
05
0.11
0.
00
0.00
0.
03
0.01
0.
02
0.02
0.
03
0.52
9.
34
1.18
10
.51
33
34
7.35
0.
16
0.38
1.
29
0.01
0.
00
0.00
0.
23
0.02
0.
02
0.00
0.
01
0.05
0.
11
0.01
0.
00
0.03
0.
01
0.02
0.
02
0.03
0.
59
10.3
4 1.
21
11.5
5 34
35
8.
07
0.22
0.
41
1.42
0.
01
0.01
0.
00
0.24
0.
02
0.02
0.
03
0.01
0.
05
0.11
0.
01
0.00
0.
03
0.01
0.
02
0.02
0.
03
0.67
11
.39
1.29
12
.68
35
36
8.88
0.
25
0.44
1.
48
0.01
0.
01
0.00
0.
26
0.02
0.
02
0.03
0.
01
0.05
0.
11
0.01
0.
00
0.03
0.
01
0.02
0.
03
0.03
0.
75
12.4
4 1.
32
13.7
6 36
37
9.
66
0.30
0.
49
1.55
0.
01
0.01
0.
00
0.27
0.
02
0.02
0.
03
0.01
0.
06
0.11
0.
01
0.00
0.
06
0.02
0.
01
0.03
0.
03
0.84
13
.54
1.48
15
.02
37
38
10.5
1 0.
38
0.52
1.
55
0.01
0.
01
0.00
0.
29
0.02
0.
02
0.03
0.
01
0.06
0.
11
0.01
0.
00
0.06
0.
02
0.01
0.
04
0.03
0.
95
14.6
3 1.
68
16.3
2 38
39
11
.42
0.44
0.
57
1.61
0.
02
0.01
0.
00
0.31
0.
02
0.02
0.
03
0.01
0.
06
0.14
0.
01
0.00
0.
06
0.02
0.
01
0.04
0.
03
1.05
15
.89
1.86
17
.75
39
40
12.4
8 0.
52
0.63
1.
61
0.02
0.
01
0.00
0.
33
0.02
0.
02
0.05
0.
01
0.07
0.
14
0.01
0.
00
0.06
0.
02
0.01
0.
05
0.03
1.
18
17.2
9 2.
08
19.3
7 40
41
13
.60
0.63
0.
71
1.68
0.
03
0.02
0.
01
0.35
0.
02
0.02
0.
05
0.01
0.
07
0.14
0.
01
0.00
0.
06
0.03
0.
01
0.06
0.
03
1.33
18
.86
2.38
21
.24
41
42
14.9
3 0.
74
0.76
1.
68
0.03
0.
02
0.01
0.
37
0.03
0.
02
0.05
0.
01
0.08
0.
14
0.01
0.
00
0.06
0.
03
0.01
0.
07
0.03
1.
48
20.5
6 2.
75
23.3
0 42
43
16
.33
0.84
0.
84
1.68
0.
04
0.02
0.
01
0.39
0.
03
0.02
0.
08
0.01
0.
08
0.14
0.
01
0.00
0.
06
0.04
0.
01
0.08
0.
03
1.64
22
.39
3.08
25
.47
43
44
17.9
3 0.
95
0.93
1.
61
0.05
0.
03
0.01
0.
41
0.03
0.
02
0.08
0.
01
0.09
0.
14
0.01
0.
00
0.06
0.
05
0.01
0.
10
0.03
1.
82
24.3
6 3.
44
27.8
0 44
45
19
.74
1.09
1.
01
1.61
0.
06
0.03
0.
01
0.43
0.
03
0.02
0.
11
0.01
0.
10
0.17
0.
01
0.00
0.
06
0.06
0.
01
0.12
0.
03
2.01
26
.71
3.81
30
.52
45
46
21.8
8 1.
23
1.09
1.
55
0.08
0.
04
0.01
0.
45
0.03
0.
02
0.14
0.
01
0.11
0.
17
0.01
0.
00
0.06
0.
06
0.01
0.
14
0.03
2.
23
29.3
4 4.
01
33.3
5 46
47
23
.73
1.39
1.
17
1.55
0.
10
0.05
0.
01
0.47
0.
03
0.02
0.
16
0.01
0.
12
0.17
0.
02
0.00
0.
06
0.08
0.
01
0.16
0.
03
2.44
31
.76
4.20
35
.97
47
48
25.6
3 1.
53
1.28
1.
48
0.12
0.
05
0.01
0.
49
0.03
0.
02
0.19
0.
01
0.13
0.
17
0.02
0.
00
0.08
0.
09
0.01
0.
19
0.03
2.
69
34.2
6 4.
40
38.6
6 48
49
27
.57
1.69
1.
36
1.42
0.
16
0.06
0.
01
0.51
0.
03
0.02
0.
22
0.01
0.
14
0.17
0.
02
0.00
0.
08
0.10
0.
01
0.22
0.
03
2.94
36
.79
4.47
41
.26
49
50
29.4
3 1.
88
1.47
1.
36
0.20
0.
07
0.01
0.
53
0.03
0.
03
0.25
0.
02
0.16
0.
17
0.02
0.
00
0.08
0.
12
0.01
0.
26
0.03
3.
21
39.3
2 4.
60
43.9
2 50
51
31
.31
2.07
1.
58
1.29
0.
25
0.08
0.
02
0.55
0.
04
0.03
0.
27
0.02
0.
18
0.19
0.
02
0.00
0.
08
0.14
0.
01
0.30
0.
03
3.49
41
.95
4.79
46
.74
51
52
33.1
0 2.
29
1.72
1.
23
0.31
0.
10
0.02
0.
57
0.04
0.
03
0.33
0.
02
0.20
0.
19
0.02
0.
00
0.08
0.
16
0.01
0.
35
0.03
3.
77
44.5
6 4.
86
49.4
2 52
53
34
.79
2.53
1.
85
1.23
0.
39
0.11
0.
02
0.58
0.
04
0.03
0.
35
0.02
0.
23
0.19
0.
02
0.00
0.
08
0.18
0.
01
0.41
0.
03
4.08
47
.19
5.12
52
.31
53
54
36.4
4 2.
83
1.99
1.
16
0.50
0.
13
0.03
0.
60
0.04
0.
03
0.41
0.
02
0.26
0.
19
0.03
0.
00
0.08
0.
20
0.01
0.
47
0.03
4.
39
49.8
4 5.
39
55.2
3 54
55
37
.99
3.13
2.
15
1.10
0.
62
0.15
0.
03
0.61
0.
04
0.03
0.
49
0.02
0.
29
0.22
0.
03
0.00
0.
08
0.23
0.
01
0.54
0.
03
4.70
52
.52
5.78
58
.30
55
56
40.3
8 3.
49
2.32
1.
03
0.78
0.
17
0.04
0.
63
0.05
0.
03
0.54
0.
02
0.33
0.
22
0.03
0.
00
0.08
0.
26
0.02
0.
62
0.03
5.
02
56.0
9 6.
17
62.2
6 56
57
42
.71
3.89
2.
51
0.97
0.
98
0.19
0.
04
0.64
0.
05
0.03
0.
63
0.02
0.
38
0.22
0.
03
0.00
0.
08
0.30
0.
02
0.71
0.
03
5.34
59
.78
6.70
66
.48
57
58
45.0
4 4.
36
2.75
0.
90
1.24
0.
21
0.05
0.
66
0.05
0.
03
0.74
0.
03
0.43
0.
22
0.04
0.
00
0.08
0.
33
0.02
0.
81
0.03
5.
65
63.6
8 7.
36
71.0
3 58
59
47
.37
4.85
3.
00
0.84
1.
56
0.24
0.
06
0.67
0.
05
0.04
0.
82
0.03
0.
49
0.25
0.
04
0.00
0.
08
0.37
0.
02
0.92
0.
03
5.96
67
.69
8.21
75
.90
59
60
49.6
4 5.
42
3.27
0.
77
1.96
0.
27
0.07
0.
68
0.06
0.
04
0.93
0.
03
0.56
0.
25
0.05
0.
00
0.08
0.
41
0.02
1.
05
0.03
6.
26
71.8
3 9.
19
81.0
3 60
61
51
.85
6.02
3.
60
0.71
2.
45
0.29
0.
09
0.70
0.
06
0.04
1.
06
0.03
0.
63
0.25
0.
05
0.00
0.
08
0.46
0.
02
1.19
0.
03
6.55
76
.15
10.5
1 86
.66
61
62
54.0
6 6.
67
3.98
0.
65
3.07
0.
32
0.10
0.
71
0.07
0.
04
1.20
0.
03
0.70
0.
28
0.05
0.
00
0.06
0.
50
0.02
1.
34
0.03
6.
84
80.7
1 12
.02
92.7
3 62
63
56
.27
7.38
4.
41
0.58
3.
83
0.35
0.
12
0.73
0.
07
0.05
1.
33
0.04
0.
78
0.28
0.
06
0.00
0.
06
0.54
0.
02
1.52
0.
03
7.10
85
.55
13.7
9 99
.34
63
64
58.4
8 8.
12
4.88
0.
52
4.78
0.
38
0.14
0.
74
0.08
0.
05
1.50
0.
04
0.86
0.
28
0.07
0.
00
0.06
0.
59
0.02
1.
72
0.03
7.
37
90.6
9 15
.83
106.
52
64
65
60.8
1 8.
91
5.42
0.
45
5.94
0.
40
0.17
0.
76
0.09
0.
05
1.63
0.
05
0.95
0.
30
0.07
0.
00
0.06
0.
63
0.02
1.
95
0.03
7.
59
96.2
8 18
.06
114.
34
65
66
63.2
6 9.
72
6.05
0.
45
7.34
0.
43
0.20
0.
78
0.10
0.
06
1.80
0.
05
1.03
0.
30
0.08
0.
00
0.03
0.
67
0.02
2.
21
0.03
0.
00
94.6
2 35
.73
130.
34
66
67
65.8
9 10
.62
6.75
0.
39
9.05
0.
45
0.23
0.
80
0.11
0.
06
1.96
0.
06
1.12
0.
33
0.09
0.
00
0.03
0.
71
0.02
2.
50
0.03
0.
00
101.
21
39.9
3 14
1.14
67
68
68
.70
11.5
5 7.
52
0.32
11
.11
0.46
0.
27
0.82
0.
13
0.07
2.
10
0.06
1.
20
0.36
0.
10
0.00
0.
03
0.74
0.
03
2.83
0.
03
0.00
10
8.43
44
.86
153.
29
68
69
71.8
0 12
.53
8.39
0.
32
13.5
9 0.
48
0.32
0.
84
0.15
0.
07
2.23
0.
07
1.29
0.
39
0.11
0.
00
0.03
0.
77
0.03
3.
20
0.03
0.
00
116.
64
50.7
0 16
7.34
69
70
75
.27
13.5
9 9.
34
0.26
16
.55
0.48
0.
36
0.87
0.
17
0.08
2.
32
0.08
1.
37
0.41
0.
12
0.00
0.
03
0.79
0.
03
3.60
0.
04
0.00
12
5.76
57
.80
183.
55
70
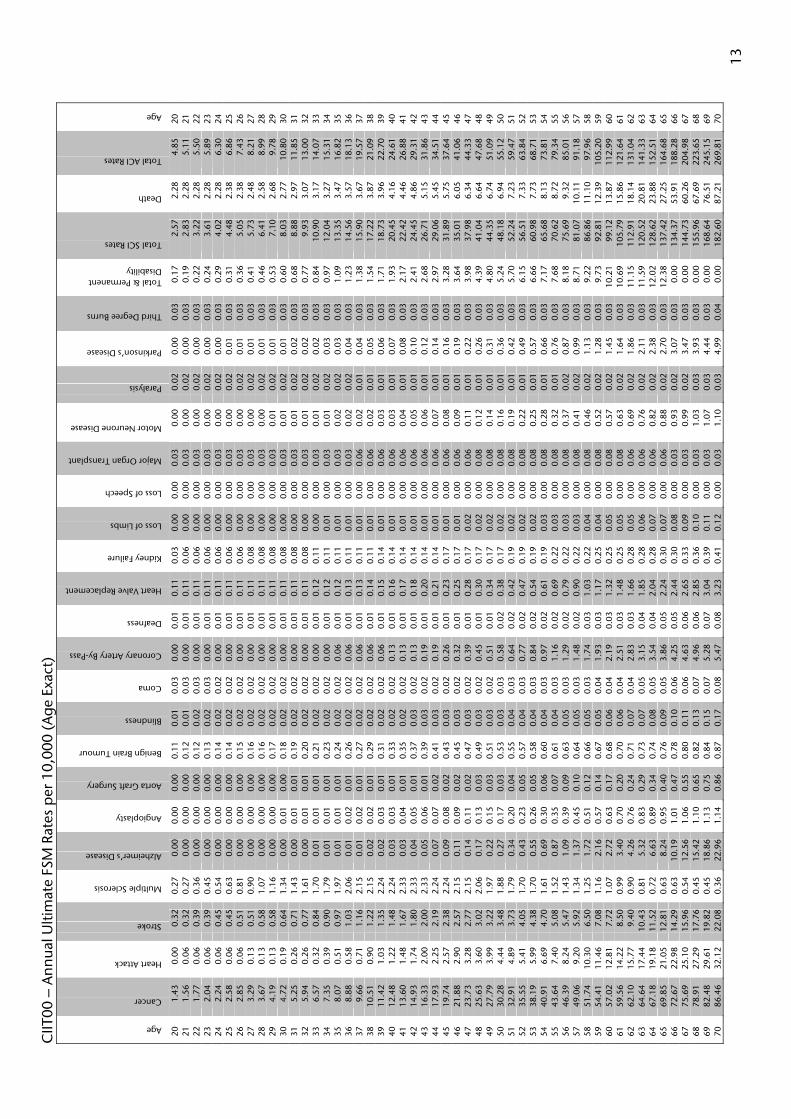
13
CIIT
00 –
Ann
ual U
ltim
ate
FSM
Rat
es p
er 1
0,00
0 (A
ge E
xact
)
Age
Cancer
Heart Attack
Stroke
Multiple Sclerosis
Alzheimer’s Disease
Angioplasty
Aorta Graft Surgery
Benign Brain Tumour
Blindness
Coma
Coronary Artery By-Pass
Deafness
Heart Valve Replacement
Kidney Failure
Loss of Limbs
Loss of Speech
Major Organ Transplant
Motor Neurone Disease
Paralysis
Parkinson’s Disease
Third Degree Burns
Total & Permanent Disability
Total SCI Rates
Death
Total ACI Rates
Age
20
1.43
0.
00
0.32
0.
27
0.00
0.
00
0.00
0.
11
0.01
0.
03
0.00
0.
01
0.11
0.
03
0.00
0.
00
0.03
0.
00
0.02
0.
00
0.03
0.
17
2.57
2.
28
4.85
20
21
1.
56
0.06
0.
32
0.27
0.
00
0.00
0.
00
0.12
0.
01
0.03
0.
00
0.01
0.
11
0.06
0.
00
0.00
0.
03
0.00
0.
02
0.00
0.
03
0.19
2.
83
2.28
5.
11
21
22
1.77
0.
06
0.39
0.
36
0.00
0.
00
0.00
0.
12
0.02
0.
03
0.00
0.
01
0.11
0.
06
0.00
0.
00
0.03
0.
00
0.02
0.
00
0.03
0.
22
3.22
2.
28
5.50
22
23
2.
04
0.06
0.
39
0.45
0.
00
0.00
0.
00
0.13
0.
02
0.03
0.
00
0.01
0.
11
0.06
0.
00
0.00
0.
03
0.00
0.
02
0.00
0.
03
0.24
3.
61
2.28
5.
89
23
24
2.24
0.
06
0.45
0.
54
0.00
0.
00
0.00
0.
14
0.02
0.
02
0.00
0.
01
0.11
0.
06
0.00
0.
00
0.03
0.
00
0.02
0.
00
0.03
0.
29
4.02
2.
28
6.30
24
25
2.
58
0.06
0.
45
0.63
0.
00
0.00
0.
00
0.14
0.
02
0.02
0.
00
0.01
0.
11
0.06
0.
00
0.00
0.
03
0.00
0.
02
0.01
0.
03
0.31
4.
48
2.38
6.
86
25
26
2.85
0.
06
0.51
0.
81
0.00
0.
00
0.00
0.
15
0.02
0.
02
0.00
0.
01
0.11
0.
06
0.00
0.
00
0.03
0.
00
0.02
0.
01
0.03
0.
36
5.05
2.
38
7.43
26
27
3.
29
0.13
0.
51
0.90
0.
00
0.00
0.
00
0.16
0.
02
0.02
0.
00
0.01
0.
11
0.08
0.
00
0.00
0.
03
0.00
0.
02
0.01
0.
03
0.41
5.
73
2.48
8.
21
27
28
3.67
0.
13
0.58
1.
07
0.00
0.
00
0.00
0.
16
0.02
0.
02
0.00
0.
01
0.11
0.
08
0.00
0.
00
0.03
0.
00
0.02
0.
01
0.03
0.
46
6.41
2.
58
8.99
28
29
4.
19
0.13
0.
58
1.16
0.
00
0.00
0.
00
0.17
0.
02
0.02
0.
00
0.01
0.
11
0.08
0.
00
0.00
0.
03
0.01
0.
02
0.01
0.
03
0.53
7.
10
2.68
9.
78
29
30
4.72
0.
19
0.64
1.
34
0.00
0.
01
0.00
0.
18
0.02
0.
02
0.00
0.
01
0.11
0.
08
0.00
0.
00
0.03
0.
01
0.02
0.
01
0.03
0.
60
8.03
2.
77
10.8
0 30
31
5.
25
0.26
0.
71
1.43
0.
00
0.01
0.
01
0.19
0.
02
0.02
0.
00
0.01
0.
11
0.08
0.
00
0.00
0.
03
0.01
0.
02
0.02
0.
03
0.68
8.
88
2.97
11
.85
31
32
5.94
0.
26
0.77
1.
61
0.00
0.
01
0.01
0.
20
0.02
0.
02
0.00
0.
01
0.11
0.
08
0.00
0.
00
0.03
0.
01
0.02
0.
02
0.03
0.
77
9.93
3.
07
13.0
0 32
33
6.
57
0.32
0.
84
1.70
0.
01
0.01
0.
01
0.21
0.
02
0.02
0.
00
0.01
0.
12
0.11
0.
00
0.00
0.
03
0.01
0.
02
0.02
0.
03
0.84
10
.90
3.17
14
.07
33
34
7.35
0.
39
0.90
1.
79
0.01
0.
01
0.01
0.
23
0.02
0.
02
0.00
0.
01
0.12
0.
11
0.01
0.
00
0.03
0.
01
0.02
0.
03
0.03
0.
97
12.0
4 3.
27
15.3
1 34
35
8.
07
0.51
0.
97
1.97
0.
01
0.01
0.
01
0.24
0.
02
0.02
0.
06
0.01
0.
12
0.11
0.
01
0.00
0.
03
0.02
0.
02
0.03
0.
03
1.09
13
.35
3.47
16
.82
35
36
8.88
0.
58
1.03
2.
06
0.01
0.
02
0.01
0.
26
0.02
0.
02
0.06
0.
01
0.13
0.
11
0.01
0.
00
0.03
0.
02
0.02
0.
04
0.03
1.
23
14.5
6 3.
57
18.1
3 36
37
9.
66
0.71
1.
16
2.15
0.
01
0.02
0.
01
0.27
0.
02
0.02
0.
06
0.01
0.
13
0.11
0.
01
0.00
0.
06
0.02
0.
01
0.04
0.
03
1.38
15
.90
3.67
19
.57
37
38
10.5
1 0.
90
1.22
2.
15
0.02
0.
02
0.01
0.
29
0.02
0.
02
0.06
0.
01
0.14
0.
11
0.01
0.
00
0.06
0.
02
0.01
0.
05
0.03
1.
54
17.2
2 3.
87
21.0
9 38
39
11
.42
1.03
1.
35
2.24
0.
02
0.03
0.
01
0.31
0.
02
0.02
0.
06
0.01
0.
15
0.14
0.
01
0.00
0.
06
0.03
0.
01
0.06
0.
03
1.71
18
.73
3.96
22
.70
39
40
12.4
8 1.
22
1.48
2.
24
0.03
0.
03
0.01
0.
33
0.02
0.
02
0.13
0.
01
0.16
0.
14
0.01
0.
00
0.06
0.
03
0.01
0.
07
0.03
1.
93
20.4
5 4.
16
24.6
1 40
41
13
.60
1.48
1.
67
2.33
0.
03
0.04
0.
01
0.35
0.
02
0.02
0.
13
0.01
0.
17
0.14
0.
01
0.00
0.
06
0.04
0.
01
0.08
0.
03
2.17
22
.42
4.46
26
.88
41
42
14.9
3 1.
74
1.80
2.
33
0.04
0.
05
0.01
0.
37
0.03
0.
02
0.13
0.
01
0.18
0.
14
0.01
0.
00
0.06
0.
05
0.01
0.
10
0.03
2.
41
24.4
5 4.
86
29.3
1 42
43
16
.33
2.00
2.
00
2.33
0.
05
0.06
0.
01
0.39
0.
03
0.02
0.
19
0.01
0.
20
0.14
0.
01
0.00
0.
06
0.06
0.
01
0.12
0.
03
2.68
26
.71
5.15
31
.86
43
44
17.9
3 2.
25
2.19
2.
24
0.07
0.
07
0.02
0.
41
0.03
0.
02
0.19
0.
01
0.21
0.
14
0.01
0.
00
0.06
0.
07
0.01
0.
14
0.03
2.
97
29.0
6 5.
45
34.5
1 44
45
19
.74
2.57
2.
38
2.24
0.
09
0.08
0.
02
0.43
0.
03
0.02
0.
26
0.01
0.
23
0.17
0.
01
0.00
0.
06
0.08
0.
01
0.16
0.
03
3.28
31
.89
5.75
37
.64
45
46
21.8
8 2.
90
2.57
2.
15
0.11
0.
09
0.02
0.
45
0.03
0.
02
0.32
0.
01
0.25
0.
17
0.01
0.
00
0.06
0.
09
0.01
0.
19
0.03
3.
64
35.0
1 6.
05
41.0
6 46
47
23
.73
3.28
2.
77
2.15
0.
14
0.11
0.
02
0.47
0.
03
0.02
0.
39
0.01
0.
28
0.17
0.
02
0.00
0.
06
0.11
0.
01
0.22
0.
03
3.98
37
.98
6.34
44
.33
47
48
25.6
3 3.
60
3.02
2.
06
0.17
0.
13
0.03
0.
49
0.03
0.
02
0.45
0.
01
0.30
0.
17
0.02
0.
00
0.08
0.
12
0.01
0.
26
0.03
4.
39
41.0
4 6.
64
47.6
8 48
49
27
.79
3.99
3.
22
1.97
0.
22
0.15
0.
03
0.51
0.
03
0.02
0.
51
0.01
0.
34
0.17
0.
02
0.00
0.
08
0.14
0.
01
0.31
0.
03
4.80
44
.35
6.74
51
.09
49
50
30.2
8 4.
44
3.48
1.
88
0.27
0.
17
0.03
0.
53
0.03
0.
03
0.58
0.
02
0.38
0.
17
0.02
0.
00
0.08
0.
16
0.01
0.
36
0.03
5.
24
48.1
8 6.
94
55.1
2 50
51
32
.91
4.89
3.
73
1.79
0.
34
0.20
0.
04
0.55
0.
04
0.03
0.
64
0.02
0.
42
0.19
0.
02
0.00
0.
08
0.19
0.
01
0.42
0.
03
5.70
52
.24
7.23
59
.47
51
52
35.5
5 5.
41
4.05
1.
70
0.43
0.
23
0.05
0.
57
0.04
0.
03
0.77
0.
02
0.47
0.
19
0.02
0.
00
0.08
0.
22
0.01
0.
49
0.03
6.
15
56.5
1 7.
33
63.8
4 52
53
38
.19
5.99
4.
38
1.70
0.
55
0.26
0.
05
0.58
0.
04
0.03
0.
84
0.02
0.
54
0.19
0.
02
0.00
0.
08
0.25
0.
01
0.57
0.
03
6.66
60
.98
7.73
68
.71
53
54
40.9
1 6.
69
4.70
1.
61
0.69
0.
30
0.06
0.
60
0.04
0.
03
0.97
0.
02
0.61
0.
19
0.03
0.
00
0.08
0.
28
0.01
0.
66
0.03
7.
17
65.6
8 8.
13
73.8
1 54
55
43
.64
7.40
5.
08
1.52
0.
87
0.35
0.
07
0.61
0.
04
0.03
1.
16
0.02
0.
69
0.22
0.
03
0.00
0.
08
0.32
0.
01
0.76
0.
03
7.68
70
.62
8.72
79
.34
55
56
46.3
9 8.
24
5.47
1.
43
1.09
0.
39
0.09
0.
63
0.05
0.
03
1.29
0.
02
0.79
0.
22
0.03
0.
00
0.08
0.
37
0.02
0.
87
0.03
8.
18
75.6
9 9.
32
85.0
1 56
57
49
.06
9.20
5.
92
1.34
1.
37
0.45
0.
10
0.64
0.
05
0.03
1.
48
0.02
0.
90
0.22
0.
03
0.00
0.
08
0.41
0.
02
0.99
0.
03
8.71
81
.07
10.1
1 91
.18
57
58
51.7
4 10
.30
6.50
1.
25
1.72
0.
51
0.12
0.
66
0.05
0.
03
1.74
0.
03
1.03
0.
22
0.04
0.
00
0.08
0.
46
0.02
1.
13
0.03
9.
22
86.8
6 11
.10
97.9
6 58
59
54
.41
11.4
6 7.
08
1.16
2.
16
0.57
0.
14
0.67
0.
05
0.04
1.
93
0.03
1.
17
0.25
0.
04
0.00
0.
08
0.52
0.
02
1.28
0.
03
9.73
92
.81
12.3
9 10
5.20
59
60
57
.02
12.8
1 7.
72
1.07
2.
72
0.63
0.
17
0.68
0.
06
0.04
2.
19
0.03
1.
32
0.25
0.
05
0.00
0.
08
0.57
0.
02
1.45
0.
03
10.2
1 99
.12
13.8
7 11
2.99
60
61
59
.56
14.2
2 8.
50
0.99
3.
40
0.70
0.
20
0.70
0.
06
0.04
2.
51
0.03
1.
48
0.25
0.
05
0.00
0.
08
0.63
0.
02
1.64
0.
03
10.6
9 10
5.79
15
.86
121.
64
61
62
62.1
0 15
.77
9.40
0.
90
4.26
0.
76
0.24
0.
71
0.07
0.
04
2.83
0.
03
1.66
0.
28
0.05
0.
00
0.06
0.
69
0.02
1.
86
0.03
11
.15
112.
91
18.1
4 13
1.04
62
63
64
.64
17.4
4 10
.43
0.81
5.
32
0.83
0.
29
0.73
0.
07
0.05
3.
15
0.04
1.
85
0.28
0.
06
0.00
0.
06
0.76
0.
02
2.11
0.
03
11.5
9 12
0.52
20
.81
141.
33
63
64
67.1
8 19
.18
11.5
2 0.
72
6.63
0.
89
0.34
0.
74
0.08
0.
05
3.54
0.
04
2.04
0.
28
0.07
0.
00
0.06
0.
82
0.02
2.
38
0.03
12
.02
128.
62
23.8
8 15
2.51
64
65
69
.85
21.0
5 12
.81
0.63
8.
24
0.95
0.
40
0.76
0.
09
0.05
3.
86
0.05
2.
24
0.30
0.
07
0.00
0.
06
0.88
0.
02
2.70
0.
03
12.3
8 13
7.42
27
.25
164.
68
65
66
72.6
7 22
.98
14.2
9 0.
63
10.1
9 1.
01
0.47
0.
78
0.10
0.
06
4.25
0.
05
2.44
0.
30
0.08
0.
00
0.03
0.
93
0.02
3.
07
0.03
0.
00
134.
37
53.9
1 18
8.28
66
67
75
.69
25.1
0 15
.96
0.54
12
.56
1.06
0.
55
0.80
0.
11
0.06
4.
63
0.06
2.
65
0.33
0.
09
0.00
0.
03
0.99
0.
02
3.47
0.
03
0.00
14
4.73
60
.26
204.
98
67
68
78.9
1 27
.29
17.7
6 0.
45
15.4
2 1.
10
0.65
0.
82
0.13
0.
07
4.96
0.
06
2.85
0.
36
0.10
0.
00
0.03
1.
03
0.03
3.
93
0.03
0.
00
155.
96
67.6
9 22
3.65
68
69
82
.48
29.6
1 19
.82
0.45
18
.86
1.13
0.
75
0.84
0.
15
0.07
5.
28
0.07
3.
04
0.39
0.
11
0.00
0.
03
1.07
0.
03
4.44
0.
03
0.00
16
8.64
76
.51
245.
15
69
70
86.4
6 32
.12
22.0
8 0.
36
22.9
6 1.
14
0.86
0.
87
0.17
0.
08
5.47
0.
08
3.23
0.
41
0.12
0.
00
0.03
1.
10
0.03
4.
99
0.04
0.
00
182.
60
87.2
1 26
9.81
70

14
4 Background
4.1 CMI Experience
4.1.1 The CMI
The CMI is the largest single research project organised by the UK Actuarial Profession. It has been accumulating and analysing data on mortality and morbidity risks arising under life assurance, annuity and pension business for over 80 years. Although organised by the UK Actuarial Profession and paid for by those life offices, reinsurers and others who use its analytical and benchmarking services, it is constituted independently as a research organisation. It publishes its work by means of: • Reports – available to all • Working Papers – available to all • Annual results and quadrennium results – available only to CMI members The CMI’s publically available material can be obtained through the UK Actuarial Profession’s website (http://www.actuaries.org.uk) under the research and prizes section.
4.1.2 CI Investigation for the 1999-2002 Quadrennium
‘All Office’ results for the Critical Illness (CI) investigation for the 1999-2002 quadrennium and for the individual years were released by the CMI to member offices in May 2005. This was done after the CMI had completed its usual process described below: • The life offices submitted their data. Details of the offices that submitted data are detailed in
Appendix 2. • The CMI Secretariat checked the data. • The CMI issued an error report and a warning report to each life office regarding its data. • Each office reviewed the reports and corrected the data as it felt appropriate. • The CMI processed the data and generated results for that office which were sent back to the
office. • Each life office confirmed its data was correct and the results made sense. • Once all the life offices have submitted verified data, “all office” results were generated. Unlike for the mortality investigation where data is received in a grouped format, the CMI collects the CI data on an individual policy basis. Details of the CMI’s data collection coding are given in the appendix of CMI Working Paper 14. Subsequently, the CMI made available to member offices the 1999-2002 data in raw format to allow interested parties to perform their own analyses. Office number and product code have been removed to preserve the confidentiality of the offices. It was the availability of this data that first gave us the idea of producing an insured lives table. The dataset contains a substantial volume of data. In total it comprises 7.4 m life years of exposure and 11,803 claims broken down as follow:

15
Table 2 – Top level split of data for the quadrennium 1999-2002
ACI SCI CI claims 7,978 1,493 Deaths & Terminal Illness 2,332 -
This is the first quadrennium for which the CMI has released CI results. The CMI released the results (but not the data) of the 2003 and 2004 experience analysis at the end of April 2007. This has increased the data volume considerably (see Table 3) because a number of new offices have joined the dataset.
Table 3 - Top level split of data for the years 2003 - 2004
ACI SCI CI claims 6,741 1,223 Deaths & Terminal Illness 1,598 -
Unfortunately as yet we only have the summary results and therefore have not been able to incorporate them into our work.
4.1.3 Claim Date
Until the CMI had gone through the data collection process it was unsure which claim dates were available and which claim dates to use. Therefore the CMI felt it was necessary to collect four claim dates, Date of Diagnosis, Date of Notification, Date of Admission and Date of Settlement. Unfortunately not all of the offices were able to provide all of these dates. Table 4 shows the percentage of claims where the stated date was given.
Table 4 – Percentage of total claim records containing the respective claim date
% of claims Date of Diagnosis 56% Date of Notification 83% Date of Admission 33% Date of Settlement 88%
The CMI felt that it was appropriate to use Date of Diagnosis to calculate age and duration of a claim to avoid distorting the age and duration pattern of the experience. Therefore, before the Actual versus Expected analysis could be done, an analysis of the reporting and settlement delays had to be done. Using these delay patterns it was possible to estimate the Date of Diagnosis for the 44% of claims where this was missing (see Section 5.2 for more details). The CMI has made good progress in getting life offices to record Date of Diagnosis and therefore in future analyses estimating Date of Diagnosis should be less of an issue. The proportion of claims with Date of Diagnosis filled in has increased to 71% in 2003 and 75% in 2004. Although for 12% of cases no actual Date of Settlement was given, the year in which settlement occurred was taken to be the year in which the CMI was informed of the claim and therefore the claim could be allocated to the appropriate exposure.
16
4.1.4 Structure of the Data
With the estimated Date of Diagnosis the data, which is on both a “lives” and “amount” basis, can be broken down by age, duration, sex, smoker status, benefit type and/or sales channel. In addition, the life offices provide details of the claim cause, which the CMI categorises into 31 cancer categories and 25 other condition categories (see Table 12 in Section 5.5.1 for further details). The categories include Death and all the 2002 standard ABI conditions (see Section 4.2). The CMI collects a list of in-force policies at each year end. A census method is therefore used to calculate exposure which assumes that all policies no longer in-force at the end of the year exited half-way through the year and new business entered mid-year. The inforce data is grouped by age nearest and curtate duration at 1/1/n and the claims for each calendar year, determined by Date of Settlement, are grouped using age nearest and curtate duration at Date of Diagnosis.
4.1.5 Date of Settlement
A unique feature of this CMI analysis is that they do not use a single date of claim to determine the age and policy duration at time of claim and to assign claims to a particular year’s experience. Instead it allocates: • Claims to exposure years according to the Date of Settlement • Age and duration according to the Date of Diagnosis. One of the major issues highlighted by the CMI is the substantial delays observed in the claims data, e.g. the average delay between diagnosis and settlement was 176 days, but with some delays being well in excess of 5 years. This total delay has two causes, firstly the delay between Date of Diagnosis and the Date of Notification, and secondly by further significant delays between the Date of Notification and the Date of Settlement. The CMI only includes claims in its experience analysis when there is certainty, i.e. when the claim has been settled. Therefore for the following practical reasons the CMI felt it was best to collect settled claims in each calendar year: • It would be impractical to wait for all claims incurred in a given year to be settled to get fully
developed experience data. • Claims with Date of Diagnosis before a life office or a new portfolio of an existing contributor
joined the investigation would have to be discarded as there is no corresponding exposure. In particular all claims pertaining to years prior to 1999 would be unusable.
• Similarly the claims experience will not develop when a life office leaves the investigation. • The accuracy of trying to allocate claims to exposure years according to their date of diagnosis is
undermined by the large number of claims with estimated Date of Diagnosis. • As data is collected past experience analyses will have to be revisited as claims replace the IBNS
estimates. As a consequence the CMI allocate claims to exposure year according to the Date of Settlement.
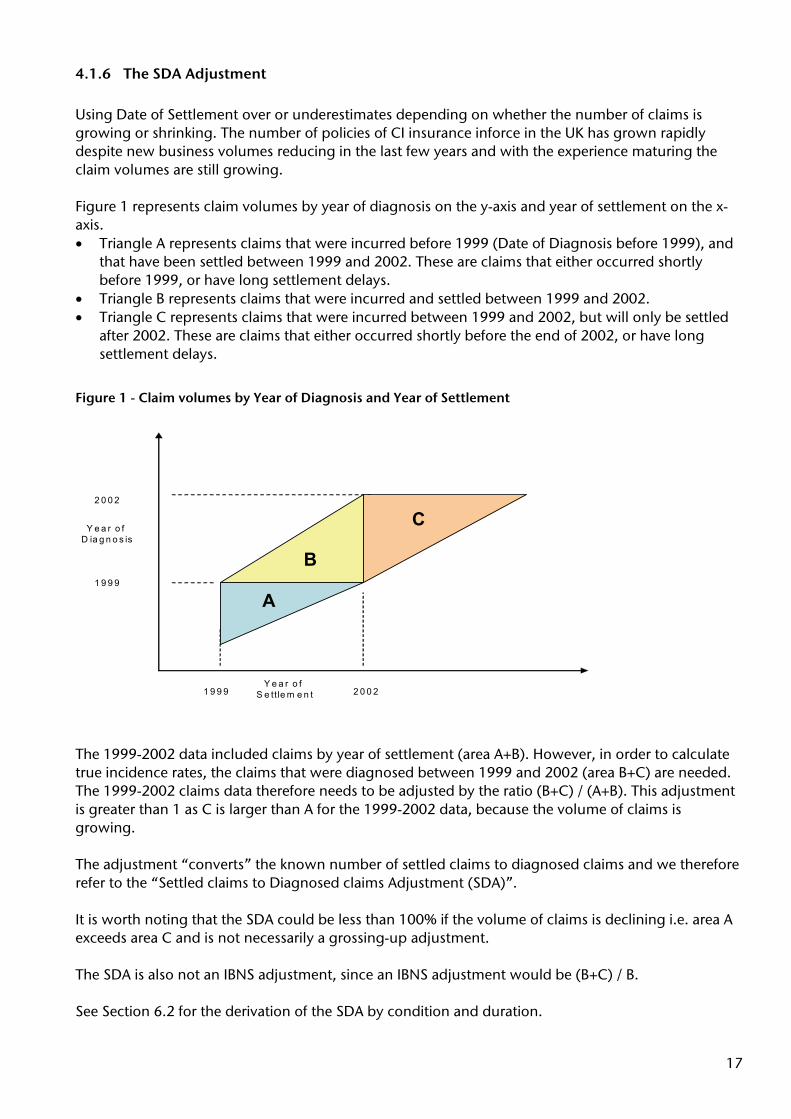
17
4.1.6 The SDA Adjustment
Using Date of Settlement over or underestimates depending on whether the number of claims is growing or shrinking. The number of policies of CI insurance inforce in the UK has grown rapidly despite new business volumes reducing in the last few years and with the experience maturing the claim volumes are still growing. Figure 1 represents claim volumes by year of diagnosis on the y-axis and year of settlement on the x-axis. • Triangle A represents claims that were incurred before 1999 (Date of Diagnosis before 1999), and
that have been settled between 1999 and 2002. These are claims that either occurred shortly before 1999, or have long settlement delays.
• Triangle B represents claims that were incurred and settled between 1999 and 2002. • Triangle C represents claims that were incurred between 1999 and 2002, but will only be settled
after 2002. These are claims that either occurred shortly before the end of 2002, or have long settlement delays.
Figure 1 - Claim volumes by Year of Diagnosis and Year of Settlement
The 1999-2002 data included claims by year of settlement (area A+B). However, in order to calculate true incidence rates, the claims that were diagnosed between 1999 and 2002 (area B+C) are needed. The 1999-2002 claims data therefore needs to be adjusted by the ratio (B+C) / (A+B). This adjustment is greater than 1 as C is larger than A for the 1999-2002 data, because the volume of claims is growing. The adjustment “converts” the known number of settled claims to diagnosed claims and we therefore refer to the “Settled claims to Diagnosed claims Adjustment (SDA)”.
It is worth noting that the SDA could be less than 100% if the volume of claims is declining i.e. area A exceeds area C and is not necessarily a grossing-up adjustment. The SDA is also not an IBNS adjustment, since an IBNS adjustment would be (B+C) / B. See Section 6.2 for the derivation of the SDA by condition and duration.
1 9 9 9
2 0 0 2
Y e a r o f D ia g n o s is
1 9 9 9 2 0 0 2Y e a r o f
S e tt le m e n t
B
A
C

18
4.1.7 CMI Results
Significant volumes of CI business only started to be written from 1995 in the UK. Therefore as one can see from Table 13 in Section 5.5.2 the data is still immature. In addition it is subject to estimation of Date of Diagnosis for a significant proportion of claims and the results are subject to a significant SDA. Hence the CMI believe there is too much uncertainty surrounding the experience for it to be used to graduate an official CMI table. Consequently, the “All Office” results issued by the CMI consisted of the A/E ratios with Expected being based on CIBT93 table; this is the table preceding CIBT02 which is described in Section 4.3. A summary of the results is given in Section 5.4.2.
4.2 The UK Standard CI Definitions
4.2.1 The First SoBP for CI
Before April 1999 life offices were free to use their own CI definitions. Consequently a range of definitions were used across the industry. This resulted in an Office of Fair Trading (“OFT” – UK Cartel and Consumer Protection Bureau) investigation which suggested the varying definitions made it hard for consumers to compare different products across the industry. This was considered undesirable. The OFT’s recommendations were implemented by the ABI in April 1999 when it issued its first SoBP for CI. It was agreed with the OFT that all conditions that were included in at least 75% of policies on the market should be standardised (see Appendix 5 for the 2002 research on coverage) and hence the first SoBP included the following 20 CI definitions:
1. Aorta Graft 2. Benign Brain Tumour 3. Blindness 4. Cancer 5. Coma 6. Coronary Artery By-Pass Grafts 7. Deafness 8. Heart Attack 9. Heart Valve Replacement or Repair 10. Kidney Failure 11. Loss of Limbs 12. Loss of Speech 13. Major Organ Transplant 14. Motor Neurone Disease 15. Multiple Sclerosis 16. Paralysis of Limbs 17. Parkinson’s Disease 18. Stroke 19. Terminal Illness 20. Third Degree Burns

19
The SoBP stipulated that in order for a life office to name one of its products CI, it must: • Cover at least cancer, heart attack and stroke • Use claims definitions that are at least as generous as the minimum standardised definitions for
any of the other 20 conditions.
4.2.2 The Second SoBP for CI
A review of the CI definitions was conducted in 2001. This resulted in the second SoBP being issued in May 2002 which included two minor changes to the cancer and heart attack definitions. The change of the cancer definition was driven by the concerns over PSA testing being able to detect very prevalent minor prostate cancers leading to a significant increase in male claims. The change to the heart attack definition was driven by changes in medical practice regarding the use of troponins to diagnose heart attacks.
4.2.3 The Fourth SoBP for CI
A third SoBP was issued in January 2004. This made some minor changes to other sections of the SoBP, but made no changes to the definitions. After a lengthy consultation period the ABI issued the fourth SoBP in April 2006 which changed nearly all of the definitions, as well as adding the following three definitions:
1. Alzheimer’s Disease 2. HIV infection 3. Traumatic Head Injury
The purpose of the changes was to improve clarity and to ensure that the number of claims in future did not dramatically increase due to improvements in diagnostics, i.e. “future proof” the definitions. Details of how the definitions have developed are given in Appendix 3.
4.3 CIBT02
4.3.1 Background
CIBT02 is a set of estimated CI incidence rates for the UK population (except for the TPD rates that were derived from insured data) relating to the year 2002. The paper is still in draft form and is due to be finalised soon. It updates CIBT93 which related to the year 1993. Because CI trends since 1993 have varied by condition, age and gender, it was felt the shape of the CIBT93 rates was no longer appropriate. In addition, the data available for 2002 was better than that for 1993, this enabled refinements in the construction of the table, in particular by age and sex. CIBT93 was constructed by the CI Healthcare Study Group and published in the paper “A Critical Review” presented to the Staple Inn Actuarial Society on 14 March 2000. The draft CIBT02 was published by the Institute of Actuaries CI Trends Research Group in December 2006 in their paper “Exploring the Critical Path”. Full details of the construction of the rates are available in that paper. The CI rates are built up from rates for the individual conditions that make up the cover. The paper therefore has rates for the 23 ABI conditions mentioned in Appendix 7. In addition CIBT02 contains rates for Traumatic Head Injury and HIV, but both are set to zero. There were none of these claims in the CMI 1999-2002 data and therefore we have ignored them.
20
The CIBT02 rates are: • For age range 18 to 85 with age definition of age nearest • Aggregate rather than differentiated between smokers and non-smokers • Rates for Stand-alone CI and Accelerated CI cover, but not more complex variants such as “buy-
back” or “second event cover”. • The rates for each condition do not vary by SCI and ACI. For each condition other than death and TPD, CIBT02 contains rates that were produced using the following general approach: • The raw Observed Rates were calculated from appropriate national data sources, the main ones
being Cancer Registrations (ONS), HES data (Department of Health), Mortality Statistics by Cause (ONS) and National Population Estimates (ONS). These rates are in age bands rather than for individual ages.
• The Raw Observed Rates are mostly for all occurrences of the condition rather than for first ever occurrence of the condition. Therefore the rates needed to be adjusted for this factor.
• The Raw Observed Rates needed to be increased due to unreported incidence as a result of for example, treatment at a private hospital or sudden death before admittance to hospital.
• The Crude Rates are the Raw Observed Rates with the above two adjustments. • The Crude Rates were interpolated and smoothed to obtain rates for each age. • The Raw Observed Rates were calculated using the total population as the denominator whereas
when dealing with first ever event the denominator should be the population who has not yet had the condition. Therefore the Crude Rates were further increased to allow for the reduction in the denominator by the prevalence of the condition.
• Finally the rates were reduced to allow for 28 day survival following occurrence of the condition to give the stand-alone rate for the condition.
A slightly different approach was followed for the death and the TPD rates: • Population mortality data was available from the GAD for the year 2001 to 2003 and cause of
death was available from the ONS. To avoid double counting it was necessary to calculate the death rates without overlap with the CI conditions. These were constructed by subtracting the proportion of deaths where the cause of claim was a CI condition.
• TPD is a definition that exists only in the insurance world. The TPD rates were therefore calculated using individual income protection data. Income Protection claims that have not recovered after five years were assumed to be totally and permanently disabled and used as a proxy for TPD incidence rates. TPD incidence rates were reduced to allow for the overlap with other CI conditions.
Rates are central mx-type rates rather than initial qx-type rates. The difference between qx and mx is very small in the context of the approximations and uncertainty inherent in the table. Therefore the CI Trends Research Group suggests that the rates can be used as qx.
4.3.2 Adjustments for Coma
The coma rates within CIBT02 are zero. This is because the authors argue that there is a100% overlap with other critical illnesses. The condition for a coma claim is only fulfilled after 96 hours in a coma and therefore the author’s argument is that the patient would qualify for a TPD or death payout. Although the arguments put forward in “Exploring the Critical Path” for 100% overlap with other critical illness payouts seem reasonable from a medical point of view, the CMI data contains 44 coma claims. These coma claims were probably the result of an accident that may eventually have lead to a TPD or death claim. However, since the payouts were made under the coma definition, offices require a rate to measure their experience against.
21
CIIT00 was derived by adjusting CIBT02 to be in line with the CMI experience on a condition by condition basis. Therefore it was necessary to have a non-zero entry for coma. We have used hospital episode statistics and UK population data to derive a population rate for coma. We have added the population coma rate to the draft CIBT02 table and the revised table, CIBT02(adj), is shown in Appendix 7.
4.3.3 Benign Brain Tumour
In our analysis we have noted that the CMI 1999-2002 data has more benign brain tumour claims than CIBT02 expect. This can be seen in Table 19. An I/P adjustment of 224% imply that benign brain tumours are more prevalent in the insured group than in the general population. The magnitude of the I/P adjustment can possibly be explained by the following reasons: • It is very difficult to identify benign brain tumours in the underwriting process. Brain scans do not
form part of standard medical examinations. A benign brain tumour is usually only identified when symptoms force the person to seek medical help. The incidence of benign brain tumours may therefore be very similar between the insured group and the population.
• Data from the ONS1 suggest that benign brain tumours are about 20% more prevalent in high socio-economic groups.
• The CIBT02 benign brain tumour rates were calculated from HES data, using ICD10 codes D33 and D43. However, we have spoken to doctors and claims managers and have been told that D32 is also accepted for claims purposes as benign brain tumours. The rates in CIBT02 may therefore be too low. Adding D32 increases the expected rate by about 75%. The descriptions of D32, D33 and D43 are:
D32 – Benign neoplasm of meninges D33 – Benign neoplasm brain and other parts of the central nervous system.
Excludes: meninges2 D43 – Neoplasm of uncertain or unknown behaviour of brain and central
nervous system.
It also seems likely that claims staff enter some claims relating to malignant brain tumours as benign brain tumours.
1 Quinn, Babb, Brock, Kirby, Jones, Cancer Trends in England and Wales 1950 – 1999 (2001), Chapter 4 2 Meninges is the system of membranes that envelops the central nervous system.
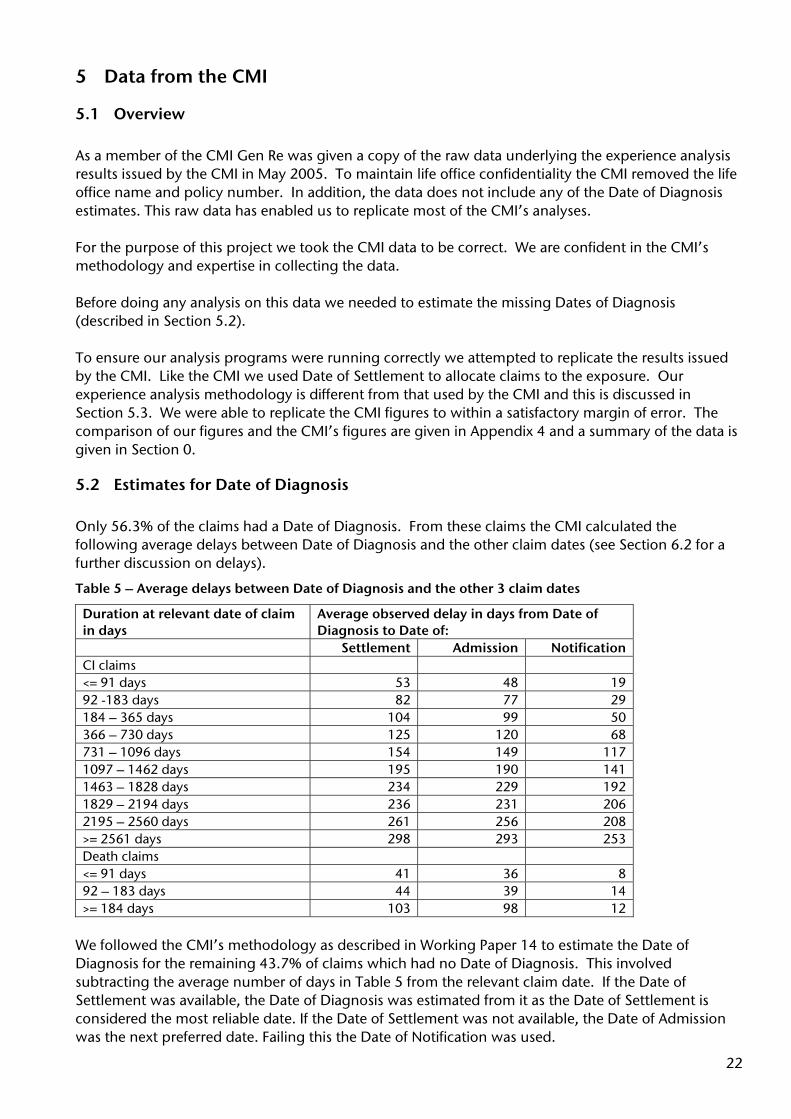
22
5 Data from the CMI
5.1 Overview As a member of the CMI Gen Re was given a copy of the raw data underlying the experience analysis results issued by the CMI in May 2005. To maintain life office confidentiality the CMI removed the life office name and policy number. In addition, the data does not include any of the Date of Diagnosis estimates. This raw data has enabled us to replicate most of the CMI’s analyses. For the purpose of this project we took the CMI data to be correct. We are confident in the CMI’s methodology and expertise in collecting the data. Before doing any analysis on this data we needed to estimate the missing Dates of Diagnosis (described in Section 5.2). To ensure our analysis programs were running correctly we attempted to replicate the results issued by the CMI. Like the CMI we used Date of Settlement to allocate claims to the exposure. Our experience analysis methodology is different from that used by the CMI and this is discussed in Section 5.3. We were able to replicate the CMI figures to within a satisfactory margin of error. The comparison of our figures and the CMI’s figures are given in Appendix 4 and a summary of the data is given in Section 0.
5.2 Estimates for Date of Diagnosis Only 56.3% of the claims had a Date of Diagnosis. From these claims the CMI calculated the following average delays between Date of Diagnosis and the other claim dates (see Section 6.2 for a further discussion on delays).
Table 5 – Average delays between Date of Diagnosis and the other 3 claim dates
Duration at relevant date of claim in days
Average observed delay in days from Date of Diagnosis to Date of:
Settlement Admission Notification CI claims <= 91 days 53 48 19 92 -183 days 82 77 29 184 – 365 days 104 99 50 366 – 730 days 125 120 68 731 – 1096 days 154 149 117 1097 – 1462 days 195 190 141 1463 – 1828 days 234 229 192 1829 – 2194 days 236 231 206 2195 – 2560 days 261 256 208 >= 2561 days 298 293 253 Death claims <= 91 days 41 36 8 92 – 183 days 44 39 14 >= 184 days 103 98 12
We followed the CMI’s methodology as described in Working Paper 14 to estimate the Date of Diagnosis for the remaining 43.7% of claims which had no Date of Diagnosis. This involved subtracting the average number of days in Table 5 from the relevant claim date. If the Date of Settlement was available, the Date of Diagnosis was estimated from it as the Date of Settlement is considered the most reliable date. If the Date of Settlement was not available, the Date of Admission was the next preferred date. Failing this the Date of Notification was used.

23
Table 6 shows the percentage of claims for which each of the four claims dates was used to get the Date of Diagnosis.
Table 6 – Claim Date used to obtain Date of Diagnosis
Claim date Number of Claims
Percentage of Claims
Date of Diagnosis 6,649 56.3%Date of Settlement 4,990 42.3%Date of Admission 142 1.2%Date of Notification 22 0.2%Total 11,803 100.0%
5.3 Differences in Methodologies
5.3.1 Calculation of Exposure
Our method of calculating exposure was fundamentally different to that used by the CMI. The CMI used the census method which assumes that all policies no longer in-force at the year end exited half-way through the year and that new business entered mid-year. With a growing portfolio the half-way assumption is inaccurate and can lead to small over-estimate in the exposure. As the data is on a policy by policy basis it was possible to improve on the exposure estimate at least in respect of the date of commencement. It was not possible to improve on the CMI’s methodology for date of exit as the CMI do not collect date of exit for lapses. We calculated exposure on a policy by policy basis using a standard experience analysis package, GLEAN3. For the purpose of verifying our methodology we replaced the date of commencement by the date 1 July of the year of commencement so as to replicate the census method. However, for the construction of CIIT00 we used the correct date of commencement. The effect of this change is shown in Table 7.
Table 7 – Difference in A/E due to using exact date of commencement rather than mid-year of year of commencement for exposure
ACI SCI Sex Smoker Mid-year Exact Ratio Mid-year Exact Ratio M NS 38.1% 38.3% 100.4% 44.3% 44.4% 100.1% M SM 68.9% 69.3% 100.6% 74.2% 74.5% 100.4% F NS 45.1% 45.4% 100.5% 51.9% 52.0% 100.3% F SM 56.9% 57.3% 100.7% 56.8% 57.1% 100.6%
Changing the inception date from a mid-year commencement to an exact entry date has only a small effect on the A/E. However, we believe our methodology is better and therefore for our work we used the exact date of commencement.
5.3.2 Age Definition
Since CIBT93 is a population table based on grouped data, there is no correct age definition. However, there should be consistency within the industry on how the table should be used. In “A Critical Review”, the authors stated that the table should be used as “age exact”, but their calculations instead used “age nearest”. The CMI uses the CIBT93 table on an “age nearest” basis, while many actuaries in the industry use the CIBT93 table on an “age exact” basis. If people incorrectly assume the CMI analysis is on an “age exact” basis and use it accordingly, then they are understating the experience by about 5%. This can be seen from Table 8.
3 GLEAN is an experience analysis software package provided by Sungard Data Systems Inc.
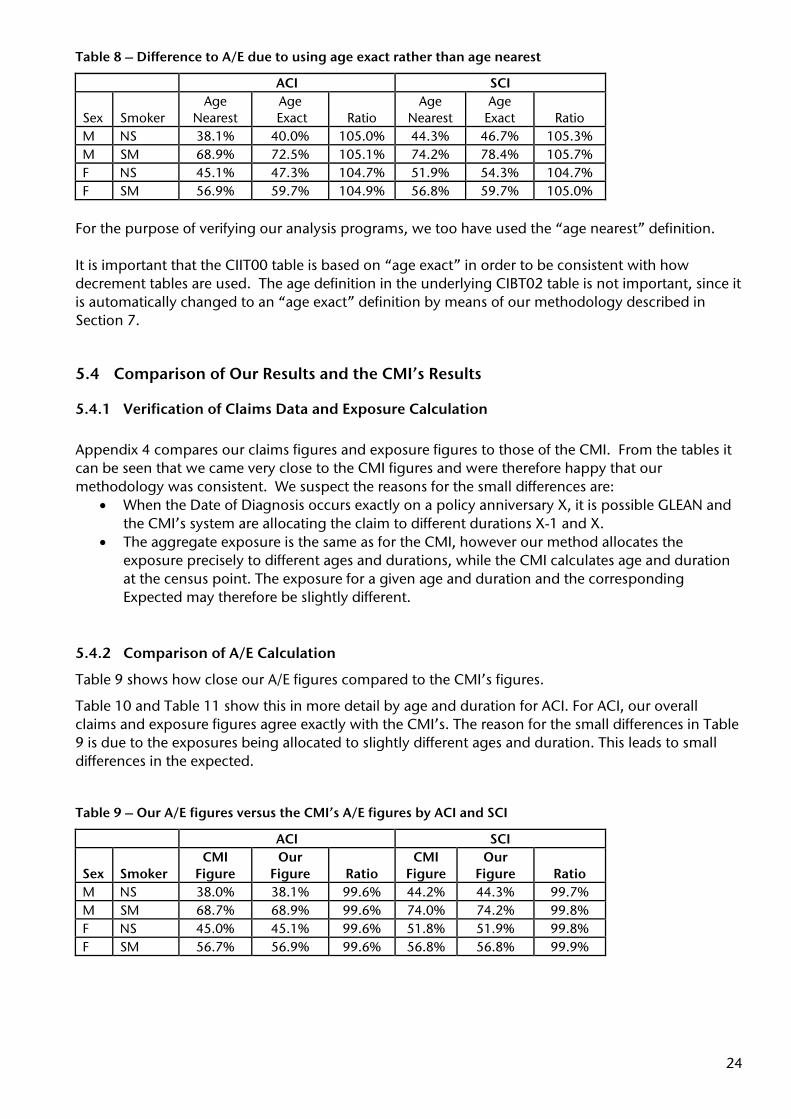
24
Table 8 – Difference to A/E due to using age exact rather than age nearest
ACI SCI
Sex Smoker Age
Nearest Age
Exact Ratio Age
Nearest Age
Exact Ratio M NS 38.1% 40.0% 105.0% 44.3% 46.7% 105.3% M SM 68.9% 72.5% 105.1% 74.2% 78.4% 105.7% F NS 45.1% 47.3% 104.7% 51.9% 54.3% 104.7% F SM 56.9% 59.7% 104.9% 56.8% 59.7% 105.0%
For the purpose of verifying our analysis programs, we too have used the “age nearest” definition. It is important that the CIIT00 table is based on “age exact” in order to be consistent with how decrement tables are used. The age definition in the underlying CIBT02 table is not important, since it is automatically changed to an “age exact” definition by means of our methodology described in Section 7.
5.4 Comparison of Our Results and the CMI’s Results
5.4.1 Verification of Claims Data and Exposure Calculation
Appendix 4 compares our claims figures and exposure figures to those of the CMI. From the tables it can be seen that we came very close to the CMI figures and were therefore happy that our methodology was consistent. We suspect the reasons for the small differences are:
• When the Date of Diagnosis occurs exactly on a policy anniversary X, it is possible GLEAN and the CMI’s system are allocating the claim to different durations X-1 and X.
• The aggregate exposure is the same as for the CMI, however our method allocates the exposure precisely to different ages and durations, while the CMI calculates age and duration at the census point. The exposure for a given age and duration and the corresponding Expected may therefore be slightly different.
5.4.2 Comparison of A/E Calculation
Table 9 shows how close our A/E figures compared to the CMI’s figures.
Table 10 and Table 11 show this in more detail by age and duration for ACI. For ACI, our overall claims and exposure figures agree exactly with the CMI’s. The reason for the small differences in Table 9 is due to the exposures being allocated to slightly different ages and duration. This leads to small differences in the expected.
Table 9 – Our A/E figures versus the CMI’s A/E figures by ACI and SCI
ACI SCI
Sex Smoker CMI
Figure Our
Figure Ratio CMI
Figure Our
Figure Ratio M NS 38.0% 38.1% 99.6% 44.2% 44.3% 99.7% M SM 68.7% 68.9% 99.6% 74.0% 74.2% 99.8% F NS 45.0% 45.1% 99.6% 51.8% 51.9% 99.8% F SM 56.7% 56.9% 99.6% 56.8% 56.8% 99.9%

25
Table 10 – Our A/E figures versus the CMI’s A/E figures by age banding for ACI
Male Female Smoker Status
Age Band
CMI Figure
Our Figure
Ratio CMI Figure
Our Figure
Ratio
NS -30 50.2% 49.8% 100.9% 43.5% 43.3% 100.5%NS 31-40 39.6% 39.7% 99.8% 48.2% 48.3% 99.9%NS 41-50 35.6% 35.8% 99.5% 45.1% 45.3% 99.5%NS 51-60 35.5% 35.8% 99.2% 41.4% 41.9% 98.8%NS 61- 38.9% 39.5% 98.4% 31.4% 31.9% 98.4%NS All 38.0% 38.1% 99.6% 45.0% 45.1% 99.6%SM -30 55.2% 54.5% 101.3% 49.4% 49.2% 100.5%SM 31-40 59.6% 59.8% 99.7% 51.5% 51.6% 99.9%SM 41-50 76.2% 76.5% 99.6% 59.3% 59.6% 99.6%SM 51-60 76.7% 77.3% 99.2% 62.9% 63.6% 98.8%SM 61- 55.9% 57.2% 97.8% 91.3% 94.0% 97.1%SM All 68.7% 68.9% 99.6% 56.7% 56.9% 99.6%
Table 11 – Our A/E figures versus the CMI’s A/E figures by duration for ACI
Male Female Smoker Status
Duration CMI Figure
Our Figure
Ratio CMI Figure
Our Figure
Ratio
NS 0 31.0% 30.4% 101.7% 40.6% 40.0% 101.5%NS 1 37.3% 38.0% 98.2% 46.4% 47.2% 98.4%NS 2 42.6% 42.8% 99.5% 49.6% 49.6% 100.0%NS 3 41.4% 41.6% 99.6% 48.0% 48.3% 99.4%NS 4 37.2% 37.8% 98.6% 46.9% 47.3% 99.3%NS 5+ 40.5% 40.9% 99.1% 43.0% 43.6% 98.7%NS All 38.0% 38.1% 99.6% 45.0% 45.1% 99.6%SM 0 63.7% 62.6% 101.8% 45.4% 44.5% 101.9%SM 1 67.9% 69.6% 97.6% 59.9% 61.1% 98.0%SM 2 75.4% 75.1% 100.3% 60.3% 60.2% 100.1%SM 3 82.6% 83.2% 99.3% 56.0% 56.4% 99.3%SM 4 65.2% 65.9% 98.9% 56.0% 56.0% 100.0%SM 5+ 64.5% 65.2% 98.9% 65.7% 66.8% 98.3%SM All 68.7% 68.9% 99.6% 56.7% 56.9% 99.6%
5.5 Summary of Data
5.5.1 Claims Data by Cause
As mentioned in Section 4.1.4 the CMI claims data included details of cause of claim. Table 12 gives details of the causes of claim recorded by the CMI together with the observed distribution of claims cause. As can be seen the main causes of SCI claim are cancer, heart attack, stroke, multiple sclerosis, coronary artery by-pass and TPD making up 88.0% of SCI claims. These major conditions plus deaths make up 93.4% of ACI claims. For comparison with the SCI ratio, the major conditions make up 91.6% of the non-death claims.

26
Table 12 – Number of claims for each condition and percentage of total claims (excl. uncoded smoker status)
Claims 1999-2002 ACI % SCI % All Major ABI Conditions: Cancer 4,519 43.9% 871 58.5% 5,390Heart Attack 1,157 11.2% 192 12.9% 1,349Stroke 525 5.1% 81 5.4% 606Multiple Sclerosis 465 4.5% 73 4.9% 538Coronary Artery By-pass 229 2.2% 50 3.4% 279 Minor ABI Conditions: Alzheimer’s Disease 5 0.0% 0 0.0% 5Angioplasty 45 0.4% 16 1.1% 61Aorta Graft Surgery 9 0.1% 3 0.2% 12Benign Brain Tumour 142 1.4% 16 1.1% 158Blindness 5 0.0% 2 0.1% 7Coma 39 0.4% 5 0.3% 44Deafness 0 0.0% 0 0.0% 0Heart Valve Replacement 60 0.6% 12 0.8% 72Kidney Failure 59 0.6% 6 0.4% 65Loss of Limbs 4 0.0% 1 0.1% 5Loss of Speech 0 0.0% 0 0.0% 0Major Organ Transplant 25 0.2% 0 0.0% 25Motor Neurone Disease 30 0.3% 11 0.7% 41Paralysis 19 0.2% 4 0.3% 23Parkinson’s Disease 19 0.2% 6 0.4% 25Third Degree Burns 0 0.0% 0 0.0% 0 Non-ABI Illnesses 117 1.1% 43 2.9% 160 Unknown 92 0.9% 54 3.6% 146 Total & Permanent Disability 404 3.9% 43 2.9% 447 Deaths & Terminal Illness 2,320 22.5% 0 0.0% 2,320 All 10,289 100.0% 1,489 100.0% 11,7784
5.5.2 Distribution of Exposure
The following tables and the tables in Appendix 4.2 give a summary of the distribution of the exposure for ACI and SCI. From this you will note: • The data is rather immature with less than 20% of the business in duration 5+. • There is minimal data with ages above 60. • There is relatively little smoker experience (19.2%). • There is relatively little SCI experience (13.7%).
4 11,803 claims – 25 uncoded smoker claims = 11,778 (see Section 6.3.1)

27
Table 13 – Distribution of Exposure by Age and Duration
Age / Duration
0 1 2 3 4 5+ All
0 -30 9.6% 6.3% 4.2% 2.8% 1.7% 1.8% 26.4%31 - 40 11.3% 8.6% 6.9% 5.6% 4.4% 8.5% 45.3%41 - 50 4.7% 3.6% 2.9% 2.5% 2.1% 5.5% 21.4%51 – 60 1.2% 1.0% 0.9% 0.7% 0.6% 2.0% 6.5%60 + 0.0% 0.1% 0.0% 0.0% 0.0% 0.2% 0.4%All 26.8% 19.6% 14.9% 11.6% 9.0% 18.1% 100.0%
Table 14 – Distribution of Exposure by Sex and Smoker status
Sex / Smoker Status
NS SM All
M 42.1% 10.9% 53.0%F 38.8% 8.2% 47.0%All 80.8% 19.2% 100.0%
28
6 Adjustments to CMI’s Claims Data
6.1 Overview Before we could use the CMI data to construct the insured lives table the claims data required some adjustments. As already discussed in Section 4.1.6 the claims data under-represents the claims incurred during the investigation period and requires an SDA. The CMI has stated in Working Paper 14 that the quadrennium results need to be increased by around 15%. Since only 56.3% of claims have Date of Diagnosis filled in, we felt that we could not improve on the CMI’s estimate. We took 15% to be the correct overall increase for all of the quadrennium data. In December 2005, the CMI presented further analysis that confirmed the 15% increase to the overall result, but shows that different increases should be used by sex, smoker status, duration and product (ACI & SCI) since inception. Although we agree with the CMI that the increases vary by sex and smoker status, we felt that the main driver behind these differences is the cause of claim and it is the different mix of conditions by sex / smoker status / product that causes the sex / smoker status / product difference. It is well reported that cardiovascular claims are relatively more prevalent in males and cancer claims are relatively more prevalent in females. Lung cancer is relatively more prevalent in smokers than in non-smokers. Different claim causes have different settlement delays and hence require different adjustments. Our research confirmed that the most important factors in determining the settlement delay are claim cause and duration since inception at claim. This is discussed in Section 6.2. Overall the SDA increased the quadrennium claims (ACI and SCI combined) by 15.1%, the ACI claims by 14.7% and the SCI claims by 17.7%. As well as the SDA there were four further minor adjustments to be made: • For this exercise we only need data which has a known smoker status. Therefore all data with
smoker status unknown was removed (Section 6.3.1). • The claims with unknown cause were respread amongst the claims with known cause (Section
6.3.2). • Certain claims needed to be adjusted upwards because the claim condition was not fully
represented in the exposure (Section 6.3.3). • The insured lives table represents critical illnesses from the ABI conditions discussed in Section 4.2.
Hence the claims with causes that were not one of the ABI conditions were removed (Section 6.3.4).
The effect of these four adjustments can be seen in Appendix 6.
29
6.2 Adjustments to Claims Data to reflect Diagnosed Claims
6.2.1 Overall SDA
In Working Paper 14, the CMI calculated the SDA factor that applies to the quadrennium 1999 – 2002 data to be of the order of 15%. The 15% is an average across: • ACI and SCI • Illnesses (TPD, Deaths and Other Illnesses) • Duration since policy inception • Sex • Smoker status • Age • Distribution channels (Broker, Bancassurer, Tied) Some contributing offices have supplied data for less than the full period of investigation (i.e. not for every year from 1999 to 2002. See Appendix 2.). When estimating the SDA factor with a run-off triangle, the triangle is distorted in the first year these offices enter the experience or the final year in which they leave the experience. In their analysis, the CMI have modified the development patterns to allow for the above mentioned distortions. We took the simpler route of just calculating the SDA on the data from the group that contributed data over the whole period of investigation Group 1 in Appendix 2). This produced an overall SDA factor of 15.1%, which we felt reproduced the CMI original estimate. Table 15 shows the number of claims that were available to calculate the SDA factors in a run-off triangle.
Table 15 – Number of claims available to calculate the SDA factor
No. of claims 1999-2002 11,803 No. of claims where Diagnosis and Settlement dates are known 5,404 No. of claims where Diagnosis and Settlement dates are known for Group 1 3,066
6.2.2 Different SDA factors by Condition and Duration
Given the limited amount of data there was a practical limitation in how many subdivisions of the data separate SDA factors could be calculated for. Therefore we only calculated SDA factors for the most significant subdivisions of the data. We used GLM, a data mining product5 and our knowledge of CI to identify the most significant cohort splits. In order of importance they were: • Condition
The result of this exercise suggested calculating separate SDA factors for Deaths, TPD and the remaining other CI conditions. It seemed logical to us that Death claims are settled relatively fast and that TPD claims take a relatively long time to settle because of the need to confirm permanency of the condition. The average delays Table 16 show this clearly as do the delay patterns in Figure 2.
5 CART Pro V6.0 Data Mining Software from Salford Systems.
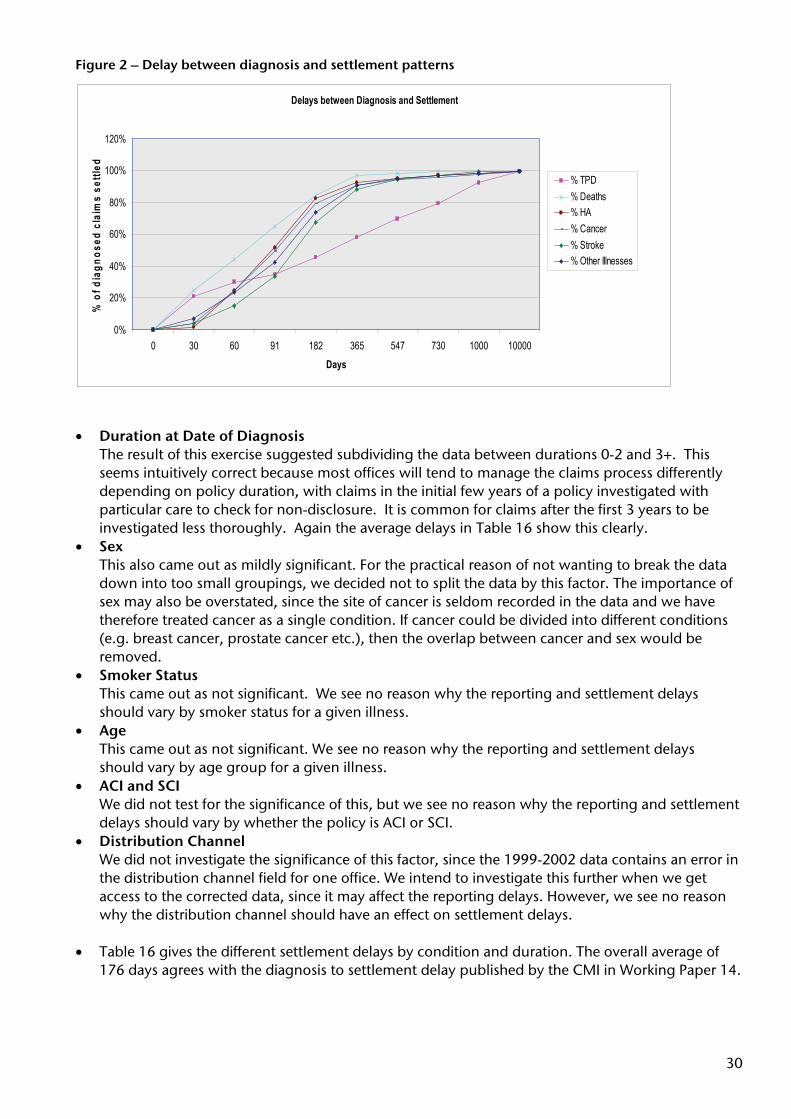
30
Figure 2 – Delay between diagnosis and settlement patterns
• Duration at Date of Diagnosis
The result of this exercise suggested subdividing the data between durations 0-2 and 3+. This seems intuitively correct because most offices will tend to manage the claims process differently depending on policy duration, with claims in the initial few years of a policy investigated with particular care to check for non-disclosure. It is common for claims after the first 3 years to be investigated less thoroughly. Again the average delays in Table 16 show this clearly.
• Sex This also came out as mildly significant. For the practical reason of not wanting to break the data down into too small groupings, we decided not to split the data by this factor. The importance of sex may also be overstated, since the site of cancer is seldom recorded in the data and we have therefore treated cancer as a single condition. If cancer could be divided into different conditions (e.g. breast cancer, prostate cancer etc.), then the overlap between cancer and sex would be removed.
• Smoker Status This came out as not significant. We see no reason why the reporting and settlement delays should vary by smoker status for a given illness.
• Age This came out as not significant. We see no reason why the reporting and settlement delays should vary by age group for a given illness.
• ACI and SCI We did not test for the significance of this, but we see no reason why the reporting and settlement delays should vary by whether the policy is ACI or SCI.
• Distribution Channel We did not investigate the significance of this factor, since the 1999-2002 data contains an error in the distribution channel field for one office. We intend to investigate this further when we get access to the corrected data, since it may affect the reporting delays. However, we see no reason why the distribution channel should have an effect on settlement delays.
• Table 16 gives the different settlement delays by condition and duration. The overall average of 176 days agrees with the diagnosis to settlement delay published by the CMI in Working Paper 14.
Delays between Diagnosis and Settlement
0%
20%
40%
60%
80%
100%
120%
0 30 60 91 182 365 547 730 1000 10000
Days
% o
f dia
gnos
ed c
laim
s se
ttled
% TPD% Deaths% HA% Cancer% Stroke% Other Illnesses

31
Table 16: Average delay between diagnosis and settlement in days for all offices by duration and condition
Condition Duration 0 - 2 Duration 3+ AverageDeaths 108 99 103Other Conditions 183 155 172TPD 651 247 409All 190 155 176
The results above suggested that we should split the data into six subgroups by condition and duration. However, we decided to use the same SDA factors for Deaths and TPD across all durations. The reasons for this decision were: • The number of claims in the TPD and Deaths cohort are too few to make up credible separate run-
off triangles • Since the SDA factor for Death claims was small and the difference in average delay by duration
Table 16) was small, we felt the difference in the two separate SDA factors would be marginal. • The main delay for TPD is due to determining the permanence of the claim and this was unlikely to
change significantly with duration. We believe the average delay in duration 0-2 (see Table 16 s a statistical fluctuation, since there are a limited number of TPD claims where the Date of Diagnosis is known.
Given this, we have split the data into four subgroups (deaths all durations, other conditions durations 0 to 2, other conditions durations 3+, TPD all durations) and created run-off triangles for each subgroup. From these subgroups we calculated the SDA factors given in Table 17.
Table 17 – Our SDA factors
Condition Duration 0 - 2 Duration 3+ AverageDeaths 4.1% 4.1% 4.1%Other Conditions
18.8% 16.0% 17.5%
TPD 25.7% 25.7% 25.7%All ACI 15.6% 13.8% 14.7%All SCI 18.9% 16.4% 17.7%All 16.0% 14.1% 15.1%6
Our calculation gives an overall figure very close to the 15% suggested by the CMI. In addition, by calculating separate factors for the main conditions and durations, we allow for the differences in settlement delay while retaining credible claim numbers. We feel that the SDA factors look sensible, since • Death claims have the smallest SDA and TPD the largest factor. This mirrors the settlement delay
pattern. • Duration 0-2 have a bigger SDA than duration 3+ for the other conditions. This agrees with our
intuition that claims personnel will investigate early duration claims more thoroughly.
6 Weighted average of the SDA factors based on the modified data in Appendix 6
32
6.3 Further Adjustments to Claims Data
6.3.1 Removal from Data of Cases with Smoker Status Unknown
For this exercise we wanted to produce rates split by smoker status and therefore we had to exclude data where the smoker status was unknown. The CMI data included a small subgroup of data where the smoker status was unknown which we removed for the purpose of this exercise. The following table shows the effect on Exposure and Claims when the uncoded smokers were removed.
Table 18 - The effect of removing uncoded smoker from Exposure and Claims
Exposure Claims All data (ACI & SCI) 7,396,748 11,803 Uncoded smokers 45,170
(0.6% of Exposure) 25
(0.2% of Claims) Remaining known smoker status 7,351,578 11,778
6.3.2 Respreading of Unknown claim cause
The data included a small number of claims where the cause of claim was unknown. We felt that the best thing to do with these claims was to respread them proportionately amongst the claims where the cause was known. From the data we saw that none of these were death claims and therefore decided that these claims should be respread amongst the CI conditions excluding death. From Appendix 6 it can be seen that 1.2% of ACI claims excluding death had an unknown claim condition and 3.7% of SCI claims had an unknown claim condition. Therefore we increased the claims with known claim cause but excluding death by 1.2% for ACI and 3.7% for SCI.
6.3.3 Adjustment for under representation
Appendix 5 shows that all the contributing offices cover the major CI conditions. However, for the other CI conditions this was not always the case especially amongst the Bancassurers. Consequently there was a mismatch between the exposure and the claims data. To correct for this we decided to gross-up the number of claims for the relevant conditions instead of trying to adjust the exposure for each condition. The CMI believe that many of less common conditions have a significant overlap with the main conditions, especially TPD. Hence they have not attempted to make any allowance for the fact that some of these less common conditions are not present in all the exposure. Whilst we accept there is an overlap with the main conditions, CIBT02 shows there is a significant residual incidence and therefore we felt it was incorrect to make no adjustment. We accept that our grossing-up is conservative, however • the adjustments are fairly small (about 0.5%) • for reserving it is better to be slightly conservative. As mentioned in Section 4.2 the ABI commissioned research into the presence of conditions in CI policies in the market. The ABI conducted this research in 1999 and again 2001. Ideally we would have liked to use the 1999 research, since it would be more representative of the inforce business between 1999 and 2002. However, only the 2001 research was available to us (Table 40 in Appendix 5).

33
From the research it was possible to estimate the under representation for a given condition with the relative exposure that each company contributed during the quadrennium. However, because the publicly available CMI data did not contain company names, we asked the CMI to calculate the relative exposure weights for us. The grossing-up factors are given in Table 40 in Appendix 5. The maximum adjustment was +38% (100% / 72.5% - 1). The increase for under representation is small compared to the overall number of claims, resulting in 55 more ACI claims out of 11,739 and 11 more SCI claims out of 1,714.
6.3.4 Removal of Claims from Non-ABI Conditions
The CIIT00 table is designed to represent the experience of a policy consisting of all the ABI’s 2002 CI conditions listed in Appendix 3 and TPD. Therefore, the claims resulting from additional illnesses that are not in the list of ABI conditions except for TPD were removed. There were 118 (1.1%) ACI claims and 44 (2.9%) SCI claims which fell into this category.
6.4 Modified Claims Data Table 41 and Table 42 in Appendix 6 show how the claims data was modified. From this it can be seen that the aggregate ACI claims changed from 10,310 to 11,739 and the aggregate SCI claims changed from 1,493 to 1,714. This is a result of the changes discussed in Sections 6.2 and 6.3.

34
7 Construction of CIIT00
7.1 Overview The new table presented in this paper is based on CIBT02(adj) reshaped to reflect the experience data from the CMI for the quadrennium 1999 – 2002. For the purpose of this paper we have named the insurance table, CIIT00. There are four tables distinguishing by sex and smoker status; CIIT00 MNS, CIIT00 MSM, CIIT00 FNS and CIIT00 FSM. The experience suggested there is a difference between the experience of ACI excluding death and SCI. We believe this is to do with the allocation of claims to death for ACI rather than to a given CI condition. If a policyholder dies before claims settlement following a CI condition but after the SCI survival period, the claim should be technically allocated to the CI condition but in practice is likely to be recorded as a death claim. We felt that this would not significantly affect the shape of the rates, hence we calculated I/P adjustments for the CI conditions based on both ACI and SCI experience. This is discussed in Section 7.2.. Each condition was categorised into one of 7 categories of claim which we felt would have a similar I/P adjustment. For each category of claim we calculated the I/P adjustment to convert the population rate into an insured CI rate which takes account of: • The effect of underwriting, • The socio-economic position of insured lives compared to the whole population. • The effect of smoking status. This is discussed in Section 7.3 together with any subsequent smoothing that was necessary. In the UK the CI experience does suggest there is some selection and we found this did vary by category of condition. This is discussed in Section 7.4 Finally, Section 7.5 discusses the production of separate rates for ACI and SCI. The rates for each condition are the same for ACI and SCI. The difference between the two sets of rates is the proportion of deaths that are included.
7.2 Data Used
7.2.1 ACI experience versus SCI experience
The CMI’s data shows the experience for SCI is significantly higher than for CI conditions (excluding deaths) for ACI. One theory for this is that ACI is often sold alongside a mortgage and therefore experiences less anti-selection from applicants. It is our opinion that this effect should be small, since both products are underwritten in the same way. We believe it has more to do with the allocation of death claims under ACI. Technically the death claims following a CI condition in the period after the end of the SCI survival period (e.g. 28 days) should be allocated to the CI condition. However, it is likely that the claim will be allocated to deaths. This is because for ACI it does not matter whether a claim is a death claim or a CI claim, therefore once the policyholder has died it is not necessary to investigate further as to whether or not it was technically a CI claim rather than a death claim.
35
7.2.2 Which data to use?
In an ideal world given the above we would not mix the ACI and SCI data to get shape and selection patterns for the CI rates. However, given the limited amount of data and the fact that we did not believe the above difference would significantly effect the shape or the select pattern, we decided to combine the data initially and only at the end calibrate the rates to obtain ACI and SCI rates which reflect the actual level of experience. In a similar vain we would have ideally liked to create smoothed select and ultimate rates using the select and ultimate experience separately. Again we did not feel the difference in shape of the select rates and ultimate rates would be significantly different and because of the limited amount of data especially in the ultimate durations we decided to combine the select and ultimate data and only at the end calibrate the rates to obtain select and ultimate rates which reflect the select and ultimate experience. Due to the lack of data at older ages (only 6 claims above age 70), we decided it was not practical to produce a set of rates for ages above 70. Even above age 60 the data is very sparse, but most term policies in the UK go to age 70 and hence we thought practitioners would prefer a table with rates up to this age.
7.3 Calculation of Raw I/P Adjustment
7.3.1 Raw I/P adjustment formula
The raw I/P adjustments for each CI condition were calculated as follows:
Equation 1
[ ]∑∑
×=
xcsx
sxc
qExpEA
,
,/θ
Where ∑ denotes the fact the raw I/P adjustments were calculated using
data grouped in some manner. sxc ,θ is the number of claims for age x and smoker status s in the CMI
experience for condition c. xc q is the rate of incidence for age x from CIBT02(adj). These rates
have no smoker status. CIBT02(adj) is CIBT02 adjusted as described in Section 4.3.2 to include rates for coma.
sxExp , is the exposure for age x and smoker status s in the CMI
experience. The I/P adjustment takes account of; • The effect of underwriting, • The socio-economic position of insured lives compared to the whole population. • Smoker status.
36
The CIBT02(adj) rates do not distinguish between smokers and non-smokers and hence the I/P adjustments do distinguish between smokers and non-smokers. The population rates in CIBT02(adj) already take account of overlap of conditions and therefore the I/P adjustment does not include any allowance for overlaps.
7.3.2 Grouped Raw I/P Adjustments
We felt the raw I/P adjustments for illnesses with similar characteristics should be of the same order because the underwriting effects, socio economic effects and smoking effects should be similar. Amongst the CI conditions we identified the following 7 categories of the conditions: 1. Cancer type conditions 2. Cardiovascular type conditions 3. Neurological type conditions 4. Accident type conditions 5. Organ failure type conditions 6. TPD 7. Death & terminal illness To test our hypothesis we calculated the overall raw I/P adjustment for each condition and for each group of conditions. Table 19 shows these raw I/P adjustments.
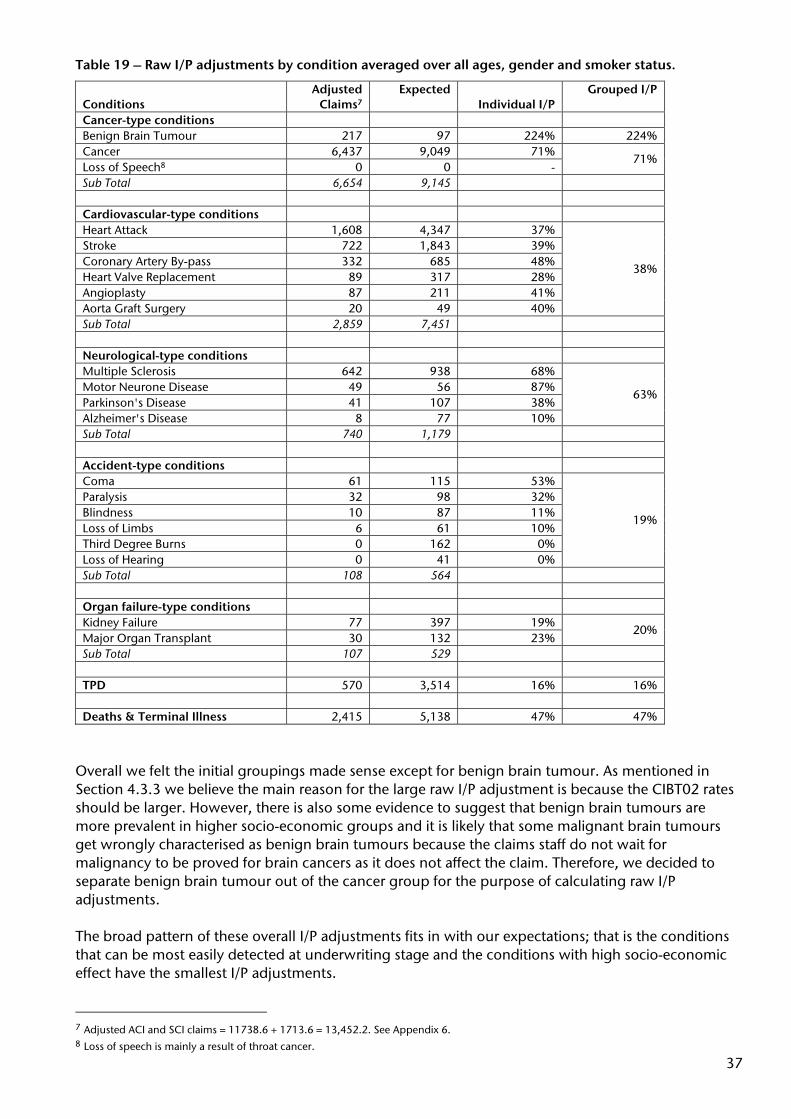
37
Table 19 – Raw I/P adjustments by condition averaged over all ages, gender and smoker status.
Conditions Adjusted
Claims7 Expected
Individual I/P Grouped I/P
Cancer-type conditions Benign Brain Tumour 217 97 224% 224% Cancer 6,437 9,049 71% Loss of Speech8 0 0 -
71%
Sub Total 6,654 9,145 Cardiovascular-type conditions Heart Attack 1,608 4,347 37% Stroke 722 1,843 39% Coronary Artery By-pass 332 685 48% Heart Valve Replacement 89 317 28% Angioplasty 87 211 41% Aorta Graft Surgery 20 49 40%
38%
Sub Total 2,859 7,451 Neurological-type conditions Multiple Sclerosis 642 938 68% Motor Neurone Disease 49 56 87% Parkinson's Disease 41 107 38% Alzheimer's Disease 8 77 10%
63%
Sub Total 740 1,179 Accident-type conditions Coma 61 115 53% Paralysis 32 98 32% Blindness 10 87 11% Loss of Limbs 6 61 10% Third Degree Burns 0 162 0% Loss of Hearing 0 41 0%
19%
Sub Total 108 564 Organ failure-type conditions Kidney Failure 77 397 19% Major Organ Transplant 30 132 23%
20%
Sub Total 107 529 TPD 570 3,514 16% 16% Deaths & Terminal Illness 2,415 5,138 47% 47%
Overall we felt the initial groupings made sense except for benign brain tumour. As mentioned in Section 4.3.3 we believe the main reason for the large raw I/P adjustment is because the CIBT02 rates should be larger. However, there is also some evidence to suggest that benign brain tumours are more prevalent in higher socio-economic groups and it is likely that some malignant brain tumours get wrongly characterised as benign brain tumours because the claims staff do not wait for malignancy to be proved for brain cancers as it does not affect the claim. Therefore, we decided to separate benign brain tumour out of the cancer group for the purpose of calculating raw I/P adjustments. The broad pattern of these overall I/P adjustments fits in with our expectations; that is the conditions that can be most easily detected at underwriting stage and the conditions with high socio-economic effect have the smallest I/P adjustments. 7 Adjusted ACI and SCI claims = 11738.6 + 1713.6 = 13,452.2. See Appendix 6. 8 Loss of speech is mainly a result of throat cancer.
38
Some further points that are worth making are: There is no loss of speech claims in the CMI data, since loss of speech is usually the result of throat cancer or a stroke. This is reflected in the CIBT02 rates being zero for all ages. Therefore, it does not matter in which of the two groupings it was added. We have placed it in the cancer type condition grouping. • The I/P adjustments for Alzheimer’s and Parkinson’s disease were low. We believe this reflects the
fact that the experience is still immature with very little exposure at older ages where these conditions are prevalent. Hence we felt it sensible to maintain the neurological-type conditions group and used the higher group I/P adjustment for Alzheimer’s and Parkinson’s.
• Anecdotally, we believe blindness, loss of limbs, third degree burns and loss of hearing are greatly
affected by occupation. Therefore one would expect a large I/P adjustment due to the underwriting out of dangerous occupations and due to socio-economic selection implicit in the insured population. Hence it is perhaps not surprising that the I/P adjustments were much lower than for coma and paralysis which do not have these effects. However, the volume of data was so small that further subdivision was not practical.
• The 47% I/P adjustment for deaths & terminal illness is consistent with the ratio of population
deaths from ELT15 (centred around 1992) to insured lives deaths from T92 of 48%.
7.3.3 Refining the Grouped Raw I/P Adjustments
For each category of condition the I/P adjustments were broken down into different levels of grouping by age, gender and smoker status depending on the amount of claims data available: • Where the condition had less than 100 male claims and 100 female claims a single I/P adjustment
regardless of age, sex and smoker status was calculated.
• Where there were more than 100 male claims or 100 female claims, then separate I/P adjustments were calculated for each sex.
• Where there were more than 100 male non-smoker claims or 100 female non-smoker claims (there were always more non-smoker claims than smoker claims), then separate I/P adjustments were calculated for sex and smoker status.
• Where there were more than 100 claims in some age groupings for the male non-smokers or female non-smokers, then separate I/P adjustments were calculated by age grouping. Age groupings with less than 100 claims were merged until they included more than 100 claims. The initial age groupings were; 0 to 30, 31 to 40, 41 to 50, 51 to 60 and 60 to 100.
7.3.4 Smoothing the raw I/P Adjustments
For the cancer, cardiovascular and deaths the raw I/P adjustments varied by age band. However, there were discontinuities at the edges of the age bands that were clearly the result of our methodology, rather than any discontinuities in the experience. We therefore decided to smooth the raw I/P adjustments. To do this we used a nine year moving average (four years before and four years after the age to be estimated), since the age groups usually cover 10 years. A summary of the final I/P adjustments is given in Appendix 8 for quinqennial ages and the average final I/P adjustments are given in Tabel 20.

39
Table 20 - Summary of Average Smooth I/P Adjustments by Conditions Group
Sex
Benign Brain
Tumour Cancer Cardiovascular Neurological Accident Organ failure TPD Deaths All
MNS 224% 69% 31% 59% 19% 20% 24% 38% 43% MSM 224% 84% 80% 91% 19% 20% 34% 78% 75% FNS 224% 71% 25% 58% 19% 20% 10% 44% 47% FSM 224% 68% 60% 76% 19% 20% 16% 92% 58%
7.3.5 Initial Rates
For each condition a set of rates was calculated by applying the smoothed I/P adjustments for the relevant category of conditions to the CITB02(adj) rates. These rates reflect the insured experience of ACI and SCI combined. Since the underlying CIBT02(adj) table is smooth and the I/P adjustments that are applied to the CIBT02(adj) rates are smooth, the resulting rates were also be smooth.
7.4 Selection Adjustments The rates from Section 7.3.5 take no account of any durational effects as a result of underwriting. All the evidence we have previously seen suggested that there is a selection effect for critical illnesses, but that it is less than on life only business (usually five years). Because death usually follows a severe illness it is relatively easy for underwriters to identify people who are likely to die in the next few years. This is not the case for CI conditions which often are at the start of the death process and hence it is harder for the underwriters to identify people who are likely to claim in the next few years. Underwriting relies on medical questionnaires, doctors’ reports and standard medical examinations. These tools are good at identifying the risks for cardiovascular conditions, but are less useful for identifying cancers and benign brain tumours. For conditions where underwriting can identify the risk factors, we expected a longer and steeper select period than for conditions that are harder to underwrite. In particular, the select period for accident-type conditions should be very small. The following list of condition types (see Section 7.3.2) reflects our view, in descending order, of where underwriting will have the biggest effect: • Deaths • TPD • Organ Failure-type conditions • Cardiovascular-type conditions • Neurological-type conditions • Cancer-type conditions • Accident-type conditions We therefore derived selection periods and discounts based on the 7 condition types, rather than on the total CIIT00 rates. For each of these condition types, we did not feel there was sufficient data to derive selection discounts by age, the calculated selection discounts are assumed to apply to all ages. Both death and cancer claims result from various causes which have differing select patterns. The mix of these causes varies greatly by sex and smoker status and therefore we expected the select patterns to be affected by sex and smoker status. Therefore, for these two condition types we have calculated select periods and discounts that vary by sex and smoker status. For the remaining conditions we saw no reasons why for a given condition the select pattern would vary by sex and smoker status.

40
For each grouping of data the A/Es were calculated for durations 0, 1, 2, 3, 4, 1+, 2+, 3+, 4+ and 5+9. In the UK it is accepted that the select pattern for mortality is 5 years, therefore for the reasons explained in the first paragraph on this Section we did not investigate any longer select periods. We chose the select period by inspecting the A/Es by eye. The initial rates from Section 7.3.5 were then adjusted by the ultimate A/E so that these adjusted rates represented the ultimate experience. For the select durations the A/E’s were then recalibrated to give the following select discounts:
Table 21 – Select discounts and select period for each condition type
Condition Sex / Smoker 0 1 2 Ultimate Deaths MNS 23.0% 18.4% 15.4% - MSM 16.1% 13.3% - - FNS 22.7% 22.7% - - FSM 16.2% 12.0% - - TPD All 77.9% 47.7% 15.8% - Organ Failure All 45.0% 42.1% 7.7% - Cardiovascular All 22.4% 4.5% - - Neurological All 48.9% - - - Benign Brain Tumour All 26.9% - -
-
Cancer MNS 17.2% - - - MSM 13.9% - - - FNS 5.0% - - - FSM 5.0% - - - Accident All 0.0% - - -
The experience did reflect our initial hypothesis about which condition types had the biggest select pattern outlined in the third paragraph of this Section. We believe the reason that the deaths do not have a longer select period is because they are non-CI deaths. Non-CI deaths are likely to have a different select pattern to CI deaths and they will have a different select pattern to all deaths (non-CI deaths plus CI deaths). The select rates for the “All Conditions” table in Appendix 1 are the combination of the select rates for the individual conditions. The relative contribution from different conditions change with age and the select pattern therefore also changes with age. The following table gives a rough indication of the average select discounts for the “All Conditions” ACI and SCI tables:
Table 22 - Approximate Select Discounts for the "All Conditions" ACI CIIT00 table
ACI Select Discounts 0 1 2MNS 24.7% 9.0% 5.0%MSM 21.8% 8.0% 0.7%FNS 17.2% 6.3% 1.0%FSM 19.3% 6.8% 1.3%
9 Duration 5+ indicates the grouping of all durations 5 and greater.
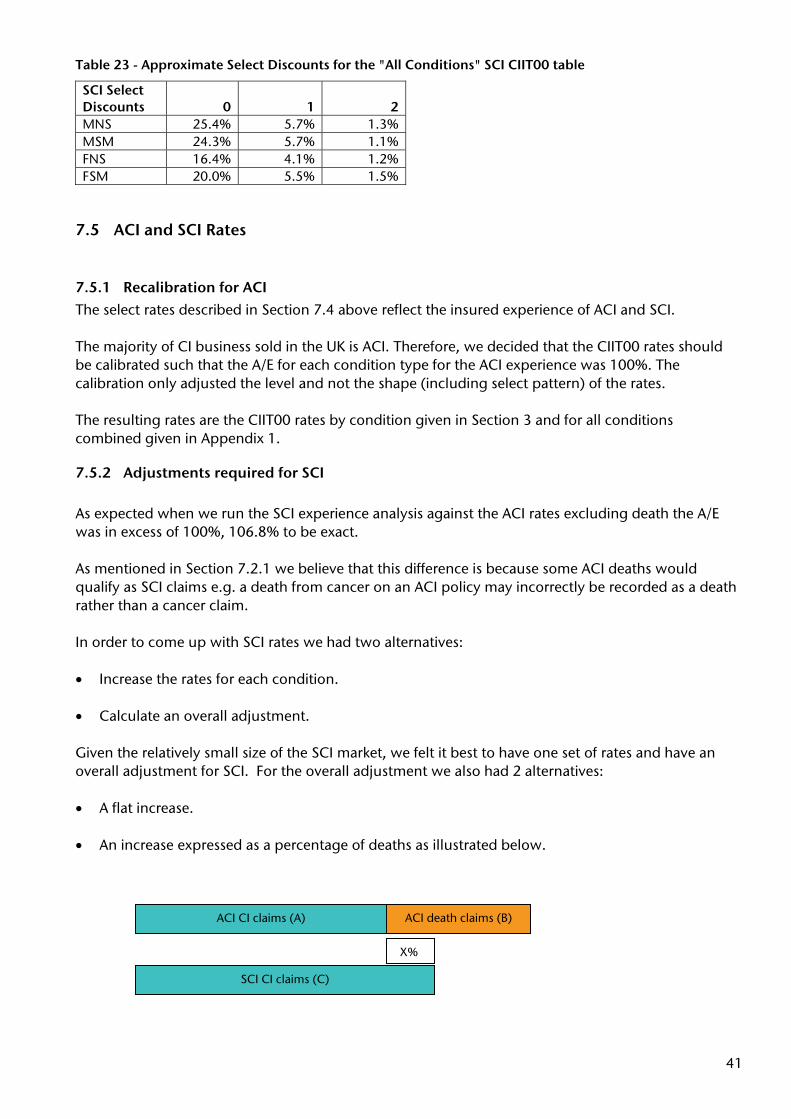
41
Table 23 - Approximate Select Discounts for the "All Conditions" SCI CIIT00 table
SCI Select Discounts 0 1 2MNS 25.4% 5.7% 1.3%MSM 24.3% 5.7% 1.1%FNS 16.4% 4.1% 1.2%FSM 20.0% 5.5% 1.5%
7.5 ACI and SCI Rates
7.5.1 Recalibration for ACI
The select rates described in Section 7.4 above reflect the insured experience of ACI and SCI. The majority of CI business sold in the UK is ACI. Therefore, we decided that the CIIT00 rates should be calibrated such that the A/E for each condition type for the ACI experience was 100%. The calibration only adjusted the level and not the shape (including select pattern) of the rates. The resulting rates are the CIIT00 rates by condition given in Section 3 and for all conditions combined given in Appendix 1.
7.5.2 Adjustments required for SCI
As expected when we run the SCI experience analysis against the ACI rates excluding death the A/E was in excess of 100%, 106.8% to be exact. As mentioned in Section 7.2.1 we believe that this difference is because some ACI deaths would qualify as SCI claims e.g. a death from cancer on an ACI policy may incorrectly be recorded as a death rather than a cancer claim. In order to come up with SCI rates we had two alternatives: • Increase the rates for each condition.
• Calculate an overall adjustment. Given the relatively small size of the SCI market, we felt it best to have one set of rates and have an overall adjustment for SCI. For the overall adjustment we also had 2 alternatives: • A flat increase.
• An increase expressed as a percentage of deaths as illustrated below.
ACI CI claims (A)
SCI CI claims (C)
ACI death claims (B)
X%

42
The problem with the first alternative is that it is possible for SCI rates to be larger than ACI rates. This clearly makes no sense. Therefore we went for the second alternative. The x% was derived from the following equation:
%.%.%.
AB
AC 426
925861 ==⎟
⎠⎞
⎜⎝⎛
⎟⎠⎞
⎜⎝⎛ −
Hence the rates constructed using the ACI rates excluding deaths plus 26.4% of the death rates reflect the SCI experience. The combined SCI rates are given in Appendix 1.

43
8 Goodness of Fit
8.1 Overview Having developed CIIT00, we back-tested it against the CMI 1999-2002 data and against other sources to make sure that it provided a reasonable fit. We were more concerned that the shape of the rates looked reasonable than the overall level, because if the shape of the rates is correct most companies will have sufficient experience to get a fairly credible measure of their overall level of experience. Given the relatively high claims rate, companies accumulate a significant volume of CI experience relatively quickly. In addition, different companies will have different levels of experience depending on sales channel, underwriting and claims standards. Using the tests described in Section 8.2 we did the following goodness of fit tests on the ACI tables: 1. Compared the goodness of fit of the CIIT00 tables (all conditions) against the CMI 1999-2002 data
adjusted as described in Section 6. This is described in Section 8.3. 2. Compared the goodness of fit of the CIIT00 tables at an individual conditions level against the CMI
1999-2002 data adjusted as described in Section 6. This is described in Section 8.4. 3. Compared the goodness of fit of the CIIT00 tables (all conditions) against the experience from a
few major UK clients (anonymised). This is described in Section 8.5. For the SCI table we were only able to test the goodness of fit for all conditions together against the CMI 1999-2002 data adjusted as described in Section 6 (See Section 8.3.2) because: • We did not allocate the proportion of ACI deaths to individual conditions. • We did not have sufficient SCI experience from UK clients. In all of the goodness of fit tests we have tested the null hypothesis at the 99% level. We thought this was reasonable, since we tested individual illnesses while I/P adjustments were determined at a grouped level. We have treated individual ages as credible cohorts. However, where the Expected number of claims in a cohort was less than five, we grouped it with the adjacent age until the Expected exceeded five in all cohorts. To independently check our A/Es for the 1999-2002 data, we asked the CMI to run CIIT00 against their unadjusted data. The CMI intends to run CIIT00 against the 2003 and 2004 data at a later stage now that the data is available.
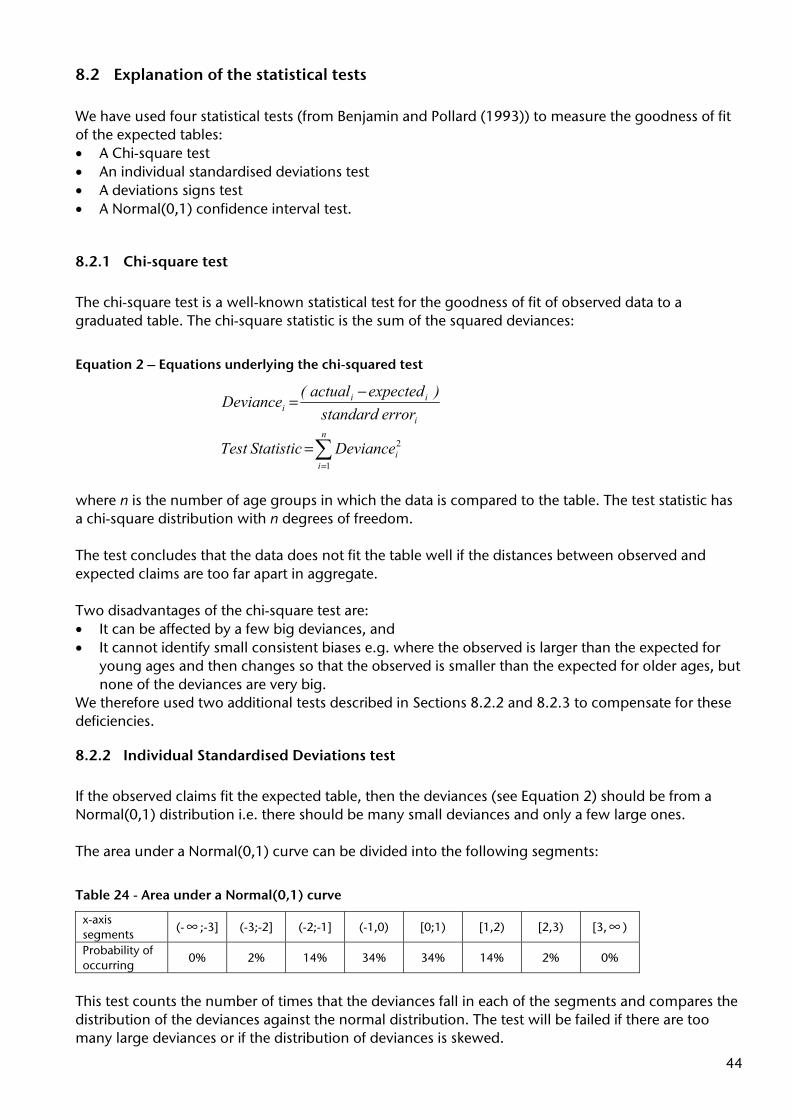
44
8.2 Explanation of the statistical tests We have used four statistical tests (from Benjamin and Pollard (1993)) to measure the goodness of fit of the expected tables: • A Chi-square test • An individual standardised deviations test • A deviations signs test • A Normal(0,1) confidence interval test.
8.2.1 Chi-square test
The chi-square test is a well-known statistical test for the goodness of fit of observed data to a graduated table. The chi-square statistic is the sum of the squared deviances:
Equation 2 – Equations underlying the chi-squared test
i
iii errordardtans
)ectedexpactual(Deviance
−=
∑=
=n
iiDevianceStatisticTest
1
2
where n is the number of age groups in which the data is compared to the table. The test statistic has a chi-square distribution with n degrees of freedom. The test concludes that the data does not fit the table well if the distances between observed and expected claims are too far apart in aggregate. Two disadvantages of the chi-square test are: • It can be affected by a few big deviances, and • It cannot identify small consistent biases e.g. where the observed is larger than the expected for
young ages and then changes so that the observed is smaller than the expected for older ages, but none of the deviances are very big.
We therefore used two additional tests described in Sections 8.2.2 and 8.2.3 to compensate for these deficiencies.
8.2.2 Individual Standardised Deviations test
If the observed claims fit the expected table, then the deviances (see Equation 2) should be from a Normal(0,1) distribution i.e. there should be many small deviances and only a few large ones. The area under a Normal(0,1) curve can be divided into the following segments:
Table 24 - Area under a Normal(0,1) curve
x-axis segments
(- ∞ ;-3] (-3;-2] (-2;-1] (-1,0) [0;1) [1,2) [2,3) [3, ∞ )
Probability of occurring
0% 2% 14% 34% 34% 14% 2% 0%
This test counts the number of times that the deviances fall in each of the segments and compares the distribution of the deviances against the normal distribution. The test will be failed if there are too many large deviances or if the distribution of deviances is skewed.
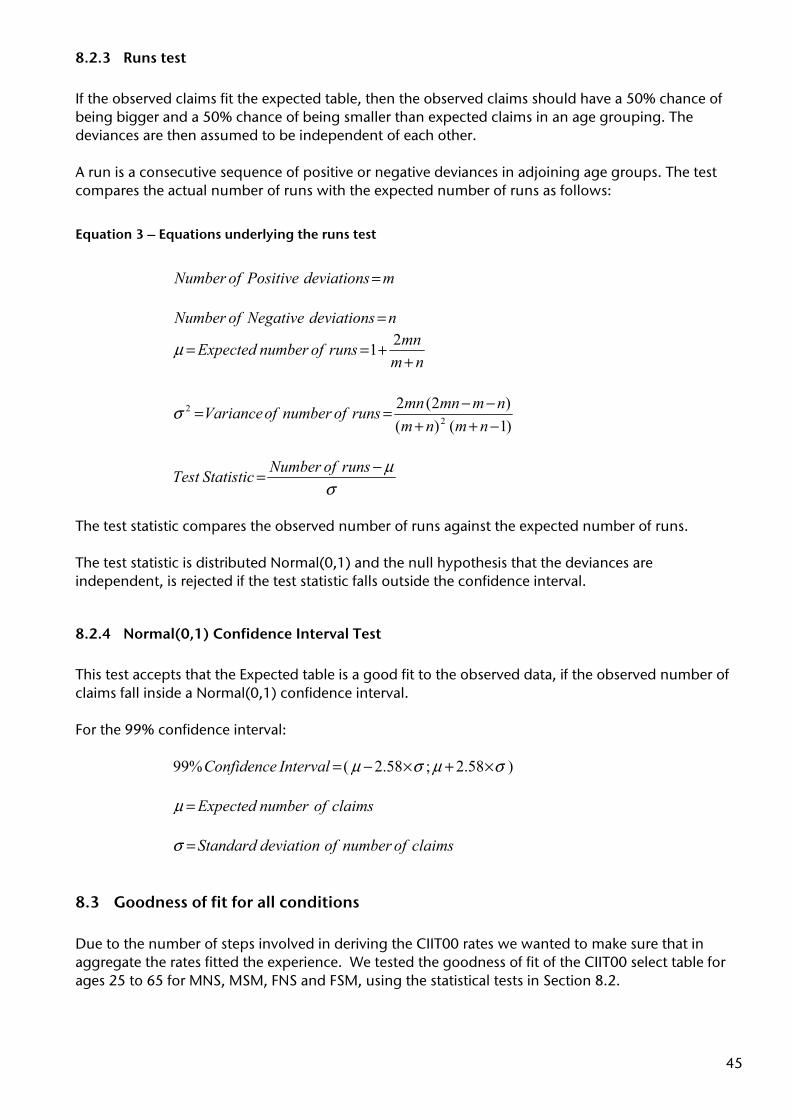
45
8.2.3 Runs test
If the observed claims fit the expected table, then the observed claims should have a 50% chance of being bigger and a 50% chance of being smaller than expected claims in an age grouping. The deviances are then assumed to be independent of each other. A run is a consecutive sequence of positive or negative deviances in adjoining age groups. The test compares the actual number of runs with the expected number of runs as follows:
Equation 3 – Equations underlying the runs test
mdeviationsPositiveofNumber = ndeviationsNegativeofNumber =
nmmnrunsofnumberExpected+
+== 21μ
)1()()2(2
22
−++−−==nmnmnmmnmnrunsofnumberofVarianceσ
σμ−= runsofNumberStatisticTest
The test statistic compares the observed number of runs against the expected number of runs. The test statistic is distributed Normal(0,1) and the null hypothesis that the deviances are independent, is rejected if the test statistic falls outside the confidence interval.
8.2.4 Normal(0,1) Confidence Interval Test
This test accepts that the Expected table is a good fit to the observed data, if the observed number of claims fall inside a Normal(0,1) confidence interval. For the 99% confidence interval:
)58.2;58.2(%99 σμσμ ×+×−=IntervalConfidence
claimsofnumberExpected=μ claimsofnumberofdeviationdardtanS=σ
8.3 Goodness of fit for all conditions Due to the number of steps involved in deriving the CIIT00 rates we wanted to make sure that in aggregate the rates fitted the experience. We tested the goodness of fit of the CIIT00 select table for ages 25 to 65 for MNS, MSM, FNS and FSM, using the statistical tests in Section 8.2.
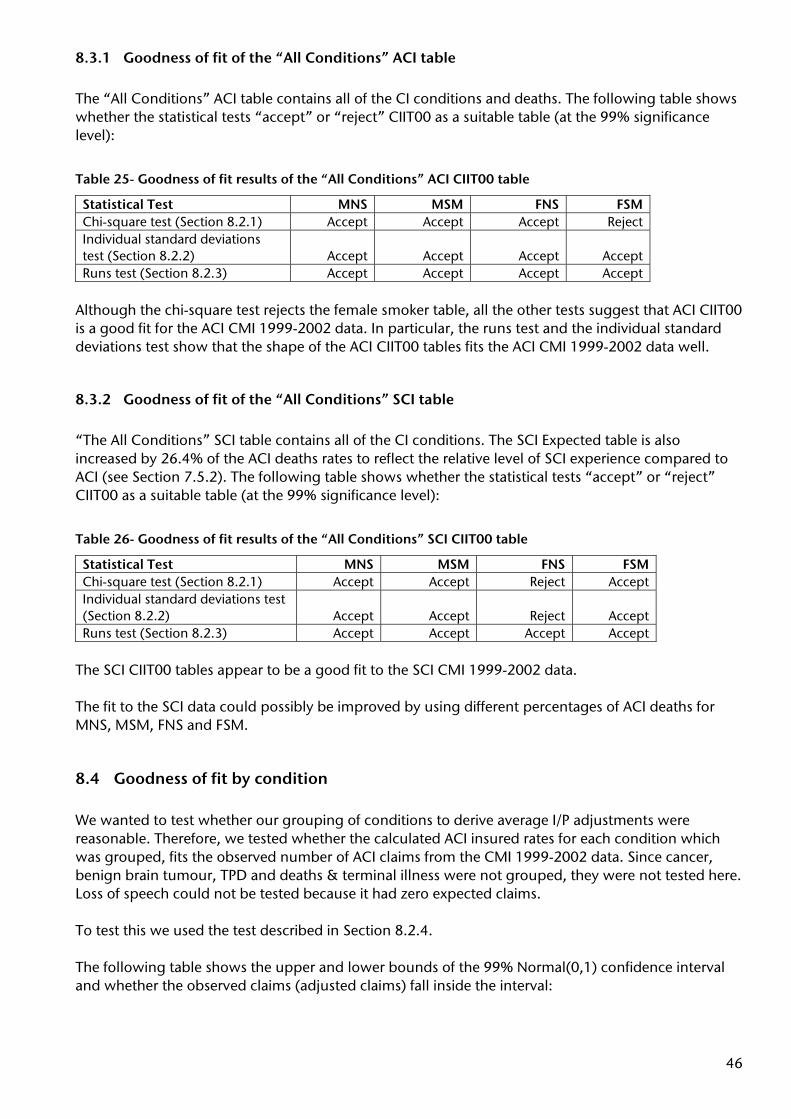
46
8.3.1 Goodness of fit of the “All Conditions” ACI table
The “All Conditions” ACI table contains all of the CI conditions and deaths. The following table shows whether the statistical tests “accept” or “reject” CIIT00 as a suitable table (at the 99% significance level):
Table 25- Goodness of fit results of the “All Conditions” ACI CIIT00 table
Statistical Test MNS MSM FNS FSM Chi-square test (Section 8.2.1) Accept Accept Accept Reject Individual standard deviations test (Section 8.2.2) Accept Accept Accept Accept Runs test (Section 8.2.3) Accept Accept Accept Accept
Although the chi-square test rejects the female smoker table, all the other tests suggest that ACI CIIT00 is a good fit for the ACI CMI 1999-2002 data. In particular, the runs test and the individual standard deviations test show that the shape of the ACI CIIT00 tables fits the ACI CMI 1999-2002 data well.
8.3.2 Goodness of fit of the “All Conditions” SCI table
“The All Conditions” SCI table contains all of the CI conditions. The SCI Expected table is also increased by 26.4% of the ACI deaths rates to reflect the relative level of SCI experience compared to ACI (see Section 7.5.2). The following table shows whether the statistical tests “accept” or “reject” CIIT00 as a suitable table (at the 99% significance level):
Table 26- Goodness of fit results of the “All Conditions” SCI CIIT00 table
Statistical Test MNS MSM FNS FSM Chi-square test (Section 8.2.1) Accept Accept Reject Accept Individual standard deviations test (Section 8.2.2) Accept Accept Reject Accept Runs test (Section 8.2.3) Accept Accept Accept Accept
The SCI CIIT00 tables appear to be a good fit to the SCI CMI 1999-2002 data. The fit to the SCI data could possibly be improved by using different percentages of ACI deaths for MNS, MSM, FNS and FSM.
8.4 Goodness of fit by condition We wanted to test whether our grouping of conditions to derive average I/P adjustments were reasonable. Therefore, we tested whether the calculated ACI insured rates for each condition which was grouped, fits the observed number of ACI claims from the CMI 1999-2002 data. Since cancer, benign brain tumour, TPD and deaths & terminal illness were not grouped, they were not tested here. Loss of speech could not be tested because it had zero expected claims. To test this we used the test described in Section 8.2.4. The following table shows the upper and lower bounds of the 99% Normal(0,1) confidence interval and whether the observed claims (adjusted claims) fall inside the interval:

47
Table 27 - Goodness of Fit on ACI CIIT00 rates by Condition
ACI Conditions Raw ACI
Claims
Adjusted ACI
Claims Expected
on CIIT00 A/E SE10
0.5% Lower
bound11
99.5% Upper bound
Goodness of Fit
Cardiovascular-types Heart Attack 1,157 1,375 1,430 96% 38 1,333 1,527 Accept Stroke 525 624 570 109% 24 508 631 Accept Coronary Artery By-pass 229 271 237 114% 15 198 277 Accept Heart Valve Replacement 60 74 98 75% 10 73 124 Accept Angioplasty 45 64 71 90% 8 49 92 Accept Aorta Graft Surgery 9 15 16 91% 4 6 27 Accept All 2,025 2,422 2,422 100% Neurogolical-types Multiple Sclerosis 465 553 498 111% 22 441 556 Accept Motor Neurone Disease 30 36 30 118% 5 16 44 Accept Parkinson’s Disease 19 31 57 54% 8 38 77 Reject Alzheimer’s Disease 5 8 41 19% 6 25 58 Reject All 519 627 627 100% Accident types: Coma 39 53 19 289% 4 7 30 Reject Paralysis 19 26 16 164% 4 6 26 Accept Blindness 5 7 14 48% 4 4 24 Accept Loss of Limbs 4 5 10 49% 3 2 18 Accept Third Degree Burns 0 0 26 0% 5 13 39 Reject Deafness 0 0 7 0% 3 0 13 Accept All 67 91 91 100% Organ Failure-types Kidney Failure 59 70 75 93% 9 53 97 Accept Major Organ Transplant 25 30 25 120% 5 12 38 Accept All 84 100 100 100%
The adjusted claims fall inside the 99% confidence interval for 14 of the 18 grouped conditions. We believe that the data unrepresents Alzheimer’s and Parkinson’s claims and this was reflect in the CIIT00 rates, therefore it is not surprising that these conditions failed the test. Only coma and third degree burns are unexpectedly outside the confidence intervals. This points to the fact that the comment regarding the two levels of I/P for accident type conditions may be correct. However, given the claims volumes we did not review this further.
8.5 Goodness of fit for “All Conditions” ACI table against anonymised client data The CMI 1999-2002 data is not ideal in two respects: • It relates to a time period that is five years ago, and • The data is collected on a claims settled basis. Data from clients are more recent and often have the diagnosis and notified dates filled in. In order to test the shape and level of the CIIT00 table, we have compared the CIIT00 table against anonymised client data. We have used two IFA offices and two bancassurers. Tabel 28 gives the A/Es for the anonymised clients:
10 SE = Expected ^ 0.5 11 0.5% Lower bound = Expected – 2.58 x SE and 99.5% Upper bound = Expected + 2.58 x SE
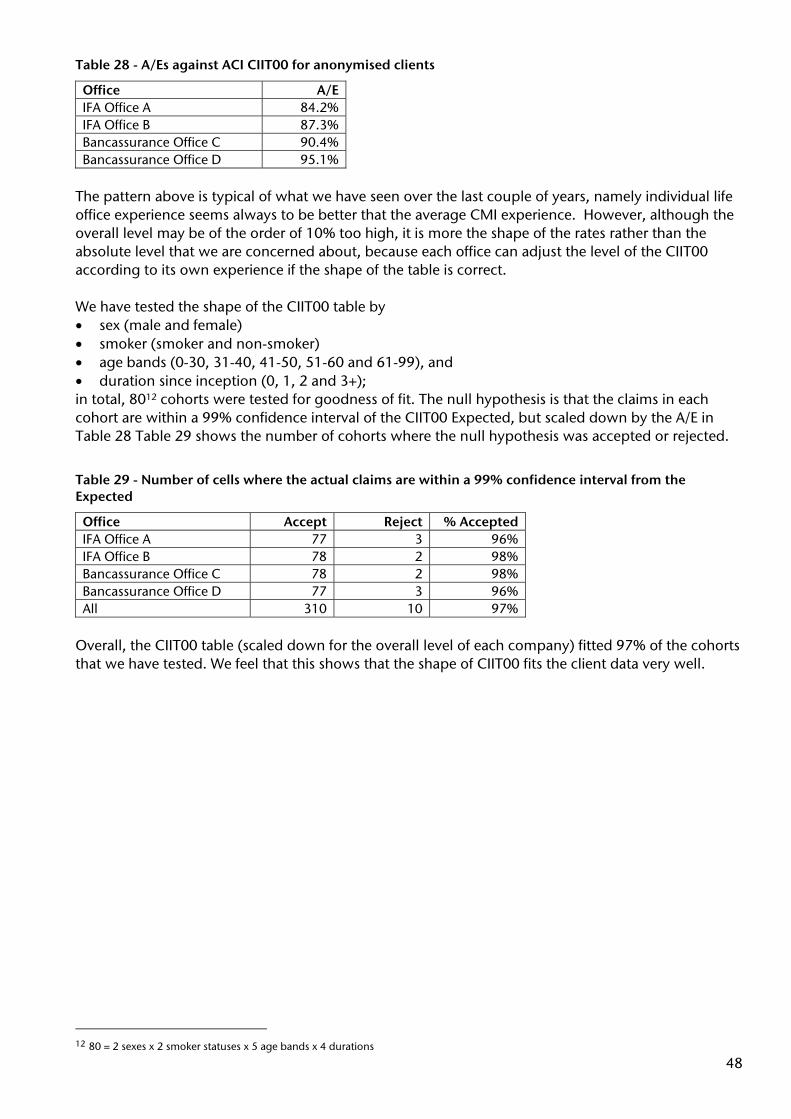
48
Table 28 - A/Es against ACI CIIT00 for anonymised clients
Office A/EIFA Office A 84.2%IFA Office B 87.3%Bancassurance Office C 90.4%Bancassurance Office D 95.1%
The pattern above is typical of what we have seen over the last couple of years, namely individual life office experience seems always to be better that the average CMI experience. However, although the overall level may be of the order of 10% too high, it is more the shape of the rates rather than the absolute level that we are concerned about, because each office can adjust the level of the CIIT00 according to its own experience if the shape of the table is correct. We have tested the shape of the CIIT00 table by • sex (male and female) • smoker (smoker and non-smoker) • age bands (0-30, 31-40, 41-50, 51-60 and 61-99), and • duration since inception (0, 1, 2 and 3+); in total, 8012 cohorts were tested for goodness of fit. The null hypothesis is that the claims in each cohort are within a 99% confidence interval of the CIIT00 Expected, but scaled down by the A/E in Table 28 Table 29 shows the number of cohorts where the null hypothesis was accepted or rejected.
Table 29 - Number of cells where the actual claims are within a 99% confidence interval from the Expected
Office Accept Reject % AcceptedIFA Office A 77 3 96%IFA Office B 78 2 98%Bancassurance Office C 78 2 98%Bancassurance Office D 77 3 96%All 310 10 97%
Overall, the CIIT00 table (scaled down for the overall level of each company) fitted 97% of the cohorts that we have tested. We feel that this shows that the shape of CIIT00 fits the client data very well.
12 80 = 2 sexes x 2 smoker statuses x 5 age bands x 4 durations
49
9 Points to note about CIIT00
9.1 Age Definition CIIT00 is has been derived on a lives basis for ACI. The rates are annual rates that apply from the exact ages shown in the tables.
9.2 Overall Level We have observed that the experience of companies we deal with is consistently below 100%, this is shown in Section 8.5. All things being equal we would expect a distribution of experiences around 100%. One possible reason may be that the SDA factor of 15% is on the high side. Another reason may be due to the large number of policies and claims with sum insured below £10,000 that have terrible experience13. If we ignore these policies the CMI experience reduces from 100% to 90.3%. This looks more reasonable when considered against the anonymised client experience shown in Section 8.5. It is possible that these policies come from a particular portfolio and we believe that the CMI should investigate the source of these claims more thoroughly.
9.3 Different Definitions The CMI experience includes three tranches of business with differing definitions; the pre April 1999 policies which had non-standardised definitions, the April 1999 to April 2002 policies which used the 1999 standardised definitions and the post April 2002 policies which used the 2002 standardised definitions. Therefore, we did ask ourselves how relevant this experience is for deriving a table which will be used to analyse the current in-force business which will have a very different mix of definitions. We believe that in most cases the changes in the definitions will have only produced marginal differences in experience. Hence although this is not perfect we believe the derived rates are satisfactory. Obviously as the experience matures we will be able to refine the experience to include only underwriting periods after the introduction of the standard ABI CI definitions which will allow more homogeneity in the data.
13 There are 1,114 claims with sum assured less or equal to £10,000 out of 11,803 claims

50
9.4 Date of Diagnosis For 44% of the claims the date of diagnosis has been estimated using the average claim delay present in the 56% of claims (see Table 6). This has two drawbacks: • It implicitly assumes that the claim delay patterns in the claims with date of diagnosis is the same
as the claim delay patterns in the claims without date of diagnosis. Given that the two sets of claims may come from different life office portfolios this may not be true.
• Even assuming the claim delay patterns are the same, using an average instead of a distribution
means that for some cases the actual date of diagnosis is significantly different. Although there are these clear drawbacks, we felt it was better to use 100% of the data but include date estimates, than only use 56% of the data. The CMI has actively encouraged companies to record the date of diagnosis and we are told that in the 2004 data about 75% of claims now have date of diagnosis.
9.5 Using CIIT00 for Experience Analysis Clearly for a company to do robust experience analysis it needs to record date of diagnosis and be able to correctly allocate claims by date of diagnosis within the experience analysis. In these circumstances the company does not need to calculate an SDA adjustment, but it needs to calculate an IBNR adjustment and an adjustment to pending claims. Given the delays mentioned in Section 5.2, these two adjustments can be quite significant. In addition many companies will have policies which cover more than the 22 conditions covered by CIIT00. Our belief is that most of these conditions will only have a marginal effect on the experience and therefore CIIT00 would still offer a fairly good estimate of the experience. Alternatively it should be possible to derive the appropriate insured rates for any additional condition by using population statistics and the appropriate I/P adjustment derived in this paper.
9.6 Applicability of CIIT00 for the 2006 ABI Definitions
9.6.1 Troponins
The 2002 ABI definitions introduced the use of troponins to identify heart attack claims and since 2005, troponins have become the predominant method for determining a heart attack. As a result the number of cases of heart attack has risen dramatically (by the order of 30%) as this more sensitive diagnostic test identifies heart attacks which previously would not have been classified as heart attack. The 2006 ABI definitions restrict the number of heart attacks which qualify for claim by introducing a severity level on the troponin measure. We believe this may reduce the number of heart attack claims but are unsure how this will work in practice, because the troponin level is not always recorded by the hospital and therefore the claim evidence may only show whether or not there was an increase in the troponin level.
51
9.6.2 ABI Increases Scope of Cancer Definition
Late last year the ABI announced that essential thrombocythaemia and polycythaemia rubra vera fulfil the cancer definition and therefore should be paid out as Cancer claims. We believe the ABI has misunderstood the medical evidence, because it is clear that not all forms of these conditions are malignant. They have compounded this mistake by making this apply to all previous ABI definitions. We estimate this will increase Cancer claims by about 1.5%. So for claims experience going forward, Cancer claims will increase regardless of the generation of definition.
9.7 Child CI Most CI policies in the UK include Child CI in their coverage. This is not covered in CIIT00 because it is not in the CMI experience. In fact it is very difficult to do an experience analysis for Child CI, because the number of children is not recorded (even if it were to be recorded at commencement it is likely to change) and it is therefore not possible to calculate the exposure per policy. For example, a policyholder with no children has less exposure than a policyholder with 3 children.
9.8 The TPD definition The SoBP in Appendix 3 does not include a TPD claims definition. Individual offices therefore draw up their own definitions for TPD. The TPD definitions can broadly be grouped into the following three groups: • Own Occupation definition: The claimant is unable to perform the material and substantial duties
of his own occupation, and is likely to remain so permanently. • Suited Occupation definition: The claimant is unable to perform his own occupation and any
occupation for which he is suitably trained, educated or experienced. • Activities of Daily Living definition: The claimant is unable to routinely perform a set of everyday
activities e.g. walking, bending, reading or writing, without the help of another person, but with reasonable assistive aids such as walking sticks or reading glasses.
The TPD definition is only fulfilled once the disability has been confirmed as total and permanent. This is often not fully understood by the claimant and has resulted in very high claim repudiation rates on TPD. TPD is not an illness per se, but rather a “catch-all” condition that pays out on debilitating illnesses or accidents that are not explicitly named in the policy conditions. The “Own Occupation” definition provides the highest level of cover and is used by offices that sell their products in the competitive IFA market. The “Activities of Daily Living” definition provides the least cover and is often used by offices that sell through a single tied salesforce such as bancassurers. The CMI contributing offices are a mixture of IFA offices and bancassurers and the TPD claims have therefore resulted from different TPD definitions. The TPD rate in CIIT00 is therefore an average rate for the market, rather than a rate that corresponds to a specific claims definition. We considered adjusting the TPD rate to reflect an “Own Occupation” definition, but that would not be appropriate for other TPD definitions and the adjustment would be very subjective. In our opinion, the CIIT00 TPD rate is equivalent to approximately 90% of an “Own Occupation” TPD rate.
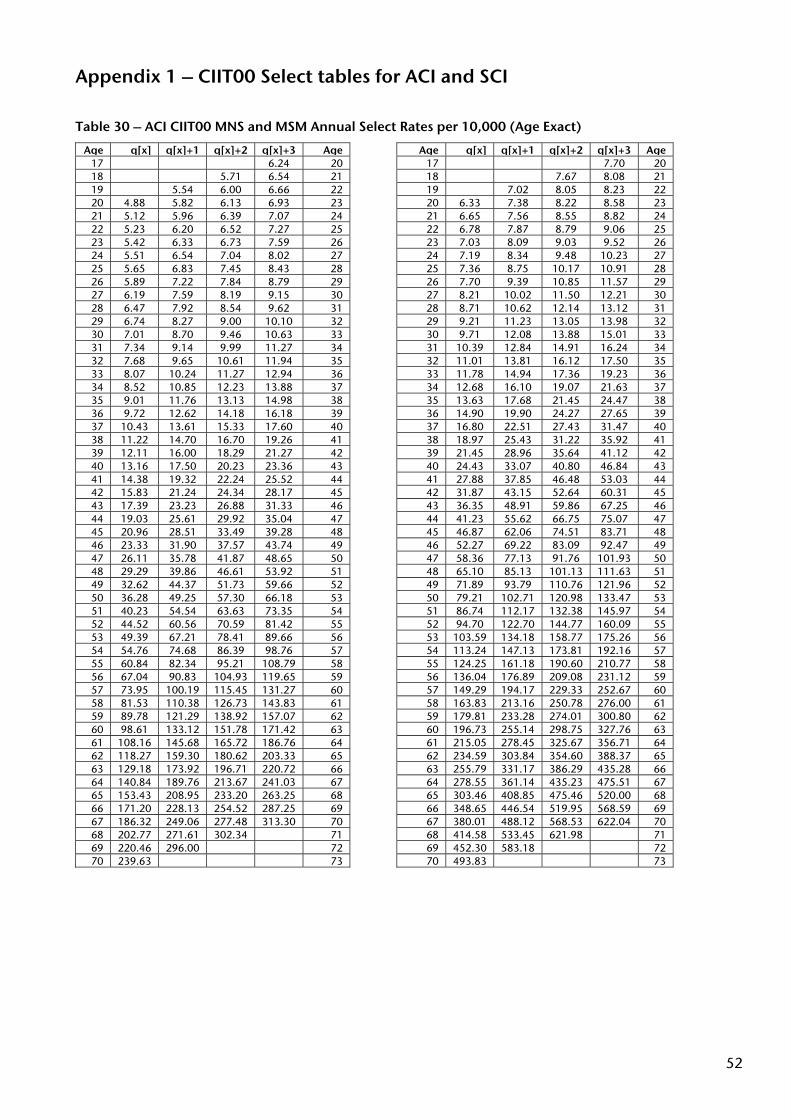
52
Appendix 1 – CIIT00 Select tables for ACI and SCI
Table 30 – ACI CIIT00 MNS and MSM Annual Select Rates per 10,000 (Age Exact)
Age q[x] q[x]+1 q[x]+2 q[x]+3 Age Age q[x] q[x]+1 q[x]+2 q[x]+3 Age17 6.24 20 17 7.70 2018 5.71 6.54 21 18 7.67 8.08 2119 5.54 6.00 6.66 22 19 7.02 8.05 8.23 2220 4.88 5.82 6.13 6.93 23 20 6.33 7.38 8.22 8.58 2321 5.12 5.96 6.39 7.07 24 21 6.65 7.56 8.55 8.82 2422 5.23 6.20 6.52 7.27 25 22 6.78 7.87 8.79 9.06 2523 5.42 6.33 6.73 7.59 26 23 7.03 8.09 9.03 9.52 2624 5.51 6.54 7.04 8.02 27 24 7.19 8.34 9.48 10.23 2725 5.65 6.83 7.45 8.43 28 25 7.36 8.75 10.17 10.91 2826 5.89 7.22 7.84 8.79 29 26 7.70 9.39 10.85 11.57 2927 6.19 7.59 8.19 9.15 30 27 8.21 10.02 11.50 12.21 3028 6.47 7.92 8.54 9.62 31 28 8.71 10.62 12.14 13.12 3129 6.74 8.27 9.00 10.10 32 29 9.21 11.23 13.05 13.98 3230 7.01 8.70 9.46 10.63 33 30 9.71 12.08 13.88 15.01 3331 7.34 9.14 9.99 11.27 34 31 10.39 12.84 14.91 16.24 3432 7.68 9.65 10.61 11.94 35 32 11.01 13.81 16.12 17.50 3533 8.07 10.24 11.27 12.94 36 33 11.78 14.94 17.36 19.23 3634 8.52 10.85 12.23 13.88 37 34 12.68 16.10 19.07 21.63 3735 9.01 11.76 13.13 14.98 38 35 13.63 17.68 21.45 24.47 3836 9.72 12.62 14.18 16.18 39 36 14.90 19.90 24.27 27.65 3937 10.43 13.61 15.33 17.60 40 37 16.80 22.51 27.43 31.47 4038 11.22 14.70 16.70 19.26 41 38 18.97 25.43 31.22 35.92 4139 12.11 16.00 18.29 21.27 42 39 21.45 28.96 35.64 41.12 4240 13.16 17.50 20.23 23.36 43 40 24.43 33.07 40.80 46.84 4341 14.38 19.32 22.24 25.52 44 41 27.88 37.85 46.48 53.03 4442 15.83 21.24 24.34 28.17 45 42 31.87 43.15 52.64 60.31 4543 17.39 23.23 26.88 31.33 46 43 36.35 48.91 59.86 67.25 4644 19.03 25.61 29.92 35.04 47 44 41.23 55.62 66.75 75.07 4745 20.96 28.51 33.49 39.28 48 45 46.87 62.06 74.51 83.71 4846 23.33 31.90 37.57 43.74 49 46 52.27 69.22 83.09 92.47 4947 26.11 35.78 41.87 48.65 50 47 58.36 77.13 91.76 101.93 5048 29.29 39.86 46.61 53.92 51 48 65.10 85.13 101.13 111.63 5149 32.62 44.37 51.73 59.66 52 49 71.89 93.79 110.76 121.96 5250 36.28 49.25 57.30 66.18 53 50 79.21 102.71 120.98 133.47 5351 40.23 54.54 63.63 73.35 54 51 86.74 112.17 132.38 145.97 5452 44.52 60.56 70.59 81.42 55 52 94.70 122.70 144.77 160.09 5553 49.39 67.21 78.41 89.66 56 53 103.59 134.18 158.77 175.26 5654 54.76 74.68 86.39 98.76 57 54 113.24 147.13 173.81 192.16 5755 60.84 82.34 95.21 108.79 58 55 124.25 161.18 190.60 210.77 5856 67.04 90.83 104.93 119.65 59 56 136.04 176.89 209.08 231.12 5957 73.95 100.19 115.45 131.27 60 57 149.29 194.17 229.33 252.67 6058 81.53 110.38 126.73 143.83 61 58 163.83 213.16 250.78 276.00 6159 89.78 121.29 138.92 157.07 62 59 179.81 233.28 274.01 300.80 6260 98.61 133.12 151.78 171.42 63 60 196.73 255.14 298.75 327.76 6361 108.16 145.68 165.72 186.76 64 61 215.05 278.45 325.67 356.71 6462 118.27 159.30 180.62 203.33 65 62 234.59 303.84 354.60 388.37 6563 129.18 173.92 196.71 220.72 66 63 255.79 331.17 386.29 435.28 6664 140.84 189.76 213.67 241.03 67 64 278.55 361.14 435.23 475.51 6765 153.43 208.95 233.20 263.25 68 65 303.46 408.85 475.46 520.00 6866 171.20 228.13 254.52 287.25 69 66 348.65 446.54 519.95 568.59 6967 186.32 249.06 277.48 313.30 70 67 380.01 488.12 568.53 622.04 7068 202.77 271.61 302.34 71 68 414.58 533.45 621.98 7169 220.46 296.00 72 69 452.30 583.18 7270 239.63 73 70 493.83 73
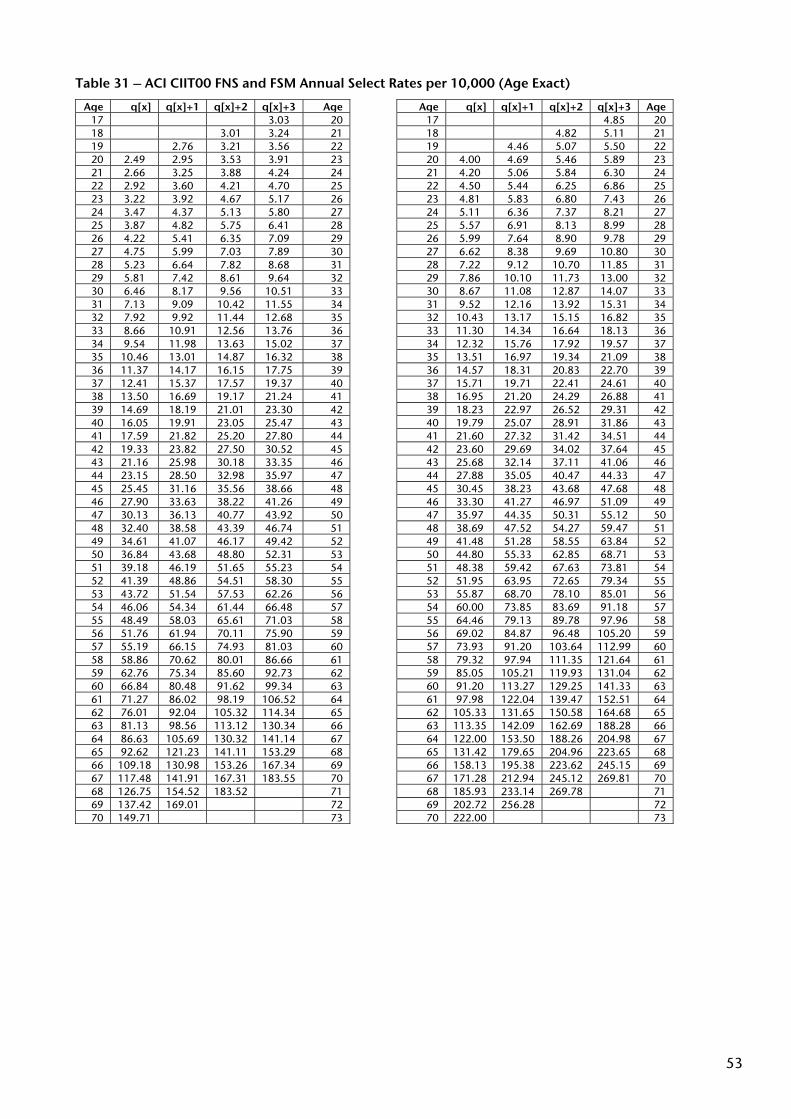
53
Table 31 – ACI CIIT00 FNS and FSM Annual Select Rates per 10,000 (Age Exact)
Age q[x] q[x]+1 q[x]+2 q[x]+3 Age Age q[x] q[x]+1 q[x]+2 q[x]+3 Age17 3.03 20 17 4.85 2018 3.01 3.24 21 18 4.82 5.11 2119 2.76 3.21 3.56 22 19 4.46 5.07 5.50 2220 2.49 2.95 3.53 3.91 23 20 4.00 4.69 5.46 5.89 2321 2.66 3.25 3.88 4.24 24 21 4.20 5.06 5.84 6.30 2422 2.92 3.60 4.21 4.70 25 22 4.50 5.44 6.25 6.86 2523 3.22 3.92 4.67 5.17 26 23 4.81 5.83 6.80 7.43 2624 3.47 4.37 5.13 5.80 27 24 5.11 6.36 7.37 8.21 2725 3.87 4.82 5.75 6.41 28 25 5.57 6.91 8.13 8.99 2826 4.22 5.41 6.35 7.09 29 26 5.99 7.64 8.90 9.78 2927 4.75 5.99 7.03 7.89 30 27 6.62 8.38 9.69 10.80 3028 5.23 6.64 7.82 8.68 31 28 7.22 9.12 10.70 11.85 3129 5.81 7.42 8.61 9.64 32 29 7.86 10.10 11.73 13.00 3230 6.46 8.17 9.56 10.51 33 30 8.67 11.08 12.87 14.07 3331 7.13 9.09 10.42 11.55 34 31 9.52 12.16 13.92 15.31 3432 7.92 9.92 11.44 12.68 35 32 10.43 13.17 15.15 16.82 3533 8.66 10.91 12.56 13.76 36 33 11.30 14.34 16.64 18.13 3634 9.54 11.98 13.63 15.02 37 34 12.32 15.76 17.92 19.57 3735 10.46 13.01 14.87 16.32 38 35 13.51 16.97 19.34 21.09 3836 11.37 14.17 16.15 17.75 39 36 14.57 18.31 20.83 22.70 3937 12.41 15.37 17.57 19.37 40 37 15.71 19.71 22.41 24.61 4038 13.50 16.69 19.17 21.24 41 38 16.95 21.20 24.29 26.88 4139 14.69 18.19 21.01 23.30 42 39 18.23 22.97 26.52 29.31 4240 16.05 19.91 23.05 25.47 43 40 19.79 25.07 28.91 31.86 4341 17.59 21.82 25.20 27.80 44 41 21.60 27.32 31.42 34.51 4442 19.33 23.82 27.50 30.52 45 42 23.60 29.69 34.02 37.64 4543 21.16 25.98 30.18 33.35 46 43 25.68 32.14 37.11 41.06 4644 23.15 28.50 32.98 35.97 47 44 27.88 35.05 40.47 44.33 4745 25.45 31.16 35.56 38.66 48 45 30.45 38.23 43.68 47.68 4846 27.90 33.63 38.22 41.26 49 46 33.30 41.27 46.97 51.09 4947 30.13 36.13 40.77 43.92 50 47 35.97 44.35 50.31 55.12 5048 32.40 38.58 43.39 46.74 51 48 38.69 47.52 54.27 59.47 5149 34.61 41.07 46.17 49.42 52 49 41.48 51.28 58.55 63.84 5250 36.84 43.68 48.80 52.31 53 50 44.80 55.33 62.85 68.71 5351 39.18 46.19 51.65 55.23 54 51 48.38 59.42 67.63 73.81 5452 41.39 48.86 54.51 58.30 55 52 51.95 63.95 72.65 79.34 5553 43.72 51.54 57.53 62.26 56 53 55.87 68.70 78.10 85.01 5654 46.06 54.34 61.44 66.48 57 54 60.00 73.85 83.69 91.18 5755 48.49 58.03 65.61 71.03 58 55 64.46 79.13 89.78 97.96 5856 51.76 61.94 70.11 75.90 59 56 69.02 84.87 96.48 105.20 5957 55.19 66.15 74.93 81.03 60 57 73.93 91.20 103.64 112.99 6058 58.86 70.62 80.01 86.66 61 58 79.32 97.94 111.35 121.64 6159 62.76 75.34 85.60 92.73 62 59 85.05 105.21 119.93 131.04 6260 66.84 80.48 91.62 99.34 63 60 91.20 113.27 129.25 141.33 6361 71.27 86.02 98.19 106.52 64 61 97.98 122.04 139.47 152.51 6462 76.01 92.04 105.32 114.34 65 62 105.33 131.65 150.58 164.68 6563 81.13 98.56 113.12 130.34 66 63 113.35 142.09 162.69 188.28 6664 86.63 105.69 130.32 141.14 67 64 122.00 153.50 188.26 204.98 6765 92.62 121.23 141.11 153.29 68 65 131.42 179.65 204.96 223.65 6866 109.18 130.98 153.26 167.34 69 66 158.13 195.38 223.62 245.15 6967 117.48 141.91 167.31 183.55 70 67 171.28 212.94 245.12 269.81 7068 126.75 154.52 183.52 71 68 185.93 233.14 269.78 7169 137.42 169.01 72 69 202.72 256.28 7270 149.71 73 70 222.00 73
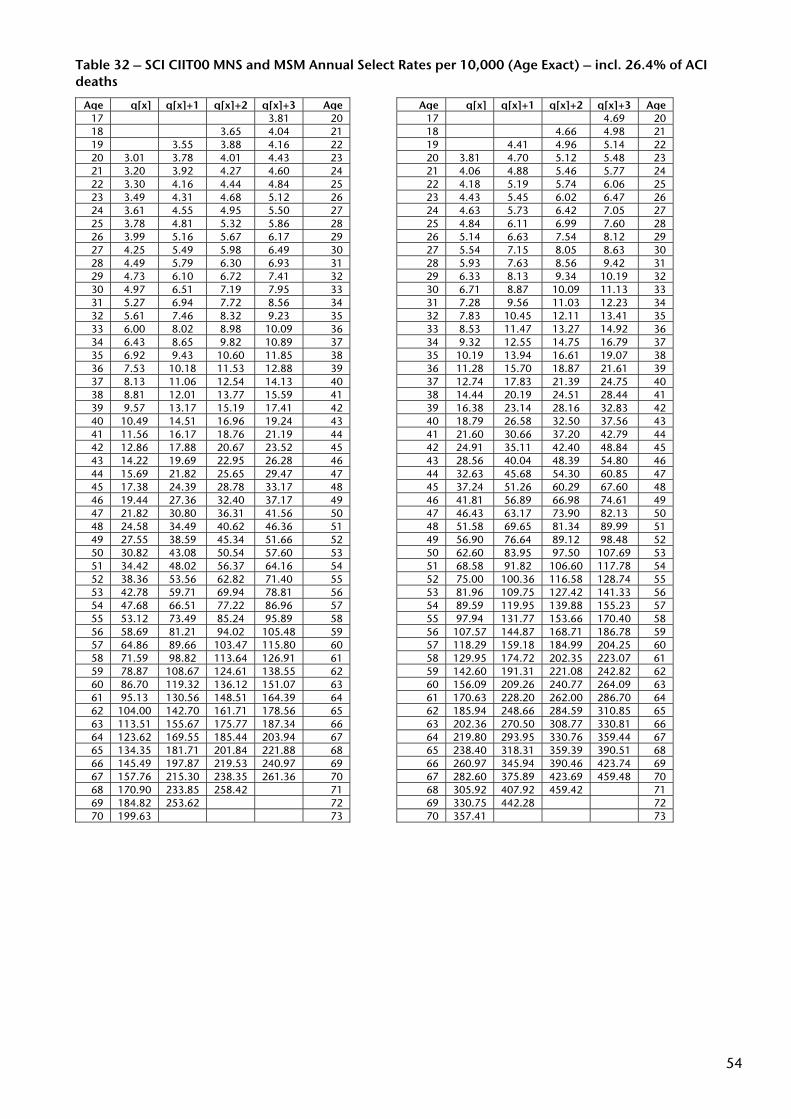
54
Table 32 – SCI CIIT00 MNS and MSM Annual Select Rates per 10,000 (Age Exact) – incl. 26.4% of ACI deaths
Age q[x] q[x]+1 q[x]+2 q[x]+3 Age Age q[x] q[x]+1 q[x]+2 q[x]+3 Age17 3.81 20 17 4.69 2018 3.65 4.04 21 18 4.66 4.98 2119 3.55 3.88 4.16 22 19 4.41 4.96 5.14 2220 3.01 3.78 4.01 4.43 23 20 3.81 4.70 5.12 5.48 2321 3.20 3.92 4.27 4.60 24 21 4.06 4.88 5.46 5.77 2422 3.30 4.16 4.44 4.84 25 22 4.18 5.19 5.74 6.06 2523 3.49 4.31 4.68 5.12 26 23 4.43 5.45 6.02 6.47 2624 3.61 4.55 4.95 5.50 27 24 4.63 5.73 6.42 7.05 2725 3.78 4.81 5.32 5.86 28 25 4.84 6.11 6.99 7.60 2826 3.99 5.16 5.67 6.17 29 26 5.14 6.63 7.54 8.12 2927 4.25 5.49 5.98 6.49 30 27 5.54 7.15 8.05 8.63 3028 4.49 5.79 6.30 6.93 31 28 5.93 7.63 8.56 9.42 3129 4.73 6.10 6.72 7.41 32 29 6.33 8.13 9.34 10.19 3230 4.97 6.51 7.19 7.95 33 30 6.71 8.87 10.09 11.13 3331 5.27 6.94 7.72 8.56 34 31 7.28 9.56 11.03 12.23 3432 5.61 7.46 8.32 9.23 35 32 7.83 10.45 12.11 13.41 3533 6.00 8.02 8.98 10.09 36 33 8.53 11.47 13.27 14.92 3634 6.43 8.65 9.82 10.89 37 34 9.32 12.55 14.75 16.79 3735 6.92 9.43 10.60 11.85 38 35 10.19 13.94 16.61 19.07 3836 7.53 10.18 11.53 12.88 39 36 11.28 15.70 18.87 21.61 3937 8.13 11.06 12.54 14.13 40 37 12.74 17.83 21.39 24.75 4038 8.81 12.01 13.77 15.59 41 38 14.44 20.19 24.51 28.44 4139 9.57 13.17 15.19 17.41 42 39 16.38 23.14 28.16 32.83 4240 10.49 14.51 16.96 19.24 43 40 18.79 26.58 32.50 37.56 4341 11.56 16.17 18.76 21.19 44 41 21.60 30.66 37.20 42.79 4442 12.86 17.88 20.67 23.52 45 42 24.91 35.11 42.40 48.84 4543 14.22 19.69 22.95 26.28 46 43 28.56 40.04 48.39 54.80 4644 15.69 21.82 25.65 29.47 47 44 32.63 45.68 54.30 60.85 4745 17.38 24.39 28.78 33.17 48 45 37.24 51.26 60.29 67.60 4846 19.44 27.36 32.40 37.17 49 46 41.81 56.89 66.98 74.61 4947 21.82 30.80 36.31 41.56 50 47 46.43 63.17 73.90 82.13 5048 24.58 34.49 40.62 46.36 51 48 51.58 69.65 81.34 89.99 5149 27.55 38.59 45.34 51.66 52 49 56.90 76.64 89.12 98.48 5250 30.82 43.08 50.54 57.60 53 50 62.60 83.95 97.50 107.69 5351 34.42 48.02 56.37 64.16 54 51 68.58 91.82 106.60 117.78 5452 38.36 53.56 62.82 71.40 55 52 75.00 100.36 116.58 128.74 5553 42.78 59.71 69.94 78.81 56 53 81.96 109.75 127.42 141.33 5654 47.68 66.51 77.22 86.96 57 54 89.59 119.95 139.88 155.23 5755 53.12 73.49 85.24 95.89 58 55 97.94 131.77 153.66 170.40 5856 58.69 81.21 94.02 105.48 59 56 107.57 144.87 168.71 186.78 5957 64.86 89.66 103.47 115.80 60 57 118.29 159.18 184.99 204.25 6058 71.59 98.82 113.64 126.91 61 58 129.95 174.72 202.35 223.07 6159 78.87 108.67 124.61 138.55 62 59 142.60 191.31 221.08 242.82 6260 86.70 119.32 136.12 151.07 63 60 156.09 209.26 240.77 264.09 6361 95.13 130.56 148.51 164.39 64 61 170.63 228.20 262.00 286.70 6462 104.00 142.70 161.71 178.56 65 62 185.94 248.66 284.59 310.85 6563 113.51 155.67 175.77 187.34 66 63 202.36 270.50 308.77 330.81 6664 123.62 169.55 185.44 203.94 67 64 219.80 293.95 330.76 359.44 6765 134.35 181.71 201.84 221.88 68 65 238.40 318.31 359.39 390.51 6866 145.49 197.87 219.53 240.97 69 66 260.97 345.94 390.46 423.74 6967 157.76 215.30 238.35 261.36 70 67 282.60 375.89 423.69 459.48 7068 170.90 233.85 258.42 71 68 305.92 407.92 459.42 7169 184.82 253.62 72 69 330.75 442.28 7270 199.63 73 70 357.41 73
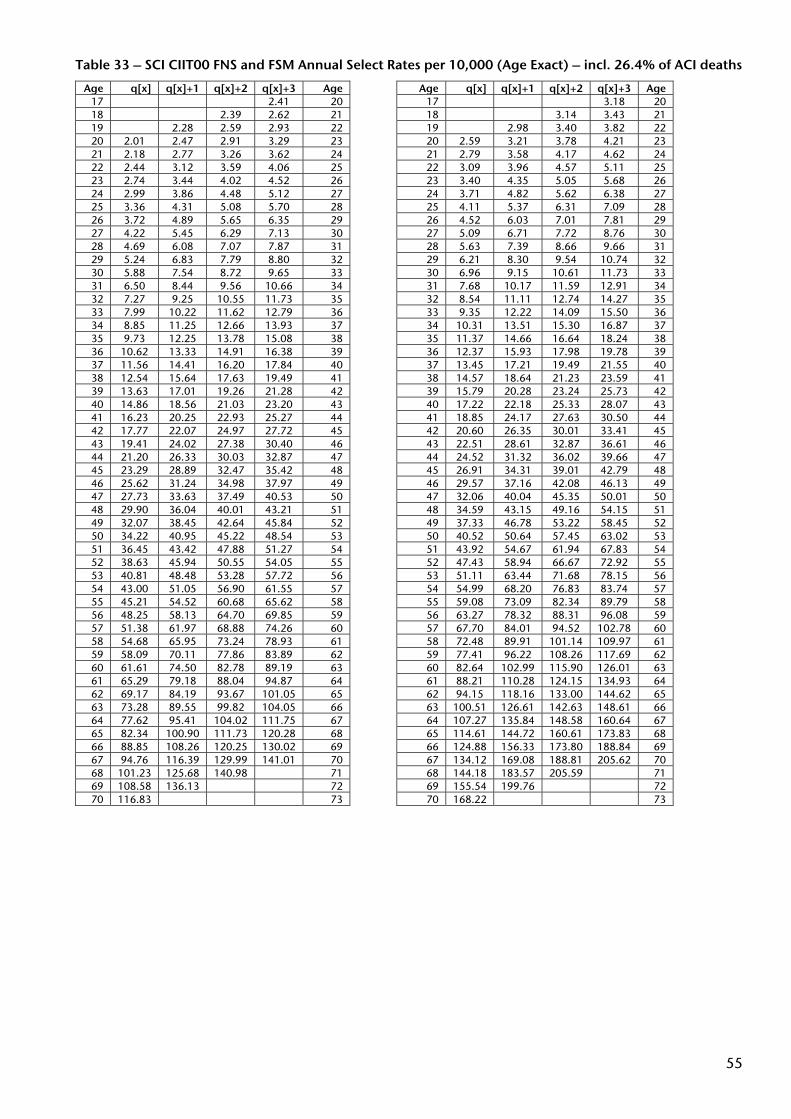
55
Table 33 – SCI CIIT00 FNS and FSM Annual Select Rates per 10,000 (Age Exact) – incl. 26.4% of ACI deaths
Age q[x] q[x]+1 q[x]+2 q[x]+3 Age Age q[x] q[x]+1 q[x]+2 q[x]+3 Age17 2.41 20 17 3.18 2018 2.39 2.62 21 18 3.14 3.43 2119 2.28 2.59 2.93 22 19 2.98 3.40 3.82 2220 2.01 2.47 2.91 3.29 23 20 2.59 3.21 3.78 4.21 2321 2.18 2.77 3.26 3.62 24 21 2.79 3.58 4.17 4.62 2422 2.44 3.12 3.59 4.06 25 22 3.09 3.96 4.57 5.11 2523 2.74 3.44 4.02 4.52 26 23 3.40 4.35 5.05 5.68 2624 2.99 3.86 4.48 5.12 27 24 3.71 4.82 5.62 6.38 2725 3.36 4.31 5.08 5.70 28 25 4.11 5.37 6.31 7.09 2826 3.72 4.89 5.65 6.35 29 26 4.52 6.03 7.01 7.81 2927 4.22 5.45 6.29 7.13 30 27 5.09 6.71 7.72 8.76 3028 4.69 6.08 7.07 7.87 31 28 5.63 7.39 8.66 9.66 3129 5.24 6.83 7.79 8.80 32 29 6.21 8.30 9.54 10.74 3230 5.88 7.54 8.72 9.65 33 30 6.96 9.15 10.61 11.73 3331 6.50 8.44 9.56 10.66 34 31 7.68 10.17 11.59 12.91 3432 7.27 9.25 10.55 11.73 35 32 8.54 11.11 12.74 14.27 3533 7.99 10.22 11.62 12.79 36 33 9.35 12.22 14.09 15.50 3634 8.85 11.25 12.66 13.93 37 34 10.31 13.51 15.30 16.87 3735 9.73 12.25 13.78 15.08 38 35 11.37 14.66 16.64 18.24 3836 10.62 13.33 14.91 16.38 39 36 12.37 15.93 17.98 19.78 3937 11.56 14.41 16.20 17.84 40 37 13.45 17.21 19.49 21.55 4038 12.54 15.64 17.63 19.49 41 38 14.57 18.64 21.23 23.59 4139 13.63 17.01 19.26 21.28 42 39 15.79 20.28 23.24 25.73 4240 14.86 18.56 21.03 23.20 43 40 17.22 22.18 25.33 28.07 4341 16.23 20.25 22.93 25.27 44 41 18.85 24.17 27.63 30.50 4442 17.77 22.07 24.97 27.72 45 42 20.60 26.35 30.01 33.41 4543 19.41 24.02 27.38 30.40 46 43 22.51 28.61 32.87 36.61 4644 21.20 26.33 30.03 32.87 47 44 24.52 31.32 36.02 39.66 4745 23.29 28.89 32.47 35.42 48 45 26.91 34.31 39.01 42.79 4846 25.62 31.24 34.98 37.97 49 46 29.57 37.16 42.08 46.13 4947 27.73 33.63 37.49 40.53 50 47 32.06 40.04 45.35 50.01 5048 29.90 36.04 40.01 43.21 51 48 34.59 43.15 49.16 54.15 5149 32.07 38.45 42.64 45.84 52 49 37.33 46.78 53.22 58.45 5250 34.22 40.95 45.22 48.54 53 50 40.52 50.64 57.45 63.02 5351 36.45 43.42 47.88 51.27 54 51 43.92 54.67 61.94 67.83 5452 38.63 45.94 50.55 54.05 55 52 47.43 58.94 66.67 72.92 5553 40.81 48.48 53.28 57.72 56 53 51.11 63.44 71.68 78.15 5654 43.00 51.05 56.90 61.55 57 54 54.99 68.20 76.83 83.74 5755 45.21 54.52 60.68 65.62 58 55 59.08 73.09 82.34 89.79 5856 48.25 58.13 64.70 69.85 59 56 63.27 78.32 88.31 96.08 5957 51.38 61.97 68.88 74.26 60 57 67.70 84.01 94.52 102.78 6058 54.68 65.95 73.24 78.93 61 58 72.48 89.91 101.14 109.97 6159 58.09 70.11 77.86 83.89 62 59 77.41 96.22 108.26 117.69 6260 61.61 74.50 82.78 89.19 63 60 82.64 102.99 115.90 126.01 6361 65.29 79.18 88.04 94.87 64 61 88.21 110.28 124.15 134.93 6462 69.17 84.19 93.67 101.05 65 62 94.15 118.16 133.00 144.62 6563 73.28 89.55 99.82 104.05 66 63 100.51 126.61 142.63 148.61 6664 77.62 95.41 104.02 111.75 67 64 107.27 135.84 148.58 160.64 6765 82.34 100.90 111.73 120.28 68 65 114.61 144.72 160.61 173.83 6866 88.85 108.26 120.25 130.02 69 66 124.88 156.33 173.80 188.84 6967 94.76 116.39 129.99 141.01 70 67 134.12 169.08 188.81 205.62 7068 101.23 125.68 140.98 71 68 144.18 183.57 205.59 7169 108.58 136.13 72 69 155.54 199.76 7270 116.83 73 70 168.22 73
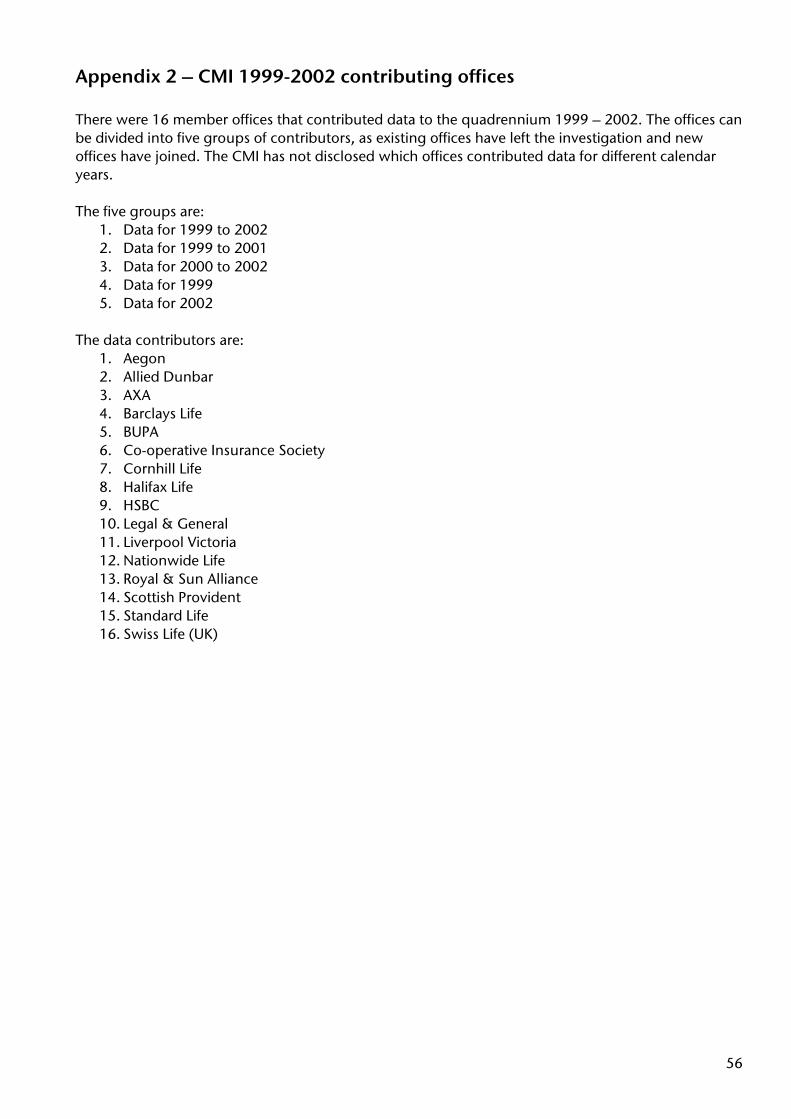
56
Appendix 2 – CMI 1999-2002 contributing offices There were 16 member offices that contributed data to the quadrennium 1999 – 2002. The offices can be divided into five groups of contributors, as existing offices have left the investigation and new offices have joined. The CMI has not disclosed which offices contributed data for different calendar years. The five groups are:
1. Data for 1999 to 2002 2. Data for 1999 to 2001 3. Data for 2000 to 2002 4. Data for 1999 5. Data for 2002
The data contributors are:
1. Aegon 2. Allied Dunbar 3. AXA 4. Barclays Life 5. BUPA 6. Co-operative Insurance Society 7. Cornhill Life 8. Halifax Life 9. HSBC 10. Legal & General 11. Liverpool Victoria 12. Nationwide Life 13. Royal & Sun Alliance 14. Scottish Provident 15. Standard Life 16. Swiss Life (UK)
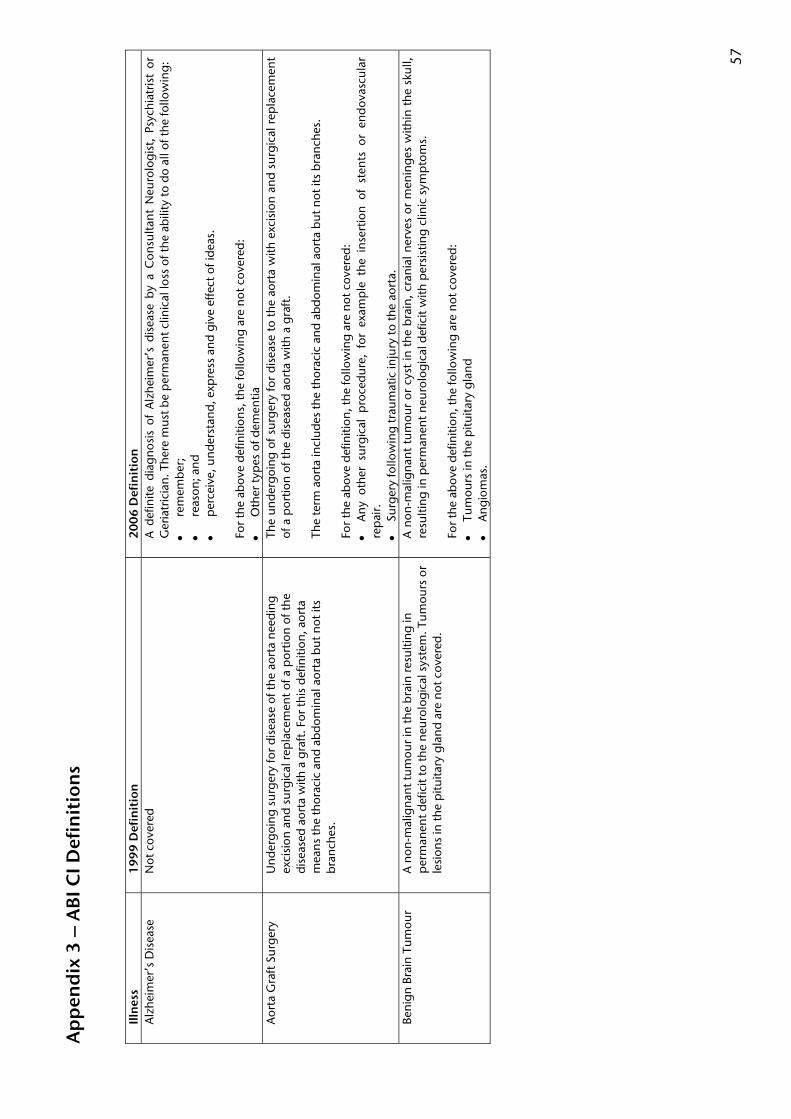
57
Ap
pen
dix
3 –
AB
I CI D
efin
itio
ns
Ill
nes
s 19
99
Def
init
ion
20
06
Def
init
ion
A
lzhe
imer
’s D
isea
se
Not
cov
ered
A
def
inite
dia
gnos
is o
f A
lzhe
imer
’s d
isea
se b
y a
Con
sulta
nt N
euro
logi
st,
Psyc
hiat
rist
or
Ger
iatr
icia
n. T
here
mus
t be
per
man
ent c
linic
al lo
ss o
f the
abi
lity
to d
o al
l of t
he fo
llow
ing:
•
rem
emb
er;
• re
ason
; and
•
per
ceiv
e, u
nder
stan
d, e
xpre
ss a
nd g
ive
effe
ct o
f ide
as.
For
the
abov
e de
finiti
ons,
the
follo
win
g ar
e no
t cov
ered
: •
Oth
er ty
pes
of d
emen
tia
Aor
ta G
raft
Sur
gery
U
nder
goin
g su
rger
y fo
r di
seas
e of
the
aort
a ne
edin
g ex
cisi
on a
nd s
urg
ical
rep
lace
men
t of
a p
ortio
n of
the
dise
ased
aor
ta w
ith a
gra
ft. F
or th
is d
efin
ition
, aor
ta
mea
ns th
e th
orac
ic a
nd a
bdom
inal
aor
ta b
ut n
ot it
s br
anch
es.
The
unde
rgoi
ng
of s
urge
ry fo
r di
seas
e to
the
aor
ta w
ith e
xcis
ion
and
surg
ical
rep
lace
men
t of
a p
ortio
n of
the
dis
ease
d ao
rta
with
a g
raft
. Th
e te
rm a
orta
incl
udes
the
thor
acic
and
abd
omin
al a
orta
but
not
its
bran
ches
. Fo
r th
e ab
ove
defin
ition
, the
follo
win
g ar
e no
t cov
ered
: •
Any
oth
er s
urgi
cal
pro
cedu
re,
for
exam
ple
the
ins
ertio
n of
ste
nts
or e
ndov
ascu
lar
rep
air.
•
Surg
ery
follo
win
g tr
aum
atic
inju
ry to
the
aort
a.
Beni
gn B
rain
Tum
our
A n
on-m
alig
nant
tum
our
in th
e br
ain
resu
lting
in
per
man
ent d
efic
it to
the
neur
olog
ical
sys
tem
. Tum
ours
or
lesi
ons
in th
e p
ituita
ry g
land
are
not
cov
ered
.
A n
on-m
alig
nant
tum
our
or c
yst
in t
he b
rain
, cra
nial
ner
ves
or m
enin
ges
with
in t
he s
kull,
re
sulti
ng in
per
man
ent n
euro
logi
cal d
efic
it w
ith p
ersi
stin
g cl
inic
sym
pto
ms.
Fo
r th
e ab
ove
defin
ition
, the
follo
win
g ar
e no
t cov
ered
: •
Tum
ours
in th
e p
ituita
ry g
land
•
Ang
iom
as.
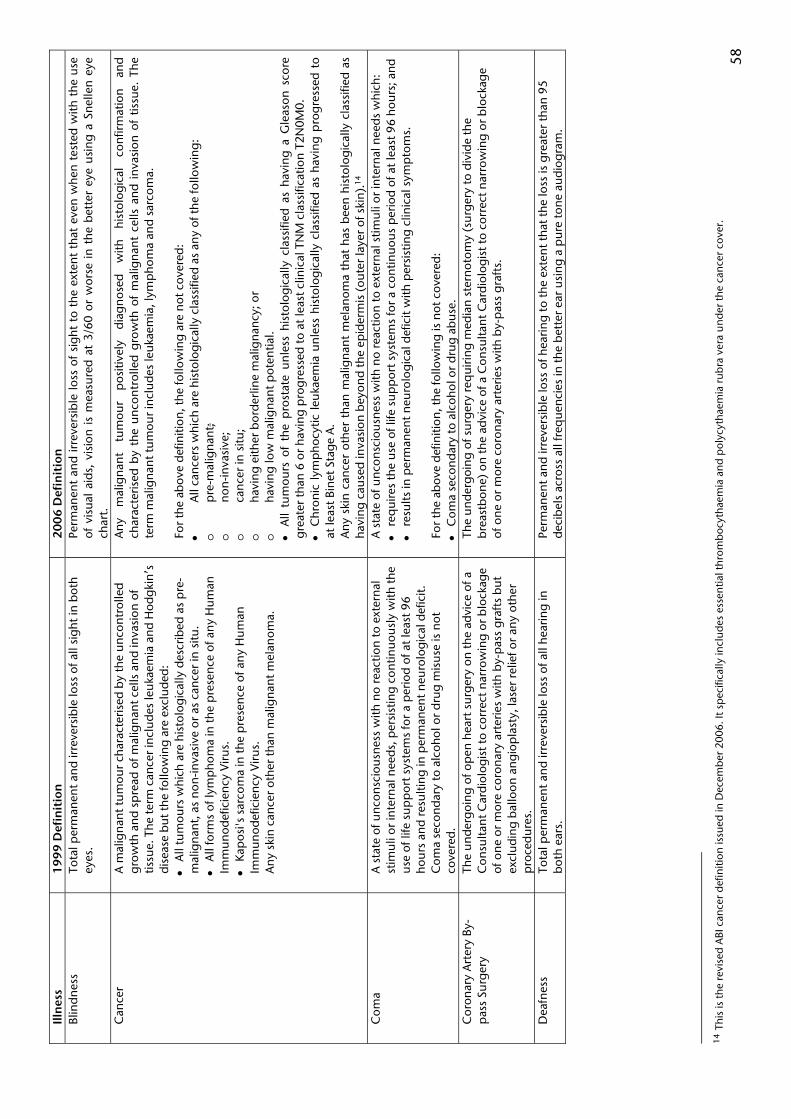
58
Illn
ess
199
9 D
efin
itio
n
200
6 D
efin
itio
n
Blin
dnes
s To
tal p
erm
anen
t and
irre
vers
ible
loss
of a
ll si
ght i
n bo
th
eyes
. Pe
rman
ent
and
irrev
ersi
ble
loss
of
sigh
t to
the
ext
ent
that
eve
n w
hen
test
ed w
ith t
he u
se
of v
isua
l ai
ds,
visi
on i
s m
easu
red
at 3
/60
or w
orse
in
the
bett
er e
ye u
sin
g a
Snel
len
eye
char
t.
Can
cer
A m
alig
nan
t tu
mou
r ch
arac
teris
ed b
y th
e un
cont
rolle
d gr
owth
and
sp
read
of m
alig
nan
t cel
ls a
nd in
vasi
on o
f tis
sue.
The
ter
m c
ance
r in
clu
des
leuk
aem
ia a
nd H
odgk
in’s
di
seas
e bu
t the
follo
win
g ar
e ex
clud
ed:
• A
ll tu
mou
rs w
hich
are
his
tolo
gica
lly d
escr
ibed
as
pre
-m
alig
nant
, as
non-
inva
sive
or
as c
ance
r in
situ
. •
All
form
s of
lym
pho
ma
in th
e p
rese
nce
of a
ny H
uman
Im
mun
odef
icie
ncy
Viru
s.
• Ka
pos
i's s
arco
ma
in th
e p
rese
nce
of a
ny
Hu
man
Im
mun
odef
icie
ncy
Viru
s.
Any
ski
n ca
ncer
oth
er th
an m
alig
nant
mel
anom
a.
Any
m
alig
nant
tu
mou
r p
ositi
vely
di
agno
sed
with
hi
stol
ogic
al
conf
irmat
ion
and
char
acte
rised
by
the
unco
ntro
lled
grow
th o
f m
alig
nan
t ce
lls a
nd i
nvas
ion
of t
issu
e. T
he
term
mal
igna
nt t
umou
r in
clu
des
leuk
aem
ia, l
ymp
hom
a an
d sa
rcom
a.
For
the
abov
e de
finiti
on, t
he fo
llow
ing
are
not c
over
ed:
• A
ll ca
ncer
s w
hich
are
his
tolo
gica
lly c
lass
ified
as
any
of th
e fo
llow
ing:
o
p
re-m
alig
nant
; o
no
n-in
vasi
ve;
o
canc
er in
situ
; o
ha
ving
eith
er b
orde
rlin
e m
alig
nanc
y; o
r o
ha
ving
low
mal
igna
nt p
oten
tial.
• A
ll tu
mou
rs o
f th
e p
rost
ate
unle
ss h
isto
logi
cally
cla
ssifi
ed a
s ha
ving
a G
leas
on s
core
gr
eate
r th
an 6
or
havi
ng p
rog
ress
ed to
at
leas
t clin
ical
TN
M c
lass
ifica
tion
T2N
0M0.
•
Chr
onic
lym
pho
cytic
leu
kaem
ia u
nles
s hi
stol
ogic
ally
cla
ssifi
ed a
s ha
ving
pro
gres
sed
to
at le
ast B
inet
Sta
ge A
. A
ny s
kin
canc
er o
ther
tha
n m
alig
nant
mel
anom
a th
at h
as b
een
hist
olog
ical
ly c
lass
ified
as
havi
ng c
ause
d in
vasi
on b
eyon
d th
e ep
ider
mis
(ou
ter
laye
r of
ski
n).1
4 C
oma
A s
tate
of u
ncon
scio
usne
ss w
ith n
o re
actio
n to
ext
erna
l st
imul
i or
inte
rnal
nee
ds, p
ersi
stin
g co
ntin
uous
ly w
ith th
e us
e of
life
sup
por
t sys
tem
s fo
r a
per
iod
of a
t lea
st 9
6 ho
urs
and
resu
lting
in p
erm
anen
t neu
rolo
gica
l def
icit.
C
oma
seco
ndar
y to
alc
ohol
or
drug
mis
use
is n
ot
cove
red.
A s
tate
of u
ncon
scio
usne
ss w
ith n
o re
actio
n to
ext
ern
al s
timul
i or
inte
rnal
nee
ds w
hich
: •
req
uire
s th
e us
e of
life
sup
por
t sys
tem
s fo
r a
cont
inuo
us p
erio
d of
at l
east
96
hour
s; a
nd
• re
sults
in p
erm
anen
t neu
rolo
gica
l def
icit
with
per
sist
ing
clin
ical
sym
pto
ms.
Fo
r th
e ab
ove
defin
ition
, the
follo
win
g is
not
cov
ered
: •
Com
a se
cond
ary
to a
lcoh
ol o
r dr
ug a
buse
. C
oron
ary
Art
ery
By-
pas
s Su
rger
y Th
e u
nder
goin
g of
op
en h
eart
sur
gery
on
the
advi
ce o
f a
Con
sulta
nt C
ardi
olog
ist t
o co
rrec
t nar
row
ing
or b
lock
age
of o
ne
or m
ore
coro
nary
art
erie
s w
ith b
y-p
ass
graf
ts b
ut
excl
udin
g ba
lloon
ang
iop
last
y, la
ser
relie
f or
any
othe
r p
roce
dure
s.
The
unde
rgoi
ng o
f sur
gery
req
uirin
g m
edia
n st
erno
tom
y (s
urge
ry to
div
ide
the
brea
stbo
ne)
on th
e ad
vice
of a
Con
sulta
nt C
ardi
olog
ist t
o co
rrec
t nar
row
ing
or b
lock
age
of o
ne
or m
ore
coro
nary
art
erie
s w
ith b
y-p
ass
graf
ts.
Dea
fnes
s To
tal p
erm
anen
t and
irre
vers
ible
loss
of a
ll he
arin
g in
bo
th e
ars.
Pe
rman
ent
and
irrev
ersi
ble
loss
of h
earin
g to
the
exte
nt th
at th
e lo
ss is
gre
ater
than
95
deci
bels
acr
oss
all f
req
uenc
ies
in th
e b
ette
r ea
r us
ing
a p
ure
tone
aud
iogr
am.
14
Thi
s is
the
revi
sed
ABI
can
cer
defin
ition
issu
ed in
Dec
embe
r 20
06. I
t sp
ecifi
cally
incl
ude
s es
sent
ial t
hrom
bocy
thae
mia
and
pol
ycyt
haem
ia r
ubra
ver
a u
nder
the
canc
er c
over
.
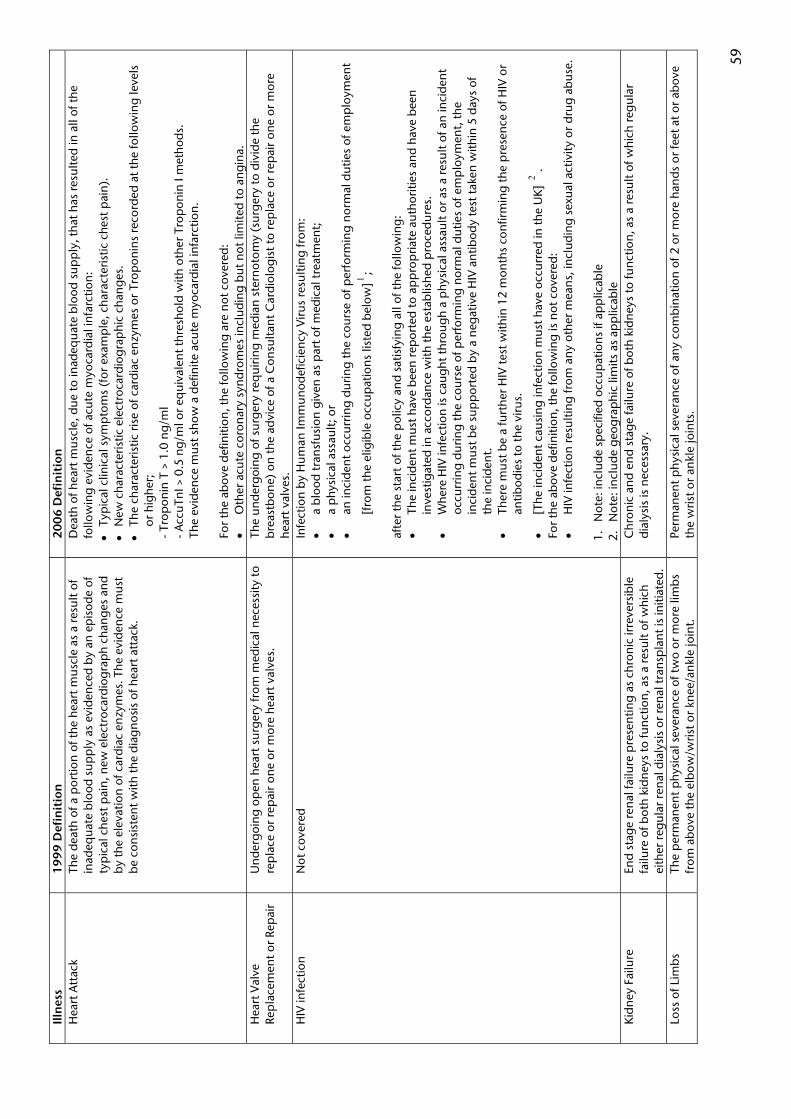
59
Illn
ess
199
9 D
efin
itio
n
200
6 D
efin
itio
n
Hea
rt A
ttac
k Th
e de
ath
of a
por
tion
of th
e he
art m
uscl
e as
a r
esu
lt of
in
adeq
uate
blo
od s
upp
ly a
s ev
iden
ced
by a
n ep
isod
e of
ty
pic
al c
hest
pai
n, n
ew e
lect
roca
rdio
grap
h ch
ange
s an
d by
the
elev
atio
n of
car
diac
en
zym
es. T
he e
vide
nce
mus
t be
con
sist
ent
with
the
diag
nos
is o
f hea
rt a
ttac
k.
Dea
th o
f hea
rt m
uscl
e, d
ue t
o in
adeq
uat
e bl
ood
sup
ply
, tha
t has
res
ulte
d in
all
of th
e fo
llow
ing
evid
ence
of a
cute
myo
card
ial i
nfar
ctio
n:
• Ty
pic
al c
linic
al s
ymp
tom
s (f
or e
xam
ple
, cha
ract
eris
tic c
hest
pai
n).
• N
ew c
hara
cter
istic
ele
ctro
card
iogr
aphi
c ch
ange
s.
• Th
e ch
arac
teris
tic r
ise
of c
ardi
ac e
nzy
mes
or
Trop
onin
s re
cord
ed a
t the
follo
win
g le
vels
or
hig
her;
- T
rop
onin
T >
1.0
ng/
ml
- Acc
uTnI
> 0
.5 n
g/m
l or
equi
vale
nt th
resh
old
with
oth
er T
rop
onin
I m
etho
ds.
The
evid
ence
mus
t sho
w a
def
inite
acu
te m
yoca
rdia
l inf
arct
ion.
Fo
r th
e ab
ove
defin
ition
, the
follo
win
g ar
e no
t cov
ered
: •
Oth
er a
cute
cor
onar
y sy
ndro
mes
incl
udin
g bu
t not
lim
ited
to a
ngin
a.
Hea
rt V
alve
Re
pla
cem
ent o
r Re
pai
r U
nder
goin
g op
en h
eart
sur
gery
from
med
ical
nec
essi
ty to
re
pla
ce o
r re
pai
r on
e or
mor
e he
art v
alve
s.
The
unde
rgoi
ng o
f sur
gery
req
uirin
g m
edia
n st
erno
tom
y (s
urge
ry to
div
ide
the
brea
stbo
ne)
on th
e ad
vice
of a
Con
sulta
nt C
ardi
olog
ist t
o re
pla
ce o
r re
pai
r on
e or
mor
e he
art v
alve
s.
HIV
infe
ctio
n N
ot c
over
ed
Infe
ctio
n by
Hum
an Im
mun
odef
icie
ncy
Viru
s re
sulti
ng fr
om:
• a
bloo
d tr
ansf
usio
n gi
ven
as p
art o
f med
ical
tre
atm
ent;
•
a p
hysi
cal a
ssau
lt; o
r •
an in
cide
nt o
ccur
ring
durin
g th
e co
urse
of p
erfo
rmin
g no
rmal
dut
ies
of e
mp
loym
ent
[fro
m th
e el
igib
le o
ccup
atio
ns li
sted
bel
ow]1
; af
ter
the
star
t of t
he p
olic
y an
d sa
tisfy
ing
all o
f the
follo
win
g:
• Th
e in
cide
nt m
ust h
ave
been
rep
orte
d to
ap
pro
pria
te a
utho
ritie
s an
d ha
ve b
een
inve
stig
ated
in a
ccor
danc
e w
ith th
e es
tabl
ishe
d p
roce
dure
s.
• W
here
HIV
infe
ctio
n is
cau
ght
thro
ugh
a p
hysi
cal a
ssau
lt or
as
a re
sult
of a
n in
cide
nt
occu
rrin
g du
ring
the
cour
se o
f per
form
ing
norm
al d
utie
s of
em
plo
ymen
t, th
e in
cide
nt m
ust
be s
upp
orte
d by
a n
egat
ive
HIV
ant
ibod
y te
st ta
ken
with
in 5
day
s of
th
e in
cide
nt.
• Th
ere
mus
t be
a fu
rthe
r H
IV te
st w
ithin
12
mon
ths
conf
irmin
g th
e p
rese
nce
of H
IV o
r an
tibod
ies
to t
he v
irus.
• [T
he in
cide
nt c
ausi
ng in
fect
ion
mus
t ha
ve o
ccur
red
in th
e U
K] 2
. Fo
r th
e ab
ove
defin
ition
, the
follo
win
g is
not
cov
ered
: •
HIV
infe
ctio
n re
sulti
ng fr
om a
ny o
ther
mea
ns, i
nclu
ding
sex
ual a
ctiv
ity o
r dr
ug a
buse
. 1.
N
ote:
incl
ude
spec
ified
occ
upat
ions
if a
pp
licab
le
2.
Not
e: in
clud
e ge
ogra
phi
c lim
its a
s ap
plic
able
Ki
dney
Fai
lure
En
d st
age
rena
l fai
lure
pre
sent
ing
as c
hron
ic ir
reve
rsib
le
failu
re o
f bot
h ki
dney
s to
func
tion,
as
a re
sult
of w
hich
ei
ther
reg
ular
ren
al d
ialy
sis
or r
enal
tran
spla
nt is
initi
ated
.
Chr
onic
and
end
sta
ge fa
ilure
of b
oth
kidn
eys
to fu
nctio
n, a
s a
resu
lt of
whi
ch r
egul
ar
dial
ysis
is n
eces
sary
.
Loss
of L
imbs
Th
e p
erm
anen
t phy
sica
l sev
eran
ce o
f tw
o or
mor
e lim
bs
from
abo
ve th
e el
bow
/wris
t or
knee
/ank
le jo
int.
Pe
rman
ent p
hysi
cal s
ever
ance
of a
ny c
ombi
natio
n of
2 o
r m
ore
hand
s or
feet
at o
r ab
ove
the
wris
t or
ankl
e jo
ints
.
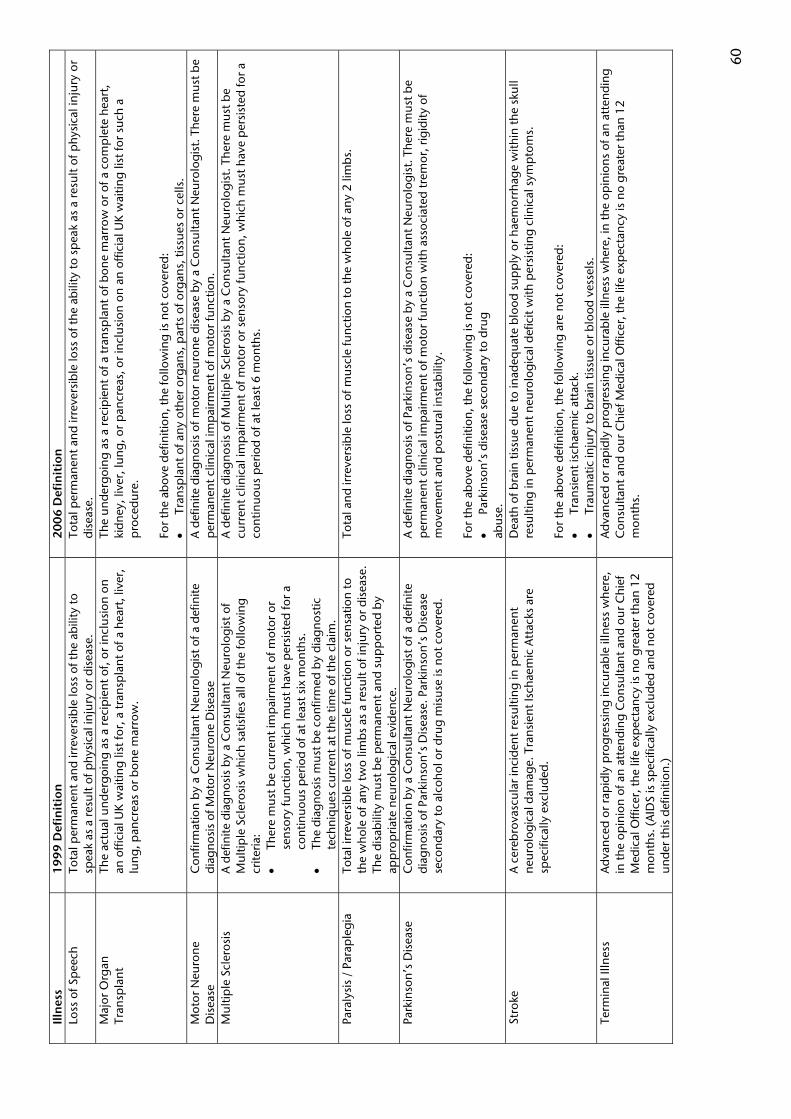
60
Illn
ess
199
9 D
efin
itio
n
200
6 D
efin
itio
n
Loss
of S
pee
ch
Tota
l per
man
ent a
nd ir
reve
rsib
le lo
ss o
f the
abi
lity
to
spea
k as
a r
esu
lt of
phy
sica
l in
jury
or
dise
ase.
To
tal p
erm
anen
t and
irre
vers
ible
loss
of t
he a
bilit
y to
sp
eak
as a
res
ult
of p
hysi
cal i
njur
y or
di
seas
e.
Maj
or O
rgan
Tr
ansp
lant
Th
e ac
tual
und
ergo
ing
as a
rec
ipie
nt o
f, or
incl
usio
n on
an
offi
cial
UK
wai
ting
list f
or, a
tran
spla
nt o
f a h
eart
, liv
er,
lung
, pan
crea
s or
bon
e m
arro
w.
The
und
ergo
ing
as a
rec
ipie
nt o
f a tr
ansp
lant
of b
one
mar
row
or
of a
com
ple
te h
eart
, ki
dney
, liv
er, l
ung,
or
pan
crea
s, o
r in
clus
ion
on a
n of
ficia
l UK
wai
ting
list f
or s
uch
a p
roce
dure
. Fo
r th
e ab
ove
defin
ition
, the
follo
win
g is
not
cov
ered
: •
Tran
spla
nt o
f any
oth
er o
rgan
s, p
arts
of o
rgan
s, ti
ssue
s or
cel
ls.
Mot
or N
euro
ne
Dis
ease
C
onfir
mat
ion
by
a C
onsu
ltant
Neu
rolo
gist
of a
def
inite
di
agno
sis
of M
otor
Neu
ron
e D
isea
se
A d
efin
ite d
iagn
osis
of m
otor
neu
rone
dis
ease
by
a C
onsu
ltan
t Neu
rolo
gist
. The
re m
ust b
e p
erm
anen
t clin
ical
imp
airm
ent o
f mot
or fu
nctio
n.
Mul
tiple
Scl
eros
is
A d
efin
ite d
iagn
osis
by
a C
onsu
ltant
Neu
rolo
gist
of
Mul
tiple
Scl
eros
is w
hich
sat
isfie
s al
l of t
he fo
llow
ing
crite
ria:
• Th
ere
mus
t be
curr
ent i
mp
airm
ent o
f mot
or o
r se
nsor
y fu
nctio
n, w
hich
mus
t ha
ve p
ersi
sted
for
a co
ntin
uous
per
iod
of a
t lea
st s
ix m
onth
s.
• Th
e di
agno
sis
mus
t be
conf
irmed
by
diag
nost
ic
tech
niq
ues
curr
ent a
t the
tim
e of
the
clai
m.
A d
efin
ite d
iagn
osis
of M
ultip
le S
cler
osis
by
a C
onsu
ltant
Neu
rolo
gist
. The
re m
ust b
e cu
rren
t clin
ical
imp
airm
ent
of m
otor
or
sens
ory
func
tion,
whi
ch m
ust
have
per
sist
ed fo
r a
cont
inuo
us p
erio
d of
at l
east
6 m
onth
s.
Para
lysi
s /
Para
ple
gia
Tota
l irr
ever
sibl
e lo
ss o
f mus
cle
func
tion
or s
ensa
tion
to
the
who
le o
f any
two
limbs
as
a re
sult
of in
jury
or
dise
ase.
Th
e di
sabi
lity
mus
t be
per
man
ent
and
sup
por
ted
by
app
rop
riate
neu
rolo
gica
l evi
den
ce.
Tota
l and
irre
vers
ible
loss
of m
uscl
e fu
nctio
n to
the
who
le o
f any
2 li
mbs
.
Park
inso
n’s
Dis
ease
C
onfir
mat
ion
by
a C
onsu
ltant
Neu
rolo
gist
of a
def
inite
di
agno
sis
of P
arki
nson
’s D
isea
se. P
arki
nson
’s D
isea
se
seco
ndar
y to
alc
ohol
or
drug
mis
use
is n
ot c
over
ed.
A d
efin
ite d
iagn
osis
of P
arki
nson
’s d
isea
se b
y a
Con
sulta
nt N
euro
logi
st. T
here
mus
t be
per
man
ent c
linic
al im
pai
rmen
t of m
otor
func
tion
with
ass
ocia
ted
trem
or, r
igid
ity o
f m
ovem
ent a
nd p
ostu
ral i
nsta
bilit
y.
For
the
abov
e de
finiti
on, t
he fo
llow
ing
is n
ot c
over
ed:
• Pa
rkin
son’
s di
seas
e se
cond
ary
to d
rug
abus
e.
Stro
ke
A c
ereb
rova
scul
ar in
cide
nt r
esul
ting
in p
erm
anen
t ne
urol
ogic
al d
amag
e. T
rans
ient
Isch
aem
ic A
ttac
ks a
re
spec
ifica
lly e
xclu
ded.
Dea
th o
f bra
in t
issu
e du
e to
inad
equa
te b
lood
sup
ply
or
haem
orrh
age
with
in th
e sk
ull
resu
lting
in p
erm
anen
t neu
rolo
gica
l def
icit
with
per
sist
ing
clin
ical
sym
pto
ms.
Fo
r th
e ab
ove
defin
ition
, the
follo
win
g ar
e no
t cov
ered
: •
Tran
sien
t isc
haem
ic a
ttac
k.
• Tr
aum
atic
inju
ry to
bra
in ti
ssu
e or
blo
od v
esse
ls.
Term
inal
Illn
ess
Adv
ance
d or
rap
idly
pro
gres
sing
incu
rabl
e ill
ness
whe
re,
in th
e op
inio
n of
an
atte
ndin
g C
onsu
ltant
and
our
Chi
ef
Med
ical
Offi
cer,
the
life
exp
ecta
ncy
is n
o gr
eate
r th
an 1
2 m
onth
s. (
AID
S is
sp
ecifi
cally
exc
lude
d an
d no
t cov
ered
un
der
this
def
initi
on.)
Adv
ance
d or
rap
idly
pro
gres
sing
incu
rabl
e ill
nes
s w
here
, in
the
opin
ions
of a
n at
tend
ing
Con
sulta
nt a
nd
our
Chi
ef M
edic
al O
ffice
r, th
e lif
e ex
pec
tan
cy is
no
grea
ter
than
12
mon
ths.

61
Ill
nes
s 19
99
Def
init
ion
20
06
Def
init
ion
Th
ird D
egre
e Bu
rns
Third
deg
ree
burn
s co
verin
g at
leas
t 20%
of t
he b
ody
surf
ace
area
. Bu
rns
that
invo
lve
dam
age
or d
estr
uctio
n of
the
ski
n to
its
full
dep
th th
roug
h to
the
unde
rlyi
ng ti
ssue
and
cov
erin
g at
leas
t 20%
of t
he b
ody’
s su
rfac
e ar
ea.
Trau
mat
ic H
ead
Inju
ry
Not
cov
ered
D
eath
of b
rain
tis
sue
due
to tr
aum
atic
inju
ry r
esul
ting
in p
erm
anen
t neu
rolo
gica
l def
icit
with
per
sist
ing
clin
ical
sym
pto
ms.
Th
e fo
llow
ing
two
chan
ges
to th
e 19
99 d
efin
ition
s w
ere
mad
e in
200
2:
Illn
ess
200
2 D
efin
itio
n
Can
cer
Any
mal
igna
nt t
umou
r ch
arac
teris
ed b
y th
e un
cont
rolle
d g
row
th a
nd s
pre
ad o
f mal
igna
nt c
ells
and
inva
sion
of
tiss
ue. T
he te
rm c
ance
r in
clud
es le
ukae
mia
an
d H
odgk
in’s
dis
ease
but
the
follo
win
g ar
e ex
clud
ed:
A
ll tu
mou
rs w
hich
are
his
tolo
gica
lly d
escr
ibed
as
pre
-mal
igna
nt, a
s n
on-in
vasi
ve o
r as
can
cer
in s
itu.
A
ll tu
mou
rs o
f the
pro
stat
e un
less
his
tolo
gica
lly c
lass
ified
as
havi
ng a
Gle
ason
sco
re g
reat
er th
an 6
or
havi
ng p
rogr
esse
d to
at
leas
t TN
M c
lass
ifica
tion
T2N
0M0.
All
form
s of
lym
pho
ma
in t
he p
rese
nce
of a
ny H
um
an Im
mun
odef
icie
ncy
Viru
s.
Ka
pos
i's s
arco
ma
in th
e p
rese
nce
of a
ny H
uman
Imm
uno
defic
ienc
y Vi
rus.
Any
ski
n ca
ncer
oth
er th
an in
vasi
ve m
alig
nant
mel
anom
a H
eart
Att
ack
The
deat
h of
a p
ortio
n of
hea
rt m
uscl
e, d
ue t
o in
adeq
uate
blo
od s
upp
ly, t
hat h
as r
esul
ted
in a
ll of
the
follo
win
g ev
iden
ce o
f acu
te m
yoca
rdia
l inf
arct
ion:
typ
ical
che
st p
ain;
new
cha
ract
eris
tic e
lect
roca
rdio
grap
hic
chan
ges;
the
char
acte
ristic
ris
e of
car
diac
enz
ymes
, tro
pon
ins
or o
ther
bio
chem
ical
mar
kers
; w
here
all
of th
e ab
ove
show
s a
defin
ite a
cute
myo
card
ial i
nfar
ctio
n. O
ther
acu
te c
oron
ary
synd
rom
es,
incl
udin
g bu
t not
lim
ited
to a
ngin
a, a
re n
ot c
over
ed u
nder
thi
s de
finiti
on.
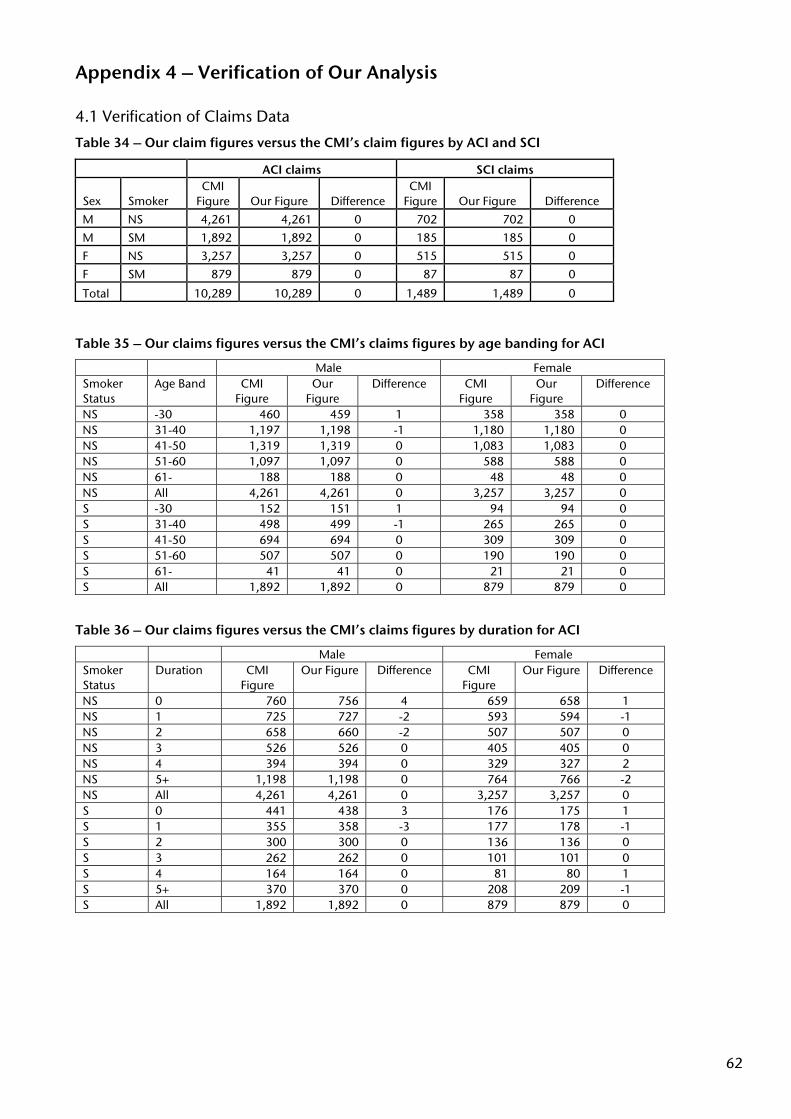
62
Appendix 4 – Verification of Our Analysis 4.1 Verification of Claims Data
Table 34 – Our claim figures versus the CMI’s claim figures by ACI and SCI
ACI claims SCI claims
Sex Smoker CMI
Figure Our Figure Difference CMI
Figure Our Figure Difference
M NS 4,261 4,261 0 702 702 0
M SM 1,892 1,892 0 185 185 0
F NS 3,257 3,257 0 515 515 0
F SM 879 879 0 87 87 0
Total 10,289 10,289 0 1,489 1,489 0
Table 35 – Our claims figures versus the CMI’s claims figures by age banding for ACI
Male Female Smoker Status
Age Band CMI Figure
Our Figure
Difference CMI Figure
Our Figure
Difference
NS -30 460 459 1 358 358 0 NS 31-40 1,197 1,198 -1 1,180 1,180 0 NS 41-50 1,319 1,319 0 1,083 1,083 0 NS 51-60 1,097 1,097 0 588 588 0 NS 61- 188 188 0 48 48 0 NS All 4,261 4,261 0 3,257 3,257 0 S -30 152 151 1 94 94 0 S 31-40 498 499 -1 265 265 0 S 41-50 694 694 0 309 309 0 S 51-60 507 507 0 190 190 0 S 61- 41 41 0 21 21 0 S All 1,892 1,892 0 879 879 0
Table 36 – Our claims figures versus the CMI’s claims figures by duration for ACI
Male Female Smoker Status
Duration CMI Figure
Our Figure Difference CMI Figure
Our Figure Difference
NS 0 760 756 4 659 658 1 NS 1 725 727 -2 593 594 -1 NS 2 658 660 -2 507 507 0 NS 3 526 526 0 405 405 0 NS 4 394 394 0 329 327 2 NS 5+ 1,198 1,198 0 764 766 -2 NS All 4,261 4,261 0 3,257 3,257 0 S 0 441 438 3 176 175 1 S 1 355 358 -3 177 178 -1 S 2 300 300 0 136 136 0 S 3 262 262 0 101 101 0 S 4 164 164 0 81 80 1 S 5+ 370 370 0 208 209 -1 S All 1,892 1,892 0 879 879 0
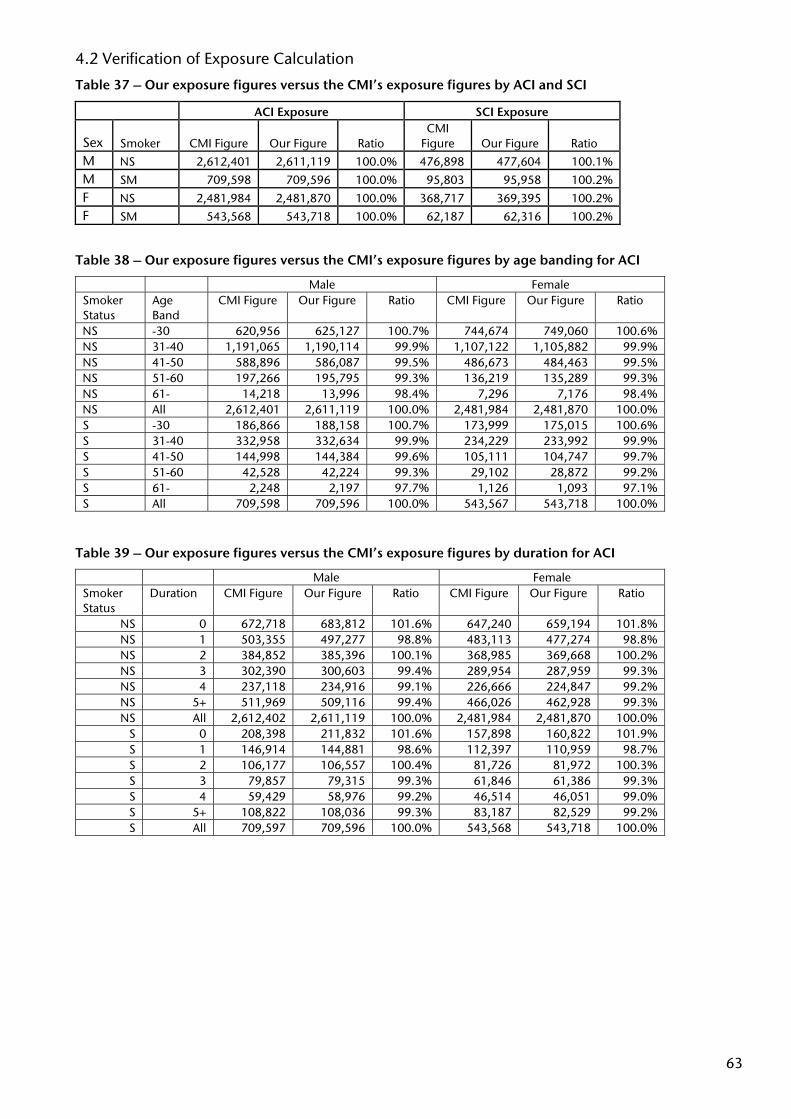
63
4.2 Verification of Exposure Calculation
Table 37 – Our exposure figures versus the CMI’s exposure figures by ACI and SCI
ACI Exposure SCI Exposure
Sex Smoker CMI Figure Our Figure Ratio CMI
Figure Our Figure Ratio M NS 2,612,401 2,611,119 100.0% 476,898 477,604 100.1% M SM 709,598 709,596 100.0% 95,803 95,958 100.2% F NS 2,481,984 2,481,870 100.0% 368,717 369,395 100.2% F SM 543,568 543,718 100.0% 62,187 62,316 100.2%
Table 38 – Our exposure figures versus the CMI’s exposure figures by age banding for ACI
Male Female Smoker Status
Age Band
CMI Figure Our Figure Ratio CMI Figure Our Figure Ratio
NS -30 620,956 625,127 100.7% 744,674 749,060 100.6% NS 31-40 1,191,065 1,190,114 99.9% 1,107,122 1,105,882 99.9% NS 41-50 588,896 586,087 99.5% 486,673 484,463 99.5% NS 51-60 197,266 195,795 99.3% 136,219 135,289 99.3% NS 61- 14,218 13,996 98.4% 7,296 7,176 98.4% NS All 2,612,401 2,611,119 100.0% 2,481,984 2,481,870 100.0% S -30 186,866 188,158 100.7% 173,999 175,015 100.6% S 31-40 332,958 332,634 99.9% 234,229 233,992 99.9% S 41-50 144,998 144,384 99.6% 105,111 104,747 99.7% S 51-60 42,528 42,224 99.3% 29,102 28,872 99.2% S 61- 2,248 2,197 97.7% 1,126 1,093 97.1% S All 709,598 709,596 100.0% 543,567 543,718 100.0%
Table 39 – Our exposure figures versus the CMI’s exposure figures by duration for ACI
Male Female Smoker Status
Duration CMI Figure Our Figure Ratio CMI Figure Our Figure Ratio
NS 0 672,718 683,812 101.6% 647,240 659,194 101.8% NS 1 503,355 497,277 98.8% 483,113 477,274 98.8% NS 2 384,852 385,396 100.1% 368,985 369,668 100.2% NS 3 302,390 300,603 99.4% 289,954 287,959 99.3% NS 4 237,118 234,916 99.1% 226,666 224,847 99.2% NS 5+ 511,969 509,116 99.4% 466,026 462,928 99.3% NS All 2,612,402 2,611,119 100.0% 2,481,984 2,481,870 100.0%
S 0 208,398 211,832 101.6% 157,898 160,822 101.9% S 1 146,914 144,881 98.6% 112,397 110,959 98.7% S 2 106,177 106,557 100.4% 81,726 81,972 100.3% S 3 79,857 79,315 99.3% 61,846 61,386 99.3% S 4 59,429 58,976 99.2% 46,514 46,051 99.0% S 5+ 108,822 108,036 99.3% 83,187 82,529 99.2% S All 709,597 709,596 100.0% 543,568 543,718 100.0%
64
Appendix 5 – ABI Research into Coverage of Conditions in the UK CI Market The following table shows the conditions covered by each of the contributing offices. The table is based on ABI research carried out in 2001. Since the contributing office’s name and policy number has been removed from the data, we were not able to calculate what proportion of policies cover each condition. The CMI is duty bound to keep this information confidential, however they did provide us with the percentage of exposure for which each condition is covered based on the ABI research matrix.
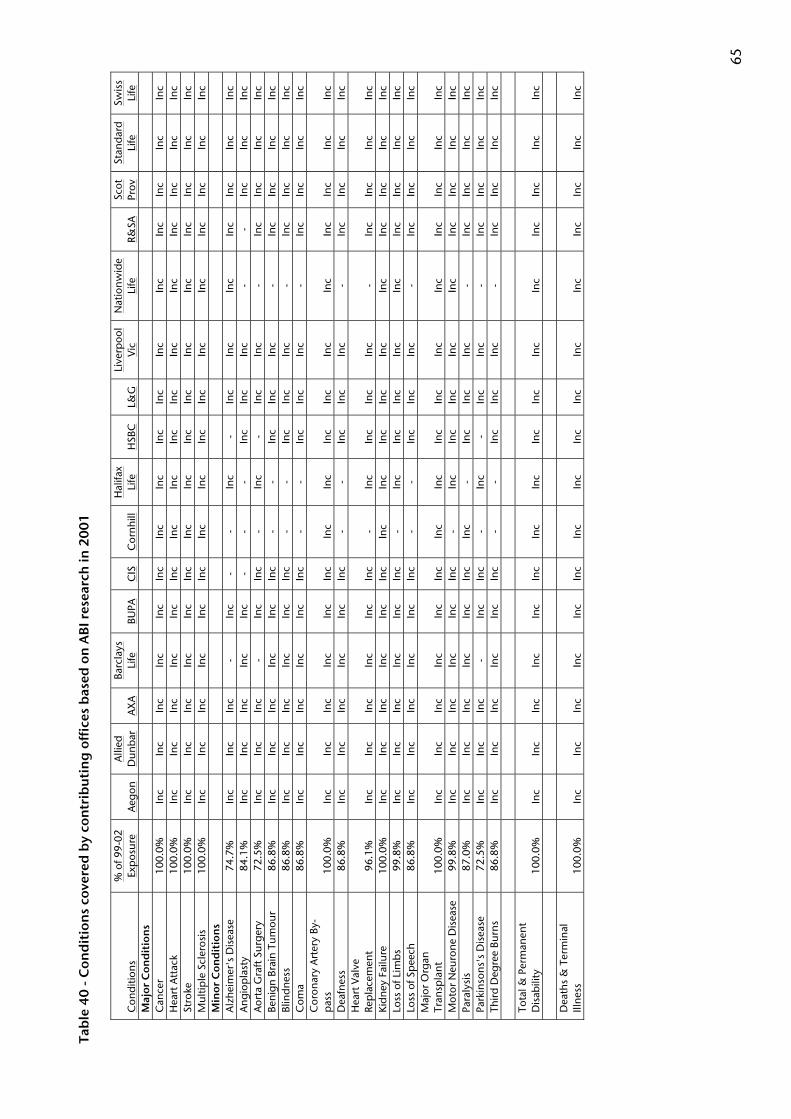
65
Tab
le 4
0 -
Con
dit
ion
s co
vere
d b
y co
ntr
ibu
tin
g o
ffic
es b
ased
on
AB
I res
earc
h in
200
1
Con
ditio
ns
% o
f 99-
02
Exp
osu
re
Aeg
on
Alli
ed
Dun
bar
AX
A
Barc
lays
Li
fe
BUPA
C
IS
Cor
nhill
H
alifa
x Li
fe
HSB
C
L&G
Li
verp
ool
Vic
Nat
ion
wid
e Li
fe
R&SA
Sc
ot
Prov
St
anda
rd
Life
Sw
iss
Life
M
ajor
Con
dit
ion
s
Can
cer
100.
0%
Inc
Inc
Inc
Inc
Inc
Inc
Inc
Inc
Inc
Inc
Inc
Inc
Inc
Inc
Inc
Inc
Hea
rt A
ttac
k 10
0.0%
In
c In
c In
c In
c In
c In
c In
c In
c In
c In
c In
c In
c In
c In
c In
c In
c St
roke
10
0.0%
In
c In
c In
c In
c In
c In
c In
c In
c In
c In
c In
c In
c In
c In
c In
c In
c M
ultip
le S
cler
osis
10
0.0%
In
c In
c In
c In
c In
c In
c In
c In
c In
c In
c In
c In
c In
c In
c In
c In
c M
inor
Con
dit
ion
s
Alz
heim
er's
Dis
ease
74
.7%
In
c In
c In
c -
Inc
- -
Inc
- In
c In
c In
c In
c In
c In
c In
c A
ngio
pla
sty
84.1
%
Inc
Inc
Inc
Inc
Inc
- -
- In
c In
c In
c -
- In
c In
c In
c A
orta
Gra
ft S
urg
ery
72.5
%
Inc
Inc
Inc
- In
c In
c -
Inc
- In
c In
c -
Inc
Inc
Inc
Inc
Beni
gn B
rain
Tu
mou
r 86
.8%
In
c In
c In
c In
c In
c In
c -
- In
c In
c In
c -
Inc
Inc
Inc
Inc
Blin
dnes
s 86
.8%
In
c In
c In
c In
c In
c In
c -
- In
c In
c In
c -
Inc
Inc
Inc
Inc
Com
a 86
.8%
In
c In
c In
c In
c In
c In
c -
- In
c In
c In
c -
Inc
Inc
Inc
Inc
Cor
onar
y A
rter
y By
-p
ass
100.
0%
Inc
Inc
Inc
Inc
Inc
Inc
Inc
Inc
Inc
Inc
Inc
Inc
Inc
Inc
Inc
Inc
Dea
fnes
s 86
.8%
In
c In
c In
c In
c In
c In
c -
- In
c In
c In
c -
Inc
Inc
Inc
Inc
Hea
rt V
alve
Re
pla
cem
ent
96.1
%
Inc
Inc
Inc
Inc
Inc
Inc
- In
c In
c In
c In
c -
Inc
Inc
Inc
Inc
Kidn
ey F
ailu
re
100.
0%
Inc
Inc
Inc
Inc
Inc
Inc
Inc
Inc
Inc
Inc
Inc
Inc
Inc
Inc
Inc
Inc
Loss
of L
imbs
99
.8%
In
c In
c In
c In
c In
c In
c -
Inc
Inc
Inc
Inc
Inc
Inc
Inc
Inc
Inc
Loss
of S
pee
ch
86.8
%
Inc
Inc
Inc
Inc
Inc
Inc
- -
Inc
Inc
Inc
- In
c In
c In
c In
c M
ajor
Org
an
Tran
spla
nt
100.
0%
Inc
Inc
Inc
Inc
Inc
Inc
Inc
Inc
Inc
Inc
Inc
Inc
Inc
Inc
Inc
Inc
Mot
or N
euro
ne D
isea
se
99.8
%
Inc
Inc
Inc
Inc
Inc
Inc
- In
c In
c In
c In
c In
c In
c In
c In
c In
c Pa
raly
sis
87.0
%
Inc
Inc
Inc
Inc
Inc
Inc
Inc
- In
c In
c In
c -
Inc
Inc
Inc
Inc
Park
inso
ns's
Dis
ease
72
.5%
In
c In
c In
c -
Inc
Inc
- In
c -
Inc
Inc
- In
c In
c In
c In
c Th
ird D
egre
e Bu
rns
86.8
%
Inc
Inc
Inc
Inc
Inc
Inc
- -
Inc
Inc
Inc
- In
c In
c In
c In
c
To
tal &
Per
man
ent
Dis
abili
ty
100.
0%
Inc
Inc
Inc
Inc
Inc
Inc
Inc
Inc
Inc
Inc
Inc
Inc
Inc
Inc
Inc
Inc
Dea
ths
& T
erm
inal
Ill
ness
10
0.0%
In
c In
c In
c In
c In
c In
c In
c In
c In
c In
c In
c In
c In
c In
c In
c In
c
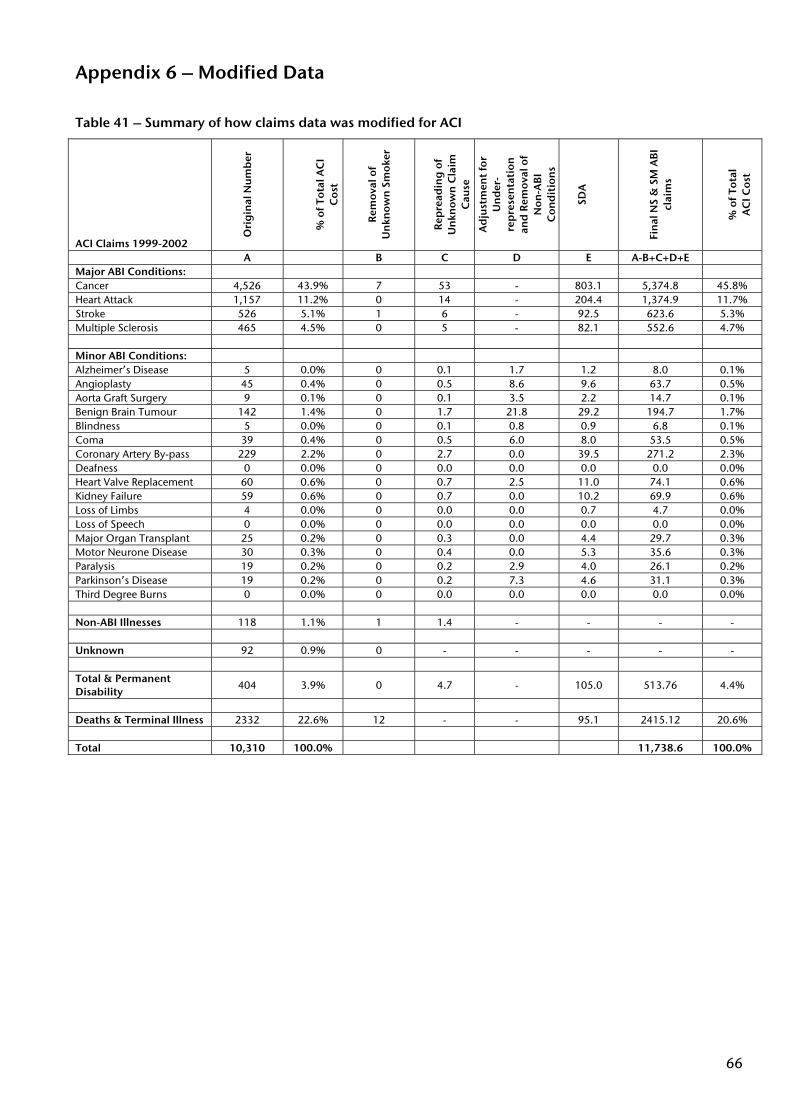
66
Appendix 6 – Modified Data
Table 41 – Summary of how claims data was modified for ACI
ACI Claims 1999-2002 O
rig
inal
Nu
mb
er
%
of T
otal
AC
I C
ost
Rem
oval
of
Un
know
n S
mok
er
R
epre
adin
g o
f U
nkn
own
Cla
im
Cau
se
Ad
just
men
t fo
r U
nd
er-
rep
rese
nta
tion
an
d R
emov
al o
f N
on-A
BI
Con
dit
ion
s
SDA
Fin
al N
S &
SM
AB
I cl
aim
s
%
of T
otal
A
CI C
ost
A B C D E A-B+C+D+E Major ABI Conditions: Cancer 4,526 43.9% 7 53 - 803.1 5,374.8 45.8% Heart Attack 1,157 11.2% 0 14 - 204.4 1,374.9 11.7% Stroke 526 5.1% 1 6 - 92.5 623.6 5.3% Multiple Sclerosis 465 4.5% 0 5 - 82.1 552.6 4.7% Minor ABI Conditions: Alzheimer’s Disease 5 0.0% 0 0.1 1.7 1.2 8.0 0.1% Angioplasty 45 0.4% 0 0.5 8.6 9.6 63.7 0.5% Aorta Graft Surgery 9 0.1% 0 0.1 3.5 2.2 14.7 0.1% Benign Brain Tumour 142 1.4% 0 1.7 21.8 29.2 194.7 1.7% Blindness 5 0.0% 0 0.1 0.8 0.9 6.8 0.1% Coma 39 0.4% 0 0.5 6.0 8.0 53.5 0.5% Coronary Artery By-pass 229 2.2% 0 2.7 0.0 39.5 271.2 2.3% Deafness 0 0.0% 0 0.0 0.0 0.0 0.0 0.0% Heart Valve Replacement 60 0.6% 0 0.7 2.5 11.0 74.1 0.6% Kidney Failure 59 0.6% 0 0.7 0.0 10.2 69.9 0.6% Loss of Limbs 4 0.0% 0 0.0 0.0 0.7 4.7 0.0% Loss of Speech 0 0.0% 0 0.0 0.0 0.0 0.0 0.0% Major Organ Transplant 25 0.2% 0 0.3 0.0 4.4 29.7 0.3% Motor Neurone Disease 30 0.3% 0 0.4 0.0 5.3 35.6 0.3% Paralysis 19 0.2% 0 0.2 2.9 4.0 26.1 0.2% Parkinson’s Disease 19 0.2% 0 0.2 7.3 4.6 31.1 0.3% Third Degree Burns 0 0.0% 0 0.0 0.0 0.0 0.0 0.0% Non-ABI Illnesses 118 1.1% 1 1.4 - - - - Unknown 92 0.9% 0 - - - - - Total & Permanent Disability
404 3.9% 0 4.7 - 105.0 513.76 4.4%
Deaths & Terminal Illness 2332 22.6% 12 - - 95.1 2415.12 20.6% Total 10,310 100.0% 11,738.6 100.0%
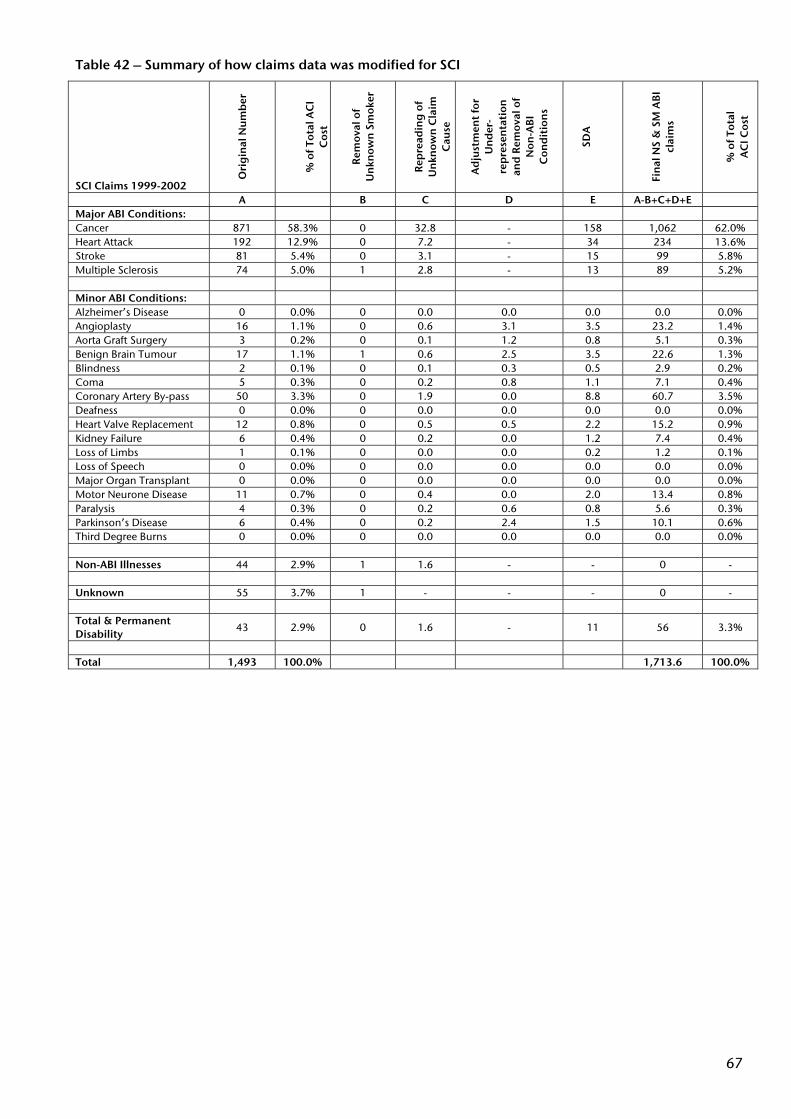
67
Table 42 – Summary of how claims data was modified for SCI
SCI Claims 1999-2002
Ori
gin
al N
um
ber
%
of T
otal
AC
I C
ost
Rem
oval
of
Un
know
n S
mok
er
R
epre
adin
g o
f U
nkn
own
Cla
im
Cau
se
Ad
just
men
t fo
r U
nd
er-
rep
rese
nta
tion
an
d R
emov
al o
f N
on-A
BI
Con
dit
ion
s
SDA
Fin
al N
S &
SM
AB
I cl
aim
s
%
of T
otal
A
CI C
ost
A B C D E A-B+C+D+E Major ABI Conditions: Cancer 871 58.3% 0 32.8 - 158 1,062 62.0% Heart Attack 192 12.9% 0 7.2 - 34 234 13.6% Stroke 81 5.4% 0 3.1 - 15 99 5.8% Multiple Sclerosis 74 5.0% 1 2.8 - 13 89 5.2% Minor ABI Conditions: Alzheimer’s Disease 0 0.0% 0 0.0 0.0 0.0 0.0 0.0% Angioplasty 16 1.1% 0 0.6 3.1 3.5 23.2 1.4% Aorta Graft Surgery 3 0.2% 0 0.1 1.2 0.8 5.1 0.3% Benign Brain Tumour 17 1.1% 1 0.6 2.5 3.5 22.6 1.3% Blindness 2 0.1% 0 0.1 0.3 0.5 2.9 0.2% Coma 5 0.3% 0 0.2 0.8 1.1 7.1 0.4% Coronary Artery By-pass 50 3.3% 0 1.9 0.0 8.8 60.7 3.5% Deafness 0 0.0% 0 0.0 0.0 0.0 0.0 0.0% Heart Valve Replacement 12 0.8% 0 0.5 0.5 2.2 15.2 0.9% Kidney Failure 6 0.4% 0 0.2 0.0 1.2 7.4 0.4% Loss of Limbs 1 0.1% 0 0.0 0.0 0.2 1.2 0.1% Loss of Speech 0 0.0% 0 0.0 0.0 0.0 0.0 0.0% Major Organ Transplant 0 0.0% 0 0.0 0.0 0.0 0.0 0.0% Motor Neurone Disease 11 0.7% 0 0.4 0.0 2.0 13.4 0.8% Paralysis 4 0.3% 0 0.2 0.6 0.8 5.6 0.3% Parkinson’s Disease 6 0.4% 0 0.2 2.4 1.5 10.1 0.6% Third Degree Burns 0 0.0% 0 0.0 0.0 0.0 0.0 0.0% Non-ABI Illnesses 44 2.9% 1 1.6 - - 0 - Unknown 55 3.7% 1 - - - 0 - Total & Permanent Disability
43 2.9% 0 1.6 - 11 56 3.3%
Total 1,493 100.0% 1,713.6 100.0%
68
Appendix 7 – CIBT02(adj) Male / Female Ages 20 – 70 The zero coma rates in the original CIBT02 table have been substituted with the population coma rates that we have derived. Note that the “Total SCI Rates” and “Total ACI Rates” still correspond to the original CIBT02 table and assume a zero rate for coma.
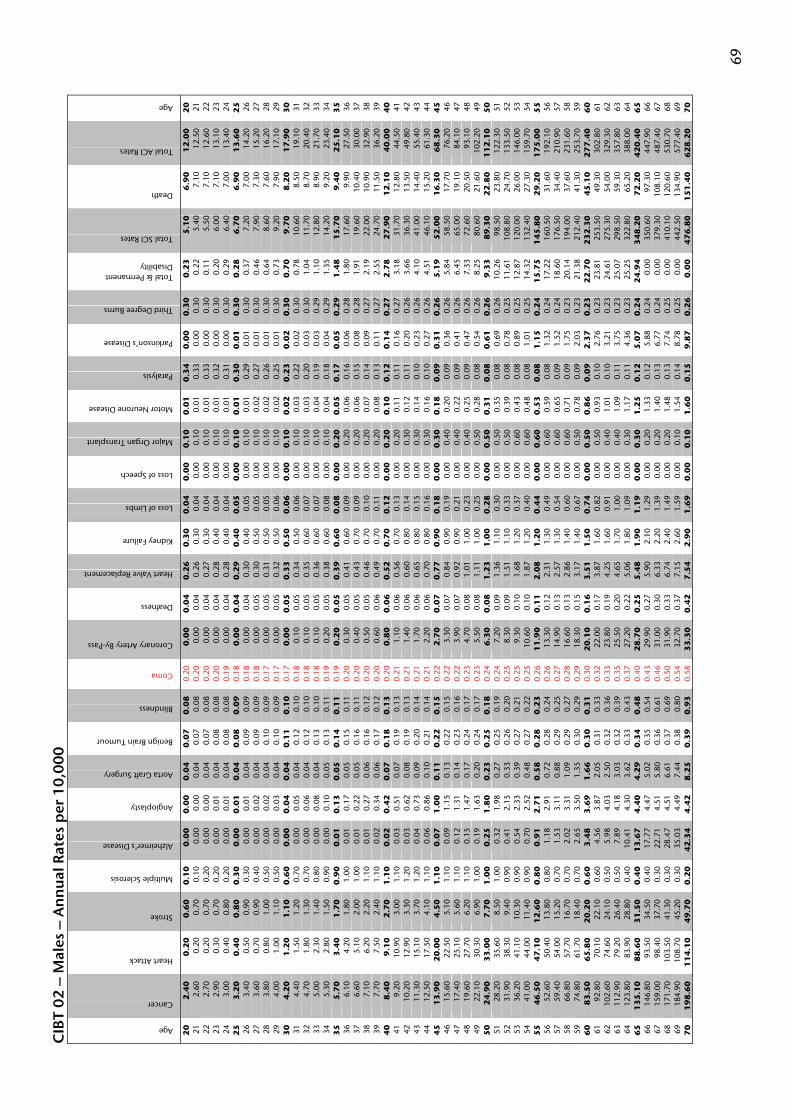
69
CIB
T 0
2 –
Mal
es –
An
nu
al R
ates
per
10
,00
0
Age
Cancer
Heart Attack
Stroke
Multiple Sclerosis
Alzheimer’s Disease
Angioplasty
Aorta Graft Surgery
Benign Brain Tumour
Blindness
Coma
Coronary Artery By-Pass
Deafness
Heart Valve Replacement
Kidney Failure
Loss of Limbs
Loss of Speech
Major Organ Transplant
Motor Neurone Disease
Paralysis
Parkinson’s Disease
Third Degree Burns
Total & Permanent Disability
Total SCI Rates
Death
Total ACI Rates
Age
20
2
.40
0
.20
0
.60
0
.10
0
.00
0
.00
0
.04
0
.07
0
.08
0.
20
0.0
0
0.0
4
0.2
6
0.3
0
0.0
4
0.0
0
0.1
0
0.0
1
0.3
4
0.0
0
0.3
0
0.2
3
5.1
0
6.9
0
12
.00
2
0
21
2.60
0.
20
0.70
0.
10
0.00
0.
00
0.04
0.
07
0.08
0.
20
0.00
0.
04
0.26
0.
30
0.04
0.
00
0.10
0.
01
0.33
0.
00
0.30
0.
22
5.40
7.
10
12.5
0 21
22
2.
70
0.20
0.
70
0.20
0.
00
0.00
0.
04
0.07
0.
08
0.20
0.
00
0.04
0.
27
0.30
0.
04
0.00
0.
10
0.01
0.
33
0.00
0.
30
0.11
5.
50
7.10
12
.60
22
23
2.90
0.
30
0.70
0.
20
0.00
0.
01
0.04
0.
08
0.08
0.
20
0.00
0.
04
0.28
0.
40
0.04
0.
00
0.10
0.
01
0.32
0.
00
0.30
0.
20
6.00
7.
10
13.1
0 23
24
3.
00
0.40
0.
80
0.20
0.
00
0.01
0.
04
0.08
0.
08
0.19
0.
00
0.04
0.
28
0.40
0.
04
0.00
0.
10
0.01
0.
31
0.00
0.
30
0.29
6.
40
7.00
13
.40
24
25
3
.20
0
.40
0
.80
0
.30
0
.00
0
.01
0
.04
0
.08
0
.09
0.
18
0.0
0
0.0
4
0.2
9
0.4
0
0.0
5
0.0
0
0.1
0
0.0
1
0.3
0
0.0
1
0.3
0
0.2
8
6.7
0
6.9
0
13
.60
2
5
26
3.40
0.
50
0.90
0.
30
0.00
0.
01
0.04
0.
09
0.09
0.
18
0.00
0.
04
0.30
0.
40
0.05
0.
00
0.10
0.
01
0.29
0.
01
0.30
0.
37
7.20
7.
00
14.2
0 26
27
3.
60
0.70
0.
90
0.40
0.
00
0.02
0.
04
0.09
0.
09
0.18
0.
00
0.05
0.
30
0.50
0.
05
0.00
0.
10
0.02
0.
27
0.01
0.
30
0.46
7.
90
7.30
15
.20
27
28
3.80
0.
80
1.00
0.
50
0.00
0.
02
0.04
0.
10
0.09
0.
17
0.00
0.
05
0.31
0.
50
0.05
0.
00
0.10
0.
02
0.26
0.
01
0.30
0.
64
8.60
7.
60
16.2
0 28
29
4.
00
1.00
1.
10
0.50
0.
00
0.03
0.
04
0.10
0.
09
0.17
0.
00
0.05
0.
32
0.50
0.
06
0.00
0.
10
0.02
0.
25
0.01
0.
30
0.73
9.
20
7.90
17
.10
29
30
4
.20
1
.20
1
.10
0
.60
0
.00
0
.04
0
.04
0
.11
0
.10
0.
17
0.0
0
0.0
5
0.3
3
0.5
0
0.0
6
0.0
0
0.1
0
0.0
2
0.2
3
0.0
2
0.3
0
0.7
0
9.7
0
8.2
0
17
.90
3
0
31
4.40
1.
50
1.20
0.
70
0.00
0.
05
0.04
0.
12
0.10
0.
18
0.10
0.
05
0.34
0.
50
0.06
0.
00
0.10
0.
03
0.22
0.
02
0.30
0.
78
10.6
0 8.
50
19.1
0 31
32
4.
70
1.80
1.
30
0.70
0.
00
0.06
0.
04
0.12
0.
10
0.18
0.
10
0.05
0.
35
0.60
0.
07
0.00
0.
10
0.03
0.
20
0.03
0.
30
1.04
11
.70
8.70
20
.40
32
33
5.00
2.
30
1.40
0.
80
0.00
0.
08
0.04
0.
13
0.10
0.
18
0.10
0.
05
0.36
0.
60
0.07
0.
00
0.10
0.
04
0.19
0.
03
0.29
1.
10
12.8
0 8.
90
21.7
0 33
34
5.
30
2.80
1.
50
0.90
0.
00
0.10
0.
05
0.13
0.
11
0.19
0.
20
0.05
0.
38
0.60
0.
08
0.00
0.
10
0.04
0.
18
0.04
0.
29
1.35
14
.20
9.20
23
.40
34
35
5
.70
3
.40
1
.70
0
.90
0
.01
0
.13
0
.05
0
.14
0
.11
0.
19
0.2
0
0.0
5
0.3
9
0.6
0
0.0
8
0.0
0
0.2
0
0.0
5
0.1
7
0.0
5
0.2
9
1.4
8
15
.70
9
.40
2
5.1
0
35
36
6.
10
4.20
1.
80
1.00
0.
01
0.17
0.
05
0.15
0.
11
0.20
0.
30
0.05
0.
41
0.60
0.
09
0.00
0.
20
0.06
0.
16
0.06
0.
28
1.80
17
.60
9.90
27
.50
36
37
6.60
5.
10
2.00
1.
00
0.01
0.
22
0.05
0.
16
0.11
0.
20
0.40
0.
05
0.43
0.
70
0.09
0.
00
0.20
0.
06
0.15
0.
08
0.28
1.
91
19.6
0 10
.40
30.0
0 37
38
7.
10
6.20
2.
20
1.10
0.
01
0.27
0.
06
0.16
0.
12
0.20
0.
50
0.05
0.
46
0.70
0.
10
0.00
0.
20
0.07
0.
14
0.09
0.
27
2.19
22
.00
10.9
0 32
.90
38
39
7.70
7.
50
2.40
1.
10
0.02
0.
34
0.06
0.
17
0.12
0.
20
0.60
0.
06
0.49
0.
70
0.11
0.
00
0.20
0.
08
0.13
0.
11
0.27
2.
55
24.7
0 11
.50
36.2
0 39
4
0
8.4
0
9.1
0
2.7
0
1.1
0
0.0
2
0.4
2
0.0
7
0.1
8
0.1
3
0.20
0
.80
0
.06
0
.52
0
.70
0
.12
0
.00
0
.20
0
.10
0
.12
0
.14
0
.27
2
.78
2
7.9
0
12
.10
4
0.0
0
40
41
9.
20
10.9
0 3.
00
1.10
0.
03
0.51
0.
07
0.19
0.
13
0.21
1.
10
0.06
0.
56
0.70
0.
13
0.00
0.
20
0.11
0.
11
0.16
0.
27
3.18
31
.70
12.8
0 44
.50
41
42
10.2
0 12
.90
3.30
1.
20
0.03
0.
62
0.08
0.
19
0.13
0.
21
1.40
0.
06
0.60
0.
80
0.14
0.
00
0.30
0.
12
0.11
0.
20
0.26
3.
66
36.3
0 13
.50
49.8
0 42
43
11
.30
15.1
0 3.
70
1.20
0.
04
0.73
0.
09
0.20
0.
14
0.21
1.
70
0.06
0.
65
0.80
0.
15
0.00
0.
30
0.14
0.
10
0.23
0.
26
4.10
41
.00
14.4
0 55
.40
43
44
12.5
0 17
.50
4.10
1.
10
0.06
0.
86
0.10
0.
21
0.14
0.
21
2.20
0.
06
0.70
0.
80
0.16
0.
00
0.30
0.
16
0.10
0.
27
0.26
4.
51
46.1
0 15
.20
61.3
0 44
4
5
13
.90
2
0.0
0
4.5
0
1.1
0
0.0
7
1.0
0
0.1
1
0.2
2
0.1
5
0.22
2
.70
0
.07
0
.77
0
.90
0
.18
0
.00
0
.30
0
.18
0
.09
0
.31
0
.26
5
.19
5
2.0
0
16
.30
6
8.3
0
45
46
15
.60
22.5
0 5.
10
1.10
0.
09
1.15
0.
13
0.22
0.
15
0.22
3.
30
0.07
0.
84
0.90
0.
19
0.00
0.
40
0.20
0.
09
0.36
0.
26
5.84
58
.50
17.7
0 76
.20
46
47
17.4
0 25
.10
5.60
1.
10
0.12
1.
31
0.14
0.
23
0.16
0.
22
3.90
0.
07
0.92
0.
90
0.21
0.
00
0.40
0.
22
0.09
0.
41
0.26
6.
45
65.0
0 19
.10
84.1
0 47
48
19
.60
27.7
0 6.
20
1.10
0.
15
1.47
0.
17
0.24
0.
17
0.23
4.
70
0.08
1.
01
1.00
0.
23
0.00
0.
40
0.25
0.
09
0.47
0.
26
7.33
72
.60
20.5
0 93
.10
48
49
22.1
0 30
.30
6.90
1.
00
0.19
1.
63
0.20
0.
24
0.17
0.
23
5.50
0.
08
1.11
1.
00
0.25
0.
00
0.50
0.
28
0.08
0.
54
0.26
8.
25
80.6
0 21
.60
102.
20
49
50
2
4.9
0
33
.00
7
.70
1
.00
0
.25
1
.80
0
.23
0
.25
0
.18
0.
24
6.3
0
0.0
8
1.2
3
1.0
0
0.2
8
0.0
0
0.5
0
0.3
1
0.0
8
0.6
1
0.2
6
9.3
3
89
.30
2
2.8
0
11
2.1
0
50
51
28
.20
35.6
0 8.
50
1.00
0.
32
1.98
0.
27
0.25
0.
19
0.24
7.
20
0.09
1.
36
1.10
0.
30
0.00
0.
50
0.35
0.
08
0.69
0.
26
10.2
6 98
.50
23.8
0 12
2.30
51
52
31
.90
38.3
0 9.
40
0.90
0.
41
2.15
0.
33
0.26
0.
20
0.25
8.
30
0.09
1.
51
1.10
0.
33
0.00
0.
50
0.39
0.
08
0.78
0.
25
11.6
1 10
8.80
24
.70
133.
50
52
53
36.2
0 41
.10
10.3
0 0.
90
0.54
2.
33
0.39
0.
27
0.21
0.
25
9.30
0.
10
1.68
1.
20
0.37
0.
00
0.60
0.
43
0.08
0.
89
0.25
12
.87
120.
00
26.0
0 14
6.00
53
54
41
.00
44.0
0 11
.40
0.90
0.
70
2.52
0.
48
0.27
0.
22
0.25
10
.60
0.10
1.
87
1.20
0.
40
0.00
0.
60
0.48
0.
08
1.01
0.
25
14.3
2 13
2.40
27
.30
159.
70
54
55
4
6.5
0
47
.10
1
2.6
0
0.8
0
0.9
1
2.7
1
0.5
8
0.2
8
0.2
3
0.26
1
1.9
0
0.1
1
2.0
8
1.2
0
0.4
4
0.0
0
0.6
0
0.5
3
0.0
8
1.1
5
0.2
4
15
.75
1
45
.80
2
9.2
0
17
5.0
0
55
56
52
.60
50.4
0 13
.80
0.80
1.
18
2.91
0.
72
0.28
0.
24
0.26
13
.30
0.12
2.
31
1.30
0.
49
0.00
0.
60
0.59
0.
08
1.32
0.
24
17.2
2 16
0.50
31
.60
192.
10
56
57
59.4
0 54
.00
15.2
0 0.
70
1.53
3.
11
0.88
0.
29
0.25
0.
27
14.9
0 0.
13
2.57
1.
30
0.54
0.
00
0.60
0.
65
0.09
1.
52
0.24
18
.60
176.
50
34.4
0 21
0.90
57
58
66
.80
57.7
0 16
.70
0.70
2.
02
3.31
1.
09
0.29
0.
27
0.28
16
.60
0.13
2.
86
1.40
0.
60
0.00
0.
60
0.71
0.
09
1.75
0.
23
20.1
4 19
4.00
37
.60
231.
60
58
59
74.8
0 61
.70
18.4
0 0.
70
2.65
3.
50
1.35
0.
30
0.29
0.
29
18.3
0 0.
15
3.17
1.
40
0.67
0.
00
0.50
0.
78
0.09
2.
03
0.23
21
.38
212.
40
41.3
0 25
3.70
59
6
0
83
.50
6
5.8
0
20
.20
0
.60
3
.48
3
.69
1
.66
0
.30
0
.31
0.
30
20
.10
0
.16
3
.51
1
.50
0
.74
0
.00
0
.50
0
.86
0
.09
2
.37
0
.23
2
2.7
0
23
2.3
0
45
.10
2
77
.40
6
0
61
92.8
0 70
.10
22.1
0 0.
60
4.56
3.
87
2.05
0.
31
0.33
0.
32
22.0
0 0.
17
3.87
1.
60
0.82
0.
00
0.50
0.
93
0.10
2.
76
0.23
23
.81
253.
50
49.3
0 30
2.80
61
62
10
2.60
74
.60
24.1
0 0.
50
5.98
4.
03
2.50
0.
32
0.36
0.
33
23.8
0 0.
19
4.25
1.
60
0.91
0.
00
0.40
1.
01
0.10
3.
21
0.23
24
.61
275.
30
54.0
0 32
9.30
62
63
11
2.90
79
.20
26.4
0 0.
50
7.89
4.
18
3.03
0.
32
0.39
0.
35
25.5
0 0.
20
4.65
1.
70
1.00
0.
00
0.40
1.
09
0.11
3.
75
0.23
25
.07
298.
50
59.3
0 35
7.80
63
64
12
3.80
83
.90
28.8
0 0.
40
10.4
1 4.
30
3.62
0.
33
0.43
0.
37
27.2
0 0.
22
5.06
1.
80
1.09
0.
00
0.30
1.
17
0.11
4.
36
0.23
25
.25
322.
80
65.2
0 38
8.00
64
6
5
13
5.1
0
88
.60
3
1.5
0
0.4
0
13
.67
4
.40
4
.29
0
.34
0
.48
0.
40
28
.70
0
.25
5
.48
1
.90
1
.19
0
.00
0
.30
1
.25
0
.12
5
.07
0
.24
2
4.9
4
34
8.2
0
72
.20
4
20
.40
6
5
66
146.
80
93.5
0 34
.50
0.40
17
.77
4.47
5.
02
0.35
0.
54
0.43
29
.90
0.27
5.
90
2.10
1.
29
0.00
0.
20
1.33
0.
12
5.88
0.
24
0.00
35
0.60
97
.30
447.
90
66
67
159.
00
98.4
0 37
.70
0.30
22
.71
4.51
5.
80
0.36
0.
61
0.46
31
.00
0.30
6.
33
2.20
1.
39
0.00
0.
20
1.40
0.
13
6.77
0.
24
0.00
37
9.30
10
8.10
48
7.40
67
68
17
1.70
10
3.50
41
.30
0.30
28
.47
4.51
6.
61
0.37
0.
69
0.50
31
.90
0.33
6.
74
2.40
1.
49
0.00
0.
20
1.48
0.
13
7.74
0.
25
0.00
41
0.10
12
0.60
53
0.70
68
69
18
4.90
10
8.70
45
.20
0.30
35
.03
4.49
7.
44
0.38
0.
80
0.54
32
.70
0.37
7.
15
2.60
1.
59
0.00
0.
10
1.54
0.
14
8.78
0.
25
0.00
44
2.50
13
4.90
57
7.40
69
7
0
19
8.6
0
11
4.1
0
49
.70
0
.20
4
2.3
4
4.4
2
8.2
5
0.3
9
0.9
3
0.58
3
3.3
0
0.4
2
7.5
4
2.9
0
1.6
9
0.0
0
0.1
0
1.6
0
0.1
5
9.8
7
0.2
6
0.0
0
47
6.8
0
15
1.4
0
62
8.2
0
70

70
CIB
T 0
2 –
Fem
ales
– A
nn
ual
Rat
es p
er 1
0,0
00
Age
Cancer
Heart Attack
Stroke
Multiple Sclerosis
Alzheimer’s Disease
Angioplasty
Aorta Graft Surgery
Benign Brain Tumour
Blindness
Coma
Coronary Artery By-Pass
Deafness
Heart Valve Replacement
Kidney Failure
Loss of Limbs
Loss of Speech
Major Organ Transplant
Motor Neurone Disease
Paralysis
Parkinson’s Disease
Third Degree Burns
Total & Permanent Disability
Total SCI Rates
Death
Total ACI Rates
Age
20
2
.10
0
.00
0
.50
0
.30
0
.00
0
.00
0
.00
0
.05
0
.08
0.
16
0.0
0
0.0
4
0.1
6
0.1
0
0.0
1
0.0
0
0.1
0
0.0
0
0.1
3
0.0
0
0.1
4
0.6
8
4.4
0
2.3
0
6.7
0
20
21
2.
30
0.10
0.
50
0.30
0.
00
0.00
0.
00
0.05
0.
08
0.15
0.
00
0.04
0.
16
0.20
0.
01
0.00
0.
10
0.00
0.
12
0.00
0.
15
0.78
4.
90
2.30
7.
20
21
22
2.60
0.
10
0.60
0.
40
0.00
0.
00
0.00
0.
05
0.08
0.
14
0.00
0.
04
0.16
0.
20
0.01
0.
00
0.10
0.
00
0.12
0.
00
0.15
0.
87
5.50
2.
30
7.80
22
23
3.
00
0.10
0.
60
0.50
0.
00
0.00
0.
00
0.05
0.
08
0.13
0.
00
0.04
0.
16
0.20
0.
01
0.00
0.
10
0.00
0.
12
0.00
0.
15
0.96
6.
10
2.30
8.
40
23
24
3.30
0.
10
0.70
0.
60
0.00
0.
00
0.00
0.
05
0.08
0.
12
0.00
0.
04
0.16
0.
20
0.01
0.
00
0.10
0.
00
0.12
0.
00
0.16
1.
15
6.80
2.
30
9.10
24
2
5
3.8
0
0.1
0
0.7
0
0.7
0
0.0
0
0.0
0
0.0
1
0.0
6
0.0
9
0.12
0
.00
0
.04
0
.16
0
.20
0
.01
0
.00
0
.10
0
.00
0
.11
0
.01
0
.16
1
.35
7
.60
2
.40
1
0.0
0
25
26
4.20
0.
10
0.80
0.
90
0.00
0.
00
0.01
0.
06
0.09
0.
11
0.00
0.
04
0.16
0.
20
0.02
0.
00
0.10
0.
00
0.11
0.
01
0.16
1.
54
8.50
2.
40
10.9
0 26
27
4.
80
0.20
0.
80
1.00
0.
00
0.00
0.
01
0.06
0.
09
0.10
0.
00
0.05
0.
17
0.30
0.
02
0.00
0.
10
0.00
0.
11
0.01
0.
16
1.73
9.
60
2.50
12
.10
27
28
5.30
0.
20
0.90
1.
20
0.00
0.
01
0.01
0.
06
0.09
0.
10
0.00
0.
05
0.17
0.
30
0.02
0.
00
0.10
0.
01
0.10
0.
01
0.16
1.
92
10.6
0 2.
60
13.2
0 28
29
6.
00
0.20
0.
90
1.30
0.
00
0.01
0.
01
0.07
0.
09
0.10
0.
00
0.05
0.
17
0.30
0.
02
0.00
0.
10
0.01
0.
10
0.01
0.
16
2.21
11
.70
2.70
14
.40
29
30
6
.70
0
.30
1
.00
1
.50
0
.00
0
.01
0
.01
0
.07
0
.10
0.
09
0.0
0
0.0
5
0.1
7
0.3
0
0.0
2
0.0
0
0.1
0
0.0
1
0.1
0
0.0
1
0.1
6
2.5
0
13
.10
2
.80
1
5.9
0
30
31
7.40
0.
40
1.10
1.
60
0.00
0.
01
0.01
0.
08
0.10
0.
09
0.00
0.
05
0.17
0.
30
0.02
0.
00
0.10
0.
01
0.09
0.
02
0.16
2.
78
14.4
0 3.
00
17.4
0 31
32
8.
30
0.40
1.
20
1.80
0.
01
0.01
0.
01
0.08
0.
10
0.09
0.
00
0.05
0.
18
0.30
0.
02
0.00
0.
10
0.01
0.
09
0.02
0.
16
3.16
16
.00
3.10
19
.10
32
33
9.10
0.
50
1.30
1.
90
0.01
0.
01
0.01
0.
09
0.10
0.
09
0.00
0.
05
0.18
0.
40
0.03
0.
00
0.10
0.
01
0.09
0.
02
0.16
3.
54
17.6
0 3.
20
20.8
0 33
34
10
.10
0.60
1.
40
2.00
0.
01
0.02
0.
01
0.09
0.
11
0.10
0.
00
0.05
0.
19
0.40
0.
03
0.00
0.
10
0.01
0.
09
0.03
0.
16
4.02
19
.40
3.30
22
.70
34
35
1
1.0
0
0.8
0
1.5
0
2.2
0
0.0
1
0.0
2
0.0
1
0.1
0
0.1
1
0.10
0
.10
0
.05
0
.19
0
.40
0
.03
0
.00
0
.10
0
.02
0
.08
0
.03
0
.16
4
.49
2
1.4
0
3.5
0
24
.90
35
36
12
.10
0.90
1.
60
2.30
0.
01
0.03
0.
01
0.10
0.
11
0.10
0.
10
0.05
0.
20
0.40
0.
03
0.00
0.
10
0.02
0.
08
0.04
0.
16
5.05
23
.40
3.60
27
.00
36
37
13.2
0 1.
10
1.80
2.
40
0.02
0.
03
0.01
0.
11
0.11
0.
10
0.10
0.
05
0.21
0.
40
0.04
0.
00
0.20
0.
02
0.08
0.
05
0.16
5.
71
25.8
0 3.
70
29.5
0 37
38
14
.40
1.40
1.
90
2.40
0.
02
0.04
0.
01
0.12
0.
12
0.11
0.
10
0.05
0.
22
0.40
0.
04
0.00
0.
20
0.03
0.
08
0.06
0.
15
6.36
28
.10
3.90
32
.00
38
39
15.7
0 1.
60
2.10
2.
50
0.03
0.
04
0.02
0.
12
0.12
0.
11
0.10
0.
06
0.23
0.
50
0.04
0.
00
0.20
0.
03
0.08
0.
07
0.15
7.
11
30.8
0 4.
00
34.8
0 39
4
0
17
.20
1
.90
2
.30
2
.50
0
.03
0
.05
0
.02
0
.13
0
.13
0.
11
0.2
0
0.0
6
0.2
5
0.5
0
0.0
5
0.0
0
0.2
0
0.0
4
0.0
7
0.0
8
0.1
5
8.0
5
33
.90
4
.20
3
8.1
0
40
41
18.8
0 2.
30
2.60
2.
60
0.04
0.
06
0.02
0.
14
0.13
0.
11
0.20
0.
06
0.26
0.
50
0.05
0.
00
0.20
0.
05
0.07
0.
09
0.15
8.
97
37.3
0 4.
50
41.8
0 41
42
20
.70
2.70
2.
80
2.60
0.
05
0.08
0.
02
0.15
0.
13
0.12
0.
20
0.06
0.
28
0.50
0.
05
0.00
0.
20
0.05
0.
07
0.11
0.
15
9.99
40
.90
4.90
45
.80
42
43
22.7
0 3.
10
3.10
2.
60
0.06
0.
09
0.02
0.
15
0.14
0.
12
0.30
0.
06
0.30
0.
50
0.06
0.
00
0.20
0.
06
0.07
0.
13
0.15
11
.09
44.9
0 5.
20
50.1
0 43
44
25
.00
3.50
3.
40
2.50
0.
08
0.10
0.
03
0.16
0.
14
0.12
0.
30
0.06
0.
33
0.50
0.
06
0.00
0.
20
0.07
0.
07
0.15
0.
15
12.2
8 49
.10
5.50
54
.60
44
45
2
7.6
0
4.0
0
3.7
0
2.5
0
0.1
0
0.1
2
0.0
3
0.1
7
0.1
5
0.12
0
.40
0
.07
0
.36
0
.60
0
.07
0
.00
0
.20
0
.09
0
.07
0
.18
0
.15
1
3.5
5
54
.10
5
.80
5
9.9
0
45
46
30.6
0 4.
50
4.00
2.
40
0.12
0.
14
0.03
0.
18
0.15
0.
13
0.50
0.
07
0.39
0.
60
0.07
0.
00
0.20
0.
10
0.07
0.
21
0.15
15
.10
59.6
0 6.
10
65.7
0 46
47
33
.80
5.10
4.
30
2.40
0.
15
0.17
0.
04
0.19
0.
16
0.13
0.
60
0.07
0.
43
0.60
0.
08
0.00
0.
20
0.12
0.
07
0.25
0.
15
16.5
3 65
.40
6.40
71
.80
47
48
37.2
0 5.
60
4.70
2.
30
0.19
0.
20
0.04
0.
20
0.17
0.
13
0.70
0.
08
0.47
0.
60
0.09
0.
00
0.30
0.
14
0.07
0.
29
0.15
18
.23
71.7
0 6.
70
78.4
0 48
49
40
.80
6.20
5.
00
2.20
0.
24
0.23
0.
05
0.20
0.
17
0.13
0.
80
0.08
0.
53
0.60
0.
09
0.00
0.
30
0.16
0.
07
0.34
0.
15
19.8
9 78
.10
6.80
84
.90
49
50
4
4.4
0
6.9
0
5.4
0
2.1
0
0.3
0
0.2
7
0.0
5
0.2
1
0.1
8
0.13
0
.90
0
.08
0
.59
0
.60
0
.10
0
.00
0
.30
0
.18
0
.07
0
.40
0
.15
2
1.7
1
84
.90
7
.00
9
1.9
0
50
51
48.2
0 7.
60
5.80
2.
00
0.38
0.
31
0.06
0.
22
0.19
0.
14
1.00
0.
09
0.66
0.
70
0.11
0.
00
0.30
0.
21
0.07
0.
47
0.14
23
.59
92.1
0 7.
30
99.4
0 51
52
52
.00
8.40
6.
30
1.90
0.
48
0.35
0.
07
0.22
0.
20
0.14
1.
20
0.09
0.
74
0.70
0.
12
0.00
0.
30
0.24
0.
07
0.54
0.
14
25.5
2 99
.60
7.40
10
7.00
52
53
55
.80
9.30
6.
80
1.90
0.
61
0.41
0.
08
0.23
0.
21
0.15
1.
30
0.10
0.
83
0.70
0.
13
0.00
0.
30
0.28
0.
08
0.63
0.
14
27.5
7 10
7.40
7.
80
115.
20
53
54
59.7
0 10
.40
7.30
1.
80
0.77
0.
47
0.10
0.
24
0.22
0.
15
1.50
0.
10
0.95
0.
70
0.14
0.
00
0.30
0.
32
0.08
0.
73
0.14
29
.65
115.
60
8.20
12
3.80
54
5
5
63
.60
1
1.5
0
7.9
0
1.7
0
0.9
7
0.5
4
0.1
2
0.2
4
0.2
3
0.16
1
.80
0
.11
1
.08
0
.80
0
.15
0
.00
0
.30
0
.36
0
.08
0
.84
0
.14
3
1.8
4
12
4.3
0
8.8
0
13
3.1
0
55
56
67.6
0 12
.80
8.50
1.
60
1.21
0.
61
0.14
0.
25
0.24
0.
16
2.00
0.
12
1.23
0.
80
0.17
0.
00
0.30
0.
41
0.08
0.
97
0.14
33
.94
133.
10
9.40
14
2.50
56
57
71
.50
14.3
0 9.
20
1.50
1.
52
0.70
0.
16
0.26
0.
25
0.17
2.
30
0.13
1.
40
0.80
0.
18
0.00
0.
30
0.46
0.
08
1.10
0.
14
36.1
1 14
2.40
10
.20
152.
60
57
58
75.4
0 16
.00
10.1
0 1.
40
1.92
0.
79
0.19
0.
26
0.27
0.
18
2.70
0.
13
1.60
0.
80
0.20
0.
00
0.30
0.
52
0.09
1.
26
0.14
38
.24
152.
30
11.2
0 16
3.50
58
59
79
.30
17.8
0 11
.00
1.30
2.
42
0.88
0.
22
0.27
0.
29
0.19
3.
00
0.15
1.
81
0.90
0.
22
0.00
0.
30
0.58
0.
09
1.43
0.
14
40.3
1 16
2.40
12
.50
174.
90
59
60
8
3.1
0
19
.90
1
2.0
0
1.2
0
3.0
4
0.9
8
0.2
7
0.2
7
0.3
1
0.20
3
.40
0
.16
2
.05
0
.90
0
.24
0
.00
0
.30
0
.64
0
.10
1
.62
0
.14
4
2.2
9
17
2.9
0
14
.00
1
86
.90
60
61
86
.80
22.1
0 13
.20
1.10
3.
80
1.08
0.
32
0.28
0.
33
0.21
3.
90
0.17
2.
30
0.90
0.
27
0.00
0.
30
0.71
0.
10
1.84
0.
14
44.2
7 18
3.90
16
.00
199.
90
61
62
90.5
0 24
.50
14.6
0 1.
00
4.75
1.
18
0.38
0.
28
0.36
0.
22
4.40
0.
19
2.58
1.
00
0.29
0.
00
0.20
0.
77
0.10
2.
08
0.15
46
.19
195.
50
18.3
0 21
3.80
62
63
94
.20
27.1
0 16
.20
0.90
5.
94
1.29
0.
45
0.29
0.
39
0.24
4.
90
0.20
2.
87
1.00
0.
32
0.00
0.
20
0.84
0.
11
2.35
0.
15
48.0
0 20
7.70
21
.00
228.
70
63
64
97.9
0 29
.80
17.9
0 0.
80
7.41
1.
38
0.53
0.
29
0.43
0.
26
5.50
0.
22
3.17
1.
00
0.36
0.
00
0.20
0.
91
0.11
2.
66
0.15
49
.76
220.
50
24.1
0 24
4.60
64
6
5
10
1.8
0
32
.70
1
9.9
0
0.7
0
9.2
0
1.4
8
0.6
2
0.3
0
0.4
8
0.28
6
.00
0
.25
3
.48
1
.10
0
.39
0
.00
0
.20
0
.98
0
.12
3
.02
0
.15
5
1.3
2
23
4.2
0
27
.50
2
61
.70
65
66
10
5.90
35
.70
22.2
0 0.
70
11.3
8 1.
57
0.74
0.
31
0.54
0.
30
6.60
0.
27
3.80
1.
10
0.43
0.
00
0.10
1.
04
0.13
3.
42
0.16
0.
00
196.
10
54.4
0 25
0.50
66
67
11
0.30
39
.00
24.8
0 0.
60
14.0
2 1.
64
0.86
0.
32
0.61
0.
32
7.20
0.
30
4.11
1.
20
0.47
0.
00
0.10
1.
10
0.13
3.
88
0.16
0.
00
210.
80
60.8
0 27
1.60
67
68
11
5.00
42
.40
27.6
0 0.
50
17.2
2 1.
70
1.00
0.
33
0.69
0.
35
7.70
0.
33
4.42
1.
30
0.52
0.
00
0.10
1.
15
0.14
4.
39
0.17
0.
00
226.
70
68.3
0 29
5.00
68
69
12
0.20
46
.00
30.8
0 0.
50
21.0
6 1.
75
1.16
0.
34
0.80
0.
38
8.20
0.
37
4.73
1.
40
0.57
0.
00
0.10
1.
20
0.15
4.
95
0.18
0.
00
244.
50
77.2
0 32
1.70
69
7
0
12
6.0
0
49
.90
3
4.3
0
0.4
0
25
.64
1
.78
1
.34
0
.35
0
.93
0.
42
8.5
0
0.4
2
5.0
2
1.5
0
0.6
2
0.0
0
0.1
0
1.2
3
0.1
5
5.5
8
0.1
9
0.0
0
26
3.9
0
88
.00
3
51
.90
70
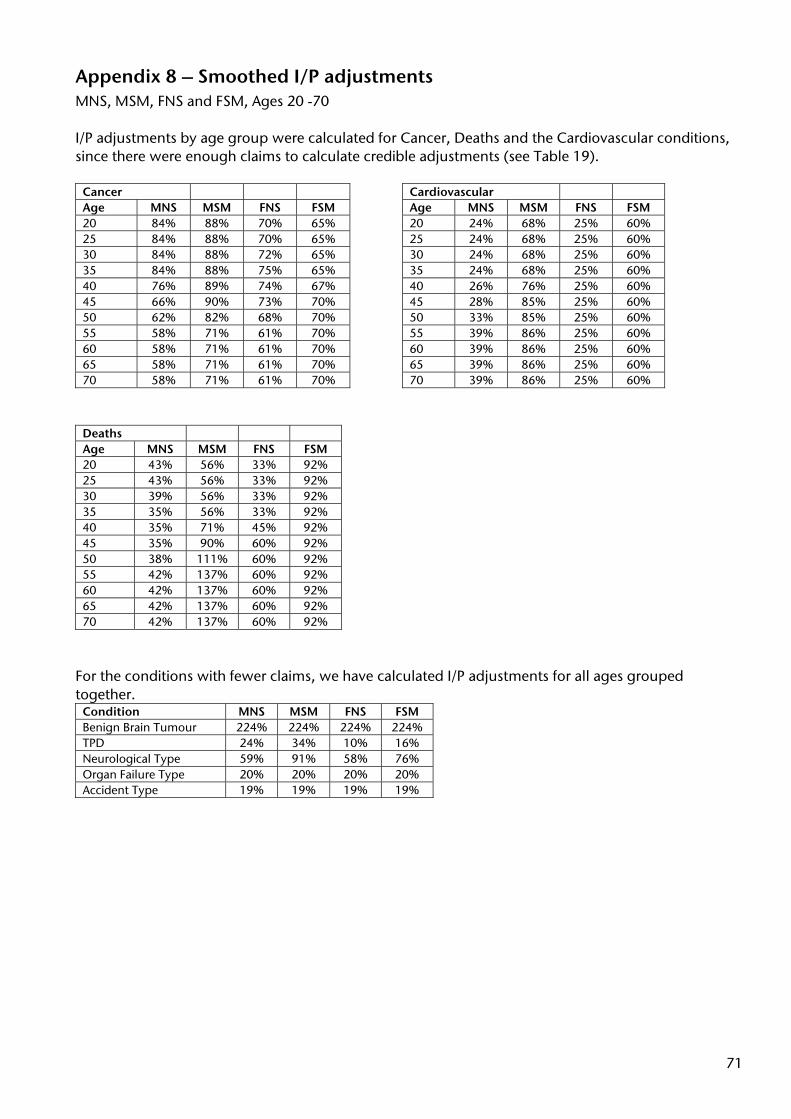
71
Appendix 8 – Smoothed I/P adjustments MNS, MSM, FNS and FSM, Ages 20 -70 I/P adjustments by age group were calculated for Cancer, Deaths and the Cardiovascular conditions, since there were enough claims to calculate credible adjustments (see Table 19).
Cancer Cardiovascular Age MNS MSM FNS FSM Age MNS MSM FNS FSM 20 84% 88% 70% 65% 20 24% 68% 25% 60% 25 84% 88% 70% 65% 25 24% 68% 25% 60% 30 84% 88% 72% 65% 30 24% 68% 25% 60% 35 84% 88% 75% 65% 35 24% 68% 25% 60% 40 76% 89% 74% 67% 40 26% 76% 25% 60% 45 66% 90% 73% 70% 45 28% 85% 25% 60% 50 62% 82% 68% 70% 50 33% 85% 25% 60% 55 58% 71% 61% 70% 55 39% 86% 25% 60% 60 58% 71% 61% 70% 60 39% 86% 25% 60% 65 58% 71% 61% 70% 65 39% 86% 25% 60% 70 58% 71% 61% 70% 70 39% 86% 25% 60%
Deaths Age MNS MSM FNS FSM 20 43% 56% 33% 92% 25 43% 56% 33% 92% 30 39% 56% 33% 92% 35 35% 56% 33% 92% 40 35% 71% 45% 92% 45 35% 90% 60% 92% 50 38% 111% 60% 92% 55 42% 137% 60% 92% 60 42% 137% 60% 92% 65 42% 137% 60% 92% 70 42% 137% 60% 92%
For the conditions with fewer claims, we have calculated I/P adjustments for all ages grouped together.
Condition MNS MSM FNS FSM Benign Brain Tumour 224% 224% 224% 224% TPD 24% 34% 10% 16% Neurological Type 59% 91% 58% 76% Organ Failure Type 20% 20% 20% 20% Accident Type 19% 19% 19% 19%

72
Appendix 9 – Anonymised Client data against CIIT00 The null hypothesis is that the claims in each cohort are within a 99% confidence interval of the Expected, where the Expected is based on CIIT00, but scaled down by the office’s overall A/E.
Table 43 - Hypothesis test on whether the actual claims are inside a 99% confidence interval based on scaled CIIT00 Expected rates
Office A Office B MNS Duration MNS Duration Age 0 1 2 3+ Age 0 1 2 3+ 0-30 Accept Accept Accept Reject 0-30 Accept Accept Accept Accept 31-40 Accept Accept Accept Accept 31-40 Accept Accept Accept Accept 41-50 Accept Accept Accept Accept 41-50 Accept Accept Accept Accept 51-60 Accept Accept Accept Accept 51-60 Accept Accept Accept Accept 60-99 Accept Accept Accept Accept 60-99 Accept Accept Accept Accept MSM Duration MSM Duration Age 0 1 2 3+ Age 0 1 2 3+ 0-30 Accept Accept Accept Accept 0-30 Accept Accept Accept Accept 31-40 Accept Accept Accept Accept 31-40 Accept Accept Accept Accept 41-50 Accept Accept Accept Accept 41-50 Accept Accept Accept Accept 51-60 Accept Accept Accept Accept 51-60 Accept Accept Accept Accept 60-99 Accept Accept Accept Accept 60-99 Accept Accept Accept Accept FNS Duration FNS Duration Age 0 1 2 3+ Age 0 1 2 3+ 0-30 Accept Accept Accept Accept 0-30 Accept Accept Accept Accept 31-40 Accept Accept Accept Accept 31-40 Accept Accept Accept Accept 41-50 Accept Accept Accept Accept 41-50 Accept Accept Accept Accept 51-60 Accept Accept Accept Accept 51-60 Accept Accept Accept Accept 60-99 Accept Accept Accept Accept 60-99 Accept Accept Accept Accept FSM Duration FSM Duration Age 0 1 2 3+ Age 0 1 2 3+ 0-30 Accept Accept Accept Accept 0-30 Accept Accept Accept Accept 31-40 Accept Accept Accept Accept 31-40 Accept Accept Reject Accept 41-50 Reject Accept Accept Accept 41-50 Accept Accept Accept Accept 51-60 Reject Accept Accept Accept 51-60 Accept Accept Accept Accept 60-99 Accept Accept Accept Accept 60-99 Accept Accept Reject Accept
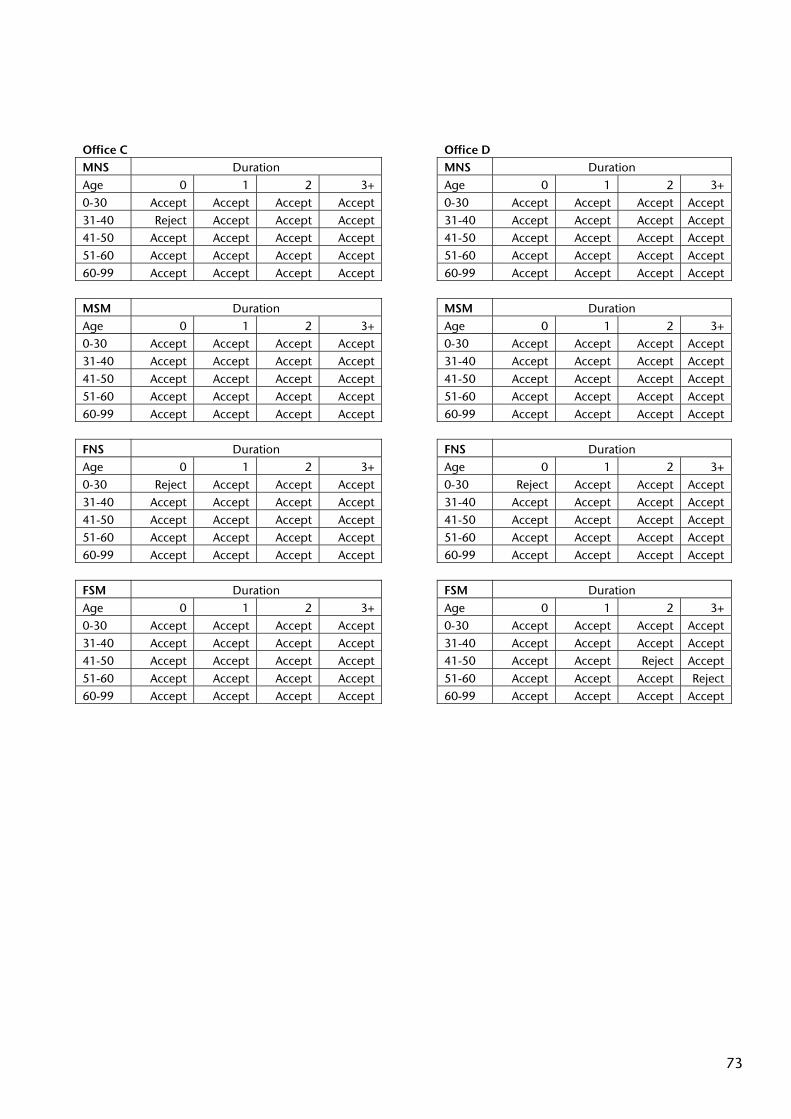
73
Office C Office D MNS Duration MNS Duration Age 0 1 2 3+ Age 0 1 2 3+ 0-30 Accept Accept Accept Accept 0-30 Accept Accept Accept Accept 31-40 Reject Accept Accept Accept 31-40 Accept Accept Accept Accept 41-50 Accept Accept Accept Accept 41-50 Accept Accept Accept Accept 51-60 Accept Accept Accept Accept 51-60 Accept Accept Accept Accept 60-99 Accept Accept Accept Accept 60-99 Accept Accept Accept Accept MSM Duration MSM Duration Age 0 1 2 3+ Age 0 1 2 3+ 0-30 Accept Accept Accept Accept 0-30 Accept Accept Accept Accept 31-40 Accept Accept Accept Accept 31-40 Accept Accept Accept Accept 41-50 Accept Accept Accept Accept 41-50 Accept Accept Accept Accept 51-60 Accept Accept Accept Accept 51-60 Accept Accept Accept Accept 60-99 Accept Accept Accept Accept 60-99 Accept Accept Accept Accept FNS Duration FNS Duration Age 0 1 2 3+ Age 0 1 2 3+ 0-30 Reject Accept Accept Accept 0-30 Reject Accept Accept Accept 31-40 Accept Accept Accept Accept 31-40 Accept Accept Accept Accept 41-50 Accept Accept Accept Accept 41-50 Accept Accept Accept Accept 51-60 Accept Accept Accept Accept 51-60 Accept Accept Accept Accept 60-99 Accept Accept Accept Accept 60-99 Accept Accept Accept Accept FSM Duration FSM Duration Age 0 1 2 3+ Age 0 1 2 3+ 0-30 Accept Accept Accept Accept 0-30 Accept Accept Accept Accept 31-40 Accept Accept Accept Accept 31-40 Accept Accept Accept Accept 41-50 Accept Accept Accept Accept 41-50 Accept Accept Reject Accept 51-60 Accept Accept Accept Accept 51-60 Accept Accept Accept Reject 60-99 Accept Accept Accept Accept 60-99 Accept Accept Accept Accept

74
Appendix 10 – References • ABI Statement of Best Practice.
Weblink: http://www.abi.org.uk/Display/default.asp?Menu_ID=1140&Menu_All=1,946,1140&Child_ID=474
• Benjamin and Pollard (1993), The Analysis of Mortality and Other Actuarial Statistics. • CMI (2005). Working Paper 14: Methodology Underlying the 1999-2002 CMI Critical Illness
Experience Investigation. The Faculty of Actuaries and Institute of Actuaries. Weblink: http://www.actuaries.org.uk/Display_Page.cgi?url=/library/cmi.xml
• CMI (2005). Working Paper 18: 1999-2002 CMI Critical Illness Experience: Feedback on Working Paper
14 and Future Work. The Faculty of Actuaries and Institute of Actuaries. Weblink: http://www.actuaries.org.uk/Display_Page.cgi?url=/library/cmi.xml
• CMI presentation (2005). CMI Critical Illness Update: Current Issues in Critical Illness.
Weblink: http://www.actuaries.org.uk/files/pdf/proceedings/ci20051207/Grimshaw.pdf
• Dinani, A., Grimshaw, D., Robjohns, N., Somerville, S.V., Spry A.J.B., Staffurth, J.A.F. (2000). A
Critical Review. Weblink: http://www.sias.org.uk/view_paper?id=CriticalReview
• Robjohns, N., Galloway, H., Morris, R., Reid, S.K., Wells, J. (2006). Exploring the Critical Path.
Weblink: http://www.sias.org.uk/view_paper?id=CITrends


![Interventions for preventing critical illness ... · [Intervention Review] Interventions for preventing critical illness polyneuropathy and critical illness myopathy Greet Hermans2,](https://img.pdfslide.us/doc/110x75/5f804b24e9ab6257b4401362/interventions-for-preventing-critical-illness-intervention-review-interventions.jpg)