Embed Size (px)
Citation preview

psychon~uroendocrinology. Vok 17. No. 6. pp. 565-591, 1992 0306-4530/92 $5.00+0.00 Printed in Great Britain Pergamon Press I.~d.
A CRITICAL REVIEW OF MENSTRUAL SYNCHRONY RESEARCH
H . CLYDE W I L S O N
Department of Anthropology, University of Missouri - Columbia, Columbia, Missouri, U.S.A.
(Received 23 July 1990; in final form 25 July 1992)
SUMMARY
Two experiments and three studies reported a significant level of menstrual synchrony after subjects had been treated with applications of axillary extract from a donor subject or after subjects have spent time together. Four studies failed to replicate these results. A comparison of the studies shows the only consistent difference is that those studies not finding menstrual synchrony reported problems with subjects who had irregular cycle lengths, while those finding menstrual synchrony reported no such problems. All experiments and studies were based on the methods and research design introduced by McClintock (1971). Three errors are inherent in research based on her model: (1) an implicit assumption that differences between menses onsets of randomly paired subjects vary randomly over consecutive onsets, (2) an incorrect procedure for determining the initial onset absolute difference between subjects, and (3) exclusion of subjects or some onsets of subjects who do not have the number of onsets specified by the research design. All of these errors increase the probability of finding menstrual synchrony in a sample. One or more of these errors occurred in the experiments and studies reporting synchrony; no significant levels of menstrual synchrony occur when these errors are corrected. Menstrual synchrony is not demonstrated in any of the experiments or studies.
INTRODUCTION
IN 1971 McClintock published an article reporting menstrual synchrony in pairs and groups of college w o m e n who spent time together. By 1978, the date I began menstrual synchrony research, McClintock's article had been cited over 40 times in the scientific literature and con- tinues to be cited in professional journals, literature on biological and psychologica l issues regarding women, and the popular media (e.g., Monmaney, 1987). The possibility that one woman might influence the menstrual cycle of another has both practical and theoretical impli- cations. The pract ical impl ica t ion is the potent ia l o f a p h e r o m o n e or some other signal influencing the timing of ovulation that would assist in reproductive scheduling. The theoreti- cal implication is understanding synchronous ovulation as the product of natural selection in human biological evolution.
Several types o f behavior are known to influence menstrual cycles and ovulation in humans: prolonged and intensive breast feeding, loss of body fat below certain levels, psychological stress, and ingestion or injection of hormones. McClintock's research raises the added possibil-
Address correspondence and reprint requests to: Dr. H. C. Wilson, Department of Anthropology, University of Missouri - Columbia, 200 Swallow Hall, Columbia MO 65211, USA.
565
566 H.C. Wtt.soN
ity of pheromonal control of menstrual cycles and the timing of ovulation. Rogel (1978) cites McClintock in her extensive review, "A Critical Evaluation of the Possibility of Higher Primate Reproductive and Sexual Pheromones," and suggests:
From the research discussed in this article, it seems that the most promising area in which to search for pheromonal control of higher primate sexual and reproductive behavior is menstrual synchrony, a phenomenon that suggests the action of a primer pheromone. (p. 826)
Bennett (1974) pointed to "the contraceptive possibilities of pheromones" as one of the research areas on chemical contraceptives under study (pp. 181-182). Convincing evidence menstrual synchrony occurs in humans would justify a major research effort to identify the pheromone or other phenomenon responsible for this effect.
Confirming menstrual synchrony in humans also could contribute to the emerging body of evidence that stresses the importance of primate females in mate choice, gestation, and infant care. Until recently, theories in evolutionary biology have concentrated on the primate male's choice of mates; the estrous females were considered neutral or passive in this process (Hrdy, 1981, pp. 11-12). However, field studies of primates report dominance hierarchies among females in many species (Hrdy, 1981). Further, these dominant females favorably compete with subordinate females for reproductive access to the males and have significantly greater reproductive success (Drickamer, 1974; Dunbar & Dunbar, 1977). Therefore, if all females have synchronized ovarian cycles, a dominant female could enhance her reproduc!ive potential by monopolizing the sperm, consortship and protection of a dominant male. Using a different argument, Turke (1984) suggests each male would be occupied with a female, if the females have synchronous ovarian cycles and extended sexual receptivity. Thus, a female's reproduc- tive success is increased by her male's exclusive consortship and his increased parental effort.
McClintock's study has been replicated twice and has received additional support from two experiments. Four studies failed to replicate her study. This review examines the causes for these conflicting results. First, I review the menstrual synchrony experiments and studies and compare the seven field studies, i.e., research in which no attempt was made to control environ- mental factors or manipulate the behavior of the subjects, on the basis of seven variables. Second, I describe and explain three errors that bias the results of menstrual synchrony research. And, third, I use these errors to indicate biases in the three studies and two experi- ments reporting menstrual synchrony. My conclusion is that menstrual synchrony has not been demonstrated in any of these studies or experiments.
A REVIEW OF MENSTRUAL SYNCHRONY STUDIES
All the studies and experiments are based on methods introduced by McClintock (1971). In the studies, subjects with no previous social contact come together in a social setting such as becoming roommates. The absolute difference between dates of the subjects' first post-contact menses onsets is determined. After a period of several months, the absolute difference between the subjects' menses onsets dates is determined over the same number of onsets. A decrease from the initial to the final onset absolute difference is defined as menstrual synchrony. In the experiments, subjects received on their upper lips scheduled application of axillary extract taken from a donor subject. The absolute difference between the first application and the initial menses onset of the subject is determined. The final onset absolute difference is determined after an equal number of applications and subjects' onsets. As before, a decrease from the initial to the final absolute differences is defined as synchrony.
MENSTRUAL SYNCHRONY RESEARCH 567
The first published replication of McClintock's study was when Graham and McGrew (1980) reported menstrual synchrony in a sample of 18 pairs of closest friends at a coeducational university in Scotland. The same year Russell et al. (1980) reported an experiment in which five women synchronized their menses onsets with an unknown donor after being treated over four menstrual cycles with the odor of a donor's axillary secretions. The following year, in a second replication of McClintock's study, Quadagno et al. (1981) reported menstrual synchrony among close friends and roommates at a coeducational state university. Finally, in 1986 Preti et al. (1986), in an experiment similar to that of Russell et al. (1980), found that, after two men- strual cycles, a sample of 10 women experienced a significant decrease in the absolute differ- ence between the women's menses onsets and the applications of the donor's axillary secretions.
However, four other studies failed to find menstrual synchrony. Pfaff (1980) did not find menstrual synchrony in samples of roommates and close friends at a coeducational state univer- sity; Jarett (1984) reported no significant synchrony in a sample of roommates from two women's colleges; and Wilson et al. (1991) did not find menstrual synchrony in samples of pairs and groups of subjects in a sorority and in a cooperative house on the campus of a coedu- cational state university.
The experiments introduced several controls, e.g., selection of subjects with regular cycles who were not taking oral contraceptives, scheduling of the treatment cycles, double-blind treat- ment procedures, and control groups receiving placebo treatments. The seven studies, lacking the controls of the experiments, differ in several major variables that could have influenced the outcome of the studies. Seven of these variables were examined to determine which, if any, might explain the conflicting results reported in the studies: (1) differences in the environmen- tal setting, e.g., coeducational university or women's college, (2) differences in the percentage of subjects using oral contraceptives, (3) differences in the length of the study period, (4) differ- ences in sample size, (5) differences in method of selecting the study sample, e.g., volunteers or selected by the investigator, (6) differences in age of the subjects, and (7) differences in reported frequency of subjects with irregular cycles or amenorrhea. The first six of these vari- ables showed no significant difference between those studies reporting significant levels of syn- chrony and those reporting no significant levels of synchrony, e.g., subjects in all the samples were in the same age range, and McClintock (1971) found synchrony but Jarett (1984) did not find synchrony, though both used subjects from women's colleges. The only variable that clearly differentiates the menstrual synchrony studies reporting positive results from those reporting negative results is the reported frequencies of menstrual cycle irregularity and amen- orrhea. McClintock (1971), Graham and McGrew (1980), and Quadagno et al. (1981) found significant levels of menstrual synchrony in their samples and reported no problems with subjects having irregular cycles or amenorrhea. Pfaff (1980), Jarett (1984), and Wilson et al.
(1991) found no significant levels of menstrual synchrony in their samples, and all of them had to make changes in McClintock's methods to adjust for high frequencies of subjects with irreg- ular menstrual cycles or amenorrhea. The possible source of this difference is considered below (Error III).
THREE ERRORS IN THE STUDY OF MENSTRUAL SYNCHRONY
The methods used in experiments and studies for determining menstrual synchrony in pairs of subjects have included three types of errors: (1) failure to recognize that a probable one-half of the pairs in a sample synchronize by chance, (2) miscalculation of the absolute difference between initial menses onsets, and (3) exclusion from the sample of those subjects or some

568 H.C. wtt.so.~
onsets of subjects in order to fit the number of onsets to the specifications of the research design. All of these errors increase the probability of finding a statistically significant level of menstrual synchrony in a sample. These three errors also occur in samples of groups of subjects. However, I will postpone discussion of the special case of group samples until my review of McClintock's samples of groups. Artificial data and samples from studies conducted by Wilson et al. (1991) are used to illustrate sources of these errors and how they bias the results of menstrual synchrony research.
Error I Error I is the implicit assumption that, at the beginning of the observation period, either the
differences between menses onsets of pairs of subjects are varying randomly or the differences between menses onsets of subjects are increasing. None of the studies or experiments makes an explicit assumption about the expected direction of change between menstrual onsets, though they all assume that a decrease in onset differences between pairs of subjects over the same number of onsets is an indication of menstrual synchrony. However, at the beginning of the observation period, approximately one-half of the pairs of a sample have onset differences that are decreasing over the same number of menstrual cycles. This apparent synchrony is due to chance factors as shown in the following set of equations.
For any randomly paired subjects, the relationship between menstrual onsets over the same number of cycles is expressed as:
O~= IC~ (X, - Xb) + (Ta o - Tbo)l (equation 1)
Where D~ is the onset absolute difference at cycle c~ (i = 0.1,2,3...), xa and xb are the mean cycles lengths of subjects A and B, and Tao and Tbo are the dates of the initial onsets for subjects A and B at cycle 0.
Three cases are derived from equation 1:
Case A. if xa = xb, then c~ (x, - x b) = 0, and o~ is the same at all onsets; Case B. if 2 , , xb and r a o = rbo, or if X~ > Xb and Tao > Tbo, or if Xb > X~ and Xbo > T,o,
then o~ increases at the rate of IC= (xa - Xb)l: and, Case C. if ~. > xb and T.o < Tbo, or if Xb > x. and Tbo < Vao,
then c> i decreases at the rate of I¢~ (x. - Xb)l until o~ = 0, and t>~ increases at the rate of IC~ (x. - Xb)l thereafter.
These three conditions can be restated as follows:
Case A. if randomly paired subjects have the same mean cycle lengths, then over an equal number of consecutive onsets the absolute differences between onset dates remains constant; and
Case B. if randomly paired subjects have unequal mean cycle lengths and the initial onsets of both subjects occur on the same day, or if the subject with the greater mean cycle length has the second recorded onset date, then over an equal number of consecutive onsets the onset absolute differences increase (diverge) at the rate of the difference between the mean cycle lengths of the pair; and
Case C. if a pair of subjects has unequal mean cycle lengths and the subject with the greater mean cycle length has the first recorded onset date, then over an equal number of consecutive onsets the onset absolute differences initially decrease (converge) at the rate of the difference between mean cycle lengths of the pair until the onset difference reaches 0, and thereafter they increase (diverge) at the same rate the onset difference decreased.
M~STRUAL SYNCHRONY RESEARCH 569
Thus, over the first several onsets, whether the onset difference of randomly paired subjects remains constant (case A), increases (case B) or decreases (case C) is due to the chance factors of the subjects' relative mean menstrual cycle lengths and the order of their initial onset dates.
For purposes of this discussion, I assume cases B and C each have an equal chance of occurring, i.e., p = q= 0.5. Justification for this decision is that case A, where onset differences remain constant over consecutive onsets, seldom occurs in actual samples. The distribution of cases A, B and C among 59 pairs in a sorority roommates sample (Wilson et al., 1991) is one case, 30 cases, and 28 cases, respectively. Further, cases in which the difference between the initial and final onsets is zero are dropped from analysis in both the Wilcoxon and sign tests and thus do not affect the statistical tests comparing the initial and final mean onset absolute differ- ences.
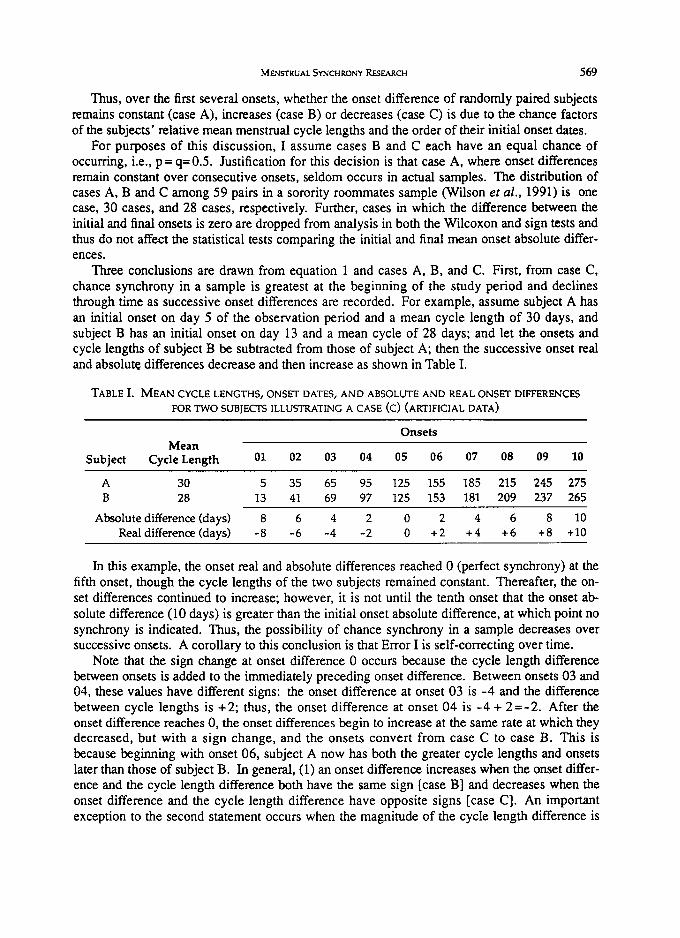
Three conclusions are drawn from equation 1 and cases A, B, and C. First, from case C, chance synchrony in a sample is greatest at the beginning of the study period and declines through time as successive onset differences are recorded. For example, assume subject A has an initial onset on day 5 of the observation period and a mean cycle length of 30 days, and subject B has an initial onset on day 13 and a mean cycle of 28 days; and let the onsets and cycle lengths of subject B be subtracted from those of subject A; then the successive onset real and absolute differences decrease and then increase as shown in Table I.
TABLE 1. MEAN CYCLE LENGTHS, ONSET DATES, AND ABSOLUTE AND REAL ONSET DIFFERENCES FOR TWO SUBJECTS ILLUSTRATING A CASE (C) (ARTIFICIAL DATA)
Onsets Mean
Subject Cycle Length 01 02 03 04 05 06 07 08 09 10
A 30 5 35 65 95 125 155 185 215 245 275 B 28 13 41 69 97 125 153 181 209 237 265
Absolute difference(days) 8 6 4 2 0 2 4 6 8 10 Real difference(days) -8 -6 -4 -2 0 +2 +4 +6 +8 +10
In this example, the onset real and absolute differences reached 0 (perfect synchrony) at the fifth onset, though the cycle lengths of the two subjects remained constant. Thereafter, the on- set differences continued to increase; however, it is not until the tenth onset that the onset ab- solute difference (10 days) is greater than the initial onset absolute difference, at which point no synchrony is indicated. Thus, the possibility of chance synchrony in a sample decreases over successive onsets. A corollary to this conclusion is that Error I is self-correcting over time.
Note that the sign change at onset difference 0 occurs because the cycle length difference between onsets is added to the immediately preceding onset difference. Between onsets 03 and 04, these values have different signs: the onset difference at onset 03 is -4 and the difference between cycle lengths is +2; thus, the onset difference at onset 04 is -4 + 2 = - 2 . After the onset difference reaches 0, the onset differences begin to increase at the same rate at which they decreased, but with a sign change, and the onsets convert from case C to case B. This is because beginning with onset 06, subject A now has both the greater cycle lengths and onsets later than those of subject B. In general, (1) an onset difference increases when the onset differ- ence and the cycle length difference both have the same sign [case B] and decreases when the onset difference and the cycle length difference have opposite signs [case C]. An important exception to the second statement occurs when the magnitude of the cycle length difference is
570 H.C. W~t~, '
more than twice the magnitude of the onset difference. For example, if the onset difference is -2 and the cycle length difference to the next onset is +5, then the onset difference increases to +3. In this case, the 0 difference is reached and exceeded in a single cycle, as indicated by the change in the sign of the onset difference. I underscore this point because it is crucial to under- standing the later discussion of synchrony in groups of subjects.
The second conclusion to be drawn from equation 1 is that the magnitude of change in the difference between initial and final onsets of subjects is irrelevant, since it is a product of the difference between the mean cycle lengths of the subjects and the number of cycles over which onset differences are measured, neither of which are necessarily related to menstrual synchrony. Further, in cases of decreasing onset differences, the magnitude of change between the initial and final onset absolute differences is limited by the magnitude of the initial onset absolute dif- ference. Therefore, the initial and final onset absolute differences are correlated; the larger the initial onset difference, the greater the possible decrease in the magnitude of the difference between the initial and final onset differences. It follows, then, that the calculation of decreas- ing and increasing differences is asymmetrical; decreasing onset differences have a limit set by the magnitude of the initial onset difference, while increasing onset differences have no such limit. This asymmetry is critical in tests that measure both the direction and the magnitude of the differences between the initial and final onset differences, since the greater weight given the increasing (divergent) differences can lead to the retention of the null hypothesis when it should be rejected. 1 Finally, the real magnitude of change is not recorded for those pairs in case C. Note, for the example in Table I, that the real magnitude of change is 18 days; however, the absolute difference at onset 10 indicates a difference of only two days. I suggest that a sign test indicating only the direction of change is a sufficient statistical test at this stage in menstrual synchrony investigation, given the problems of measuring the magnitude of change. Over the first few onsets, the null hypothesis is p = q --- 0.5, where p and q are the probabilities of syn- chrony (onset convergence) and asynchrony (onset divergence), respectively. However, since case C causes the number of asynchronous pairs to increase over time, the general null hypothe- sis is p < q. The test hypothesis is p> q. The sign test is the nonparametric equivalent of the binomial test; therefore, levels of significance for pairs <25 can be read directly from tables of probabilities for the binomial test. For pairs > 25, the normal approximation to the binomial distribution is used (Siegel, 1956).
The third conclusion to be drawn from equation 1 is that the probability of a statistically significant level of synchronous cases occurring by chance is related directly to the length of the study period and the sample size. An observation period of three or four cycles does not allow sufficient time for the converging onsets of case C to convert to the diverging onsets of case B. And, the smaller the sample size, the greater the probability of finding synchrony by chance. McClintock (1983b, p. 131) stated that synchrony occurs in 69-83% of the pairs of subjects in studies of menstrual synchrony. Therefore, a chance occurrence of at least 80% syn- chronous cases in samples of 5 pairs is p--0.19 and of 10 pairs is p=0.055, above the usually accepted 0.05 level of statistical significance.
The probability of committing Error I is reduced by using large samples of pairs and by recording the onset differences over a long enough period so the pairs that are initially converg- ing by chance have time to convert to diverging onsets. I suggest as a rule of thumb, if the sample size is 20 pairs or less, then the observation period should cover a minimum of nine cycles (10 onsets). Finally, the sign test, which considers only the direction of change between
I See J a r e t t (1984) for a possible soluUon to this problem.
MENSTRUAL SYNCHRONY RESEARCH 571
initial and final mean onset differences, is a more appropriate test than those that consider the magnitude of the change. The magnitude of change between initial and final onset differences is irrelevant, since it is determined by the initial onset difference, the difference between mean cycle lengths of pairs of subjects, and the number of cycles over which onsets are recorded.
Error H Error II occurs when the absolute difference between the initial menses onset dates of a pair
of subjects is incorrectly determined. This error introduces a bias in two ways. First, the incor- rect onset difference always is greater than the correct onset difference, thus increasing the initial mean onset absolute difference. Second, an incorrect initial onset difference reverses the direction of change between the consecutive onset differences of a pair, as defined by equa- tion 1, cases B and C. This occurs because correcting an onset difference changes the order of initial onsets; the subject with the first (earliest) recorded onset has the second (latest) recorded onset after the correction.
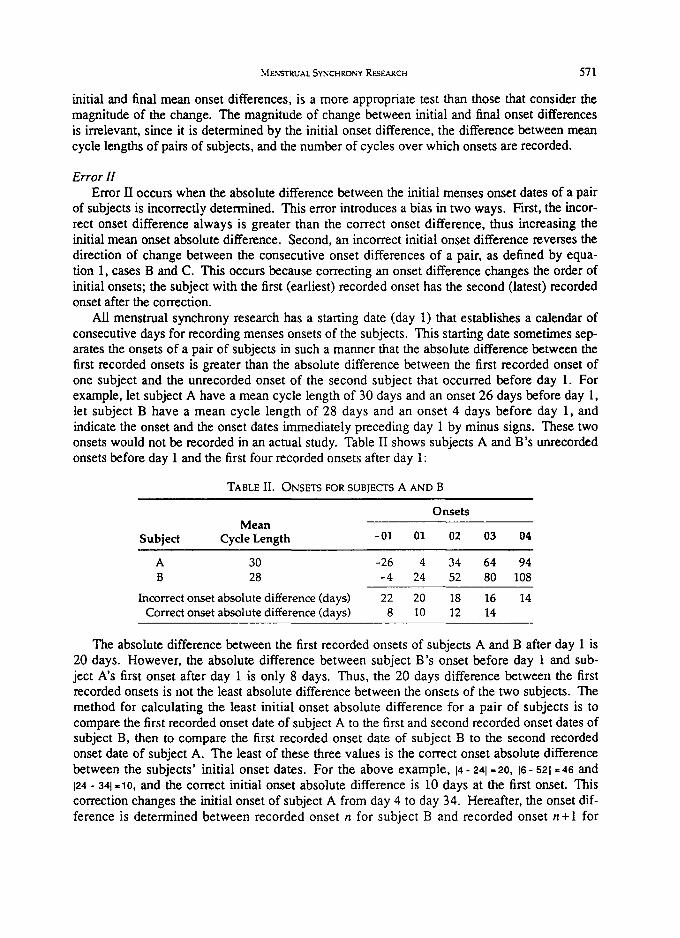
All menstrual synchrony research has a starting date (day 1) that establishes a calendar of consecutive days for recording menses onsets of the subjects. This starting date sometimes sep- arates the onsets of a pair of subjects in such a manner that the absolute difference between the first recorded onsets is greater than the absolute difference between the first recorded onset of one subject and the unrecorded onset of the second subject that occurred before day 1. For example, let subject A have a mean cycle length of 30 days and an onset 26 days before day 1, let subject B have a mean cycle length of 28 days and an onset 4 days before day 1, and indicate the onset and the onset dates immediately preceding day 1 by minus signs. These two onsets would not be recorded in an actual study. Table II shows subjects A and B's unrecorded onsets before day 1 and the first four recorded onsets after day 1:
TABLE II. ONSETS FOR SUBJECTS A AND B
Onsets Mean
Subject Cyde Length - 01 01 02 03 04
A 30 -26 4 34 64 94 B 28 -4 24 52 80 108
Inco~e~ onsetabsolu~ difference(days) 22 20 18 16 14 Corre~ onsetabsolu~ difference(days) 8 10 12 14
The absolute difference between the first recorded onsets of subjects A and B after day 1 is 20 days. However, the absolute difference between subject B's onset before day 1 and sub- ject A's first onset after day 1 is only 8 days. Thus, the 20 days difference between the first recorded onsets is not the least absolute difference between the onsets of the two subjects. The method for calculating the least initial onset absolute difference for a pair of subjects is to compare the first recorded onset date of subject A to the first and second recorded onset dates of subject B, then to compare the first recorded onset date of subject B to the second recorded onset date of subject A. The least of these three values is the correct onset absolute difference between the subjects' initial onset dates. For the above example, 14- 241 =20, 16-521 =46 and 124 - 341 =10, and the correct initial onset absolute difference is 10 days at the first onset. This correction changes the initial onset of subject A from day 4 to day 34. Hereafter, the onset dif- ference is determined between recorded onset n for subject B and recorded onset n + l for
572 H.C. Wzt.5oh'
subject A. This change also reverses the order of onset differences, according to equation 1, from case C to case B; the incorrect differences are decreasing at the rate of two days per cycle, while the correct onset differences are increasing at the rate of two days per cycle.
The maximum absolute difference between initial onsets is one-half the cycle length of the subject with the earliest onset, since the onset of the subject with the latest onsets must fall between either the first and second onsets or second and third onsets of the other subject. In the example above, subject A has the earliest recorded onset at day 4 and a cycle length of 30 days between both onsets 01 and 02 and onsets 02 and 03; therefore, the first onset of subject B must be within 15 days of the first or second onset of subject A. The 20-day difference between the first two recorded onsets is greater than 15 days and indicates an error in the calculation of the closest initial onset absolute difference. An exception to this rule is when the difference between the initial onsets of the two subjects is greater than one and one-half times the cycle length of the subject with the first (earliest) recorded onset. In the example above, subject B's onset would have to occur at day 54, i.e., 50 days after the first onset of subject A, in order to have a corrected onset difference of 20 days. This occurs in samples with subjects having irregular cycles or amenorrhea. The minimum initial onset difference between a pair of subjects is zero, since both subjects can have their first onsets on the same day.
An estimate of the range of variation for the initial onset absolute difference in a sample of paired subjects is zero to one-half the mean cycle length of subjects in the sample. Errors in the calculation of the closest initial onset absolute difference occur in about 22% of the pairs in a sample, if the initial onset difference is calculated from only the first recorded onsets of both subjects. The number of possible onset differences greater than one-half the mean cycle length is calculated by first determining the number of possible onset differences for a sample. For a sample with a mean cycle of length Xs, the number of possible onset differences is ~s 2. The number of possible onset d i f ferences greater than one-ha l f the mean cycle length is [(xs/2 - 11 (xs/2)] .2 For example, if the sample mean cycle length is 28 days, the total possible number of onset differences is 282 =784; the number of onset differences greater than 14 days is 13 x 14 =182; and the percentage of onset differences that exceed 14 days is (182/784) x 100 =23.2"/,. The expected frequencies of onset differences greater than Ys/2 for mean cycle lengths from 26-32 clays range from 21.40-23.44%.
McClintock perceived a problem in calculating the initial onset difference. Her correction is to calculate "the difference between the date of onset in October for one arbitrarily chosen member of the pair and the closest date of onset for the other.. ." (McClintock, 1971, p. 244) Her method corrects 50% of the errors, since she does not compare the first onset of the other subject to the second onset of the arbitrarily chosen subject. In the above example, her method would not have compared subject B's first onset to subject A's second onset. Thus, errors occur in about 11% of the pairs in a sample if only McClintock's correction is applied.
The estimated initial mean onset difference for a sample, after all initial onset differences have been corrected, is one-fourth the sample mean cycle length. 3 An initial mean onset differ- ence greater than the estimated initial mean onset difference indicates probable errors in calcu-
2 The total n u m b e r of possible o n s e t s for sample m e a n cycle length of Xs is the n u m b e r of p e r m u t a U o n s of Xs taken two at a t ime, (Xs" 1)(Xs). p l u s a n addi t ional ser ies of onse t differences Xs for onse t differences of 0, {(I, I), (2.2), (3.3)... (X s, Xs)}, s ince both onse t s also can occur on the s a m e day. Therefore. (Xs" 1)(Xs) + Xs + Xs L The n u m b e r of pe rmu t a t i ons greater t h a n one-ha l f the sample m e a n cycle length is Xs / 2 t aken two at a time. The m e a n cycle length is rounded to the nea re s t whole n u m b e r for ease of calculat ion, a n d if Xs is an odd number , Xs / 2 is rounded to the next h ighes t whole number , s ince onse t differences are recorded only in whole n u m b e r s .
ME'~$TRUAL SYNCHRONY RESEARCH 573
lations of some initial onset differences, or a sample with subjects who have irregular cycles or amenorrhea, or both.
I again use the roommates sample (subjects, 92, pairs, 59, since some of the subjects had more than one roommate) from the sorority study to illustrate Error II (Wilson et al., 1991). The subjects in this sample had 356 cycles over the 150-day study period. The mean cycle length was 30.62 + 9.48 days, or approximately 31 days. The results are as follows:
(a) The expected mean initial onset difference is 7.75 days (31/4); the observed mean initial onset difference is 7.03 days.
(b) The expected number of cases in which the first recorded onset dates yielded incorrect initial onset differences is 12.9 (21.86%). The observed number of incorrect initial onset differ- ences is 14 (23.73%).
(c) The expected number of initial onset differences corrected by the method described by McClintock is 6.4 (10.93%). The observed number of cases corrected by McClintock's method is 6 (10.17%).
(d) The expected number of additional initial onset differences corrected by the method described above also is 6.4 (10.93%). The observed number is 8 (13.56%).
The sorority roommates sample fits the expected values very closely. However, after all the corrections for initial onset differences are made, three onset differences in the sample still ex- ceeded the expected maximum value of 15.5 days. These initial onset differences were 17, 20, and 32 days. These cases all occurred because one or both subjects had cycle lengths that ex- ceeded the sample mean cycle length, e.g., the initial onset of one subject occurred on day 49 in one pair and on day 66 in a second pair. I underscore that these cases occur only in samples with subjects who have unusually long cycle lengths or amenorrhea, like those in the sorority sample.
The errors from Error II, like the occurrences of cases B and C of equation 1, are chance events without predictable direction and may increase or decrease the number of synchronous cases in a sample. Error II can be avoided by the method for calculating the initial onset absolute difference described above. Another procedure for correcting initial onset differences in experimental samples is described below in the review of Preti et al. (1986).
Error III
Error III occurs when subjects are excluded from samples or when the onsets of some subjects are excluded in the calculations of final onset absolute differences. Both exclusions bias samples toward showing menstrual synchrony by reducing dispersion in final onset absolute differences.
Subjects are excluded from samples because they (1) leave the sample as it was initially defined, (2) voluntarily withdraw from the sample, or (3) fail to have the number of onsets specified by the research design. Subjects who leave samples, e.g., who withdraw from college or move to another dormitory, are selected randomly and have no consistent effect on tests for menstrual synchrony. Subjects who voluntarily withdraw from samples create a bias toward synchrony if they are experiencing irregular cycles or amenorrhea. Anecdotal information from the sorority and cooperative house studies suggest this possibility (Wilson et al., 1991). A few subjects expressed their concerns that their irregular cycles might adversely influence our study. None of our participants voluntarily withdrew. Voluntary withdrawals were reported by Russell
3Th|s method of estlmating the correct initial mean onset absolute difference appears in a letter from Dr. Richard Whalen to Dr. David Quadagno in 1982 (see note 4). It first appeared in print, to my knowledge, in an article by PreU et al. (1986).
574 H.C. W~LSO~
et al. (1980), Pfaff (1980), and Jarett (1984), but no follow-up study was made to determine why the subjects withdrew.
The most frequent reason subjects or onsets of subjects are excluded from samples is that the subjects fail to have the number of onsets specified by the research design; thus, the initial and final onset absolute differences cannot be compared over the same number of consecutive cycles for both subjects. This usually occurs because some subjects have irregular cycles or amenorrhea. However, cycle irregularity and amenorrhea may not be evident if the investigator records only a set number of onsets, or if all of the recorded onsets are not used in calculating final onset absolute differences.
This bias is illustrated by the sorority roommates sample (Wilson et al., 1991). The obser- vation period was 150 days from September 1 to January 28. We expected that the 92 subjects would have five onsets, with an initial onset in September and a final onset in January. More than one-half (n = 50) did have five onsets. However, the other 42 subjects had either less than five onsets (n=30) or more than five onsets (n= 12). The range of onset frequencies in the sample was from two to seven. In our study we demonstrated the effects of excluding subjects with irregular cycles by eliminating those pairs of subjects having the most extreme variation in mean cycle lengths. When all 59 pairs are in the sample, the final mean onset absolute differ- ence is 14.95 days greater than the initial mean onset absolute difference. In the manipulated sample, when there remain only those 26 pairs in which both subjects have mean cycle lengths in the range 24.6-32.5 days, the final mean onset absolute difference is only 0.72 days greater than the initial mean onset absolute difference, a reduction of 14.23 days in the final onset absolute difference.
Error III is an important source of bias in menstrual synchrony research only to the extent that cycle irregularity and onset variability occur in samples. I noted in the introduction that cycle irregularity is the only known factor that differentiates those studies that fail to find men- strual synchrony from those that reported menstrual synchrony. My argument is that cycle irregularity and amenorrhea are characteristic of college-age women. This argument is sup- ported by cross-sectional, longitudinal, and clinical studies of menstrual cycles among women ages 17-22 yr. Collett et al. (1954) reported that the widest range in menstrual cycle length is in ages 17-24 and 40-50 in a cross-sectional sample of 146 women. Two of the most compre- hensive reports of longitudinal studies of menstrual cycle histories are Treloar et al. (1967) and Vollman (1977). Treloar et al. (1967, p. 124), reporting a study of 2,702 women with almost 276,000 recorded cycles, note the greatest variability in menstrual cycle intervals is before age 21 and after age 39: "The first few years of menstrual life, like the last few, are marked usually by a variation pattern of mixed short and long intervals with a characteristic transition into and out of the relatively more regular pattems of middle life." And Vollman (1977, p. 55), based on his study of over 31,000 cycles recorded by 656 women, stated: "Short (_<20 days) and long (_>41 days) menstrual cycles are more prevalent in adolescent and climacteric women." Adolescents are in the chronological age group 11-22 yr. Vollman (1977, pp. 55-68) found his observations to be in agreement with those of Treloar et al. (1967) and other longitudinal and cross-sectional studies of variations in menstrual cycle length by chronological age. Further, irregular cycles are associated with suppressed ovarian function; undergraduate women have higher frequencies of anovulatory cycles (Collett et al., 1954; Doring, 1969) and lower salivary progesterone profiles compared to more mature women (Ellison et al., 1987). These combined data clearly indicate that high frequencies of irregular cycles and amenorrhea are expected in samples drawn from college-age women.
Frequencies of irregular cycles in college-age women are more problematic, since fre-
MENSTRUAL SYNCHRONY RESEARCH 575
quencies vary with research objectives, sample selection, percentage of subjects taking oral contraceptives, methods for data collection, and length of observation period. Frequencies of combined oligomenorrhea and amenorrhea vary from 10.6% of 900 women visiting a student health center (Singh, 1981) to 13.9% of 991 college women (17-23 yr) responding to a ques- tionnaire (Bachmann & Kemmann, 1982). Frequencies of cycle irregularity varied from 28.2% in a sample of 211 student nurses who had menstrual cessation periods of 6 wk to 12 mo (McCormick, 1975) to 31.4% in a sample of 2,349 women registering at Edinburgh University who reported they had "fairly irregular cycles" (21.0%) or "extremely irregular cycles" (10.4%) (Sheldrake & Cormack, 1976).
The observation periods in the studies reporting menstrual synchrony in pairs of subjects ranged from 4 - 6 mo. A comparable observation period is the 150 days for the 92 subjects in the sorority roommates sample (Wilson et al., 1991). Using Singh's (1981, p. 300) definitions, 24 subjects (26.1%) experienced at least one period of oligomenorrhea (menstrual intervals between 38 days and 3 too) or secondary amenorrhea (cessation of menstruation for at least 3 mo). The mean cycle length of these 24 subjects was 51.7 days. In addition, there were 11 subjects in the roommates sample with cycle lengths _<24 days. The mean cycle length of these 11 subjects was 20.2 days. Overall, 38.0% (35/92) subjects in the roommates sample had exceptionally short or long cycles. Differences of 10-20 days between mean cycle length occurred when these subjects were paired with subjects whose mean cycle lengths were near the sample mean cycle length. This, in turn, produced large final onset differences between subjects when compared over consecutive onsets, inflated the final mean onset absolute differ- ence, and decreased the probability of finding menstrual synchrony.
A conservative estimate, based on the studies cited above, is that about 25% of a sample of college-age women experience at least one exceptionally long or short menstrual cycle in a period of 4 - 6 mo. The investigator has three choices when confronted with subject onset varia- tion. First, the onsets may be compared at the greatest number of onsets the pair has in com- mon. Thus, if one subject has five recorded onsets and the other subject has seven recorded onsets, then the final onset absolute difference is calculated at the fifth onset for each subject (of. Wilson et al., 1991). While this method compares an equal number of onsets for each subject, it creates variations in the observation period and in the number of onsets used to cal- culate final onset absolute differences. It also leads to large final onset absolute differences, since the final onsets being compared may be several months apart. Second, the subjects' ini- tial and final onset differences may be compared at the beginning and at the end of the observa- tion period, even though the two subjects do not have the same number of onsets (cf. Jarett, 1984). This procedure biases a sample toward synchrony by calculating the initial and final onset absolute differences at two time intervals, thereby excluding from the calculations those onsets of one subject that exceed the number of onsets of the other subject. The third choice is to exclude from the sample those pairs of subjects who do not have the number of onsets specified by the research design. The second and third of these procedures are the sources of Error Ill, since they bias the sample toward menstrual synchrony by reducing dispersion in final onset absolute differences.
Error III can be reduced, avoided or managed by: (1) selecting subjects who are between ages 23 and 44 yr to avoid cycle irregularity characteristic of adolescent and climacteric women (Vollman, 1977, p. 55), (2) selecting subjects who self-report they have regular cycles, or (3) building into the research design procedures for dealing with cycle irregularity. The design also should include a decision as to whether subjects taking oral contraceptives will be included in the sample, since subjects with invariant cycles may influence the outcome of the research.
576 H.C. W~t.SON
REVIEWS OF MENSTRUAL SYNCHRONY EXPERIMENTS AND STUDIES
In this section I will review the experiments of Russell et al. (1980) and Preti et al. (1986) and the studies of Quadagno et al. (1981), Graham and McGrew (1980), and McClintock (1969, 1971). All reported finding statistically significant menstrual synchrony. I will describe the experiments and studies, discuss where errors might have occurred, and show how these errors might have influenced their results.
Russe l l et al. (1980) These investigators reported menstrual synchrony in a sample of five subjects treated on
their upper lip three times a week with a solution containing alcohol and the underarm odor obtained from a donor subject. The donor "had a history of a very regular menstrual cycle of 28 days" and of "driving" the menstrual cycles of women with whom she associated (Russell et al., 1980, p. 737). Four of the subjects synchronized with the donor's onsets over a period of five onsets (four cycles). The initial mean onset absolute difference between the five subjects and the donor was 9.3 days, and the final mean onset absolute difference was 3.4 days. Analysis of variance for repeated measures showed the probability of this difference being due to chance is p<0.01. A control sample of six subjects treated only with an alcohol solution did not synchronize; the initial and final mean onset absolute differences were 8.0 and 9.2 days.
Error I: According to equation 1, the probability is that cases B with increasing onset differ- ences are equal to cases C with decreasing onset differences over the first few onsets. There are four synchronous cases in this sample of five cases observed over four cycles. A sign test shows four or five positive results are expected to occur by chance about 19 times out of 100 (p=0.188). Menstrual synchrony is not demonstrated in this sample, since the chance proba- bility of synchrony is greater than the usually accepted significance level of 0.05.
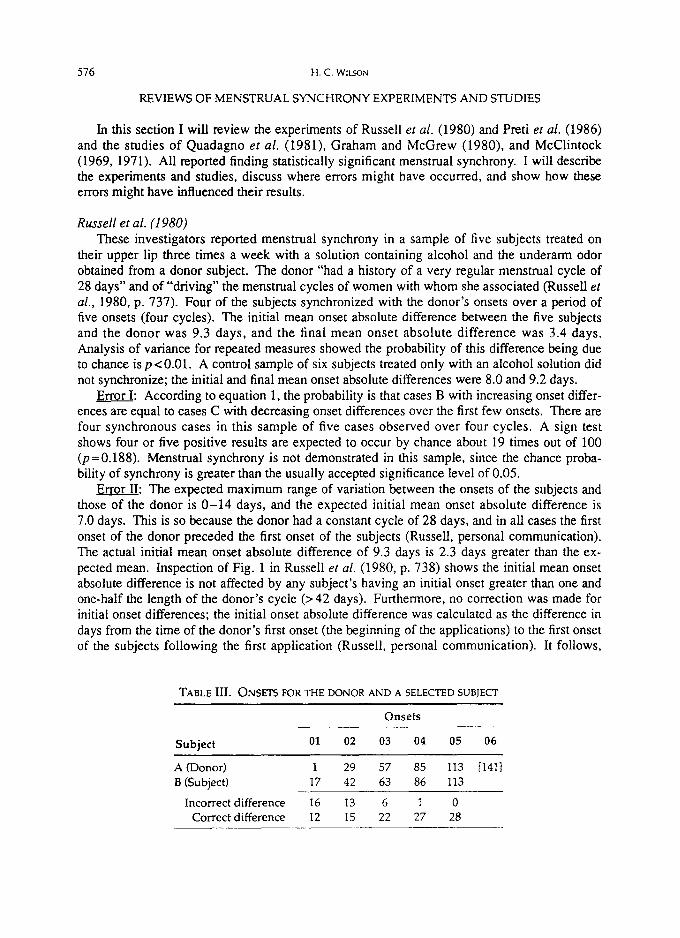
Errgr II: The expected maximum range of variation between the onsets of the subjects and those of the donor is 0 - 1 4 days, and the expected initial mean onset absolute difference is 7.0 days. This is so because the donor had a constant cycle of 28 days, and in all cases the first onset of the donor preceded the first onset of the subjects (Russell, personal communication). The actual initial mean onset absolute difference of 9.3 days is 2.3 days greater than the ex- pected mean. Inspection of Fig. 1 in Russell et al. (1980, p. 738) shows the initial mean onset absolute difference is not affected by any subject's having an initial onset greater than one and one-half the length of the donor's cycle (> 42 days). Furthermore, no correction was made for initial onset differences; the initial onset absolute difference was calculated as the difference in days from the time of the donor's first onset (the beginning of the applications) to the first onset of the subjects following the first application (Russell, personal communication). It follows,
TABLE III. ONSETS FOR THE DONOR AND A SELECTED SUBJECT
Subject
Onsets
01 02 03 04 05 06
A (Donor) 1 29 57 B (Subject) 17 42 63
Incorrect difference I6 13 6 Correct difference 12 15 22
85 113 [141] 86 113
I 0 27 28
MENSTRUAL SYNCHRONY RESEARCH 577
therefore, that at least one of the five initial onset differences (22%) is probably incorrect. Figure 1 of Russell et al. (1980) shows an initial onset difference between the donor and a sub- ject of 16 days. This only could occur if that initial onset absolute difference was incorrectly calculated. I constructed a calendar for the onset dates for the donor and subjects based on the information that the donor had a 28-day cycle length, her onset always occurred first, and the differences between the donor's and subjects' consecutive onsets shown in Figure 1 of Russell et al. (1980). The first onset of the donor is recorded as day 1 of the experiment. Table III shows the calendar for the subject whose initial onset absolute difference with the donor was 16 days. Both the incorrect and corrected onset differences over consecutive onsets are shown.
The correct initial onset absolute difference is 12 days, the difference between donor's second onset and the subject's first onset (29 - 17~ 12). A sixth onset for the donor is added in brackets so that the onsets can be calculated for four cycles. Correcting the initial onset differ- ence reverses the direction from decreasing onsets to increasing onsets over time. Rather than a final onset difference of 0 days at onset 05 for donor and subject, the final onset difference is 28 days (141 - 11a -28). With the corrected initial onset difference of 12 days and the corrected final onset difference of 28 days, the initial mean onset absolute difference for the sample is 8.5 days and the final mean onset absolute difference is 9.0 days. Thus, the experimental sample indi- cates synchrony did not occur.
Error III: The 16 subjects who volunteered for the experiment were divided equally between the experimental group who received the donor 's odor and the control group. However, "[b]ecause of subject attrition the final number of subjects was eleven, with five in the experimental group and six in the control group." (Russell et a l . , 1980, p. 737) The reasons for three subjects withdrawing from the experiment are unknown (Russell personal communication). Doty (1981) pointed out that the experiment did not use a double-blind pro- cedure: The investigator who applied the applications was the donor of the axillary extract. She knew which of the subjects were expected to synchronize with the applications of the extract, and, no matter how subtly and unintended, could have signaled her expectation to the subjects during the three weekly treatments. Subjects who perceive they fail to meet the expec- tations of the research goals may be more likely to voluntarily withdraw from a project. If so, withdrawal from this small sample of one or more subjects who failed to synchronize with the donor's applications could have biased the experiment toward finding synchrony by reducing dispersion at the final onset difference.
In summary, the experiment of Russell et al. (1980) shows evidence of all three errors: The number of synchronous cases is too few to be statistically significant (Error I), one of the four synchronous cases has an incorrect initial onset difference which, when corrected, causes the initial mean onset difference to be greater than the final mean onset difference (Error II), and one or more subjects may have withdrawn from the experiment because their cycle behavior was not meeting the expectations of the investigators (Error 11I). I conclude that Russell et al. (1980) did not demonstrate menstrual synchrony in subjects treated with axillary extract from a female donor.
Pret i e t al. (1986) The experiment of Preti et al. (1986) is patterned after that of Russell et al. (1980). I have
written a critical review of this experiment elsewhere (Wilson, 1987). I review the experiment here to show the improvements in research design over that of Russell et al. , a different method for correcting for the initial onset differences, a method of reducing the cases of menstrual irregularity, and how a procedural error can be the source of Error II. The 19 subjects in this
578 H.C. WIL.-C~N
experiment were selected from a larger sample on the basis of reporting they had regular men- strual cycles in the range of 29.5 + 3 days. The 10 subjects in the experiment sample had a solution of alcohol and axillary extract applied to the upper lip three times a week. The axillary extract came from pads worn by four women during three complete menstrual cycles. Extract from 5 of these 12 cycles was combined into 10 extract composites coordinated to conform to days 2, 5, 8, 11, 14, 17, 20, 23, 26, and 29 of a 29+2-day menstrual cycle. The research design specified the extract be applied in 22- to 25-day cycles. Eight of the subjects synchronized with the application cycles after three onsets (two menstrual cycles), and the initial mean onset absolute difference of 8.3 days decreased to a final mean onset absolute difference of 3.9 days. An analysis of variance with repeated measures showed the probability of a 4.4-day reduction occurring by chance was p<0.05. Only three of the nine subjects in the control sample syn- chronized with the application cycles, and the initial mean onset absolute difference of 6.22 days at onset 01 increased to a final mean absolute difference of 7.56 days at onset 03.
Error I: Application of the sign test shows the probability is p = 0.055 that by chance eight or more cases out of ten will have reduced (synchronous) onsets, slightly greater than the usually accepted level of significance. Also, two cycles do not allow enough time for correct- ing chance convergence as defined by case C, equation 1.
Error H: Preti et al. (1986, p. 479) estimated for their samples the range of initial onset dif- ferences to between 0 and 14.75 days and the initial mean onset absolute difference to be 7.38 days. The onset absolute differences shown in their Table 1 range from 1-12 days, and the initial mean onset difference exceeded the expected mean by less than 1 day. The initial onset differences were calculated as follows: A subject could begin the applications at any phase of her menstrual cycle. If she received the first treatment during the preovulatory phase of her cycle, the initial onset difference was the number of days between the time of the first treatment and the menses preceding the treatment. If a subject received her first treatment during the pos- tovulatory phase of her cycle, the initial onset difference was the number of days between the time of the first treatment and her menses onset following the treatment. The preovulatory and postovulatory cases were equally divided in the sample of 10 subjects. This procedure estab- lishes all of the preovulatory subjects as cases C, according to equation I. The onset differ- ences are initially expected to decrease over consecutive onsets, because the subjects had the earlier onset dates and longer cycles (expected 29.5 + 3 days), while the treatment dates were later and the cycles (22-25 days) were less than those of the subjects. The postovulatory subjects are all cases B, and the onset differences are initially expected to increase over consec- utive onsets because the treatments, which had the shorter cycle, occurred earlier than the subjects' first onsets.
Inspection of their Table 1 (Preti et al., 1986, p. 480) shows four of the preovulatory cases, as expected, had decreasing onset differences with the treatments over the three onsets, and one case had a decreasing onset between onsets 01 and 02 and an increase between onsets 02 and 03 accompanied by a sign change, again as expected. However, none of the postovulatory cases showed increasing consecutive onsets, as expected for cases B. Four of these cases showed a decrease in onset differences between onsets 01 and 03, and the fifth case had the same value at onsets 01 and 03. Using the information in the authors' Table 1, I calculated the actual cycle lengths for the applications (Wilson, 1987, pp. 542-543) . The application cycle lengths between onsets 01 and 02 ranged from 33-36 days for the postovulatory cases, instead of the 22- to 25-day cycles specified by the research design. Preti (1987) confirms my calcula- tions. The effect of these long first application cycles is to convert the postovulatory cases from cases B to cases C, since now the first treatments occurred earlier than the subjects' onset dates,
MENSTRUAL SYNCHRONY RESEARCH 579
and the mean treatment cycles were greater than the mean cycle lengths of the subjects. When the treatment cycles of the postovulatory cases are corrected to a 22- to 25-day cycle length, the sample has the characteristics of a sample of randomly paired subjects (Wilson, 1987). Also, three of the subjects, who were reported to have had their cycle lengths "modulated" by the treatments, had constant cycle lengths over the two recorded cycles.
Error HI: There are no indications that subjects were excluded or withdrew from this exper- iment. A double-blind procedure ensured that the technician who applied the treatments did not know the purpose of the study, nor which of the solutions contained the axillary extract (Preti et al., 1986, pp. 477-478). Also, the subjects were selected because they reported having regular cycles, and it is probable they all had at least two cycles in the 13 week duration of the experi- ment.
In summary, the number of synchronous pairs in the experimental sample of Preti et al. (1986) is too few, and the duration of the experiment is too short to be statistically significant (Error I). More importantly, errors in some of the applications of the axillary extract show four subjects with decreasing onset differences over consecutive onsets. These four subjects have increasing onset differences when the lengths of the applications are corrected and do not syn- chronize with the treatment applications (Error II). Finally, three of the subjects said to have had their cycles changed by the treatment applications had constant cycle lengths. This experi- ment fails to demonstrate that menstrual cycles can be altered by applications of female axiUary extract or that the subjects' onsets synchronized with the treatment applications.
Quadagno et al. (1981) These investigators found menstrual synchrony in a sample of women at a coeducational
state university. The observation period was from October-March. Tests for menstrual syn- chrony were conducted for 62 pairs of close friends, 70 pairs of roommates, and a control sample of 70 pairs of randomly matched subjects (Quadagno, personal communication). Initial mean onset absolute differences were 21.76 days for roommates, 18.71 days for close friends, and 19.79 days for the control group. Final mean onset absolute differences are 12.34, 8.91, and 17.75 days, respectively. Student's t-test showed statistically significant levels of menstrual synchrony for the close friends (p < 0.01) and roommates (p < 0.01), but not for the control sample. Based on the information in Table II of Quadagno et al. (1981, p. 241), the estimated mean cycle length of the subjects was 30.6 days.
Error I: The number of pairs in the roommates and close friends samples was too great to expect that synchrony might occur by chance, as defined by equation 1.
Error II: The expected initial mean onset difference for the samples was 7.6 days, based on an estimated mean cycle length of 30.6 days. The initial mean onset absolute differences of 18.71 days for close friends and 21.76 days for roommates are two to three times that the expected value. Quadagno (personal communication) acknowledges these initial mean onset absolute differences are incorrect. 4
Errgr III: Quadagno et al. (1981, p. 240) stated the "menstrual onsets for March were chosen to follow the initial October onset by an equal number of cycles." However, only four onset dates were recorded for this 6-mo period: "Questionnaires were distributed twice during
4 This error was first pointed out by Dr. Richard Whalen in a letter to Dr. David Quadagno. Dr. Quadagno re- calculated the initial and final mean onset differences for his samples and found a significant level of men- s trual synchrony (p<0.001) for the roommates sample, bu t not in the close-friends sample. There still are an estimated eight pairs (11%] that have incorrect initial onsets. Also, my comments regarding Error Ill are not changed by this revision.
580 H.C. Wlt~.,,'
the academic year (October and March)... The questiormaires provided the researchers with the following information about each woman.., day of last and second-to-last menstrual flow..." (Quadagno et al., 1981, p. 240). Apparently, the investigators assumed that an equal number of cycles occurred between October and March, whereas all that could be determined is the subjects had at least four onsets between October and March. The effect of this procedure is to compare subjects' onsets for the first and last onsets during the study period, regardless of how many onsets each subject might have had. This avoids the problem of dealing with subjects with irregular menstrual cycles, but increases the probability of chance synchrony by reducing variability in recorded onsets.
In summary, the study of Quadagno et al. (1981) does not demonstrate menstrual synchrony in their pairs of close friends and roommates, because of errors in calculating the initial onset absolute differences between pairs of subjects (Error II). Also, onset data were not collected for the full 6 mo of the study; thus, variation in the final mean onset absolute differences is reduced by not following the procedure of comparing subjects' onset differences over an equal number of cycles (Error 111).
Graham and McGrew (1980) Graham and McGrew studied menstrual synchrony in a sample of 79 students attending a
coeducational university in Scotland. Tests for synchrony were conducted for 18 pairs of close friends, 18 pairs of neighbors, 18 random pairs, and for a sample of 15 groups (3<n> 6) based on the proximity of their dormitory rooms. Menstrual onsets were recorded over three cycles (four onsets). The close friends sample had a significant level of menstrual synchrony: Fourteen of 18 pairs had decreasing onset differences over the four onsets. An initial mean onset absolute difference of 10.8 days decreased to 6.4 days at the final mean onset absolute difference (values estimated from the graph in their Figure 1). The probability levels were p < 0.04 by one-way analysis of variance and p < 0.025 by the Wilcoxon matched-pairs signed- ranks test. The sample of pairs, the sample of living groups, and the random sample did not show significant levels of synchrony. The mean cycle length of the sample was approximately 28.5 days, based on the cycle lengths of the 44 subjects shown in their Table III (Graham & McGrew, 1980, p. 250), plus an assumed cycle length of 28 days for the 35 subjects taking oral contraceptives.
Error I: Application of the sign test shows that the probability that 14 of 18 pairs will have decreasing (synchronous) onset differences is p=0.015; thus, synchrony in.the close friends sample cannot be attributed to chance convergence.
Error II: Graham and McGrew (1980, p. 247) used McClintock's method for calculating the initial onset differences: "For close friends, neighbours and peers, the difference was calcu- lated between the date of onset in September for an arbitrarily chosen member of a pair and the closest date of onset for the other." This procedure failed to determine the correct (closest) initial onset difference for a probable two pairs (about 11%) in a sample of 18 pairs with a mean cycle length of 28-29 days. An additional indication of incorrect onset differences was the initial mean onset absolute difference of 10.8 days; this is 3.7 days greater than the expected initial mean onset absolute difference of 7.1 days. Figure 2 of Graham and McGrew (1980, p. 248) shows the differences between the initial and final onset absolute differences for each of the 18 pairs of subjects, with the synchronous pairs on one side of the scale and the asyn- chronous pairs on the other side. On the synchrony side of the graph for the close friends sample, one pair had an absolute difference of 18 days and a second pair had an absolute differ- ence of 19 days. The initial onset differences for these two pairs must be at least 18 days and
MENSTRUAL SYNCHRONY RESEARCH 581
19 days for these magnitudes of decrease to occur between the initial and final onsets. The expected maximum range of onset difference is one-half the mean cycle length of the sample or about 14.5 days; therefore, these two pairs have incorrect initial onset absolute differences. An alternative explanation is that one subject in each of these two pairs had an initial onset 18 or 19 days after the second onset of her paired cohort, i.e., 42 days or more after the September 1 beginning of the study. The possibility of an initial onset in October or later is precluded, however, since each of the pairs in the three samples was analyzed by "comparing the differ- ences between menstrual onsets dates for each of the four months" (Graham & McGrew, 1980, p. 247).
According to equation 1, correcting these differences reverses the direction of consecutive onset differences from decreasing to increasing differences, moves them from the synchronous group to the asynchronous group, and reduces the number of pairs with decreasing (syn- chronous) onset differences from 14 to 12. The probability is p=0.119 that at least 12 of 18 cases have decreasing consecutive onsets by chance, thus, the probability of chance synchrony is <0.05. Further, correcting the onset differences for these two pairs decreases the initial and increases the final mean onset absolute differences, thereby reducing the difference between initial and final mean onset differences. It is unlikely this corrected difference is statistically significant, since the two corrected onsets are about 11% of the total sample.
Error III: Graham (personal communication) stated that no subjects were excluded from the study because they failed to have the four onsets specified by the research design. Two expla- nations for the lack of subjects with irregular cycles are that 35 of 79 subjects (44.3%) were taking oral contraceptives, and the duration of the observation period was only three cycles.
In summary, the initial onset differences of two pairs in the sample of 18 pairs of close friends probably are incorrect and, therefore, are not the closest initial mean onset differences (Error II). Correcting these two initial onset differences decreases the initial mean onset abso- lute difference while correspondingly increasing the final mean onset absolute difference. Also, correcting these two initial onset differences reduces the number of synchronous pairs to 12, a number of pairs too small to demonstrate menstrual synchrony in a sample of 18 pairs (Error I). Thus, menstrual synchrony is not demonstrated in the sample of 18 pairs of close friends.
McClintock (1969, 1971) McClintock's research initially was reported in her honors thesis (1969) at Wellesley
College and published in 1971 in Nature. 5 I only cite her honors thesis when the material does not appear in her published article. My review is divided into a review of samples of pairs and a review of samples of groups, since the procedures for testing for menstrual synchrony in group samples differs from those used for pairs samples.
Samples of Pairs McClintock's study sample was 135 women who lived in a dormitory on the campus of a
women's college. The age of the subjects was 17-22 yr. The study period was from late September to early April. Tests for menstrual synchrony were conducted for samples of 33 pairs of roommates, 33 pairs of closest friends, these two samples combined, and 33 random pairs (McClintock, 1969, p. 24). Initial onset absolute differences for the pairs were calculated in October and compared to the final onset absolute differences in March. The comparison was
s Dr. Pa t sy S impson , Pres ident of S t ephe r~ College, was Dr. McClintock's h o n o r s t hes i s advisor. She kindly a s s i s t ed me in obta in ing a copy of Dr. McClintock's thes is .
582 H.C. WIt.SON
over the same number of menstrual cycles for each subject in the pairs. The Wilcoxon matched-pairs signed-ranks test showed all samples, except the random pairs, had significant levels of menstrual synchrony, with probabilities of p < 0.007 for roommates, p < 0.003 for closest friends, and p< 0.0003 for a combined sample of roommates and closest friends. The initial and final mean onset absolute differences in October and March, respectively, were 9.2 and 6.6 days for the roommates and 8.9 and 5.4 days for the closest friends (McClintock, 1969, p. 24). Tests for significance between the initial and final mean onset absolute differences were not performed. I estimate the mean cycle length of the sample to be 29.7 days, based on the mean cycle lengths of the subjects grouped by academic classes (McClintock, 1971, p. 245).
Error I: McClintock does not report the number of synchronous pairs in her samples. I estimate there are 23-27 synchronous pairs in her samples, based on a range of 70 -80% syn- chronous pairs in human samples reported by McClintock (1983a, p. 131). Synchronous pairs of 23 or more in samples of 33 pairs cannot be attributed to chance, according to equation 1.
Error II: McClintock's (1971, p. 244) method for calculating the initial onset difference was to arbitrarily select the first onset date of one member of the pair and the closest date of onset for the other member. This fails to correct about 12% of the initial onset dates in a sample with a mean cycle length of 30 days, or three or four (3.96) pairs in a sample of 33 pairs. That some of the initial onset differences were incorrect is indicated by a reported range of 1-20 days in initial onset differences (McClintock, 1969, p. 24). This range exceeds by 5 days the expected maximum range of 0 -15 days in samples with a mean cycle length of 30 days. Those initial onset differences that exceeded the expected maximum range probably were incorrectly calculated, since McClintock does not indicate there are subjects in her samples with irregular cycles or amenorrhea. The incorrect onset differences would be greater than the correct onset differences, and correcting these initial onset differences would reverse the direction of decreasing or increasing onset over consecutive onsets. What effect these cor- rections would have on the tests for menstrual synchrony cannot be determined from the avail- able data.
Error III: McClintock's samples of pairs of roommates and closest friends each had 66 subjects, since the roommates only lived in double rooms, and a pair of subjects qualified for closest friends "only if both had indicated that they saw each other most often" (McClintock, 1971, p. 244). I assume the pairs in the two samples were mutually exclusive, since the two samples are combined for a test of significance. However, there are probably less than 132 subjects in the combined samples; a subject could have both a roommate and a closest friend, or a subject could have neither a roommate nor a closest friend. McClintock's (1971, p. 244) description of her procedure for collecting onset data indicates all subjects in both samples had six recorded onsets in the 6-mo period from October through March: "Three times during the academic year, each subject was asked when her last and second to last menstrual periods had begun; thus the date of onset was determined for all cycles between late September and early April" (McClintock, 1971, p. 244). Further, Jarett (1984, p. 24), citing a personal communica- tion with McClintock, stated: "Apparently most of McClintock's subjects tended to have periods every month on a regular basis." However, given an age range of 17-22 yr for the subjects, it is extremely unlikely that all 66 of the subjects in each of the two samples had exactly six onsets in the months from October through March. Support for this statement was discussed in the section on Error HI above.
McClintock's method for collecting onset data leads to an appearance of exactly six onsets for each subject, since, for example, subjects with five onsets would have had one onset reported twice, and subjects with seven onsets would have had one onset excluded. Cases of
MENSTRUAL SYNCHRONW RESEARCH 583
both over- and under-reporting the number of onsets of subjects are sources of Error III and bias samples by reducing dispersion about the mean of the final onset absolute difference. The bias occurs because the pair of subjects is not being compared over an equal number of cycles, since a sixth onset in March for one subject may be compared to a seventh onset in March for a second subject. Comparing subjects over an unequal number of onsets violates the procedure of comparing onsets over an equal number of onsets in order "to minimize chance coincidences that did not result from a trend toward synchrony" (McClintock, 1971, p. 244).
In summary, Error II occurs in McClintock's closest friends and roommates samples, since there are an estimated three or four pairs for whom the initial onset differences are incorrect. Correcting these errors reduces the magnitude of the initial mean onset absolute difference and changes the direction of onset differences over consecutive onsets, according to equation 1, cases B and C. Error 111 occurs because the method of collecting onset data failed to record menstrual cycle irregularity and onset variability in the samples, thus reducing dispersion about the final mean onset absolute difference. I am not able to quantify the magnitude of these errors, as I did in each of the four preceding reviews, because the information necessary for analyses was not reported. However, I conclude McClintock did not demonstrate menstrual synchrony in her samples of close friends and roommates, since there are probable errors in her study that bias the samples toward finding menstrual synchrony.
Samples of groups The group samples were selected from the same 135 subjects used for the samples of pairs.
Tests for synchrony were conducted for a sample of 15 groups of close friends and a sample of 14 living groups based on room proximity in the dormitory. The numbers of subjects was 5 <n < 10 in the close friends groups and 5 < n _< 12 in the living groups. McClintock's measure of onset dispersion in a group was the mean absolute deviation (mean deviation, hereafter), i.e., each individual's onset absolute difference from the group's mean onset date. 6 The groups' onset means were calculated for "October, late November, January, late February and April" (McClintock, 1971, p. 244). A decrease in a group's onset mean deviations from October- April was interpreted as menstrual synchrony. Page's (1963) linear rank test for ordered multiple treatments was used to test for synchrony. The close friends sample was statistically significant at p<0.001. The living groups sample was not significant. A graph of the means of the 15 close friends groups' mean deviations shows a consistent decrease from 6.4 days in October to 4.6 days in April. Further, "The asymptotic relation and non-overlapping confidence intervals for the medians [see note 6] in October and late February, and October and April (>0.99), indicate an increase in synchrony for close friends groups" (McClintock, 1971, p. 245, Fig. 1). This is the only study reporting menstrual synchrony in groups of subjects. More importantly, it is the only study that establishes the rate at which synchrony occurs: "The greatest decrease [in group sample means] occurred in the first 4 months with little subsequent change" (McClintock, 1971, p. 245). This rate of change was the apparent rationale for deter- mining menstrual synchrony over five or less menstrual cycles in both experiments and most of the samples in the studies.
McClintock did not report the number of subjects in the close friends group sample (here- after, group sample). She (1971, p. 244) stated, "All subjects were divided into fifteen groups
6 It is not c lear whe the r the va lues on the graph {McClintock, 197 i . p. 245. Fig. 1) are m e d i a n s or m e a n s of the 15 groups" onse t m e a n abso lu te deviat ions. I interpret these va lues as means . The m e a n s in McClintock's Table II (1969, p. 26) are 6 .4 .5 .2 , and 4.6 days for October, J a n u a r y and April, respectively. The m e a n s for late November a nd late February are es t imate from the graph as 5,4 and 4.7 days.
584 H.C. Wa_soN
of close friends (5 < N < 10)." The mean group size is nine subjects, if "all subjects" means all 135 subjects, which appears high for groups in the range of 5 - 1 0 subjects. Also, it seems unlikely that each dormitory resident could be assigned to a meaningful social group of five or more members. Since I need an estimate of the size of the sample for some of the analyses that follow, I assume a mean group size of seven subjects and a total sample size of 105 subjects.
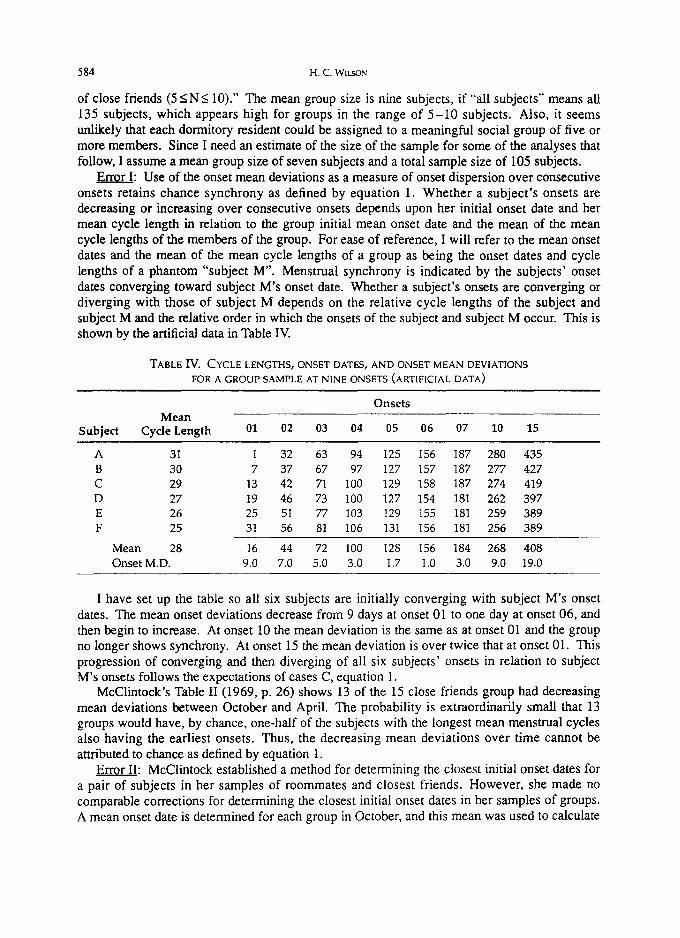
Error I: Use of the onset mean deviations as a measure of onset dispersion over consecutive onsets retains chance synchrony as defined by equation 1. Whether a subject 's onsets are decreasing or increasing over consecutive onsets depends upon her initial onset date and her mean cycle length in relation to the group initial mean onset date and the mean of the mean cycle lengths of the members of the group. For ease of reference, I will refer to the mean onset dates and the mean of the mean cycle lengths of a group as being the onset dates and cycle lengths of a phantom "subject M". Menstrual synchrony is indicated by the subjects' onset dates converging toward subject M's onset date. Whether a subject's onsets are converging or diverging with those of subject M depends on the relative cycle lengths of the subject and subject M and the relative order in which the onsets of the subject and subject M occur. This is shown by the artificial data in Table IV.
TABLE IV. CYCLE LENGTHS, ONSET DATES, AND ONSET MEAN DEVIATIONS
FOR A GROUP SAMPLE AT NINE ONSETS (ARTIFICIAL DATA)
Onsets Mean
Subject Cycle Length 01 02 03 04 05 06 07 10 15
A 31 1 32 63 94 125 156 187 280 435 B 30 7 37 67 97 127 157 187 277 427 C 29 13 42 71 100 129 158 187 274 419 D 27 19 46 73 100 127 154 181 262 397 E 26 25 51 77 103 129 155 181 259 389 F 25 31 56 81 106 131 156 181 256 389
Mean 28 16 44 72 100 128 156 184 268 408 OnsetM.D. 9.0 7.0 5.0 3.0 1.7 1.0 3.0 9.0 19.0
I have set up the table so all six subjects are initially converging with subject M's onset dates. The mean onset deviations decrease from 9 days at onset 01 to one day at onset 06, and then begin to increase. At onset 10 the mean deviation is the same as at onset 01 and the group no longer shows synchrony. At onset 15 the mean deviation is over twice that at onset 01. This progression of converging and then diverging of all six subjects' onsets in relation to subject M's onsets follows the expectations of cases C, equation 1.
McClintock's Table II (1969, p. 26) shows 13 of the 15 close friends group had decreasing mean deviations between October and April. The probability is extraordinarily small that 13 groups would have, by chance, one-half of the subjects with the longest mean menstrual cycles also having the earliest onsets. Thus, the decreasing mean deviations over time cannot be attributed to chance as defined by equation 1.
Error II: McClintock established a method for determining the closest initial onset dates for a pair of subjects in her samples of roommates and closest friends. However, she made no comparable corrections for determining the closest initial onset dates in her samples of groups. A mean onset date is determined for each group in October, and this mean was used to calculate
M~,'~STRUAL SYNCHRONY RESEARCH 585
the initial mean onset deviation for the group (McClintock, 1971, p. 244). This procedure established an expected range of differences between individual onsets of 0 - 3 0 days, since an initial onset could have occurred on any of the 31 days of October. The maximum range of 30 days is more than twice the expected maximum range of 14.9 days for pairs of subjects in McClintock's samples. Assuming the mean number of subjects in the groups samples is seven, the mean number of possible pairs in each group [(r~- n) / 2] is 21, and the total of possible pair for the 15 groups is 315, then an expected 69 of 315 pairs (22%) have incorrect initial onset dif- ferences, if the first onsets are used to calculate the initial onset absolute differences. An alter- nate method for calculating a group initial mean onset absolute difference, one that does correct for the closest onset difference between subjects, is to treat the subjects in a group as sets of pairs. The closest initial onset absolute difference for each pair is obtained by the method described in the section on Error IT. An initial absolute onset difference, with corrected onset differences when necessary, is calculated for each pair, and these initial absolute differences are used to determine a group initial mean onset absolute difference (cf. Wilson et al., 1991).
The difference between an initial onset mean deviation and an initial mean onset of all possible pairs is illustrated by using the artificial data in Table IV. There are 15 possible pairs of subjects in the sample. The mean cycle length of the samples is 28 days, so the expected initial mean onset absolute difference is 7.0 days, and the range of variation in onset differences is 0 - 14 days. After six initial onset differences are corrected, the group initial mean onset absolute difference for the 15 pairs is 8.53 days, and the range of onset differences is 1-13 days. Since the seventh recorded onset is the final onset difference for those subjects with cor- rected initial onset differences, the final mean onset absolute difference calculated over six onsets (five cycles) for each individual is 13.87 days. Thus, synchrony does not occur by the method of calculating the initial mean onset differences between all possible pairs of subjects.
Error III: One source of Error III is excluding from the analysis some of the onsets of subjects. McClintock's method for determining the mean deviation for the 15 groups in her sample considered only five onsets for each subject, even though dates for six onsets were col- lected. Exclusion of subjects' onsets caused the group onset mean deviation to decrease over time by increasing the number of cases C relative to cases B. I describe below how this occurs and demonstrate that the apparent menstrual synchrony in the group sample of close friends is an artifact of McClintock's methods. First, I needed to determine the length of the study period and the number of onsets considered in the group sample.
The six onsets McClintock collected from late September to early April were used to compare initial and final onset absolute differences of pairs of subjects from October through March. However, for her study of groups, onset mean deviations were compared from October through April, thus extending her observation period from "early April" to the month of April. How this change occurred is not explained, but it is clear that onset mean deviations were cal- culated from the months of October and April. Therefore, for my analysis of the group samples, I established a calendar of consecutive days from day 1 on October 1 to day 212 on April 30. If the observation period is shorter, say, 195 days or the 182 days from October through March, my argument still holds, because I show that the group onset mean deviations are calculated at five discontinuous time intervals accounting for only about 150 days of the total observation period.
McClintock (1969, p. 23) calculated mean onset dates for 3 mo for her honors thesis: "A mean onset date was determined for each group in October (cycle #1), in January (cycle #4) and in April (cycle #7)." These "cycles" are not menstrual cycles, since no menstrual cycle could have occurred in the month of October when the first onset was recorded, and a seventh
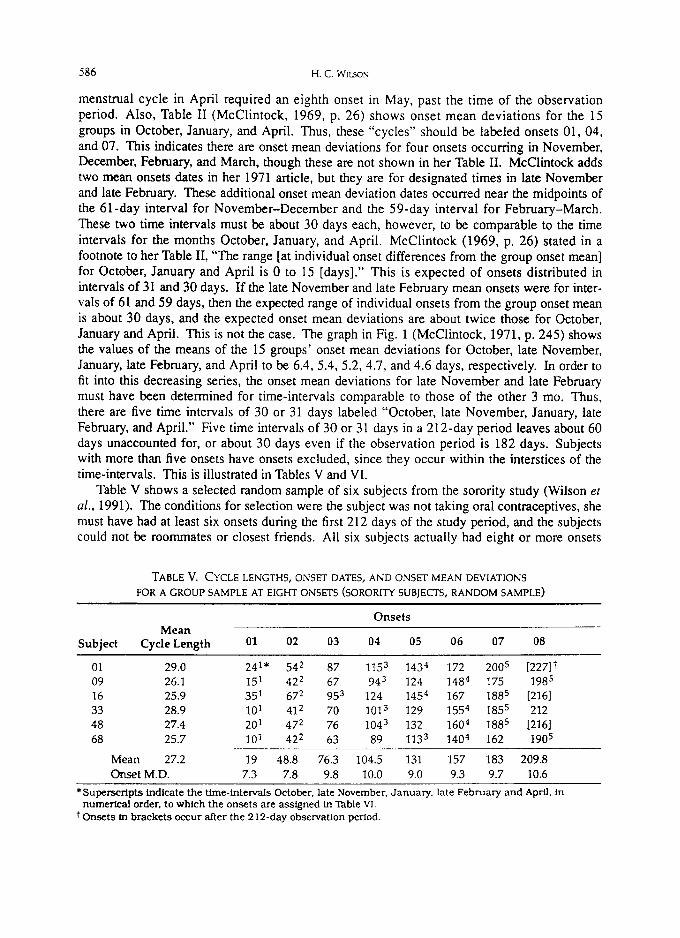
586 H.C. WILSON
menstrual cycle in April required an eighth onset in May, past the time of the observation period. Also, Table II (McClintock, 1969, p. 26) shows onset mean deviations for the 15 groups in October, January, and April. Thus, these "cycles" should be labeled onsets 01, 04, and 07. This indicates there are onset mean deviations for four onsets occurring in November, December, February, and March, though these are not shown in her Table II. McClintock adds two mean onsets dates in her 1971 article, but they are for designated times in late November and late February. These additional onset mean deviation dates occurred near the midpoints of the 61-day interval for November-December and the 59-day interval for February-March. These two time intervals must be about 30 days each, however, to be comparable to the time intervals for the months October, January, and April. McClintock (1969, p. 26) stated in a footnote to her Table II, "The range [at individual onset differences from the group onset mean] for October, January and April is 0 to 15 [days]." This is expected of onsets distributed in intervals of 31 and 30 days. If the late November and late February mean onsets were for inter- vals of 61 and 59 days, then the expected range of individual onsets from the group onset mean is about 30 days, and the expected onset mean deviations are about twice those for October, January and April. This is not the case. The graph in Fig. 1 (McClintock, 1971, p. 245) shows the values of the means of the 15 groups' onset mean deviations for October, late November, January, late February, and April to be 6.4, 5.4, 5.2, 4.7, and 4.6 days, respectively. In order to fit into this decreasing series, the onset mean deviations for late November and late February must have been determined for time-intervals comparable to those of the other 3 mo. Thus, there are five time intervals of 30 or 31 days labeled "October, late November, January, late February, and April." Five time intervals of 30 or 31 days in a 212-day period leaves about 60 days unaccounted for, or about 30 days even if the observation period is 182 days. Subjects with more than five onsets have onsets excluded, since they occur within the interstices of the time-intervals. This is illustrated in Tables V and VI.
Table V shows a selected random sample of six subjects from the sorority study (Wilson et al., 1991). The conditions for selection were the subject was not taking oral contraceptives, she must have had at least six onsets during the first 212 days of the study period, and the subjects could not be roommates or closest friends. All six subjects actually had eight or more onsets
TABLE V. CYCLE LENGTHS, ONSET DATES, AND ONSET MEAN DEVIATIONS FOR A GROUP SAMPLE AT EIGHT ONSETS (SORORITY SUBJEC-'TS, RANDOM SAMPLE)
Onsets Mean
Subject Cyde Length 01 02 03 04 05 06 07 08
01 29.0 241. 542 87 1153 1434 172 2005 [227]~ 09 26.1 151 422 67 943 124 1484 I75 1985 16 25.9 351 672 953 124 1454 167 1885 [216] 33 28.9 101 412 70 1013 129 1554 1855 212 48 27.4 201 472 76 1043 132 1604 1885 [216] 68 25.7 101 422 63 89 1133 1404 162 1905
Mean 27.2 19 48.8 76.3 104.5 131 157 183 209.8 Onset M.D. 7.3 7.8 9.8 10.0 9.0 9.3 9.7 10.6
* Superscripts indicate the time-intervals October, late November, January. late February and April, in numerical order, to which the onsets are assigned in Table VI.
t Onsets in brackets occur after the 212-day observation period.
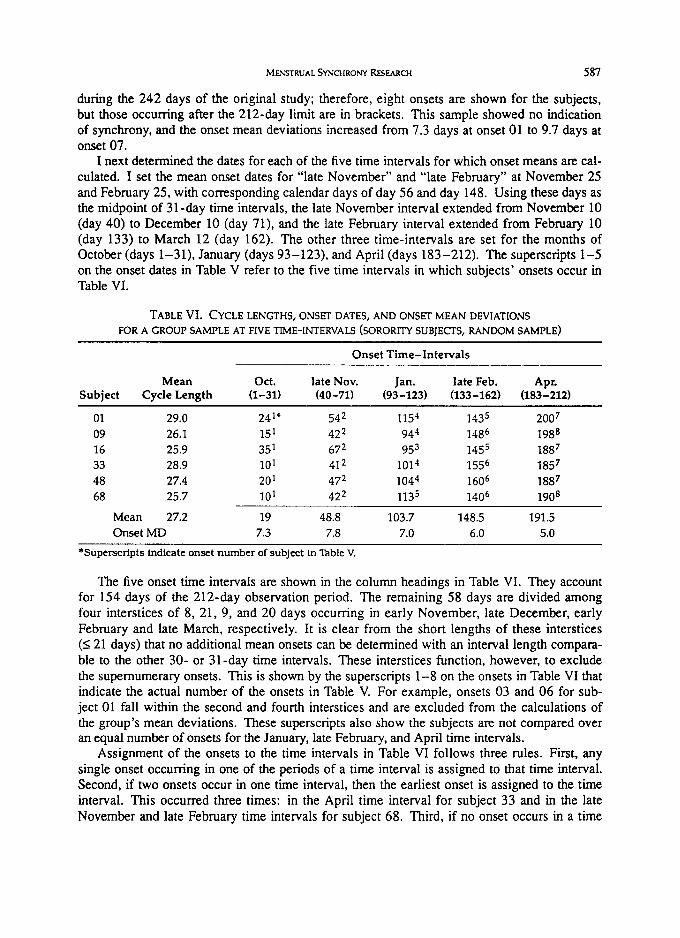
MENSTRUAL SYNCHRONY RESEARCH 587
during the 242 days of the original study; therefore, eight onsets are shown for the subjects, but those occurring after the 212-day limit are in brackets. This sample showed no indication of synchrony, and the onset mean deviations increased from 7.3 days at onset 01 to 9.7 days at onset 07.
I next determined the dates for each of the five time intervals for which onset means are cal- culated. I set the mean onset dates for "late November" and "late February" at November 25 and February 25, with corresponding calendar days of day 56 and day 148. Using these days as the midpoint of 31-day time intervals, the late November interval extended from November 10 (day 40) to December 10 (day 71), and the late February interval extended from February 10 (day 133) to March 12 (day 162). The other three time-intervals are set for the months of October (days 1-31), January (days 93-123), and April (days 183-212). The superscripts 1-5 on the onset dates in Table V refer to the five time intervals in which subjects' onsets occur in Table VI.
TABLE VI. CYCLE LENGTHS, ONSET DATES, AND ONSET MEAN DEVIATIONS FOR A GROUP SAMPLE AT FIVE TIME-INTERVALS (SORORITY SUBJECTS, RANDOM SAMPLE)
Onset T i m e - Intervals
Mean Oct. late Nov. Jan. late Feb. Apr. Subject Cycle Length (1-31) (40-71) (93-123) (133-162) (183-212)
01 29.0 241. 542 1154 1435 2007 09 26.1 151 422 944 1486 1988 16 25.9 351 672 953 1455 1887
33 28.9 101 412 1014 1556 1857 48 27.4 201 472 1044 1606 1887 68 25.7 101 422 1135 1406 1908
Mean 27.2 19 48.8 103.7 148.5 191.5 Onset MD 7.3 7.8 7.0 6.0 5.0
*Superscripts indicate onset number of subject in Table V.
The five onset time intervals are shown in the column headings in Table VI. They account for 154 days of the 212-day observation period. The remaining 58 days are divided among four interstices of 8, 21, 9, and 20 days occurring in early November, late December, early February and late March, respectively. It is clear from the short lengths of these interstices (< 21 days) that no additional mean onsets can be determined with an interval length compara- ble to the other 30- or 31-day time intervals. These interstices function, however, to exclude the supernumerary onsets. This is shown by the superscripts 1-8 on the onsets in Table VI that indicate the actual number of the onsets in Table V. For example, onsets 03 and 06 for sub- ject 01 fall within the second and fourth interstices and are excluded from the calculations of the group's mean deviations. These superscripts also show the subjects are not compared over an equal number of onsets for the January, late February, and April time intervals.
Assignment of the onsets to the time intervals in Table VI follows three rules. First, any single onset occurring in one of the periods of a time interval is assigned to that time interval. Second, if two onsets occur in one time interval, then the earliest onset is assigned to the time interval. This occurred three times: in the April time interval for subject 33 and in the late November and late February time intervals for subject 68. Third, if no onset occurs in a time
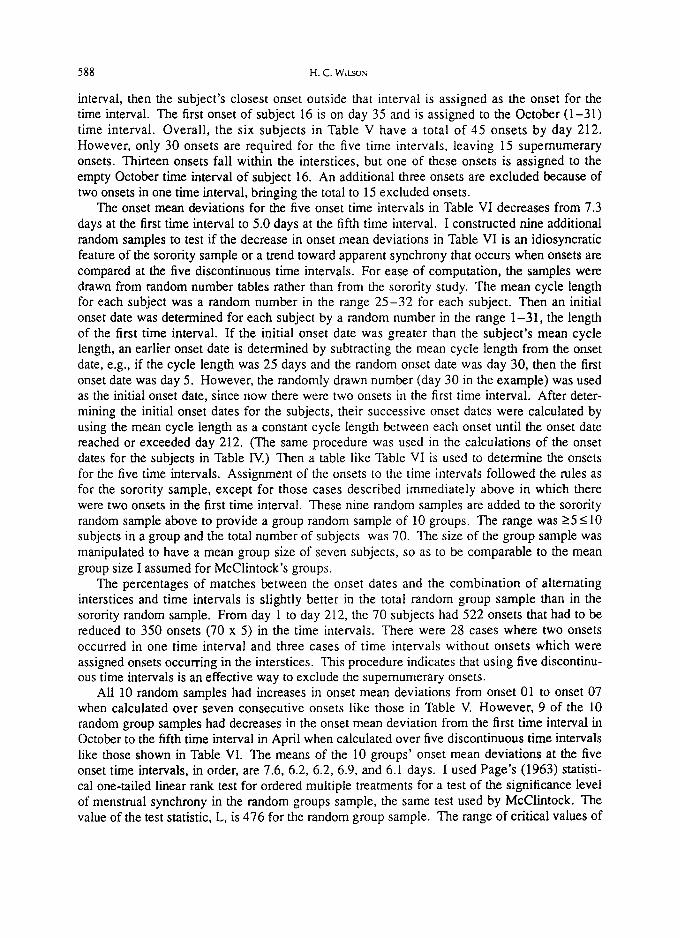
588 H.C. W~LSOS
interval, then the subject's closest onset outside that interval is assigned as the onset for the time interval. The first onset of subject 16 is on day 35 and is assigned to the October (1-31) time interval. Overall, the six subjects in Table V have a total of 45 onsets by day 212. However, only 30 onsets are required for the five time intervals, leaving 15 supernumerary onsets. Thirteen onsets fall within the interstices, but one of these onsets is assigned to the empty October time interval of subject 16. An additional three onsets are excluded because of two onsets in one time interval, bringing the total to 15 excluded onsets.
The onset mean deviations for the five onset time intervals in Table VI decreases from 7.3 days at the first time interval to 5.0 days at the fifth time interval. I constructed nine additional random samples to test if the decrease in onset mean deviations in Table VI is an idiosyncratic feature of the sorority sample or a trend toward apparent synchrony that occurs when onsets are compared at the five discontinuous time intervals. For ease of computation, the samples were drawn from random number tables rather than from the sorority study. The mean cycle length for each subject was a random number in the range 2 5 - 3 2 for each subject. Then an initial onset date was determined for each subject by a random number in the range 1-31, the length of the first time interval. If the initial onset date was greater than the subject 's mean cycle length, an earlier onset date is determined by subtracting the mean cycle length from the onset date, e.g., if the cycle length was 25 days and the random onset date was day 30, then the first onset date was day 5. However, the randomly drawn number (day 30 in the example) was used as the initial onset date, since now there were two onsets in the first time interval. After deter- mining the initial onset dates for the subjects, their successive onset dates were calculated by using the mean cycle length as a constant cycle length between each onset until the onset date reached or exceeded day 212. (The same procedure was used in the calculations of the onset dates for the subjects in Table IV.) Then a table like Table VI is used to determine the onsets for the five time intervals. Assignment of the onsets to the time intervals followed the rules as for the sorority sample, except for those cases described immediately above in which there were two onsets in the first time interval. These nine random samples are added to the sorority random sample above to provide a group random sample of 10 groups. The range was >5 _<10 subjects in a group and the total number of subjects was 70. The size of the group sample was manipulated to have a mean group size of seven subjects, so as to be comparable to the mean group size I assumed for McClintock's groups.
The percentages of matches between the onset dates and the combination of alternating interstices and time intervals is slightly better in the total random group sample than in the sorority random sample. From day 1 to day 212, the 70 subjects had 522 onsets that had to be reduced to 350 onsets (70 x 5) in the time intervals. There were 28 cases where two onsets occurred in one time interval and three cases of time intervals without onsets which were assigned onsets occurring in the interstices. This procedure indicates that using five discontinu- ous time intervals is an effective way to exclude the supernumerary onsets.
All 10 random samples had increases in onset mean deviations from onset 01 to onset 07 when calculated over seven consecutive onsets like those in Table V. However, 9 of the 10 random group samples had decreases in the onset mean deviation from the first time interval in October to the fifth time interval in April when calculated over five discontinuous time intervals like those shown in Table VI. The means of the 10 groups' onset mean deviations at the five onset time intervals, in order, are 7.6, 6.2, 6.2, 6.9, and 6.1 days. I used Page's (1963) statisti- cal one-tailed linear rank test for ordered multiple treatments for a test of the significance level of menstrual synchrony in the random groups sample, the same test used by McClintock. The value of the test statistic, L, is 476 for the random group sample. The range of critical values of
MENSTRUAL SYNCHRONY RESEARCH 589
L for a significance level of 0.05 is 477-486 . Thus, the random group sample falls short of showing a significant decrease in onset mean deviations over the five time intervals.
The trend toward apparent synchrony is due to an increase in the number of cases C in relation to cases B, when group onsets are compared at discontinuous time intervals. Case C, according to equation 1, produces onset convergence over the first few consecutive onsets with a probability of 0.5. However, the frequency of cases C is 70.7% in the random group sample and is the reason for the decrease in the group's onset mean deviations. The greater frequency of cases C occurs because some subjects require more than one cycle to cross the interstice to the next onset time interval. In general, the subjects who have onsets in the earlier half of a time interval need two cycles to cross the interstice to the next time interval, while the subjects with onsets in the later half of the time interval need only one cycle to cross the interstice. Thus, the mean cycle length (subject M's cycle length) is between the cycle lengths of the subjects crossing the interstice in multiple cycles and those crossing in one cycle, while the mean onset date (subject M's onset) is between the onsets in the earlier and later halves of the time interval. Given these conditions, the subjects are cases C in relation to subject M such as those shown in the artificial sample in Table IV. Also, the differences between the cycle lengths of the subjects and that of subject M, i.e., the rate of change, is expected to be large because the mean is calculated for a combination of single and multiple cycles.
It appears from the foregoing discussion that perfect synchrony should be achieved over one or two time intervals, since about 71% of the onset change differences are cases C and the mag- nitude of the rate of change is large. However, the discussion of the first conclusion drawn from Error I points out that cases C increase, rather than the decrease, if the magnitude of change (the difference between the subjects' cycle lengths) is more than twice the preceding onset difference. This situation only occurs when the preceding onset difference is at or near zero, if onset differences are calculated over consecutive cycles. However, large rates of change are more frequent when onsets are calculated at discontinuous time intervals, and this increases the frequencies of those cases C in which onset differences increase rather than decrease. The reversal of the direction of change, therefore, dampens the rate of onset conver- gence expected from the high frequency of cases C. This also explains why the group onset mean deviations tend to decrease sharply over the first few onsets and then tend to stabilize.
Recall in McClintock's groups sample that "the greatest decrease [in the group sample means] occurred in the first 4 months with little subsequent change" (McClintock, 1971, p. 245). About 56% of the total decrease in McClintock's group sample means and about 93% of the total decrease in the random sample means occurred in both samples between the first and second time intervals. This is because group mean deviations tend to be greater at the first time interval, since they are not affected by the greater frequency of cases C. However, at sub- sequent onsets, the magnitude of change of some cases C exceeds more than twice the previous onset mean deviations, and the values of the onset mean deviations either stabilize or oscillate in a narrow range. This trend is evident in my random samples when extended to 15 onsets. Thus, the shape of the curve in McClintock's Fig. 1 (McClintock, 1971, p. 245) can be explain- ed by the relative frequencies of cases C with decreasing onset differences between the first and second time intervals and by the combination of decreasing and increasing cases C thereafter.
In summary, I conclude that McClintock did not demonstrate menstrual synchrony in her close-friends group sample because the closest onsets were not used for calculating the initial onset differences between subjects (Error II). Further, evidence from McClintock's honors thesis and article indicate that the mean onset dates for the close friends group sample were cal- culated at five discontinuous time intervals. The random sample demonstrates that this proce-
590 H.C. WIt.SON
dure biases a sample toward apparent menstrual synchrony by excluding onsets and increasing the number of cases C relative to cases B (Error 1II).
SUMMARY AND CONCLUSIONS
The two experiments of Russell et al. (1980) and Preti et al. (1986) and the three studies of Graham and McGrew (1980), Quadagno et al. (1981), and McClintock (1969, 1971) all have two or three errors that bias their results toward showing higher than expected frequencies of menses onset convergence in their samples. I have demonstrated in all samples, except McClintock's two samples of pairs, that statistically significant levels of menstrual synchrony are not found when these errors are corrected. A comparable demonstration for McClintock's samples of pairs is not possible because the documentation of her research is insufficient for correcting errors and conducting revised tests for menstrual synchrony. My general conclusion is that none of the samples in the experiments and studies demonstrate menstrual synchrony in human subjects. This conclusion is supported by the studies of Pfaff (1980), Jarett (1984), and two studies of Wilson et al. (1991) that reporting finding no statistically significant levels of menstrual synchrony in their samples of pairs and groups.
Whether or not menstrual synchrony occurs in humans is still an open question. Ovarian cycles in vertebrates have adapted to a wide range of environmental stimuli (McClintock, 1981, 1983a, 1983b), McClintock (1983a, pp. 136-140, Table I) listed 36 species of mammals in which reproductive synchrony, suppression, and enhancement occur in female groups in natural environments. Eighteen of these species, not including humans, are shown as having syn- chronous ovarian cycles as the result of interactions between females; eight of the species are primates. There is no a priori reason why humans should be an exception. Important theoreti- cal and practical issues hinge upon the outcome of this question. However, tests for human menstrual synchrony need to be more rigorously controlled, and new methods of testing need to be devised. I have attempted to contribute to this effort by indicating three errors in menstrual synchrony research and by suggesting methods by which these errors can be avoided.
Acknowledgments: The research background for this paper was supported by National Institute of Mental Health grant 1 R03 MH 32054-01 and University of Missouri - Columbia grant RR 07053, the latter supported by an Institutional Biomedical Research Support Grant from the National Institutes of Health. I thank my departmental colleagues Dr. James A. Gavan, Dr. Michael C. Robbins, and Dr. Samuel D. Stout for their advice and support, and Dr. Michael J. O'Brien who read an earlier draft of this manuscript and provided constructive criticism. Dr. Glenn Hausfater, formerly of the Division of Biological Sciences, gave me encouragement at a critical juncture in this project. I thank Drs. Whalen and Quadagno for permission to use information from their correspondence. Thanks, also, to former students, especially Sarah Gehlert and David Griffin, and to col- leagues and friends who pointed out references to menstrual synchrony in the scientific literature and the mass media.
REFERENCES
Bachmann GA, Kemmann E (1982) Prevalence of oligomenorrhea and amenorrhea in a college population. Am J Obstet Gyneco1144: 98-102.
Bennett JP (1974) Chemical Contraception. Columbia University Press, NY Collett ME, Wertenberger GE, Fiske VM (1954) The effect of age upon the pattern of the menstrual cycle.
Fertil Steril 5: 437-448. Doring GK (1969) The incidence of anovular cycles in women. J Reprod Fert (Suppl)6: 77-81. Doty RL (1981) Olfactory communication in humans. Chem Senses 6: 351-376.
MI2qSTRUAI. SYNCHRONY RESEARCH 591
Drickamer LC (1974) A ten-year summary of reproductive data for free-ranging Macaca mulatta. Folia Primato121: 61-80.
Dunbar RIM, Dunbar EP (1977) Dominance and reproductive success among female gelada baboons. Nature 266: 351-352.
Ellison PT, Lager C, Calfee J (1987) Low profiles of salivary progesterone among college undergraduate women. J Adolesc Health Care 8: 204-207.
Graham CA, McGrew WC (1980) Menstrual synchrony in female undergraduates living on a coeducational campus. Psychoneuroendocrinology 5: 245-252.
Hrdy SB (1981) The Woman That Never Evolved. Harvard University Press, Cambridge. Jarett LR (1984) Psychosocial and biological influences on menstruation: synchrony, cycle length, and regular-
ity. Psychoneuroendocrinology 9: 21-28. McClintock MK (1969) Menstrual Synchrony and Acceleration: A Possible Parallel with Pheromonal Pheno-
mena in Mice. Honors Thesis, Wellesley College, Wellesley MA. McClintock MK (1971) Menstrual synchrony and suppression. Nature 229: 244-245. McClintock MK (1981) Social control of the ovarian cycle and the function of estrous synchrony. Amer Zool
21: 243-256. McClintock MK (1983a) Pheromonal regulation of the ovarian cycle: enhancement, suppression, and syn-
chrony. In: Vandenberg JG (Ed) Pheromones And Reproduction In Mammals. Academic Press, New York, pp 113-149.
McClintock MK (1983b) Synchronizing ovarian and birth cycles by female pheromones. In: Muller-Schwarze D, Silverstein RM (Eds).Chemical Signals in Vertebrates. Plenum Press, New York, pp 159-178.
McCormick WO (1975) Amenorrhea and other menstrual symptoms in student nurses. J Psychosom Res 19: 131-137.
Monmaney T (1987) Are we led by the nose? Discovery Sep: 48-56. Page EB (1963) Ordered hypotheses for multiple treatments: a significance test for linear ranks. Amer Star
Assoc J 58: 216-230. Pfaff MJU (1980) Menstrual Synchrony: Fact or Fiction? Master's Thesis, University of Idaho, Moscow ID. Preti G (1987) Reply to Wilson (letter). Horm Behav 21: 547-550. Preti G, Cutler WB, Garcia CR, Huggins GR, Lawley HL (1986) Human axillary secretions influence women's
menstrual cycles: the role of donor extract of females. Horm Behav 20: 474-482. Quadagno DM, Shubeita HE, Deck J, Francoeur, D (1981) Influence of male social contacts, exercise and all-
female living conditions on the menstrual cycle. Psychoneuroendocrinology 6: 239-244. Rogel MJ (1978) A critical evaluation of the possibility of higher primate reproductive and sexual pheromones.
Psychol Bu185: 810-830. Russell MJ, Switz GM, Thompson K (1980) Olfactory influences on the human menstrual cycle. Pharmacol
Biochem Behav 13: 737-738. Sheldrake P, Cormack M (1976) Variations in menstrual cycle symptom reporting. J Psychosom Res 20:
169-175. Siegel S (1956) Nonparametric Statistics for the Behavioral Sciences. McGraw Hill, New York. Singh KB (1981) Menstrual disorders in college students. Am J Obstet Gynecol 140: 299-302. Treloar AE, Boynton RE, Behn BG, Brown BW (1967) Variation of the human menstrual cycle through repro-
ductive life. Int J Fert 12: 77-126. Turke PW (1984) Effects of ovulatory concealment and synchrony on protohominid mating systems and
parental roles. Ethol Sociobol 5: 33-44. Vollman RF (1977) The Menstrual Cycle. WB Saunders, Philadelphia. Wilson HC (1987) Female axillary secretions influence women's menstrual cycles: a critique. Horm Behav 21:
536-546. Wilson HC, Kiefhaber SH, Gravel V (1991) Two studies of menstrual synchrony: negative results. Psycho-
neuroendocrinology 16: 353-359.