Embed Size (px)
Citation preview
A Critical Examination of the Relationshipbetween Emotional Intelligence andTransformational Leadershipjoms_933 1317..1342
Dirk Lindebaum and Susan CartwrightManchester Business School; Lancaster University
abstract The buoyant research interest in the constructs emotional intelligence (EI) andtransformational leadership (TFL) is a testament to the crucial role of emotional skills at work.EI is often described as an antecedent of TFL, and several empirical studies report a positiverelationship between these variables. On closer inspection, however, there may bemethodological factors, such as common method variance, that potentially undermine thevalidity of findings. Using a multi-rater assessment (N = 227), this study sought to overcomethe problem of method variance, whilst at the same time evaluate its potential presence bycomparing same-source and non-same-source data. Findings suggest that, when using a strongmethodological design, no relationship between EI and TFL is found. Thus, these findingsrenew the demand for scientific rigour in the design of studies to enhance their validity. Thetheoretical ramifications of this study are such that management scholars need tore-conceptualize the relationship between EI and TFL.
INTRODUCTION
In an era when organizations increasingly rely upon knowledge workers (Ostermanet al., 2001), the importance of emotional skills in the workplace has gained enormousvisibility in recent years (e.g. Ashkanasy et al., 2000; Druskat and Druskat, 2006). This ispartly because, in a knowledge–work economy, teams become the production unit ratherthan the individual (Drucker, 1994). Their success depends, inter alia, on the quality ofinterpersonal relationships (Caruso and Salovey, 2004; Jordan et al., 2002; Kelan, 2008).Thus, many writers point out that the function of organizations is increasingly reliantupon emotional skills, such as sensitivity towards others, empathy, and emotional regu-lation (Gabriel and Griffiths, 2002; Goleman, 1998). Some go as far as to suggest thattwo-thirds of the competencies associated with superior performance at work are socialand emotional in nature (Cherniss, 2000).
Address for reprints: Dirk Lindebaum, Manchester Business School, Booth Street West, Manchester M15 6PB,UK ([email protected]).
© 2010 The AuthorsJournal of Management Studies © 2010 Blackwell Publishing Ltd and Society for the Advancement of ManagementStudies. Published by Blackwell Publishing, 9600 Garsington Road, Oxford, OX4 2DQ, UK and 350 Main Street,Malden, MA 02148, USA.
Journal of Management Studies 47:7 November 2010doi: 10.1111/j.1467-6486.2010.00933.x
Following this, two constructs have especially captured the imagination of manage-ment scholars and psychologists: emotional intelligence (EI) and transformational lead-ership (TFL). Whilst several accounts underlie their heightened importance (seeCartwright and Pappas, 2008), quickly changing and turbulent organizational environ-ments contributed a fair share to the advocacy of both constructs in management andpsychology (e.g. Bass, 1985; Druskat and Druskat, 2006). Both EI and TFL are emotion-laden constructs (George, 2000) and the former has been suggested to be an antecedentof the latter (Brown and Moshavi, 2005). In consequence, the relationship between theseconstructs has been zealously studied in recent years, both theoretically (Ashkanasy andDaus, 2005; Austin et al., 2008; Küpers and Weibler, 2006) and empirically (Butler andChinowsky, 2006; Duckett and Macfarlane, 2003; Leban and Zulauf, 2004). In theirentirety, these studies appear to suggest that the relationship between EI and TFL islargely corroborated.
However, serious reservations have been raised in terms of accepting results fromstudies examining the relationship between EI and leadership. Antonakis (2003), inparticular, criticizes the failure of many studies to avoid common method variance(CMV). Similar concerns are echoed elsewhere (Kroeck et al., 2004). The present studyacknowledges these concerns and extends them to the theory of EI and TFL, a nexus thathas also been questioned in a recent and pithy exchange between proponents and criticsof EI (Antonakis et al., 2009). The above criticism should be understood in light of claimsthat EI explains 34 per cent of the variance in a measure of TFL (Butler and Chinowsky,2006), which is an above-average percentage in social science research (Pallant, 2005).To date, the management literature has not adequately addressed the methodologicalchallenge of overcoming CMV, whilst at the same time permitting an evaluation of itspotential presence in the aforementioned relationship.
This article seeks to remedy this deficiency. First, it provides a rationale for utilizing aparticular conceptualization of EI. Second, it synthesizes the theoretical concepts of EIand TFL and offers an overview of empirical studies that have investigated the interfacebetween the two. It then proceeds to explain briefly the methodological concerns relatedto CMV and the implications for research designs. The resultant design of this studyexplores the relationship between EI and TFL, taking account of CMV. Finally, thearticle discusses its findings in relation to previous studies, its limitations, and recom-mendations for future research.
EMOTIONAL INTELLIGENCE
EI has been variously defined in the current literature. For instance, Mayer and Salovey(1997) define EI as the ‘ability to perceive accurately, appraise, and express emotion; theability to access and/or generate feelings when they facilitate thought; the ability tounderstand emotion and emotional knowledge; and the ability to regulate emotions topromote emotional and intellectual growth’ (p. 10). However, other writers haveadopted a broader perspective on EI, thereby extending the cognitive ability model ofMayer and Salovey (1997). These conceptualizations incorporate additional factors suchas zeal, persistence, or assertiveness (e.g. Bar-On, 1997; Goleman, 1995), and thusinclude personality traits in addition to mental abilities. The above extension has crucial
D. Lindebaum and S. Cartwright1318
© 2010 The AuthorsJournal of Management Studies © 2010 Blackwell Publishing Ltd andSociety for the Advancement of Management Studies
implications for how EI is operationalized. That is, even if EI inventories tap into thesame sampling domains (e.g. emotion perception), the resultant operationalization ofability-based and self-report measures is fundamentally different (Davey, 2005). Thisview is strongly informed by the work of Petrides and Furnham (2001), who proposed thetaxonomy of trait and ability EI. According to Petrides et al. (2007, p. 273), trait EI canbe defined as ‘emotion-related dispositions and self-perceptions’. Trait EI relies uponself-report measures (e.g. the Emotional Quotient Inventory, EQ-i) and assesses typicalor preferred modes of behaviour, whereas the latter uses ability measures (e.g. theMayer–Salovey–Caruso Emotional Intelligence Test, MSCEIT), with right or wronganswers, and refers to maximum performance in processing emotional information(Mayer and Salovey, 1997).
Both trait and ability EI approaches have received a fair share of critical evaluation.These concern, inter alia, the conceptual overlap of trait EI with traditional personalityfactors (O’Connor and Little, 2003) and the objective determination of correct responsesto test items in the case of ability measures (Brody, 2004). However, representatives ofboth the trait and ability EI approach maintain that considerable progress of theirrespective conceptualization has been achieved in recent years (Mayer et al., 2004;Petrides et al., 2007).
This study adopts the trait EI conceptualization as a framework of analysis for twomain reasons. First, some self-report measures within the trait EI tradition have dem-onstrated excellent psychometric properties in terms of construct validity as well aspredictive and incremental validity over and above personality and other so-called traitEI measures (e.g. Freudenthaler et al., 2008; Law et al., 2004; Wong and Law, 2002).Furthermore, the time required to complete some self-report measures is considerablyshorter than the ability measure of EI, which is a crucial factor in negotiating access toorganizations. Second, self-report measures are susceptible to the effects of social desir-ability (Schutte et al., 1998). In response to this, several scholars have called for the useof multi-rater assessments to overcome this methodological weakness of trait EI measures(Roberts et al., 2001). Such sentiment is also echoed by Matthews et al. (2004), whoemphatically argue that validation studies of this kind ‘are urgently needed’ (p. 184),though as yet not widely undertaken. The design of this study takes this view intoaccount.
Synthesizing EI and TFL
The interface between the concepts of EI and TFL has been subject of intense scientificscrutiny in recent years (Antonakis et al., 2009; Brown and Moshavi, 2005; Küpers andWeibler, 2006). In this section, this is explored first with regard to the conceptualproximity between EI and TFL, followed by a detailed discussion of empirical studiesthat examined their relationship.
Whilst TFL has been variously defined, Burns (1978) characterizes the transforma-tional leader as someone who ‘looks for potential motives in followers, seeks to satisfyhigher needs, and engages the full person of the follower’ (p. 4). He goes on to suggestthat the result ‘is a relationship of mutual stimulation and elevation that convertsfollowers into leaders and may convert leaders into moral agents’ (p. 4). Bass and Avolio
Emotional Intelligence and Transformational Leadership 1319
© 2010 The AuthorsJournal of Management Studies © 2010 Blackwell Publishing Ltd and
Society for the Advancement of Management Studies
(1994) have refined earlier research on TFL (e.g. Bass, 1985) and deconstructed theconcept into four components (i.e. the ‘four I’s’). These are denoted as: (1) idealizedinfluence, (2) inspirational motivation, (3) intellectual stimulation, and (4) individualizedconsideration. Briefly, transformational leaders who exercise idealized influence providea vision and sense of mission, instil pride, and are admired and respected by theirfollowers, who often seek to emulate them (Avolio et al., 1991). Transformational leadersuse inspirational motivation to communicate high expectations, often drawing on sym-bolic messages to provide meaning to their followers’ work (Bass, 1990). Intellectualstimulation concerns the leader’s efforts to help followers be creative and innovate byquestioning assumptions and prompting them to approach old situations in novel ways(Avolio et al., 1991). Finally, transformational leaders tend to exercise individualizedconsideration towards their followers by paying close attention to each individual’s needsfor progression and achievement (Bass, 1990). A rich stock of studies suggests that TFLcan be a very effective form of leadership ( Jansen et al., 2008; Rowold and Heinitz,2007).
Caruso and Salovey (2004) argue that it is rather difficult to inspire individuals, tochallenge their prevalent assumptions, and to enable them, without being emotionallyintelligent. For instance, it may be difficult for a leader to exercise individualized con-sideration, intellectual inspiration, inspirational motivation, and idealized influencewithout the ability to accurately appraise and express emotions in the self and others inthe first place (see Küpers and Weibler, 2006). This is fundamentally important becausefailure to do so would create a dissonance between the leader and follower, therebypreventing the very transformational process from taking effect. Likewise, the use ofemotions to facilitate thinking may be conducive to instil confidence or hope in followerswho feel overwhelmed by the task at hand, thus being closely linked to inspirationalmotivation. Understanding the causes of emotions and how they change over time aidsthe leader in arousing enthusiasm and optimism for a proposed activity or change, as wellas shifting the mood by inducing a more cautious atmosphere if decisions carry high risks(George, 2000; Yukl, 2006). Such activities are captured, for instance, in the intellectualstimulation and inspirational motivation dimension of TFL theory (Küpers and Weibler,2006). Lastly, the management of emotions in the self and others is reflected, inter alia, inthe individualized consideration component of TFL. Stated another way, some leadersmay be able to rebuild the confidence of a downtrodden and crestfallen follower, usingwords and suggestions they know the followers will be receptive to (George, 2000; Yukl,2006).
Given the transformational nature of the four I’s, some argue that leaders of this typeenable their followers to become leaders themselves (Hunt, 1991; Kuhnert, 1994).Because transformational leaders develop an emotion-laden relationship with their fol-lowers (Bass and Avolio, 1994), and EI has been described as vital for functioninginterpersonal relationships (Caruso and Salovey, 2004), the growing interest of leader-ship scholars in the relationship between EI and TFL would seem to be self-explanatory.
In recent years, numerous studies have examined empirically the link between EI andTFL. The literature review permits the classification of these studies into three prominentstreams. Stream 1 includes those studies that collected data concerning trait EI and TFLfrom the same source using self-report measures. Stream 2 features studies that admin-
D. Lindebaum and S. Cartwright1320
© 2010 The AuthorsJournal of Management Studies © 2010 Blackwell Publishing Ltd andSociety for the Advancement of Management Studies
istered trait EI and TFL questionnaires to different raters. Finally, studies pertaining toStream 3 used an ability-based measure of EI and collected data relative to TFL from adifferent source.
Examples of Stream 1 studies. Gardner and Stough (2002) have examined the relationshipbetween trait EI and TFL in a sample of 110 high-level managers. Trait EI is measuredby means of the Swinburne University Emotional Intelligence (SUEIT), whereas TFLhas been assessed via the Multifactor Leadership Questionnaire (MLQ). Data derivedfrom both questionnaires are self-reported. Findings produced in this study indicate astrong and significant correlation between trait EI and TFL, both at the total score(r = 0.68, p < 0.01) and subscale level (r = 0.27 to 0.64, p < 0.01). In the process ofconducting stepwise regression analysis, the dimension ‘understanding of emotions exter-nal’ emerged as the strongest predictor of TFL (b = 0.55, p < 0.01). Note, however, thatstepwise regression is often seen as a flawed procedure (Thompson, 1995). Mandell andPherwani (2003) also document a relationship between trait EI and TFL in a smallsample (n = 32) of retail managers. In this study, the researchers administered theself-report measures MLQ (5x-revised) and the EQ-i (Bar-On, 1997). Hierarchicalregression analysis demonstrates that trait EI is a significant predictor of TFL (R2 = 0.25,p < 0.05), suggesting that it explains 25 per cent of the variance in the TFL scores. Asimilar, albeit stronger, R2 value was obtained in a study by Butler and Chinowsky(2006). Using the same instruments as Mandell and Pherwani (2003) in a sample of 130construction executives, they have found that 34 per cent (R2 = 0.34, p < 0.001) of theTFL score is accounted for by the total trait EI score.
Examples of Stream 2 studies. Barling et al. (2000) have evaluated TFL behaviours in asample of 49 managers, each assessed by at least three subordinates. Managers com-pleted the EQ-i, whereas the subordinates had ranked the managers on the MLQ(5x-short). Their findings suggest that high overall trait EI scores are associated withthree out of the four TFL factors (i.e. idealized influence, inspirational motivation, andindividualized consideration). The fourth factor, intellectual stimulation, was not foundto have a significant relationship with trait EI. Note, however, that the findings of thisstudy are not based upon correlational analyses, but on mean differences (i.e.ANCOVA). In contrast, Brown et al. (2006) have found that trait EI, as measured by theEQ-i, does not correlate significantly with any of the MLQ subscales or total scale. Thesefindings were replicated in another study (Brown and Reilly, 2008).
Very few studies have explicitly cautioned against the pitfall of CMV with respect totrait EI and TFL. The study of Barbuto and Burbach (2006) makes a meaningfulcontribution to the field by using same-source and non-same-source ratings. That is,managers completed a trait EI and TFL scale, whilst colleagues (4–6 per individual)provided another TFL rating relative to the managers. The results of their study suggestthat overall trait EI correlates both with the self-ratings of TFL (all MLQ subscales:r = 0.21 to 0.42, p < 0.01) and the TFL assessment of colleagues (only two MLQ sub-scales: r = 0.12 and 0.13, p < 0.05). It is worth stressing that the correlations decrease instrength and significance once non-same-source ratings are considered.
Emotional Intelligence and Transformational Leadership 1321
© 2010 The AuthorsJournal of Management Studies © 2010 Blackwell Publishing Ltd and
Society for the Advancement of Management Studies
Examples of Stream 3 studies. Leban and Zulauf (2004) have incorporated an abilitymeasure of EI (MSCEIT, Mayer et al., 2002) in their research design, collecting dataconcerning EI and TFL from different sources. Here, 24 project managers completed theMSCEIT, whereas an unspecified number of team members and stakeholders assessedthe TFL style of those project managers using the MLQ. Leban and Zulauf reportedsignificant and moderately strong correlations between total EI and the inspirationalmotivation dimension of TFL (r = 0.36, p < 0.05) as well as correlations of similarsignificance and strength between the strategic EI component and idealized influenceand individual consideration.
In aggregate, however, the array of studies that rely upon same-source ratings inassessing the relationship between trait EI and TFL is considerable (e.g. Butler andChinowsky, 2006; Downey et al., 2006; Duckett and Macfarlane, 2003; Gardner andStough, 2002; Mandell and Pherwani, 2003; Palmer et al., 2001). This poses problems inthe interpretation of findings, as they can be prone to CMV. It is notable that the numberof studies pointing to the potential influence of CMV in the relationship between trait EIand TFL is extremely limited (see Barbuto and Burbach, 2006).
COMMON METHOD VARIANCE
CMV occurs when the measurement technique introduces systematic variance into themeasure (Doty and Glick, 1998). There is now a broad consensus among scholars that itposes a potential problem to the validity of empirical findings (Kline et al., 2000; Pod-sakoff et al., 2003), though some scholars discern a more serious threat in terms ofmeasurement and construct validity (Mitchell, 1985). Possible causes of CMV concernthe collection of the predictor and criterion variables from the same source at the sametime using the same measurement technique (see Podsakoff et al., 2003, for a review).
In technical terms, method factors can interact with trait factors in a multiplicativeway (Campbell and O’Connell, 1982). In other words, the higher the basic relationshipbetween traits, the higher the method effects. Under this formulation, multiplicativeeffects are a functional interaction between the ‘true’ level of trait correlation and themagnitude of method bias. Crucially, the focal point of this study (i.e. the relationshipbetween trait EI and TFL) may be particularly prone to the effects of CMV, as both traitEI and TFL are intrinsically imbued with emotion (e.g. George, 2000). The emergenceof the aforementioned multiplicative effect is further exacerbated when only same-sourceratings are used.
To prevent CMV, this study followed the guidelines offered by Podsakoff et al. (2003).Whilst these authors propose both procedural and statistical remedies to limit the effectsof CMV, they are explicit in their recommendation that the procedural remedy ofcollecting predictor and criterion variables from different sources is the most effectiveone. However, as a means of teasing out the presence of CMV in the relationshipbetween trait EI and TFL, same-source ratings are collected as well for the sake ofcomparison. As a result, our study takes the form of a multi-rater assessment, includingproject managers, their line managers, and team members. The precise nature of thedesign and the underling rationale are discussed later in this article.
D. Lindebaum and S. Cartwright1322
© 2010 The AuthorsJournal of Management Studies © 2010 Blackwell Publishing Ltd andSociety for the Advancement of Management Studies
RESEARCH AIM AND HYPOTHESES
The overriding aim of this study is to investigate the relationship between traitEI and TFL, whilst taking into account the potential influence of CMV. Suchinvestigation is of decisive importance given that EI is often seen as a predictor of TFL(e.g. Barbuto and Burbach, 2006; Brown and Moshavi, 2005), which then translatesinto superior leader performance. To recap, the basic logic behind the link between EIand TFL is that EI enables individuals to perceive and understand social contexts,as well as their own and others’ emotional states (Brown and Moshavi, 2005). Inconsequence, inspiring and empowering others, which are key components of TFLtheory, may prove difficult without being emotionally intelligent (Caruso and Salovey,2004).
Assuming that the connection between EI and TFL has been rigorously examined andreliable results are produced, management scholars would be able to: (1) continueadvancing theory around these constructs; and (2) use these studies to inform recruitmentor development policies. If, however, these results are methodologically questionable,then future theory building is likely to rest upon a shaky foundation and considerableresources may be squandered on policies that are based upon invalid results and add littleto the organizational bottom line.
To disentangle the relationship between trait EI and TFL, four hypotheses are articu-lated and examined in this study. To recap, the most effective way of preventing CMVis to collect the predictor and criterion variables from different sources (Podsakoff et al.,2003). In addition, in situations where correlations are randomly positive and negativeand nearing a practical significance of zero, it has been argued that there is a truecorrelation of zero. In such a case, Lindell and Whitney (2001) argue that there is errorvariance, but neither method variance nor a true score (i.e. no genuine correlationbetween two variables). Seen from this perspective, one can argue that large and signifi-cant correlations between same-source ratings, coupled with non-significant correlationsamong ratings from different sources, suggest that CMV exerts a significant influence onthe relationship between trait EI and TFL. In order to take account of the rating source(i.e. same-source vs. non-same-source), and to be able to examine the contradiction in theempirical studies reported earlier, it is essential to specify the hypotheses as rival hypoth-eses; that is, as being mutually exclusive. Therefore:
Hypothesis 1: Trait EI self-ratings of managers significantly and positively correlatewith the TFL ratings provided by the line manager and team members.
Hypothesis 2: Same-source ratings of trait EI and TFL provided by the line managerand team members correlate significantly and positively.
Hypothesis 3: Managers’ self-ratings of trait EI (subscales) significantly predict totalTFL scores provided by the line manager and team members.
Hypothesis 4: Same-source ratings of trait EI (subscales) significantly predict total TFLscores.
Emotional Intelligence and Transformational Leadership 1323
© 2010 The AuthorsJournal of Management Studies © 2010 Blackwell Publishing Ltd and
Society for the Advancement of Management Studies
Underlying Hypothesis 1 is the view that there is true correlation between trait EI andTFL. A significant correlation would support this hypothesis. In contrast, Hypothesis 2posits that there is a significant and positive relationship between trait EI and TFL incases where ratings stem from the same source due to a common method shared. AsHypotheses 1 and 2 are set out as rival hypotheses, they cannot both be supported in thepresent analysis. The same principle applies to Hypotheses 3 and 4. Pearson’s product-moment correlations (r) are used to test Hypotheses 1 and 2, whereas Hypotheses 3 and4 are subjected to multiple regression analysis. Randomization tests were also conductedto enhance the internal validity of findings (Todman and Dugard, 2001).
METHOD
Sample and Procedure
This study constitutes a quantitative portion of a larger ongoing mixed-method studyinto EI, TFL, and their implications for performance in the UK construction industry.The focus of this study rests upon project managers. Irrespective of specialization, theproject manager ‘oversees the day to day control of the process conducted on-siteincluding liaison with the architect/civil engineer regarding instructions, payments,progress meetings, and commercial dealings with sub-contractors’ (Harris and McCaffer,2001, p. 313). This implies an immense centrality of the project manager’s function,especially with a view to ensuring the success of a project (Calvert et al., 1995). To thiseffect, the project manager has to relate to a variety of different parties involved in theconstruction process, such as clients, architects, and operatives on site (Harris andMcCaffer, 2001). It is in the reconciling of these different social and educational back-grounds that the concept of EI gains prominence, for EI has been described as vital forinterpersonal relationships (Caruso and Salovey, 2004). A further reason for investigatingthe role of project managers stems from a curious contradiction in the extant literature.They embrace a key role in the delivery of a construction project (Dainty et al., 2004).Owing to these factors, trait EI and TFL are hypothesized to be important individualdifference variables that help distinguish effective from less effective project managers.This is important because engineering-oriented employees are increasingly seeking indi-viduals with good interpersonal skills in addition to technical expertise (Walesh, 2000).Yet, it must concurrently be pointed out that many project managers are conspicuousthrough undue egotism, arrogance, and aggressive management style (Harris andMcCaffer, 2001; Smithers and Walker, 2000). A recent report (ODPM, 2004) reiteratedthat the industry’s weakness in managing working relationships and the workforce is stillprevalent, despite earlier reports having identified this problem already (Egan, 1998;Latham, 1994). The corollary is thus that construction in general, and project managersspecifically, constitute an exciting and interesting opportunity to investigate the relation-ship between trait EI and TFL in an organizational setting. In total, 14 UK constructionorganizations participated in this study.
As stated earlier, the multi-rater assessment (Foster and Law, 2006) includes threedifferent hierarchical levels. Lawler (1967) discussed the merit of including a multi-raterapproach to assessing managerial behaviour at great length. In short, the line managers
D. Lindebaum and S. Cartwright1324
© 2010 The AuthorsJournal of Management Studies © 2010 Blackwell Publishing Ltd andSociety for the Advancement of Management Studies
are traditionally included as they know best how the manager’s job behaviour contrib-utes to the overall targets of the organization. Team member ratings are relevant sincethey are able to observe more of their managers’ behaviour than peers or line man-agers. Studies in the area of multi-rater assessments have used pairs of raters from thesame class (Atkins and Wood, 2002; Semmer et al., 1996). The use of pairs of ratershelps attenuate the problem of different raters having different perspectives on behav-iour (Lieberman, 1956). In the case of leadership assessments, some posit that theperspective of team members must be adopted (Meindl, 1995). The formation of a pairof raters at this level is thus advisable. Lastly, self-ratings are pertinent insofar as theindividuals’ self-perceptions are meaningful determinants of their future behaviour(Lawler, 1967).
Thus, the multi-rater assessment comprised a number of clusters, each of whichcontaining four individuals. That is, a project manager (i.e. the focal individual), a linemanager, and two team members (A and B). It was stipulated with participating com-panies that the project should at least have run for three months, so that the raters arereasonably able to evaluate the project managers. The project managers assessed theirown EI, whereas team members A and B, as well as the line managers, assessed the EIof project managers, along with their leadership styles. Overall, 404 questionnaires weredistributed (i.e. 101 clusters) and 227 were returned. More specifically, 55 projectmanagers, 62 line managers, 59 team members A, and 51 team members B returnedtheir questionnaires via postal mail to the author.[1] Thus, data were collected at the teammember, project manager, and line manager level. As we were interested in generatingas many correlational combinations as possible to examine the potential influence ofCMV irrespective of level analysis, we did not aggregate the data, particularly not theteam member ratings. Antonakis et al. (2004) furthermore note that, if a leader’s behav-iour is not homogeneously viewed by followers, then the behaviour of the leader operatesat the individual level of analysis. They argue that ‘any inferences that are made shouldbe based on the individual and use individual-level data, because individual responses areindependent’ (p. 63). Due to the lack of correlation between team members A and Bregarding EI (see Table II), further support for not aggregating the team member ratingswas obtained. Crucially still, Hunt (1991) notes that leadership assessments by followermay be no more than a reflection of their cognitive structures, an issue also raised in thecontext of CMV (see Podsakoff et al., 2003). It should be noted that it was of concern togenerate as many as possible rating combinations to more rigorously examine the effectsof CMV, and not, as undertaken by Atwater and Yammarino (1992), to examine theagreement between self and other ratings.
The response rate amounted to 56.2 per cent and is well within the range of pub-lished studies in the field of organizational research (Mitchell, 1985). The mean age ofthe project manager sample was 44 years (median = 43; SD = 8.91), with age rangingfrom 26 to 66 years (n = 55). Years working in construction varied between 1 and 35years, the mean being 12.3 years (median = 8.50; SD = 9.49). All project managerswere men. In line with the need to control for fixed effects in regression analyses (e.g.Judge et al., 1985), data on the financial volume of the projects were collected as aproxy measure for firm size (mean = £26.17 million; median = £21.25 million;SD = £21.47 million).
Emotional Intelligence and Transformational Leadership 1325
© 2010 The AuthorsJournal of Management Studies © 2010 Blackwell Publishing Ltd and
Society for the Advancement of Management Studies
Research Instruments
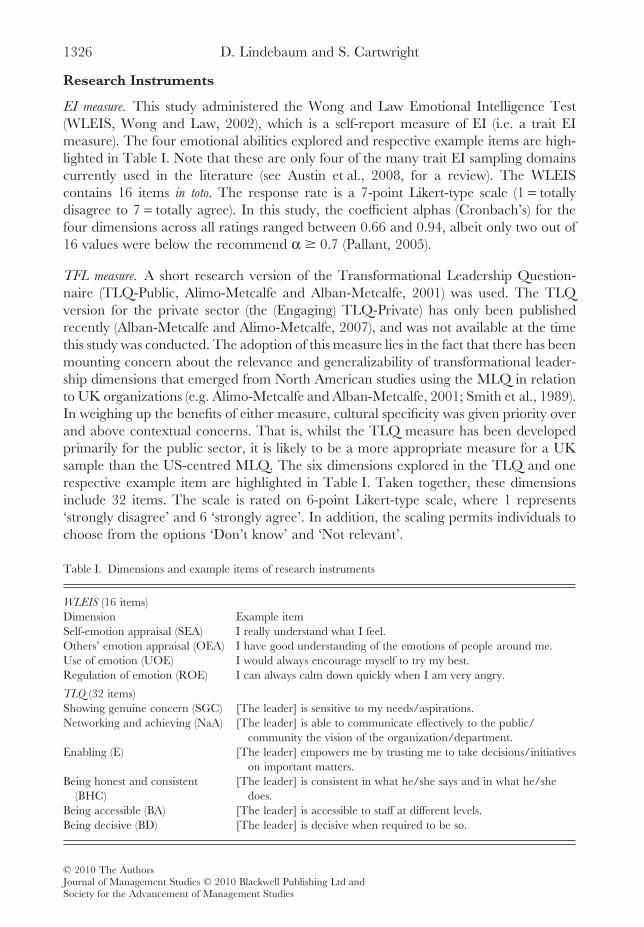
EI measure. This study administered the Wong and Law Emotional Intelligence Test(WLEIS, Wong and Law, 2002), which is a self-report measure of EI (i.e. a trait EImeasure). The four emotional abilities explored and respective example items are high-lighted in Table I. Note that these are only four of the many trait EI sampling domainscurrently used in the literature (see Austin et al., 2008, for a review). The WLEIScontains 16 items in toto. The response rate is a 7-point Likert-type scale (1 = totallydisagree to 7 = totally agree). In this study, the coefficient alphas (Cronbach’s) for thefour dimensions across all ratings ranged between 0.66 and 0.94, albeit only two out of16 values were below the recommend a � 0.7 (Pallant, 2005).
TFL measure. A short research version of the Transformational Leadership Question-naire (TLQ-Public, Alimo-Metcalfe and Alban-Metcalfe, 2001) was used. The TLQversion for the private sector (the (Engaging) TLQ-Private) has only been publishedrecently (Alban-Metcalfe and Alimo-Metcalfe, 2007), and was not available at the timethis study was conducted. The adoption of this measure lies in the fact that there has beenmounting concern about the relevance and generalizability of transformational leader-ship dimensions that emerged from North American studies using the MLQ in relationto UK organizations (e.g. Alimo-Metcalfe and Alban-Metcalfe, 2001; Smith et al., 1989).In weighing up the benefits of either measure, cultural specificity was given priority overand above contextual concerns. That is, whilst the TLQ measure has been developedprimarily for the public sector, it is likely to be a more appropriate measure for a UKsample than the US-centred MLQ. The six dimensions explored in the TLQ and onerespective example item are highlighted in Table I. Taken together, these dimensionsinclude 32 items. The scale is rated on 6-point Likert-type scale, where 1 represents‘strongly disagree’ and 6 ‘strongly agree’. In addition, the scaling permits individuals tochoose from the options ‘Don’t know’ and ‘Not relevant’.
Table I. Dimensions and example items of research instruments
WLEIS (16 items)Dimension Example itemSelf-emotion appraisal (SEA) I really understand what I feel.Others’ emotion appraisal (OEA) I have good understanding of the emotions of people around me.Use of emotion (UOE) I would always encourage myself to try my best.Regulation of emotion (ROE) I can always calm down quickly when I am very angry.
TLQ (32 items)Showing genuine concern (SGC) [The leader] is sensitive to my needs/aspirations.Networking and achieving (NaA) [The leader] is able to communicate effectively to the public/
community the vision of the organization/department.Enabling (E) [The leader] empowers me by trusting me to take decisions/initiatives
on important matters.Being honest and consistent
(BHC)[The leader] is consistent in what he/she says and in what he/she
does.Being accessible (BA) [The leader] is accessible to staff at different levels.Being decisive (BD) [The leader] is decisive when required to be so.
D. Lindebaum and S. Cartwright1326
© 2010 The AuthorsJournal of Management Studies © 2010 Blackwell Publishing Ltd andSociety for the Advancement of Management Studies
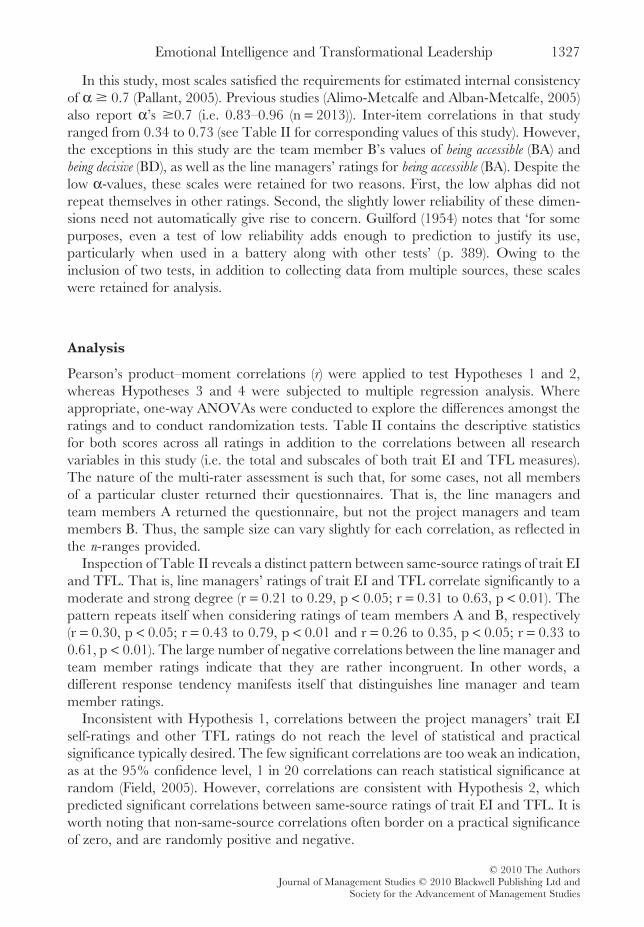
In this study, most scales satisfied the requirements for estimated internal consistencyof a � 0.7 (Pallant, 2005). Previous studies (Alimo-Metcalfe and Alban-Metcalfe, 2005)also report a’s �0.7 (i.e. 0.83–0.96 (n = 2013)). Inter-item correlations in that studyranged from 0.34 to 0.73 (see Table II for corresponding values of this study). However,the exceptions in this study are the team member B’s values of being accessible (BA) andbeing decisive (BD), as well as the line managers’ ratings for being accessible (BA). Despite thelow a-values, these scales were retained for two reasons. First, the low alphas did notrepeat themselves in other ratings. Second, the slightly lower reliability of these dimen-sions need not automatically give rise to concern. Guilford (1954) notes that ‘for somepurposes, even a test of low reliability adds enough to prediction to justify its use,particularly when used in a battery along with other tests’ (p. 389). Owing to theinclusion of two tests, in addition to collecting data from multiple sources, these scaleswere retained for analysis.
Analysis
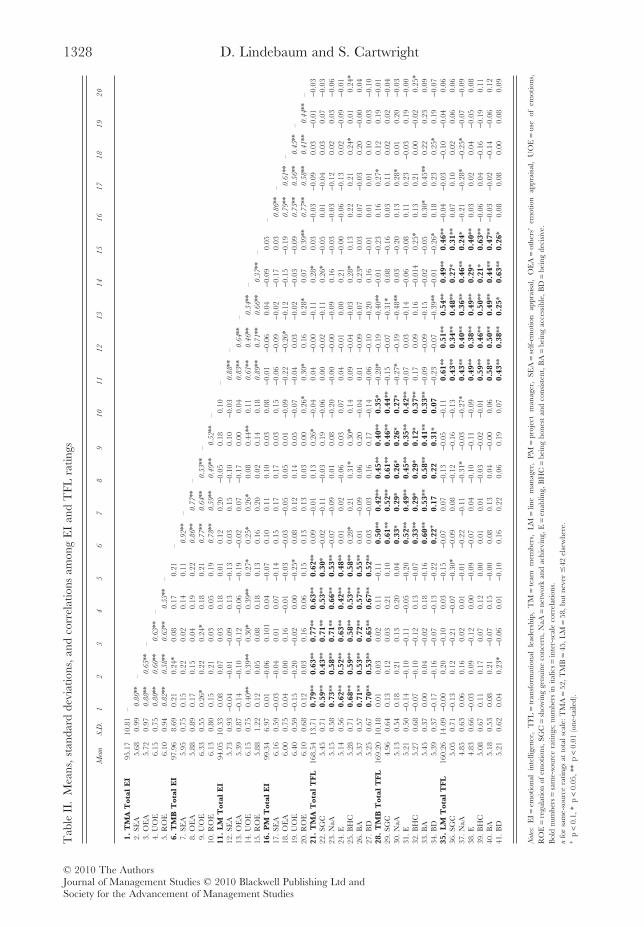
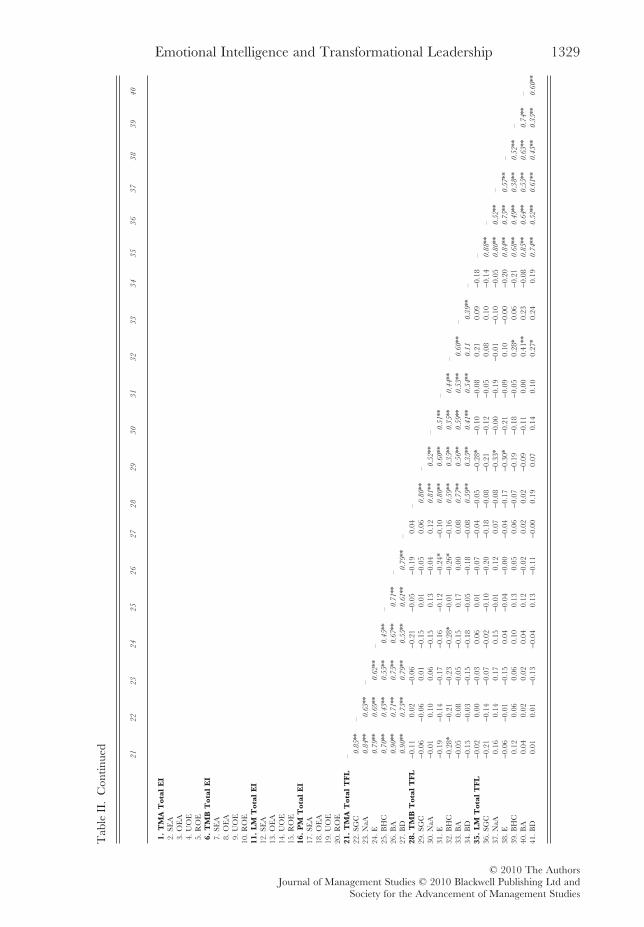
Pearson’s product–moment correlations (r) were applied to test Hypotheses 1 and 2,whereas Hypotheses 3 and 4 were subjected to multiple regression analysis. Whereappropriate, one-way ANOVAs were conducted to explore the differences amongst theratings and to conduct randomization tests. Table II contains the descriptive statisticsfor both scores across all ratings in addition to the correlations between all researchvariables in this study (i.e. the total and subscales of both trait EI and TFL measures).The nature of the multi-rater assessment is such that, for some cases, not all membersof a particular cluster returned their questionnaires. That is, the line managers andteam members A returned the questionnaire, but not the project managers and teammembers B. Thus, the sample size can vary slightly for each correlation, as reflected inthe n-ranges provided.
Inspection of Table II reveals a distinct pattern between same-source ratings of trait EIand TFL. That is, line managers’ ratings of trait EI and TFL correlate significantly to amoderate and strong degree (r = 0.21 to 0.29, p < 0.05; r = 0.31 to 0.63, p < 0.01). Thepattern repeats itself when considering ratings of team members A and B, respectively(r = 0.30, p < 0.05; r = 0.43 to 0.79, p < 0.01 and r = 0.26 to 0.35, p < 0.05; r = 0.33 to0.61, p < 0.01). The large number of negative correlations between the line manager andteam member ratings indicate that they are rather incongruent. In other words, adifferent response tendency manifests itself that distinguishes line manager and teammember ratings.
Inconsistent with Hypothesis 1, correlations between the project managers’ trait EIself-ratings and other TFL ratings do not reach the level of statistical and practicalsignificance typically desired. The few significant correlations are too weak an indication,as at the 95% confidence level, 1 in 20 correlations can reach statistical significance atrandom (Field, 2005). However, correlations are consistent with Hypothesis 2, whichpredicted significant correlations between same-source ratings of trait EI and TFL. It isworth noting that non-same-source correlations often border on a practical significanceof zero, and are randomly positive and negative.
Emotional Intelligence and Transformational Leadership 1327
© 2010 The AuthorsJournal of Management Studies © 2010 Blackwell Publishing Ltd and
Society for the Advancement of Management Studies
Tab
leII
.M
eans
,sta
ndar
dde
viat
ions
,and
corr
elat
ions
amon
gE
Ian
dT
FLra
tings
Mea
nS.D
.1
23
45
67
89
10
11
12
13
14
15
16
17
18
19
20
1.T
MA
Tot
alE
I95
.17
10.8
1–
2.SE
A5.
680.
990
.86**
–
3.O
EA
5.72
0.97
0.8
8**
0.6
5**
–
4.U
OE
6.15
0.75
0.8
0**
0.6
0**
0.6
3**
–5.
RO
E6.
100.
940
.82**
0.5
8**
0.6
3**
0.5
3**
–6.
TM
BT
otal
EI
97.9
68.
690.
210.
24*
0.08
0.17
0.21
–7.
SEA
5.95
0.75
0.15
0.22
0.02
0.14
0.11
0.9
2**
–
8.O
EA
5.88
0.89
0.17
0.15
0.04
0.19
0.22
0.8
6**
0.7
7**
–
9.U
OE
6.33
0.55
0.26
*0.
220.
24*
0.18
0.21
0.7
7**
0.6
4**
0.5
3**
–
10.R
OE
6.13
0.80
0.15
0.21
0.03
0.05
0.19
0.7
8**
0.5
9**
0.4
9**
0.5
2**
–11
.L
MT
otal
EI
94.0
510
.33
0.08
0.07
0.03
0.18
0.01
0.12
0.20
-0.0
50.
180.
10–
12.S
EA
5.73
0.93
-0.0
4-0
.01
-0.0
90.
13-0
.13
0.03
0.15
-0.1
00.
10-0
.03
0.8
8**
–
13.O
EA
5.39
0.87
-0.1
4-0
.10
-0.1
2-0
.06
-0.1
9-0
.02
0.07
-0.1
70.
000.
040
.83**
0.6
4**
–
14.U
OE
6.15
0.75
0.40
**0.
39**
0.30
*0.
39**
0.27
*0.
25*
0.26
*0.
080.
44**
0.11
0.6
1**
0.4
6**
0.3
4**
–
15.R
OE
5.88
1.22
0.12
0.05
0.08
0.18
0.13
0.16
0.20
0.02
0.14
0.18
0.8
9**
0.7
1**
0.6
6**
0.3
7**
–16
.P
MT
otal
EI
99.3
46.
970.
01-0
.06
0.10
10.
04-0
.07
0.10
0.11
0.10
0.03
0.08
-0.0
1-0
.06
0.04
-0.0
90.
05–
17.S
EA
6.16
0.59
-0.0
3-0
.04
0.01
0.07
-0.1
40.
150.
170.
170.
030.
15-0
.06
-0.0
9-0
.02
-0.1
70.
030
.86**
–
18.O
EA
6.00
0.75
0.04
0.00
0.16
-0.0
1-0
.03
-0.0
3-0
.05
0.05
0.01
-0.0
9-0
.22
-0.2
6*-0
.12
-0.1
5-0
.19
0.7
9**
0.6
1**
–
19.U
OE
6.40
0.59
-0.1
5-0
.20
-0.0
20.
00-0
.25*
0.08
0.12
0.14
0.05
-0.0
7-0
.04
0.03
-0.0
2-0
.03
-0.0
90
.75**
0.5
6**
0.4
5**
–
20.R
OE
6.10
0.68
0.12
0.03
0.16
0.06
0.15
0.13
0.13
0.03
0.00
0.26
*0.
30*
0.16
0.28
*0.
070.
39**
0.7
7**
0.5
8**
0.4
1**
0.4
4**
–21
.T
MA
Tot
alT
FL
168.
5413
.71
0.79
**0.
63**
0.77
**0.
63**
0.62
**0.
09-0
.01
0.13
0.26
*-0
.04
0.04
-0.0
0-0
.11
0.28
*0.
03-0
.03
-0.0
90.
03-0
.01
-0.0
322
.SG
C5.
450.
710.
59**
0.43
**0.
71**
0.53
**0.
30*
-0.0
2-0
.11
-0.0
30.
19-0
.06
0.00
-0.0
2-0
.11
0.26
*-0
.05
0.01
-0.0
40.
030.
07-0
.03
23.N
aA5.
150.
580.
73**
0.58
**0.
71**
0.66
**0.
53**
-0.0
7-0
.09
0.01
0.08
-0.2
0-0
.00
-0.0
0-0
.09
0.16
-0.0
3-0
.03
-0.1
20.
020.
03-0
.06
24.E
5.14
0.56
0.62
**0.
52**
0.63
**0.
42**
0.48
**0.
010.
02-0
.06
0.03
0.07
0.04
-0.0
10.
000.
21-0
.00
-0.0
6-0
.13
0.02
-0.0
9-0
.01
25.B
HC
5.28
0.71
0.68
**0.
59**
0.58
**0.
53**
0.58
**0.
28*
0.21
0.31
*0.
30*
0.14
0.09
-0.0
4-0
.03
0.28
*0.
130.
220.
210.
24*
0.01
0.24
*26
.BA
5.37
0.57
0.71
**0.
53**
0.72
**0.
57**
0.55
**0.
01-0
.09
0.06
0.20
-0.0
40.
01-0
.09
-0.0
70.
23*
0.03
0.07
-0.0
30.
20-0
.00
0.04
27.B
D5.
250.
670.
70**
0.53
**0.
65**
0.67
**0.
52**
0.03
-0.0
30.
160.
17-0
.14
-0.0
6-0
.10
-0.2
00.
16-0
.01
0.01
0.01
0.10
0.03
-0.1
028
.T
MB
Tot
alT
FL
169.
2010
.18
0.01
0.03
0.02
0.11
-0.1
10.
50**
0.42
**0.
45**
0.40
**0.
35*
-0.2
8*-0
.19
-0.4
0**
-0.0
1-0
.23
0.16
0.27
*0.
120.
19-0
.01
29.S
GC
4.96
0.64
0.13
0.12
0.03
0.21
0.10
0.61
**0.
52**
0.61
**0.
46**
0.44
**-0
.15
-0.0
7-0
.31*
0.08
-0.1
60.
030.
110.
020.
02-0
.04
30.N
aA5.
130.
540.
180.
210.
130.
200.
040.
33*
0.29
*0.
26*
0.26
*0.
27*
-0.2
7*-0
.19
-0.4
8**
0.03
-0.2
00.
130.
28*
0.01
0.20
-0.0
331
.E5.
210.
50-0
.14
-0.1
0-0
.11
-0.0
5-0
.20
0.52
**0.
49**
0.45
**0.
35**
0.42
**-0
.07
0.03
-0.1
4-0
.06
-0.0
80.
110.
23-0
.03
0.19
-0.0
032
.BH
C5.
270.
68-0
.07
-0.1
0-0
.12
0.13
-0.0
70.
33**
0.29
*0.
29*
0.12
*0.
37**
0.17
0.09
0.16
-0.0
140.
25*
0.13
0.21
0.00
-0.0
20.
25*
33.B
A5.
450.
370.
000.
04-0
.02
0.18
-0.1
60.
60**
0.53
**0.
58**
0.41
**0.
33**
-0.0
9-0
.09
-0.1
5-0
.02
-0.0
50.
30*
0.45
**0.
220.
230.
0934
.BD
5.39
0.37
-0.1
7-0
.16
-0.0
7-0
.13
-0.2
20.
22+
0.17
0.22
0.31
*0.
07-0
.23
-0.0
7-0
.39*
*-0
.01
-0.2
6*0.
180.
230.
25*
0.19
-0.0
735
.L
MT
otal
TF
L16
0.26
14.0
9-0
.00
0.20
-0.1
00.
03-0
.15
-0.0
70.
07-0
.13
-0.0
5-0
.11
0.61
**0.
51**
0.54
**0.
49**
0.46
**-0
.04
-0.0
3-0
.10
-0.0
40.
0636
.SG
C5.
050.
71-0
.13
0.12
-0.2
1-0
.07
-0.3
0*-0
.09
0.08
-0.1
2-0
.16
-0.1
30.
43**
0.34
**0.
48**
0.27
*0.
31**
0.07
0.10
0.02
0.06
0.06
37.N
aA4.
850.
630.
060.
160.
020.
01-0
.01
-0.2
2-0
.11
-0.3
1*-0
.03
-0.2
7*0.
43**
0.40
**0.
36**
0.46
**0.
24*
-0.2
1-0
.28*
-0.2
5*-0
.07
-0.0
938
.E4.
830.
66-0
.03
0.09
-0.1
20.
00-0
.09
-0.0
70.
04-0
.10
-0.1
1-0
.09
0.49
**0.
38**
0.49
**0.
29*
0.40
**0.
030.
020.
04-0
.05
0.08
39.B
HC
5.08
0.67
0.11
0.17
0.07
0.12
0.00
0.01
0.01
-0.0
3-0
.02
-0.0
10.
59**
0.46
**0.
50**
0.21
*0.
63**
-0.0
60.
04-0
.16
-0.1
90.
1140
.BA
5.18
0.53
0.08
0.21
-0.0
70.
15-0
.00
0.08
0.13
0.04
-0.0
00.
060.
58**
0.50
**0.
49**
0.44
**0.
47**
-0.0
3-0
.02
-0.1
4-0
.06
0.12
41.B
D5.
210.
620.
040.
23*
-0.0
60.
01-0
.10
0.16
0.22
0.06
0.19
0.07
0.43
**0.
38**
0.25
*0.
63**
0.26
*0.
080.
080.
000.
080.
09
Not
es:
EI
=em
otio
nal
inte
llige
nce,
TFL
=tr
ansf
orm
atio
nal
lead
ersh
ip,
TM
=te
amm
embe
rs,
LM
=lin
em
anag
er,
PM=
proj
ect
man
ager
,SE
A=
self-
emot
ion
appr
aisa
l,O
EA
=ot
hers
’em
otio
nap
prai
sal,
UO
E=
use
ofem
otio
ns,
RO
E=
regu
latio
nof
emot
ions
,SG
C=
show
ing
genu
ine
conc
ern,
NaA
=ne
twor
kan
dac
hiev
ing,
E=
enab
ling,
BH
C=
bein
gho
nest
and
cons
iste
nt,B
A=
bein
gac
cess
ible
,BD
=be
ing
deci
sive
.B
old
num
bers
=sa
me-
sour
cera
tings
;num
bers
inita
lics
=in
ter-
scal
eco
rrel
atio
ns.
nfo
rsa
me-
sour
cera
tings
atto
tals
cale
:TM
A=
52,T
MB
=45
,LM
=58
,but
neve
r�
42el
sew
here
.+
p<
0.1,
*p
<0.
05,*
*p
<0.
01(o
ne-t
aile
d).
D. Lindebaum and S. Cartwright1328
© 2010 The AuthorsJournal of Management Studies © 2010 Blackwell Publishing Ltd andSociety for the Advancement of Management Studies
Tab
leII
.C
ontin
ued
21
22
23
24
25
26
27
28
29
30
31
32
33
34
35
36
37
38
39
40
1.T
MA
Tot
alE
I2.
SEA
3.O
EA
4.U
OE
5.R
OE
6.T
MB
Tot
alE
I7.
SEA
8.O
EA
9.U
OE
10.R
OE
11.
LM
Tot
alE
I12
.SE
A13
.OE
A14
.UO
E15
.RO
E16
.P
MT
otal
EI
17.S
EA
18.O
EA
19.U
OE
20.R
OE
21.
TM
AT
otal
TF
L–
22.S
GC
0.8
5**
–
23.N
aA0
.84**
0.6
3**
–
24.E
0.7
9**
0.6
9**
0.6
2**
–
25.B
HC
0.7
0**
0.4
3**
0.5
5**
0.4
5**
–
26.B
A0
.90**
0.7
1**
0.7
5**
0.6
7**
0.7
1**
–
27.B
D0
.90**
0.7
5**
0.7
9**
0.5
5**
0.6
1**
0.7
9**
–28
.T
MB
Tot
alT
FL
-0.1
10.
02-0
.06
-0.2
1-0
.05
-0.1
90.
04–
29.S
GC
-0.0
6-0
.06
0.01
-0.1
50.
01-0
.05
0.06
0.8
0**
–
30.N
aA-0
.01
0.10
0.06
-0.1
50.
13-0
.04
0.12
0.8
1**
0.5
2**
–
31.E
-0.1
9-0
.14
-0.1
7-0
.16
-0.1
2-0
.24*
-0.1
00
.80**
0.6
0**
0.5
1**
–
32.B
HC
-0.2
8*-0
.21
-0.2
3-0
.28*
-0.0
1-0
.26*
-0.1
60
.59**
0.3
5**
0.3
5**
0.4
4**
–
33.B
A-0
.05
0.08
-0.0
5-0
.15
0.17
0.00
0.08
0.7
7**
0.5
6**
0.5
9**
0.5
3**
0.6
0**
–
34.B
D-0
.15
-0.0
3-0
.15
-0.1
8-0
.05
-0.1
8-0
.08
0.5
9**
0.3
5**
0.4
1**
0.5
4**
0.1
10
.39**
–35
.L
MT
otal
TF
L-0
.02
0.00
-0.0
30.
060.
01-0
.07
-0.0
4-0
.05
-0.2
8*-0
.10
-0.0
80.
210.
09-0
.18
–36
.SG
C-0
.21
-0.1
4-0
.07
-0.0
2-0
.10
-0.2
0-0
.18
-0.0
8-0
.21
-0.1
2-0
.05
0.08
0.10
-0.1
40
.88**
–
37.N
aA0.
160.
140.
170.
15-0
.01
0.12
0.07
-0.0
8-0
.33*
-0.0
0-0
.19
-0.0
1-0
.10
-0.0
50
.80**
0.5
2**
–
38.E
-0.0
6-0
.01
-0.1
50.
04-0
.04
-0.0
0-0
.04
-0.1
7-0
.30*
-0.2
1-0
.09
0.10
-0.0
0-0
.20
0.8
4**
0.7
5**
0.5
7**
–
39.B
HC
0.12
0.06
0.06
0.10
0.13
0.05
0.06
-0.0
7-0
.19
-0.1
8-0
.05
0.28
*0.
06-0
.21
0.6
8**
0.4
9**
0.3
8**
0.5
2**
–
40.B
A0.
040.
020.
020.
040.
12-0
.02
0.02
0.02
-0.0
9-0
.11
0.00
0.41
**0.
23-0
.08
0.8
5**
0.6
4**
0.5
5**
0.6
3**
0.7
4**
–
41.B
D0.
010.
01-0
.13
-0.0
40.
13-0
.11
-0.0
00.
190.
070.
140.
100.
27*
0.24
0.19
0.7
4**
0.5
2**
0.6
1**
0.4
5**
0.3
5**
0.6
0**
Emotional Intelligence and Transformational Leadership 1329
© 2010 The AuthorsJournal of Management Studies © 2010 Blackwell Publishing Ltd and
Society for the Advancement of Management Studies
The distinctiveness of the same-source response pattern across all ratings raises thequestion whether the ratings are significantly distinct from each other. To put this to thetest, two one-way ANOVAs were conducted. The first aimed to explore the differencebetween all aggregate trait EI scores of this study; that is, the self-reported EI score of theproject manager and the scores of the line managers and both team members relative tothe project manager. There was a statistically significant difference at the p < 0.05 levelbetween the self-reported project manager EI and their line managers’ rating of trait EIrelative to him (F (3, 223) = 3.89, p = 0.01). Effect size was computed using eta squared(0.05), which is small to medium in impact (Cohen, 1988). Post-hoc comparisons drawingon Tukey’s HSD test indicated that the mean score for the project managers(mean = 99.35, SD = 6.97) was significantly different from the ratings of the line man-agers (mean = 94.04, SD = 10.33). With regard to the ratings of team members A(mean = 95.17, SD = 10.81) and team members B (mean = 97.96, SD = 8.69), they werenot significantly different either amongst each other, or in relation to both projectmanager’ and line managers’ rating.
The second one-way ANOVA was conducted to explore the difference betweenTLQ ratings of the line manager and both team members. There was a statisticallysignificant difference amongst the TLQ score of the line managers and both teammembers (F (2, 152) = 8.02, p = 0.00). The effect sizes, calculated using eta squared,was 0.09. As noted by Cohen (1988), this is a medium to large effect. Post-hoc com-parisons using Tukey’s HSD test indicated that the mean score for the line managersratings (mean = 160.26, SD = 14.01) was significantly different from both team memberA (mean = 168.54, SD = 13.71) and team member B (M = 169.20, SD = 10.18) ratings.In turn, there was no significant difference between the TLQ score of team member Aand B.
To test Hypotheses 3 and 4, multiple regression analysis was performed, using theWLEIS subscale scores as predictor and the TLQ total scores as outcome variables. Thedata were systematically analysed by using EI self-ratings of project managers as predic-tors for other TFL ratings (i.e. both team members and line manager) and same-sourceratings (e.g. team member A ratings of trait EI and TFL).
Again, a distinct pattern in relation to same-source ratings is discernable. Findingspresented in Table III are largely inconsistent with Hypothesis 3 and consistent withHypothesis 4, in that predominately only same-source data produced significant F-ratios.Whenever same-source ratings were inserted in the regression analysis, significantF-ratios appeared (F = 21.94, p < 0.001; F = 3.21, p < 0.05; F = 9.35, p < 0.001). Oneexception concerns the team member A ratings on the WLEIS subscales and the linemanager ratings on the TLQ (F = 2.72, p < 0.05). Note, however, that this F-ratio is justreaching statistical significance (p = 0.04), and that this is the only borderline case inTable III. Other F-ratios, such as the team member ratings on the WLEIS and TLQ, aremore remote from the p > 0.05 threshold than the previous case (i.e. p = 0.02). Likewise,the variance explained by the WLEIS subscales in relation to the TLQ is moderate tostrong for same-source ratings. Values for R2 are 0.65, 0.24, and 0.41, respectively,suggesting that a considerable 65 per cent of team member A, 24 per cent of teammember B, and 41 per cent of the line manager TLQ ratings are explained by WLEISsubscale scores.
D. Lindebaum and S. Cartwright1330
© 2010 The AuthorsJournal of Management Studies © 2010 Blackwell Publishing Ltd andSociety for the Advancement of Management Studies
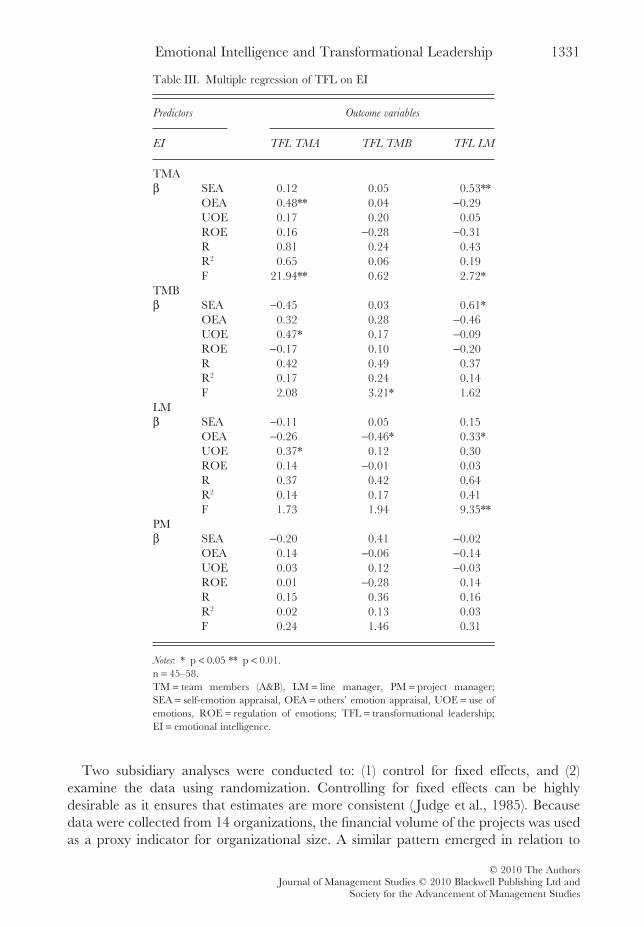
Two subsidiary analyses were conducted to: (1) control for fixed effects, and (2)examine the data using randomization. Controlling for fixed effects can be highlydesirable as it ensures that estimates are more consistent ( Judge et al., 1985). Becausedata were collected from 14 organizations, the financial volume of the projects was usedas a proxy indicator for organizational size. A similar pattern emerged in relation to
Table III. Multiple regression of TFL on EI
Predictors Outcome variables
EI TFL TMA TFL TMB TFL LM
TMAb SEA 0.12 0.05 0.53**
OEA 0.48** 0.04 -0.29UOE 0.17 0.20 0.05ROE 0.16 -0.28 -0.31R 0.81 0.24 0.43R2 0.65 0.06 0.19F 21.94** 0.62 2.72*
TMBb SEA -0.45 0.03 0.61*
OEA 0.32 0.28 -0.46UOE 0.47* 0.17 -0.09ROE -0.17 0.10 -0.20R 0.42 0.49 0.37R2 0.17 0.24 0.14F 2.08 3.21* 1.62
LMb SEA -0.11 0.05 0.15
OEA -0.26 -0.46* 0.33*UOE 0.37* 0.12 0.30ROE 0.14 -0.01 0.03R 0.37 0.42 0.64R2 0.14 0.17 0.41F 1.73 1.94 9.35**
PMb SEA -0.20 0.41 -0.02
OEA 0.14 -0.06 -0.14UOE 0.03 0.12 -0.03ROE 0.01 -0.28 0.14R 0.15 0.36 0.16R2 0.02 0.13 0.03F 0.24 1.46 0.31
Notes: * p < 0.05 ** p < 0.01.n = 45–58.TM = team members (A&B), LM = line manager, PM = project manager;SEA = self-emotion appraisal, OEA = others’ emotion appraisal, UOE = use ofemotions, ROE = regulation of emotions; TFL = transformational leadership;EI = emotional intelligence.
Emotional Intelligence and Transformational Leadership 1331
© 2010 The AuthorsJournal of Management Studies © 2010 Blackwell Publishing Ltd and
Society for the Advancement of Management Studies
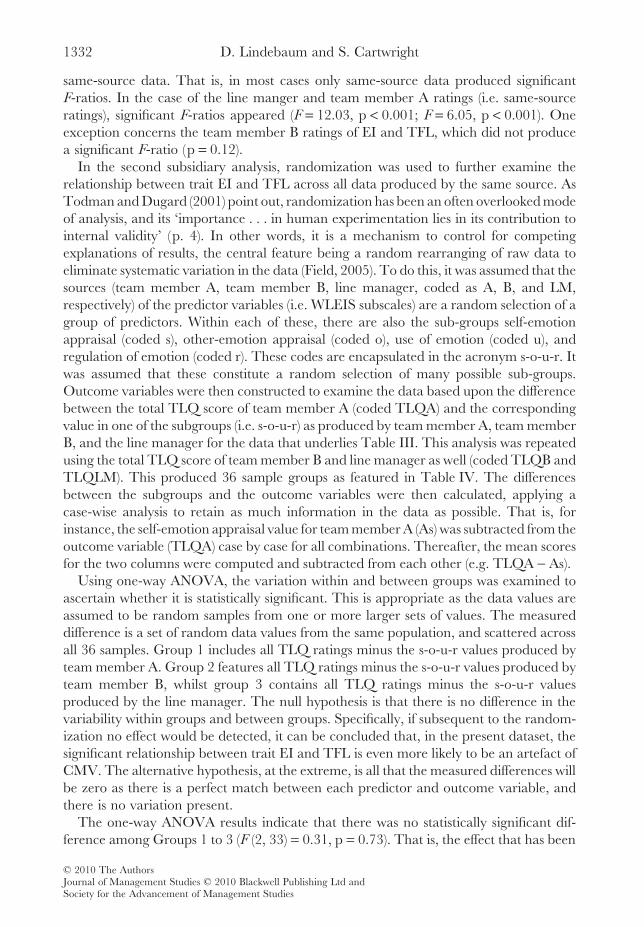
same-source data. That is, in most cases only same-source data produced significantF-ratios. In the case of the line manger and team member A ratings (i.e. same-sourceratings), significant F-ratios appeared (F = 12.03, p < 0.001; F = 6.05, p < 0.001). Oneexception concerns the team member B ratings of EI and TFL, which did not producea significant F-ratio (p = 0.12).
In the second subsidiary analysis, randomization was used to further examine therelationship between trait EI and TFL across all data produced by the same source. AsTodman and Dugard (2001) point out, randomization has been an often overlooked modeof analysis, and its ‘importance . . . in human experimentation lies in its contribution tointernal validity’ (p. 4). In other words, it is a mechanism to control for competingexplanations of results, the central feature being a random rearranging of raw data toeliminate systematic variation in the data (Field, 2005). To do this, it was assumed that thesources (team member A, team member B, line manager, coded as A, B, and LM,respectively) of the predictor variables (i.e. WLEIS subscales) are a random selection of agroup of predictors. Within each of these, there are also the sub-groups self-emotionappraisal (coded s), other-emotion appraisal (coded o), use of emotion (coded u), andregulation of emotion (coded r). These codes are encapsulated in the acronym s-o-u-r. Itwas assumed that these constitute a random selection of many possible sub-groups.Outcome variables were then constructed to examine the data based upon the differencebetween the total TLQ score of team member A (coded TLQA) and the correspondingvalue in one of the subgroups (i.e. s-o-u-r) as produced by team member A, team memberB, and the line manager for the data that underlies Table III. This analysis was repeatedusing the total TLQ score of team member B and line manager as well (coded TLQB andTLQLM). This produced 36 sample groups as featured in Table IV. The differencesbetween the subgroups and the outcome variables were then calculated, applying acase-wise analysis to retain as much information in the data as possible. That is, forinstance, the self-emotion appraisal value for team member A (As) was subtracted from theoutcome variable (TLQA) case by case for all combinations. Thereafter, the mean scoresfor the two columns were computed and subtracted from each other (e.g. TLQA - As).
Using one-way ANOVA, the variation within and between groups was examined toascertain whether it is statistically significant. This is appropriate as the data values areassumed to be random samples from one or more larger sets of values. The measureddifference is a set of random data values from the same population, and scattered acrossall 36 samples. Group 1 includes all TLQ ratings minus the s-o-u-r values produced byteam member A. Group 2 features all TLQ ratings minus the s-o-u-r values produced byteam member B, whilst group 3 contains all TLQ ratings minus the s-o-u-r valuesproduced by the line manager. The null hypothesis is that there is no difference in thevariability within groups and between groups. Specifically, if subsequent to the random-ization no effect would be detected, it can be concluded that, in the present dataset, thesignificant relationship between trait EI and TFL is even more likely to be an artefact ofCMV. The alternative hypothesis, at the extreme, is all that the measured differences willbe zero as there is a perfect match between each predictor and outcome variable, andthere is no variation present.
The one-way ANOVA results indicate that there was no statistically significant dif-ference among Groups 1 to 3 (F (2, 33) = 0.31, p = 0.73). That is, the effect that has been
D. Lindebaum and S. Cartwright1332
© 2010 The AuthorsJournal of Management Studies © 2010 Blackwell Publishing Ltd andSociety for the Advancement of Management Studies
Tab
leIV
.M
ean
diffe
renc
esbe
twee
nto
talT
LQ
scor
esan
dW
LE
ISsu
bsca
les
used
for
rand
omiz
atio
nte
sts
(bas
edon
one-
way
AN
OV
A)
12
34
56
78
91
01
11
2
Gro
up1
TL
QA
-As
TL
QA
-Ao
TL
QA
-Au
TL
QA
-Ar
TL
QB
-As
TL
QB
-Ao
TL
QB
-Au
TL
QB
-Ar
TL
QL
M-A
sT
LQ
LM
-Ao
TL
QL
M-A
uT
LQ
LM
-Ar
Mea
ndi
ffere
nce
145.
3314
5.08
143.
4214
4.15
146.
0214
6.11
144.
0714
4.40
139.
3413
9.29
137.
5313
8.00
Gro
up2
TL
QA
-Bs
TL
QA
-Bo
TL
QA
-Bu
TL
QA
-Br
TL
QB
-Bs
TL
QB
-Bo
TL
QB
-Bu
TL
QB
-Br
TL
QL
M-B
sT
LQ
LM
-Bo
TL
QL
M-B
uT
LQ
LM
-Br
Mea
ndi
ffere
nce
147.
9014
7.96
146.
5214
3.94
145.
0414
4.96
143.
6014
4.09
141.
4014
1.31
140.
1014
0.62
Gro
up3
TL
QA
-LM
sT
LQ
A-L
Mo
TL
QA
-LM
uT
LQ
A-L
Mr
TL
QB
-LM
sT
LQ
B-L
Mo
TL
QB
-LM
uT
LQ
B-L
Mr
TL
QL
M-L
Ms
TL
QL
M-L
Mo
TL
QL
M-L
Mu
TL
QL
M-L
Mr
Mea
ndi
ffere
nce
146.
1914
7.67
144.
5614
5.37
147.
3814
9.00
145.
5614
6.49
136.
8413
8.49
134.
7913
6.22
Not
es:
TL
Q=
Tra
nsfo
rmat
iona
lLea
ders
hip
Que
stio
nnai
re(T
LQ
A,T
LQ
B,T
LQ
LM
stan
dfo
rra
tings
byte
amm
embe
rA
,B,a
ndlin
em
anag
er);
lett
ers
follo
win
gth
ehy
phen
deno
teth
eso
urce
ofth
era
ting
(i.e.
,tea
mm
embe
rA
)and
the
self-
emot
ion
appr
aisa
l,fo
rex
ampl
e(th
eref
ore,
As).
Thu
s,in
the
uppe
rle
ftco
rner
,the
team
mem
ber
Ase
lf-em
otio
nap
prai
salr
atin
gw
assu
btra
cted
from
TL
Qra
ting
ofth
esa
me
rate
r.In
the
low
erle
ftco
rner
,the
line
man
ager
ratin
gof
self-
emot
ion
appr
aisa
l(L
Ms)
was
subt
ract
edfr
omte
amm
embe
rA
’sT
LQ
ratin
g.T
hesa
me
prin
cipl
eap
plie
sto
allo
ther
boxe
sin
Tab
leIV
.
Emotional Intelligence and Transformational Leadership 1333
© 2010 The AuthorsJournal of Management Studies © 2010 Blackwell Publishing Ltd and
Society for the Advancement of Management Studies
detected in the correlational and regression analyses (see Tables II and III) has disap-peared in the randomization process. If a true correlation existed between trait EI andTFL in the present dataset, this effect should shine through in the randomization. As itdoes not, it can be justifiably suggested that CMV largely accounts for the significantrelationships found in Tables II and III.
DISCUSSION
This article has cast a critical eye on the extant management literature that empiricallyinvestigated the relationship between trait EI and TFL. In synthesizing both topicalconcepts, it has detailed their emotion-laden interface which attracted a fair share ofresearch interest. Despite supportive evidence concerning the relationship between traitEI and TFL (e.g. Butler and Chinowsky, 2006; Mandell and Pherwani, 2003; Palmeret al., 2001), Antonakis (2003) expressed concern about the validity of those studies sincethey, inter alia, fail to prevent CMV. This argument has been extended in this study inrelation to TFL as well. We discuss our study in terms its empirical implications,especially with regard to CMV, and its theoretical ramifications.
Empirical Implications
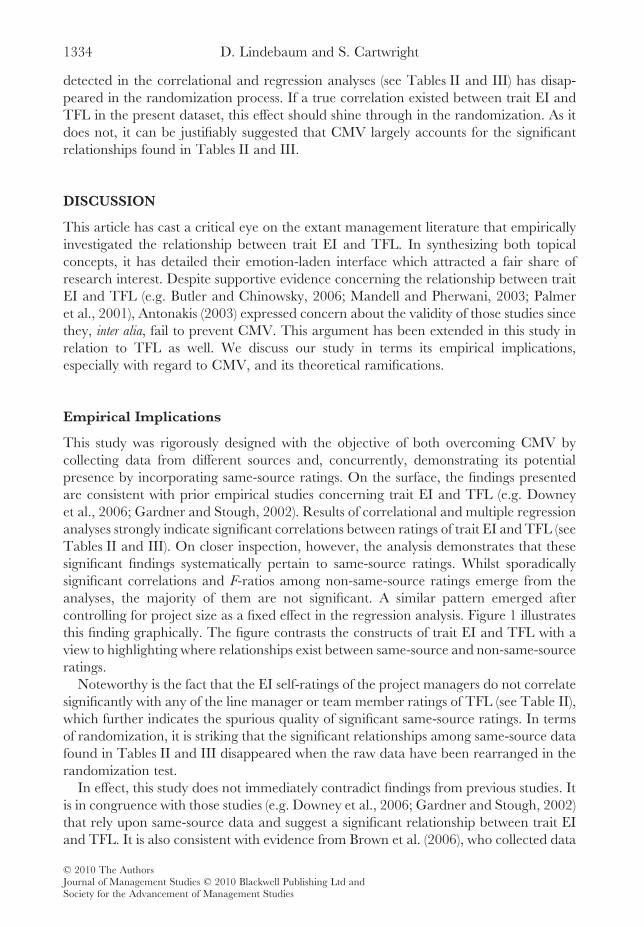
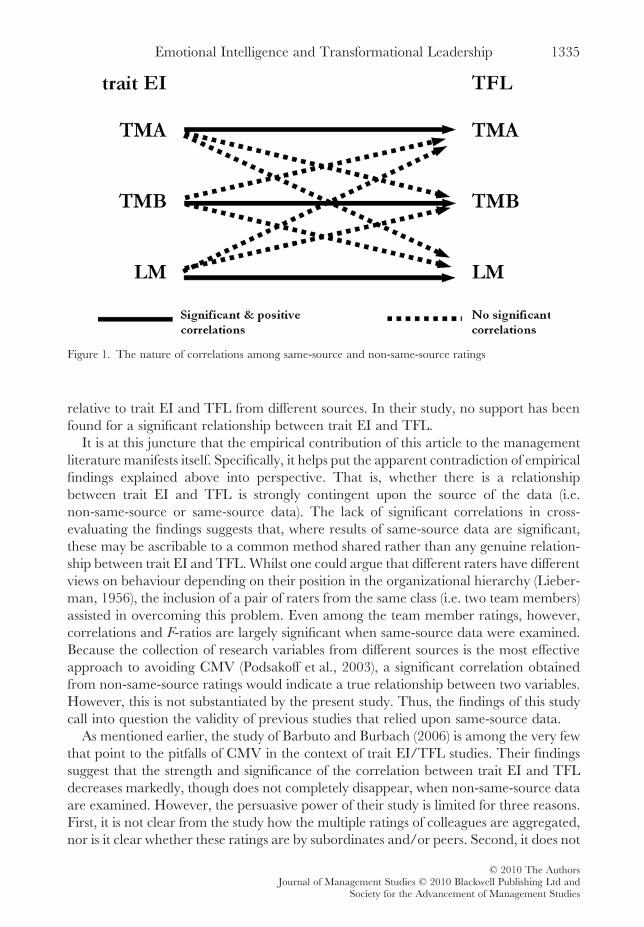
This study was rigorously designed with the objective of both overcoming CMV bycollecting data from different sources and, concurrently, demonstrating its potentialpresence by incorporating same-source ratings. On the surface, the findings presentedare consistent with prior empirical studies concerning trait EI and TFL (e.g. Downeyet al., 2006; Gardner and Stough, 2002). Results of correlational and multiple regressionanalyses strongly indicate significant correlations between ratings of trait EI and TFL (seeTables II and III). On closer inspection, however, the analysis demonstrates that thesesignificant findings systematically pertain to same-source ratings. Whilst sporadicallysignificant correlations and F-ratios among non-same-source ratings emerge from theanalyses, the majority of them are not significant. A similar pattern emerged aftercontrolling for project size as a fixed effect in the regression analysis. Figure 1 illustratesthis finding graphically. The figure contrasts the constructs of trait EI and TFL with aview to highlighting where relationships exist between same-source and non-same-sourceratings.
Noteworthy is the fact that the EI self-ratings of the project managers do not correlatesignificantly with any of the line manager or team member ratings of TFL (see Table II),which further indicates the spurious quality of significant same-source ratings. In termsof randomization, it is striking that the significant relationships among same-source datafound in Tables II and III disappeared when the raw data have been rearranged in therandomization test.
In effect, this study does not immediately contradict findings from previous studies. Itis in congruence with those studies (e.g. Downey et al., 2006; Gardner and Stough, 2002)that rely upon same-source data and suggest a significant relationship between trait EIand TFL. It is also consistent with evidence from Brown et al. (2006), who collected data
D. Lindebaum and S. Cartwright1334
© 2010 The AuthorsJournal of Management Studies © 2010 Blackwell Publishing Ltd andSociety for the Advancement of Management Studies
relative to trait EI and TFL from different sources. In their study, no support has beenfound for a significant relationship between trait EI and TFL.
It is at this juncture that the empirical contribution of this article to the managementliterature manifests itself. Specifically, it helps put the apparent contradiction of empiricalfindings explained above into perspective. That is, whether there is a relationshipbetween trait EI and TFL is strongly contingent upon the source of the data (i.e.non-same-source or same-source data). The lack of significant correlations in cross-evaluating the findings suggests that, where results of same-source data are significant,these may be ascribable to a common method shared rather than any genuine relation-ship between trait EI and TFL. Whilst one could argue that different raters have differentviews on behaviour depending on their position in the organizational hierarchy (Lieber-man, 1956), the inclusion of a pair of raters from the same class (i.e. two team members)assisted in overcoming this problem. Even among the team member ratings, however,correlations and F-ratios are largely significant when same-source data were examined.Because the collection of research variables from different sources is the most effectiveapproach to avoiding CMV (Podsakoff et al., 2003), a significant correlation obtainedfrom non-same-source ratings would indicate a true relationship between two variables.However, this is not substantiated by the present study. Thus, the findings of this studycall into question the validity of previous studies that relied upon same-source data.
As mentioned earlier, the study of Barbuto and Burbach (2006) is among the very fewthat point to the pitfalls of CMV in the context of trait EI/TFL studies. Their findingssuggest that the strength and significance of the correlation between trait EI and TFLdecreases markedly, though does not completely disappear, when non-same-source dataare examined. However, the persuasive power of their study is limited for three reasons.First, it is not clear from the study how the multiple ratings of colleagues are aggregated,nor is it clear whether these ratings are by subordinates and/or peers. Second, it does not
Figure 1. The nature of correlations among same-source and non-same-source ratings
Emotional Intelligence and Transformational Leadership 1335
© 2010 The AuthorsJournal of Management Studies © 2010 Blackwell Publishing Ltd and
Society for the Advancement of Management Studies
use ratings from line managers, peers, and subordinates at the same time, especially froma pair of ratings from the same group (i.e. subordinates), as discussed above. Third, theuse of leadership self-assessment is often criticized due to a lack of objectivity (e.g. Hoganand Hogan, 2001).
One noteworthy issue arises from the study by Leban and Zulauf (2004). As indicatedearlier, 24 project managers completed the MSCEIT, whereas an unspecified number ofsubordinates filled in the MLQ relative to that project manager. Prior studies havedemonstrated that MSCEIT scores were unrelated to self-report measures of EI (Ash-kanasy and Dasborough, 2003). One reason for this could be that, whilst both abilitymeasures and self-report measures may tap into the same sampling domains, theyfundamentally differ in the way they are operationalized (Davey, 2005). Moreover,self-reports of ability and actual ability are only modestly correlated in the domain ofintelligence research (e.g. r = 0.20; Paulhus et al., 1998). Thus, interpretation of thefindings must be undertaken with this important fact in mind.
Theoretical Ramifications
Beyond our empirical contribution, there are at least two wider theoretical ramificationsof our findings. First, careful consideration of the present findings in relation to existingtheoretical and empirical studies points to potent explanation as to why ratings fromdifferent raters do not correlate. Whether construction markedly differs from otherindustries is still a subject of debate (Bresnen and Marshall, 2001). However, what isaccepted is that the construction industry is typically characterized by aggressive/authoritative management styles, adversarial relationships, tight profit margins, fiercecompetition, and the imperative to be able to react to extreme short-term pressures atwork (e.g. Agapiou et al., 1998; Holt et al., 2000; Loosemore et al., 2003). In particular,it is seen to reflect a ‘macho’ culture, which tends to dismiss the practice of many ‘softer’approaches to the management of human resources as expensive luxuries (Dainty et al.,2002). Thus, the context of construction may help explain the absence of significantcorrelations in cross-evaluations of ratings (see Figure 1). It is worth recalling that sig-nificant but small correlations are found in cross-evaluations of ratings in another study(Barbuto and Burbach, 2006), which is embedded in the public sector (i.e. electedofficials). This would, however, attenuate the claim that EI may not be needed forleadership (see Antonakis, 2003; Antonakis et al. 2009). Rather, it would appear thatwhether a significant relationship between EI and TFL exists is strongly dependent uponthe presence of a favourable context.
The work of Hunter et al. (in press) supports the view that context can also provedetrimental to TFL. They maintain that, in organizations conspicuous by intense timepressure, leaders may find it difficult to provide feedback and guidance to followers.Further to this, they observe that, albeit transformational and other similar forms ofleadership may be ideal in some contexts, they are difficult to find in all contexts. Note,however, that meta-analytic studies do not suggest that leadership has differential effectsas a function of business context ( Judge et al., 2002). It is conceivable that the samedesign may yield different findings in another setting.
D. Lindebaum and S. Cartwright1336
© 2010 The AuthorsJournal of Management Studies © 2010 Blackwell Publishing Ltd andSociety for the Advancement of Management Studies
Second, these contextual factors may also illustrate the imperative to re-conceptualizethe outcomes of EI in relation to transformational leadership. There are at least twoplausible scenarios in this respect. On the one hand, high trait EI may entail that one’sself-perceived ability to appraise emotions and situations leads to the recognition thatTFL is inappropriate and less applicable in the context of construction, and that trans-actional leadership, or other context-sensitive forms of leadership, constitute a moreeffective approach to attaining desired results as a project manager. It would be, there-fore, expedient in future to administer TFL and transactional leadership measuressimultaneously across various contexts, so as to draw out in more detail how contextpotentially mediates or moderates the relationship between EI, TFL, and transactionalleadership. Yet, with this argument comes a compelling question through the backdoor;what if the exercise of a more context-sensitive leadership style is incongruent with themanager’s view on how to sustain his or her well-being? Thus, some scholars quitelegitimately ask: ‘Does the individual benefit from high EI or is it the organization?’(Lindebaum, 2009, p. 230). Note that, whilst a recent meta-analysis links trait EI to bettermental health (Schutte et al., 2007), Lindebaum (in press) found that project managersoften feel they must appear stressed and forceful to be seen as productive, anger being afrequent emotional conduit in this respect (see also Shepherd and Cardon, 2009). Thus,even in a knowledge economy, the expectations of role-obligatory behaviours towards anindividual, like those in construction, can exert a powerful influence on behaviour. As thedata analysis suggests, this can occur to the extent that the abilities associated with EI nolonger predict more collaborative and inspiring forms of leadership. Hence, despite theevidence that underpins the utility of EI and TFL in management studies (e.g. Bass,1985; Côté and Miners, 2006), role prescriptions attached to specific occupations or rolesmay render them less influential under these circumstances (see also Vince, 2006; Maitlisand Sonenshein, 2010).
On the other hand, consider a manager who is very demanding and challengingtowards a team member in terms of allocating tasks. An outsider may conclude that themanager lacks the empathy to understand how his or her leadership style negativelyimpacts upon the team member’s health. However, the manager’s demanding leadershipstyle can also emanate from his or her understanding that the team member prefers tooperate inside his/her typical comfort zone – not having realized his/her full potentialyet. Placing ever greater demands upon the team member may be a vehicle to push theboundary and, in so doing, aid the team member in realizing the potential for profes-sional and personal growth. This, in turn, would diminish the theoretical linkagebetween trait EI and TFL discussed at the outset of the paper, for one would not be seen,on the surface, as someone exercising individualized consideration.
Three limitations must be recognized in this study. The first concerns the sample sizeof the study, which is somewhat lower than desirable when the cross-correlations amongthe various raters are considered (e.g. 55 project managers), even though the overallsample size is N = 227. This can raise issues of sample variation and the committing ofa type II error (Huck, 2004); that is, failing to detect an effect in the sample although oneexists. Bear in mind, however, that the sample size must be construed with the cogni-zance that gaining access to construction companies for research purposes is a notori-ously difficult undertaking (Naoum, 1998). Future research would benefit from a larger
Emotional Intelligence and Transformational Leadership 1337
© 2010 The AuthorsJournal of Management Studies © 2010 Blackwell Publishing Ltd and
Society for the Advancement of Management Studies
and more diverse sample. However, in conjunction with the results of the randomizationtest and other empirical studies, the conclusions drawn from this statistical analysisappear justifiable.
The second limitation pertains to the circumstance that this study did not control forpersonality factors concurrently, a demand voiced by several scholars (Antonakis, 2003).This is because personality factors have shown considerable conceptual overlap with traitEI measures in past studies (e.g. O’Connor and Little, 2003). Under this formulation, itwould be desirable to control simultaneously for personality factors, as coefficients mayotherwise be biased or overstated.[2] It is worth noting that once the above stringentcriterion is applied, the extant literature shrinks considerably, suggesting that scholarsoften neglect to adequately test EI (whether as trait or ability), whilst controlling forpersonality and general mental ability.
Third, the WLEIS only assesses four facets of the trait EI sampling domain, which,according to a recent content analysis (Austin et al., 2008, p. 580), comprises up to 15facets. Important domains not included in the WLEIS include, inter alia, adaptability,assertiveness, self-motivation, and trait optimism. As such, certain traits are not capturedby the WLEIS, which implies that it provides only a limited view on an individual’soverall trait EI.
In conclusion, owing to the strong demonstration of CMV in the dataset, theimperative to collect research variables from different sources must be reiterated.Hence, this study helps re-energize the debate regarding scientific rigour in designingresearch projects to ensure that results obtained are valid and credible. By the sametoken, this study highlights the necessity to re-conceptualize how trait EI can impingeupon, and relate to, the various forms of leadership. In other words, it seems toosimplistic to claim that EI may only ‘be an antecedent of transformational leadership’(Brown and Moshavi, 2005, p. 869). Given the considerable interest of managementscholars in the concepts of EI and TFL, these reminders are of critical importance forfuture research.
ACKNOWLEDGMENTS
We are indebted to Keith Julian for his invaluable statistical advice, as well as Effi Raftopoulou for herinsightful comments. Research into this paper has been facilitated by studentships from Manchester BusinessSchool and the Economic Social Research Council (+3), as well as grants from the Statistical Society ofManchester and the Northern Leadership Academy (all UK) to the first author.
NOTES
[1] Out of concern over statistical power, one may argue that the ratings of team member A and B shouldbe collapsed into one variable. However, in this case, such a view is mistaken, as the collapsing of thesevariables would lead to distinctly unequal sub-samples (i.e. 110 team member ratings versus 55 projectmanager ratings, ratio 2 : 1), thus raising concerns that the homogeneity of variance assumption forparametric testing is violated. Both Field (2005) and Pallant (2005) argue that the ratio between thelargest and smallest group should not be larger than 1.5. They also suggest that when sample sizes areunequal, ANOVA (which forms the basis of multiple regression) is not robust to violations of homoge-neity of variance. In fact, preliminary analysis in SPSS confirmed that the assumption is violated if theteam member ratings are collapsed (i.e. Leven statistic, p = 0.005; Welch, p = 0.004; and Brown-Forsythe, p = 0.008).
D. Lindebaum and S. Cartwright1338
© 2010 The AuthorsJournal of Management Studies © 2010 Blackwell Publishing Ltd andSociety for the Advancement of Management Studies
[2] As trait EI is the construct of interest, there is no need to control for general mental ability, as trait EIis located in personality rather cognitive ability theory (see Petrides et al., 2007).
REFERENCES
Agapiou, A., Flanagan, R., Norman, G. and Notman, D. (1998). ‘The changing role of builders merchantsin the construction supply chain’. Construction Management and Economics, 16, 351–61.
Alban-Metcalfe, J. and Alimo-Metcalfe, B. (2007). ‘Development of a private sector version of the (Engaging)Transformational Leadership Questionnaire’. Leadership and Organisation Development Journal, 28, 104–21.
Alimo-Metcalfe, B. and Alban-Metcalfe, J. (2001). ‘The development of a new Transformational LeadershipQuestionnaire’. Journal of Occupational and Organizational Psychology, 74, 1–27.
Alimo-Metcalfe, B. and Alban-Metcalfe, J. (2005). ‘Leadership: time for a new direction?’. Leadership, 1,51–71.
Antonakis, J. (2003). ‘Why “emotional intelligence” does not predict leadership effectiveness: a comment onPrati, Douglas, Ferris, Ammeter and Buckley’. International Journal of Organizational Analysis, 11, 355–61.
Antonakis, J., Schriesheim, C. A., Donovan, J. A., Gopalakrishna-Pillai, K., Pellegrini, E. K. and Rossomme,J. L. (2004). ‘Methods for studying leadership’. In Antonakis, J., Cianciolo, A. T. and Sternberg, R. J.(Eds), The Nature of Leadership. Thousand Oaks, CA: Sage, 48–70.
Antonakis, J., Ashkanasy, N. M. and Dasborough, M. T. (2009). ‘Does leadership need emotional intelli-gence?’. Leadership Quarterly, 20, 247–61.
Ashkanasy, N. M. and Dasborough, M. T. (2003). ‘Emotional awareness and emotional intelligence inleadership teaching’. Journal of Education for Business, 79, 18–22.
Ashkanasy, N. M. and Daus, C. S. (2005). ‘Rumors of the death of emotional intelligence in organizationalbehavior are vastly exaggerated’. Journal of Organizational Behavior, 26, 441–52.
Ashkanasy, N. M., Härtel, C. E. J. and Zerbe, W. J. (2000). ‘Emotions in the workplace: research, theory,and practise’. In Ashkanasy, N. M., Härtel, C. E. J. and Zerbe, W. J. (Eds), Emotions in the Workplace.Westport, CT: Quorum, 3–18.
Atkins, P. W. B. and Wood, R. E. (2002). ‘Self-versus others’ ratings as predictors of assessment centerratings: validation evidence for 360-degree feedback programs’. Personnel Psychology, 55, 871–904.
Atwater, L. E. and Yammarino, F. J. (1992). ‘Does self-other agreement on leadership perceptions moderatethe validity of leadership and performance predictions?’. Personnel Psychology, 45, 141–64.
Austin, E. J., Parker, J. D. A., Petrides, K. V. and Saklofske, D. H. (2008). ‘Emotional intelligence’. In Boyle,G. J., Matthews, G. and Saklofske, D. H. (Eds), The Sage Handbook of Personality Theory and Assessment.London: Sage, 576–96.
Avolio, B. J., Waldman, D. A. and Yammarino, F. J. (1991). ‘Leading in the 1990s: the four I’s oftransformational leadership’. Journal of European Industrial Training, 15, 9–16.
Barbuto, J. J. E. and Burbach, M. E. (2006). ‘The emotional intelligence of transformational leaders: a fieldstudy of elected officials’. Journal of Social Psychology, 146, 51–64.
Barling, J., Slater, F. and Kelloway, E. K. (2000). ‘Transformational leadership and emotional intelligence:an exploratory study’. Leadership and Organisation Development Journal, 21, 157–61.
Bar-On, R. (1997). The Emotional Quotient Inventory (EQ-i): A Test of Emotional Intelligence. Toronto: Multi-HealthSystems.
Bass, B. M. (1985). Leadership and Performance beyond Expectations. New York: Free Press.Bass, B. M. (1990). ‘From transactional to transformational leadership: learning to share the vision’.
Organizational Dynamics, 18, 19–31.Bass, B. M. and Avolio, B. J. (1994). Improving Organizational Effectiveness Through Transformational Leadership.
London: Sage.Bresnen, M. and Marshall, N. (2001). ‘Understanding the diffusion and application of new management
ideas in construction’. Engineering, Construction, and Architectural Management, 8, 335–45.Brody, N. (2004). ‘What cognitive intelligence is and what emotional intelligence is not’. Psychological Inquiry,
15, 234–8.Brown, F. W. and Moshavi, D. (2005). ‘Transformational leadership and emotional intelligence: a potential
pathway for an increased understanding of interpersonal influence’. Journal of Organizational Behavior, 26,867–71.
Brown, F. W. and Reilly, M. D. (2008). ‘Emotional intelligence, transformational leadership and gender:correlation and interaction possibilities’. Journal of International Management Studies, 3, 1–9.
Emotional Intelligence and Transformational Leadership 1339
© 2010 The AuthorsJournal of Management Studies © 2010 Blackwell Publishing Ltd and
Society for the Advancement of Management Studies
Brown, F. W., Bryant, S. E. and Reilly, M. D. (2006). ‘Does emotional intelligence – as measured by the EQI– influence transformational leadership and/or desirable outcomes?’. Leadership and Organisation Devel-opment Journal, 27, 330–51.
Burns, J. M. G. (1978). Leadership. New York: Harper & Row.Butler, C. J. and Chinowsky, P. S. (2006). ‘Emotional intelligence and leadership behavior in construction
executives’. Journal of Management in Engineering, 22, 119–25.Calvert, R. E., Bailey, G. and Coles, D. (1995). Introduction to Building Management. London: Butterworth
Heinemann.Campbell, D. T. and O’Connell, E. J. (1982). ‘Methods as diluting trait relationships rather than adding
irrelevant systematic variance’. In Brinberg, D. and Kidder, L. (Eds), Forms of Validity in Research. SanFrancisco, CA: Jossey-Bass, 93–111.
Cartwright, S. and Pappas, C. (2008). ‘Emotional intelligence, its measurement and implications for theworkplace’. International Journal of Management Reviews, 10, 149–71.
Caruso, D. R. and Salovey, P. (2004). The Emotionally Intelligent Manager: How to Develop and Use the Four KeyEmotional Skills of Leadership. San Francisco, CA: Jossey-Bass.
Cherniss, C. (2000). ‘Social and emotional competence in the workplace’. In Bar-On, R. and Parker, J. D.(Eds), The Handbook of Emotional Intelligence: Theory, Development, Assessment, and Application at Home, School,and in the Workplace. San Francisco, CA: Jossey-Bass, 433–58.
Cohen, J. (1988). Statistical Power Analysis for the Behavioral Sciences. Hillsdale, NJ: Erlbaum.Côté, S. and Miners, C. T. H. (2006). ‘Emotional intelligence, cognitive intelligence, and job performance’.
Administrative Science Quarterly, 51, 1–28.Dainty, A. R. J., Bryman, A. and Price, A. D. F. (2002). ‘Empowerment within the UK construction sector’.
Leadership and Organization Development Journal, 23, 333–42.Dainty, A. R. J., Raiden, A. B. and Neale, R. H. (2004). ‘Psychological contract expectations of construction
project managers’. Engineering, Construction and Architectural Management, 11, 33–44.Davey, G. (2005). Encyclopaedic Dictionary of Psychology. London: Hodder Arnold.Doty, D. H. and Glick, W. H. (1998). ‘Common methods bias: does common methods variance really bias
results?’. Organizational Research Methods, 1, 374–406.Downey, L. A., Papageorgiou, V. and Stough, C. (2006). ‘Examining the relationship between leadership,
emotional intelligence and intuition in senior female managers’. Leadership and Organisation DevelopmentJournal, 27, 250–64.
Drucker, P. F. (1994). ‘The age of social transformation’. Atlantic Monthly, 274, 53–71.Druskat, V. and Druskat, P. (2006). ‘Applying emotional intelligence in project working’. In Pryke, S. and
Smyth, H. (Eds), The Management of Complex Projects: A Relational Approach. Oxford: Blackwell, 78–96.Duckett, H. and Macfarlane, E. (2003). ‘Emotional intelligence and transformational leadership in retailing’.
Leadership and Organization Development Journal, 24, 309–17.Egan, J. (1998). Rethinking Construction. London: HMSO.Field, A. P. (2005). Discovering Statistics Using SPSS. London: Sage.Foster, C. A. and Law, M. R. F. (2006). ‘How many perspectives provide a compass? Differentiating
360-degree and multi-source feedback’. International Journal of Selection and Assessment, 14, 288–91.Freudenthaler, H. H., Neubauer, A. C., Gabler, P., Scherl, W. G. and Rindermann, H. (2008). ‘Testing and
validating the trait emotional intelligence questionnaire (TEIQue) in a German-speaking sample’.Personality and Individual Differences, 45, 673–8.
Gabriel, Y. and Griffiths, D. S. (2002). ‘Emotion, learning and organizing’. The Learning Organization, 9,214–21.
Gardner, L. and Stough, C. (2002). ‘Examining the relationship between leadership and emotional intelli-gence in senior level managers’. Leadership and Organization Development Journal, 23, 68–78.
George, J. M. (2000). ‘Emotions and leadership: the role of emotional intelligence’. Human Relations, 53,1027–55.
Goleman, D. (1995). Emotional Intelligence: Why It Can Matter More Than IQ. New York: Bantam Books.Goleman, D. (1998). Working with Emotional Intelligence. London: Bloomsbury Publishing.Guilford, J. P. (1954). Psychometric Methods. New York: McGraw-Hill.Harris, F. and McCaffer, R. (2001). Modern Construction Management. Oxford: Blackwell Science.Hogan, R. and Hogan, J. (2001). ‘Assessing leadership: a view from the Dark Side’. International Journal of
Selection and Assessment, 9, 40–51.Holt, G. D., Love, P. E. D. and Nesan, L. J. (2000). ‘Employee empowerment in construction: an imple-
mentation model for process improvement’. Team Performance Management, 6, 47–51.Huck, S. W. (2004). Reading Statistics and Research. Boston, MA: Pearson Education.
D. Lindebaum and S. Cartwright1340
© 2010 The AuthorsJournal of Management Studies © 2010 Blackwell Publishing Ltd andSociety for the Advancement of Management Studies
Hunt, J. G. (1991). Leadership: A New Synthesis. Newbury Park, CA: Sage.Hunter, S. T., Tate, B. W., Dzieweczynski, J. L. and Pesin, L. (in press). ‘Understanding the antecedents of
leader errors: a multilevel perspective’. In Hansbrough, T. and Schyns, B. (Eds), When Leadership GoesWrong: Destructive Leadership, Mistakes and Ethical Failures. Charlotte, NC: Information Age Publishing, inpress.
Jansen, J. J. P., George, G., Van den Bosch, F. A. J. and Volberda, H. W. (2008). ‘Senior team attributes andorganizational ambidexterity: the moderating role of transformational leadership’. Journal of ManagementStudies, 45, 982–1007.
Jordan, P. J., Ashkanasy, N. M., Härtel, C. E. J. and Hooper, G. S. (2002). ‘Workgroup emotionalintelligence: scale development and relationship to team process effectiveness and goal focus’. HumanResource Management Review, 12, 195–214.
Judge, G. G., Hill, R. C., Griffiths, W. E. and Lütkepohl, H. (1985). The Theory and Practice of Econometrics. NewYork: Wiley.
Judge, T. A., Bono, J. E., Ilies, R. and Gerhardt, M. W. (2002). ‘Personality and leadership: a qualitative andquantitative review’. Journal of Applied Psychology, 87, 765–80.
Kelan, E. K. (2008). ‘Emotions in a rational profession: the gendering of skills in ICT work’. Gender, Work &Organization, 15, 49–71.
Kline, T. J. B., Sulsky, L. M. and Rever-Moriyama, S. D. (2000). ‘Common method variance and specifi-cation errors: a practical approach to detection’. Journal of Psychology, 134, 401–21.
Kroeck, K. G., Lowe, K. B. and Brown, K. W. (2004). ‘The assessment of leadership’. In Antonakis, J.,Cianciolo, A. T. and Sternberg, R. J. (Eds), The Nature of Leadership. Thousand Oaks, CA: Sage, 71–97.
Kuhnert, K. W. (1994). ‘Transforming leadership: developing people through delegation’. In Bass, B. M.and Avolio, B. J. (Eds), Improving Organizational Effectiveness through Transformational Leadership. ThousandOaks, CA: Sage, 10–25.
Küpers, W. and Weibler, J. (2006). ‘How emotional is transformational leadership really? Some suggestionsfor a necessary extension’. Leadership and Organisation Development Journal, 27, 363–83.
Latham, M. (1994). Constructing the Team. London: HMSO.Law, K. S., Wong, C. and Song, L. J. (2004). ‘The construct and criterion validity of emotional intelligence
and its potential utility for management studies’. Journal of Applied Psychology, 89, 483–96.Lawler, E. (1967). ‘The multitrait-multirater approach to measuring managerial job performance’. Journal of
Applied Psychology, 51, 369–81.Leban, W. and Zulauf, C. (2004). ‘Linking emotional intelligence abilities and transformational leadership
styles’. Leadership and Organization Development Journal, 25, 554–64.Lieberman, S. (1956). ‘The effects of changes in roles on the attitudes of role occupants’. Human Relations, 9,
385–402.Lindebaum, D. (2009). ‘Rhetoric or remedy? A critique on developing emotional intelligence’. Academy of
Management Learning and Education, 8, 225–37.Lindebaum, D. (in press). ‘Negative emotion – positive outcomes: a study of construction project managers’.
In Hansbrough, T. and Schyns, B. (Eds), When Leadership Goes Wrong: Destructive Leadership, Mistakes andEthical Failures. Charlotte, NC: Information Age Publishing, in press.
Lindell, M. K. and Whitney, D. J. (2001). ‘Accounting for common method variance in cross-sectionalresearch designs’. Journal of Applied Psychology, 86, 114–21.
Loosemore, M., Dainty, A. and Lingard, H. (2003). Human Resource Management in Construction Projects: Strategicand Operational Approaches. London: Taylor and Francis.
Maitlis, S. and Sonenshein, S. (2010). ‘Sensemaking in crisis and change: inspiration and insights from Weick(1988)’. Journal of Management Studies, 47, 551–80.
Mandell, B. and Pherwani, S. (2003). ‘Relationship between emotional intelligence and transformationalleadership style: a gender comparison’. Journal of Business and Psychology, 17, 387–404.
Matthews, G., Roberts, R. D. and Zeidner, M. (2004). ‘Seven myths about emotional intelligence’. Psycho-logical Inquiry, 15, 179–96.
Mayer, J. D. and Salovey, P. (1997). ‘What is emotional intelligence?’. In Salovey, P. and Sluyter, D. (Eds),Emotional Development and Emotional Intelligence: Implications for Educators. New York: Basic Books, 3–31.
Mayer, J. D., Salovey, P. and Caruso, D. R. (2002). Mayer-Salovey-Caruso-Emotional Intelligence Test (MSCEIT)Users’ Manual. Toronto: MHS Publishers.
Mayer, J. D., Salovey, P. and Caruso, D. R. (2004). ‘Emotional intelligence: theory, findings, and implica-tions’. Psychological Inquiry, 15, 197–215.
Meindl, J. R. (1995). ‘The romance of leadership as a follower-centric theory – a social constructionistapproach’. Leadership Quarterly, 6, 329–41.
Emotional Intelligence and Transformational Leadership 1341
© 2010 The AuthorsJournal of Management Studies © 2010 Blackwell Publishing Ltd and
Society for the Advancement of Management Studies
Mitchell, T. R. (1985). ‘An evaluation of the validity of correlational research conducted in organizations’.Academy of Management Review, 10, 192–205.
Naoum, S. G. (1998). Dissertation Research and Writing for Construction Students. Boston, MA: Butterworth-Heinemann.
O’Connor, R. M. and Little, I. S. (2003). ‘Revisiting the predictive validity of emotional intelligence:self-report versus ability-based measures’. Personality and Individual Differences, 35, 1893–902.
ODPM (Office of the Deputy Prime Minister) (2004). The Egan Review: Skills for Sustainable Communities.London: ODPM.
Osterman, P., Kochan, T. A., Locke, R. and Piore, M. J. (2001). Working in America: A Blueprint for the New LaborMarket. Cambridge, MA: MIT Press.
Pallant, J. (2005). SPSS Survival Manual: A Step by Step Guide to Data Analysis Using SPSS for Windows. Maiden-head: Open University Press.
Palmer, B., Walls, M., Burgess, Z. and Stough, C. (2001). ‘Emotional intelligence and effective leadership’.Leadership and Organisation Development, 22, 5–10.
Paulhus, D. L., Lysy, D. C. and Yik, M. S. M. (1998). ‘Self-report measures of intelligence: are they usefulas proxy IQ tests?’. Journal of Personality and Social Psychology, 66, 525–54.
Petrides, K. V. and Furnham, A. (2001). ‘Trait emotional intelligence: psychometric investigation withreference to established trait taxonomies’. European Journal of Personality, 15, 425–48.
Petrides, K. V., Pita, R. and Kokkinaki, F. (2007). ‘The location of trait emotional intelligence in personalityfactor space’. British Journal of Psychology, 98, 273–89.
Podsakoff, P. M., MacKenzie, S. B., Lee, J. Y. and Podsakoff, N. P. (2003). ‘Common method biases inbehavioral research: a critical review of the literature and recommended remedies’. Journal of AppliedPsychology, 88, 879–903.
Roberts, R. D., Zeidner, M. and Matthews, G. (2001). ‘Does emotional intelligence meet traditionalstandards for an intelligence? Some new data and conclusions’. Emotion, 1, 196–231.
Rowold, J. and Heinitz, K. (2007). ‘Transformational and charismatic leadership: assessing the convergent,divergent, and criterion validity of the MLQ and CKS’. Leadership Quarterly, 18, 121–33.
Schutte, N. S., Malouff, J. M., Hall, L. E., Haggerty, D. J., Cooper, J. T., Golden, C. J. and Dornheim, L.(1998). ‘Development and validation of a measure of emotional intelligence’. Personality and IndividualDifferences, 25, 167–77.
Schutte, N. S., Malouff, J. M., Thorsteinsson, E. B., Bhullar, N. and Rooke, S. E. (2007). ‘A meta-analyticinvestigation of the relationship between emotional intelligence and health’. Personality and IndividualDifferences, 42, 921–33.
Semmer, N., Zapf, D. and Greif, S. (1996). ‘Shared job strain: a new approach for assessing the validity ofjob stress measurements’. Journal of Occupational and Organizational Psychology, 69, 293–310.
Shepherd, D. A. and Cardon, M. S. (2009). ‘Negative emotional reactions to project failure and theself-compassion to learn from the experience’. Journal of Management Studies, 46, 923–49.
Smith, P. B., Misumi, J., Tayeb, M., Peterson, M. and Bond, M. (1989). ‘On the generality of leadership-stylemeasures across cultures’. Journal of Occupational Psychology, 62, 97–109.
Smithers, G. L. and Walker, D. H. T. (2000). ‘The effect of the workplace on motivation and demotivationof construction professionals’. Construction Management and Economics, 18, 833–41.
Thompson, B. (1995). ‘Stepwise regression and stepwise discriminant analysis need not apply here: aguidelines editorial’. Educational and Psychological Methods, 4, 525–34.
Todman, J. B. and Dugard, P. (2001). Single-Case and Small-n Experimental Designs. Mahwah, NJ: LawrenceErlbaum.
Vince, R. (2006). ‘Being taken over: managers’ emotions and rationalizations during a company takeover’.Journal of Management Studies, 43, 343–65.
Walesh, S. G. (2000). ‘Engineering a new education’. Journal of Management in Engineering, 16, 35–41.Wong, C. S. and Law, K. S. (2002). ‘The effect of leader and follower emotional intelligence on performance
and attitude: an exploratory study’. Leadership Quarterly, 13, 243–74.Yukl, G. A. (2006). Leadership in Organisations. Upper Saddle River, NJ: Prentice-Hall.
D. Lindebaum and S. Cartwright1342
© 2010 The AuthorsJournal of Management Studies © 2010 Blackwell Publishing Ltd andSociety for the Advancement of Management Studies