Embed Size (px)
Citation preview

David Parrish - NOAA ESRL
• Investigate CO/NOx ratios and CO levels in U.S. ambient data
Today:
A Critical Evaluation of U.S. On-road Vehicle Emissions in National and International Inventories
• Suggest needed improvements to U.S. on-road vehicle inventories and compare to international inventories
• Investigate possible application to Beijing
• Investigate VOC speciation through ambient data in U.S. and Beijing

Implicit message:We often hear that U.S. emission inventories are in pretty good
shape; that is not true in all respects (i.e. on-road emissions from MOBILE6).
Do not emulate U.S. techniques without critical evaluation.
A Critical Evaluation of U.S. On-road Vehicle Emissions in National and International Inventories
Proposed Conclusion and Recommendation:It is not possible to accurately estimate emissions without input
from direct measurements (e.g. CEMS on point sources, satellite measurements, top-down tests through ambient measurements, inverse modeling, etc.)
An iterative process is required between inventory developers and measurers to reach accurate inventories.

1200
1000
800
600
400
200
0
CO
(ppb
v)
12:00 AM7/7/99
6:00 PM
150
100
50
0
NO
y (ppbv)
6:00 - 8:30
(5 min averages)
Ambient CO and NOycorrelate well duringmorning rush hour.
Measurementscharacterize CO/NOxemission ratio from on-road vehicles.
CO to NOx ratio in U.S. on-road vehicle emissions: Characterization through ambient measurements
Nashville,Tennessee

CO/NOx emission ratio from on-road vehicles
2500
2000
1500
1000
500
0
CO
(ppb
v)
200150100500NOy (ppbv)
Year Slope r2
1994 10.2 ± 1.5 0.97 1995 8.5 ± 1.3 0.90 1999 6.3 ± 0.9 0.95
6:00 - 8:30Nashville, TN(5 min averages)
• Ratio of CO to NOx from on-road vehicles in U.S. has decreased dramatically
3000
2000
1000
0
CO
(ppb
v)
16012080400NOy (ppbv)
Year Slope r2
1989 18.9 ± 2.7 0.95 1991 15.7 ± 2.3 0.94 1996 12.7 ± 2.0 0.87 1998 8.9 ± 1.3 0.94
6:00 - 10:00Boulder, CO
(5 min averages)

Temporal trends in CO to NOx ratios in U.S. urban areas
Morning rush hour dataUrban sites
7.9 ± 0.1
6.5 ± 0.4
5.7 ± 0.4
9.0 ± 1.2
9.4 ± 0.7
Ratio in 2000
0.97-6.6 ± 0.3AIRS
--------Atlanta
0.96-8.8 ± 1.0Nashville
0.94-6.7 ± 0.5Boulder
0.95-5.5 ± 0.4Los Angeles
r2Trend %/yrLocation
VOC/NOx emission ratiohas decreased similarly
Ratio of CO to NOx from on-road vehicles in U.S. has decreased dramatically

Parrish, “Critical evaluation of US on-road vehicle emission inventories” Atmospheric Environment, 40, 2288-2300, 2006.
Morning rush hour dataUrban sites
MOBILE6 emission ratios have not decreased fast enough, and are too high now.
Temporal trends in CO to NOx ratios in U.S. urban areas
7.9 ± 0.1
6.5 ± 0.4
5.7 ± 0.4
9.0 ± 1.2
9.4 ± 0.7
Ratio in 2000
0.97-6.6 ± 0.3AIRS
--------Atlanta
0.96-8.8 ± 1.0Nashville
0.94-6.7 ± 0.5Boulder
0.95-5.5 ± 0.4Los Angeles
r2Trend %/yrLocation
Ratio of CO to NOx from on-road vehicles in U.S. has decreased dramatically
MOBILE6: Current EPA model

Recent data from Texas
Expanded axes, AIRS data as reference
Morning rush hour dataUrban sites
Ratio of CO to NOx from on-road vehicles in U.S. has decreased dramatically
MOBILE6 emission ratios have not decreased fast enough, and are too high now.

CO
to N
Ox M
olar
Rat
io
2008200420001996
AIRS
El Paso
San Antonio
Dallas
Houston
MoodyTower
NEI1999
8
6
4
10
14
Morning rush hour dataUrban sites
7.9 ± 0.1
7.3 ± 0.6
7.8 ± 0.7
9.1 ± 0.5
12.4 ± 0.7
Ratio in 2000
0.97-6.6 ± 0.3AIRS
0.86-5.8 ± 2.2Dallas
0.76-4.9 ± 2.5Houston
0.94-5.8 ± 1.5San Antonio
0.94-6.9 ± 1.7El Paso
r2Trend %/yrLocation
Decrease continues through the present
Recent data from Texas
Ratio of CO to NOx from on-road vehicles in U.S. has decreased dramatically
MOBILE6 emission ratios have not decreased fast enough, and are too high now.

What drives the CO/NOx decrease?
Ambient urban CO levels have decreased: 4.6%/yr, but less rapidly than CO/NOxemission ratio: 6.6%/yr
NOx emissions must have increased!
Parrish, “Critical evaluation of US on-road vehicle emission inventories” AtmosphericEnvironment, 40, 2288-2300, 2006.

What drives the CO/NOx decrease?
Ambient urban CO levels have decreased: 4.6%/yr, but less rapidly than CO/NOxemission ratio: 6.6%/yr
NOx emissions must have increased! Not captured by MOBILE6
Parrish, “Critical evaluation of US on-road vehicle emission inventories” AtmosphericEnvironment, 40, 2288-2300, 2006.
MOBILE6 CO emissions about factor of 2 high, although rate of decrease well fit.
MOBILE6 VOC emissions have rate of decrease similar to CO, and are much more accurate

10
8
6
4
2
0
NO
x em
issi
ons
MOBILE5 NEI MOBILE6 NEI Inferred Emissions
UNECE/EMEP SNAP UNECE/EMEP NFR02
120
100
80
60
40
20
0
CO
em
issi
ons
200520001995199019851980
(units: Tg/year)
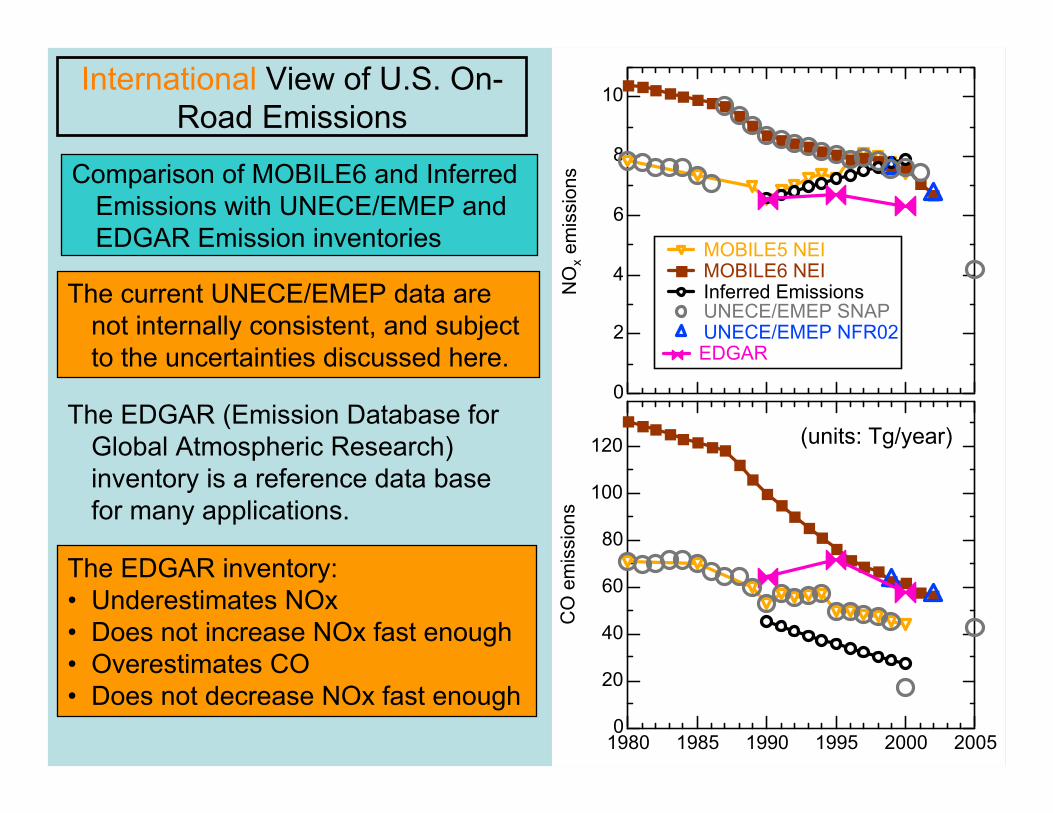
International View of U.S. On-Road Emissions
Comparison of MOBILE6 and Inferred Emissions with UNECE/EMEP and EDGAR Emission inventories
The U.S. officially submits data to the UNECE/EMEP database under the 1979 LRTAP Convention.
The current UNECE/EMEP data are not internally consistent, and subjectto the uncertainties discussed here.
10
8
6
4
2
0
NO
x em
issi
ons
MOBILE5 NEI MOBILE6 NEI Inferred Emissions
UNECE/EMEP SNAPUNECE/EMEP NFR02
EDGAR
120
100
80
60
40
20
0
CO
em
issi
ons
200520001995199019851980
(units: Tg/year)The EDGAR (Emission Database for
Global Atmospheric Research)inventory is a reference data base for many applications.
International View of U.S. On-Road Emissions
Comparison of MOBILE6 and Inferred Emissions with UNECE/EMEP and EDGAR Emission inventories
The current UNECE/EMEP data are not internally consistent, and subjectto the uncertainties discussed here.
The EDGAR inventory:• Underestimates NOx• Does not increase NOx fast enough• Overestimates CO• Does not decrease NOx fast enough

1200
1000
800
600
400
200
0
CO
(ppb
v)
12:00 AM7/7/99
6:00 PM
150
100
50
0N
Oy (ppbv)
6:00 - 8:30
(5 min averages)
Ambient CO and NOy correlate well during morning rush hour.
Can we apply the same technique toBeijing ambient measurements?
Nashville,Tennessee

1200
1000
800
600
400
200
0
CO
(ppb
v)
12:00 AM7/7/99
6:00 PM
150
100
50
0N
Oy (ppbv)
6:00 - 8:30
(5 min averages)
Ambient CO and NOy correlate well during morning rush hour.
Can we apply the same technique toBeijing ambient measurements?
Nashville,Tennessee
4
3
2
1
0
CO
(ppm
v)
00:00 06:00 12:00 18:00 00:00
100
80
60
40
20
0
NO
y (ppbv)
Beijing August 2005Min Shao
Peking University
Compared to U.S. cities: CO and NOy much more variable; regional sources important much less of rush hour peak; higher CO, lower NOy.

2500
2000
1500
1000
500
0
CO
(ppb
v)
200150100500NOy (ppbv)
Year Slope r2
1994 10.2 ± 1.5 0.97 1995 8.5 ± 1.3 0.90 1999 6.3 ± 0.9 0.95
6:00 - 8:30Nashville, TN(5 min averages)
Can we apply the same technique toBeijing ambient measurements?
Ambient CO and NOy correlate well during morning rush hour.

2500
2000
1500
1000
500
0
CO
(ppb
v)
200150100500NOy (ppbv)
Year Slope r2
1994 10.2 ± 1.5 0.97 1995 8.5 ± 1.3 0.90 1999 6.3 ± 0.9 0.95
6:00 - 8:30Nashville, TN(5 min averages)
Can we apply the same technique toBeijing ambient measurements?
Ambient CO and NOy correlate well during morning rush hour.
4
3
2
1
0C
O (p
pmv)
706050403020100 NOy (ppbv)
slopes averages: 14 ± 5; r= 0.75hourly pts: 35 ± 3; r= 0.67
Beijing August 2005Min Shao
Peking University
Compared to U.S. cities: Much poorer correlation; CO (NOx?) dominated by non-road sources; higher slopes.
NotDirectly

0.01
2
4
68
0.1
2
4
68
1
2
4
68
10
Ben
zene
(ppb
v)
4 6 80.1
2 4 6 81
2 4 6 810
2
Acetylene (ppbv)
71 U.S. cities 1984-882002 NE US Coast2004 NE US Coast
• Are from road transport
• Correlate very well in the atmosphere
• Ratio gives emission ratio, whichprovides a test of emissioninventories
Benzene & acetylene:
• React slowly in the atmosphere -ambient benzene to acetylene ratioreflects emission ratio
Assumptions:
Benzene / acetylene: Conclusions:
VOC Speciation in U.S. on-road vehicle emissions: Characterization through ambient measurements

Speciated VOCs are inaccurate byfactors of 3 or more, depending on theconstituents.
(Fortin et al., ES&T, 39, 1403-1408, 2005)
-2.0
-1.5
-1.0
-0.5
0.0
20052000199519901985198019751970
Mea
n M
olar
Rat
io
Ambient Measurements 71 U.S. Cities ROSE SCAB SOS SCAQS NARE ITCT NEAQS
TexAQS
Inventory total
0.2
0.1
0.3
0.4
0.5
0.7
1.0
1.5
Inventory on-road
Accurately captures magnitude andtemporal trend of VOC emissions.
Comparison of inventory emissions with ambient measurements indicatesMOBILE6 model:
Inventories of U.S. emissionsa of two VOC species.
a units: 105 moles hr-1
Species NAPAP 1985
NEI 1996
NEI 1999
Inventory Benzene 10.69 4.08 3.98
Total Acetylene 9.24 4.53 5.38
Ratio 1.16 0.90 0.74
On-Road Benzene ------ 0.94 1.00
Acetylene ------ 1.74 3.15
Ratio ------ 0.54 0.32
Benzene/Acetylene Ratio
VOC Speciation in U.S. on-road vehicle emissions: Characterization through ambient measurements

Figure 4. Emission ratios of various VOCs to CO measured in the Los Angeles Basin by the NOAA WP-3D aircraft in May, 2002 compared to the ratios calculated from SAPRC (Warneke et al., “Determination of Urban VOC Emissions Ratios and Comparison with Inventories”, in review, J. Geophys. Res.,2006)
16
14
12
10
8
6
4
2
086420
SAPRC VOC/CO (pptv/ppbv)
ALKANE1
ETHYLENE
ACETALDEHYDE
ACETONE
METHANOL
ACETYLENE
BUTANES
PENTANES
TOLUENE
PROPANE
BENZENEPROPYLENE
1:1
Comparison of inventory emissions with ambient measurements: Some successes, some problems.
VOC Speciation in U.S. on-road vehicle emissions: Characterization through ambient measurements

0.01
2
4
68
0.1
2
4
68
1
2
4
68
10
Ben
zene
(ppb
v)
4 6 80.1
2 4 6 81
2 4 6 810
2
Acetylene (ppbv)
71 U.S. cities 1984-882002 NE US Coast2004 NE US Coast
• Are from road transport
• Correlate very well in the atmosphere
• Ratio gives emission ratio, whichprovides a test of emissioninventories
Benzene & acetylene:
• React slowly in the atmosphere -ambient benzene to acetylene ratioreflects emission ratio
Assumptions:
Benzene / acetylene: Conclusions:
Can we apply the same technique toBeijing ambient measurements?

0.01
2
4
68
0.1
2
4
68
1
2
4
68
10
Ben
zene
(ppb
v)
4 6 80.1
2 4 6 81
2 4 6 810
2
Acetylene (ppbv)
2005 Beijing71 U.S. cities 1984-882002 NE US Coast2004 NE US Coast
• Are from road transport
• Correlate very well in the atmosphere
• Ratio gives emission ratio, whichprovides a test of emissioninventories
Benzene & acetylene:
• React slowly in the atmosphere -ambient benzene to acetylene ratioreflects emission ratio
Assumptions:
Benzene / acetylene: Conclusions:
Can we apply the same technique toBeijing ambient measurements?
Beijing VOC levels and mixture is very much like U.S. cities in the 1980s
2005 Beijing data from Min Shao, Bill Kuster: Peking University

2
4
6
81
2
4
6
810
2
4
6
Ethy
lene
(ppb
v)
0.12 4 6 8
12 4 6 8
102
Toluene (ppbv)
2005 Beijing71 U.S. cities 1984-882002 NE US Coast2004 NE US Coast
• Correlate very well in the urban atmosphere
• Urban ratio gives emission ratio, which provides a test of emission inventories
• Only Benzene/Acetylene ratio has changed significantly in U.S.
Conclusions:
Can we apply the same technique toBeijing ambient measurements?
Beijing VOC levels and mixture is very much like U.S. cities in the 1980s
2005 Beijing data from Min Shao, Bill Kuster: Peking University

0.001
0.01
0.1
1
10
100
i-But
ane
(ppb
v)
0.001 0.01 0.1 1 10 100n-Butane (ppbv)
2005 Beijing71 U.S. cities 1984-882002 NE US Coast2004 NE US Coast
• Correlate very well in the atmosphere
• Urban ratio gives emission ratio, which provides a test of emission inventories
• Only Benzene/Acetylene ratio has changed significantly in U.S.
Conclusions:
Can we apply the same technique toBeijing ambient measurements?
Beijing VOC levels and mixture is very much like U.S. cities in the 1980s
2005 Beijing data from Min Shao, Bill Kuster: Peking University

MOBILE6 has significant short-comings as well as strengths; for the U.S.:
• 1994 VOC emissions were accurate while CO emissions were overestimated by about a factor of two.
• Temporal trends of CO and VOC emissions are similar and accurate.• NOx emissions increased, not decreased, through the 1990’s. For 2006,
NOx emissions may be significantly underestimated.
A Critical Evaluation of U.S. On-road Vehicle Emissions in National and International Inventories
Ambient measurements provide useful tests of VOC speciation in on-road emissions
Proposed Conclusion and Recommendation:It is not possible to accurately estimate emissions without input
from direct measurements (e.g. CEMS on point sources, satellite measurements, top-down tests through ambient measurements, inverse modeling, etc.)
An iterative process is required between inventory developers and measurers to reach accurate inventories.


What about Texas?
CO/NOx emission ratio inon-road mobile emissionshave decreased dramatically.
7.9 ± 0.1
7.3 ± 0.6
7.8 ± 0.7
9.1 ± 0.5
12.4 ± 0.7
Ratio in 2000
0.97-6.6 ± 0.3AIRS
0.86-5.8 ± 2.2Dallas
0.76-4.9 ± 2.5Houston
0.94-5.8 ± 1.5San Antonio
0.94-6.9 ± 1.7El Paso
r2Trend %/yrLocation
NEI 1999 emission ratios estimates are too high and are worse now than in 2000
Expanded axes, AIRS data as reference
70
60
50
40
30
20
10
0
emis
sion
s (to
ns/d
ay)
DieselGasoline
Fuel-based
EPA Fuel-based
Fuel-based
EPAEPA
CO/10 VOC NOx
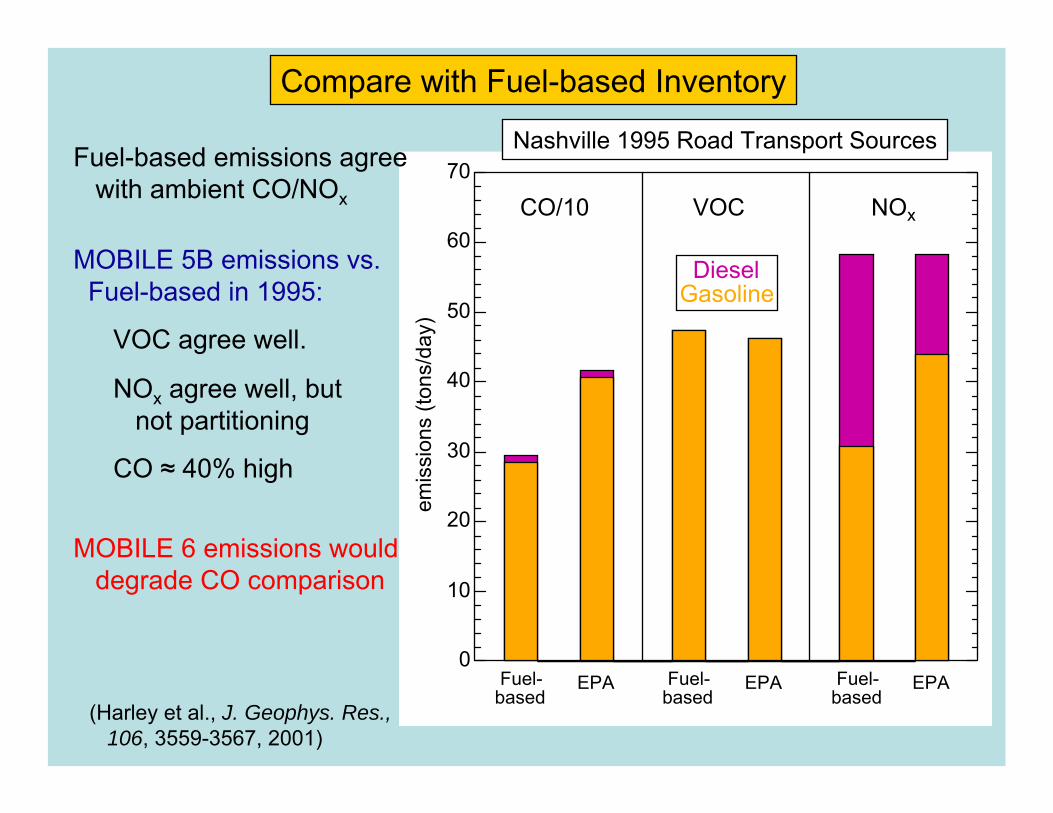
VOC agree well.
CO ≈ 40% high
Compare with Fuel-based Inventory
Nashville 1995 Road Transport Sources
(Harley et al., J. Geophys. Res., 106, 3559-3567, 2001)
Fuel-based emissions agreewith ambient CO/NOx
NOx agree well, butnot partitioning
MOBILE 5B emissions vs.Fuel-based in 1995:
MOBILE 6 emissions would degrade CO comparison