Embed Size (px)
Citation preview

A CRITICAL EVALUATION OF GREEN ROOF SUBSTRATE COMPONENTS
By
Jason Michael Matlock
A THESIS
Submitted to
Michigan State University
in partial fulfillment of the requirements
for the degree of
Horticulture – Master of Science
2015

ABSTRACT
A CRITICAL EVALUATION OF GREEN ROOF SUBSTRATE COMPONENTS
By
Jason Michael Matlock
Extensive green roofs are highly technical growing systems that must overcome
environmental, physical, and biological challenges in order to function properly. Proper
selection of materials for inclusion in the substrate layer is of particular importance.
Compost is often included in green roof substrates to increase fertility and water holding
capacity. However, compost is a highly variable material whose effects on many other
aspects of green roof functionality are poorly understood. A green house experiment was
performed to measure the effect of six different composts on the physical properties of
substrates, the growth and development of plants grown in those substrates, and the water
quality of run off during simulated rain events. Compost selection was found to be an
important factor in all of those categories. Conventional substrate materials also represent
a significant percentage of the total embodied energy and environmental impact of green
roofs. The ecological role and overall sustainability of green roofs would be greatly
improved by finding alternatives to the energy-intensive substrate components. Two
materials from recycled sources, foamed glass and crushed bulk porcelain, were
compared to heat-expanded shale in an outdoor field trial. Total plant coverage in both
materials over a two-year observation period was equivalent to coverage in the
conventional substrate. Foamed glass was half the density of the expanded shale and
porcelain substantially reduced substrate temperature fluctuations.

iii
ACKNOWLEDGEMENTS
The completion of this thesis was only possible because of the support of many
people along the way. I thank my major advisor, Dr. Bradley Rowe, and committee
members, Dr. John Biernbaum and Dr. Kurt Steinke, for having faith in my ability to take
on this challenge. I thank my friends and family for making the extra effort to
accommodate my unpredictable availability and for providing encouragement when it
was needed. I thank Dr.’s Matt Grieshop and Rufus Isaacs for their patience and support
as I completed this thesis. Most of all, I want to acknowledge my friend and partner,
Rachel Rochefort, for the uncountable ways in which she made this degree possible.

iv
TABLE OF CONTENTS
LIST OF TABLES vi
LIST OF FIGURES vii
KEY TO ABBREVIATIONS viii
Chapter 1: Literature Review 1
Introduction 2
Benefits of Extensive Green Roofs 2
Thermal Regulation 2
Stormwater Management 4
Runoff Water Quality 5
Ecosystem Services 6
The Substrate layer 7
General Considerations 7
Organic Matter 8
Compost 11
The Environmental and Economic Impact of Extensive Green Roofs 14
Alternative Materials 17 Current Investigations 17
Recycled Materials Meriting Investigation 19
LITERATURE CITED 21
Chapter 2: Does Compost Selection Impact Green Roof Substrate Performance:
Measuring Physical Properties, Plant Development, and Runoff Water
Quality 28
Abstract 29
Introduction 30
Materials and Methods 33
Composts 33
Physical and Chemical Analysis of Substrates 33
Plant Growth and Development 35
Runoff Water Quality 36
Statistical Analysis 37
Results 38
Physical and Chemical Analysis of Substrates 38
Plant Growth and Development 39
Runoff Water Quality - Nitrate 40
Runoff Water Quality - Phosphorus 41
Discussion 42
Physical Analysis of Substrates 42
Plant Growth and Development 43
Runoff Water Quality 44

v
Compost Production 47
Food Waste Composts 48
Transplant Composts 50
Conclusions 50
APPENDIX 52
LITERATURE CITED 65
Chapter 3: The Suitability of Crushed Porcelain and Foamed Glass as
Alternatives to Expanded Aggregates in Green Roof Substrates in terms of
Plant Growth and Thermal Regulation 70
Abstract 71
Introduction 72
Materials and Methods 75
Experimental Setup 75
Data Collection 77
Statistical Analysis 78
Results 78
Substrate Physical Properties 78
Plant Coverage 79
Allium cernuum 79
Allium senescens 80
Sedum 80
Trandescantia ohiensis 80
Coreopsis lanceolata 80
Koelaria macrantha 80
Monarda punctatum 81
Volumetric Moisture Content 81
Substrate Temperature 82
Discussion 83
Substrate Physical Properties 83
Plant Coverage 85
Substrate Temperature 86
Embodied Energy and Sustainability 87
Related Research 88
Conclusions 89
APPENDIX 91
LITERATURE CITED 106

vi
LIST OF TABLES
Table 2.1. Description of Composts 53
Table 2.2. Physical Properties of Green Roof Substrates Prepared with Different
Composts 54
Table 2.3. Soluble Nutrient Analysis of Composts 55
Table 2.4. Total Nutrient Analysis of Composts 56
Table 2.5. Effect of Compost Selection on Plant Biomass 57
Table 2.6. Effect of Compost Selection on Plant Growth Rates 58
Table 2.7. Relevant Water Quality Standards For Interpreting Runoff Water
Quality 59
Table 3.1. Description of Substrates 92
Table 3.2. Substrate Physical and Chemical Properties at the Start of the Study 93
Table 3.3. Differences in Weekly Means for Volumetric Moisture Content
Over the 2014 Growing Season 94
Table 3.4. Differences in Weekly means for Day-Time Temperature over the 2014
Growing Season 95
Table 3.5. Differences in Weekly Means for Night-Time Temperature Over the 2014
Growing Season 96
vii
LIST OF FIGURES
Figure 2.1. Experimental Setup for Determination of Saturated Flow 60
Figure 2.2. Interaction of Plant and Compost Types with regard to Shoot Biomass
and Plant Growth rate 61
Figure 2.3. Influence of Plant Type on Runoff Water Quality 62
Figure 2.4. Change in Runoff Water Quality over Time 63
Figure 2.5. Nutrient Concentrations in Runoff water From Green Roof Substrates
Prepared with Different Composts 64
Figure 3.1. Particle Size Distribution at the Start of the Study 97
Figure 3.2. Absolute Plant Coverage 98
Figure 3.3. Differences in Volumetric Moisture Content over the 2014
Growing Season 100
Figure 3.4. Mean Volumetric Moisture Content over the 2014 Growing Season 101
Figure 3.5. Mean Substrate Temperature Over the 2014 Growing Season 102
Figure 3.6. Differences in Day Time Substrate Temperatures Over the 2014
Growing Season 103
Figure 3.7. Differences in Night Time Substrate Temperatures Over the 2014
Growing Season 104
Figure 3.8. Daily Variations in Substrate Temperatures Over the 2013 Growing
Season 105
viii
KEY TO ABBREVIATIONS
CEC
Cation Exchange Capacity
FLL
Forschungsgesellschaft Landschaftsentwicklung Landschaftsbau
(Society of Landscape Development and Landscape Design)
FWH
Food Waste Hot-Compost
FWW
Food Waste Worm-compost
LCA
Life Cycle Analysis
SHC
Saturated Hydraulic Conductivity
WHC
Water Holding Capacity

1
Chapter 1:
Literature Review

2
Introduction
Cities represent large expanses of impervious surfaces with little to no vegetation.
The displacement of natural green space has measureable consequences for both wildlife
and human beings. More than half of the human population now resides in urban areas
(Marshall 2007) and the size of that population continues to rise. The continued
disruption of natural space and the consequent loss of the biological services they provide
is an inherently unsustainable practice. It is absolutely necessary for human kind to adopt
new technologies that preserve the ecological functionality of the spaces we occupy. One
such technology is the green roof.
The term “green roof” encompasses a wide range of roofing systems that support
the growth of vegetation. Across the world, green roofs differ greatly in terms of their
construction, appearance, vegetation, functionality, and cost. A specific type of green
roof is the single course extensive system. These roofing systems are relatively shallow,
with typical depths ranging from 5 to 20 centimeters. The substrate layers are of uniform
composition. Access to this style of roof is often limited and minimal maintenance is
anticipated. The vegetation layer is often composed of drought resistant, persistent
species such as sedums, grasses, and sedges. Single course extensive green roofs are
usually installed more for their economic benefits than for other reasons.
Benefits of Extensive Green Roofs
Thermal Regulation: The roof a building is exposed to solar radiation for most
of the day and can become quite hot. A large temperature differential between the top
floor and roof of a building drives the ingress of heat into the building. Green roofs help
to reduce that temperature differential by mitigating heat accumulation on the rooftop.

3
Liu and Baskaran (2003) took thermal measurements at the Field Roofing Facility in
Ottawa, Canada for two years. Surface temperatures on the conventional portion of the
roof exceeded 70°C and had a median daily fluctuation of 45°C. The green roof portion
never exceeded 40°C and had a median fluctuation of 6°C, which reduced heat flow
through the roof into the building by 75%. Saiz et al. (2006) had similar results in Madrid
with conventional roof temperatures reaching 65°C compared to 32°C on the green roof.
The cooling effect of green roofs is a combination of multiple factors. The
substrate layer provides additional insulation between the roof surface and the building
interior. The contribution of the substrate layer is fairly minor, however. Carter and
Keeler (2008) determined that a 7.62 cm deep substrate layer composed of expanded slate
had an insulation value of R-2.8, which is roughly equivalent to 2.5 cm of the closed cell
foam used in home construction. For perspective, Michigan’s Uniform Energy Codes
require insulation values between R-24 and R-49 for ceilings and attics (MDELEG
2011). The vegetation layer is the major source of cooling on a green roof. Plant leaves
selectively absorb visible light with pigments while reflecting away the near infrared
radiation that causes surface heating. Thick leaves with large intercellular air spaces and
waxy cuticles, characteristic of many of the crussulacean species used in extensive green
roofs, are particularly effective at reflecting near infrared radiation (Slaton et al. 2001;
Woolley 1971). Heat is also actively removed from the roof by plants through
evapotranspiration (Omnura et al. 2001). The amount of heat removed by plant
transpiration and evaporation from the soil and leaf surfaces is highly influenced by leaf
area (Takakura et al. 2000). Thus effective cooling by a green roof is largely dependent
on the activity and coverage of the plant layer.
4
The mitigation of heat and modulation of roof top temperatures reduces the
cooling costs of a building and increases the service life of the waterproof membrane.
The lifespan of extensive green roofs is frequently estimated to be between 40 and 50
years, though exact figures are difficult to obtain. In comparison, most conventional roofs
are replaced every 15 to 25 years.
Stormwater Management: Urbanization has created large expanses of
impermeable surfaces. In the short term, precipitation that falls onto these surfaces has
four paths that it can follow: it can evaporate, it can be diverted to a water treatment
facility, it can be stored in a retention pond, or it can flow into a natural watershed. Water
treatment facilities and storage reservoirs have limited capacities and the cost of their
construction/maintenance is proportional to their size. Exceeding the capacity of a
treatment facility can result in overflows of untreated water into populated and natural
environments. Impervious surfaces have been directly linked to decreases in aquatic
species richness and water quality in nearby streams as a result of eutrophication,
sediment loading, and the dissolution of soluble chemicals (Brabec et al. 2002).
Green roofs control stormwater with the substrate layer. Precipitation has to move
through the pore network of the substrate before draining. Substrates are able to hold a
certain amount of water, referred to as field capacity or water holding capacity, before
running off. With small rain events, water is absorbed into the substrate and never enters
the drainage system. The water is removed from the substrate by direct evaporation or by
transpiration of the vegetation layer, replenishing its water holding capacity. With larger
precipitation volumes, drainage of the water landing on the roof is delayed by its passage
through the substrate layer. The timing of this delay is determined by the rate at which

5
water is able to move through the substrate, which is referred to as hydraulic
conductivity. Water will travel at different rates depending on whether the substrate is in
a saturated or unsaturated state. The net effect is a reduction and delay of stormwater
leaving a roof.
Bliss et al. (2009) observed an overall reduction of stormwater from a green roof
compared to a flat roof from the end of August 2006 to the middle of January 2007 in
Pittsburgh, PA. The total runoff volume of each storm was reduced between 5 and 69%,
with larger reductions realized during smaller rain events. Runoff flow rates were
similarly reduced. VanWoert et al. (2005) conducted a similar study in Holt, MI that
compared gravel, bare green roof media, and green roof media with a vegetation layer
over a 14-month period. The gravel consistently retained less water than the other
treatments, with an overall difference of 23.2% between the gravel and bare media. The
difference was most pronounced during moderate and heavy rain events. The presence of
a vegetated layer increased overall retention by 10.2%. These two studies show that green
roofs measurably reduce stormwater runoff; that the composition of a green roof substrate
has a significant effect on the quantity of water that can be retained; and that the presence
of a vegetated layer enhances the retention ability of the substrate layer. These results are
consistent with a much larger body of literature documenting this subject matter.
Runoff Water Quality: As water passes through the substrate layer, there is the
potential for an exchange of soluble ions. There is concern that the soluble nutrient pool
of the substrate layer will be carried away from the green roof during precipitation
events. The leaching potential of plant nutrients, in particular nitrogen and phosphorus,
and the impact of increased nutrient loads in runoff water on natural and man-made

6
watersheds have been heavily investigated (Hart et al. 2004; Beman et al. 2005). Given
the clearly detrimental effect of even small quantities of these nutrients leaching into
watersheds, it is important to understand how green roofs behave in regards to this issue.
There have been several investigations conducted into the quality of water from green
roofs, but the results of these studies have not produced a general consensus. Several
studies have determined that green roofs do contribute to the mass loading of plant
nutrients in stormwater. The degree of mass loading reported in these studies varies
greatly. Vijayaraghavan et al. (2012) reported nitrate and phosphate concentrations of 25
and 20 ppm, respectively. However, Toland et al. (2012) reported nitrate and phosphate
concentrations as low as 0.17 and 1.57 ppm, respectively. Berndtsson et al. (2009) found
that the green roof in their study actually decreased nitrogen concentrations in rainwater,
though they still reported elevated levels of phosphorus (0.27 ppm) in the runoff.
There is still a need to identify factors in green roof design and operation that
explain and predict their impact on runoff water quality. One such factor that has been
implicated in the literature is the organic matter included in green roof substrates.
Agricultural studies investigating the effects of field-applied organic matter have found
that such applications can degrade water quality, but the results of these studies are
variable and differ among specific organic matter types (Eghball and Gilley 1999;
Faucette et al. 2004; Spargo et al. 2006). There has been little to no research that
specifically addresses how different organic matter sources included in green roof
substrates affect the quality of runoff water from green roofs.
Ecosystem Services: There are additional benefits offered by green roofs that go
beyond the scope of an individual building. Graham and Kim (2003) conducted a

7
modeling study that implied that the retrofitting of all rooftops capable of supporting a
green roof in Vancouver, British Columbia, Canada would restore the local watershed to
its natural state within 50 years. According to Yang et al. (2003), retrofitting green roofs
has a similar effect on air quality as planting urban forests. Modeling the adoption of
greens roofs in Chicago, IL, Smith and Roebber (2011) demonstrated that ambient air
temperature, relative humidity, and lake-breeze circulation would be affected. These
studies, while clearly speculative, show that the nearly intangible impacts of a single
green roof would become quite perceivable in aggregate. The economic return of
ecosystem services to the owner of an individual green roof is difficult to calculate and
therefore may not be viewed by building owners as incentives for selecting a green roof
installation. However, these benefits are critical to understanding the potential ecological
functions of green roofs.
The Substrate Layer
General Considerations: Supporting plant growth on a rooftop is a challenge. A
substrate must provide a suitable environment for plant growth while also meeting the
technical requirements of the building on top of which it is being placed (FLL, 2008).
Unless supporting a vegetative layer was part of the initial building plan, flat rooftops are
rarely designed for loads beyond those experienced with a shallow gravel ballast layer
and some equipment. This means that weight is a limiting factor in selecting materials for
substrates. In discussing weight, one must also consider that substrates will be exposed to
rain. In heavy or prolonged precipitation events, the mass of water falling onto a roof can
become substantial. Therefore, the density of a material when wet and its ability to drain
are key factors to consider.

8
Extensive green roof substrates must also be physically rigid to avoid changes in
the substrate profile due to compaction. Compaction has several negative consequences.
Pore network continuity is compromised when soil particles are forced into greater
proximity of each other. This disrupts the flow of water through the substrate, reducing
the ability of the roof to drain. It also creates physical barriers to root growth and restricts
the diffusion of air throughout the substrate (Matthews et al. 2010; Nadian et al. 1997).
The inclusion of small particle sizes, like those of fine silts, can also cause similar
problems. These particles could become mobile under saturated flow conditions created
by heavy rain events and migrate until they occlude micropores in the substrate, clog the
drainage fabrics, or wash out of the green roof all together (Gee and Or 2002; Xu 2003).
Commonly selected inorganic materials for green roof substrates come from both
natural (volcanic rock, gravel, sand) and manufactured (heat-expanded shale, clay, and
slate) origins. Commercial green roof substrates tend to be blends of these materials,
which helps to balance the benefits and drawbacks of each. However, blends of these
materials are still prone to having low water and nutrient holding capacity / content, and
little to no biological activity. Organic matter is often added in small quantities, less than
20% by volume, to green roof substrates to overcome the shortcomings of the inorganic
fractions (FLL), 2008). Ampim et al. (2010) provides a thorough overview of green roof
substrates.
Organic Matter: The role of organic matter in soils and substrates has been a
subject of intense review for many years. There is a general consensus that total water
holding capacity increases with organic matter content. However, there are mixed
opinions regarding the change in available water holding capacity with respect to organic
9
matter (Loveland and Webb 2003). Some feel that organic matter simultaneously
increases both the field capacity and the wilting point and thus does little to make water
more available to plants (Bauer and Black 1992; Haynes and Naidu 1998). However,
Hudson (1994) performed a critical and detailed review of the literature to show that
when individual studies on this subject are reviewed together, strong evidence exists in
favor of available water holding capacity increasing with respect to organic matter
content. There has been no investigation regarding the relationship between organic
matter content and available water capacity in green roof substrates.
Organic matter is also associated with improved soil fertility, largely due to its
high cation exchange capacity (CEC). Organic matter has been cited as having CECs
between 40 and 200 cmol·kg-1
(Harada and Inoko 1980; Helling et al. 1964). To put this
into context, pumice was tested at 2.0 cmol·kg-1
(Fassman 2010) and expanded shale at
2.8 cmol·kg-1
(Sloan et al. 2010). The CEC of a sandy soil ranges between 3-5 cmol·kg-1
,
a light loam from 10-20 cmol·kg-1
, and dark loam from 15 to 25 cmol·kg-1
(Mengel
1993). A small percentage of organic matter can result in a large increase in the CEC of a
green roof substrate composed of these inorganic materials. High cation exchange values
help a substrate retain a pool of available nutrients, hold water, and buffer the pH of a
substrate.
It is important to recognize that organic matter is a heterogeneous mixture of
molecules that vary in size, chemical functionality, age, and non-carbon content. Organic
matter can refer to discernable materials like sphagnum moss and coco coir; to fresh plant
residues; to materials that are further decomposed such as peat and compost, or to
exceptionally recalcitrant molecules composed predominately of carbon. The organic

10
matter of a mature system is often composed of members from the entire spectrum. The
formation of organic matter is a multi-stage process that is highly dependent upon time,
environment, and the microbial community.
The activity of microbes is highly correlated with the decomposition of organic
matter and thus factors that affect their activity also influence the rate at which organic
matter is decomposed. The initial breakdown of fresh residues is largely dependent on the
relative abundance of soluble nutrients required for microbial cellular metabolism,
particularly nitrogen, phosphorus, and sulfur. The pool of readily accessible carbon, i.e.
sugars, starches, and celluloses, is quickly depleted. This process occurs over the range of
a few years in a temperate forest (Jenkinson and Ladd 1981). The more complex forms of
carbon remaining from the organic residues take much longer to decompose, on the order
of a decade. There are several factors that contribute to the slowing of decomposition
over time. First, the remaining forms of carbon such as lignins, tannins, and chitins, are
more resistant to enzymatic degradation and oxidation (Derenne and Largeau 2001).
Kalbitz et al. (2003) showed that the chemical structure and complexity of dissolved
organic matter extracted from various organic residues was strongly related to their half-
lives in the presence of soil microbes. Secondly, as the initially homogenous pool of
resources is depleted, access to additional nutrients and degradable forms of carbon is
reduced. Microbes can become isolated from carbon sources through changes in pore
networks, soil aggregation, and the complexation of carbon molecules with other
substances (Lutzow et al. 2006; Van Veen and Kuikman 1990).
Nagase and Dunnett (2011) compared the dry shoot mass of plants grown in a
green roof substrate with varying organic matter percentages under both drought and

11
irrigated conditions. Total water holding capacity of the substrate increased with organic
matter content. Under drought conditions there was greater shoot mass in treatments with
organic matter than without, but no statistical difference was observed in shoot mass after
organic matter content exceeded 10% by volume. However, shoot mass increased in
proportion to organic matter content up to 50% of the substrate volume when the plots
were irrigated.
Compost: Composting is a process designed to accelerate the decomposition of
organic matter by optimizing conditions for microbial activity. The generalized method
of modern composting begins by combining organic materials to ensure an adequate and
balanced supply of nutrients, particularly reducible carbon and nitrogen. The materials
included in compost are referred to as “feedstocks.” There is an exceptionally wide range
of feedstocks used in composting. Examples include manures, crop residues, yard wastes,
sewage sludge, straw, hay, and food scraps. Temperature, moisture, and dissolved oxygen
are managed through techniques as simple as physically mixing or through more
complicated methods involving forced air and buried tubing. Encouraging microbial
activity and allowing the heat generated by microbial metabolism to raise the temperature
of a pile allows the compost to enter a thermophilic phase. Temperatures in compost piles
can exceed 60°C (MacGregor et al. 1981). Many organisms cannot survive at these
temperatures, particularly human and plant pathogens (Watanabe et al. 1997). The
thermophilic phase is proceeded by the maturation phase, in which compost is allowed to
stabilize and mature over time. An excellent definition of stability and maturity is
provided in Pullicino et al. (2007):

12
“…it has been generally accepted that compost stability refers to the rate
or degree of organic matter decomposition expressed as a function of
microbial activity and evaluated by means of respirometric measurements
…or by studying the transformations in the chemical characteristics of
compost organic matter…On the other hand, maturity generally refers to
the degree of decomposition of phytotoxic organic substances produced
during the active composting stage and has been generally evaluated
through plant or seed bioassays…”
Though the process of aerobic composting can be generalized, there are many
points at which specific differences can exist. The decisions made by a particular
compost producer change the properties of the compost being made. The nutrient
concentration, pH, CEC, and pathogen load of finished compost can be influenced by
feedstock selection (Bernai et al. 1998, Dimambro et al. 2007), environmental conditions
(Tiquia et al. 2000), and even the frequency at which a pile is mixed (Ogundwande et al.
2008). These factors also affect the population dynamics of microbial communities
(Liang et al. 2003) and consequently, the time needed to achieve stability and maturity
(Huang et al. 2004, Zhu 2007, Eiland et al. 2001).
Given the many ways in which compost can differ, it is not surprising that
compost selection has been demonstrated to affect the performance of plant substrates.
Atiyeh et al. (2000) made potting mixtures blended with any of two types of
vermicompost and five types of compost at concentrations of 10 and 20% by volume.
The composts differed in terms of pH and macronutrient content. The dry shoot masses
of multiple plant species grown in the potting mixtures were significantly different and

13
microbial activity was greater in the vermicomposts than in the other types of compost.
Hashemimajad et al. (2004) made potting mixes ranging from 0 to 45% by volume of
composts made from dairy manure, tobacco residue, yard leaf, or sewage sludge. All
potting mixes that contained compost resulted in tomato plants having greater dry shoot
mass than those that did not. There were significant differences between compost types.
There were also significant differences in the measured physical properties: bulk density,
particle density, total porosity, and water holding capacity; as well as in the nutrient and
organic carbon concentrations, of the potting mixes. Klock-Moore (2000) found that
including compost made from feedstocks blending biosolid wastes and yard trimmings
into potting mixes resulted in greater shoot mass and number of flower spikes in salvia
plants than including compost made from feedstocks blending seaweed and yard
trimmings.
Research on the subject of compost for use in green roof substrates has paid little
attention to the diversity of these materials and the potential impact of their selection. The
green roof community recognizes that composts differ from other forms of organic matter
(Ampim et al. 2010) and has gone so far as to acknowledge that some composts may
differ in terms of soluble salts (Friedrich 2005). However, the majority of research on
organic matter and compost in green roofs has involved how the amount of material
included in a substrate affects plant growth (Nagase and Dunnett 2011; Olszewski et al.
2010) and runoff water quality (Hathaway et al. 2008; Moran 2004). The conclusions of
these studies made no mention of the possibility that different composts could have
produced results other than those obtained. Given the clear impact of compost selection

14
observed in the research of potting mixes, it is obvious that the role of compost in green
roof substrates requires investigation.
The Environmental and Economic Impact of Extensive Green Roofs
A big question surrounding large-scale implementation of green roofs in North
America is whether or not they are “worth it.” Answering this question is not so
straightforward. There are many aspects to a green roof, all of which are not equally
valued by each person questioning their merits. Economic, environmental, and social
aspects of green roofs all interact with each other at various scales. A building owner
balancing the cost of construction, maintenance, and repair of a green roof against the
energy savings and extended lifespan associated with a green roof may feel differently
than a municipality determining cost-savings associated with ecosystem services. The
restoration of green space lost to urbanization has to be weighed against the
environmental disruption of obtaining and producing the materials needed for a green
roof assembly. Researchers from a variety of disciplines have begun to conduct a sort of
assessment called a Life Cycle Analysis that attempts to combine the effects of these
various viewpoints into a single balance sheet.
Carter and Keeler (2008) considered the economic implications of replacing flat
roofs with green roofs in the Tanyard Branch watershed, located near Athens, GA. Their
analysis considered installations costs, roof maintenance, stormwater management, and
changes in air quality. Based on the pricing at the time of publication, they estimated that
a green roof is 18.87% more costly to an individual and 12.14% more costly to the
society than a black, flat roof. However, the net value of green roof installation was
improved when the analysis was adjusted to account for anticipated increases in energy

15
costs and decreases in the cost of green roof installation resulting from improved
domestic availability of green roof components.
Kosareo and Ries (2007) compared the environmental impact of green roofs and
conventional flat roofs based on construction in Pittsburgh, PA. Their assessment
considered many factors including stormwater management, runoff water quality, energy
use, and green house gas emissions. They did not factor in the impact of the substrate
material. They found that, over the course of their service life, extensive green roofs use
less energy, result in fewer greenhouse and ozone layer depleting gas emissions, and have
a lesser impact on aquatic and human health than conventional roofs. They also found
that the most significant environmental impacts resulted from the materials used in
construction of the roof and that the benefits of green roofs were largely tied to reduced
building energy use and extended service life.
Saiz et al. (2006) performed a holistic analysis of the life of a sixteen-floor
building with an extensive green roof located in Madrid, Spain. They focused on energy
use, heat mitigation, and the possible recycling of grey water runoff. Their analysis
accounted for the production of the substrate materials, but did not account for its
disposal after the service life of the green roof had been reached. In this model, the
installation of an extensive green roof was environmentally favorable in comparison to a
common flat roof. The most significant factors affecting environmental impact were
related to the reduction in energy consumption due to heat mitigation.
Peri et al. (2012) published a critical review of the analyses conducted by Kosareo
and Ries (2007) and Saiz et al. (2006). Peri considered these works to be “partially
comprehensive” because they failed to fully consider both the full lifecycle of the roof

16
and all of its components, namely the substrate layer, in their analyses. Peri performed an
environmental LCA of an existing extensive green roof located in Bagheria, Italy that
was constructed with a substrate composed of volcanic rock, perlite, compost, and peat.
They gave full consideration to all of the materials used in the construction of the green
roof from the initial production of those materials through the end of the green roof’s
service life and consequent disposal. The production of materials, in particular the
extraction and kilning of the inert substrate components, accounted for the majority of the
crude oil consumed during the life of the green roof.
Chenani et al. (2015) based their LCA study on a modeled extensive green roof
located in Chicago, IL. They compared multiple substrate compositions. Their results
showed that expanded clay was the major contributor of environmental impact when
included in a substrate, even at low rates (10%). They recommended finding alternatives
to energy and resource intensive substrates. The energy cost of the substrate layer was
also investigated by Getter et al. (2009). They calculated the carbon footprint of a green
roof with a 6 cm deep substrate layer and then determined the amount of time needed to
offset that footprint based on carbon sequestration in the vegetation layer and building
energy savings. They found that over seven years was required to balance the carbon
released into the environment and that nearly 87% of that carbon was associated with the
heat expanded slate in the substrate layer.
Bianchini and Hewage (2012) specifically considered the impact of using
recycled polymer-based materials on the environmental balance of green roofs. Using
recycled materials resulted in more than a two-fold reduction on the time required to
offset the environmental cost of producing those components.
17
The results of the LCA studies, while not entirely conclusive, provide several
useful insights into the relationship between the cost, benefits, and impacts of green
roofs. As it stands, green roofs are generally more environmentally favorable than
conventional roofs, but may be more monetarily costly. The reduction in building energy
use through heat mitigation and the extended roof service life are the most significant
contributors to the green roof’s environmental favorability and economic return, followed
by the combined effect of multiple roofs on stormwater management. However, the
materials used in green roof construction have considerable impacts on the environment
and are expensive. Their production is energy and resource intensive. The manufacture of
the non-organic substrate components represents a considerable portion of the total
embodied energy and environmental impact of the green roof. The transportation of green
roof components from non-local sources due to local unavailability is also economically
and environmentally unfavorable. Reducing the cost and environmental impact of the
construction materials, in particular the substrate, would drastically alter the balance.
Using materials from local, recycled sources in place of non-local, newly –manufactured
materials is a potential way in which to do this.
Alternative Materials
Current Investigations: There is a small, but growing, pool of literature related
to the use of recycled materials in green roof substrates. One of the first recycled
materials to be widely employed in green roofs, at least in the United Kingdom, was
crushed brick. This material is exceptionally difficult to source in the United States and
its use in green roofs within the US is negligible. Therefore, it is not surprising that most
of the studies that include crushed brick as a treatment were conducted somewhere in the

18
UK. Young et al. (2014) make the point that, despite the general acceptance of crushed
brick as a suitable substrate component, there are very few producers of the material in
the UK. The limited availability often forces those wishing to use it in a green roof
project to pay for long hauling distances, which is neither economically or
environmentally favorable. Much of the research on recycled-source substrates has
focused on materials that are more locally available. Materials that have appeared in the
literature include: pelleted waste clay/sewage sludge, pelleted newspaper ash, carbonated
limestone, crushed demolition aggregate, solid municipal waste incinerator bottom ash
aggregate, crushed tile, and crumbed rubber (Molineaux et al. 2009; Bates et al. 2015;
Graceson et al. 2014; Peréz et al. 2012).
The results of these studies are generally favorable for the adoption of alternative
substrates. They also reveal that small changes in the composition of substrates, such as
the specific ratio of each component or the particle size to which materials are milled, can
have a strong effect on how the resultant substrate performs. For example, in the study by
Young et al. (2014), changing brick particle size from 4-15 mm to 2-5 mm diameter
increased water holding capacity by 35% and increased shoot growth by 17%. In
Molineaux et al (2009), a clay pellet-based substrate produced three times the biomass of
a crushed brick substrate when compost was mixed at 15% by volume. When the
compost was increased to 25%, the biomass in the crushed brick more than tripled and
was equivalent to that in the clay pellet, which had no response to the added compost.
The works of these authors serve as strong examples that replacement of
conventional green roof substrates with sustainable alternatives is an achievable goal.
They also serve as a cautionary reminder that substrates are complex systems composed

19
of interactive parts that are not necessarily interchangeable. The complexity of substrates
and the potentially strong influence of small changes must be kept in mind as the green
roof community continues to evaluate new candidate materials.
Recycled Materials Meriting Investigation: Foamed glass and crushed
porcelain are two materials that have received little attention as potential substrate
components for green roof applications. There is currently one company in the United
States that manufactures foamed glass substrates, Growstone LLC, located in New
Mexico. Recycled glass bottles are ground into a fine powder and the powdered glass is
combined with foaming agents and kilned in a gas furnace using a blend of natural gas
and landfill-sourced methane as a fuel source. The gas released by the foaming agent
creates a network of micropores within the glass media. The raw product is then cracked,
crushed, and blended. The resulting product is incredibly lightweight, non-compressible,
and easily drained. Klopp and Berghage (2012) performed a preliminary evaluation of
foamed glass for use in green roof applications. They grew sedum plugs in small
containers simulating an extensive green roof in a greenhouse and reported favorable
growth of the sedum over a seven week period. They also reported that the wet density of
the material was below that of commonly used green roof substrates. One potential issue
mentioned in their study was that foamed glass is subject to degradation due to
freeze/thaw cycles under saturated conditions. It is unclear whether these conditions
would be experienced in the field. This is the only published study related to the use of
foamed glass substrates for green roofs. While the results are promising, they are hardly
conclusive due to the short observation window, idealized experimental conditions, and
limited characterization of the material.

20
Porcelain is a common component of demolition waste that originates from sinks,
toilets, tiles, and bath tubs. These fixtures are ubiquitous in buildings throughout the
United States. Currently, most demolished porcelain ends up in landfills. The material is
strong and non-compressible. White porcelain has a high albedo due to its color and
surface sheen. There are some interesting implications for the use of a high albedo
substrate. As mentioned previously, the heat mitigation potential of a green roof is largely
dependent upon the vegetation layer and is reduced when large portions of a green roof
surface are exposed or when plants are not actively transpiring. Roofs covered with high
albedo materials have been shown to provide cooling equivalent to fully functional green
roofs (Gaffin et al. 2005). A high albedo material like porcelain used in a green roof
substrate could increase the cooling efficiency of a green roof.

21
LITERATURE CITED

22
LITERATURE CITED
Ampim, P., Sloan, J., Cabrera, R., Harp, D., and Jaber, F. 2010. Green roof growing
substrates: types, ingredients, composition, and properties. Journal of Environmental
Horticulture 28(4): 244-252.
Atiyeh, R.M., Subler, S., Edwards, C.A., Bachman, G., Metzger, J.D., and Shuster, W.
2000. Effects of vermicompost and compost on plant growth in horticultural potting
media and soil. Pedo biologia 44: 579-590.
Bates, A., Sadler, J., Greswell, R., and Mackay, R. 2015. Effects of recycled aggregate
growth substrate on green roof vegetation development: A six year experiment.
Landscape and Urban Planning 135: 22-31.
Bauer, A. and Black, A. 1992. Organic carbon effects on available water capacity of three
soil textural groups. Proceedings of the Soil Science Society of America 56: 248-254.
Beman, J., Arrigo, K., Matson, P. 2005. Agricultural runoff fuels large phytoplankton
blooms in vulnerable areas of the ocean. Nature 434:211-214.
Bernai, M.P., Paredes, C., Sánchez-Monedero, M.A., Cegarra, J. 1998. Maturity and
stability parameters of composts prepared with a wide range of organic wastes.
Bioresource Technology 63: 91-99.
Berndtsson, J., Bengtsson, L., and Jinno, K. 2009. Runoff water quality from intensive
and extensive vegetated roofs. Ecological Engineering 35: 369-380.
Bianchini, F. and Hewage, K. 2012. How “green” are the green roofs? Life cycle analysis
of green roof materials. Building and Environment 48: 57-65.
Bliss, D., Nuefeld, R., and Ries, R. 2009. Storm water runoff mitigation using a green
roof. Environmental Engineering Science 26(2): 407-418.
Brabec, E., Schulte, S., and Richards, P. 2002. Impervious surfaces and water quality: a
review of current literature and its implication for watershed planning. Journal of
Planning Literature 16(4): 499-514.
Carter, T. and Keeler, A. 2008. Life-cycle cost-benefit analysis of extensive vegetated
roof systems. Journal of Environmental Management 87: 350-363.
Chenani, S., Lehvävirta, S., and Häkkinen, T. 2015. Life cycle assessment of layers of
green roofs. Journal of Cleaner Production. doi: 10.1016/j.jclepro.2014.11.070.
Derenne, S. and Largeau, C. 2001. A review of some important families of refractory
macromolecules: composition, origin, and fate in soils and sediments. Soil Science 166:
833-847.

23
Dimambro,M., Lillywhite, R., and Rhan, C. 2007. The physical, chemical, and microbial
characteristics of biodegradable municipal waste derivded composts. Compost Science
and Utilization 15(4):243-252.
Eghball, B. and Gilley, J. 1999. Phosphorus and nitrogen in runoff following beef cattle
manure of compost addition. Biological Systems Engineering: Papers and Publications.
Paper 131.
Eiland, F., Klamer, M., Lind, A.M., Leth. M., and Bààth, E. 2001. Influence of initial
C/N ratio on chemical and microbial composition during long term composting of straw.
Microbial Ecology 41(3): 272-280.
Fassman, E., Simcock, R., and Voyde, E. 2010. Extensive green (living) roofs for storm
water mitigation: part 1 design and construction. Prepared by Aukland UniServices for
Aukland Regional Council. Aukland Regional Council Technical Report 2010/017.
Faucette, L.B., Risse, L.M., Nearing, M.A., Gaskinm J.W., and West, L.T. 2004. Runoff,
erosion, and nutrient losses from compost and mulch blankets under simulated rainfall.
Journal of Soil and Water Conservation 59(4): 154-160.
Forschungsgesellschaft Landschaftsentwicklung Landschaftsbau (FLL) (Society of
Landscape Development and Landscape Design). 2008. Guidelines for the planning,
execution and upkeep of green-roof sites. Forschungsgesellschaft
Landschaftsentwicklung Landschaftsbau, Bonn, Germany.
Friedrich, C. 2005. Principles for selecting the proper components for a green roof
growing media. In: Proceedings of the 3rd
North American Green Roof Conference:
Greening Rooftops for Sustainable Communities, Washington, DC. May 4-6.
Gaffin, S., Parshall, L., O’Keeffe, G., Braman, D., Beattie, D., and Berghage, R. 2005.
Energy balance modeling applied to a comparison of green and white roof cooling
efficiency. Paper presented at the Third Annual Greening Rooftops for Sustainable
Communities Conference, Awards and Trade Show; May 4-6. Washington, DC.
Getter, K.L., Rowe, D.B., Robertson, G.P., Cregg, B.M., and Andresen, J.A. 2009.
Carbon sequestration potential of extensive green roofs. Environmental Science and
Technology 43(19):7564-7570 (http://dx.doi.org/10.1021/es901539x)
Graceson, A., Monaghan, J., Hall, N., and Hare, M. 2014. Plant growth responses to
different growing media for green roofs. Ecological Engineering 69: 196-200.
Graham, P. and M. Kim. 2003. Evaluating the stormwater management benefits of green
roofs through water balance modeling. In:Greening Rooftops for Sustainable
Communities Conference, May 29-30.

24
Gee, G. W. and Or, D. 2002. Particle-size analysis. Methods of soil analysis. Chapter 2,
Part, 4, 255-293.
Harada, Y. and Inoko, A. 1980. The measurement of cation-exchange capacity of
composts for the estimation of the degree of maturity. Soil Science and Plant Nutrition
26(1): 127-134.
Hart, M., Quin, B., and Nguyen, L. 2004. Phosphorus runoff from agricultural land and
direct fertilizer effects: a review. Journal of Environmental Quality 33: 1954-1972.
Hashemimajad, K., Kalbasi, M., Golchin, A., Shariatmadari, H. 2004. Comparison of
vermicomposts and composts and potting media for growth of tomatoes. Journal of Plant
Nutrition 27(6):1107-1123.
Hathaway, A., Hunt, W, and Jennings, G. 2008. A field study of green roof hydrologic
and water quality performance. Transactions of the ASABE 51(1): 37-44.
Haynes, R. and Naidu, R. 1998. Influence of lime, fertiliser and manure applications on
soil organic matter content and soil physical conditions: a review. Nutrient Cycling in
Agroecosystems 51: 123-137.
Helling, C., Chesters, G., and Corey, R. 1964. Contribution of organic matter and clay to
soil cation exchange capacity as affected by the PH of the saturating solution. Soil
Science Society Proceedings: 517-520.
Huang, G., et al. 2004. Effect on C/N on composting of pig manure with sawdust. Waste
Management 24: 805-813.
Hudson, B. 1994. Soil organic matter and available water capacity. Journal of Soil and
Water Conservation 49(2): 189-197.
Jenkinson, D. and Ladd, J. 1981. Microbial biomass in soil: measurement and turnover.
Soil biochemistry: 415-471.
Kalbitz, K., Schmerwitz, J., Schwezig, D., and Matzner, E. 2003. Biodegradation of soil-
derived organic matter as related to its properties. Geoderma 113: 273-391.
Klock-moore,K. 2000. Comparison of salvia growth in seaweed compost and biosolids
compost. Compost Science and Utilization 8(1):24-28.
Klopp, T. and Berghage, R. 2012. The use of foamed glass recycled glass material as a
greenroof media. Undergraduate research project, Pennsylvania State University,
University Park, PA.
Kosareo, L. and Ries, R. 2007. Comparative environmental life cycle assessment of green
roofs. Building and Environment 42: 2606-2613.

25
Liang, C., Das K., and McLendon, R. 2003. The impact of temperature an moisture
regimes on the aerobic microbial activity of a biosolids composting blend. Bioresource
Technology 86: 131-137.
Liu, K. and Baskaran, B. 2003. Thermal performance of green roofs through field
evaluation. In: Proceedings for the First North American Green Roof Infrastructure
Conference, Awards and Trade Show, Chicago, IL., May 29-30, 2003, pp. 1-10.
Loveland, P. and Webb, J. 2003. Is there a critical level of organic matter in the
agricultural soils of temperate regions: a review. Soil and Tillage Research 70: 1-18.
Lutzow, M., Kögel-Knabner, I., Ekschmidt, K., Matzner, E., Guggenberger, G.,
Marschner, B., Flessa, H. 2006. Stabilization of organic matter in temperate soils:
mechanisms and their relevance under different soil conditions –a review. European
Journal of Soil Science 57: 426-445.
MacGregor, S.T, Miller F.C., Psarianos, K.M., and Finstein, M.S. 1981. Composting
process control based on interaction between microbial heat output and temperature.
Applied and Environmental Microbiology: 1321-1330.
Marshall, J. 2007. Urban land area and population growth: a new scaling relationship for
metropolitan expansion. Urban Studies 44(10): 1889-1904.
Matthews, G., et al. 2010. Measurement and simulation of the effect of compaction on
the pore structure and saturated hydraulic conductivity of grassland and arable soil. Water
Resources Research 46.
Mengel, D. 1993. Fundamentals of soil cation exchange capacity (CEC). Purdue
University Cooperative Extension Service. Agronomy Guide AY-238.
http://www.extension.purdue.edu/extmedia/AY/AY-238.html. Accessed 1/9/2015.
Michigan Department of Energy, Labor, and Economic Growth (MDELEG). 2011.
Michigan Uniform Energy Code.
Molineux, C., Fentiman, C., and Gange, A. 2009. Characterising alternative recycled
waste materials for use as green roof growing media in the UK. Ecological Engineering
35: 1507-1513.
Moran, A. C. 2004. A North Carolina field study to evaluate green roof runoff quantity,
runoff quality, and plant growth. MS thesis. Raleigh, N.C.: North Carolina State
University, Department of Biological and Agricultural Engineering.
Nadian, H., Smith, S.E., Alston, A.M., and Murray, R.S. 1997. Effects of soil compaction
on plant growth, phosphorus uptake, and morphological characteristics of vesicular-

26
arbuscular mycorrhizzal colonization of Trifolium subterraneum. New Phytology 135:
303-311.
Nagase, A. and Dunnett, N. 2011. The relationship between percentage of organic matter
in substrate and plant growth in extensive green roofs. Landscape and Urban Planning
103: 230-236.
Ogundwande, G., et al. 2008. Nitrogen loss in chicken litter compost as affected by
carbon to nitrogen ratio and turning frequency. Bioresource Technology 99: 7495- 7505.
Olszewski, M., Holmes, M., and Young, C. 2010. Assessment of physical properties and
stonecrop growth in green roof substrates amended with compost and hydrogel. Hort
Technology 20(2): 438-444.
Omnura, S., Matsumoto,M., and Hokoi, S. 2001. Study on evaporative cooling effect of
roof lawn gardens. Energy and Buildings 33: 653-666.
Pérez, G., Vila, A., Rincón, L., Solé, C., and Cabeza, L. 2012. Use of rubber crumbs as
drainage layer in green roofs as potential energy improvement material. Applied Energy
97: 347-354.
Peri, G., Traverso, M., Finkbeiner, M., and Rizzo, G. 2012. Embedding “substrate” in
environmental assessment of green roofs life cycle: evidences from an application to the
whole chain in a Mediterranean site. Journal of Cleaner Production 35: 274-287.
Pullicino, D., Erriquens, F., and Gigliotti, G. 2007. Changes in the chemical
characteristics of water-extractable organic matter during composting and their influence
on compost stability and maturity. Bioresource Technology 98: 1822-1831.
Saiz, S., Kennedy, C., and Snail, K. 2006. Comparative life cycle assessment of standard
and green roofs. Environmental Science & Technology 40: 4312-4316.
Slaton, M., Hunt Jr., R., and Smith, W. 2001. Estimating near infrared reflectance from
leaf structural characteristics. American Journal of Botany 88(2): 278-284.
Sloan, J., Cabrera, R., Ampim, P., George, S., and MacKay, W. 2010. Performance of
ornamental plants in alternative organic growing media amended with increasing rates of
expanded shale. HortTechnology 20(3): 592-602.
Smith, K. and Roebber, P. 2011. Green roof mitigation potential for a proxy future
climate scenario in Chicago, IL. Journal of Applied Meteorology and Climatology 50(3):
507-522.
Sparge, J., Evanylo, G., and Alley, M. 2006. Repeated compost application effects on
phosphorus runoff in the Virginia Piedmont. Journal of Environmental Quality 35(6):
2342-2351.

27
Takakura, T., Kitade, S., and Goto, E. 2000. Cooling effect of greenery cover over a
building. Energy and Buildings 31: 1-6.
Tiquia, S., Richard, T., and Honeyman, M. 2000. Effect of windrow turning and seasonal
temperatures on composting of hog manure from hoop structures. Environmental
Technology 21: 1037-1046.
Toland, D.C., Haggard, B.E., and Boyer, M.E. 2012. Evaluation of nutrient
concentrations in runoff water from green roofs, conventional roofs, and urban streams.
Transactions of the ASABE 55(1): 99-106.
Watanabe, H. et al. 1997. Inactivation of pathogenic bacteria under mesophilic and
thermophilic conditions. Water Science and Technology 36(6-7): 25-32.
Woolley, J. 1971. Reflectance and transmittance of light by leaves. Plant Physiology 47:
656-662.
VanWoert, N., Rowe, B., Andresen, J., Rugh, C., Fernandez, T., and Xiao, L. 2005.
Green roof storm water retention: effects of roof surface, slope, and media depth. Journal
of Environmental Quality 34:1036-1044.
Van Veen, J. and Kuikman, P. 1990. Soil structural aspects of decomposition of organic
matter by micro-organisms. Biogeochemistry 11(3): 213-233.
Vijayaraghavan, K., Joshi, U.M., and Balasubramanian, R. 2012. A field study to
evaluate runoff quality from green roofs. Water Research 46: 1337-1345.
Xu, J. 2003. Sediment flux to the sea as influenced by changing human activities and
precipitation: example of the yellow river, china. Environmental Management 31(3): 328-
341.
Yang, J., Yu, Q., and Gong, P. 2003. Quantifying air pollution removal by green roofs in
Chicago. Atmospheric Environment 42: 7266-7273.
Young, T., Cameron, D. D., Sorrill, J., Edwards, T., and Phoenix, G. K. 2014. Importance
of different components of green roof substrate on plant growth and physiological
performance. Urban Forestry and Urban Greening. In Press
(http://dx.doi.org/10.1016/j.ufug.2014.04.007).
Zhu, N. 2007. Effect of low initial C/N ratio on aerobic composting of swine manure with
rice straw. Bioresource Technology 98: 9-13.

28
Chapter 2:
Does Compost Selection Impact Green Roof Substrate Performance: Measuring Physical
Properties, Plant Development, and Runoff Water Quality.

29
Abstract
Foamed glass and porcelain sourced from bulk waste intended for disposal in a landfill
were used to create extensive green roof substrates. A control substrate was prepared with
expanded shale. The resulting substrates were analyzed to determine bulk density,
maximum water holding capacity, granulometric distribution, air filled porosity, total
pore volume, saturated hydraulic conductivity, and cation exchange capacity. The
substrates were used to fill outdoor green roof platforms to a depth of 10 cm and then
planted with nine species suitable for green roof application. Plant coverage was
measured six times over two seasons in 2013 and 2014. Substrate temperature and
volumetric moisture content were recorded during the 2014 growing season. Total plant
coverage was statistically equivalent between the three substrates on 5 of the 6
measurement dates. Moisture content of the porcelain and foamed glass was either
equivalent or significantly greater than the expanded shale throughout the observed
season. Subsurface temperatures were cooler in the porcelain and foamed glass than the
expanded shale during the daytime for the majority of the observed season. Daily
variations in temperature of the porcelain substrate were significantly lower than
expanded shale during the early part of the season when portions of the substrate surface
were still exposed.

30
Introduction
A typical extensive green roof system consists of a textured drainage layer, filter
fabric, and a 5 to 20 cm substrate layer supporting the growth of vegetation on the surface
(Getter and Rowe, 2006). There are variations on this basic design, including the use of
non-permanent modules that are placed on top of a roof, however the primary concept
minimizes the amount of substrate required for maintaining a plant canopy. Traditional
extensive green roofs utilize drought resistant species such as sedums, sedges, and prairie
grasses to create a system requiring little to no maintenance. However, there has been
growing interest in the use of native, and even culinary, plant species in both the general
public and in academic research (Whittinghill et al. 2013).
The installation costs of an extensive green roof are much greater than those of
conventional bituminous or gravel ballasted roofs. The higher capital investment of green
roof construction is justified by the additional services they provide. The mitigation of
heat by the vegetated layer and the management of stormwater are two of the most
significant benefits of green roofs. Rooftop temperatures can be reduced by upward of
30°C relative to a conventional roof, leading to a 75% decrease in heat flow into the top
floors of a building equipped with a green roof (Liu and Baskaran 2003; Saiz et al. 2006).
An additional benefit of reducing rooftop temperatures is that wear on the waterproofing
membrane from cycles of expansion and contraction is reduced. The service life of green
roofs is estimated to be at least 30 years, twice that of conventional roofs (Jörg Breuning
& Green Roof Service, LLC 2015). Heat mitigation potential is largely affected by the
condition of the vegetation grown on a green roof.

31
Green roofs have been shown to have multiple beneficial effects on stormwater
runoff. A green roof can store water in the substrate layer and reduce the total volume of
stormwater runoff. Green roofs also delay and decrease the rate of runoff (VanWoert et
al. 2005; Castleton et al. 2010). The overall effect of this interaction with stormwater is
an attenuation of the demand placed on municipal water treatment facilities and of on the
influx of urban runoff into aquatic ecosystems. While most researchers generally agree
that green roofs are universally beneficial with regard to runoff volume, there is
disagreement regarding the runoff water quality (Berndtsson 2010; Rowe 2011). Green
roofs have been found to act as both a source (Hathaway et al. 2008; Vijayaraghavan et
al. 2012; Toland et al. 2012) and a sink (Berndtsson et al. 2009) of dissolved nitrogen and
phosphorus.
The depth of the substrate layer in extensive systems is restricted by building load
limitations, which complicates fertility management and plant establishment (Dunnett et
al., 2008; Rowe et al., 2006). Green roof substrates must remain lightweight when wet.
They must also be resistant to compression and compaction, which decrease drainage,
root development, and plant growth (Matthews et al. 2010; Nadian et al. 1997). The green
roof industry has utilized light weight expanded aggregates made from naturally sourced
volcanic rock or from heat-expanded shale, clay, and slate. These materials are less prone
to compaction, drain rapidly, and have lower bulk densities than topsoils (Beattie and
Berghage, 2004). However, expanded aggregates tend to have low water and nutrient
holding capacities. Fertility and water-holding capacity are managed using small
percentages (4-12% by mass) of an organic matter source such as peat moss or compost
(FLL, 2008, Ampim et al. 2010).

32
Organic matter is a fairly non-specific term that encompasses a wide range of
carbonaceous materials derived from decomposed plant and animal residues.
Decomposition of organic residues is a multi-stage process involving the selective
preservation of recalcitrant molecules through the interaction of chemical structure,
spatial inaccessibility, water availability, microbial activity, and environmental
conditions (Lutzow et al. 2006). The resulting collection of “humic” molecules contains a
wide variety of acidic and negatively charged functional groups that readily associate
with water and cations (Havlin et al. 2005). The inclusion of organic matter in green roof
substrates has been shown to increase water retention and plant growth (Nagase and
Dunnett 2011; Olszewski et al. 2010).
The stabilization of organic matter can be a lengthy process. The decomposition
of readily available carbon (sugars, starches, organic acids, celluloses, etc.) occurs over
several years in temperate forests and further degradation continues over decades
(Jenkinson and Ladd 1981, Lutzow et al. 2006). Composting is a process designed to
accelerate the primary decomposition of organic residues into a stable material through
enhanced microbial action (Bertoldi et al. 1983). Compost is made from a variety of
organic materials including animal byproducts, plant residues, paper scraps, cardboard,
and municipal waste. Composts can be processed in piles or windrows, with or without
cover, and with varying frequencies of mixing (Brodie et al. 2000). Some composts are
processed using worms or the larvae of some insects (Newton et al. 2005). Variations in
starting materials and production process effect the physical, chemical, and biological
properties of finished compost (Campitelli and Ceppi 2009; Cooperband 2003; Tiquia et
al. 2002).

33
Compost is often treated as a fungible material within the green roof community.
Consequently, recommendations for the use of compost are generic and pay little
consideration to the fact that composts are highly diverse. Multiple studies have shown
that compost selection affects the physical and chemical properties of greenhouse
substrates as well as the development of plants grown in those substrates (Atiyeh et al.
2000; Klock-Moore 2000). It stands to reason that variability in composts included in
green roof substrates will result in differences between those substrates.
The purpose of this study was to determine how compost selection influences
green roof substrates in terms of physical and chemical properties, plant growth and
development, and susceptibility to leaching of nitrate and soluble phosphorus, which can
be potential pollutants.
Materials and Methods
Composts: Six different composts varying in feedstock and production style were
combined with a commercial green roof mixture of expanded shale and 2NS sand
(Renewed Earth, Kalamazoo, MI) to create six substrates that varied only in their
compost selection. The composts are referred to as FWH, FWW, Yard G, Yard T, Trans
D, Trans W, (Table 2.1). Substrate blends consisted of 24% haydite A (.074-2.38mm),
24% haydite B (2.38–9.51mm), 32% 2NS sand, and 20% of the given compost.
Proportions were measured by volume. Haydite is an expanded shale aggregate produced
by the Hydraulic Press Brick Company in Indianapolis, IN.
Physical and Chemical Analysis of Substrates: The analyses were based on
methods presented in Methods of Soil Analysis, published by the Soil Society of America.
Thick-walled steel tubing with an internal diameter of 7.7 cm was cut into equal length

34
sections and fitted with circular sections of course filter paper and cheesecloth held in
place with a rubber band to form a permeable bottom. Excess material was trimmed away
after fitting. Each core was filled with one of the seven treatments to a height (L) of 10
cm and vibrated to allow for settling. Additional material was added to restore the height
to 10 cm and this process was repeated until no shrinkage occurred. Four replicates were
prepared per treatment.
The cores were oven dried for 24 hours at 150 °C and then weighed. Dry bulk
density was determined using the known volume and dry mass. Cores were then saturated
from the bottom up in a sink and allowed to soak for a minimum of 24 hours. Saturated
cores were weighed. Total porosity was determined using the difference between the dry
and saturated masses. The saturated cores were then used to determine saturated
hydraulic conductivity.
Saturated flow conditions were created using a marionette reservoir composed of
a stoppered 1 L Erlenmeyer flask with an air inlet and a water outlet. The reservoir was
placed on a jack above a supported Buchner funnel. A saturated core was placed in the
Buchner funnel and the water outlet tube of the reservoir was clamped to the lip of the
core. The reservoir was positioned with the jack so that the bottom of the outlet tube
inside of the flask corresponded with the desired level of standing water head on top of
the core (Figure 2.1). The head height (Hi) was monitored with a ruler placed inside of
the core. Cores were allowed to achieve steady state flow in equilibrium with the
established hydraulic head. A tared beaker was placed under the Buchner funnel to
collect at least 100 mL of effluent. The beaker was removed and weighed to determine
the exact volume (V) of water collected and the exact time (t) of collection was recorded

35
with a stopwatch. This procedure was repeated four times for each core. An average of
the four trials was used for all statistical analyses.
Saturated hydraulic conductivity constants (KS) were calculated for each core
using a derivation of Darcy’s Law, where A is the surface area of the core:
KS =V ⋅ L
A ⋅ t ⋅ (Hi + L)
Saturated cores were weighed with no hydraulic head and then transferred to Tempe cells
equipped with 1 bar ceramic membranes and placed under 0.33 bar of applied air
pressure for 24 hours. Cores were weighed immediately following removal from the
Tempe cells, dried in an oven for 24 hrs at 105 °C, and weighed again. Cores were then
emptied and weighed. Bulk density (Pb), total porosity (fT), and volumetric water content
(ΘV) at field capacity (defined here as a matrix potential of -0.33 bar) were calculated for
each core using the recorded masses and volumes.
Plant Growth and Development: Bulb crates measuring 56.2 x 35.6 cm were
filled to a depth of 10 cm with one of six blended substrates and planted with three plant
species that differed in growth rate, nutrient demand, and drought tolerance: Ocimum
basilicum (basil), Sedum floriforum (sedum), or Carex eburnea (bristleleaf sedge). The
sedum were purchased as plugs from Hortech, Spring Lake, MI in 38 cell trays with cell
volumes of 407 cm3. The bristleleaf sedge were purchased as plugs from Mother Plants,
Ithaca, NY and the basil were grown from seed (Gurney’s Seed & Nursery Co.,
Greendale, IN). Both the bristleleaf sedge and basil were grown in 72 cell plug trays with
cell volumes of 54 cm3.
Six plugs of each species were planted in each substrate blend and replicated three
times for a total of 54 crates. There were 18 plants of each species within each substrate

36
for a total of 324 plants in the study. Crates were placed randomly on greenhouse benches
in a completely random design. The study took place in a glass greenhouse under natural
lighting. Air temperature was controlled by a thermostat set at 21±1°C. Moisture readings
were taken on experimental units were taken every other day using an ML2X Theta
Moisture Probe (Delta T Devices, Ltd.; Cambridge, U.K.). Experimental units were
irrigated to runoff when volumetric moisture content was at or below 7%. Weeds were
removed during moisture checks.
Plant growth was monitored every three weeks for a period of 14 weeks by
measuring height and width in two directions to determine the approximate volume
occupied by each plant. Growth of basil was measured until it was ready to be harvested.
At that point it was harvested perpetually and fresh harvest weights were recorded. Top
growth was removed to maintain the plant’s height at approximately 20 cm. Flowers were
removed to perpetuate vegetative growth. Basil was replanted once harvest weights
diminished. After 25 weeks (April through October 2013) plants were harvested,
separated into roots and shoots, dried at 60 ºC for seven days, and weighed to determine
plant biomass accumulation.
Runoff Water Quality: During three regularly spaced intervals (days 21, 93, and
165), runoff water was collected and submitted to the MSU Soil and Plant Nutrient
Laboratory to determine nitrate, and soluble phosphorus concentrations. Runoff was
induced by slowly watering each experimental unit until it just began to drip from the
bottom. The experimental units were allowed to equilibrate for one hour before adding an
amount of water equivalent to a 13 mm precipitation event. Runoff was then collected
during a 2 hour window before being weighed and sampled. A sample of the tap water

37
used to induce runoff was also collected and submitted for analysis. Ion concentration
values were adjusted prior to statistical analysis by subtracting the concentrations of the
tap water from the concentrations of the runoff.
Statistical Analysis: Recorded volumes of all plants within an experimental unit
for each measurement date were summed. Simple linear regression was performed
modeling the rate of change in plant volume in each experimental unit over time. The
slope of the regression line was taken to be the growth rate of each experimental unit.
Mean values for plant biomass and plant growth rate were compared using two-way
ANOVA models. One-way ANOVA models were used for substrate physical properties.
Runoff water quality was analyzed using a repeated measures model with time as the
repeated factor. Plant species and compost type were treated as fixed effects in all
models. Data were evaluated for compliance with normality and equal variance
assumptions. Non-normal data was corrected using either a natural log or power
transformation. All values were back-transformed prior to reporting results unless
otherwise noted. Data failing to meet equal variance assumptions were analyzed using
grouped variance models. Repeated measures analyses were conducted using a
heterogeneous autoregressive covariance structure. Denominator degrees of freedom in
repeated measures and non-equal variance models were determined using the Kenward-
Rogers method. Multiple comparisons were made using Fischer’ LSD at a 95%
confidence level. All analyses were performed with PROC MIXED and PROC REG in
SAS 9.4 (SAS Institute, Cary NC).

38
Results
Physical and Chemical Analysis of Substrates: One-way ANOVA
demonstrated significant differences between treatments for bulk density (F6,10.3=23.22, P
<.0001), field capacity (F6,5.5=26.09, P=.0008), saturated hydraulic conductivity
(F6,7.36=13.78, P =.0012), and total porosity (F6,5.43=15.02, p= .0033).
All compost substrates had greater field capacities than the un-amended control.
Field capacities within compost treatments ranged from 0.168 to 0.205 ml·cm-3
.
Differences in field capacity relative to the un-amended control ranged from 0.010
ml·cm-3
in the Trans W treatment to 0.047 ml·cm-3
in the FWW treatment (Table 2.2).
Saturated hydraulic conductivities within compost treatments ranged from 1.4 to
10.2 cm·hr-1
. The FWW, FWH, Yard T, and Trans W substrates had lower saturated
hydraulic conductivities than the control, but the Trans D and Yard G substrates had
higher saturated hydraulic conductivities. Differences relative to the unamended control
ranged from 5.9 cm·hr-1
lower to 2.9 cm·hr-1
greater (Table 2.2).
Bulk densities within compost treatments ranged from 1.23 to 1.42 g·cm-3
. The
FWW, FWH, and Yard T treatments had greater bulk densities than the control. The
Trans D treatment had a lower bulk density than the control. The Yard G and Trans W
treatments were statistically similar in bulk density to the control. Differences in bulk
density relative to the un-amended control ranged from 0.09 g·cm-3
lower to 0.10 g·cm-3
greater (Table 2.2).
Total porosities within compost treatments ranged from 41.5% to 50.3%. The
Trans D treatment had greater total porosity than the control. The FWH, FWW, and Yard
T treatments had lower total porosities than the control. The Yard G and Trans W

39
treatments were statistically similar to the control. Differences in total porosity relative to
the control ranged from 6.0% lower to 2.8% greater (Table 2.2).
Chemical analysis revealed that total and soluble nutrient concentrations as well
as pH varied among compost types (Tables 2.3, 2.4). Soluble nutrient concentrations
were consistently greatest in the FWW compost. Among the nutrients analyzed, those in
the FWW compost were between 3.5 (calcium) and 150 (nitrate) times greater than those
of the lowest testing compost. There was no compost that consistently had the greatest or
lowest total nutrient concentrations. Variability within total nutrient concentrations was
much less pronounced than observed within soluble nutrient concentrations. Differences
between the lowest and highest testing composts for each nutrient ranged between 1.5
and 3.8 fold.
Plant Growth and Development: The interaction between compost type and
plant species was significant for shoot biomass (F10,23=5.38, P=.0004). Basil harvest mass
was lowest in the Yard G treatment and greatest in the FWW treatment. However,
bristleleaf sedge and sedum shoot biomass were lowest in the Trans W treatment and
greatest in the FWH treatment (Figure 2.2). Main effects analysis showed that compost
type was significant for shoot biomass (F5,30=17.66, P<.0001). Basil harvest weights
ranged from 46 to 194 g per tray. Bristleleaf sedge shoot dry masses ranged from 82 to
156 g per tray and sedum dry shoot masses from 40 to 77 g per tray (Table 2.5).
The effect of compost type on root mass was significant for sedum (F5,12=3.16,
p=.0476) but not for bristleleaf sedge (F5,12=1.95, p=.1588). Sedum root masses ranged
from 14 to 37 g per tray and bristleleaf sedge root masses ranged from 60 to 129 g per
tray. A post-hoc pairwise comparison of the treatments with the highest and lowest mean

40
values for root biomass in bristleleaf sedge revealed a significant difference (df=12,
t=2.22, p=.0463) (Table 2.5).
The interaction between compost type and plant species was significant for plant
growth rate (F10,17=2.51, P=.0452). Basil growth rate was lowest in the Trans W
treatment and greatest in the FWH treatment. Growth rates in bristleleaf sedge were
lowest in the Yard G treatment and greatest in the Trans D treatment. In sedum, growth
rates were lowest in the Trans W treatment and greatest in the FWH treatment (Figure
2.2). Main effects analysis showed that compost type was significant for growth rate
(F5,15=5.38, P=.0048). Basil harvest weights ranged from 46 to 194 g per tray. Bristleleaf
sedge shoot dry masses ranged from 82 to 156 g per tray and sedum dry shoot masses
from 40 to 77 g per tray (Table 2.6).
Runoff Water Quality - Nitrate: The three-way interaction of time, compost
selection, and plant type was significant (F20,61.2=1.78, P=.0448) for nitrate concentration
in runoff water, which warranted exploration of the two-way interactions. The two-way
interaction of plant type and time was significant (F4,56.7=6.26, P=.0003) (Figure 3.3a).
Marginal means for sedum, sedge, and basil were 34.51, 32.79, and 13.95 ppm,
respectively. Pairwise comparisons showed that the marginal means for sedum (dF=43.9,
t=4.30, P<.0001) and sedge (dF=43.9, t=6.62, P=.0001) were significantly different from
basil, and from each other (dF=43.9, t=2.32, P=.0251). Slicing the interaction by time
showed that nitrate concentrations were significantly different among plant types on day
21 (F2,36=10.84, P=.0002) and day 93 (F2,36.5=15.86, P<.0001), but not on day 165
(F2,35.1=2.35, P=.1102). Pairwise comparisons revealed that difference between sedge and
sedum was not significant on day 21 (df=36, t=0.48, P=.6324). The two-way interaction

41
of time and compost type was also significant (F10,61.9=4.95, P<.0001) (Figure 2.4). The
marginal means for days 21, 93, and 165 were 107.30, 3.39, and 1.32 ppm, respectively.
Pairwise comparisons showed that marginal means for all three days were significantly
different (P<.0005). Nitrate concentrations on day 21 were significantly greater than days
93 or 165 for all composts types (P<.0001). The main effects of compost selection
(F5,43.9=22.16, P<.0001), plant type (F2,43.9=43.9, P<.0001), and time (F2,51=657.57,
P<.0001) were all significant. On day 21, among all treatments, nitrate concentrations
ranged from 8.23 to 510.66 ppm. On day 93 the ranges were from 0.30 to 46 ppm and on
day 165 the ranges were from 0.40 to 5.03 ppm. The vermicompost treatments had the
highest concentrations of nitrate on the first measured event in all species (Figure 2.5).
Runoff Water Quality – Phosphorus: The three-way interaction of time,
compost selection, and plant type was significant (F20,53=2.45, P<.0001) for phosphorus
concentration in runoff water , which warranted exploration of the two way interactions.
The two way interaction of plant type and time was significant (F4,47=12.13, P<.0001)
(Figure 2.3). Marginal means for sedge, sedum, and basil were 1.06, 0.94, and 0.79 ppm,
respectively. Pairwise comparisons showed that the marginal means for sedge (dF=34.9,
t=8.13, P<.0001) and sedum (dF=34.9, t=3.89, P=.0004) were significantly different
from basil, as well as from each other (dF=34.9, t=4.24, P=.0002). Slicing the interaction
by time showed that phosphorus concentrations were significantly different among plant
types on day 21 (F2,35.3=6.63, P=.0045), day 93 (F2,34.6=66.61, P<.0001), and day 165
(F2,44.8=23.31, P<.1102). The two-way interaction of time and compost type was also
significant (F10,53=73.29, P<.0001) (Figure 2.4). The marginal means for days 21, 93,
and 165 were2.21, 0.61, and 0.38 ppm, respectively. Pairwise comparisons showed that

42
marginal means for all three days were significantly different (P<.0001). Phosphorus
concentrations on day 21 were significantly greater than days 93 or 165 for all composts
types (P<.0001). The main effects of compost selection (F5,34.9=219.69, P<.0001), plant
type (F2,34.9=33.05, P<.0001), and time (F2,51=1535.18, P<.0001) were all significant. On
day 21, among all treatments, phosphorus concentrations ranged from 0.61 to 7.0 ppm.
On day 93 the ranges were from 0.14 to 1.64 ppm. On day 165, the ranges were from
0.13 to 0.85 ppm. The vermicompost treatments had the highest concentrations of
phosphorus on the first measured event in all species (Figure 2.5).
Discussion
Physical Analysis of Substrates: The addition of compost to expanded shale
affected every measured physical property. The field capacities of all amended treatments
were greater than expanded shale, which supports the general practice of adding compost
to improve water retention of green roof substrates. However, the magnitude of the
increase was variable, meaning the actual effect of compost addition on field capacity is
not predictable. The magnitudes of change in properties other than field capacity were
also variable. Unlike field capacity, the addition of compost to expanded shale did not
consistently increase or decrease bulk density, porosity, or saturated hydraulic
conductivity. The observed variability in both the direction and magnitude of change of
key physical properties resulting from compost selection demonstrates that the effects of
compost addition on green roof substrates cannot be generalized.
Understanding how particular composts will affect a green roof substrate is
important because the physical properties of green roof substrates are related to the
environmental and economic costs of a roof, the capacity of a substrate to support

43
vegetation, and the ability of a roof to provide ecosystem services. As an example,
consider the FWW and Trans D substrates. There was a 0.18 g·cm-3
difference in dry bulk
density, which means that a truckload of the FWW substrate would weigh 14.6% more
than the same volume of the Trans D substrate. The additional weight translates to
increased fuel consumption. The fuel consumed during transportation of substrates
represents a significant portion of both the cost and embodied energy of a green roof
(Carter and Keeler 2008; Peri et al. 2012). Choosing between the two substrates would
also affect the way in which a green roof would manage stormwater. The saturated
hydraulic conductivity of the FWW substrate was 1.4 cm·hr-1
, which was 8.5 cm·hr-1
less
than the Trans D. The largest rainfall recorded for 2014 over a one-hour period in the
Lansing, MI area was 3.2 cm, which occurred during a string of rain events that would
have resulted in green roofs being near field capacity. Assuming that such a rain event
ended after an hour, a green roof made with the Trans D substrate would have released
that water at the same rate that it fell, compared to spreading the release over a 75 minute
window following the end of the event with the FWW substrate.
Plant Growth and Development: Green roof performance is highly dependent
upon the active transpiration and coverage area of the vegetative layer. Plants maintain
roof temperatures during summer months through evapotranspirational cooling and
reflection of the near infrared radiation responsible for surface heating (Takakura et al.
2000; Slaton et al. 2001; Woolley 1971). Evapotranspiration also accelerates the removal
of water from the substrate layer, increasing the amount that can be stored during
successive precipitation events. Thus it is desirable for a green roof to achieve complete
surface coverage and to have actively transpiring plants as soon as possible. However,

44
there is also evidence to show that growth beyond that which is necessary to achieve
complete coverage may be detrimental to a green roof. Rowe et al. (2006) showed that
plants producing lush vegetation had decreased survivorship under drought conditions.
They postulated that the increased leaf surface area resulted in more rapid water loss than
occurred in plants with less vigorous growth.
A nearly two fold difference was observed in dry biomass production among
compost treatments for all three species included in the study. Growth rates for basil
varied by a factor of 2.6 and those of bristleleaf sedge by a factor of 1.5. These results
suggest that compost selection can have a strong effect on the initial establishment of a
green roof, both in terms of the size of plants and the area which they cover. Furthermore,
compost selection could make the difference between having poor plant establishment,
achieving desirable plant coverage, and producing a vegetative layer that is overly
susceptible to drought stress.
Runoff Water Quality: There have been few investigations into the quality of
runoff from extensive green roofs. Amongst the studies that have been conducted,
reported concentrations of nitrate and phosphorus in green roof runoff vary (Berndtsson
et al. 2009; Hathaway et al. 2008; Toland et al. 2012; Vijayaraghavan et al. 2012), which
has resulted in a lack of consensus regarding the degree to which green roofs contribute
to mass loading of stormwater. One possible reason for this lack of consensus is that the
age of the roofs in these studies was not the same. In our study, nutrient concentrations
were greatest on the initial measurement date and decreased significantly after six
months. It stands to reason that the mass loading effect of a green roof is affected by age.

45
Comparing the results of multiple green roof runoff studies with respect to the age of the
roofs under investigation provides support to this hypothesis.
Vijayaraghavan, K., et al. (2012) constructed small green roof platforms using
green roof substrate made from volcanic rock and compost filled to a depth of 15 cm.
Their experiments were conducted two months after the platforms were filled using
simulated rain events. Mean nitrate concentration in the runoff water was approximately
25 ppm. Mean phosphorus concentration was near 20 ppm.
Hathaway, A.M., et al. (2008) monitored effluent from an extensive green roof in
North Carolina. The substrate was composted of expanded slate, sand, and 15% cow
manure compost with a depth of 10 cm. The roof had been established for one year prior
to the start of data collection. Ion concentrations from the green roof effluent were
compared to those from the effluent of a conventional roof control and collected rain
water. The green roof acted as a source of phosphorus and nitrogen. Nitrogen
concentrations were statistically similar to those observed from the control roof. Nitrogen
concentrations from the green roof were between 0.7 and 6.9 ppm. Concentrations from
the control were between 0.7 and 7.2 ppm. However, phosphorus levels were much
higher from the green roof than from the control roof or the rainwater. Phosphorus
concentrations from the green roof were between 0.6 and 1.4 ppm and those from the
control were between 0.05 and 0.35 ppm. Rain water nitrogen was between 0.06 and 2.41
ppm. Rainwater phosphorus was consistently 0.05 ppm.
Toland, D.C., et al. (2012) observed water quality from multiple green roofs,
conventional roofs, and urban streams near Fayetteville, AK. The green roofs were
established between 17 and 23 months prior to observation. The green roof substrates
46
were mixes of expanded clay with 15% compost. Nitrate concentrations from green roofs
ranged between 0.17 to 0.41 ppm, which was within the range observed for the streams
and control roofs. However, phosphorus concentrations were greater from green roof
runoff than from that of conventional roofs or samples from urban streams. Soluble
reactive phosphorus concentrations ranged from 1.57 to 1.82 ppm from green roofs, 0.01
to 0.02 ppm from conventional roofs, and 0.03 to 0.12 ppm from the urban streams.
Berndtsson, J.C., et al. (2009) observed runoff from a green roof in Sweden. The
roof had been established for 4 years. Concentrations of nitrate, soluble phosphorus from
the roof were compared against rainwater. Nitrogen concentrations were approximately 1
ppm in the rainwater and less than 0.5 ppm in the green roof effluent. Phosphorus
concentrations were less than 0.1ppm in the rainwater and between 0.3 and 0.4 ppm in
the green roof effluent.
There is a decreasing trend in nutrient concentrations relative to the age of the
green roof under study. This trend is likely a result of younger roofs having a greater pool
of soluble compounds from the substrate components that gradually reach a state of
equilibrium after repeatedly being leached by precipitation events. If this is the case, then
the impact of compost selection on runoff water quality would be most pronounced
during the establishment of the roof and would diminish with time.
The runoff concentrations observed in our study are consistent with this
explanation and prediction. Initial nitrate concentrations within a given species type
differed by 311 to 645 ppm and initial phosphorus concentrations by 6.5 to 8.2 ppm. The
magnitudes of these values were much greater than those reported in other studies of
green roof runoff. However, no other study has captured runoff from roofs, simulated or

47
otherwise, that were as young as the units in our study. After six months, our observed
concentrations were consistent with the concentrations observed by other authors. Thus it
stands to reason that compost can have a pronounced effect on green roof runoff quality,
but that effect is likely observable only through the first few seasons following
establishment.
The interpretation of runoff water analyses is complicated by a lack of water quality
standards specifically regulating green roof construction and maintenance. Researchers
have been using other established water quality standards in combination with
comparisons of values cited in other green roof literature to put results into context. We
compiled the concentration limits for nitrate and soluble phosphorus from three water
quality standards: the MDEQ Groundwater Quality Standard (MDEQ 1998), the EPA
National Primary Drinking Water Standard (USEPA 2010), and the EPA Ecoregional
Nutrient Criteria for Rivers & Streams (USEPA 2002) (Table 2.7). At the beginning of
the study, the EPA drinking water standard was violated by all treatments and only the
Yard T substrate planted with basil was able to meet the MDEQ standard. By the end of
the study, the MDEQ standard was met by all treatments and all but the FWW substrate
planted with sedum met the EPA drinking water standard. The EPA criteria for
freshwater rivers and streams were violated for the entire duration of the study.
Compost Production: This study included two pairs of composts that differed in
production by a single factor: the food waste composts (FWW & FWH) and the
transplant composts (Trans W and Trans D). The food waste composts shared a common
feedstock, but were composted using either a traditional hot compost method (FWH) or a
vermicompost method (FWW). The transplant composts used identical feedstocks and

48
were both composted with the traditional hot compost method. The Trans W was blended
with water during the initial mixing and the Trans D was blended with an aqueous
nutrient solution. Examination of the differences between related pairs of composts
demonstrates how subtle changes in compost production translate to substrate
performance.
Food Waste Composts: Vermicomposting has been shown to solubilize a greater
fraction of total nutrients than hot composting (Albanell et al. 1988, Tognetti et al. 2005).
The soluble fractions of total phosphorous, potassium, calcium, and magnesium were
1.85, 23.49, 3.13, and 0.76%, respectively, in the FWH compost compared to 5.15, 29.87,
4.64, 2.91% in the FWW compost. It is likely that the observed increase in those
solubilized nutrients resulted from vermicomposting. Greater solubilization of nitrogen is
also consistent with vermicomposting, however the 900 ppm disparity between the FWH
and FWW composts requires additional explanation. The pH of the FWH compost was
8.9 and only 0.04% of the total nitrogen was in a non-mineralized form, compared to a
pH of 6.5 and a soluble nitrogen fraction of 1.68% in the FWW. High pH and low soluble
nitrogen are suggestive of unfinished, unstable compost.
Compost stability refers to the interaction of organic matter decomposition and
microbial activity (Pullicino et al. 2007). Nitrogen in feedstocks is predominately
contained within organic compounds such as proteins. Proteins are degraded along with
labile carbon sources by heterotrophic microbes during the thermophilic phase of
composting (Tuomela et al. 2000). Initially, nitrogen liberated from feedstock residues is
immobilized in microbial biomass. Once nitrogen requirements are met, additional
nitrogen that is extracted during the acquisition of reduced carbon becomes available as

49
ammonia. Ammonia, a basic cation, accumulates and raises the pH of the compost. After
the labile pool of carbon has been depleted, the accumulated ammonia is converted to
nitrate by chemoautotrophic bacteria (Amlinger et al 2003, Cabrera et al. 2005, Tuomela
et al. 2000). The nitrification process is acidic and reduces the compost pH to somewhere
between 6.5 and 8.0 (Sánchez-Monedero et al. 2001, Tuomela et al. 2000). The nitrogen
in the FWH compost was likely immobilized in microbial biomass at the beginning of the
study.
It is reasonable to suspect that plant growth would be related to availability of
nutrients. However, no statistical differences were observed in shoot mass for basil,
sedum, or bristleleaf sedge between the two food waste composts. The reduction in
soluble nutrient concentration did have an effect on initial runoff water quality. On day
21, mean nitrate concentration across all plant types was 258 ppm, or 72%, lower in the
FWH substrate than in the FWW substrate and mean phosphorus concentration in the
FWH substrate was 4.01 ppm, or 55%, lower. One explanation for the equivalence of
plant development is that nutrients in the FWH substrate were gradually released while
the initially large pool of soluble nutrients in the FWW substrate was rapidly depleted
through leaching.
The choice of processing method was also reflected in substrate physical
properties. Field capacity was 14% greater and saturated hydraulic conductivity was three
times smaller in the FWW substrate than the FWH substrate, which means that the FWW
substrate would hold a larger volume of water for a greater period of time than the FWH
substrate.

50
Transplant Composts: These two composts were the most similar composts
included in this study and are an excellent example of the downstream impact of small
changes in composting practices. The Trans W and Trans D composts differed only by
the liquid used to wet the piles during the initial mixing of feedstocks. Despite the strong
similarity between the two composts, significant differences existed in the physical
properties of the substrates in which the composts were included and the development of
the plants grown in those substrates. Saturated hydraulic conductivity of the Trans D
substrate was 118% greater than that of the Trans W substrate and porosity was 4.8 %
(vol.) greater. Shoot biomasses of basil and bristleleaf sedge were 87% and 45% greater,
respectively, in the Trans D substrates than the Trans W substrates. The addition of the
nutrient solution also had an effect on chemical properties. Excepting magnesium,
soluble nutrient concentrations of the Trans D compost were at least twice those of the
Trans W compost. The effects of increased soluble ion concentrations were reflected in
initial runoff water quality. Nitrate and phosphorus concentrations in run off water were
63% and 25% less in the Trans W than the Trans D substrate.
Conclusions
The substrate is involved with many functional aspects of green roofs. Stormwater
management is directly related to substrate field capacity and hydraulic conductivity.
Runoff water quality is affected by soluble nutrient concentrations and cation exchange
capacity. Thermal regulation, while directly attributable to the plant layer, is also affected
by the substrate layer’s influence on plant growth and development. We observed
significant differences in substrate physical properties, plant development, and runoff
water quality resulting from compost selection. Our results suggest that compost selection

51
has the potential to affect the ability of green roofs to provide ecosystem services.
However, this study was limited to an observational window of six months, which
represents only a small portion of the expected lifespan of green roofs. We saw that time
plays a factor in the significance of compost selection on runoff water quality. Further
research is required to understand the long-term implications of compost selection on
other key parameters related to green roof performance. Additional research is also
needed to understand how the composting process can be adapted to produce composts
specifically tailored to green roof applications.

52
APPENDIX

53
Table 2.1. Description of Composts
Yard G Screened commercial compost produced in large windrows from municipal
yard waste (Granger LLC, Lansing MI)
Yard T Screened commercial compost produced in large windrows from municipal
yard waste and horse manure (Tuthill Farms and Composting, South Lyon
MI)
Trans W Unscreened compost produced in pallet size piles at the MSU Student
Organic Farm (SOF) using straw, pine shavings, hay, sphagnum peat and
water by soaking prior to layering
Trans D Produced in the same fashion as the Transplant blend with the addition of
the liquid waste fraction of an on-campus anaerobic digester in place of
water during construction of the pile.
FWH Food Waste Hot (FWH). Screened compost produced in outdoor piles at
the MSU SOF using pre-consumer food scraps, leaf mold and wood chips.
FWW Food Waste Vermicompost (FWW). Screened vermicompost produced in a
wedge bed system in a high tunnel at the MSU SOF using pre-consumer
food scraps, leaf mold and wood chips.

54
Table 2.2. Physical Properties of Green Roof Substrates Prepared with Different
Composts
Yard G Yard T Trans W Trans D FWH FWW Control
Bulk Density
(g·cm-3
) 1.25 b 1.42 a 1.31 b 1.23 b 1.42 a 1.41 a 1.32 b
Field
Capacity
(ml·cm-3
)
0.203 a 0.183 b 0.168 cd 0.180 bc 0.175 bc 0.205 a 0.158 d
Ks
(cm·hr-1
) 10.18 a 3.16 b 4.52 b 9.88 a 4.26 b 1.39 c 7.28 a
Porositys
(% vol) 48.5 ab 44.8 cd 45.5 bc 50.3 a 41.5 d 45.0 c 47.5 ab
A commercial green roof substrate composed of expanded slate and sand was combined
with different composts. Composts were mixed at 20% by volume. Values in the same
row sharing a letter were found to be statistically similar using Fischer’s LSD at α=0.05.
FWH- food waste hot compost, FWW – food waste vermicompost, Trans D – nutrient
enriched straw and hay compost, Trans W – straw and hay compost, Yard T – yard waste
and manure compost, Yard G – yard waste compost

55
Table 2.3. Soluble Nutrient Analysis of Composts
pH
EC
(mmhos)
NO3
(ppm)
NH4
(ppm)
P
(ppm)
K
(ppm)
Ca
(ppm)
Mg
(ppm)
Yard G 7.9 6.11 229 2.7 3.8 1350 660 131
Yard T 7.6 3.75 204 2.6 5.2 462 420 125
Trans W 6.0 3.51 271 1.5 31 538 360 100
Trans D 6.3 7.03 416 244 56 1069 720 67
FWH 8.9 5.15 6 4.1 27.7 1386 660 56
FWW 6.5 12.89 904 6.5 123.5 2357 1500 247
Analysis performed by Michigan State University Soil and Plant Nutrient Laboratory.
FWH- food waste hot compost, FWW – food waste vermicompost, Trans D – nutrient
enriched straw and hay compost, Trans W – straw and hay compost, Yard T – yard waste
and manure compost, Yard G – yard waste compost

56
Table 2.4. Total Nutrient Analysis of Composts
% N % P % K % Ca % Mg
Yard G 1.76 0.23 0.78 4.76 0.94
Yard T 1.4 0.13 0.34 4.66 0.9
Trans W 1.04 0.06 0.4 3.56 1.14
Trans D 1.99 0.08 0.72 3.44 0.99
FWH 1.6 0.15 0.59 2.11 0.74
FWW 1.48 0.24 0.78 3.23 0.85
Analysis performed by Michigan State University Soil and Plant Nutrient Laboratory.
FWH- food waste hot compost, FWW – food waste vermicompost, Trans D – nutrient
enriched straw and hay compost, Trans W – straw and hay compost, Yard T – yard waste
and manure compost, Yard G – yard waste compost

57
Table 2.5. Effect of Compost Selection on Plant Biomass
Basil Sedge Sedum
Wet
Harvest Root
Ұ Shoot Root Shoot
Yard G 46.33 d 64.46 ab 90.87 b 14.04 b 74.66 ab
Yard T 51.00 cd 72.79 ab 114.76 ab 20.80 b 52.27 bc
Trans W 74.33 bc 60.40 b 82.03 b 18.32 b 40.46 c
Trans D 138.67 ab 102.77 ab 149.66 a 19.79 b 46.59 c
FWH 156.67 ab 128.82 a 156.08 a 37.49 a 94.82 a
FWW 194.00 a 124.15 ab 139.96 a 21.61 b 76.75 a
Masses are reported as grams per experimental unit. The edible portions of basil shoots
were harvested perpetually. Reported masses for basil represent the cumulative wet mass
of fresh shoots. Reported masses of bristleleaf sedge and sedum represent dry masses.
Values in the same column sharing a letter were found to be statistically similar using
Fischer’s LSD at α=0.05.
ҰANOVA result for sedge root mass was not significant (F5,12=1.95, p=.1588)
FWH- food waste hot compost, FWW – food waste vermicompost, Trans D – nutrient
enriched straw and hay compost, Trans W – straw and hay compost, Yard T – yard waste
and manure compost, Yard G – yard waste compost

58
Table 2.6. Effect of Compost Selection on Plant Growth Rates
Compost Type Basil SedgeҰ Sedum
Ұ
1.64 bc 1.57 b 0.23 ab
Yard G 1.45 c 2.02 ab 0.22 ab
Yard T 3.25 ab 2.24 a 0.23 ab
Trans W 1.50 c 1.95 ab 0.16 b
Trans D 3.96 a 2.30 a 0.31 a
FWH 3.54 a 1.98 ab 0.28 a
FWW 1.64 bc 1.57 b 0.23 ab
Plant dimensions were taken every 2 weeks over a 98-day period. Values are reported as
the change in plant volume (cm3·day
-1) on a per tray basis. Values in the same column
sharing a letter were found to be statistically similar using Fischer’s LSD at α=0.05.
ҰANOVA results for Sedge (F5,12=1.61, p=.2303) and Sedum (F5,12=2.10, p=.1356) were
not significant
FWH- food waste hot compost, FWW – food waste vermicompost, Trans D – nutrient
enriched straw and hay compost, Trans W – straw and hay compost, Yard T – yard waste
and manure compost, Yard G – yard waste compost
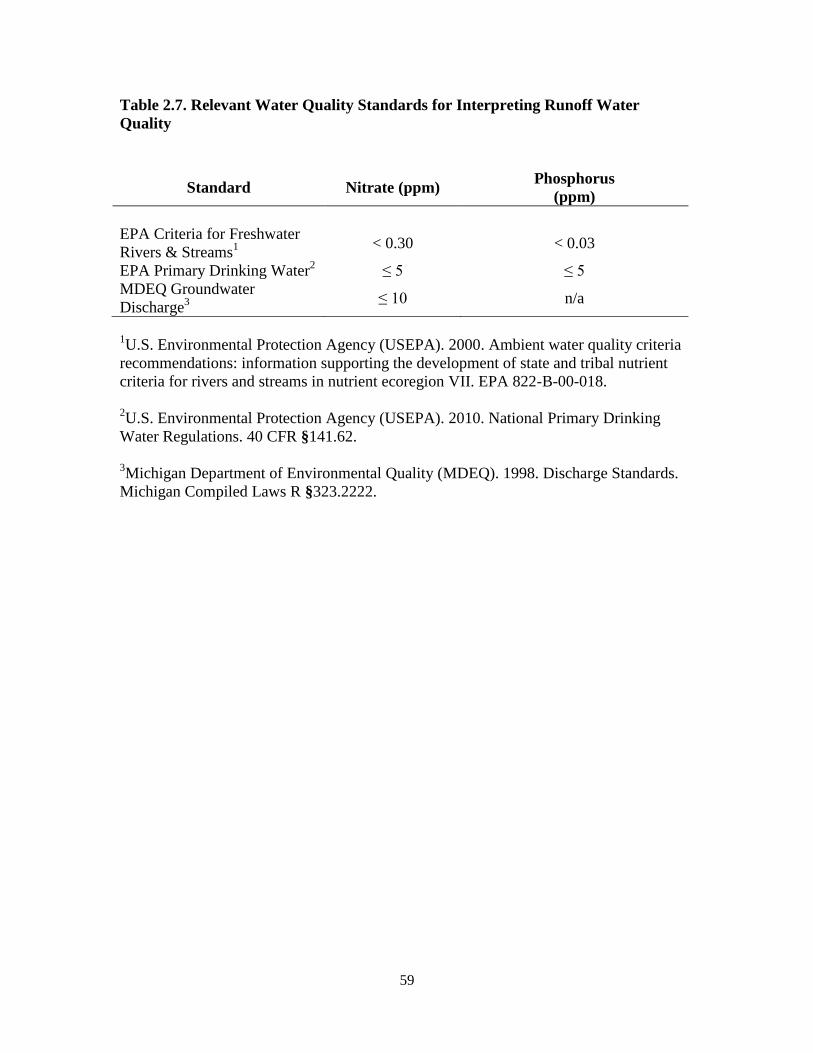
59
Table 2.7. Relevant Water Quality Standards for Interpreting Runoff Water
Quality
Standard Nitrate (ppm) Phosphorus
(ppm)
EPA Criteria for Freshwater
Rivers & Streams1 < 0.30 < 0.03
EPA Primary Drinking Water2
≤ 5 ≤ 5
MDEQ Groundwater
Discharge3 ≤ 10 n/a
1U.S. Environmental Protection Agency (USEPA). 2000. Ambient water quality criteria
recommendations: information supporting the development of state and tribal nutrient
criteria for rivers and streams in nutrient ecoregion VII. EPA 822-B-00-018.
2U.S. Environmental Protection Agency (USEPA). 2010. National Primary Drinking
Water Regulations. 40 CFR §141.62.
3Michigan Department of Environmental Quality (MDEQ). 1998. Discharge Standards.
Michigan Compiled Laws R §323.2222.

60
Figure 2.1. Experimental Setup for Determination of Saturated Flow
Saturated Hydraulic Conductivity was determined by establishing a constant head by
adjusting the height of a reservoir above substrate samples placed inside a metal core and
noting the time required to collect a fixed quantity of runoff.

61
Figure 2.2. Interaction of Plant and Compost Type with regards to Shoot Biomass
and Plant Growth Rate
Shoot biomass and the rate of change in plant volume (growth rate) were normalized by
dividing each value within a given plant type by the largest value within that plant type.
Normalizing in this way scaled all values to a range between 0 and 1.
FWH- food waste hot compost, FWW – food waste vermicompost, Trans D – nutrient
enriched straw and hay compost, Trans W – straw and hay compost, Yard T – yard waste
and manure compost, Yard G – yard waste compost
0
0.1
0.2
0.3
0.4
0.5
0.6
0.7
0.8
0.9
1
FWH FWW Trans D Trans W Yard G Yard T
No
rma
lize
d S
ho
ot
Bio
ma
ss
0
0.2
0.4
0.6
0.8
1
FWH FWW Trans D Trans W Yard G Yard T
No
rma
lize
d G
row
th R
ate
Basil Sedge Sedum

62
Figure 2.3 Influence of Plant Type on Runoff Water Quality
Marginal means for nitrate and phosphorus concentrations across all compost types were
transformed using a natural function [ln( marginal mean+1)]. Data are presented as
natural log transformations in order to account for the large difference between day 21
and day 165 and allow all measurement points to be presented using a single scale.
0
2
4
6
8
10
12
14
21 93 165
Na
tura
l L
og
NO
3 (
pp
m)
Day
0
0.2
0.4
0.6
0.8
1
1.2
21 93 165
Na
tura
l L
og
P (
pp
m)
Day
Basil Sedge Sedum

63
Figure 2.4. Change in Runoff Water Quality over Time
Marginal means for nitrate and phosphorus concentrations across all plant types were
transformed using a natural function [ln( marginal mean+1)]. Data are presented as
natural log transformations in order to account for the large difference between day 21
and day 165 and allow all measurement points to be presented using a single scale.
FWH- food waste hot compost, FWW – food waste vermicompost, Trans D – nutrient
enriched straw and hay compost, Trans W – straw and hay compost, Yard T – yard waste
and manure compost, Yard G – yard waste compost
0
1
2
3
4
5
6
7
FWH FWW Trans D Trans W Yard G Yard T
Na
tura
l L
og
Nit
rate
(p
pm
)
0
0.5
1
1.5
2
2.5
FWH FWW Trans D Trans W Yard G Yard T
Na
tura
l L
og
P (
pp
m)
Day 21 Day 93 Day 165

64
Figure 2.5. Nutrient Concentrations in Runoff Water from Green Roof Substrates Prepared with Different Composts
FWH- food waste hot compost, FWW – food waste vermicompost, Trans D – nutrient enriched straw and hay compost, Trans W –
straw and hay compost, Yard T – yard waste and manure compost, Yard G – yard waste compost
0
100
200
300
400
500
600
Basil
0
100
200
300
400
500
600
0
100
200
300
400
500
600
0
1
2
3
4
5
6
7
0
1
2
3
4
5
6
7
8
0
1
2
3
4
5
6
7
8
NO
3 p
er t
ray
(p
pm
)
P p
er t
ra
y (
pp
m)
Day 21 Day 93 Day 165
Sedge Sedum

65
LITERATURE CITED

66
LITERATURE CITED
Albanell, E., Plaixats, J., and Cabrero, T. 1988. Chemical changes during vermicomposting
(Eisenia fetida) of sheep manure mixed with cotton industrial wastes. Biology and Fertility
of Soils 6(3): 266-269.
Amlinger, F., Gotz, B., Dreher, P., Geszti, J., and Weissteiner, C. 2003. Nitrogen in
biowaste and yard waste compost: dynamics of mobilisation and availability-a review.
European Journal of Soil Biology 39: 107-116.
Ampim, P., Sloan, J., Cabrera, R., Harp, D., Jaber, F. 2010. Green roof growing substrates:
types, ingredients, composition, and properties. Journal of Environmental Horticulture 28(4):
244-252.
Atiyeh, R.M,, Subler, S., Ewards, C.A., Bachman G., Metzger, J.D., and Shuster, W. 2000.
Effects of vermicompost and compost on plant growth in horticultural container media and soil.
Pedo biologia 44: 579-590.
Beattie, D. and Berghage, R. 2004. Green roof media characteristics: The basics. In Proc. of 2nd
North American Green Roof Conference: Greening Rooftops for Sustainable Communities,
Portland, OR.
Berndtsson, J., Bengtsson, L., and Jinno, K. 2009. Runoff water quality from intensive and
extensive vegetated roofs. Ecological Engineering 35: 369-380.
Berndtsson, J. 2010. Green roof performance towards management of runoff water quantity and
quality: a review. Ecological Engineering. 36: 351-360.
Bertoldi, M., Vallini, G., and Pera, A. 1983. The biology of composting: a review. Waste
Management & Research 1: 157-176.
Brodie, H.L., Carr, L.E., and Condon, P. 2000. A comparison of static pile and turned windrow
methods for poultry litter compost production. Compost Science & Utilization 8(3): 178-189.
Cabrera, M.L., Kissel, D.E., and Vigil, M.F. 2005. Nitrogen mineralization from organic
residues: research opportunities. Journal of Environmental Quality 34(1): 75-79.
Campitelli, P. and Ceppi, S. 2009. Chemical, physical, and biological compost and
vermicompost characterization: and chemometric study. Chemometrics and Intelligent
Laboratory Systems 90: 64-71.
Carter, T. and Keeler, A. 2008. Life-cycle cost-benefit analysis of extensive vegetated roof
systems. Journal of Environmental Management 87: 350-363.

67
Castleton, H.F., Stovin, V., Beck, S.B.M., and Davison, J.B. 2010. Green roofs: building energy
savings and the potential for retrofit. Energy and Buildings. 42: 1582-1591.
Cooperband, L.R., Stone, A.G., Fryda, M.R., and Ravet, J.L. 2003. Relating compost measures
of stability and maturity to plant growth. Compost Science & Utilization 11(2): 113-124.
Dane, J.H. 2002. Methods of Soil Analysis. Part 4. Physical Methods. Soil Society of America.
Dunnett, N., Nagase, A., Hallam, A. 2008. The dynamics of planted and colonizing species on a
green roof over six growing seasons 2001-2006: influence of substrate depth. Urban Ecosystems
11: 373-384.
Forschungsgesellschaft Landschaftsentwicklung Landschaftsbau (FLL) (Society of Landscape
Development and Landscape Design). 2008. Guidelines for the planning, execution and upkeep
of green-roof sites. Forschungsgesellschaft Landschaftsentwicklung Landschaftsbau, Bonn,
Germany.
Getter, K.L., and Rowe, D.B. 2006. The role of green roofs in sustainable development. Hort
Science 41(5): 1276-1285.
Hathaway, A.M., Hunt, W.F., and Jennings, G.D. 2008. A field study of green roof hydrologic
and water quality performance. Transactions of the ASABE 51(1): 37-44.
Havlin, J., Tisdale, S., Nelson, W., and Beaton, J. 2005. Soil fertility and fertilizers (7th ed.).
Upper Saddle River, N.J.: Pearson Prentice Hall.
Jenkinson, D. and Ladd, J. 1981. Microbial biomass in soil: measurement and turnover. Soil
biochemistry: 415-471.
Jörg Breuning & Green Roof Service, LLC. 2015. Retrieved on 1/20/2015 from:
http://www.greenrooftechnology.com/green-roofs-explained#roof-last-green-roof
Klock-Moore, K. 2000. Comparison of salvia growth in seaweed compost and biosolids
compost. Compost Science & Utilization 8(1): 24-28.
Liu, K., and Baskaran, B. 2003. Thermal performance of green roofs through field evaluation.
In: Proceedings for the First North American Green Roof Infrastructure Conference, Awards and
Trade Show, Chicago, IL., May 29-30, 2003, pp. 1-10.
Lutzow, M., Kogel-Knabner, I., Ekschmitt, K., Matzner, E., Guggenberger, G., Marschner, B.,
and Flessa, H. 2006. Stabilization of organic matter in temperate soils: mechanisms and their
relevance under different soil conditions – a review. European Journal of Soil Science 57: 426-
445.
Matthews, G.P., Laudone, G.M., Gregory A.S., Bird, N.R.A., Matthews, A.G. de G., and
Whalley, W.R. 2010. Measurement and simulation of the effect of compaction of the pore

68
structure and saturated hydraulic conductivity of grassland and arable soil. Water Resources
Research 46. doi:10.1029/2009WR007720
Michigan Department of Environmental Quality (MDEQ). 1998. Discharge Standards. Michigan
Compiled Laws R §323.2222.
Nadian, H., Smith S.E., Alston, A.M., and Murray, R.S. 1997. Effects of soil compaction on
plant growth, phosphorus uptake and morphological characteristics of vesicular-arbuscular
mycorrhizal colonization of Trifolium subterraneum. New Phytology 135: 303-311.
Nagase, A. and Dunnett, N. 2011. The relationship between percentage of organic matter in
substrate and plant growth in extensive green roofs. Landscape and Urban Planning 103: 230-
236.
Newton, L., Watson, D., Dove, R., Sheppard, C., and Burtle, G. 2005. Using the black soldier
fly, hermetia illucens, as a value-added tool for the management of swine manure. In: Report for
Mike Williams, Director of the Animal and Poultry Waste Management Center, North Carolina
State University, Raleigh, North Carolina. Agreements Between the NC Attorney General,
Smithfield Foods, and Premium Standard Farms, and Frontline Farmers.
Olszewski, M., Holmes, M., and Young, C. 2010. Assessment of physical properties and
stonecrop growth in green roof substrates amended with compost and hydrogel. Hort Technology
20(2): 438-444.
Peri, G., Traverso, M., Finkbeiner, M., and Rizzo, G. 2012. Embedding “substrate” in an
environmental assessment of green roofs life cycle; evidences from an application to the whole
chain in a Mediterranean site. Journal of Cleaner Production 35:274-287.
Pullicino, D., Erriquens, F., and Gigliotti, G. 2007. Changes in the chemical characteristics of
water-extractable organic matter during composting and their influence on compost stability and
maturity. Bioresource Technology 98: 1822-1831.
Rowe, D.B. 2011. Green roofs as a means of pollution abatement. Environmental Pollution
159(8-9):2100-2110.
Rowe, B., Monterusso, M., and Rugh, C. 2006. Assessment of heat-expanded slate and fertility
requirements in green roof substrates. Hort Technology 16(3): 471-477.
Saiz, S., et al. 2006. Comparative life cycle assessment of standard and green roofs.
Environmental Science and Technology 40:4312-4316.
Sánchez-Monedero, M.A., Roig, A., Paredes, C., Bernal, M.P. 2001. Nitrogen transformation
during organic waste composting by the Rutgers system and its effect on pH, EC, and maturity of
the composting mixtures. Bioresource Technology 78: 301-308.
Slaton, M., Hunt Jr., E., and Smith, W. 2001. Estimating near-infrared leaf reflectance from leaf
structural characteristics. American Journal of Botany 88(2): 278-284.

69
Takakura, T., Kitade, S., and Goto, E. 2000. Cooling effect of greenery cover over a building.
Energy and Buildings 31: 1-6.
Tiquia, S.M., Richard T.L., and Honeyman, M.S. 2002. Carbon, nutrient, and mass loss during
composting. Nutrient Cycling in Agroecosystems 62: 15-24.
Toland, D.C., Haggard, B.E., and Boyer, M.E. 2012. Evaluation of nutrient concentrations in
runoff water from green roofs, conventional roofs, and urban streams. Transactions of the
ASABE 55(1): 99-106.
Tognetti, C., Laos, F., Mazzarino, M.J., and Hernandez, M.T. 2005. Composting vs.
vermicomposting: a comparison of end product quality. Compost Science & Utilization 13(1): 6-
13.
Tuomela, M., Vikman, M., Hatakka, A., and Itavaara, M. 2000. Biodegradation of lignin in a
compost environment: a review. Bioresource Technology 72: 169-183.
U.S. Environmental Protection Agency (USEPA). 2000. Ambient water quality criteria
recommendations: information supporting the development of state and tribal nutrient criteria for
rivers and streams in nutrient ecoregion VII. EPA 822-B-00-018.
U.S. Environmental Protection Agency (USEPA). 2010. National Primary Drinking Water
Regulations. 40 CFR §141.62.
VanWoert, N., Rowe, B., Andresen, J., Rugh, C., Fernandez, T., and Xiao, L. 2005. Green roof
storm water retention: effects of roof surface, slope, and media depth. Journal of Environmental
Quality 34:1036-1044.
Vijayaraghavan, K., Joshi, U.M., and Balasubramanian, R. 2012. A field study to evaluate runoff
quality from green roofs. Water Research 46: 1337-1345.
Whittinghill, L., Rowe, B., and Cregg, B. 2013. Evaluation of vegetable production on extensive
green roofs. Agroecology and Sustainable Food Systems 37(4): 465-484.
Woolley, J. 1971. Reflectance and transmittance of light by leaves. Plant Physiology 47: 656-
662.

70
Chapter 3:
The Suitability of Crushed Porcelain and Foamed Glass as Alternatives to Expanded Aggregates
in Green Roof Substrates in terms of Plant Growth and Thermal Regulation
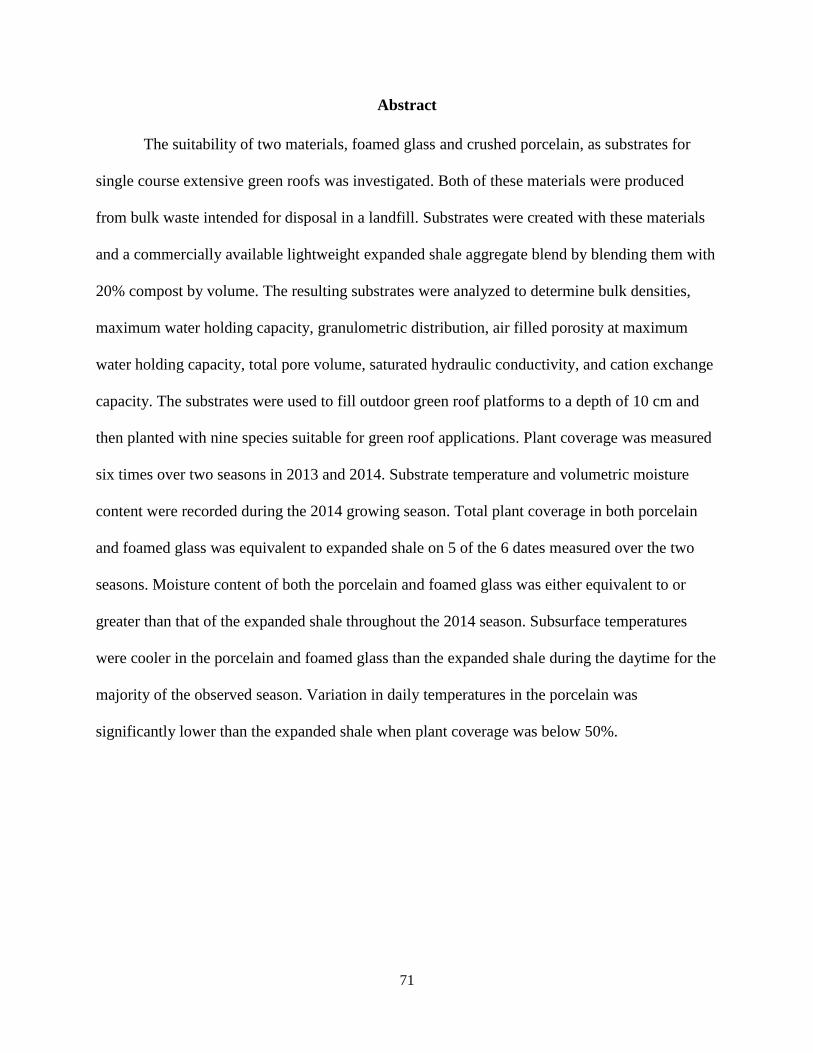
71
Abstract
The suitability of two materials, foamed glass and crushed porcelain, as substrates for
single course extensive green roofs was investigated. Both of these materials were produced
from bulk waste intended for disposal in a landfill. Substrates were created with these materials
and a commercially available lightweight expanded shale aggregate blend by blending them with
20% compost by volume. The resulting substrates were analyzed to determine bulk densities,
maximum water holding capacity, granulometric distribution, air filled porosity at maximum
water holding capacity, total pore volume, saturated hydraulic conductivity, and cation exchange
capacity. The substrates were used to fill outdoor green roof platforms to a depth of 10 cm and
then planted with nine species suitable for green roof applications. Plant coverage was measured
six times over two seasons in 2013 and 2014. Substrate temperature and volumetric moisture
content were recorded during the 2014 growing season. Total plant coverage in both porcelain
and foamed glass was equivalent to expanded shale on 5 of the 6 dates measured over the two
seasons. Moisture content of both the porcelain and foamed glass was either equivalent to or
greater than that of the expanded shale throughout the 2014 season. Subsurface temperatures
were cooler in the porcelain and foamed glass than the expanded shale during the daytime for the
majority of the observed season. Variation in daily temperatures in the porcelain was
significantly lower than the expanded shale when plant coverage was below 50%.

72
Introduction
Extensive green roofs are often promoted as sustainable and environmentally friendly
technologies. This claim is supported by a long list of ecosystem system services that are
provided by green roof installations (Oberndorfer et al., 2007; Rowe, 2011). Green roofs provide
a means to restore vegetative cover that has been removed by urban construction. Ground cover
plays an important role in natural ecosystems including the provision of refuge for wildlife,
absorption of storm waterstormwater, mitigation of solar radiation, maintenance of local air
quality, and the sequestration of atmospheric carbon in plant biomass and soil organic matter.
The impact of the loss of ground cover in urban environments has been well documented through
studies of urban wildlife populations (McKinney 2008; Chace and Walsh 2006), watershed
management (Brabec et al. 2002; Tsihrintzis 1997), air quality (Beckett 1998), and the heat
island effect (Arnfield 2003). It has been observed that green roofs are able to restore, at least in
part, some of the services originally provided by the native ground cover (Getter and Rowe 2006;
Oberndorfer 2007; Berndtsson 2010).
Extensive green roofs must overcome significant engineering challenges in order to
function effectively over their expected service life, which has been estimated to be between 40
and 50 years (Jörg Breuning & Green Roof Service, LLC 2015). Foremost, a green roof must
provide a suitable habitat for the vegetative cover. This means the substrate must be able to
retain available water and nutrients, as well as provide a pore network to allow for root growth
and oxygen exchange. However, a substrate must also provide sufficient drainage to avoid water
logging of the often shallow (5 to 20 cm) substrate profile. Furthermore, a green roof is subject
to functional considerations such as controlling the quality of runoff water and preventing
clogging of the pore network and drainage system. Traditionally, the green roof industry has

73
utilized lightweight expanded aggregates made from heat-expanded slate, shale, and clay or
volcanic rocks like pumice as a solution (Rowe et al., 2006). Expanded aggregates are non-
compacting, drain rapidly, and have lower bulk densities than traditional planting substrates.
Some roofs also include a drainage layer made from dimpled plastic or polymer-based materials
that are placed beneath the substrate layer. A fabric mat made from synthetic fibers is often
included above a drainage layer.
Given the large and diverse body of work showing that green roofs play a positive role in
the development of urban areas, it is easy to assume that they are an inherently “green”
technology. However, it is important to recognize that these benefits are experienced after the
installation of the roof. In order to truly understand the sustainability of green roofs, we must
also consider the environmental and economic impact of their construction. There have been
several attempts to perform a “lifecycle analysis” of extensive green roofs (Carter and Keeler
2008; Saiz et al. 2006; Kosareo and Ries 2007; Peri et al. 2012; Chenani et al. 2015). The most
thorough evaluations were seen in the works of Peri et al. (2007) and Chenani et al. (2015). Peri
et al. performed an LCA on an existing extensive green roof near Sicily, Italy with a growing
medium composed of volcanic materials and expanded perlite. They found that the production of
materials accounted for 64% of the crude oil consumed throughout the lifecycle of the green
roof, with a significant portion of that consumption attributed to the creation of the expanded
perlite and the transportation of non-local materials. Of the eight categories of environmental
impact listed in their study, construction was the largest contributor to Abiotic Depletion
Potential (extraction of natural resources), Acidification Potential (production of acidifying
pollutants like sulfur containing gases), and Global Warming Potential (release of carbon
dioxide, nitrous oxide, and methane gas). Together, these three categories represented 80.5% of

74
the calculated environmental impact over the course of the green roof life cycle. Chanani et al.
based their study on a modelled extensive green roof located in Chicago, IL. They compared
multiple substrate compositions. Their results showed that expanded clay was the major
contributor of environmental impact when included in a substrate, even at low rates (10%). They
recommended finding alternatives to energy and resource intensive substrates.
Getter et al. (2009) examined the carbon budget of a sedum green roof with a 6 cm deep
substrate consisting of heat-expanded slate as the base component of the substrate. The carbon
released as a result of constructing the green roof was greater than the potential net carbon that
could be sequestered over the lifetime of the green roof. The heat expanded slate accounted for
87% of the released carbon. It was estimated that the unfavorable carbon balance would be offset
as a result of reduced building energy use attributable to the green roof after nine years. In a
follow up study, Whittinghill et al (2014) found that increasing substrate depth and growing
plants with greater biomass could reduce the carbon payback period to less than three years,
though this would increase the total embodied energy in the substrate due to its greater depth.
It is clear that the most significant way in which to reduce the environmental impact and
embodied energy of green roof construction is to identify suitable replacements for the heat
expanded aggregates and petroleum polymer based drainage layers currently in use. Several
studies conducted in the past ten years have addressed this issue. Crushed brick from demolished
buildings is commonly encountered as an alternative green roof substrate in the United Kingdom
and has been the subject of several studies (Graceson et al. 2014; Bates et al. 2015; Molineaux et
al. 2009; Young et al. 2014). Other alternatives that have received attention include naturally
sourced materials like crushed shells and coco coir (Steinfeld and Del Porto 2008), and recycled
aggregates like crushed tile (Graceson et al. 2014), bottom ash from incinerators (Graceson et al.

75
2014; Molineaux et al. 2009), recycled rubber (Pérez 2012; Steinfeld and Del Porto 2008), and
recycled aerated concrete (Bisceglie et al., 2014). Results from these studies are difficult to
compare directly due to variations in the response variables that were measured and the physical
properties of the materials under investigation. However, some of these studies show that it is
possible to achieve results similar to those observed in a traditionally constructed green roof
using alternative materials.
Therefore, the objective of this study was to determine how the use of two potential
replacements for expanded shale, crushed porcelain and foamed glass, would affect the
functionality of a green roof. We monitored three parameters as indicators of functionality: plant
coverage, substrate moisture, and substrate temperature. The study was conducted outdoors to
observe how the substrates were effected by natural variability.
Materials and Methods
Experimental Setup: The study was conducted on divided roof platforms at the
Michigan State University Horticulture Teaching and Research Center (Holt, MI). Platforms
were set at a 2% grade with the top edge of each platform elevated approximately 1.4 m from
ground level and were oriented with the low end of the slope toward the south to maximize sun
exposure. Roof platforms measured 2.4 m x 2.4 m and were divided into three 0.8 x 2.4 m
sections containing a XeroFlor XF-105 drainage mat (XeroFlor America, Durham, NC). Each
section was filled to a depth of 10 cm with one of three substrates in a randomized complete
block experimental design. The base material for each substrate consisted of either recycled
foamed glass (Growstone GS-2 Soil Aerator, Growstone LLC, Albuquerque, New Mexico),
recycled crushed porcelain (Michigan State University Surplus Store and Recycling Center, East
Lansing, MI), or heat-expanded shale (Haydite, Hydraulic Press Company, Brooklyn, IN). The

76
foamed glass and crushed porcelain were blended with 20% by volume of municipal solid waste
compost (Granger, Lansing, MI) to produce these substrates. The heat-expanded shale substrate
was composed of a mixture of 30% Haydite A, 30% Haydite B, and 40% 2NS sand (Hammond
Farms, East Lansing, MI), which was then blended with the 20% compost as above. The shale
substrate is commercially available, is often used on green roofs, and served as the control in the
study (Table 3.1).
Substrate blends were submitted to the Pennsylvania State University Agricultural
Analytical Services Laboratory to determine particle size distribution, dry weight density,
maximum water holding capacity, density at maximum water-holding capacity, total porosity,
air-filled porosity at maximum water-holding capacity, saturated hydraulic conductivity, pH,
total soluble salts (EC), organic matter content, and cation exchange capacity (Table 3.2, Figure
3.1).
Within the platforms, nine plant species were cultivated to evaluate the effect of substrate
type on plant coverage, growth, survival, and substrate temperature and moisture. Species
included Alllium cernuum (nodding onion), Allium senescens (ornamental onion), Sedum acre
(goldmoss stonecrop), Sedum album (white stonecrop), Sedum kamtschaticum (Russian
stonecrop), Coreopsis lanceolata (Lancefeaf Coreopsis), Monarda punctata (Horsemint),
Tradescantia ohiensis (Spiderwort), and Koeleria macrantha (June grass). The Allium and
Sedum spp. were planted from plugs (116.3 cm3, 38/flat) supplied by Hortech, Inc. (Spring Lake,
MI) and the study contained 108 plugs of each taxa. The Coreopsis, Monarda, Tradescantia, and
Koeleria spp. plugs (150.8 cm3, 38/flat) were all Michigan natives and were supplied by
Wildtype Nursery, Inc. (Mason, MI). Three plugs of each species were randomly planted within
three rows of nine plants on 34 cm centers with 20 cm row spacing for a total of 27 plants per
77
section. Each plot was replicated three times. All plugs were planted on June 14, 2013. A wide
range of species were selected to provide an indication of how plants with varying growth
requirements responded to different substrate blends.
Long term fertility was provided by applying the lowest recommended amount, 1.8 kg
per m2, of a slow release complete fertilizer (Nutricote 13-13-13 Type 180 Total with Minor
Nutrients, The Scotts Company, Marysville, OH) at the time of planting. In addition to natural
rainfall, supplemental irrigation was provided to the roof platforms by an automatic irrigation
system through a series of overhead sprinklers during the 2013 growing season to help plant
establishment. Plots were irrigated two times per week for 15 min during the growing season
which amounted to 2.4 L per section per irrigation event. No supplemental irrigation was
provided during the 2014 growing season so plants had to rely solely on natural rainfall.
Data Collection. A point frame transect was used multiple times each season to quantify
plant development, coverage, and changes in plant community (Waite, 2000). The point frame
consisted of perpendicular strings that formed a grid of 7.5 x 7.5 cm cells. The frame was
positioned directly above each section while making measurements. A steel rod was placed
vertically at each measuring point where the strings crossed and the species in contact with the
rod were recorded. When no plant material was present, the grid intersection was recorded as
being “bare.” Absolute cover (AC) was then calculated for each species as the total number of
contacts recorded divided by the number of data collection points for each section. Weed species
were removed at each of the recording sessions.
Substrate moisture and temperature were monitored during the 2014 growing season. A
single Type T Thermocouple and CS616 Water Content Reflectometer were placed in the center
of each platform section at a depth of 5 cm. Measurements were taken on an hourly basis from

78
May 20 through October 1 and were continuously recorded on a CR1000 Campbell Scientific
Datalogger (Campbell Scientific Inc., Logan, UT).
Statistical Analysis: Absolute plant coverage was analyzed both in terms of individual
species and in aggregate (total coverage). Significance differences in mean values from the
foamed glass and porcelain substrates were compared against the expanded shale control using
single tailed Dunnett’s Tests with α = 0.10. The Minimum Significant Difference (MSD) is
reported along with the observed difference in means.
Substrate moisture and temperature values were analyzed using a repeated measures
model with a spatial power covariance structure. Degrees of freedom and standard errors were
calculated using the Kenward-Roger Method. Least-squared means were calculated for each
week. Comparisons of the alternative substrate weekly means against those of the expanded
shale control were performed using single tailed Dunnett’s Tests.
Temperature amplitudes were calculated by subtracting the lowest mean temperature
from the highest mean temperature recorded for each day. Comparisons of the seasonal
distributions of amplitude between the alternative substrates and the expanded shale control were
made using the nonparametric Dwass, Steel, Critchlow-Fligner Method.
Results
Substrate Physical Properties: The Society of Landscape Development and Landscape
Design (FLL) is an organization in Germany that publishes guidelines for green roof
construction (FLL 2008). The FLL guidelines are widely recognized and are used here to provide
context in discussing the physical properties of the foamed glass and crushed porcelain substrates
(Table 3.2). The foamed glass substrate met all of the relevant FLL guidelines, with the
exception of saturated hydraulic conductivity which was 0.04 cm·s-1
greater than the

79
recommended range. The dry and wet bulk densities of the foamed glass substrate were 0.96 and
1.12 g∙cm-3
less than the expanded shale, respectively. The cation exchange capacity of the
foamed glass substrate was also 5 times greater (24.95 cmol·kg-1
) than the expanded shale
substrate. In terms of air-filled porosity, the foamed glass substrate was 49.5 % Vol greater than
the expanded shale. The water holding capacity of the porcelain substrate was 7.1 % Vol below
the FLL guidelines and the saturated hydraulic conductivity was 0.05 cm·s-1
greater than
recommended. The air-filled porosity of the expanded shale substrate was 7.1 % Vol below the
FLL guideline. The expanded shale substrate had an even distribution of particle sizes
approximating the range recommended by the FLL. The porcelain and foamed glass substrates
had much greater percentages of their total mass as large particles than recommended by the
FLL. Approximately 50% of the porcelain and 40% of the foamed glass mass occurred in
particles greater than 12.5 mm (Figure 3.1).
Plant Coverage: Total absolute coverage was equivalent between substrates for all but
one date (Figure 3.2). On May 2014, AC in the expanded shale substrate was 0.297 m3·m
-3
greater than the porcelain and 0.522 m3·m
-3 greater than the foamed glass (dF=6, CV=1.817,
MSD=0.192).
Allium cernuum: There were no statistical differences in coverage during the first season.
No living plants were visible during the first two measurements in 2014. By July 2014, coverage
in the foamed glass substrate was only 0.004 m3·m
-3, which was representative of only a single
surviving plant. Coverage in the expanded shale was limited to a few small plants equating to
0.061 m3·m
-3. The high variance on this date resulted in this difference being considered non-
significant (dF=6, CV=1.817, MSD=0.085).

80
Allium senescens: Coverage was less than 0.050 m3·m
-3 for all three substrates in April
2014 and no living plants were visible in the foamed glass treatment afterwards. Coverage in the
porcelain substrate was only 0.004 m3·m
-3 in May 2014 and 0.023 m
3·m
-3 in July 2014. These
were 0.050 m3·m
-3 (dF=6, CV=1.817, MSD=0.053) and 0.103 m
3·m
-3 (dF=6, CV=1.817,
MSD=0.103) less than the expanded shale, respectively. Coverage in the porcelain substrate was
statistically equivalent to expanded shale at that time.
Sedum: Coverage of Sedum acre was equivalent in all substrates for both seasons with
the exception of the August 2013 observation in which coverage was 0.023 m3·m
-3 greater in the
foamed glass (dF=6. CV=1.817, MSD=0.011) and 0.017 m3·m
-3 greater in the porcelain (dF=6,
CV=1.817, MSD=0.011) than the expanded shale. No significant differences were seen in either
season for Sedum album or Sedum kamtshaticum.
Trandescantia ohiensis: Coverage was equivalent in both seasons for all measurements
except for July 2014. Growth in the second season was barely detectable until July, at which
point coverage in the foamed glass treatment was 0.1944 m3·m
-3 greater than the expanded shale
(dF=6, CV=1.817, MSD=0.096). Coverage in the porcelain and expanded shale substrates was
equivalent.
Coreopsis lanceolata: Coverage was equivalent in all three substrates during the first
season. However, no plants survived into the second season in any of the substrates.
Koelaria macrantha: Coverage in the expanded shale treatment was 0.090 m3·m
-3 greater
in August 2013 (dF=6, CV=1.817, MSD=0.028) and 0.140 m3·m
-3 greater in September 2013
(dF=6, CV=1.817, MSD=0.097) than porcelain. Coverage was 0.040 m3·m
-3 greater in the
expanded shale than foamed glass in August 2013 (dF=6, CV=1.817, MSD=0.028) and 0.120
greater in September 2013 (dF=6, CV=1.817, MSD=0.097). Koelaria macrantha struggled in the

81
second season and ultimately died off in the expanded shale and porcelain treatments. Survival in
the foamed glass treatment was marginal, with coverage of only 0.017 m3·m
-3 in July 2014.
Monarda punctatum: Compared to porcelain, coverage in the expanded shale substrate
was 0.127 m3·m
-3 greater on August 2013 (dF=6, CV=1,817, MSD=0.072), 0.190 m
3·m
-3 greater
on September 2013 (dF=6, CV=1.817, MSD= 0.079), 0.123 m3·m
-3 greater on May 2014 (dF=6,
CV=1.817, MSD= 0.063). This trend also followed for foamed glass with expanded shale
coverage being 0.147 m3·m
-3 greater on August 2013 (dF=6, CV=1,817, MSD=0.072), 0.157
greater m3·m
-3 on September 2013 (dF=6, CV=1.817, MSD= 0.079), and 0.177 m
3·m
-3 greater
on May 2014 (dF=6, CV=1.817, MSD= 0.063). In July 2014, coverage in all three substrates was
statistically equivalent and exceeded 0.500 m3·m
-3.
Volumetric Moisture Content: Throughout the 2014 season, moisture content in the
porcelain ranged from 0.05 ml·cm-3
lower to 0.16 ml·cm-3
higher than the expanded shale
control. The median difference in moisture content was 0.02 ml·cm-3
. No statistically significant
differences were detected in weekly moisture content between crushed porcelain and expanded
shale at any point in the season (Table 3.3; Figure 3.4). However, mean moisture content in the
foamed glass substrate was between 0.03 to 0.40 ml·cm-3
higher than the expanded shale
substrate at every measurement point for the season. The median difference over the season was
0.15 ml·cm-3
. Statistical differences in least squared means were detectable throughout the
season. The majority of significant differences occurred between July 22 and August 8 (Table
3.3; Figure 3.4).
There was a three-week dry spell from July 16 to August 5. Moisture levels in all three
substrates dropped to the lowest values recorded in the study (Figure 3.3). During that time,
moisture levels in the foamed glass treatment were 0.04 to 0.05 ml·cm-3
greater than those in the

82
expanded shale treatment. Weekly means were statistically significant during the second and
third weeks of the dry spell (p-values between 0.04 and 0.06). There were no significant
differences observed between the porcelain and expanded shale substrates during that period.
Substrate Temperature: Over the entire 2014 season, the porcelain substrate ranged
between 2.5 °C warmer and 7.8 °C cooler than the expanded shale. The difference was most
pronounced during the middle of the summer (Figure 3.5). From July 8 to August 20, the
median daytime temperature difference was 1.42 °C cooler than the expanded shale. The
difference was 0.25 and 0.17 °C cooler during the early (May 20 to July 7) and late (August 21
to September 30) parts of the year, respectively (Figure 3.6). Nighttime temperatures ranged
from 2.4 °C warmer to 2.6 °C cooler. Median temperature differences were also smaller at night.
Early in the season, the median difference in temperatures was 0.13 °C. This increased to 0.29
°C cooler in the summer and to 0.42 °C in the late part of the season (Figure 3.7). Daytime
weekly means were significantly lower for 11 of the 19 observed weeks (Table 3.4). Only 3 of
the 19 observed weeks had statistically significant differences in nighttime temperature (Table
3.5).
Temperature differences between the foamed glass and expanded shale substrates ranged
from 7.2 °C warmer to 9.9 °C cooler, with respect to expanded shale (Figure 3.5). Despite the
wide distribution of differences over the season, median values indicate that the foamed glass
substrate remained slightly cooler during the day than the expanded shale. At the beginning of
the season, the median temperature difference was 0.64 °C cooler. This increased to 1.80 °C
cooler in the middle of summer and then dropped to 0.33 °C at the end of the season (Figure
3.6). At night, the foamed glass substrate was consistently cooler than the expanded shale with
differences ranging from 0.9 °C warmer and 7.5 °C cooler. At the beginning of the season, the

83
median difference was 1.46 °C cooler. This increased to 1.82 °C cooler in the summer and then
dropped off to 0.16 °C warmer in the late part of the season (Figure 3.7). Daytime weekly means
for foamed glass temperature were statistically different from expanded shale for 12 of the 19
observed weeks. Temperature in the foamed glass was cooler for 11 of the 12 significant weeks.
(Table 3.4). Differences in nighttime weekly means were significant for 8 of the 19 observed
weeks Foamed glass was cooler than expanded shale on all significant weeks (Table 3.5).
The variation in daily temperature (amplitude) of the porcelain substrate over the season
ranged from 2.8 to 18.1 °C, with a median daily change of 8.7 °C. This was significantly less
than the expanded shale (Z=6.652, DSCF=9.408, p<.0001). In the foamed glass substrate,
amplitude ranged from 2.6 to 32.3 °C and was lowest at the end of the season. The median
seasonal amplitude was 14.5 °C. The distribution and values of temperature amplitude within the
foamed glass substrate were very similar to those observed in the expanded shale substrate
(Z=0.864, DSCF=1.222, p=.6632) (Figure 3.8).
Discussion
Substrate Physical Properties: The physical properties of the porcelain substrate were
generally within FLL Guidelines or at least comparable to the expanded shale control. Two
discrepancies did appear in the analysis: 1) the WHC of the porcelain was 7.1% below FLL
guidelines and 32.8% below that of the expanded shale substrate; 2) the SHC was well above the
range specified by the FLL. While these differences could be seen as detrimental to the
candidacy of porcelain as an alternative green roof material, several factors need to be taken into
consideration. First, overall plant growth in the porcelain was statistically equivalent to growth in
the expanded shale for five of the six measurements. Second, VMC in the porcelain was
statistically equivalent to the expanded shale for 18 of the 19 weeks observed despite the large

84
difference in WHC. Finally, the porcelain was processed using less than ideal methods due to
practical constraints, which resulted in the presence of chunky particles much larger than would
be found if the material had been processed for commercial application. Were the porcelain to
have been ideally processed, there would have been a much greater percentage of small particles.
Increasing the mass percentage of small particles would have increased the WHC of the
substrate, possibly to within FLL Guidelines. The change in particle size distribution would also
increase the tortuosity of the pore network, resulting in a decrease in SHC. Given the results of
our less-than-ideal substrate, crushed porcelain appears to be interchangeable with green roof
substrates based on expanded aggregates.
The foamed glass substrate has several physical properties that make it an ideal candidate
for green roof applications. First, foamed glass is exceptionally lightweight. The dry bulk density
is nearly one quarter that of the expanded shale. This has significant implications for the
transportation of foamed glass as well as roof weight limitations. Substantially greater volumes
can be transported by a vehicle, which decreases the transportation costs in terms of both fiscal
economics and embodied energy. At maximum water-holding capacity, foamed glass is
approximately one-third the density of expanded shale. This allows greater substrate depths to be
employed on roofs that are already suitable for green roof installation. Increased substrate depths
have been associated with multiple benefits including increased drought and winter survivorship
(Durhman and Rowe 2007; Rowe et al., 2012). Additionally the ultralight nature of foamed glass
may permit the installation of green roofs on structures that would not have been able to support
the weight of traditional substrates.
The air filled porosity of foamed glass at maximum water holding capacity is quite high.
Given that the water holding capacity of the foamed glass substrate is well within the range

85
specified by FLL Guidelines, such a high level of aeration should provide an excellent
environment for root growth. Roots require oxygen for mitosis and many root health issues are
associated with anaerobic conditions. However, it is unclear whether all of the air-filled pore
volume is actually accessible to roots. It is possible that many pores within the foamed glass
aggregate are, in fact, closed cells that are inaccessible to both infiltrating water and adventurous
root systems.
Something that is clear, however, is that the root accessible portion of the foamed glass
aggregate has a much greater capacity for cationic plant nutrients than the expanded shale (the
CEC of foamed glass was 31.32 cmol·kg-1
compared to 6.37 cmol·kg-1 for expanded shale). The
plots in our experiment were well fertilized with a slow release, complete fertilizer. This negated
any impact that differences in nutrient holding would have on plant growth. However, it is
reasonable to suggest that over multiple seasons without addition of fertilizers, plants in a
foamed glass substrate would experience fewer nutrient-related stresses than in a typical green
roof substrate. It would also be reasonable assume that leaching of plant nutrients, at least those
that are positively charged, would be less than those observed in a typical green roof. In making
these assumptions, one must also consider that CEC is measured on a per weight basis. The
density of foamed glass is much less than expanded shale, which means that the difference in
cation exchange sites per unit of surface area of foamed glass is likely less than one would
initially conclude based solely on the reported CEC values.
Plant Coverage: Observation of plant growth in the two alternative substrates indicated
that little practical difference in total coverage existed in either substrate compared to the
expanded shale control. Of the six measurement dates, only one date revealed any statistically
significant differences. The one measurement in May 2014 was preceded by a long cold spell.

86
The temperature data showed that the expanded shale was consistently warmer than the other
two substrates. This suggests that the expanded shale microclimate accumulated more growing
degree days in the early spring, accounting for the increase in early growth relative to the other
substrates. There were several instances in which statistical and practical differences were
observed in the coverage of individual plant species between substrates. It is not surprising that
these differences occurred. There has been an extensive amount of research showing that a wide
variety of factors affect plant viability in green roof substrates (Farell, et al. 2012; Molineaux
2009; Thuring, et al. 2010). In this study plant species were selected from a variety of plant types
in anticipation of differences in plant responses to our substrates. The lack of significance in total
coverage in combination with occasionally significant differences in individual plant coverage
indicates that foamed glass and porcelain have the potential to perform adequately given proper
plant selection.
An interesting observational result from this study was that very little weed colonization
occurred in the porcelain substrate. Weeds were removed from the plots by hand on a regular
basis by the researchers and the biomass removed from the porcelain plots was always much less
than those of both the foamed glass and expanded shale plots. One possible explanation for this
is that the presence of the large, chunky particles allowed the organic matter to wash down below
the immediate surface and also prevented intimate contact with the substrate. This created a dry
microclimate on the substrate surface that was unfavorable for seed germination. Our plants were
able to grow because they were transplanted into the media and had extensive root systems that
were placed within the soil profile where access to water was not restricted.
Substrate Temperature: The extended longevity of a green roof compared to a
conventional bituminous roof is often attributed to preservation of the waterproofing membrane

87
through the interception of UV radiation and the reduction of membrane temperature fluctuations
(Teemusk and Mander 2010). The porcelain substrate had lower temperature fluctuations than
the expanded shale control from the start of the observation period in mid-May through mid-
August. Thermal amplitudes in porcelain remained fairly consistent throughout the season while
those in expanded shale steadily decreased. This window corresponds to the period in which
vegetation was not completely covering the roof platforms. Furthermore, the greatest
temperature differences between porcelain and expanded shale occurred during daylight hours
when the sun was shining, whereas little difference existed at night. It is possible that the
relatively higher albedo of the white, shiny porcelain accounts for the increased stability of
substrate temperature during periods of low vegetation in comparison to the expanded shale.
Roof tops with white or reflective coatings have been shown to have cooling efficiencies similar
to those of fully functional green roofs (Gaffin et al. 2005). A porcelain-based green roof may act
as a hybrid of the two systems, allowing for effective thermal regulation during periods of low
plant coverage such as cold snaps and droughts.
Embodied Energy and Sustainability: The porcelain and foamed glass substrates were
both produced from materials originally intended for landfill disposal. The diversion of those
materials from the waste-stream to a green roof adds at least another 50 years to their useful
service life. In addition, the use of these materials in place of an expanded aggregate avoided the
need to extract additional raw materials along with the environmental disturbance and
contamination associated with the extraction of shale, slate, and clay. The lifecycle analyses cited
in the introduction revealed that a significant percentage of the embodied energy of expanded
aggregates resulted from the kilning process required to transform the raw material into its
lightweight form. The porcelain was processed in an aggregate crushing plant to reduce the bulk

88
pieces into the small particles needed for a plant substrate. The foamed glass originated from
milled glass that was later kilned. Both of these products have energy intensive steps in their
production and thus do not necessarily address the issues associated with the high embodied
energy of green roof substrates. It is worth noting that a portion of the energy required to kiln the
foamed glass material came from the combustion of local landfill gas. This offset the impact of
foamed glass production by converting methane, a potent greenhouse gas, into the less impacting
form of carbon dioxide, and by making use of a form of “recycled” energy. The use of landfill
gases and renewable energy sources in place of conventionally derived energy could also be
applied to other green roof substrate manufacturing, including the traditional expanded
aggregates. Another significant component of the energy embodied in a substrate resulted from
the transportation of the material. Porcelain and glass are ubiquitous materials that can be
sourced locally, thus reducing the amount of energy required for transportation for processing
and delivery to the worksite.
Related Research: The only other research conducted on the use of foamed glass as a
green roof substrate was performed by Klopp and Berghage in 2012. They used a blend of
foamed glass and potting soil to fill containers to a depth of 10 cm. They transplanted sedum
plugs into these containers and grew them in a greenhouse for seven weeks. They reported 50%
to 60% coverage in after four weeks and 80%-90% coverage after seven weeks. They also
investigated the potential degradation of the foamed glass material due to freeze/thaw cycles and
determined the maximum WHC and bulk density at maximum WHC of the containers at
different slopes. Damage was only observed due to freeze/thaw cycles when the media remained
in a saturated state. WHCs and bulk densities were similar to those reported here.
89
Research on porcelain is also extremely limited. As far as the authors could find, no
literature exists that investigates porcelain in a crushed state. The most comparable material
tested was tumbled porcelain intended for use in flooring and countertop manufacture (Steinfeld
and Porto 2008). This material was limited to particle sizes of approximately ¼ inch. The authors
of this study reported a WHC of 3.3% and concluded that the material was limited in application
to an aesthetic top dressing. We cite our results as evidence that porcelain, once processed to
ensure an appropriate granulometric distribution, is not limited to aesthetic applications but is
rather an excellent candidate for green roof applications.
Conclusions
A major economic incentive for a building owner to construct a green roof is the reduction in
cooling costs resulting from evapotranspiration. A green roof must have a full plant canopy and
available water in the substrate in order to maximize the cooling effect. This study showed that
extensive green roofs substrates based on crushed porcelain and foamed glass are capable of
maintaining a plant canopy, retaining substrate moisture, and reducing subsurface temperature as
well as a substrate based on expanded shale. Total plant coverage in both porcelain and foamed
glass was equivalent to expanded shale on 5 of the 6 dates measured over the two seasons. The
one significantly different event was observed at the beginning of the growing season when
building cooling demands are low. Moisture content of both the porcelain and foamed glass was
either equivalent to or greater than that of the expanded shale throughout the 2014 season.
Subsurface temperatures were cooler in the porcelain and foamed glass than the expanded shale
during the daytime for the majority of the observed season. The temperature and moisture results
suggest that the alternative substrates in this study may actually improve the cooling capacity of
a green roof. The porcelain substrate also demonstrated the potential to function as a “white

90
roof” during periods of low plant coverage. Average substrate temperatures in the porcelain from
May 20 to June 2nd
2014, a period during which approximately half of the porcelain sections
were bare, were between 3.0 and 3.5 °C lower than the expanded shale. The temperature
differences at this time were the largest observed during the study. Furthermore, thermal
amplitude in the porcelain was significantly lower than the expanded shale at that time. The most
significant advantage offered by the foamed glass is that it is 65 to 75% lighter than expanded
shale. Utilization of foamed glass would allow green roof designers to choose between
decreasing roof mass while maintaining a standard substrate depth or increasing substrate depth
without changing overall roof mass. Both of these substrates are produced using recycled
materials, decreasing the overall consumption of natural resources resulting from the
construction of a green roof. However, both of these substrates require an energy intensive step
during their production (crushing the porcelain and kilning the foamed glass) and thus may not
significantly reduce the embodied energy associated with green roof substrates. This study did
not consider the impact of the alternate substrates on other functions of green roofs such as
stormwater management. Additional research with optimally processed versions of the substrates
in this study will be required to validate the suitability of the materials for green roof
applications.

91
APPENDIX

92
Table 3.1. Description of Substrates
Foamed glass Commercially available product manufactured by
Growstone, LLC (Albuquerque, New Mexico) often used for
hydroponic applications. Recycled glass bottles are ground
into a fine powder and the powdered glass is combined with
foaming agents and kilned in a gas furnace using a blend of
natural gas and landfill-sourced methane as a fuel source.
The gas released by the foaming agent creates a network of
micropores within the glass media. The raw product is then
cracked, crushed, and blended. This particular product line
was tested in lieu of other Growstone products at the request
of the manufacturer.
Crushed Porcelain Bulk porcelain (sinks, toilets, tile, etc) was sorted from on-
campus demolition projects at Michigan State University.
The porcelain was processed using an aggregate crushing
plant hired by MSU Landscape Services to reduce
demolished concrete to compliance with the ASTM 21AA
standard. The crushing plant was modified slightly to
generate a greater percentage of smaller particles than the
ASTM 21AA standard.
Expanded shale A blend of lightweight expanded shale aggregates and 2NS
sand produced by the Hydraulic Press Brick Company in
Brooklyn, IN specifically for use in extensive green roofs.

93
Table 3.2. Substrate Physical and Chemical Properties at the Start of the Study
Characteristic Unit
Foamed
Glass Porcelain
Expanded
shale
FLL1
Guidelines
Bulk Density
(dry weight basis) g·cm
-3 0.31 1.45 1.27 none
Bulk Density
(at Max WHC) g·cm
-3 0.60 1.56 1.72 none
Total Pore Volume % Vol 82.2 40.6 48.5 none
Maximum WHC % Vol 29.8 12.9 20.3 20-65
Air-Filled Porosity
(at Max WHC) % Vol 52.4 27.7 2.9 ≥10
Saturated Hydraulic
Conductivity cm·s
-1 >0.711 >0.723 0.170 0.1-0.67
pH 7.9 7.6 7.9 6.0-8.5
Cation Exchange
Capacity cmol·kg-
1 31.32 8.91 6.37 none
Analysis performed by Pennsylvania State University Agricultural Analytical Services
Laboratory, University Park, PA. WHC stands for Water Holding Capacity
1Forschungsgesellschaft Landschaftsentiwicklung Landschaftsbau (FLL). 2008. Guidelines for
the Planning Execution and Upkeep of Green-Roof Sites. FLL Guidelines are for single course
extensive green roofs.

94
Table 3.3. Differences in Weekly Means for Volumetric Moisture Content over the 2014
Growing Season
Positive values indicate that the substrate of interest had greater moisture than the expanded
shale control. P-values are reported for pairwise comparisons using Dunnett’s Test with a
defined control (Expanded shale).
Foamed
Glass Porcelain
Week ∆VMC p-value ∆VMC p-value
5/20-5/26 0.217 0.1866 0.029 0.9553
5/27-6/2 0.239 0.1093 0.023 0.9669
6/3-6/9 0.276 0.0875 0.060 0.8316
6/10-6/16 0.242 0.0740 0.010 0.9926
6/17-6/23 0.200 0.1313 -0.009 0.9940
6/24-6/30 0.201 0.1611 0.006 0.9974
7/1-7/7 0.191 0.1129 0.030 0.9206
7/8-7/14 0.143 0.0779 0.013 0.9689
7/15-7/21 0.055 0.1236 0.020 0.6628
7/22-7/28 0.041 0.0565 0.022 0.3072
7/29-8/4 0.044 0.0393 0.021 0.3226
8/5-8/11 0.055 0.0297 0.023 0.3754
8/12-8/18 0.077 0.0667 0.044 0.3208
8/19-8/25 0.075 0.0506 0.063 0.1009
8/26-9/1 0.151 0.0601 0.021 0.9177
9/2-9/8 0.151 0.0730 -0.002 0.9990
9/9-9/15 0.145 0.1341 -0.011 0.9818
9/16-9/22 0.132 0.1553 -0.017 0.9589
9/23-9/30 0.137 0.1461 -0.013 0.9761
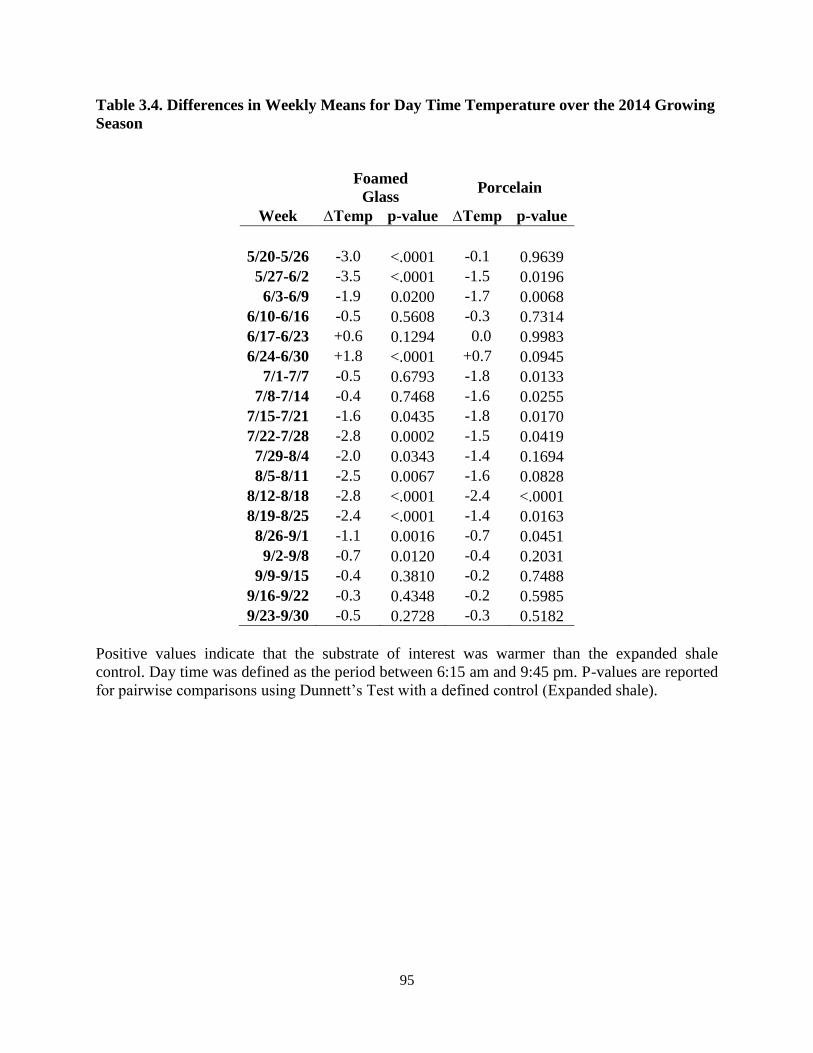
95
Table 3.4. Differences in Weekly Means for Day Time Temperature over the 2014 Growing
Season
Foamed
Glass Porcelain
Week ∆Temp p-value ∆Temp p-value
5/20-5/26 -3.0 <.0001 -0.1 0.9639
5/27-6/2 -3.5 <.0001 -1.5 0.0196
6/3-6/9 -1.9 0.0200 -1.7 0.0068
6/10-6/16 -0.5 0.5608 -0.3 0.7314
6/17-6/23 +0.6 0.1294 0.0 0.9983
6/24-6/30 +1.8 <.0001 +0.7 0.0945
7/1-7/7 -0.5 0.6793 -1.8 0.0133
7/8-7/14 -0.4 0.7468 -1.6 0.0255
7/15-7/21 -1.6 0.0435 -1.8 0.0170
7/22-7/28 -2.8 0.0002 -1.5 0.0419
7/29-8/4 -2.0 0.0343 -1.4 0.1694
8/5-8/11 -2.5 0.0067 -1.6 0.0828
8/12-8/18 -2.8 <.0001 -2.4 <.0001
8/19-8/25 -2.4 <.0001 -1.4 0.0163
8/26-9/1 -1.1 0.0016 -0.7 0.0451
9/2-9/8 -0.7 0.0120 -0.4 0.2031
9/9-9/15 -0.4 0.3810 -0.2 0.7488
9/16-9/22 -0.3 0.4348 -0.2 0.5985
9/23-9/30 -0.5 0.2728 -0.3 0.5182
Positive values indicate that the substrate of interest was warmer than the expanded shale
control. Day time was defined as the period between 6:15 am and 9:45 pm. P-values are reported
for pairwise comparisons using Dunnett’s Test with a defined control (Expanded shale).

96
Table 3.5. Differences in Weekly Means for Night Time Temperature over the 2014
Growing Season
Foamed
Glass Porcelain
Week ∆Temp p-value ∆Temp p-value
5/20-5/26 -0.9 0.1775 +0.6 0.4882
5/27-6/2 -4.0 0.0051 -0.6 0.8167
6/3-6/9 -2.5 0.0609 -0.1 0.9855
6/10-6/16 -1.8 0.0523 +0.2 0.9234
6/17-6/23 -1.3 0.3362 +0.3 0.9093
6/24-6/30 -0.4 0.8300 +0.7 0.6412
7/1-7/7 -1.9 0.0943 -0.1 0.9973
7/8-7/14 -1.8 0.1370 0.0 0.9998
7/15-7/21 -3.3 0.0555 0.0 0.9993
7/22-7/28 -2.9 <.0001 +0.4 0.6378
7/29-8/4 -1.4 0.2846 +0.8 0.6382
8/5-8/11 +0.1 0.1113 +0.4 0.3733
8/12-8/18 -1.3 0.0428 +0.1 0.9433
8/19-8/25 -0.9 0.0412 +0.7 0.1540
8/26-9/1 -0.3 0.3209 +0.3 0.2164
9/2-9/8 0.0 0.9918 +0.4 0.0763
9/9-9/15 +0.3 0.2578 +0.5 0.0494
9/16-9/22 +0.2 0.5410 +0.4 0.1077
9/23-9/30 +0.2 0.5008 +0.4 0.0608
Positive values indicate that the substrate of interest was warmer than the expanded shale
control. Night time was defined as the period between 10 pm and 6:00 am. P-values are reported
for pairwise comparisons using Dunnett’s Test with a defined control (Expanded shale).

97
Figure 3.1. Particle Size Distribution at the Start of the Study
Substrates were screened using sieves with 0.002, 0.05, 0.25, 1.0, 2.0, 3.2, 6.3, 9.5, and 12.5 mm
openings
0
10
20
30
40
50
60
70
80
90
100
0.001 0.01 0.1 1 10
Cu
mm
ula
tiv
e %
Ma
ss
Particle Size (mm)
Porcelain
Foamed Glass
Expanded Shale
FLL Max
FLL Min

98
Figure 3.2. Absolute Plant Coverage
0.00
0.05
0.10
0.15
Allium cernuum
0.00
0.05
0.10
0.15
0.20
Allium senescens
0.00
0.05
0.10
0.15
0.20
0.25
0.30
0.35
0.40
0.45
0.50
Sedum kamtshaticum
0.00
0.05
0.10
0.15
0.20
0.25
0.30
Sedum album
0.00
0.05
0.10
0.15
0.20
0.25
0.30
0.35
0.40
Sedum acre
0.00
0.05
0.10
0.15
0.20
0.25
0.30
0.35
0.40
0.45
0.50
Coreopsis lanceolata
Expanded
Shale
Foamed Glass
Porcelain

99
Figure 3.2 (cont’d)
0.00
0.05
0.10
0.15
0.20
0.25
0.30
0.35
Koeleria macrantha
0.00
0.10
0.20
0.30
0.40
0.50
0.60
0.70
Monarda punctatum
0.00
0.05
0.10
0.15
0.20
0.25
0.30
0.35
0.40
0.45
0.50
Trandescantia ohiensis
0.00
0.50
1.00
1.50
2.00
2.50Total Coverage
Expanded Shale
Foamed Glass
Porcelain
Absolute coverage of individual species and all
species combined. Absolute cover was calculated
for each species as the total number of point frame
contacts recorded divided by the number of data
collection points. Combined absolute coverage
can exceed 1.00 because of multiple species
overlapping in the same area.

100
Figure 3.3 Differences in Volumetric Moisture Content over the 2014 Growing
Season
Values calculated by subtracting the mean moisture content of expanded shale from the
mean moisture content of the respective substrate for each observation. Values above the
x-axis indicate that the substrate had greater volumetric moisture content than expanded
shale.
-0.10
0.00
0.10
0.20
0.30
0.40
0.50
5/21 6/4 6/18 7/2 7/16 7/30 8/13 8/27 9/10 9/24
Dif
feren
ce i
n S
ub
stra
te M
ois
ture
(m
3/m
3)
Foamed Glass
Porcelain

101
Figure 3.4. Mean Volumetric Moisture Content over the 2014 Growing Season
0.00
0.10
0.20
0.30
0.40
0.50
0.60
5/21 6/4 6/18 7/2 7/16 7/30 8/13 8/27 9/10 9/24
Vo
lum
etri
c M
ois
ture
Co
nte
nt
(m3/m
3)
Expanded Shale Foamed Glass Porcelain

102
Figure 3.5. Mean Substrate Temperature over the 2014 Growing Season
A one-day moving average was applied to the temperatures recorded in each replicate.
Means were then calculated for each substrate type.
10
15
20
25
30
35
5/21 6/4 6/18 7/2 7/16 7/30 8/13 8/27 9/10 9/24
Su
bst
rate
Tem
per
atu
re (
Cel
siu
s)
Expanded Shale
Foamed Glass
Porcelain

103
Figure 3.6. Differences in Day-Time Substrate Temperatures over the 2014 Growing
Season
Differences in daytime temperature between the alternative and expanded shale substrates
were calculated by subtracting the mean temperature value of expanded shale from the
mean temperature value of the respective substrate for each observation. Values below
the x-axis indicate that the substrate was cooler than expanded shale.
-10
-8
-6
-4
-2
0
2
4
6
8
10
5/21 6/4 6/18 7/2 7/16 7/30 8/13 8/27 9/10 9/24
∆T
emp
era
ture
(C
elciu
s)
Foamed Glass
-10
-8
-6
-4
-2
0
2
4
6
8
10
5/21 6/4 6/18 7/2 7/16 7/30 8/13 8/27 9/10 9/24
∆T
emp
era
ture
(C
elciu
s)
Porcelain

104
Figure 3.7. Differences in Night-Time Substrate Temperatures over the 2014
Growing Season
Differences in nighttime temperature between the alternative and expanded shale
substrates were calculated by subtracting the mean temperature value of expanded shale
from the mean temperature value of the respective substrate for each observation. Values
below the x-axis indicate that the substrate was cooler than expanded shale.
-10
-8
-6
-4
-2
0
2
4
6
8
10
5/21 6/4 6/18 7/2 7/16 7/30 8/13 8/27 9/10 9/24
∆T
emp
era
ture
(C
elciu
s)
Foamed Glass
-10
-8
-6
-4
-2
0
2
4
6
8
10
5/21 6/4 6/18 7/2 7/16 7/30 8/13 8/27 9/10 9/24
∆T
emp
era
tuer
e (
Cel
ciu
s)
Porcelain

105
Figure 3.8. Daily Variations in Substrate Temperature over the 2014 Growing
Season
Daily variations in substrate temperature were calculated for each substrate by
subtracting the minimum mean temperature from the maximum mean temperature for
each day.
0
5
10
15
20
25
30
35
40
5/21 6/4 6/18 7/2 7/16 7/30 8/13 8/27 9/10 9/24
Am
pli
tud
e (C
elsi
us)
Expanded Shale
Porcelain
Foamed Glass

106
LITERATURE CITED

107
LITERATURE CITED
Arnfield, J. 2003. Two decades of urban climate research: a review of turbulence,
exchanges of energy and water, and the urban heat island. International Journal of
Climatology 23: 1-26.
Bates, A., Sadler, J., Greswell, R., and Mackay, R. 2015. Effects of recycled aggregate
growth substrate on green roof vegetation development: A six year experiment.
Landscape and Urban Planning 135: 22-31.
Beckett, P., Freer-Smith, P., and Taylor, G. Urban woodlands: their role in reducing the
effects of particulate pollution. Environmental Pollution 99(3): 347-360.
Berndtsson, C. Green roof performance towards management of runoff water quantity
and quality: a review. Ecological Engineering 36(4): 351-360.
Bisceglie, F., Gigante, E., and Bergonzoni, M. 2014. Utliziation of waste autoclaved
aerated concrete as lighting material in the structure of a green roof. Construction and
Building Materials 69: 351.
Bozorg Chenani, S., Levävirta, S., and Häkkinen, T. 2015. Life cycle assessment of
layers of green roofs. Journal of Cleaner Production. doi: 10.1016/j.jclepro.2014.11.070.
Brabec,E., Schulte,S., and Richards, P. 2002. Impervious surfaces and water quality: a
review of current literature and its implications for watershed planning. Journal of
Planning Literature 16(4): 499-514.
Chase, J., and Walsh, J. 2006. Urban effects on native avifauna: a review. Landscape and
Urban Planning 74: 46-69.
Durhman, A., and Rowe, B. 2007. Effect of substrate depth on initial growth, coverage,
and survival of 25 succulent green roof plant taxa. HortScience 42(3): 588-595.
Farell, C., Mitchell, R., Szota, C., Rayner, J., and Williams, N. 2012. Green roofs for hot
and dry climates: interacting effects of plant water use, succulence, and substrate.
Ecological Engineering 49: 270-276.
Forschungsgesellschaft Landschaftsentwicklung Landschaftsbau (FLL) (Society of
Landscape Development and Landscape Design). 2008. Guidelines for the planning,
execution and upkeep of green-roof sites. Forschungsgesellschaft
Landschaftsentwicklung Landschaftsbau, Bonn, Germany.

108
Gaffin, S., Parshall, L., O’Keeffe, G., Braman, D., Beattie, D., and Berghage, R. 2005.
Energy balance modeling applied to a comparison of green and white roof cooling
efficiency. Paper presented at the Third Annual Greening Rooftops for Sustainable
Communities Conference, Awards and Trade Show; May 4-6. Washington, DC.
Getter, K.L., and Rowe, D.B. 2006. The role of green roofs in sustainable development.
Hort Science 41(5): 1276-1285.
Getter, K.L., Rowe, D.B., Robertson, G.P., Cregg, B.M., and Andresen, J.A. 2009.
Carbon sequestration potential of extensive green roofs. Environmental Science and
Technology 43(19):7564-7570 (http://dx.doi.org/10.1021/es901539x)
Graceson, A., Monaghan, J., Hall, N., and Hare, M. 2014. Plant growth responses to
different growing media for green roofs. Ecological Engineering 69: 196-200.
Jörg Breuning & Green Roof Service, LLC. 2015. Retrieved on 1/20/2015 from:
http://www.greenrooftechnology.com/green-roofs-explained#roof-last-green-roof
Klopp, T. and Berghage, R. 2012. The use of foamed glass recycled glass material as a
greenroof media. Undergraduate research project, Pennsylvania State University,
University Park, PA.
Kosareo, L., and Ries, R. 2007. Comparative environmental life cycle assessment of
green roofs. Building and Environment 42: 2606-2613.
McKinney, M. 2008. Effects of urbanization on species richness: a review of plants and
animals. Urban Ecosystems 11: 161-176.
Molineux, C., Fentiman, C., and Gange, A. 2009. Characterising alternative recycled
waste materials for use as green roof growing media in the U.K. Ecological Engineering
35: 1507-1513.
Oberndorfer, E., J. Lundholm, B. Bass, M. Connelly, R. Coffman, H. Doshi, N. Dunnett,
S. Gaffin, M. Köhler, K. Lui, and B. Rowe. 2007. Green roofs as urban ecosystems:
ecological structures, functions, and services. BioScience 57(10):823-833.
Pérez, G., Vila, A., Rincón, L., Solé, C., and Cabeza, L. 2012. Use of rubber crumbs as
drainage layer in green roofs as potential energy improvement material. Applied Energy
97: 347-354.
Peri, G., Traverso, M., Finkbeiner, M., and Rizzo, G. 2012. Embedding “substrate” in
environmental assessment of green roofs life cycle: evidences from an application to the
whole chain in a Mediterranean site. Journal of Cleaner Production 35: 274-287.

109
Pullicino, D., Erriquens, F., and Gigliotti, G. 2007. Changes in the chemical
characteristics of water-extractable organic matter during composting and their influence
on compost stability and maturity. Bioresource Technology 98: 1822-1831.
Rowe, D.B., M.A. Monterusso, and C.L. Rugh. 2006. Assessment of heat-expanded slate
and fertility requirements in green roof substrates. HortTechnology 16(3):471-477.
Rowe, D.B. 2011. Green roofs as a means of pollution abatement. Environmental
Pollution 159(8-9):2100-2110. (http://dx.doi.org/10.1016/j.envpol.2010.10.029).
Rowe, D.B., Getter, K.L., and Durhman, A.K. 2012. Effect of green roof media depth on
Crassulacean plant succession over seven years. Landscape and Urban Planning 104(3-
4):310-319. (http://dx.doi.org/10.1016/j.landurbplan.2011.11.010).
Steinfield,C. and Del Porto, D. 2008. Green roof alternative substrate pilot study. In
Preliminary Report to the Leading by Example Program, Executive office of Energy and
Environmental Affairs, Commonwealth of Massachusetts.
Teemusk, A. and Mander, U. 2010. Temperature regime of planted roofs compared with
conventional roofing systems. Ecological Engineering 36: 91-95.
Thuring, C., Berghage, R., and Beattie,D. 2010. Green roof plant responses to different
substrate types and depths under various drought conditions. HortTechnology 20(2):395-
401.
Tsihrintzis, V. and Hamid, R. Modelling and managing of urban stormwater runoff
quality: a review. Water Resources Management 11: 137-164.
Waite, S. 2000. Statistical Ecology in Practice: A guide to analyzing Environmental and
Ecological Field Data. Prentice Hall, Harlow, U.K.
Young, T., Cameron, D. D., Sorrill, J., Edwards, T., and Phoenix, G. K. 2014. Importance
of different components of green roof substrate on plant growth and physiological
performance. Urban Forestry and Urban Greening. In Press
(http://dx.doi.org/10.1016/j.ufug.2014.04.007).
Whittinghill, L.J., Rowe, D.B., Cregg, B.M., and Schutzki, R. 2014. Quantifying carbon
sequestration of various green roof and ornamental landscape systems. Landscape and
Urban Planning 123:41-48. (http://dx.doi.org/10.1016/j.landurbplan.2013.11.015).