Embed Size (px)
Citation preview

Amani M. Allen, Ph.D., M.P.H.Divisions of Community Health Sciences and Epidemiology
Center for Health Equity Seminar Series
January. 15,2020
Race, Racism and Biological Embedding:
A ‘critical’ approach to population health and health inequities
Berkeley Center for Social Medicine • University of California, Berkeley


Physiognomy RACE
PHYSIOGNOMY
CULTURE/
ETHNICITY
SOCIETAL
HEALTH/ILLNESS
BEHAVIOR
EXTERNAL
RISK EXPOSURE
RACE DIFFERENCES
IN HEALTH STATUS
LaVeist TA. Ethn Dis. 1996; 6(1-2):21-9.

Socially-assigned race
US: Black Brazil: White
020
40
60
80
100
39.4
55.1
63.1
perc
ent
of re
spo
nd
en
ts
Report excellent or very good health
Hispanic-Hispanic Hispanic-White White-White
General health status, by self-identified and socially-assigned "race"
24.8
18.9
12.7p
erc
ent
of re
spo
nd
en
ts
Report fair or poor health
Socially-Assigned Race
Jones CP, Truman BI, Elam-Evans LD, et al. Ethnicity & Disease. 2008;18(4):496-504

Jones CP, Truman BI, Elam-Evans LD, et al. Ethnicity & Disease. 2008;18(4):496-504Jones CP, Truman BI, Elam-Evans LD, et al. Ethnicity & Disease. 2008;18(4):496-504

Racism and Discrimination Defined
Racism is an organized system premised on the categorization and ranking of social groups into races and devalues, disempowers, and
differentially allocates desirable societal opportunities and resources to racial groups regarded as inferior (Bonilla-Silva, 1996; D. Williams,
2004).
Racism often leads to the development of negative attitudes(prejudice) and beliefs (stereotypes) toward non-dominant,
stigmatized racial groups and differential treatment (discrimination) of these groups by both individuals and social institutions.
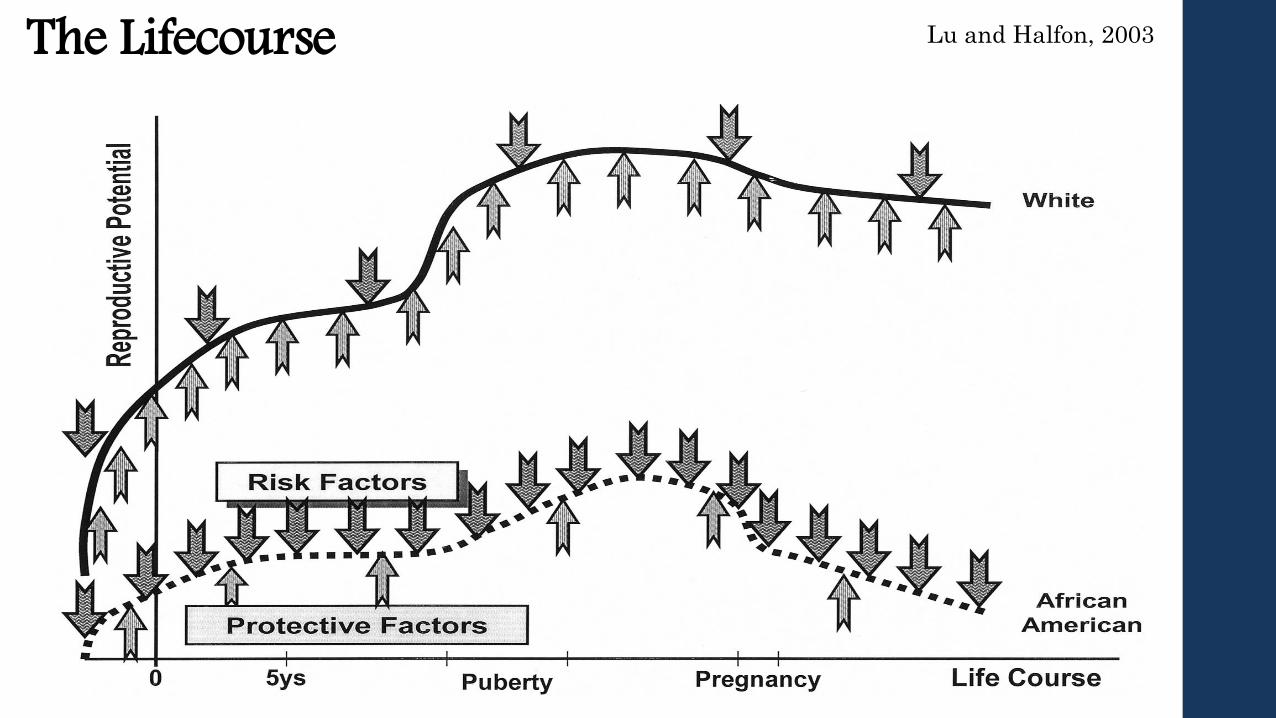
The Lifecourse Lu and Halfon, 2003

Generalized Susceptibility
“Do we not always find the diseases of the populace traceable to defects in society? No matter whether
meteorological conditions, general cosmic changes…never do these in themselves make epidemics, they only induce them whenever, through poor social
conditions, the people have lived under abnormal conditions for a long time”
- Rudolph Virchow, 1849

Stress
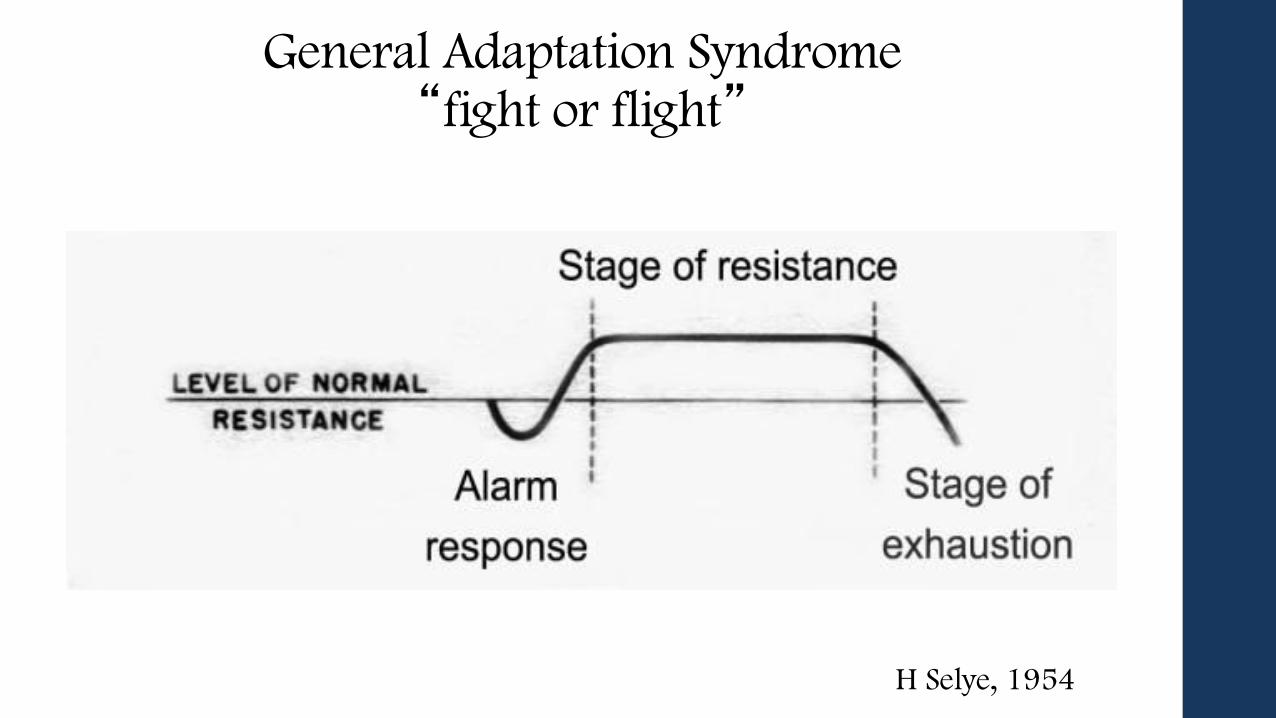
General Adaptation Syndrome “fight or flight”
H Selye, 1954

McEwen, 1998- McEwen, 1999
Allostasis &
Allostatic Load

Example: Cortisol
• Allostasiso Glucose metabolism
o Blood pressure regulation
o Immune function
o Inflammatory response
• Dysregulationo Impaired cognitive fn
o Blood-sugar imbalance
o Hbp
o Immune suppression
o Adrenal failure
o Abdominal fat → heart attack, stroke
o ↑ LDL
o Decreased bone density

Stress
Stress is a process “in which environmental
demands tax or exceed the adaptive capacity of an
organism, resulting in psychological and biological changes
that may place a person at risk for disease.”
- Lazarus & Folkman, 1984

The Stress Response Process
McEwen, B. N Engl J Med 1998; 338:171-179
McEwen, 1999

Gendered Racism & “Weathering”
• Black women up to 5X higher
odds of allostatic load
compared to White men and
women and Black men
• Higher psychosocial stress
among women vs. men
• “Weathering”: early
physiologic aging associated
with chronic social stress
Geronimus et al., 2006

Telomeres
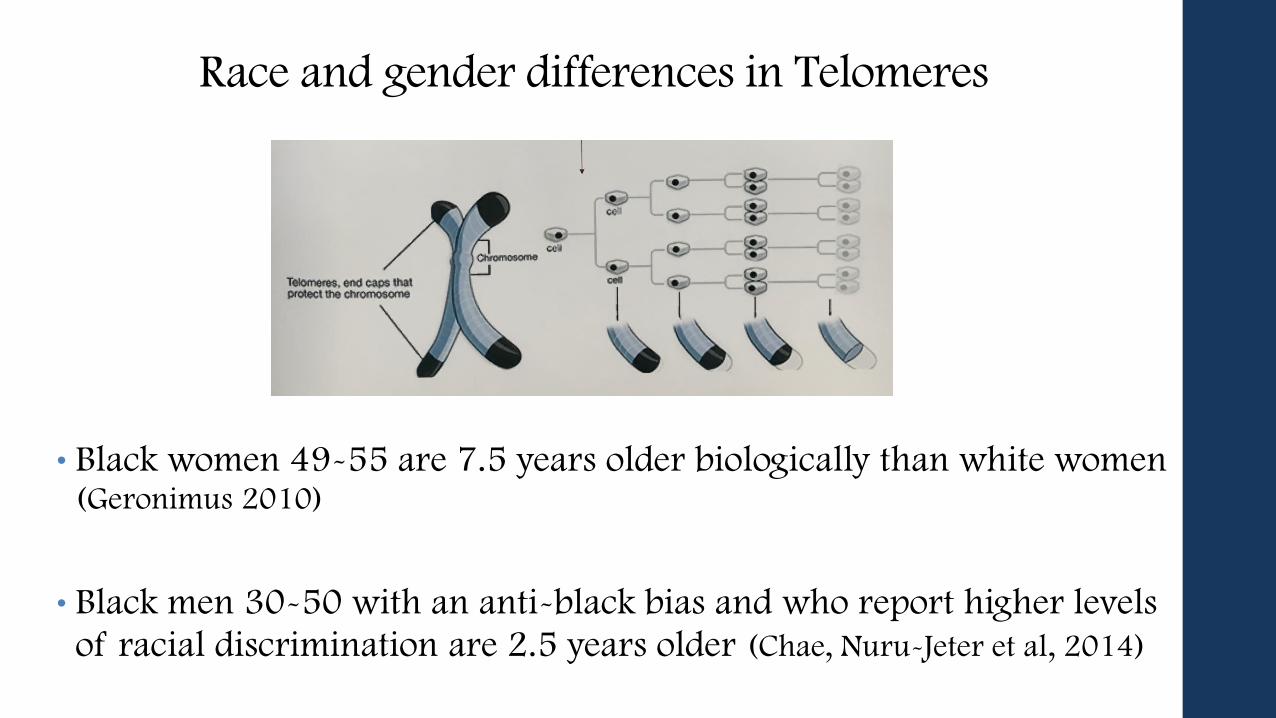
Race and gender differences in Telomeres
• Black women 49-55 are 7.5 years older biologically than white women (Geronimus 2010)
• Black men 30-50 with an anti-black bias and who report higher levels of racial discrimination are 2.5 years older (Chae, Nuru-Jeter et al, 2014)

Prevalence of most common CVDs and related disorders in adults ages 20+ by race and gender, United States
Prevalence African
American
Women
%
African
American
Men
%
White Men
%
White Women
%
Latino Men
%
Latino Women
%
All CVD 46.9 44.6 38.1 34.4 28.5* 34.5*
CVD Deaths 35.9 32.3 33.3 35.3 27.0 31.5
Coronary Heart Disease 8.8 7.8 9.4 6.9 5.3* 6.6*
Hypertension 44.8 43.0 34.3 31.1 25.9* 31.6*
Stroke 4.3 3.8 2.3 3.1 2.8* 3.1*
Congestive Heart Failure 3.6 3.0 3.2 2.1 1.7* 1.8*
End-Stage Renal Disease† 8.0 7.8 3.0 2.2
Hypertension Deaths 37.7 51.1 15.6 14.3
Source: Heart Disease and Stroke Statistics, 2010 Update, American Heart Association; Kiberd B. The Chronic Kidney Disease Epidemic.
J Am Soc Nephrol 2006;17:2967-2973. *Percentages are for Mexican-Americans; †Lifetime risk estimated using 2003 data; Prevalence
estimates for Asians lowest of all groups; Estimates for Pacific Islanders and Native Americans/Alaska Natives unreliable.

How Does “Race” Get Into the Body?
Race x Gender → ?

Stress and CVD
• Black women are ranked among the most at-risk groups for CVD in the U.S.
• Chronic stress plays a role in the etiology and progression of CVD (Black et al 2002; Toth 2008)
• Chronic stress linked with CVD via pro-inflammatory mediators. Psychosocial pathways unclear! (Black et al 2002)
• Focus on physiologic mechanisms with limited attention to the psychosocial processes regulating these mechanisms.

Racism Stress and CVD?
• Racism a chronic stressor among Black women (Krieger 1991,
Krieger and Sidney 1996, Cozier et al 2006)
• Black women report greater distress from racism than Black men (Brown et al 2000)
• Black women use unique cognitive appraisal strategies and coping styles (Nuru-Jeter et al 2009; Woods-Giscombe 2010)
• Integrated specificity: stress exposure x stress appraisal x coping = distinct physiologic stress response (Kemeny 2003)
Measures of Racism & Social Status Project (MORS)
Nuru-Jeter A, Dominguez TP, Hammond WP, Leu J, Skaff M, Egerter S, Jones CP, Braveman
P. “It’s the Skin You’re In”: African American Women Talk about Their Experiences of Racism. Matern Child Health J. 2009; 13(1):29-39.

Over the lifecourse/chronic
“I think that the most difficult thing that, that I faced was when Iwas eight years old, and when I had to learn that um, we weren’tall equal…I don’t even think I knew the difference between blackand white… I used to play with this white girl everyday, like shewas like my best friend...she would always come to my auntie’shouse. And then, there was one time where I went to her house,and she said, ‘Well, my parents said we can’t allow anybody blackin the house.’ And…, that’s somethin’ that always, um, stayedwith me my whole life …and that was really, for a little kid…heartbreaking, you know? And that’s when I first learned thatthere is a difference you know, with the colors. I thought about it alot. I still think about it.”
-San Francisco, low SES

Concern for children/micro-aggressions/ ignore/self-neglect
“I’m stressed because now that my kids are getting older…they go
through it all the time... I take that in internally. It’s subtle, it’s
not out in the open like slavery days, it’s like hidden, but you feel
it still…as adults it seems like I could overlook it…But you have
kids coming home everyday, oh he called me a nigger or black.
That affects you as a parent ... I go through the hurt when they gothrough the hurt.”
- Sacramento, high SES

Anticipatory vigilance/Emotion suppression
“it’s like you get tense. Because you know…I know this person isgoing to say something that’s going to make me, my heart rate [goup], or maybe have to hold back my tears while I’m talking tothem. I don’t want them seeing me crying, cause I don’t wantthem thinking I’m sad, I’m not sad, I’m mad… you just get tense,cause you know you have to brace yourself for something stupidthat they’re gonna say… with a White person, you know thatsome level of racism is going to hop out of their mouth…and soyou have to prepare your body for that.”
- Oakland, high SES

Suppression/acceptance/try harder
• “Realistically, it’s going to affect you…it does bother you, you just put it in a different place.”
- Berkeley, low SES
• “I think that when it happens to you so much that you not necessarily learn to accept it, but you learn to not trip off of it no more.”
- Oakland, low SES
• “You’ve just got to work harder I guess.” - Oakland, low SES
• “I don’t think I really think about it. I just know it’s the skin you’re in. It’s just another part of your life.”
- San Francisco, low SES

Impression management
• “To this day when I’m talking to people other than black I say ‘father’ instead of ‘fathers’”
- Berkeley, high SES
• “I prepare myself …it’s like I will take forever to find me something to wear because I feel I’m not going to be treated right when I go shopping…and I feel I shouldn’t have to do that, but I do that because I’m treated different.”
- Sacramento, high SES

Physical signs of stress
• “My heart starts beating fast.”- San Francisco, low SES
• “My stomach. My, like my baby. I know my baby is stressed out… My stomach is in a knot when I come over here.”
- San Francisco, low SES
• “I get a stomach ache, I’ve broken out.”- Oakland, high SES

Biopsychosocial Model of Racism Stress
Clark et al. 1999
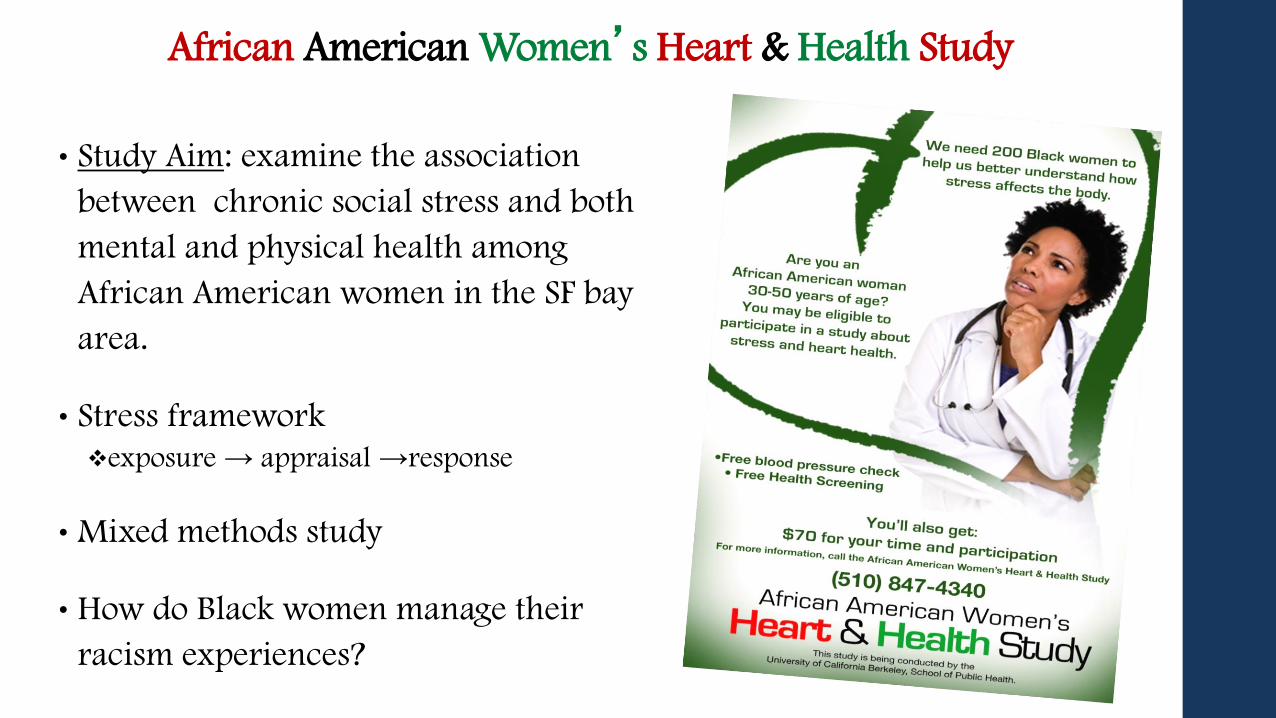
African American Women’s Heart & Health Study
• Study Aim: examine the association
between chronic social stress and both
mental and physical health among
African American women in the SF bay
area.
• Stress framework
exposure → appraisal →response
• Mixed methods study
• How do Black women manage their
racism experiences?

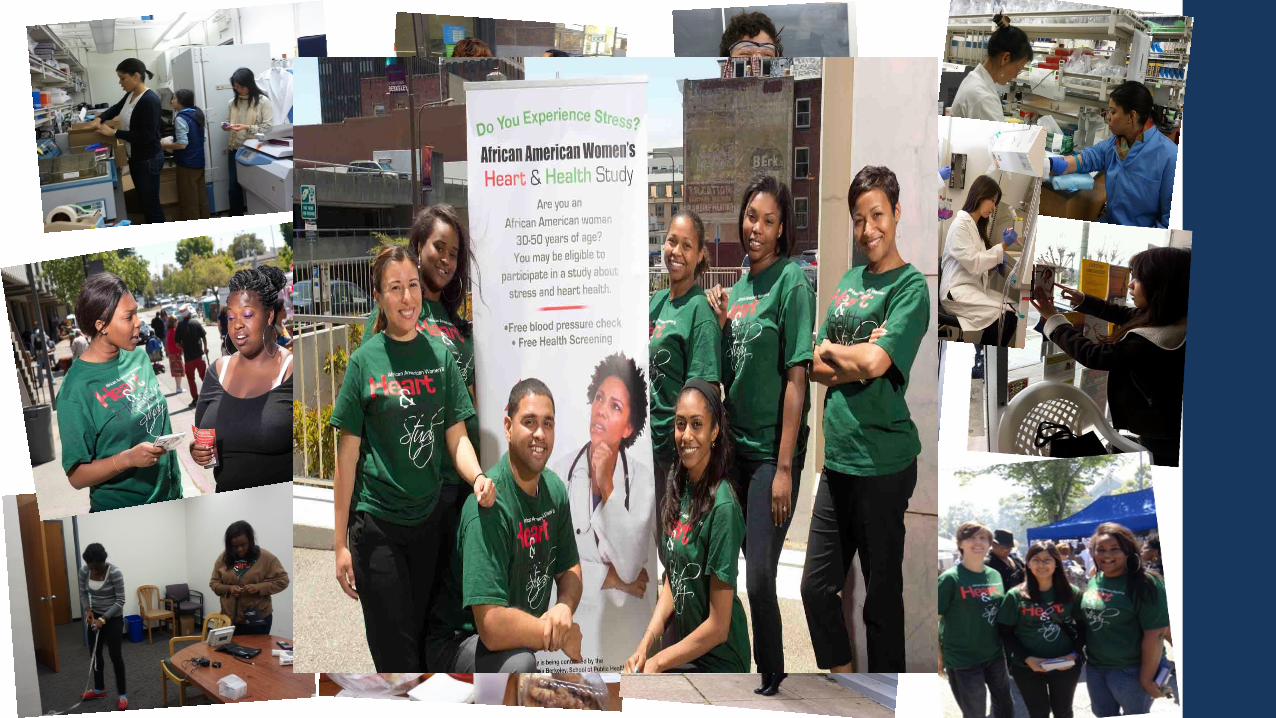
Recruitment & study sample
• Community sample of 200 AA women ages 30-50, San Francisco Bay area
• Purposive sample
• Multi-strategy recruitment Street-canvassing
Targeted neighborhood sampling
Event sampling (concerts, festivals, etc.)
Venue-based sampling (nail/hair shops, restaurants, churches, farmer’s markets)
Facebook/Twitter/project website
Snowball sampling
Organization sampling (100 Black women, NPHA, etc.)

Study procedures
• Screening and enrollment
• Visit #1– Informed consent– Interviewer-administered questionnaire–Computer-assisted self-interview
• Visit #2– Fasting visit (& no smoking or exercise)–Health screening (height, weight, waist/hip circumference, blood
pressure, BMI, body fat %)–Blood draws (stress reactivity, CV biomarkers, etc.)
• Participant incentives– $70 Visa gift card–Healthy eating cookbook–Health education materials

Study Measures
• Self-reported racial discrimination Everyday Discrimination Scale
Experiences of Discrimination Scale
Lifecourse discrimination experiences
Direct/Vicarious
Anticipatory vigilance
Concern for children
• Psychosocial measures Stereotype Threat
Superwoman Schema
Racial identity
Racial socialization
Internalized racism
Perceived social stress
John Henryism
Coping
Health behaviors
Mental health outcomes
• Physical health outcomes Blood pressure
BMI, Body fat %
Waist and hip circumference
Biomarkers
Diabetes risk (eg, insulin resistance)
CV risk (CRP, IL-6)
Stress hormones(Cortisol, epinephrine)
Self-reported physical health status
Self-reported mental health status
Chronic medical conditions
Depression/anxiety/psych distress
• Sociodemographics Age, income, wealth, perceived financial
hardship over the lifecourse, education, subjective social status, marital status, employment, health insurance, zip code, etc.

Where we are now…
Amani et al
Rebecca
Uche
Alexis
Eli
Marilyn
Katie
David
Yijie
Youchuan Saba

Racial Discrimination, Educational Attainment and Biological Dysregulation among Midlife African American Women
Allen AM, Thomas MD, Michaels EK, Reeves AN, Okjoye U, Price MM, Hasson RE, Syme SL,
Chae DH. Psychoneuroendocrinology. 2019;99:225-235.
Study aims
• To examine the association between racial discrimination and biological dysregulation, and
• Test whether the association is attenuated among higher (vs. lower) socioeconomic groups.

Experiences of Discrimination (EOD) Scale
• Have you ever experienced discrimination, been prevented from
doing something, or been hassled or made to feel inferior in any of
the following situations because of your race, ethnicity, or color?
At school
Getting hired or getting a job
At work
Getting housing
Getting medical care
Getting service in a store or restaurant
Getting credit, bank loans, or a mortgage
On the street or in a public setting
From the police or in the courts
Krieger N

Sample distribution: EOD

Allostatic Load (AL) Biomarker AL75 Cutpoints AL90 Cutpoints ALIQR Cutpoints
Low Risk Moderate Risk High Risk
Metabolic System
HDL (mg/dL) <50 <40 ≥50 ≥40 & <50 <40
LDL (mg/dL) ≥100 ≥130 <100 ≥100 & <130 ≥130
Waist Circumference (in) >35 >49 <35 ≥35 & ≤45 >45
Glucose (mg/dL) ≥100 or <70 ≥126 or <70 ≥70 or<100 ≥100 & <126 ≥126 or <70
HbA1c (mmol/mol) ≥5.7 ≥6.5 <5.7 ≥5.7& <6.5 ≥6.5
Total Cholesterol (mg/dL) ≥160 ≥200 <160 ≥160 & <200 ≥200
Triglycerides (mg/dL) ≥150 ≥200 <150 ≥150 & <200 ≥200
BMI (kg/m2) ≥25 or <18.5 ≥30 or <18.5 ≥18.5 or<25 ≥25 & <30 ≥30 or <18.5
Cardiovascular Systemd
Systolic BP (mm Hg) ≥120 ≥140 <120 ≥120 & <140 ≥140
Diastolic BP (mm Hg) ≥80 ≥90 <80 ≥80 & <90 ≥90
Neuroendocrine System
Cortisol (µg/dL) >12.69 >17.32 ≤7.36 >7.36 & ≤12.69 >12.69
Epinephrine (pg/mL) >77.70 >120 ≤47.35 >47.35 & ≤77.70 >77.70
Norepinephrine (pg/mL) >686.30 >848.95 ≤404.40 >404.40 & ≤686.30 >686.30
Inflammatory System
Il-6 (pg/mL) >7.85 >17.8 ≤1 >1 & ≤7.85 >7.85
hsCRP (mg/L) >3 >9.64 <1 ≥1 & ≤3 >3

Allostatic Load (AL)Biomarker AL75 Cutpoints AL90 Cutpoints ALIQR Cutpoints
Low Risk Moderate Risk High Risk
Metabolic System
HDL (mg/dL) <50 <40 ≥50 ≥40 & <50 <40
LDL (mg/dL) ≥100 ≥130 <100 ≥100 & <130 ≥130
Waist Circumference (in) >35 >49 <35 ≥35 & ≤45 >45
Glucose (mg/dL) ≥100 or <70 ≥126 or <70 ≥70 or<100 ≥100 & <126 ≥126 or <70
HbA1c (mmol/mol) ≥5.7 ≥6.5 <5.7 ≥5.7& <6.5 ≥6.5
Total Cholesterol (mg/dL) ≥160 ≥200 <160 ≥160 & <200 ≥200
Triglycerides (mg/dL) ≥150 ≥200 <150 ≥150 & <200 ≥200
BMI (kg/m2) ≥25 or <18.5 ≥30 or <18.5 ≥18.5 or<25 ≥25 & <30 ≥30 or <18.5
Cardiovascular Systemd
Systolic BP (mm Hg) ≥120 ≥140 <120 ≥120 & <140 ≥140
Diastolic BP (mm Hg) ≥80 ≥90 <80 ≥80 & <90 ≥90
Neuroendocrine System
Cortisol (µg/dL) >12.69 >17.32 ≤7.36 >7.36 & ≤12.69 >12.69
Epinephrine (pg/mL) >77.70 >120 ≤47.35 >47.35 & ≤77.70 >77.70
Norepinephrine (pg/mL) >686.30 >848.95 ≤404.40 >404.40 & ≤686.30 >686.30
Inflammatory System
Il-6 (pg/mL) >7.85 >17.8 ≤1 >1 & ≤7.85 >7.85
hsCRP (mg/L) >3 >9.64 <1 ≥1 & ≤3 >3

Allostatic Load (AL)
Biomarker AL75 Cutpoints AL90 Cutpoints ALIQR Cutpoints
Low Risk Moderate Risk High Risk
Metabolic System
HDL (mg/dL) <50 <40 ≥50 ≥40 & <50 <40
LDL (mg/dL) ≥100 ≥130 <100 ≥100 & <130 ≥130
Waist Circumference (in) >35 >49 <35 ≥35 & ≤45 >45
Glucose (mg/dL) ≥100 or <70 ≥126 or <70 ≥70 or<100 ≥100 & <126 ≥126 or <70
HbA1c (mmol/mol) ≥5.7 ≥6.5 <5.7 ≥5.7& <6.5 ≥6.5
Total Cholesterol (mg/dL) ≥160 ≥200 <160 ≥160 & <200 ≥200
Triglycerides (mg/dL) ≥150 ≥200 <150 ≥150 & <200 ≥200
BMI (kg/m2) ≥25 or <18.5 ≥30 or <18.5 ≥18.5 or<25 ≥25 & <30 ≥30 or <18.5
Cardiovascular Systemd
Systolic BP (mm Hg) ≥120 ≥140 <120 ≥120 & <140 ≥140
Diastolic BP (mm Hg) ≥80 ≥90 <80 ≥80 & <90 ≥90
Neuroendocrine System
Cortisol (µg/dL) >12.69 >17.32 ≤7.36 >7.36 & ≤12.69 >12.69
Epinephrine (pg/mL) >77.70 >120 ≤47.35 >47.35 & ≤77.70 >77.70
Norepinephrine (pg/mL) >686.30 >848.95 ≤404.40 >404.40 & ≤686.30 >686.30
Inflammatory System
Il-6 (pg/mL) >7.85 >17.8 ≤1 >1 & ≤7.85 >7.85
hsCRP (mg/L) >3 >9.64 <1 ≥1 & ≤3 >3

AAWHHS Sample Characteristics (n=208)HIGH RISK COVARIATES n %
Age (mean, SD)†41.72 5.90
≤ High School Diploma 69 33.33
≤ 100% FPL 39 18.84
Not Employed 93 44.93
Not Insured 55 26.57
Not Married/Domestically Partnered 146 70.53
Smoker 89 43.00
≥ 3 Alcoholic Drinks/Day 38 18.36
< 5 Physical Activity/Week 133 64.25
Currently Taking CV Medication 43 20.77
Currently Taking DM Medication 12 5.80
Neuroticism (mean, SD)†3.08 0.75
† Not a high risk value

Results
Table 2. Study Sample Discrimination Characteristics
RACIAL DISCRIMINATION n %
Experiences of Discrimination Scale (EOD)
None (EOD score: 8) 22 10.63
Low (EOD score: 9-16) 71 34.30
Moderate (EOD score: 17-24) 63 30.43
High (EOD score: 25-32) 29 14.01
Very High (EOD score: 33-40) 22 10.63

ResultsTable 3. Study Sample Physiologic Characteristics
ALLOSTATIC LOAD MEASURES mean SDAL75 6.10 2.18AL90 2.32 1.58
ALIQR 11.45 3.82SYSTEM-SPECIFIC MEASURES n %Inflammatory System
Very Low Risk 33 14.98Low Risk 39 18.84
Moderate Risk 77 37.20High Risk 60 28.99
Neuroendocrine SystemLow Risk 86 41.55
Moderate Risk 93 44.93High Risk 28 13.53
Cardiovascular SystemLow-risk on both diastolic and systolic BP 88 42.51
High-risk on systolic BP only 20 9.66High-risk on diastolic BP only 21 10.14
High-risk on both diastolic BP and systolic BP 78 37.68Metabolic System (mean, SD) 3.61 1.45


Racial Discrimination and Allostatic Load among
African American Women:
Differential Impacts of Routine vs. Non-routine Experiences
Marilyn D. Thomas, Elizabeth (Eli) Michaels, Alexis Reeves,
Uche Okoye, David H. Chae, Amani M. Allen

Everyday Discrimination (EDS) Scale
• In your day-to-day life, how often have any of the following things happened to you because of your race, ethnicity, or color?
You are treated with less courtesy than other people.
You are treated with less respect than other people.
You receive poorer service than other people at restaurants or stores.
People act as if they think you are not smart.
People act as if they are afraid of you.
People act as if you are dishonest.
People act as if they’re better than you are.
You are called names or insulted.
You are threatened or harassed.
You are followed around in stores.
Williams, DR

Sample distribution: EDS

Regression of EOD vs. EDS on AL
4.00
4.50
5.00
5.50
6.00
6.50
None Low Moderate High Very High
Allo
stat
ic L
oad
Sco
re
Experiences of Discrimination
EOD EDS
Note: Very High=reference

AL regresses on EOD and EDS

Discrimination, Racial Bias, and Telomere Length in African American
Men
DH Chae, A Nuru-Jeter, NE Adler, GH Brody, J Lin, EH
Blackburn, ES Epel. Am J Prev Med. 2014;46(2): 103-111.


Association of direct and vicarious
racism over the lifecourse and preterm
birth
K Daniels, Z Valdez, DH Chae, AM Allen

Racism over the Lifcourse

Model 1 Model 2 Model 3 Model 4 Model 5 Model 6 Model 7
Adult Direct (Everyday
Discrimination Scale)
1.091
(.915, 1.301)
Adult Direct (Experiences of
Discrimination Scale_
1.070
(.898, 1.276)
Adult Vicarious 1.130
(.883, 1.446)
Adolescent Direct
1.477*
(1.001, 2.180)
Adolescent Vicarious 1.270+
(.986, 1.635)
Childhood Direct 1.100
(.809, 1.498)
Childhood Vicarious 1.453*
(1.010, 2.090)
Controls
Number of Pregnancies 1.191*
(1.011, 1.402)
1.174*
(1.001, 1.375)
1.164+
(.994, 1.362)
1.176+
(1.000, 1.384)
1.167+
(.994, 1.371)
1.170+
(.998, 1.372)
1.181*
(1.003, 1.391)
Marital Status 1.434
(.464, 4.428)
1.410
(.456, 4.357)
1.395
(.450, 4.324)
1.421
(.453, 4.459)
1.480
(.468, 4.681)
1.416
(.457, 4.383)
1.206
(.380, 3.830)
Income Adjusted for Household
Size
1.000
(.999, 1.000)
1.000
(.999, 1.000)
1.000
(.999, 1.000)
1.000
(.999, 1.000)
1.000
(.999, 1.000)
1.000
(.999, 1.000)
1.000
(.999, 1.000)
College Educated 1.142
(.283, 4.611)
1.102
(.274, 4.432)
1.070
(.264, 4.337)
1.028
(.254, 4.158)
1.001
(.246, 4.067)
1.117
(.277, 4.500)
1.121
(.277, 4.539)
Adjusted Odds Ratios for Preterm Labor by Racial Discrimination
Notes: Exponentiated coefficients; 95% confidence intervals in brackets; + p<.10, * p<.05, ** p<.01, *** p<.001
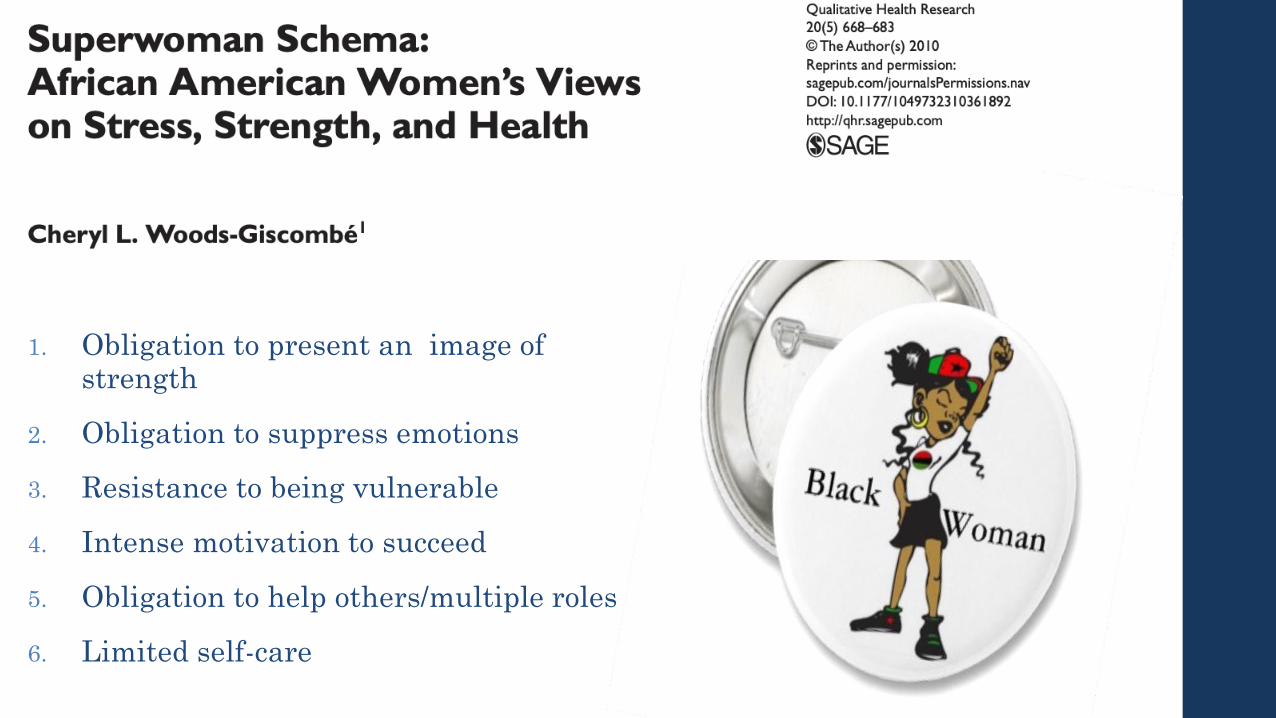
1. Obligation to present an image of strength
2. Obligation to suppress emotions
3. Resistance to being vulnerable
4. Intense motivation to succeed
5. Obligation to help others/multiple roles
6. Limited self-care


Allen AM, Wang Y, Chae DH, et al. Ann NY Acad Sci.


Typical Population Health Approach
Frohlich and Potvin. Am J Public Health. 2008 Feb;98(2):216-21.

Differential Intervention Effect

Population’s-at-Risk
68Intake of saturated fatty acids by socioeconomic group (SEG): higher to lower SEG

Fundamental Causes
Benach J, Malmusi D, Yasui Y, Martinez JM, Muntaner C. Int J Health Serv. 2011;41(1):1-9.
Intake of saturated fatty acids by socioeconomic group (SEG): higher to lower SEG

Equity = the quality of being fair or impartial