Embed Size (px)
Citation preview
Caspian Journal of Health Research 2015; 1(1): 1-17
1
A Credit Approach to Measure Inherent Hazards Using the Fire, Explosion
and Toxicity Index in the Chemical Process Industry: Case Study of an Iso-
max Unit in an Iran Oil Refinery
Masoud Mardani*1, Amir abbas Mofidi2, Arash Ghasemi3
ARTICLE INFO ABSTRACT
History
Received: 2015/03/3
Accepted: 2015/06/23
Objectives: Indices are extensively used for ranking various units
of a chemical process industry on the basis of the hazards they
pose of risk a fire, explosion and toxicity release.
Methods: This type of ranking enables the professionals to
identify the more hazardous units from the less hazardous ones so
that greater attention can be paid to the former. The key process
subunits in the Iso-max unit were identified based on parameters
such as process pressure, temperature and material value. In next
step, the main parameters affecting the FETI were identified and
estimated, and the Mond FETI index was calculated for each
subunit. In addition, the criteria offset measures for each case were
identified and their influences were studied.
Results: The results showed that the process route’s potential
hazardous characteristics, such as major incidents, were associated
with one or more of the following dangerous phenomena: thermal
radiation, blast (pressure wave) and ejection of fragments, release
of toxic materials and chemical concentration in the air. Intake
amount assessments and the corresponding risk of exposure were
also produced. By using statistical incident data of the risks of fire,
explosion and toxicity, exposure risks can be estimated more
realistically as probabilities. This approach is capable of
comparing alternative processes to select the one which is
inherently safest.
Conclusion: Using this method, the exposure risks in a process can
be identified sooner, and proper risk management decisions can be
made early in the process development or predesign stages.
Type
Original Article
1.(Corresponding Author)* (M.Sc.)
Department of HSE Management,
Faculty of Environment Management,
Islamic Azad University, Science &
Research Branch (Tehran), Iran
E-mail:[email protected]
Tel: +9891252698935
2. (Ph.D.) Department of
Occupational Health Engineering,
Faculty of Medical sciences, Tarbiat
Modares University, Tehran, Iran
3. (MS.c.) Department of HSE
Management, Faculty of Environment
Management, Islamic Azad
University, Science & Research
Branch (Tehran), Iran
Keywords: Inherent Hazards, Chemical Process, Criteria Offset Measures
Copyright © (2015) Caspian Journal of Health Research. All rights reserved.
Please cite this article as: Mardani M., Mofidi A., Ghasemi A, A Credit Approach to Measure Inherent Hazards Using the
Fire, Explosion and Toxicity Index in the Chemical Process Industry: Case Study of an Iso-max Unit in an Iran Oil Refinery ,
2015; 1(1): 1-17
Mardani et al./ Caspian Journal of Health Research 2015; 1(1): 1-17
2
Introduction: An inherently safe plant is a
plant with no absolute hazards, and 'zero
risk'. It may be impossible to design and
operate such an inherently safe plant.
Therefore, hazards and risks need to be
strategically and systematically managed [1,
2].
Safer approaches to plant design and general
theories on how safety can be built into the
design process have been presented since the
1960s [3]. Safety indices have been applied
for identifying hazards and have generated
alternative designs as well [2]. Most general
and traditional safety approaches have
focused on the layer of operation (LOP)
method, where additional safety devices and
features are added to the operational process.
The LOP method has been successful in
analysing safety systems. However, with this
approach, process hazards may remain. It
also increases the complexity of the process
and hence the capital outlays and operating
costs; in the oil and gas industries, 15% to
30% of the operating costs go to safety issues
and pollution prevention [4]. Other
approaches safety studies have tended to
focus on hazard identification and control. In
addition to the traditional analysis methods
such as Check List, Safety Review Relative
Ranking and What If analyses, more
advanced hazard and risk analysis methods
have been developed as well, such as Failure
Modes and Effects Analysis (FMEA), Fault
Tree Analysis (FTA), Event Tree Analysis
(ETA), Cause- Consequence Analysis
(CCA), preliminary Hazard Analysis (prHA),
Human Reliability Analysis (HRA) and
Hazard and Operability (HAZOP) study have
been developed [5-8].
For chemical process industry loss
prevention and risk management several
hazard indices have been developed. The
safety-eighted hazard index (SWeHI) was
developed as a tool to define fire, explosion
and toxic release hazards [9]. The
Environmental Risk Management Screening
Tools (ERMSTs) instrument was developed
by Four Elements Inc. for ranking
environmental hazards including air, ground
water and surface water pollution [10]. The
Mond Fire, Explosion and Toxicity Index
(FETI) is a tool to assess these three hazards
[10]. The Hazardous waste index (HWI) is
used as a tool for measuring flammability,
reactivity, toxicity and corrosivity hazards of
waste materials [9]. The Transportation Risk
Screening (ADLTRS) model is a tool for
determining the risk to people and the
environment posed by chemical
transportation operations [9]. Heikkila
(1999) developed the Inherent Safety Index
at the Helsinki University of Technology.
This index classifies safety factors into two
categories: chemical- and process-inherent
safety. The chemical-inherent safety category
includes the choice of materials used in the
process by looking at its heat of reaction,
flammability, explosiveness, toxicity,
corrosivity and incompatibility of chemicals.
The process-inherent safety covers the
process equipment and its conditions such as
inventory, pressure, temperature, type of
process equipment and structure of the
process [11]. The overall inherent safety
index was developed by Edward and
Lawrence (1993) to measure the safety
potential for different routes of reaction to
obtain the same product [12].
The fuzzy logic-based inherent safety index
(FLISI) was developed by Gentile (2004)
[13]. The major problem in applying inherent
safety indices is that safety is mostly based on
qualitative principles and cannot easily be
evaluated and analysed. The FLISI was an
attempt to use hierarchical fuzzy logic to
measure inherent safety and provide
conceptual framework for inherent safety
analysis. Fuzzy logic is very helpful for
Mardani et al./ Caspian Journal of Health Research 2015; 1(1): 1-17
3
combining qualitative information (expert
judgement) and quantitative data (numerical
modelling) by using fuzzy IF–THEN rules.
The Fire and Explosion Index (F&EI) was
invented by Dow’s chemical exposure
hazards researchers and the American
Institute of Chemical Engineers (AIChE) in
1967 as a tool to determine relative rankings
of fire, explosion and chemical exposure
hazards. It has been revised six times since
then. Its last revision (7th edition) was
published in 1994 [14]. A computer program
was developed to automate F&EI calculation
and perform sensitivity analysis using
Microsoft’s Visual Basic by Etowa et al. in
2002 [15].
However, their program was not intended to
determine business interruption or loss
control credit factors, when conducting
process unit risk analyses. Index
methodologies are found to be robust, but are
not able to cover all safety parameters [16].
The application of the F&EI and SWeHI as
predictive tools for loss prevention and risk
management in the oil and gas industry can
be considered a new use for them. One of the
attempts in present study is to apply F&EI to
predict the safety status of an old oil refinery.
The Mond FETI index is a relatively simple
technique, including a complete
methodology to calculate the total risk of a
given process [17]. It does not require highly
qualified experts to administer and its
calculations are not time consuming. The
FETI is the only index that considers all
safety parameters and is able to select the
most critical parts of the process. It is able to
calculate the values of damages and other
losses using day outage, property damage,
replacement value and value of lost
production. These characteristics make FETI
stand out among other fire and explosion risk
indices. The objectives of the present study
were to measure the inherent fire, explosion
and toxicity hazards in the Iso-max unit of the
Tehran Oil Refinery using the Mond FETI
Index.
Material and Methods: The FETI was
first presented by D. J. Lewis in 1979 [18].
The second edition of the Mond FETI Index
discussed here was published in 1997 and
applied to the present study of the Mond
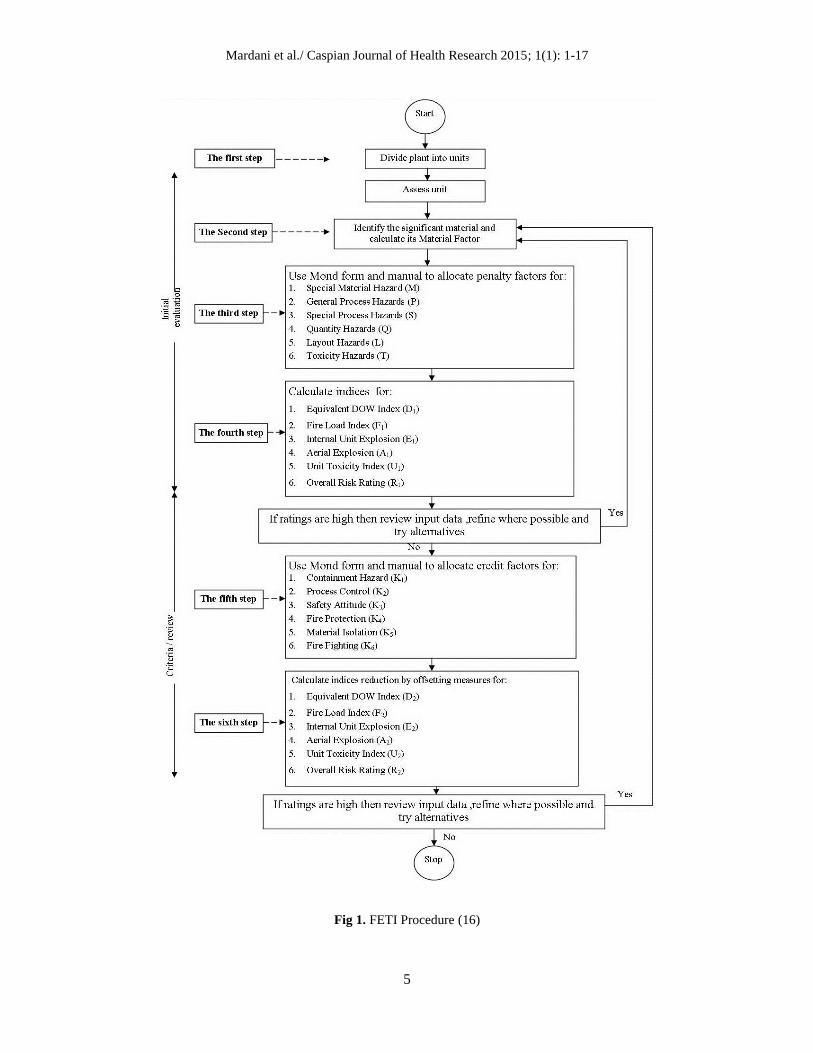
Division of ICI [19].The general procedure
for using the Mond FETI is shown in Fig 1,
and involves the following six steps:
The first step, as with the Dow Index, is to
divide the plant into units, and it is better to
start with too many than too few.
The Second step is to determine the material
factor, B, which provides a numerical base
for the indices. The material factor (MF),
which represents the measure of the potential
energy released by the material under study,
is obtained first. The MF is obtained from
databases, material safety data sheets
(MSDS), or manual calculations. The
dominant or key material upon which the
material factor is based is next determined. It
is defined as the compound or mixture in the
unit which, due to its inherent properties and
the quantity present, provides the greatest
potentia1 for energy release by combustion,
explosion or exothermic reaction. The
material factor, B, is in most cases the net
heat of combustion of the material in air,
expressed as thousands of BTU per pound
(2326 kJ/kg). For reactive combinations of
materials, the heat of reaction is used if it
exceeds the heat of combustion. This material
factor is often the same as that given in the
third edition of the Dow guide [18, 19]. The
base is then modified by other considerations
contained in the following sections.
The third step is to use the Mond form and
manual to allocate penalty factors for the
following aspects:
The Special Material Hazards Factor (M)
is applied to take into account any special
Mardani et al./ Caspian Journal of Health Research 2015; 1(1): 1-17
4
properties of the key material that may affect
either the nature of the incident or the
likelihood of its occurrence. Ten properties
are listed, with corresponding penalties. They
include any tendencies of the key material to
act as an oxidant, to polymerise
spontaneously, to decompose violently, to
detonate, etc. One property, designated m,
represents the mixing and dispersion
characteristics of the material and also
features in the aerial explosion index. The
highest penalties recommended are for
unstable materials that can deflagrate or
detonate [19].
The General Process Hazards Factor (P)
relates to the basic type of process or other
operation being carried out in the unit. Six
main types are listed, including material
transfer, physical change-only processes and
various types of reactions with different
characteristics.
The Special Process Hazards Factor (S)
reflects 14 listed features of the process
operation that increase the overall hazard
beyond the basic levels already considered.
These account for operating temperature and
pressure, corrosion, erosion, vibration,
control problems, electrostatic hazards, etc. S
is evaluated on the assumption that the plant
has an adequate control system for normal
operations. Credits for more sophisticated
safety features such as explosion suppression
and combustible gas monitors are applied
later.
The Quantity Hazards Factor (Q)
represents the quantity of combustible,
flammable, explosive or decomposable
material in the unit, which is treated as a
separate factor in the Mond FETI Index. It is
related to the total quantity K of such material
in the unit. K also features in the fire index
[20].
The Layout Hazards Factor (L) is another
separate factor in the FETI Index. The normal
working area N of the unit in square metres
also features in the fire index, and is defined
‘as the plan area of the structure associated
with the unit, enlarged where necessary to
include any pumps and associated equipment
not within the plan area of the structure.ʼ The
height H, in metres above ground at which
flammable materials are present in the unit,
also features in the aerial explosion index. L
also includes factors for the relation of
ventilation rates to flammable vapours,
which could escape, and ‘domino effects’
involving the spread of incidents from one
unit to another. The Acute Health Hazards
Factor (T) is not intended to reflect health
hazards as such, but rather the delay caused
by the toxicity of escaping materials when
tackling a developing or potential fire or
explosion. The factor is the sum of penalties
for skin effects and inhalation.
The fourth step is to calculate indices for the
following factors:
The equivalent Dow Index (3rd edition),
whose formula was given earlier, is not used
for interpretive purposes but features in later
calculations.
Mardani et al./ Caspian Journal of Health Research 2015; 1(1): 1-17
5
Fig 1. FETI Procedure (16)
Mardani et al./ Caspian Journal of Health Research 2015; 1(1): 1-17
6
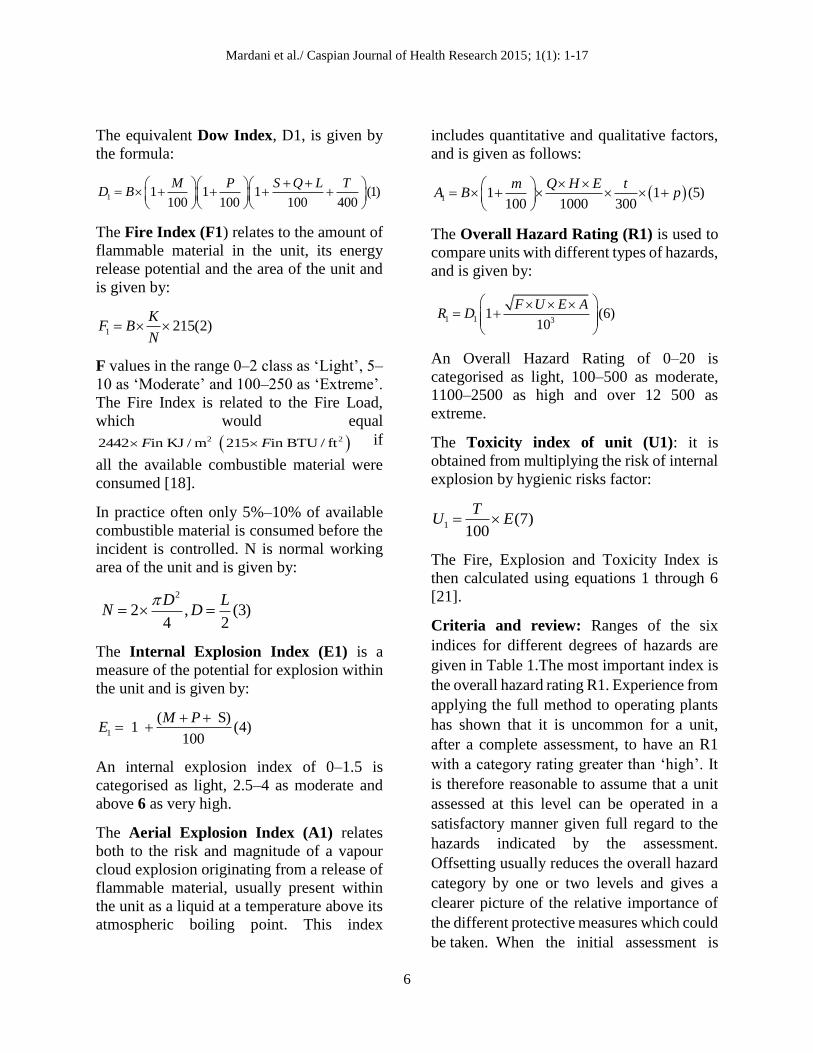
The equivalent Dow Index, D1, is given by
the formula:
1 1 1 1 (1)100 100 100 400
M P S Q L TD B
The Fire Index (F1) relates to the amount of
flammable material in the unit, its energy
release potential and the area of the unit and
is given by:
1 215(2)K
F BN
F values in the range 0–2 class as ‘Light’, 5–
10 as ‘Moderate’ and 100–250 as ‘Extreme’.
The Fire Index is related to the Fire Load,
which would equal
2 22442 in KJ / m 215 in BTU / ftF F if
all the available combustible material were
consumed [18].
In practice often only 5%–10% of available
combustible material is consumed before the
incident is controlled. N is normal working
area of the unit and is given by:
2
2 , (3)4 2
D LN D
The Internal Explosion Index (E1) is a
measure of the potential for explosion within
the unit and is given by:
1
( S) 1 (4)
100
M PE
An internal explosion index of 0–1.5 is
categorised as light, 2.5–4 as moderate and
above 6 as very high.
The Aerial Explosion Index (A1) relates
both to the risk and magnitude of a vapour
cloud explosion originating from a release of
flammable material, usually present within
the unit as a liquid at a temperature above its
atmospheric boiling point. This index
includes quantitative and qualitative factors,
and is given as follows:
1 1 1 (5)100 1000 300
m Q H E tA B p
The Overall Hazard Rating (R1) is used to
compare units with different types of hazards,
and is given by:
1 1 3
1 (6)10
F U E AR D
An Overall Hazard Rating of 0–20 is
categorised as light, 100–500 as moderate,
1100–2500 as high and over 12 500 as
extreme.
The Toxicity index of unit (U1): it is
obtained from multiplying the risk of internal
explosion by hygienic risks factor:
1 (7)100
TU E
The Fire, Explosion and Toxicity Index is
then calculated using equations 1 through 6
[21].
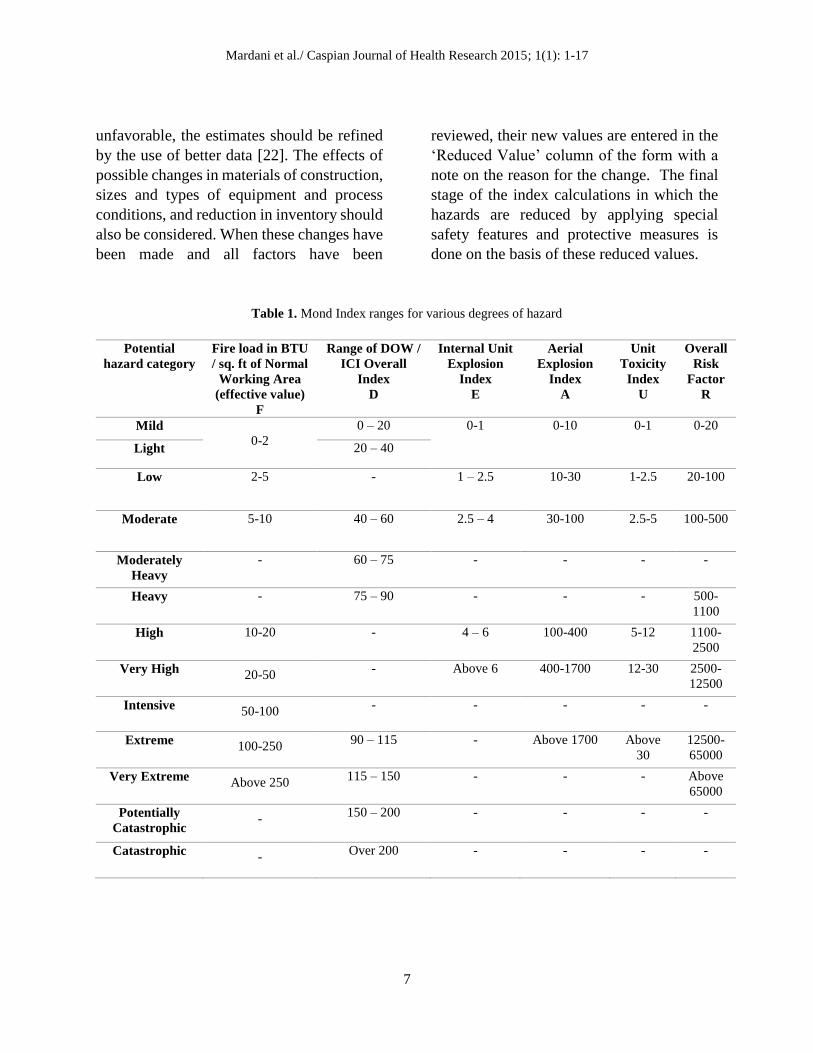
Criteria and review: Ranges of the six
indices for different degrees of hazards are
given in Table 1.The most important index is
the overall hazard rating R1. Experience from
applying the full method to operating plants
has shown that it is uncommon for a unit,
after a complete assessment, to have an R1
with a category rating greater than ‘high’. It
is therefore reasonable to assume that a unit
assessed at this level can be operated in a
satisfactory manner given full regard to the
hazards indicated by the assessment.
Offsetting usually reduces the overall hazard
category by one or two levels and gives a
clearer picture of the relative importance of
the different protective measures which could
be taken. When the initial assessment is
Mardani et al./ Caspian Journal of Health Research 2015; 1(1): 1-17
7
unfavorable, the estimates should be refined
by the use of better data [22]. The effects of
possible changes in materials of construction,
sizes and types of equipment and process
conditions, and reduction in inventory should
also be considered. When these changes have
been made and all factors have been
reviewed, their new values are entered in the
‘Reduced Value’ column of the form with a
note on the reason for the change. The final
stage of the index calculations in which the
hazards are reduced by applying special
safety features and protective measures is
done on the basis of these reduced values.
Table 1. Mond Index ranges for various degrees of hazard
Potential
hazard category
Fire load in BTU
/ sq. ft of Normal
Working Area
(effective value)
F
Range of DOW /
ICI Overall
Index
D
Internal Unit
Explosion
Index
E
Aerial
Explosion
Index
A
Unit
Toxicity
Index
U
Overall
Risk
Factor
R
Mild
0-2
0 – 20 0-1 0-10 0-1 0-20
Light 20 – 40
Low 2-5 - 1 – 2.5 10-30 1-2.5 20-100
Moderate 5-10 40 – 60 2.5 – 4 30-100 2.5-5 100-500
Moderately
Heavy
- 60 – 75 - - - -
Heavy - 75 – 90 - - - 500-
1100
High 10-20 - 4 – 6 100-400 5-12 1100-
2500
Very High 20-50
- Above 6 400-1700 12-30 2500-
12500
Intensive 50-100
- - - - -
Extreme 100-250
90 – 115 - Above 1700 Above
30
12500-
65000
Very Extreme Above 250
115 – 150 - - - Above
65000
Potentially
Catastrophic -
150 – 200 - - - -
Catastrophic -
Over 200 - - - -
Mardani et al./ Caspian Journal of Health Research 2015; 1(1): 1-17
8
The scope for reductions in the indices by
design changes is greatest before the design
is 3finalized. In existing plants, most
improvements result from the incorporation
of the safety features and preventative
measures contained in the offsetting section.
However, reducing inventory has a
significant effect on fire potential and can
usually be achieved in new and existing
plants [23].
The fifth step: Use the Mond form and
manual to allocate credit factors for:
Safety features and preventative measures
may reduce the probability or magnitude of
an incident (sometimes both). The Mond
manual classifies them in gested by which the
values of the appropriate index should be
multiplied when a safety feature or
preventative measure (which is additional to
the basic standard) is introduced. Before such
measures can be evaluated, the basic
standards that would apply to the design,
construction, operation and personnel
training have to be defined. As examples, the
basic standard for pressure vessel design is
taken as Pressure Vessel Construction
Category 3 of BS 5500, and the basic
standard for process control instrumentation
is the minimum compatible with operation
under normal design conditions (i.e. without
alarms or trip systems).
Three broad categories of safety features and
preventative measures reduce the probability
of an incident, and the symbols used for the
product totals of their sub-factors are:
A. Features that improve containment of
process materials (K1)
B. Features that improve the safety of
process control (K2)
C. Features that improve safety awareness of
personnel (K3)
There are several possibilities in each
category. The factor for each category is the
product of the suggested values for the
features and measures that apply. Three more
broad categories of safety features and
preventative measures are considered to
reduce the magnitude of any incident. These
are:
D. fire protection (K4)
E. isolation of process materials (K5)
F. firefighting (K6)
The factor for each category is obtained in the
same way as for the first group. Brief
descriptions of the features and measures
considered in each category are given in the
calculation sheet. Where only the basic
standards apply, a factor of 1 is used. The
factors K1 through K6 are calculated for the
actual or proposed protective features.
The sixth step: Calculate indices reduction
by offsetting measures
The offset indices are then obtained by
multiplying the original (reduced) indices by
the appropriate offsetting factors.
The equivalent Offset Dow Index (D2) is
given by the formula:
2 1 1 2 3 4 5 6(8)D D K K K K K K
The equivalent Offset Fire Index (F2) is
given by the formula:
2 1 1 4 5(9)F F K K K
The equivalent Offset Fire Index (F2) is
given by the formula:
2 1 2 3(10)E E K K
The equivalent Offset Aerial Explosion
Index (A2) is given by the formula:
Mardani et al./ Caspian Journal of Health Research 2015; 1(1): 1-17
9
2 1 1 5 6(11)A A K K K
The equivalent Offset Overall Hazard
Rating (R2) is given by the formula:
2 2 2 2
2 2 31 (12)
10
F U E AR D
The equivalent Offset Toxicity Index of unit
(U2) is given by the formula:
2 1 1 2 3 5(13)U U K K K K
The benefits given by the protective features
are assessed by comparing the degrees of
hazard for the original and the offset indices.
These benefits apply only when the
protective hardware is maintained and is in
proper working order and when the
management procedures upon which the
benefits depend are followed. Neglect of
either will cause the indices to revert to their
original values. The importance of
maintaining special protective features was
clearly demonstrated by the Bhopal disaster
(14).
In the final step, business interruption (BI) is
calculated. BI is estimated based on the FETI
Index calculated. The FETI calculation
determines the radius and the area of
exposure using equation [13]. Any
equipment and facility in this area will be
exposed to hazard [24]. 10.256 (14)R D
The damage factor that represents the overall
effect of the fire and blast damage is then
estimated. This is the damage to the unit
equipment produced by fire, blast, release of
fuel or reactivity energy.
By having the original equipment costs and
value of production per month (VPM) as
inputs, the actual minimum probable
property damage (MPPD) can be determined,
and BI is then calculated from equation [14]
[25].
($ ) 0.7(15)30
MPDOBI US VPM
A calculation spread sheet in Excel was
developed for the present study. Its validity
was tested using step-by-step validation of
the calculation process, comparing the results
with hand calculated results. Total validation
of the calculation sheet was implemented by
comparing the results with benchmark data.
Tests for total validation were run prior to the
final calculation.
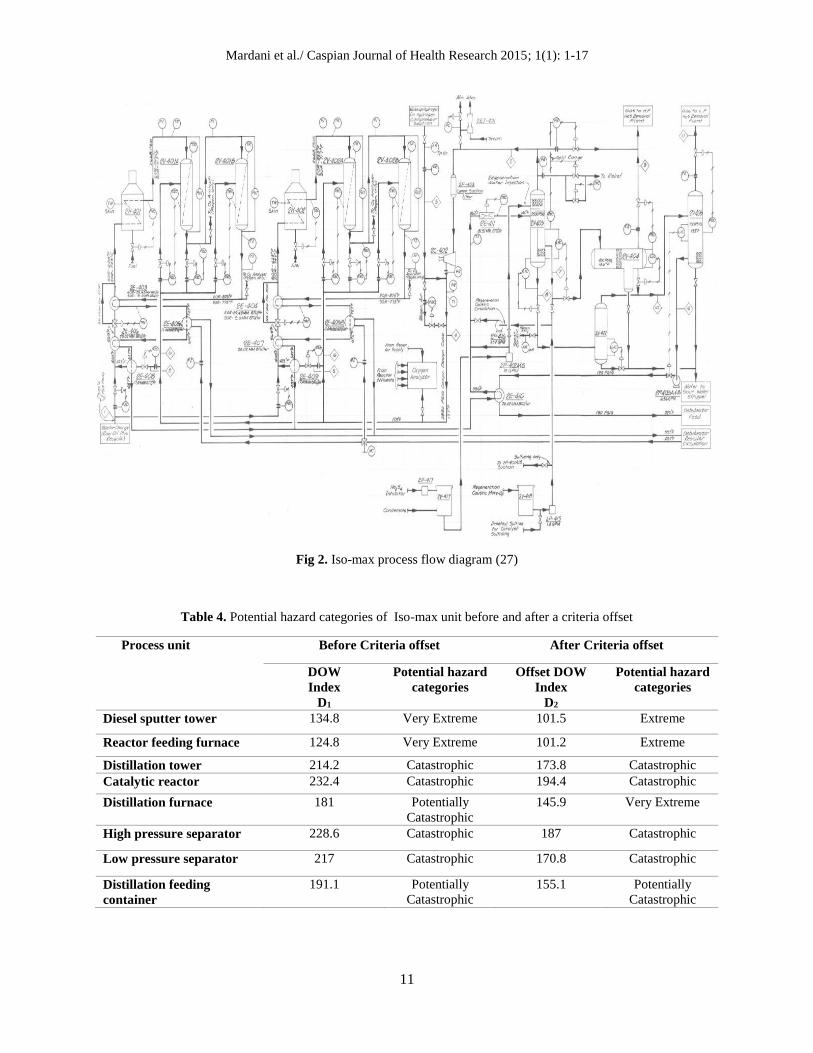
Studied Case: The case for the present study
involves an oil refinery established in 1968.
The Iso-max unit consisting of the reactor
and distillation units is one of the main units
in this refinery. The flow diagram of the Iso-
max unit is shown in (Fig 2). In the reactor,
the Iso-feed is broken down through a hydro-
cracking process in high temperature and
pressure using hydrogen in a catalytic bed. In
the distillation unit, the reaction product from
the distillation tower is separated and
stabilized in stabilizing towers. Light
flammable hydrocarbons handling in very
high operating pressures of up to 2750 psi and
temperatures of up to 980℉, with exothermic
reactions inside the reactors, categorize the
Iso-max unit as engaging in a high-risk
process [26]. The FETI was determined for
eight sub-units of the reactor and distillation
units, including: the reactor feeding oven,
catalytic reactor, high-pressure separator,
low pressure separator, distillation feeding
container, distillation oven, distillation tower
and diesel sputter tower in their existing
status. The offset index was also predicted
following the measurement of the inherent
hazards of fire, explosion and toxicity for
each of these sub-sections.
Mardani et al./ Caspian Journal of Health Research 2015; 1(1): 1-17
10
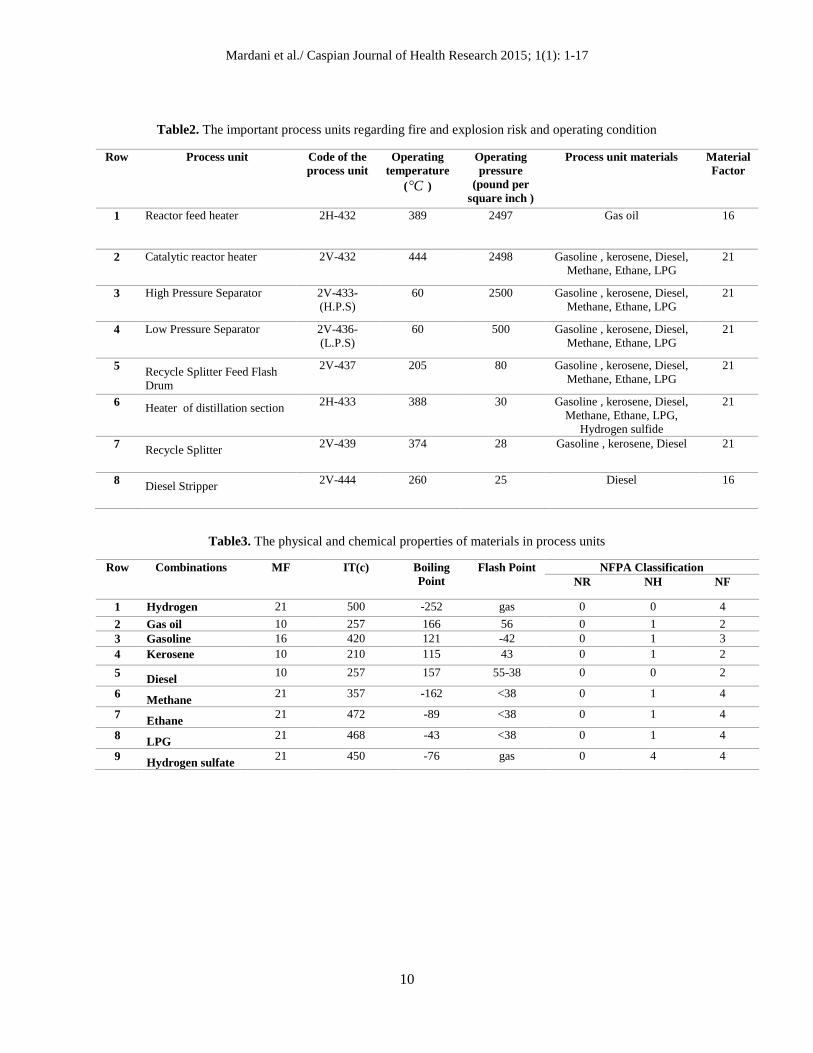
Table2. The important process units regarding fire and explosion risk and operating condition
Table3. The physical and chemical properties of materials in process units
Row Combinations MF IT(c) Boiling
Point
Flash Point NFPA Classification
NR NH NF
1 Hydrogen 21 500 -252 gas 0 0 4
2 Gas oil 10 257 166 56 0 1 2
3 Gasoline 16 420 121 -42 0 1 3
4 Kerosene 10 210 115 43 0 1 2
5 Diesel
10 257 157 55-38 0 0 2
6 Methane
21 357 -162 <38 0 1 4
7 Ethane
21 472 -89 <38 0 1 4
8 LPG
21 468 -43 <38 0 1 4
9 Hydrogen sulfate
21 450 -76 gas 0 4 4
Row Process unit Code of the
process unit
Operating
temperature
( C )
Operating
pressure
(pound per
square inch )
Process unit materials Material
Factor
1 Reactor feed heater 2H-432 389 2497 Gas oil 16
2 Catalytic reactor heater 2V-432 444 2498 Gasoline , kerosene, Diesel,
Methane, Ethane, LPG
21
3 High Pressure Separator 2V-433-
(H.P.S)
60 2500 Gasoline , kerosene, Diesel,
Methane, Ethane, LPG
21
4 Low Pressure Separator 2V-436-
(L.P.S)
60 500 Gasoline , kerosene, Diesel,
Methane, Ethane, LPG
21
5 Recycle Splitter Feed Flash
Drum
2V-437 205 80 Gasoline , kerosene, Diesel,
Methane, Ethane, LPG
21
6 Heater of distillation section
2H-433 388 30 Gasoline , kerosene, Diesel,
Methane, Ethane, LPG,
Hydrogen sulfide
21
7 Recycle Splitter
2V-439 374 28 Gasoline , kerosene, Diesel 21
8 Diesel Stripper
2V-444 260 25 Diesel 16
Mardani et al./ Caspian Journal of Health Research 2015; 1(1): 1-17
11
Fig 2. Iso-max process flow diagram (27)
Table 4. Potential hazard categories of Iso-max unit before and after a criteria offset
Process unit Before Criteria offset After Criteria offset
DOW
Index
D1
Potential hazard
categories
Offset DOW
Index
D2
Potential hazard
categories
Diesel sputter tower 134.8 Very Extreme 101.5 Extreme
Reactor feeding furnace 124.8 Very Extreme 101.2 Extreme
Distillation tower 214.2 Catastrophic 173.8 Catastrophic
Catalytic reactor 232.4 Catastrophic 194.4 Catastrophic
Distillation furnace 181 Potentially
Catastrophic
145.9 Very Extreme
High pressure separator 228.6 Catastrophic 187 Catastrophic
Low pressure separator 217 Catastrophic 170.8 Catastrophic
Distillation feeding
container
191.1 Potentially
Catastrophic
155.1 Potentially
Catastrophic
Mardani et al./ Caspian Journal of Health Research 2015; 1(1): 1-17
12
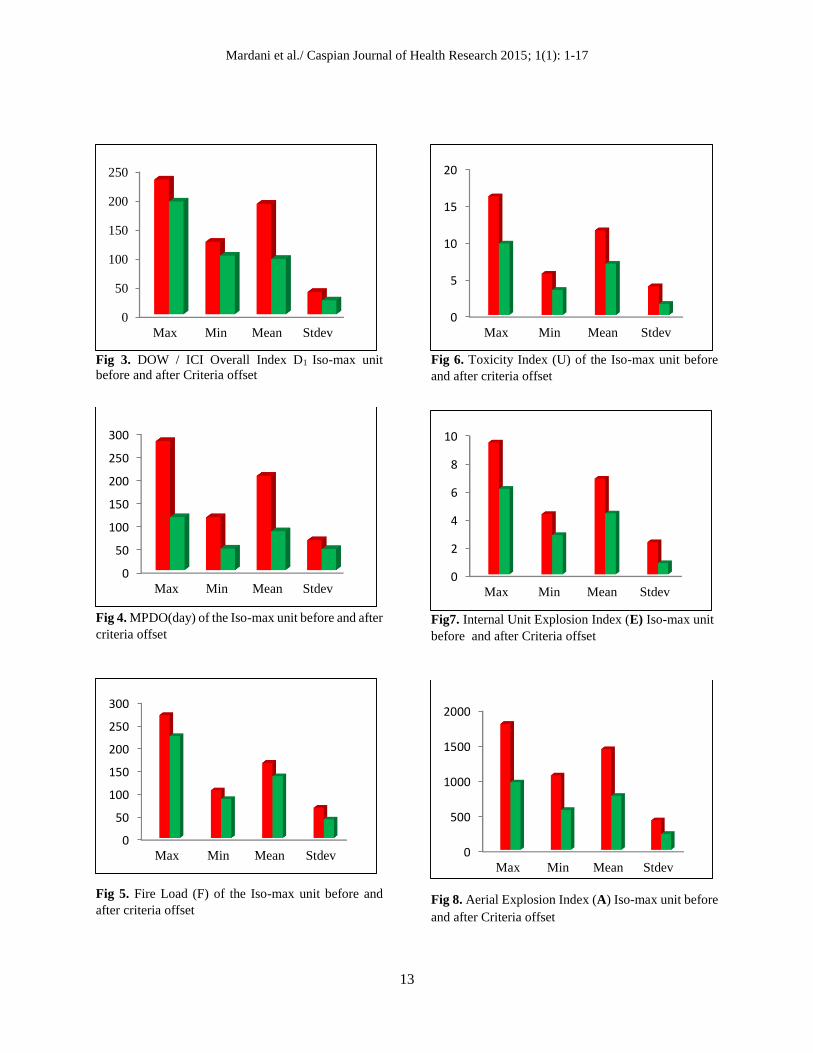
Results: The predicted DOW/ICI Overall
Index D1 for the eight sub-units showed that
the maximum, minimum and mean values of
D1 were 232.4, 124 and 190.4 ± 38.6
respectively. With the application of criteria
offset measures they were reduced to 194.4,
101.2 and 95.4 ± 24.1 respectively (Fig 3).
The statistical paired t-test showed that the
application of the criteria offset measures
significantly (p < 0.001) reduced the D1 mean
value.
According to the results, the catalytic reactor,
with a maximum D1 of 232.4, is the most
critical sub-unit.
At the present conditions, 6 sub-units have
severe risks, while the diesel sputter tower
and reactor feeding furnace both contain very
extreme risks (Table 4). The implementation
of the criteria offset measures reduced the
potential hazard categories significantly
(Table 4).
In the event of a crisis, the plant's distillation
tower would experience the highest outage,
with a Maximum Probable Day Outage
(MPDO) of 280 days), while a failure at the
reactor feeding furnace would shut down the
plant for at least 115 days. After the
implementation of the criteria offset steps,
the plant would be expected to experience
highest and lowest outages of 79 and 77 days
in the event of a fire and explosion at the
catalytic reactor and reactor feeding furnace,
respectively (Fig 4). The mean value of the
MPDO is 204 ± 65.2 days with existing
conditions. It would be expected to be
reduced to 84.6 ± 45.8 days if the criteria
offset measures were applied (Fig 4).
A statistical paired t-test showed that there is
a significant difference (p < 0.001) between
the MPDO mean values at existing
conditions and after the proposed control
measures were applied. The application of
criteria offset measures is expected to reduce
the mean MPDO by 51.2%.
The Iso-max unit would experience a
maximum Fire Load (F) of 270 BTU/sq. ft
and a minimum F of 105 BTU/sq. ft with
failures at the catalytic reactor and distillation
furnace, respectively (Fig 5). The plant
would experience the highest F of 85
BTU/sq. ft and the lowest F of 49.6 BTU/sq.
ft with failures at the distillation furnace and
diesel sputter tower, respectively, following
the implementation of the criteria offset
measures (Fig 5).
The results also showed that the mean F value
of the eight sub-sections considered was 66.5
± 12.8 BTU/sq. ft. The application of the
criteria offset measures would reduce it to
41.2 ± 7.6 BTU/sq. ft (Fig 5), which
significantly differs (p < 0.001) from the
present value.
The predicted Toxicity Index U for the eight
sub-units showed that the maximum,
minimum and mean values of U1 were 16.1,
5.6 and 11.4 ± 3.9 respectively. With the
application of the criteria offset measures
they would be reduced to 9.7, 3.4 and 6.9 ±
1.5 respectively (Fig 6). The statistical paired
t-test showed that the application of the
criteria offset measures significantly (p <
0.001) reduces the U1 mean value.
Mardani et al./ Caspian Journal of Health Research 2015; 1(1): 1-17
13
Fig 3. DOW / ICI Overall Index D1 Iso-max unit
before and after Criteria offset
Fig 4. MPDO(day) of the Iso-max unit before and after
criteria offset
Fig 5. Fire Load (F) of the Iso-max unit before and
after criteria offset
Fig 6. Toxicity Index (U) of the Iso-max unit before
and after criteria offset
Fig7. Internal Unit Explosion Index (E) Iso-max unit
before and after Criteria offset
Fig 8. Aerial Explosion Index (A) Iso-max unit before
and after Criteria offset
0
50
100
150
200
250
Max Min Mean Stdev
0
50
100
150
200
250
300
Max Min Mean Stdev
0
50
100
150
200
250
300
Max Min Mean Stdev
0
2
4
6
8
10
Max Min Mean Stdev
0
500
1000
1500
2000
Max Min Mean Stdev
0
5
10
15
20
Max Min Mean Stdev
Mardani et al./ Caspian Journal of Health Research 2015; 1(1): 1-17
14
According to the results, the distillation
feeding container with a maximum U of
232.4 is the most critical sub-unit. The Iso-
max unit calculations for the Internal Unit
Explosion Index (E) for all eight sub-units
showed that the maximum, minimum and
mean values of E were 9.4, 4.3 and 11.4 ± 3.9
respectively. With the application of the
criteria offset measures they were reduced to
9.7, 3.4 and 6.8 ± 0.8 respectively (Fig 7).
The statistical paired t-test showed that the
application of the criteria offset measures
significantly (p < 0.001) reduced the mean E
value.
According to the results, the catalytic reactor
with a maximum E of 9.4 is the most critical
sub-unit.
The predicted Aerial Explosion Index (A) for
all eight sub-units showed that the maximum,
minimum and mean values of A were 1794,
1062 and 1435.1 ± 423 respectively. With the
application of the criteria offset measures
they were reduced to 964.7, 571 and 771.6 ±
227.4 respectively (Fig 8). The statistical
paired t-test showed that the application of
the criteria offset measures would
significantly (p < 0.001) reduce the A mean
value. According to the results, the catalytic
reactor with a maximum A of 1794 is the
most critical sub-unit.
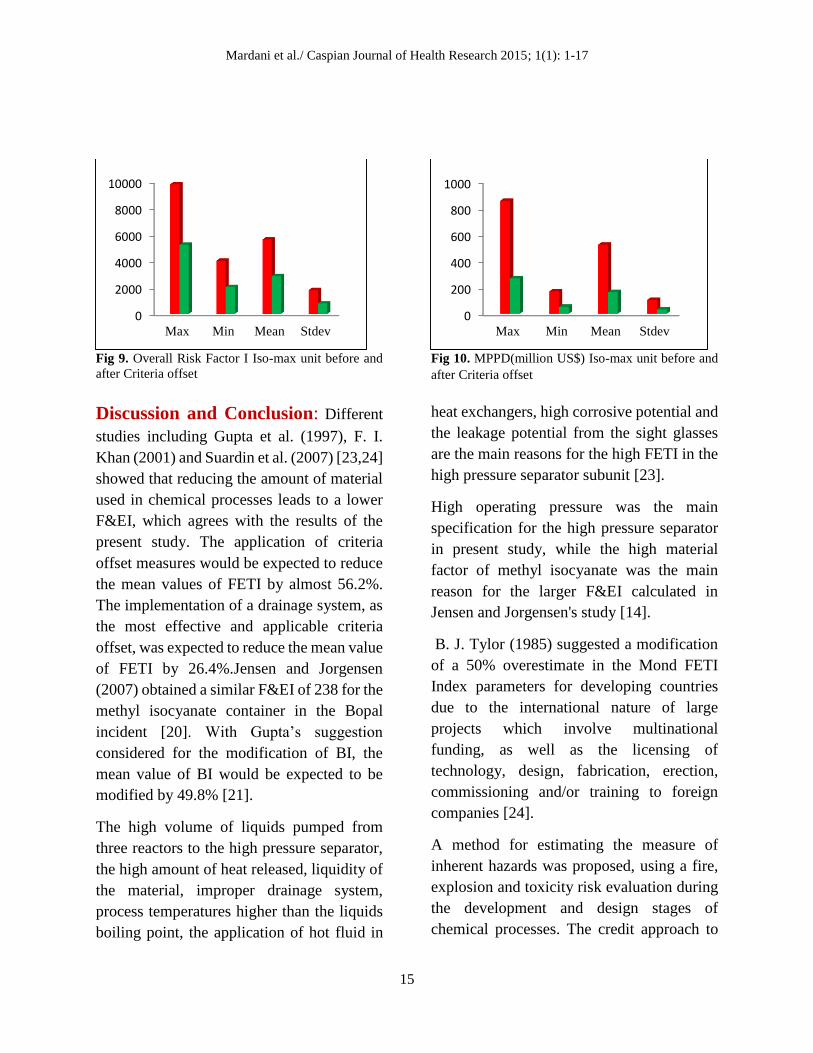
The Iso-max unit Overall Risk Factor, I, for
the eight sub-units showed that the
maximum, minimum and mean values of R
were 9800, 4021 and 5620 ± 1800
respectively. With the application of criteria
offset measures they would be reduced to
5233, 2033 and 2860 ± 789 respectively (Fig
9). The statistical paired t-test showed that
the application of the criteria offset measures
would significantly (p < 0.001) reduce the
mean value of R. According to the results, the
catalytic reactor with a maximum I of 9800 is
the most critical sub-unit.
According to the results, in case of a failure,
the highest, lowest and mean value of the
actual MPPD in the eight sub-units were
$10.1, $3.8 and $7.3 ± 1.4 million US dollars
respectively. With the application of criteria
offset measures they were expected to be
reduced to $3.8, $1.3 and $2.8 ± 0.5 million
US dollars respectively (Fig 10). The
statistical paired t-test showed a significant
difference (p < 0.001) between the actual
MPPD mean values at existing conditions
and following the interventions.
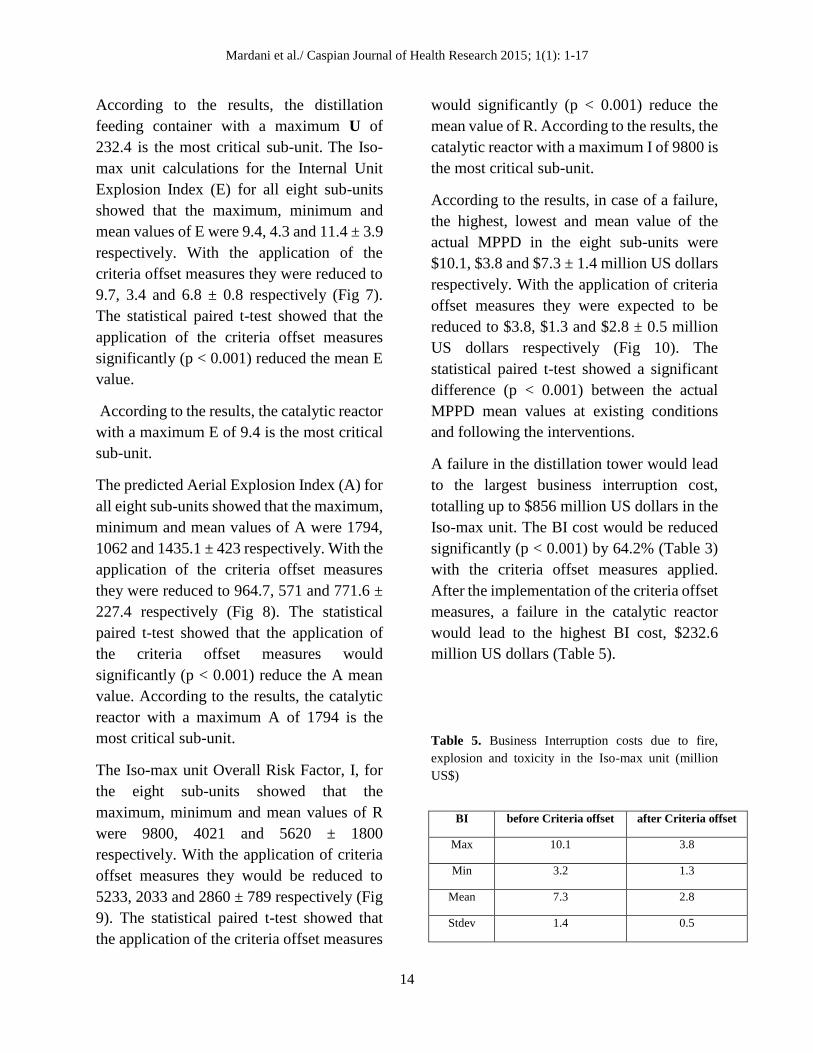
A failure in the distillation tower would lead
to the largest business interruption cost,
totalling up to $856 million US dollars in the
Iso-max unit. The BI cost would be reduced
significantly (p < 0.001) by 64.2% (Table 3)
with the criteria offset measures applied.
After the implementation of the criteria offset
measures, a failure in the catalytic reactor
would lead to the highest BI cost, $232.6
million US dollars (Table 5).
Table 5. Business Interruption costs due to fire,
explosion and toxicity in the Iso-max unit (million
US$)
BI before Criteria offset after Criteria offset
Max 10.1 3.8
Min 3.2 1.3
Mean 7.3 2.8
Stdev 1.4 0.5
Mardani et al./ Caspian Journal of Health Research 2015; 1(1): 1-17
15
Fig 9. Overall Risk Factor I Iso-max unit before and
after Criteria offset
Fig 10. MPPD(million US$) Iso-max unit before and
after Criteria offset
Discussion and Conclusion: Different
studies including Gupta et al. (1997), F. I.
Khan (2001) and Suardin et al. (2007) [23,24]
showed that reducing the amount of material
used in chemical processes leads to a lower
F&EI, which agrees with the results of the
present study. The application of criteria
offset measures would be expected to reduce
the mean values of FETI by almost 56.2%.
The implementation of a drainage system, as
the most effective and applicable criteria
offset, was expected to reduce the mean value
of FETI by 26.4%.Jensen and Jorgensen
(2007) obtained a similar F&EI of 238 for the
methyl isocyanate container in the Bopal
incident [20]. With Gupta’s suggestion
considered for the modification of BI, the
mean value of BI would be expected to be
modified by 49.8% [21].
The high volume of liquids pumped from
three reactors to the high pressure separator,
the high amount of heat released, liquidity of
the material, improper drainage system,
process temperatures higher than the liquids
boiling point, the application of hot fluid in
heat exchangers, high corrosive potential and
the leakage potential from the sight glasses
are the main reasons for the high FETI in the
high pressure separator subunit [23].
High operating pressure was the main
specification for the high pressure separator
in present study, while the high material
factor of methyl isocyanate was the main
reason for the larger F&EI calculated in
Jensen and Jorgensen's study [14].
B. J. Tylor (1985) suggested a modification
of a 50% overestimate in the Mond FETI
Index parameters for developing countries
due to the international nature of large
projects which involve multinational
funding, as well as the licensing of
technology, design, fabrication, erection,
commissioning and/or training to foreign
companies [24].
A method for estimating the measure of
inherent hazards was proposed, using a fire,
explosion and toxicity risk evaluation during
the development and design stages of
chemical processes. The credit approach to
0
2000
4000
6000
8000
10000
Max Min Mean Stdev
0
200
400
600
800
1000
Max Min Mean Stdev
Mardani et al./ Caspian Journal of Health Research 2015; 1(1): 1-17
16
measure inherent hazards can be performed
through chemical concentration- or intake-
based methods. Both the General Process
Hazards Factor (P) and the Special Process
Hazards Factor (S) can be calculated by
standard process module-based approaches
in the PFD stages. To depict a realistic
exposure scenario, the present study used an
oil refinery as its case example. The results of
this assessment may be used to characterize
the exposure risk and to compare design
concepts based on their potential health
impacts.
The Mond FETI method was tested with
eight process subunits for the Iso-max unit.
The results suggest that one sub-unit had a
catastrophic risk, while one had a very
extreme risk for fire, explosion and toxicity;
these sub-units posed the most potential harm
for health and safety. The catalytic reactor at
high pressure was the most critical subunit of
the Iso-max, with a DOW/ICI Index of 232.4.
These figures provide an idea about the
relative exposure levels of the process
concepts considered. The high pressure
separator was the least dangerous subunit,
with a DOW/ICI Index of 222.6. The method
developed is simple and flexible enough for
use by large scale continuous plants using
volatile compounds, such as petrochemical
plants and oil refineries, and can be
performed for any process development or
design phase (preliminary PFD, PFD or PID
stages). The calculation of this method of
measuring inherent hazards varies; however,
depending on which design stage is
considered. The method allows the potential
fire, explosion and toxicity risks of
competing processes or the risk level of a
process already in the development stage to
be foreseen. This, in turn, enables early
actions to be taken with process route
selection or choices of dedicated technology ,
such as leak-proof valves or hermetic pumps
to reduce fire, explosion and toxicity risks.
Acknowledgments: The authors wish to
thank the Science & Research Branch
(Tehran), Islamic Azad University,
Department of HSE Management, Tehran,
Iran as well as the Tehran Oil Refinery for
their technical support. The paper is
excerpted from the author’s thesis.
References:
[1] Crowl DA., Inherently safer chemical processes: A
life cycle approach, New York, AIChE, 1996.
[2] Suardina J., Mannana S., El-Halwagi M., The
integration of Dow's fire and explosion index (F & EI)
into process design and optimization to achieve
inherently safer design. J. Loss. Prevent. Proc.,
2007; 20 (1): 79-90.
[3] Mansfield D., Cassidy K., Inherently safer
approach and how this can be built into the design
process. Institution of Chemical Engineers
Symposium Series 1994; 134: 285-299.
[4] Palaniappan C., Srinivasan R., Tan R., Selection of
inherently safer process routes: a case study. Chem.
Eng. Process., 1997; 43: 647–653.
[5] Wang Y., Development of computer–aided fault
tree synthesis methodology for quantitative risk
analysis in the chemical process industry. PhD thesis,
A&M university college station, TX, 2004.
[6] Hyatt N., Guidelines for Process Hazard Analysis,
Hazard Identification & Risk Analysis, 3rd edition,
Ontario, Canada, Dyadem press, 2003.
Mardani et al./ Caspian Journal of Health Research 2015; 1(1): 1-17
17
[7] Siavapiraksam SP., Surianarayanan M.,
Swaminathan G., Hazard assessment for the safe
storage, manufacturing and handling of flash
compositions. J. Loss. Prevent. Proc., 2009; 22: 254-
256.
[8] Scheffler NE., 1994, Improved fire and explosion
index hazard classification, Process Saf. Prog., 13(4):
214-218.
[9] Khan FI., Sadiq R., Amyotte PR., Evaluation of
Available Indices for Inherently Safer Design Options.
Process Saf. Prog., 2003; 22(2): 83-97.
[10] Hendershot D., Process minimization, making
plants safety. Chem. Eng. Process., 2000; 35-40.
[11] Heikkila AM., Inherent safety in process plant
design: an index based approach. PhD thesis,
Technical Research Center of Finland, VTT, Espoo;
Finland, 1999.
[12] Edward DW., Lawrence D., Assessing the
inherent safety of chemical process routes: Is there a
relation between plant cost and inherent safety?
Process Saf. Environ., 1993; 71B, 252-258.
[13] Gentile M., Development of a hierarchical fuzzy
model for the evaluation of inherent safety. PhD
thesis, College Station, Texas A & M University,
2004.
[14] Suardin J., The integration of Dow's Fire and
Explosion Index into Process Design and
Optimization to achieve an Inherently Safer Design.
MSc thesis, Texas A&M University. Aug 2005.
[15] Etowa CB., Amyotte PR., Pegg MJ., Khan FI.,
Quantification of Inherent Safety Aspect of the Dow
Index. J. Loss. Prevent. Proc., 2002; 15(6): 477-487.
[16] Khan FI., Amyotte PR., How to make inherent
safety practice a reality. Can. J. Chem. Eng. 2003; 81:
1-16.
[17] Jensen N, Jorgensen SB. Taking credit for loss
control measures in the plant with the likely loss Fire
and Explosion Index (LL-F & EI). Process Saf.
Environ., 2007; 85 (B1): 51-58.
[18] Lewis DJ., The Mond Fire, Explosion & Toxicity
Index – A development of the Dow Index. AIChE Loss
Prevention Symposium, Houston 1979; 1-5.
[19] ICI Mond Division, The Mond Index, 2nd edn,
Imperial Chemical Industries plc, Explosion Hazards
Section, Technical Department, Winnington,
Northwich, Cheshire CW8 4DJ (1985).
[20] Lewis DJ., Application of the Mond Fire,
Explosion & Toxicity Index to Plant Layout and
Spacing Distances, J. Loss. Prevent. Proc., 1980; 13-
20.
[21] NFPA Standard No. 325M, Fire Hazard
Properties of Flammable Liquids, Gases and Volatile
Solids, National Fire Prevention Association, Quincy,
Mass. (1969)
[22] Dransfield PB., Lowe DR., Tyler BJ., The
problems involved in designing reliability into a
process in its early research or development stages,
IChemE. Symposium, 1981.
[23] Suardin J., Mannan S., El-Halwagi M., The
integration of Dow’s fire and explosion index (F & EI)
into process design and optimization to achieve
inherently safer design. J. Loss. Prevent. Proc., 2007;
20(1): 79-90.
[24] Etowa CB, Amyotte PR, Pegg MJ, Khan FI.
Quantification of Inherent Safety Aspect of the Dow
Index. J. Loss. Prevent. Proc.,2002; 15(6): 477-487.
[25] Dow Chemical Company, Fire and Explosion
Index – Hazard Classification Guide. 6th edn (1987).
[26] Ramezani A., Iso-max Unit No: 1, Manual
Operation –Tehran refinery; 1990.