Embed Size (px)
Citation preview

Transportation Research Part D 92 (2021) 102725
A1(
AsDJGa
b
c
d
A
KTTDB
1
2aea2boe
ad
h
Contents lists available at ScienceDirect
Transportation Research Part D
journal homepage: www.elsevier.com/locate/trd
coupled macroscopic traffic and pollutant emission modellingystem for Barcelonaaniel Rodriguez-Rey a, Marc Guevara a,∗, Ma Paz Linares b, Josep Casanovas b,c,uan Salmerón b, Albert Soret a, Oriol Jorba a, Carles Tena a, Carlos Pérezarcía-Pando a,d
Barcelona Supercomputing Center, Barcelona, 08034, SpainUniversitat Politècnica de Catalunya-Barcelona Tech UPC, Carrer Jordi Girona 1-3, 08034, Barcelona, SpainComputer Sciences Department, Barcelona Supercomputing Center, Barcelona, 08034, SpainICREA, Catalan Institution for Research and Advanced Studies, Barcelona, 08010, Spain
R T I C L E I N F O
eywords:raffic emissions modellingraffic simulationriving dynamicsarcelona
A B S T R A C T
We present a coupled macroscopic traffic and emission modelling system tailored to theBarcelona metropolitan area that allows estimating hourly road transport emissions at roadlink level. We use the developed system to perform an emission sensitivity analysis of typicallyhigh uncertainty emission features and assess their impact. We also explore the uncertaintiesof our system compared to a microscopic approach in a representative area of Barcelona.The developed macroscopic system shows a high sensitivity to spatially-resolved vehicle fleetcomposition inputs, meteorological effects on diesel engines (+19% in NO𝑥) and non-exhaustsources (80% of total PM emissions). The comparison with the microscopic system shows thatdiscrepancies grow as a function of the congestion level, up to +65% in NO𝑥. The resultingcoupled system will be used in further steps of the research to evaluate the impact of trafficmanagement strategies upon urban emissions and air quality levels in Barcelona.
. Introduction
Air pollution is a public health threat in most urban environments, where road transport is often the main contributor (EEA,019). Nitrogen oxides (NO𝑥) and particulate matter (PM) are of special concern as they are strongly associated with respiratorynd cardiovascular morbidity and premature mortality (Lelieveld et al., 2015). To prevent air pollution, the European Union (EU)stablished the 2008/50/EC EU Ambient Air Quality Directive (AQD), which sets maximum concentration limit values for specificir pollutants. Yet, most of the largest European urban conurbations struggle to meet the AQD for NO2 and especially PM (EEA,019). In the city of Barcelona (Spain), chronic nitrogen dioxides (NO2) and fine particular matter (PM2.5) concentrations exceedoth the AQD limit values and the World Health Organization air quality guidelines (ASPB, 2018). Consequently, Barcelona andther large urban conurbations have been forced to apply action plans to improve their air quality by reducing traffic activity andmissions.
The AQD encourages the use of numerical models in the evaluation of air quality plans. In this context, the combination of trafficnd emission factor models has become an extended practice to generate emission modelling inputs and derive traffic emissions atifferent scales (i.e macroscopic, mesoscopic and microscopic). While the precise definition of scales differs for traffic and emission
∗ Corresponding author.
vailable online 28 January 2021361-9209/© 2021 The Authors. Published by Elsevier Ltd. This is an open access article under the CC BY license
http://creativecommons.org/licenses/by/4.0/).
E-mail address: [email protected] (M. Guevara).
ttps://doi.org/10.1016/j.trd.2021.102725
Transportation Research Part D 92 (2021) 102725D. Rodriguez-Rey et al.
saea(te
av
bacbm
Glossary
AIMSUN Advanced Interactive Microscopic Simulator for Urban and Non-Urban NetworksAQD Air Quality DirectiveCARNET Cooperative Automotive Research NetworkCOPERT Computer Programme to Calculate Emissions from Road TransportDTA Dynamic Traffic AssignmentHBEFA Handbook Emission Factors for Road TransportHDV Heavy Duty VehicleHERMES High-Elective Resolution Modelling Emission SystemLDV Light Duty VehicleOD Origin–DestinationPC Passenger CarPHEM Passenger Car and Heavy Duty Emission ModelSTA Static Traffic AssignmentVML Virtual Mobility Lab
factor models, in both cases they are related to the resolution of the vehicle dynamics, rather than to the spatial or temporalresolution. For emission factor models, resolution is related to the level of aggregation of vehicle dynamics (Smit et al., 2008),which ranges from using average speed and total flow per segment in macroscopic models (e.g. COPERT (EMEP/EEA, 2017)), toinstantaneous speed per vehicle for microscopic models (e.g. PHEM (Hausberger et al., 2009)). The scale of traffic simulators isrelated to the traffic assignment method, either Static Traffic Assignment (STA) or Dynamic Traffic Assignment (DTA) – the latterresolving travel demand time-dependent flow conditions in a more realistic way (Zhou et al., 2015) – and to the level of aggregationof the demand that is used to resolve vehicle-to-vehicle interactions.
There is an extensive literature with case studies of coupled traffic simulators and traffic emission models at differentcales (Fontes et al., 2015; Osorio and Nanduri, 2015). It is generally accepted that traffic emissions derived from microscopicpproaches using DTA are more accurate than those estimated with a macroscopic system, due to a better vehicle dynamicsstimation, small time-step and ability to capture congestion behaviour. Some examples of the better performance of microscopicpproaches compared to macroscopic can be found in Quaassdorff et al. (2016), Tu et al. (2018), Zhang et al. (2011) and Lejri et al.2018). However, in contrast to the macroscopic approach, the microscopic one is typically limited to very localised sites due tohe detailed data needed by the traffic model and the high computational load (Fallah Shorshani et al., 2015; Tu et al., 2018; Lejrit al., 2018), which hampers its applicability for evaluating traffic emissions at city or metropolitan level.
Despite some of the inherent limitations of a macroscopic system, recent studies have shown that large improvements can still bechieved by focusing on a better representation of critical components such as the vehicle emission rates, vehicle activity patterns andehicle fleet distribution. In the Île-de-France André et al. (2018) found as much as 14% and 11% more NO𝑥 and VOC emissions
when using the observed vehicle fleet composition compared to the registered one due to a higher presence of diesel vehicles.In Madrid, Pérez et al. (2019) also found a large difference between the fraction of observed (70%) and registered (47%) dieselpowered vehicles. Grange et al. (2019) reported a large previously unaccounted temperature effect on emissions, with an estimated38% average increase in NO𝑥 diesel emissions in Europe. Results from this study are independent from the cold-start effect, whichcan additionally increase NO𝑥 emissions by up to 39% and 166% for diesel and gasoline vehicles respectively (Faria et al., 2018).Amato et al. (2014) showed that resuspension alone can contribute as much PM as tailpipe emissions, that with the addition of othernon-ehxaust sources (e.g. road, tyre and brake wear) increase the total weight of non-exhaust over PM totals, as reported by Martiniand Grigoratos (2014) and Rexeis and Hausberger (2009). However, in other studies the estimated emissions are often limited toexhaust (Chen et al., 2017; Fontes et al., 2015), or non-exhaust wear emissions (Pérez et al., 2019), but few of them include alsoresuspension.
The coupling of traffic and emission models also allows to estimate the emission impact that different mobility policies couldimply, since the traffic flow response to modifications on the network is also simulated. In Barcelona, traffic emissions are currentlycalculated with regional and local data inventories. The followed methodology is based on static traffic flow data and therefore itis unable to quantify the changes in mobility patterns induced by the application of traffic management strategies.
In this study, we present the development of a macroscopic traffic-emission coupled system tailored and tested for Barcelonausing multiple sources of local data (e.g. GPS based measurements, traffic loop detectors or a remote sensing device campaign).The coupled system estimates high resolution traffic emissions for the first crown of the Metropolitan Area of Barcelona, an areawith more than two million inhabitants, a vehicle density of approximately 6.000 vehicles km−2 and 26% of the daily trips doney private transport (Ajuntament de Barcelona, 2017). The developed system is used to: (i) quantify hourly and street-level NO𝑥nd PM10 emissions for the year 2017 and (ii) provide an extensive analysis of some key features implemented upon the emissionalculation, including spatially-constrained vehicle fleet composition, meteorological influences, non-exhaust PM sources and publicus transport routing. We further evaluate and discuss the expected uncertainties of our macroscopic system in comparison to aicroscopic approach in a specific area of the city.
2

Transportation Research Part D 92 (2021) 102725D. Rodriguez-Rey et al.
Fig. 1. Schematic representation of the macroscopic and microscopic coupling approaches.
Section 2 provides a description of the study domain, the traffic and emission models used, the input data and the calibrationand coupling processes. In Section 3, we (i) show the annual emission modelling results, (ii) evaluate the impact upon emissionsof some of the key inputs implemented and (iii) analyse the uncertainties of our system in comparison to a microscopic approach.Section 4 presents the conclusions.
2. Methodology
In this section, we describe the macroscopic traffic and emission models along with their calibration and coupling. We alsodescribe the microscopic system used for comparison. A schematic representation of the macroscopic and microscopic couplingapproaches is shown in Fig. 1.
2.1. BCN-VML: Macroscopic traffic modelling
The traffic model is based on the detailed multimodal transport model Barcelona Virtual Mobility Lab (BCN-VML), which uses thePTV Visum platform (Montero et al., 2018). BCN-VML was developed within the framework of the Cooperative Automotive ResearchNetwork (CARNET) initiative (CARNET, 2017), a knowledge hub for automotive science and technology, and in collaboration withSEAT, PTV IBERIA, Volkswagen Group Research and the Universitat Politècnica de Catalunya (UPC).
The BCN-VML working domain comprises the First Crown of the Metropolitan Area of Barcelona plus a large extension includingits access highways. The demand of BCN-VML is composed of almost 4 million trips, distributed in 265.000 links and 625 zones.For computational time optimisation, two working domains with different levels of detail are used. The first one covers a large areaof around 6.000km2. This domain is less detailed and mostly focuses on highways and national roads. The second domain, whichis the focus of the present study, comprises a detailed build of Barcelona and 17 municipalities surrounding the city, gathering apopulation of more than two million inhabitants (Institut d’Estadística de Catalunya, 2019) (Fig. 2a). The wider domain allows theBCN-VML to properly diverge the traffic into the different accesses of the city. In this way we avoid forcing the entrance through aparticular city access according to its adjacent outflow zone, without adding an excessive load to the simulation.
The road network was built based on geographical maps from HERE (Here, 2020), with manual edition for specific areas. It hasa hierarchy of 12 different link types which hold different road capacities, speed limit and Volume Delay Functions which penalisetotal travel time through a link (Kucharski Rafałand Drabicki, 2017).
Finally, the traffic demand data needed to perform the private transport traffic assignment between pairs of transport zones, theorigin–destination matrices, were obtained from mobile phone KINEO (Kineo, 2017) from March 2017. Public transport (bus lineroutes, stops and frequencies) were built according to the public transport data of the Metropolitan Area of Barcelona (TMB, 2019).Since buses cannot circulate through all of the available network, the public bus transport is associated with a different simulationprocess than the private transport. More details are provided in Section 2.3.
2.1.1. Calibration of the BCN-VMLThe calibration of the BCN-VML model requires adjusting the estimated traffic flow and vehicle speed. The calibration of the
BCN-VML estimated traffic flow for the city of Barcelona and its access roads was performed using observed hourly business-as-usual daily traffic flow data from 138 local automatic loop detectors from the Barcelona network (Ajuntament de Barcelona, 2019)
3

Transportation Research Part D 92 (2021) 102725D. Rodriguez-Rey et al.
Fig. 2. (a) Representation of the BCN-VML road network and associated business as usual daily traffic used in the present study, which comprises the city ofBarcelona and its surrounding municipalities. Dark green squares indicate the 138 permanent loop detectors used to calibrate the vehicle flow. (b) Regressionplot showing observed vs modelled flow (103 number of vehicles) from a 24 h simulation with BCN-VML. 138 observations, RMSE = 35%, 𝑅2 = 0.77, meanrelative error = 27%.
(Fig. 2a). Some network properties such as road lane capacity and allowed turnings had to be manually adjusted along with thedemand to further minimise discrepancies with observations. The comparison between simulated and observed traffic flows showsa 𝑅2 of 0.77 (Fig. 2b).
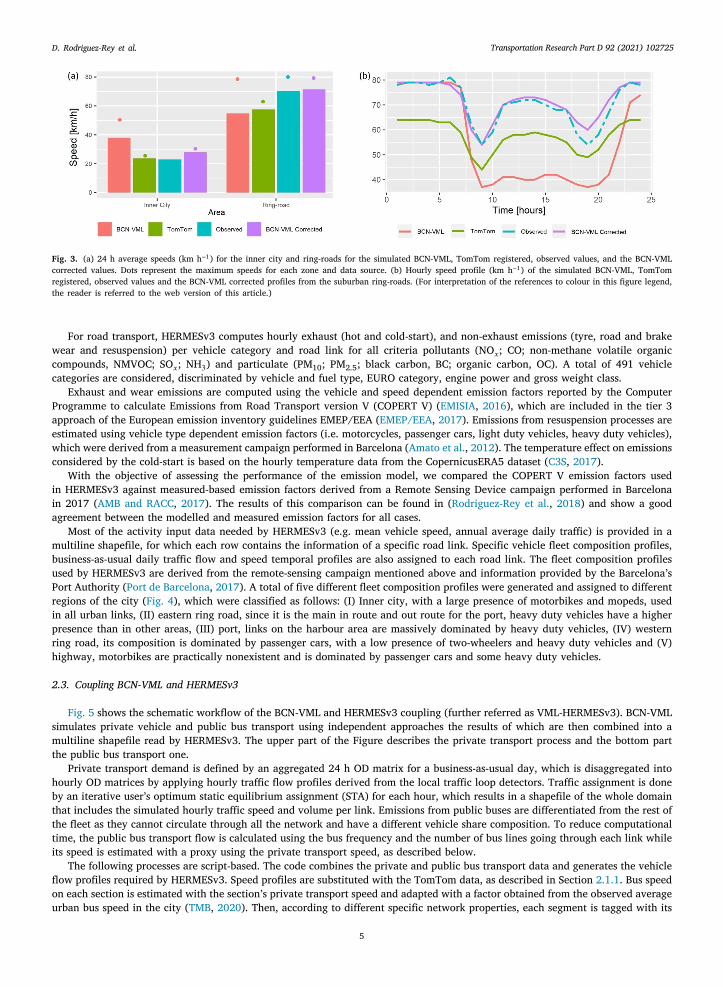
The calibration of the BCN-VML estimated vehicle speed was done based on three different sources of information: (I) TomTomGPS-based historical hourly average speeds (TomTom, 2019), (II) average speed circulation statistics reported by the Barcelona citycouncil (Ajuntament de Barcelona, 2017) and (III) measured hourly speed values reported from permanent detectors located in thesuburban ring-roads (Barcelona city council, Mobility and transport department, personal communication, 2017). The comparisonbetween simulated and observed speed values (hourly maximum and daily average) is summarised in Fig. 3a. The results areprovided separately for the inner city, where the speed limit varies between 30 and 50 km/h, and the ring-roads, where the speedlimit varies between 60 and 80 km/h depending on the road section. The BCN-VML vehicle speed overestimated the average speedvalues at the inner city area by a 65%. Additionally, the hourly speed profiles were neither matching the TomTom speed profilesnor the measured hourly speed values (Fig. 3b). The overestimated speed values at the inner city from the BCN-VML output area consequence of the lack of intersection stopping time. BCN-VML’s speeds are at link level, without considering what happensat nodes (i.e. intersections), hence there is no stopping time for each route, leading to unrealistic high speed values, close to thespeed limit. On the other hand, the wrong speed profiling from BCN-VML is related to the traffic assignment methodology. STAestimates speeds by the volume delay functions, which depends directly on the traffic flow of the simulated hour, generating anartificial speed profile which does not represent correctly the speed behaviour. In reality, traffic speed is not directly proportionalto traffic flow. Instead, it has a steady value near to maximum until congestion is achieved, which happens at a certain point oftraffic density, as reported in Thomson and Bull (2002). This behaviour is characteristic of STA and will be explained in Section 3.3when compared with a microscopic DTA approach. To overcome this, the substitution of the BCN-VML estimated speeds by theTomTom speed values would only partially solve the issue. As seen by Fig. 3b TomTom speeds underestimate the observed valuesat the city ring-roads. This bias in TomTom speed values has already been seen in other studies (Gwara, 2017) and a possible reasoncould reside in that most of the people using these devices in the city are unfamiliar with the route they are following and thereforetheir speed is lower than the average of other vehicles. The solution applied to correct the estimated vehicle speeds goes throughtwo steps: (1) the BCN-VML speed profile was replaced by the TomTom-based speed profiles, and (2) the estimated speeds by theBCN-VML at the inner city were reduced with a scalability factor obtained from the observed average urban speed. The correctionsto the estimated speed profile and maximum speed are shown in Fig. 3.
2.2. HERMESv3: Macroscopic emission modelling
The emission model used is the High-Elective Resolution Modelling Emission System version 3 (HERMESv3) developed at theBarcelona Supercomputing Center (Guevara et al., 2020). HERMESv3 estimates anthropogenic emissions at high spatial- (e.g. roadlink level) and temporal- (hourly) resolution using state-of-the-art and bottom-up calculation methods that combine local activityand emission factors along with meteorological data.
4
Transportation Research Part D 92 (2021) 102725D. Rodriguez-Rey et al.
Fig. 3. (a) 24 h average speeds (km h−1) for the inner city and ring-roads for the simulated BCN-VML, TomTom registered, observed values, and the BCN-VMLcorrected values. Dots represent the maximum speeds for each zone and data source. (b) Hourly speed profile (km h−1) of the simulated BCN-VML, TomTomregistered, observed values and the BCN-VML corrected profiles from the suburban ring-roads. (For interpretation of the references to colour in this figure legend,the reader is referred to the web version of this article.)
For road transport, HERMESv3 computes hourly exhaust (hot and cold-start), and non-exhaust emissions (tyre, road and brakewear and resuspension) per vehicle category and road link for all criteria pollutants (NO𝑥; CO; non-methane volatile organiccompounds, NMVOC; SO𝑥; NH3) and particulate (PM10; PM2.5; black carbon, BC; organic carbon, OC). A total of 491 vehiclecategories are considered, discriminated by vehicle and fuel type, EURO category, engine power and gross weight class.
Exhaust and wear emissions are computed using the vehicle and speed dependent emission factors reported by the ComputerProgramme to calculate Emissions from Road Transport version V (COPERT V) (EMISIA, 2016), which are included in the tier 3approach of the European emission inventory guidelines EMEP/EEA (EMEP/EEA, 2017). Emissions from resuspension processes areestimated using vehicle type dependent emission factors (i.e. motorcycles, passenger cars, light duty vehicles, heavy duty vehicles),which were derived from a measurement campaign performed in Barcelona (Amato et al., 2012). The temperature effect on emissionsconsidered by the cold-start is based on the hourly temperature data from the CopernicusERA5 dataset (C3S, 2017).
With the objective of assessing the performance of the emission model, we compared the COPERT V emission factors usedin HERMESv3 against measured-based emission factors derived from a Remote Sensing Device campaign performed in Barcelonain 2017 (AMB and RACC, 2017). The results of this comparison can be found in (Rodriguez-Rey et al., 2018) and show a goodagreement between the modelled and measured emission factors for all cases.
Most of the activity input data needed by HERMESv3 (e.g. mean vehicle speed, annual average daily traffic) is provided in amultiline shapefile, for which each row contains the information of a specific road link. Specific vehicle fleet composition profiles,business-as-usual daily traffic flow and speed temporal profiles are also assigned to each road link. The fleet composition profilesused by HERMESv3 are derived from the remote-sensing campaign mentioned above and information provided by the Barcelona’sPort Authority (Port de Barcelona, 2017). A total of five different fleet composition profiles were generated and assigned to differentregions of the city (Fig. 4), which were classified as follows: (I) Inner city, with a large presence of motorbikes and mopeds, usedin all urban links, (II) eastern ring road, since it is the main in route and out route for the port, heavy duty vehicles have a higherpresence than in other areas, (III) port, links on the harbour area are massively dominated by heavy duty vehicles, (IV) westernring road, its composition is dominated by passenger cars, with a low presence of two-wheelers and heavy duty vehicles and (V)highway, motorbikes are practically nonexistent and is dominated by passenger cars and some heavy duty vehicles.
2.3. Coupling BCN-VML and HERMESv3
Fig. 5 shows the schematic workflow of the BCN-VML and HERMESv3 coupling (further referred as VML-HERMESv3). BCN-VMLsimulates private vehicle and public bus transport using independent approaches the results of which are then combined into amultiline shapefile read by HERMESv3. The upper part of the Figure describes the private transport process and the bottom partthe public bus transport one.
Private transport demand is defined by an aggregated 24 h OD matrix for a business-as-usual day, which is disaggregated intohourly OD matrices by applying hourly traffic flow profiles derived from the local traffic loop detectors. Traffic assignment is doneby an iterative user’s optimum static equilibrium assignment (STA) for each hour, which results in a shapefile of the whole domainthat includes the simulated hourly traffic speed and volume per link. Emissions from public buses are differentiated from the rest ofthe fleet as they cannot circulate through all the network and have a different vehicle share composition. To reduce computationaltime, the public bus transport flow is calculated using the bus frequency and the number of bus lines going through each link whileits speed is estimated with a proxy using the private transport speed, as described below.
The following processes are script-based. The code combines the private and public bus transport data and generates the vehicleflow profiles required by HERMESv3. Speed profiles are substituted with the TomTom data, as described in Section 2.1.1. Bus speedon each section is estimated with the section’s private transport speed and adapted with a factor obtained from the observed averageurban bus speed in the city (TMB, 2020). Then, according to different specific network properties, each segment is tagged with its
5

Transportation Research Part D 92 (2021) 102725D. Rodriguez-Rey et al.
Fig. 4. BCN-VML domain showing the road types classification used. The grey area shows the limits of the municipality of Barcelona, black segments representall urban links, inside and outside Barcelona municipality, red and green links indicate eastern and western ring-road respectively, clear brown links representthe port and clear blue links highways. (For interpretation of the references to colour in this figure legend, the reader is referred to the web version of thisarticle.)
Fig. 5. Schematic representation of the VML-HERMESv3 coupling, including: Input data, main and intermediate processes and output data. The upper part ofthe workflow describes the steps associated with private transport while the bottom part describes the public bus transport.
respective zone (e.g. inner city, western ring road, port...). The zone tag will be later read by HERMESv3 to assign the respectivefleet composition, prepared aside.
HERMESv3 uses the resulting private and public bus transport multiline shapefile to estimate total hourly emissions per linkaccording to the traffic flow, average link speed and vehicle fleet composition information associated to each section along with theCOPERT V emission factors and meteorological information.
2.4. Aimsun–PHEMLight: Microscopic coupled system
We compare our macroscopic coupled system to a microscopic coupled system composed of the traffic simulator AimsunNext (Barceló, 2011) and the instantaneous emission model PHEMLight (Reixis et al., 2014) over a small area of the city. AimsunNext allows estimating the position and speed of every vehicle in the network based on its car-following model. PHEMLight is asimplified version of PHEM (Passenger car and Heavy duty Emission Model) that works with instantaneous vehicle specific powerdeveloped to work with a traffic simulator. A schematic workflow of the coupling is shown in Fig. 1.
6
Transportation Research Part D 92 (2021) 102725D. Rodriguez-Rey et al.
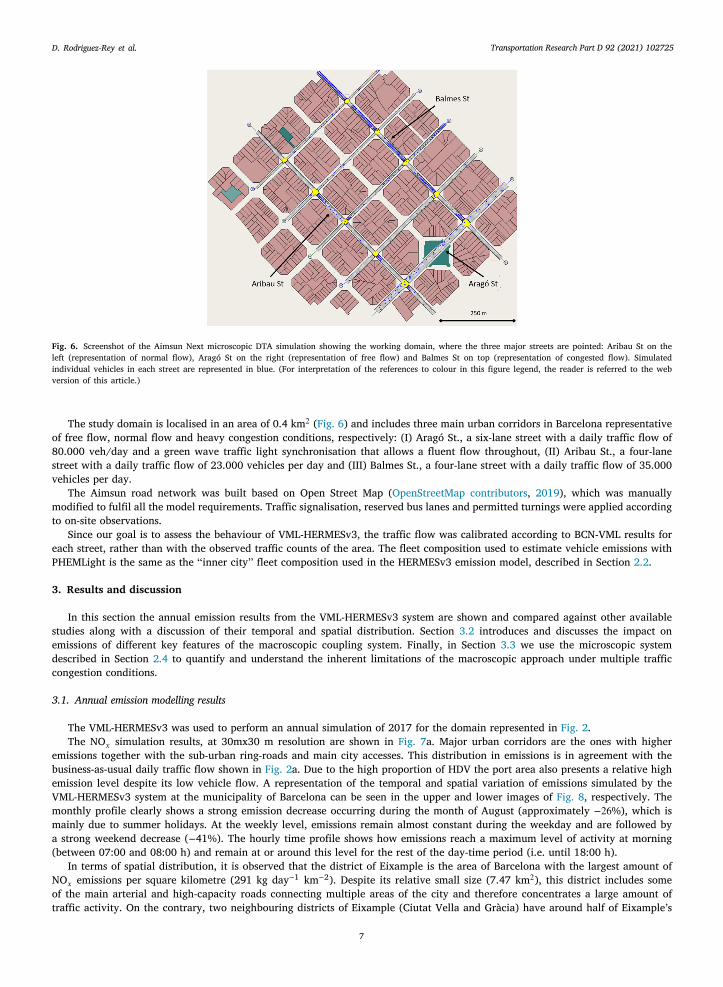
Fig. 6. Screenshot of the Aimsun Next microscopic DTA simulation showing the working domain, where the three major streets are pointed: Aribau St on theleft (representation of normal flow), Aragó St on the right (representation of free flow) and Balmes St on top (representation of congested flow). Simulatedindividual vehicles in each street are represented in blue. (For interpretation of the references to colour in this figure legend, the reader is referred to the webversion of this article.)
The study domain is localised in an area of 0.4 km2 (Fig. 6) and includes three main urban corridors in Barcelona representativeof free flow, normal flow and heavy congestion conditions, respectively: (I) Aragó St., a six-lane street with a daily traffic flow of80.000 veh/day and a green wave traffic light synchronisation that allows a fluent flow throughout, (II) Aribau St., a four-lanestreet with a daily traffic flow of 23.000 vehicles per day and (III) Balmes St., a four-lane street with a daily traffic flow of 35.000vehicles per day.
The Aimsun road network was built based on Open Street Map (OpenStreetMap contributors, 2019), which was manuallymodified to fulfil all the model requirements. Traffic signalisation, reserved bus lanes and permitted turnings were applied accordingto on-site observations.
Since our goal is to assess the behaviour of VML-HERMESv3, the traffic flow was calibrated according to BCN-VML results foreach street, rather than with the observed traffic counts of the area. The fleet composition used to estimate vehicle emissions withPHEMLight is the same as the ‘‘inner city’’ fleet composition used in the HERMESv3 emission model, described in Section 2.2.
3. Results and discussion
In this section the annual emission results from the VML-HERMESv3 system are shown and compared against other availablestudies along with a discussion of their temporal and spatial distribution. Section 3.2 introduces and discusses the impact onemissions of different key features of the macroscopic coupling system. Finally, in Section 3.3 we use the microscopic systemdescribed in Section 2.4 to quantify and understand the inherent limitations of the macroscopic approach under multiple trafficcongestion conditions.
3.1. Annual emission modelling results
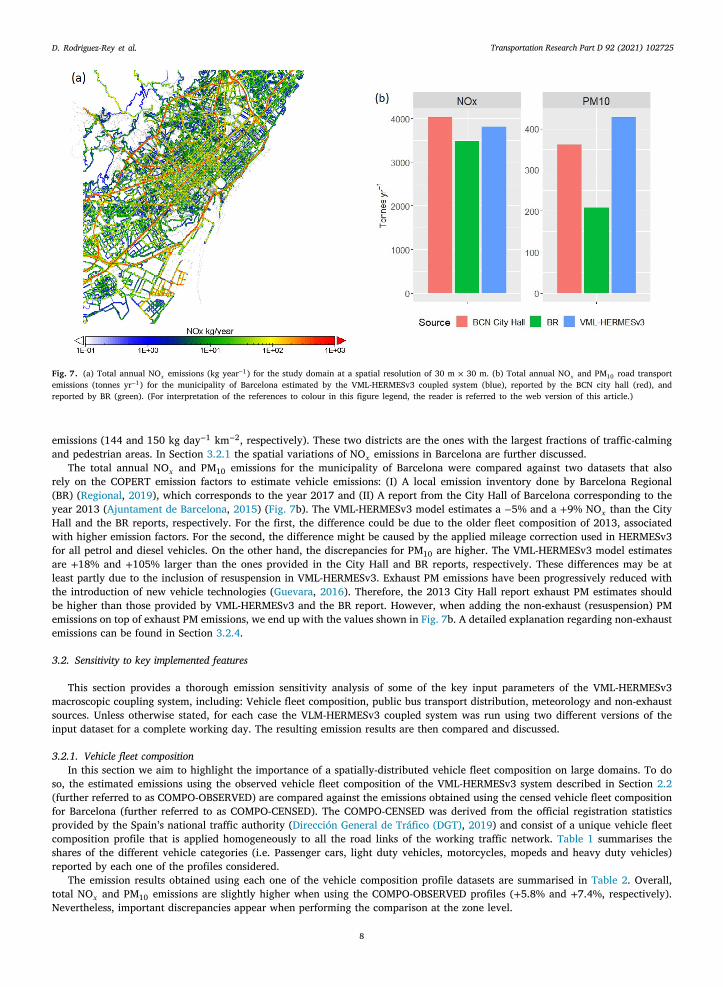
The VML-HERMESv3 was used to perform an annual simulation of 2017 for the domain represented in Fig. 2.The NO𝑥 simulation results, at 30mx30 m resolution are shown in Fig. 7a. Major urban corridors are the ones with higher
emissions together with the sub-urban ring-roads and main city accesses. This distribution in emissions is in agreement with thebusiness-as-usual daily traffic flow shown in Fig. 2a. Due to the high proportion of HDV the port area also presents a relative highemission level despite its low vehicle flow. A representation of the temporal and spatial variation of emissions simulated by theVML-HERMESv3 system at the municipality of Barcelona can be seen in the upper and lower images of Fig. 8, respectively. Themonthly profile clearly shows a strong emission decrease occurring during the month of August (approximately −26%), which ismainly due to summer holidays. At the weekly level, emissions remain almost constant during the weekday and are followed bya strong weekend decrease (−41%). The hourly time profile shows how emissions reach a maximum level of activity at morning(between 07:00 and 08:00 h) and remain at or around this level for the rest of the day-time period (i.e. until 18:00 h).
In terms of spatial distribution, it is observed that the district of Eixample is the area of Barcelona with the largest amount ofNO𝑥 emissions per square kilometre (291 kg day−1 km−2). Despite its relative small size (7.47 km2), this district includes someof the main arterial and high-capacity roads connecting multiple areas of the city and therefore concentrates a large amount oftraffic activity. On the contrary, two neighbouring districts of Eixample (Ciutat Vella and Gràcia) have around half of Eixample’s
7
Transportation Research Part D 92 (2021) 102725D. Rodriguez-Rey et al.
Fig. 7. (a) Total annual NO𝑥 emissions (kg year−1) for the study domain at a spatial resolution of 30 m × 30 m. (b) Total annual NO𝑥 and PM10 road transportemissions (tonnes yr−1) for the municipality of Barcelona estimated by the VML-HERMESv3 coupled system (blue), reported by the BCN city hall (red), andreported by BR (green). (For interpretation of the references to colour in this figure legend, the reader is referred to the web version of this article.)
emissions (144 and 150 kg day−1 km−2, respectively). These two districts are the ones with the largest fractions of traffic-calmingand pedestrian areas. In Section 3.2.1 the spatial variations of NO𝑥 emissions in Barcelona are further discussed.
The total annual NO𝑥 and PM10 emissions for the municipality of Barcelona were compared against two datasets that alsorely on the COPERT emission factors to estimate vehicle emissions: (I) A local emission inventory done by Barcelona Regional(BR) (Regional, 2019), which corresponds to the year 2017 and (II) A report from the City Hall of Barcelona corresponding to theyear 2013 (Ajuntament de Barcelona, 2015) (Fig. 7b). The VML-HERMESv3 model estimates a −5% and a +9% NO𝑥 than the CityHall and the BR reports, respectively. For the first, the difference could be due to the older fleet composition of 2013, associatedwith higher emission factors. For the second, the difference might be caused by the applied mileage correction used in HERMESv3for all petrol and diesel vehicles. On the other hand, the discrepancies for PM10 are higher. The VML-HERMESv3 model estimatesare +18% and +105% larger than the ones provided in the City Hall and BR reports, respectively. These differences may be atleast partly due to the inclusion of resuspension in VML-HERMESv3. Exhaust PM emissions have been progressively reduced withthe introduction of new vehicle technologies (Guevara, 2016). Therefore, the 2013 City Hall report exhaust PM estimates shouldbe higher than those provided by VML-HERMESv3 and the BR report. However, when adding the non-exhaust (resuspension) PMemissions on top of exhaust PM emissions, we end up with the values shown in Fig. 7b. A detailed explanation regarding non-exhaustemissions can be found in Section 3.2.4.
3.2. Sensitivity to key implemented features
This section provides a thorough emission sensitivity analysis of some of the key input parameters of the VML-HERMESv3macroscopic coupling system, including: Vehicle fleet composition, public bus transport distribution, meteorology and non-exhaustsources. Unless otherwise stated, for each case the VLM-HERMESv3 coupled system was run using two different versions of theinput dataset for a complete working day. The resulting emission results are then compared and discussed.
3.2.1. Vehicle fleet compositionIn this section we aim to highlight the importance of a spatially-distributed vehicle fleet composition on large domains. To do
so, the estimated emissions using the observed vehicle fleet composition of the VML-HERMESv3 system described in Section 2.2(further referred to as COMPO-OBSERVED) are compared against the emissions obtained using the censed vehicle fleet compositionfor Barcelona (further referred to as COMPO-CENSED). The COMPO-CENSED was derived from the official registration statisticsprovided by the Spain’s national traffic authority (Dirección General de Tráfico (DGT), 2019) and consist of a unique vehicle fleetcomposition profile that is applied homogeneously to all the road links of the working traffic network. Table 1 summarises theshares of the different vehicle categories (i.e. Passenger cars, light duty vehicles, motorcycles, mopeds and heavy duty vehicles)reported by each one of the profiles considered.
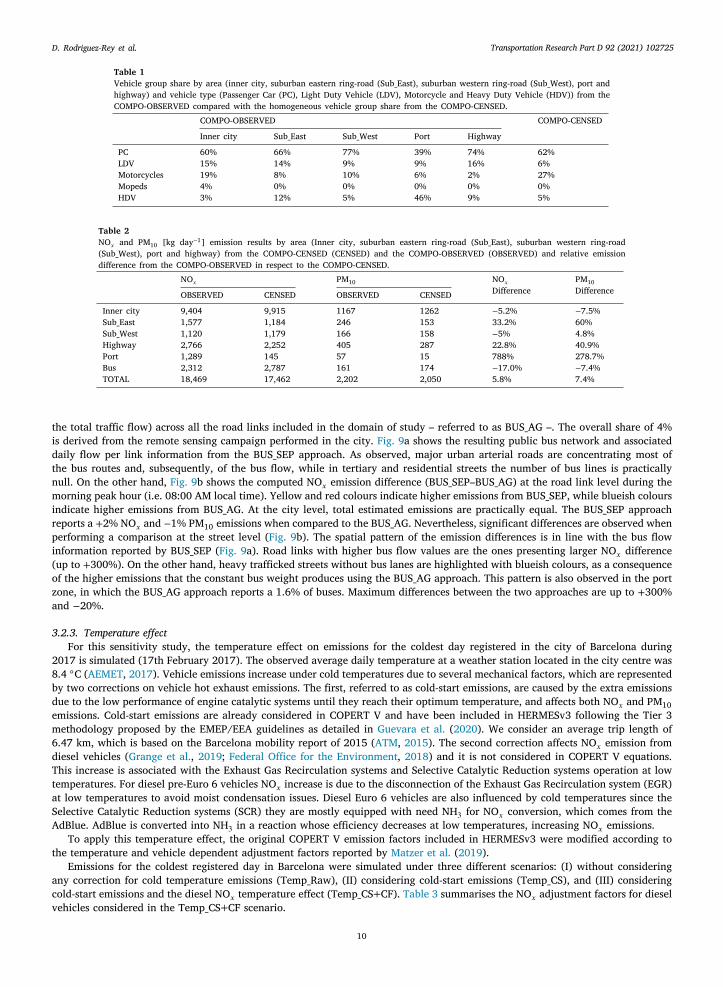
The emission results obtained using each one of the vehicle composition profile datasets are summarised in Table 2. Overall,total NO𝑥 and PM10 emissions are slightly higher when using the COMPO-OBSERVED profiles (+5.8% and +7.4%, respectively).Nevertheless, important discrepancies appear when performing the comparison at the zone level.
8

Transportation Research Part D 92 (2021) 102725D. Rodriguez-Rey et al.
Fig. 8. (a) Monthly, weekly and diurnal variation of NO𝑥 emissions (kg h−1) in Barcelona. (b) Spatial distribution of daily average NO𝑥 emissions (kg day−1 km−2)at the district level.
1. The inner city presents a low discrepancy between emission results (−5.2% NO𝑥 and −7.5% PM10 when using COMPO-OBSERVED), which is in line with the fact that both datasets present similar shares of general vehicle categories (Table 1).Discrepancies are mainly related to the different age and fuel distributions assumed in each case. For instance, in the caseof passenger cars, the average age is of 8 years in the COMPO-OBSERVED dataset, whereas in the COMPO-CENSED is of11 years.
2. At the port the predominance of HDV on the COMPO-OBSERVED (46% of the total vehicle share) enlarges NO𝑥 and PM10emissions by +788% and +279%, respectively.
3. The COMPO-OBSERVED eastern ring road NO𝑥 and PM10 emissions are a +33.2% and a +60% higher than the COMPO-CENSED. This difference is due to the large amount of cargo vehicles (HDV and LDV) on the COMPO-OBSERVED. Note thatthe high difference in PM10 is due to wear emissions, which increase with increasing speed, and resuspension which increasewith vehicle weight.
4. For the bus fleet, the COMPO-OBSERVED has a 41.84% of CNG buses in contrast with the 5% from the COMPO-CENSED.This leads to NO𝑥 and PM10 emission estimates a −17% and −7.4% lower for the COMPO-OBSERVED dataset in respect tothe COMPO-CENSED. Note that the CNG-bus emission factor for NO𝑥 is approximately 60% lower than the diesel bus one.
Although differences in the overall emission estimates are minor, the vehicle share discriminated by zones has shown animportant effect on the spatial distribution of the emission estimation.
3.2.2. Public transport bus serviceIn this section, the emissions from the specific public bus traffic network that was built using the BCN-VML traffic simulator
(see Section 2.3) – referred to as BUS_SEP – are compared against an homogeneous distribution of this vehicle category (i.e. 4% of
9
Transportation Research Part D 92 (2021) 102725D. Rodriguez-Rey et al.
a
3
28bdem6dTtaSA
t
acv
Table 1Vehicle group share by area (inner city, suburban eastern ring-road (Sub_East), suburban western ring-road (Sub_West), port andhighway) and vehicle type (Passenger Car (PC), Light Duty Vehicle (LDV), Motorcycle and Heavy Duty Vehicle (HDV)) from theCOMPO-OBSERVED compared with the homogeneous vehicle group share from the COMPO-CENSED.
COMPO-OBSERVED COMPO-CENSED
Inner city Sub_East Sub_West Port Highway
PC 60% 66% 77% 39% 74% 62%LDV 15% 14% 9% 9% 16% 6%Motorcycles 19% 8% 10% 6% 2% 27%Mopeds 4% 0% 0% 0% 0% 0%HDV 3% 12% 5% 46% 9% 5%
Table 2NO𝑥 and PM10 [kg day−1] emission results by area (Inner city, suburban eastern ring-road (Sub_East), suburban western ring-road(Sub_West), port and highway) from the COMPO-CENSED (CENSED) and the COMPO-OBSERVED (OBSERVED) and relative emissiondifference from the COMPO-OBSERVED in respect to the COMPO-CENSED.
NO𝑥 PM10 NO𝑥Difference
PM10DifferenceOBSERVED CENSED OBSERVED CENSED
Inner city 9,404 9,915 1167 1262 −5.2% −7.5%Sub_East 1,577 1,184 246 153 33.2% 60%Sub_West 1,120 1,179 166 158 −5% 4.8%Highway 2,766 2,252 405 287 22.8% 40.9%Port 1,289 145 57 15 788% 278.7%Bus 2,312 2,787 161 174 −17.0% −7.4%TOTAL 18,469 17,462 2,202 2,050 5.8% 7.4%
the total traffic flow) across all the road links included in the domain of study – referred to as BUS_AG –. The overall share of 4%is derived from the remote sensing campaign performed in the city. Fig. 9a shows the resulting public bus network and associateddaily flow per link information from the BUS_SEP approach. As observed, major urban arterial roads are concentrating most ofthe bus routes and, subsequently, of the bus flow, while in tertiary and residential streets the number of bus lines is practicallynull. On the other hand, Fig. 9b shows the computed NO𝑥 emission difference (BUS_SEP–BUS_AG) at the road link level during themorning peak hour (i.e. 08:00 AM local time). Yellow and red colours indicate higher emissions from BUS_SEP, while blueish coloursindicate higher emissions from BUS_AG. At the city level, total estimated emissions are practically equal. The BUS_SEP approachreports a +2% NO𝑥 and −1% PM10 emissions when compared to the BUS_AG. Nevertheless, significant differences are observed whenperforming a comparison at the street level (Fig. 9b). The spatial pattern of the emission differences is in line with the bus flowinformation reported by BUS_SEP (Fig. 9a). Road links with higher bus flow values are the ones presenting larger NO𝑥 difference(up to +300%). On the other hand, heavy trafficked streets without bus lanes are highlighted with blueish colours, as a consequenceof the higher emissions that the constant bus weight produces using the BUS_AG approach. This pattern is also observed in the portzone, in which the BUS_AG approach reports a 1.6% of buses. Maximum differences between the two approaches are up to +300%nd −20%.
.2.3. Temperature effectFor this sensitivity study, the temperature effect on emissions for the coldest day registered in the city of Barcelona during
017 is simulated (17th February 2017). The observed average daily temperature at a weather station located in the city centre was.4 ◦C (AEMET, 2017). Vehicle emissions increase under cold temperatures due to several mechanical factors, which are representedy two corrections on vehicle hot exhaust emissions. The first, referred to as cold-start emissions, are caused by the extra emissionsue to the low performance of engine catalytic systems until they reach their optimum temperature, and affects both NO𝑥 and PM10missions. Cold-start emissions are already considered in COPERT V and have been included in HERMESv3 following the Tier 3ethodology proposed by the EMEP/EEA guidelines as detailed in Guevara et al. (2020). We consider an average trip length of.47 km, which is based on the Barcelona mobility report of 2015 (ATM, 2015). The second correction affects NO𝑥 emission fromiesel vehicles (Grange et al., 2019; Federal Office for the Environment, 2018) and it is not considered in COPERT V equations.his increase is associated with the Exhaust Gas Recirculation systems and Selective Catalytic Reduction systems operation at lowemperatures. For diesel pre-Euro 6 vehicles NO𝑥 increase is due to the disconnection of the Exhaust Gas Recirculation system (EGR)t low temperatures to avoid moist condensation issues. Diesel Euro 6 vehicles are also influenced by cold temperatures since theelective Catalytic Reduction systems (SCR) they are mostly equipped with need NH3 for NO𝑥 conversion, which comes from thedBlue. AdBlue is converted into NH3 in a reaction whose efficiency decreases at low temperatures, increasing NO𝑥 emissions.
To apply this temperature effect, the original COPERT V emission factors included in HERMESv3 were modified according tohe temperature and vehicle dependent adjustment factors reported by Matzer et al. (2019).
Emissions for the coldest registered day in Barcelona were simulated under three different scenarios: (I) without consideringny correction for cold temperature emissions (Temp_Raw), (II) considering cold-start emissions (Temp_CS), and (III) consideringold-start emissions and the diesel NO𝑥 temperature effect (Temp_CS+CF). Table 3 summarises the NO𝑥 adjustment factors for dieselehicles considered in the Temp_CS+CF scenario.
10

Transportation Research Part D 92 (2021) 102725D. Rodriguez-Rey et al.
Fig. 9. Daily flow representation (n◦ buses day−1 link−1) of the BUS_SEP network implemented in the BCN-VML traffic simulator (a) and NO𝑥 (g h−1 link−1)difference between the separated bus approach (BUS_SEP) and the aggregated one (BUS_AG) for the 8 AM local time (b). (For interpretation of the referencesto colour in this figure legend, the reader is referred to the web version of this article.)
Table 3Correction factor for temperatures of 8.4 ◦C applied to the represented EURO Diesel PC and LDV categories asreported by (Matzer et al., 2019).Euro class Diesel PC
correction factorDiesel LDVcorrection factor
Euro 3 1.20 –Euro 4 1.35 1.35Euro 5 1.40 1.35Euro 6a,b 1.45 1.20Euro 6d-temp 1.00 1.00Euro 6d 1.00 1.00
Table 4NO𝑥 and PM10 emission [kg day−1] for the coldest day of 2017, without considering temperature effect (Temp_Raw), consideringcold-start emissions (Temp_CS) and considering cold-start emissions and diesel NO𝑥 temperature effect (Temp_CS+CF). Differenceexposes the relative difference between Temp_Raw and Temp_CS+CF.
Temp_Raw Temp_CS Temp_CS+CF Relative differenceTemp Raw vs Temp_CS+CF
NO𝑥 15,866 16,375 18,867 19%PM10 1,899 1,983 1,983 4%
Table 4 shows the NO𝑥 and PM10 emission values simulated for the three scenarios. Estimated NO𝑥 and PM10 emission for theTEMP_CS scenario are +3% and +4% higher than Temp_Raw, respectively. NO𝑥 difference increases up to +19% when consideringthe Temp_CS+CF scenario.
The resulting increased NO𝑥 emissions are slightly lower than the ones reported by Grange et al. (2019), who estimated anincrease between 30% to 45% for the majority of Spain using wintertime air temperatures compared with emissions at 20 ◦C. It isreasonable a lower NO𝑥 increase in Barcelona since the city has mild temperatures due to its coastal situation and the urban buildprovokes higher temperatures than the suburban and rural locations.
3.2.4. Non-exhaust PM10 emissionsIn this section, the VML-HERMESv3 model was run with and without the consideration of non-exhaust PM10 emission sources
(i.e. road, tyre and brake wear and resuspension). Table 5 shows the aggregated emission factors (EF) considered in HERMESv3 fornon-exhaust and exhaust PM10 for the different vehicle groups. These are computed weighting the emission factors of each vehicletechnology according to its fractional contribution to the fleet composition in that group and the average urban speed observed inthe VLM-HERMESv3 coupled system (28 km/h). Non-exhaust EF for HDV are the largest, followed by LDV, PC and motorbikes. Inall cases except motorbikes, EF for total non-exhaust are much larger than for exhaust (from four times more in case of PC to tentimes more in the case of HDV).
11

Transportation Research Part D 92 (2021) 102725D. Rodriguez-Rey et al.
sos(a5
cf
3
etT
Nif
dbta
uascaorb
Table 5Comparison between average PM10 non-exhaust and exhaust emission factors [g km−1] as a function of the vehicle category and sourcetype.
PM10 [g km−1]
Road Tyre Brake Resuspension Total non-exhaust Exhaust
PC 0.015 0.011 0.008 0.023 0.056 0.014LDV 0.015 0.017 0.012 0.082 0.126 0.020HDV 0.076 0.027 0.033 0.460 0.596 0.062Motorbikes 0.006 0.005 0.005 0.002 0.018 0.014
Table 6Simulated total exhaust and non-exhaust (resuspension, wear) daily PM10 [kg] emissions.Total PM10 Exhaust Resuspension Wear
2,145 412 1,127 606
Table 7Traffic and emission results obtained with the microscopic (AIMSUN–PHEMLight) and macroscopic (VML-HERMESv3) coupled systems for thethree streets of study. The volume capacity ratio (V/C), the speed (km h−1) and NO𝑥 emissions (kg day−1) are presented, as well as the NO𝑥relative difference between microscopic and macroscopic approach for each street.
VML-HERMESv3 AIMSUN–PHEMLight NO𝑥differenceV/C Speed [km h−1] NO𝑥 [kg/day] V/C Speed [km h−1] NO𝑥 [kg/day]
Aragó 95% 26.4 39 70% 38 35 −11.7%Balmes 82% 26.4 28 50% 18 46 +65.4%Aribau 47% 25.3 18 25% 24 20 +15.5%
A comparison between the two simulations shows an increase of PM10 emissions of +410% when considering all the non-exhaustources. Table 6 shows the resulting PM10 emissions discriminated by process (exhaust, resuspension and wear). The contributionf non-exhaust sources to total PM10 emissions was found to be of 80%, which is in line with the results found by other studies,uch as Rexeis and Hausberger (2009) (estimated a contribution between 80 to 90% for 2020 in Europe) and Harrison et al. (2012)measured a contribution of 77% in London). More specifically, the resuspension process is the one dominating total emissions, withcontribution of 52%. This result is very similar to the one found by de la Paz et al. (2015) for the city of Madrid (contribution of3%) which is in line with the fact that both cities are influenced by similar dry weather conditions.
The current large contribution of non-exhaust to total PM emissions is expected to keep growing on the following years. This isaused by the technological and legislative improvements in PM exhaust emissions combined with a lack of abatement measuresor non-exhaust sources (Guevara, 2016).
.3. Limited-area comparison with a microscopic system
This section uses the higher level of detail of the microscopic approach described in Section 2.4 to observe and discuss the possiblemission discrepancies with the macroscopic system developed in this study. More precisely, we want to estimate the influence ofraffic dynamics and vehicle-to-vehicle interaction on the emission results computed with AIMSUN–PHEMLight microscopic system.he discussion of the emission results is focused on the three urban corridors highlighted in Fig. 6.
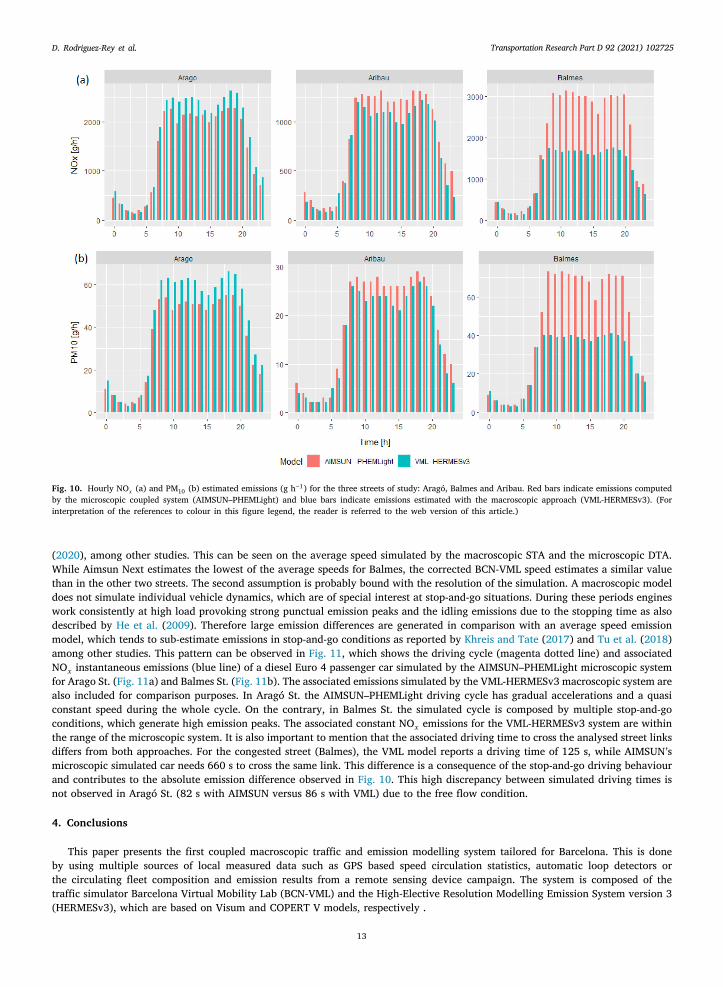
A comparison of the hourly NO𝑥 and PM10 exhaust emissions computed for each street and coupled system is shown in Fig. 10.on-exhaust PM10 sources were not considered because they are not estimated by the PHEMLight emission model. From the figure
t can be observed that the three streets present higher estimated emission discrepancies during the daytime hours when the trafficlow and congestion levels are higher. However these modelling differences diverge between the different streets.
To better understand the modelling differences, Table 7 shows for each one of them the volume capacity ratios (V/C) (i.e. vehicleensity) at 9 AM local time, the daily average speed and the total daily NO𝑥 emissions computed with each modelling system. It cane observed that despite the high V/C ratio, in Aragó St. the NO𝑥 emissions computed with the microscopic system are lower thanhe ones estimated with the macroscopic VML-HERMESv3 system (−11.7%). On the contrary, the microscopic approach estimates+65% more NO𝑥 in Balmes St. Finally, on Aribau St. the estimated NO𝑥 emissions by the microscopic system are a +15% higher.
Two assumptions can probably explain the emission differences observed above. The first lies in the traffic assignment methodsed. STA, commonly used in macroscopic traffic models, is unable to propagate queues on the network where the links upstreambottleneck remain unaffected. On the contrary, STA predicts congestion namely downstream the bottleneck and cannot model
pillback. As a consequence, link flow may exceed capacity, there is no queue formation and the demand downstream the bottleneckannot properly be adjusted. This situation becomes critical in very congested links like Balmes, and therefore can affect the levelnd location of emissions (Tsanakas et al., 2020). On the other hand, DTA used in microscopic traffic models can model spillbackf the queues as traffic demand exceeds capacity. Traffic flow evolves over time and congestion dynamics are modelled in a moreealistic way. Queues occur upstream the bottleneck and queue spillback may occur through the network. Under DTA congestion isetter located, which has a significant effect on where peak emissions occur as proved by Wismans et al. (2013) and Tsanakas et al.
12
Transportation Research Part D 92 (2021) 102725D. Rodriguez-Rey et al.
Fig. 10. Hourly NO𝑥 (a) and PM10 (b) estimated emissions (g h−1) for the three streets of study: Aragó, Balmes and Aribau. Red bars indicate emissions computedby the microscopic coupled system (AIMSUN–PHEMLight) and blue bars indicate emissions estimated with the macroscopic approach (VML-HERMESv3). (Forinterpretation of the references to colour in this figure legend, the reader is referred to the web version of this article.)
(2020), among other studies. This can be seen on the average speed simulated by the macroscopic STA and the microscopic DTA.While Aimsun Next estimates the lowest of the average speeds for Balmes, the corrected BCN-VML speed estimates a similar valuethan in the other two streets. The second assumption is probably bound with the resolution of the simulation. A macroscopic modeldoes not simulate individual vehicle dynamics, which are of special interest at stop-and-go situations. During these periods engineswork consistently at high load provoking strong punctual emission peaks and the idling emissions due to the stopping time as alsodescribed by He et al. (2009). Therefore large emission differences are generated in comparison with an average speed emissionmodel, which tends to sub-estimate emissions in stop-and-go conditions as reported by Khreis and Tate (2017) and Tu et al. (2018)among other studies. This pattern can be observed in Fig. 11, which shows the driving cycle (magenta dotted line) and associatedNO𝑥 instantaneous emissions (blue line) of a diesel Euro 4 passenger car simulated by the AIMSUN–PHEMLight microscopic systemfor Arago St. (Fig. 11a) and Balmes St. (Fig. 11b). The associated emissions simulated by the VML-HERMESv3 macroscopic system arealso included for comparison purposes. In Aragó St. the AIMSUN–PHEMLight driving cycle has gradual accelerations and a quasiconstant speed during the whole cycle. On the contrary, in Balmes St. the simulated cycle is composed by multiple stop-and-goconditions, which generate high emission peaks. The associated constant NO𝑥 emissions for the VML-HERMESv3 system are withinthe range of the microscopic system. It is also important to mention that the associated driving time to cross the analysed street linksdiffers from both approaches. For the congested street (Balmes), the VML model reports a driving time of 125 s, while AIMSUN’smicroscopic simulated car needs 660 s to cross the same link. This difference is a consequence of the stop-and-go driving behaviourand contributes to the absolute emission difference observed in Fig. 10. This high discrepancy between simulated driving times isnot observed in Aragó St. (82 s with AIMSUN versus 86 s with VML) due to the free flow condition.
4. Conclusions
This paper presents the first coupled macroscopic traffic and emission modelling system tailored for Barcelona. This is doneby using multiple sources of local measured data such as GPS based speed circulation statistics, automatic loop detectors orthe circulating fleet composition and emission results from a remote sensing device campaign. The system is composed of thetraffic simulator Barcelona Virtual Mobility Lab (BCN-VML) and the High-Elective Resolution Modelling Emission System version 3(HERMESv3), which are based on Visum and COPERT V models, respectively .
13

Transportation Research Part D 92 (2021) 102725D. Rodriguez-Rey et al.
Fig. 11. Instantaneous speed (km h−1) and associated NO𝑥 emissions (g h−1) for a diesel Euro 4 passenger car simulated by the AIMSUM–PHEMLight microscopicsystem and VML-HERMESv3 macroscopic system for Aragó St. (a) and Balmes St. (b). The driving time needed to cross each street link (seconds) and total NO𝑥associated emissions (g) of the sample vehicle are also shown. (For interpretation of the references to colour in this figure legend, the reader is referred to theweb version of this article.)
An annual simulation showing total NO𝑥 and PM10 emissions was performed with the developed coupled system. The computedannual emissions for the year 2017 were 3.800 tonnes for NO𝑥 and 427 tonnes for PM10. The computed annual NO𝑥 and PM10emission values were also compared against two local emission inventories. The VML-HERMESv3 NO𝑥 estimated emissions were inagreement with both inventories showing a discrepancy of −5% and +9%. On the other hand, the PM10 differences were higher,up to +105%. This is believed to be caused by the high uncertainty of PM10 estimates, and the consideration of all PM non-exhaustsources by the VML-HERMESv3 system.
A sensitivity analysis was performed to quantify the variability of NO𝑥 and PM10 estimated emissions to different inputparameters, including vehicle fleet composition, public bus transport implementation, temperature and non-exhaust PM sources.Moreover, a comparison of the VLM-HERMESv3 macroscopic coupled system with a microscopic coupled system composed by theAimsun Next traffic simulator and the PHEMLight instantaneous emission model (AIMSUN–PHEMLight) was also performed in ahot spot of the city.
The main findings of the sensitivity analysis and intercomparison exercise are summarised below:
– Vehicle fleet composition: High emission differences were found when using the real circulating area-dependent fleetcomposition versus the homogeneous censed one. These were mostly influenced by the HDV presence from the port area,the fuel (gasoline or diesel) used and the vehicle age.
– Public bus network: The usage of real bus routes showed strong street gradient differences in several sections of more than+300% for NO𝑥 when compared with a constant bus share of 4% for the whole network. In contrast, reductions up to −20%in NO𝑥 emissions were found in sections without bus routes.
– Meteorological influence: An increase of +19% in NO𝑥 and +4% in PM10 was found when considering the effect of cold-startand diesel NO𝑥 temperature-dependent processes. Although in Barcelona the temperature effect is reduced due to its mildweather, this can have a significant influence upon the overall emissions in colder regions.
– Non-exhaust PM sources: The inclusion of wear processes (i.e. tyre, brakes and road) and resuspension resulted in an increaseof +410% of PM10 emissions. Road resuspension, a process which is not considered in COPERT V, was found to be the largestcontributor to non-exhaust emissions, representing a 50% of the total.
– Macroscopic versus microscopic approach: The congested traffic situation showed the highest discrepancies in NO𝑥 emissions(up to 65%) between the macroscopic and microscopic approached. In contrast, during free flow, differences were small,with +11% more NO𝑥 estimated by the macroscopic system. The DTA versus the STA and the individual vehicle dynamicscharacterisation of microscopic system versus the macroscopic traffic representation were found to be the reasons for suchdifferences.
This research shows how the combination of several input parameters has a key role on the estimated overall and street levelgradient emissions. Additionally, the usage of macroscopic or microscopic approaches influences emission estimation, specially in
14

Transportation Research Part D 92 (2021) 102725D. Rodriguez-Rey et al.
stwm
ttttc
F
aE
C
AmmG
D
t
A
attNpfp
high loaded streets where the macroscopic models show some limitations for which the modeller should be aware of. Although theestimated results of microscopic approach are more precise, its high data demand and computational load limits its application tovery localised sites. Nowadays, the simulation of large urban areas can only be done by a macroscopic or mesoscopic approach,where several specific input parameters can be improved to better assess traffic emissions, as shown in this study. The applicabilityof the developed system to other areas is conditioned to the available local data. This is especially important for the build andcalibration of the traffic model and the vehicle fleetshare used. Regarding the emission factors, the COPERT ones can be used as faras the domain is European. Otherwise, there should be a mapping between the COPERT vehicle categories and the local ones.
4.1. Future research
Additional improvements on the STA simulation could be considered in order to improve vehicle dynamics on congestedituations. Tsanakas et al. (2020) applied the so called ‘‘quasidynamic’’ network loading on a STA simulation, which improvedhe simulated traffic dynamics during congestion. On another matter, the higher resolution of a microscopic traffic emission modelas used by Rakha et al. (2011) using synthetic drive cycles generated with aggregated link traffic data from the mesoscopic trafficodel (e.g. average speed, average stop duration or number of vehicle stops per unit distance).
On further steps of the research the capabilities of the presented macroscopic system will be used to evaluate the application ofraffic management strategies in Barcelona. The generated response in emissions to the induced traffic changes allows to estimatehe traffic emission impact that different mobility policies could have. The addition of a street dispersion model will also allowo quantify the air quality impact of the simulated mobility policies. The flexibility of the traffic-emission system combined withhe performed refinement of the typically uncertain traffic emission parameters is expected to improve the simulated pollutantoncentration values used for air quality assessments and health studies in Barcelona.
unding
This research has been funded by the grant BES-2016-078116 from the FPI programme by the Spanish Ministry of Economynd Competitiveness as well as the VITALISE project (PID2019-108086RA-I00/AEI / 10.13039/501100011033) from the Agenciastatal de Investigacion (AEI).
RediT authorship contribution statement
Daniel Rodriguez-Rey: Designed the research, Participated on the building and calibration of the BCN-VML model, Performedthe model coupling process and ran the experiments, Prepared the paper. Marc Guevara: Designed the research, Supervision,
ssisted the experiments. Ma Paz Linares: Designed the research, Participated on the building and calibration of the BCN-VMLodel. Josep Casanovas: Designed the research. Juan Salmerón: Participated on the building and calibration of the BCN-VMLodel. Albert Soret: Designed the research. Oriol Jorba: Supervision. Carles Tena: Assisted the experiments. Carlos Pérezarcía-Pando: Supervision.
eclaration of competing interest
The authors declare that they have no known competing financial interests or personal relationships that could have appearedo influence the work reported in this paper.
cknowledgements
Daniel Rodriguez-Rey’s PhD work is funded by grant BES-2016-078116 from the FPI program by the Spanish Ministry of Economynd Competitiveness. The authors acknowledge CARNET-The Future Mobility Research HUB to allow the usage and work onhe BCN-VML network, as well as PTV VISUM for the traffic software licence. The authors also acknowledge the support fromhe Ministerio de Ciencia, Innovación y Universidades (MICINN) as part of the BROWNING project RTI2018-099894-B-I00 andUTRIENT project CGL2017-88911-R and the support from the Agencia Estatal de Investigacion (AEI) as part of the VITALISEroject (PID2019-108086RA-I00/AEI / 10.13039/501100011033). Carlos Pérez García-Pando acknowledges the long-term supportrom the AXA Chair in Sand and Dust Storms (AXA Research Fund), as well as the support received through the Ramón y Cajalrogramme (grant RYC-2015-18690) of the Spanish Ministry of Economy and Competitiveness.
15

Transportation Research Part D 92 (2021) 102725D. Rodriguez-Rey et al.
A
A
A
A
A
ABBC
CC
d
D
EEEF
F
F
F
G
G
G
GH
HH
HIK
KK
L
L
M
M
M
OO
References
AEMET, 2017. AEMET Open data. https://opendata.aemet.es/centrodedescargas/inicio.Ajuntament de Barcelona, 2015. Pla de millora de la qualitat de l’aire de Barcelona 2015-2018.Ajuntament de Barcelona, 2017. Dades bàsiques de mobilitat Informe 2017. Tech. Rep.Ajuntament de Barcelona, 2019. Mobility gauging detail of the city of Barcelona. https://opendata-ajuntament.barcelona.cat/data/en/dataset?q=&name=
aforaments-detall.mato, F., Cassee, F.R., Denier van der Gon, H.A.C., Gehrig, R., Gustafsson, M., Hafner, W., Harrison, R.M., Jozwicka, M., Kelly, F.J., Moreno, T., Prevot, A.S.H.,
Schaap, M., Sunyer, J., Querol, X., 2014. Urban air quality: The challenge of traffic non-exhaust emissions. J. Hard Mater. (ISSN: 18733336) 275, 31–36.http://dx.doi.org/10.1016/j.jhazmat.2014.04.053,
mato, F., Karanasiou, A., Moreno, T., Alastuey, A., Orza, J.A., Lumbreras, J., Borge, R., Boldo, E., Linares, C., Querol, X., 2012. Emission factors from roaddust resuspension in a Mediterranean freeway. Atmos. Environ. (ISSN: 13522310) 61, 580–587. http://dx.doi.org/10.1016/j.atmosenv.2012.07.065.
MB and RACC, 2017. Caracterització dels vehicles i les seves emissions a l’àrea metropolitana de Barcelona. Tech. Rep., Àrea Metropolitana de Barcelona,Barcelona, http://saladepremsa.racc.cat/wp-content/uploads/2017/09/Dossier_estudi_Vehicles-i-Emissions-Area-Metropolitana.pdf.
ndré, M., Pasquier, A., Carteret, M., 2018. Experimental determination of the geographical variations in vehicle fleet composition and consequences for assessinglow-emission zones. Transp. Res. D (ISSN: 13619209) 65, 750–760. http://dx.doi.org/10.1016/j.trd.2018.10.005.
SPB, 2018. Agència de Salut Pública de Barcelona: Informe de qualitat de l’aire de Barcelona. Tech. Rep., https://www.aspb.cat/wp-content/uploads/2019/09/Informe_qualitat-aire-2018.pdf.
TM, 2015. Mobilitat: Dades i evolució 2015. Tech. Rep., https://observatori.atm.cat/mobilitat-dades-i-evolucio/Mobilitat_dades_i_evolucio_2015.pdf.arceló, J., 2011. Fundamentals of Traffic Simulation. Springer, New York.arcelona city council, Mobility and transport department, personal communication, 2017.3S, 2017. Copernicus Climate Change Service (C3S): ERA5: Fifth generation of ECMWF atmospheric reanalyses of the global climate, Copernicus Climate Change
Service Climate Data Store (CDS). https://cds.climate.copernicus.eu/cdsapp#!/home.ARNET, 2017. CARNET Barcelona - Future Mobility Research Hub. http://www.carnetbarcelona.com/.hen, R., Aguiléra, V., Mallet, V., Cohn, F., Poulet, D., Brocheton, F., 2017. A sensitivity study of road transportation emissions at metropolitan scale. J. Earth
Sci. Geotech. Eng. 7, 151–173.e la Paz, D., Borge, R., Vedrenne, M., Lumbreras, J., Amato, F., Karanasiou, A., Boldo, E., Moreno, T., 2015. Implementation of road dust resuspension in air
quality simulations of particulate matter in Madrid (Spain). Front. Environ. Sci. (ISSN: 2296665X) 3 (NOV), http://dx.doi.org/10.3389/fenvs.2015.00072.irección General de Tráfico (DGT), 2019. Estadísticas e indicadores. Parque de vehículos: tablas estadísticas. http://www.dgt.es/es/seguridad-vial/estadisticas-
e-indicadores/.EA, 2019. Air Quality in Europe — 2019 Report — EEA Report No 10/2019. ISBN: 978-92-9480-088-6, p. 104. http://dx.doi.org/10.2800/822355.MEP/EEA, 2017. Air pollutant emission inventory guidebook 2016 – last update june 2017. Environmental European Agency.MISIA, 2016. COPERT V. https://copert.emisia.com/.allah Shorshani, M., André, M., Bonhomme, C., Seigneur, C., 2015. Modelling chain for the effect of road traffic on air and water quality: Techniques, current
status and future prospects. Environ. Model. Softw. (ISSN: 13648152) 64, 102–123. http://dx.doi.org/10.1016/j.envsoft.2014.11.020.aria, M.V., Varella, R.A., Duarte, G.O., Farias, T.L., Baptista, P.C., 2018. Engine cold start analysis using naturalistic driving data : City level impacts on local
pollutants emissions and energy consumption. Sci. Total Environ. (ISSN: 0048-9697) 630, 544–559. http://dx.doi.org/10.1016/j.scitotenv.2018.02.232.ederal Office for the Environment, 2018. Real-Driving Emissions from Diesel Passenger Cars Measured by Remote Sensing and as Compared with PEMS - CONOX
Task 2 Report. Switzerland, ISBN: 9789188319708, p. 41, https://www.bafu.admin.ch/bafu/en/home/topics/air/publications-studies/studies.html.ontes, T., Pereira, S.R., Fernandes, P., Bandeira, J.M., Coelho, M.C., 2015. How to combine different microsimulation tools to assess the environmental impacts
of road traffic? Lessons and directions. Transp. Res. D (ISSN: 13619209) 34, 293–306. http://dx.doi.org/10.1016/j.trd.2014.11.012,range, S.K., Farren, N.J., Vaughan, A.R., Rose, R.A., Carslaw, D.C., 2019. Strong temperature dependence for light-duty diesel vehicle NOx emissions. Environ.
Sci. Technol. (ISSN: 15205851) 53 (11), 6587–6596. http://dx.doi.org/10.1021/acs.est.9b01024.uevara, M., 2016. Emissions of primary particulate matter. In: Airborne Particulate Matter: Sources, Atmospheric Processes and Health. The Royal Society of
Chemistry, ISBN: 978-1-78262-491-2, pp. 1–34. http://dx.doi.org/10.1039/9781782626589-00001.uevara, M., Tena, C., Porquet, M., Jorba, O., Pérez García-Pando, C., 2020. HERMESv3, a stand-alone multi-scale atmospheric emission modelling framework
– Part 2: The bottom–up module. Geosci. Model Dev. (ISSN: 1991-962X) 13, 873–903. http://dx.doi.org/10.5194/gmd-13-873-2020.wara, B., 2017. Validation of TomTom historical average speeds on freeway segments in Gauteng, South Africa.arrison, R.M., Jones, A.M., Gietl, J., Yin, J., Green, D.C., 2012. Estimation of the contributions of brake dust, tire wear, and resuspension to nonexhaust traffic
particles derived from atmospheric measurements. Environ. Sci. Technol. (ISSN: 0013936X) 46 (12), 6523–6529. http://dx.doi.org/10.1021/es300894r.ausberger, S., Luz, R., Rexeis, M., Zallinger, S., 2009. PHEM User manual. Graz.e, H.-d., Lu, W.-Z., Xue, Y., 2009. Prediction of PM10 concentrations at urban traffic intersections using semi-empirical box modelling with instantaneous velocity
and acceleration. Atmos. Environ. (ISSN: 1352-2310) 43 (40), 6336–6342. http://dx.doi.org/10.1016/j.atmosenv.2009.09.027, http://www.sciencedirect.com/science/article/pii/S1352231009008024.
ere, 2020. HERE. www.here.com.nstitut d’Estadística de Catalunya, 2019. Estimacions de població per sexe. https://www.idescat.cat/.hreis, H., Tate, J., 2017. Alternative methods for vehicle emission modelling and its impact on local road transport emission inventories in Bradford, UK. J.
Transp. Health (ISSN: 22141405) 5 (x), S50. http://dx.doi.org/10.1016/j.jth.2017.05.341.ineo, 2017. Kineo, Ingeniería de Tráfico. https://www.kineo.es/en/.ucharski Rafałand Drabicki, A., 2017. Estimating macroscopic volume delay functions with the traffic density derived from measured speeds and flows. J. Adv.
Transp. (ISSN: 20423195) 2017, http://dx.doi.org/10.1155/2017/4629792.ejri, D., Can, A., Schiper, N., Leclercq, L., 2018. Accounting for traffic speed dynamics when calculating COPERT and PHEM pollutant emissions at the urban
scale. Transp. Res. D (ISSN: 1361-9209) 63, 588–603. http://dx.doi.org/10.1016/j.trd.2018.06.023.elieveld, J., Evans, J., Fnais, M., Giannadaki, D., Pozzer, A., 2015. The contribution of outdoor air pollution sources to premature mortality on a global scale.
Nature 525, 367–371. http://dx.doi.org/10.1038/nature15371.artini, G., Grigoratos, T., 2014. Non-Exhaust Traffic Related Emissions. Brake and Tyre Wear PM. JRC Science and Policy Reports, (ISSN: 1018-5593) ISBN:
978-92-79-38303-8, http://dx.doi.org/10.2790/21481, https://ec.europa.eu/jrc.atzer, C., Weller, K., Dippold, M., Lipp, S., Rock, M., Rexels, M., Hausberger, S., 2019. Update of Emission Factors for HBEFA Version 4.1; Final Report,
I-05/19/CM EM-I-16/26/679. TU Graz, pp. 1–138.ontero, L., Linares, P., Salmerón, J., Recio, G., Lorente, E., José Vázquez, J., 2018. Barcelona Virtual Mobility Lab The multimodal transport simulation testbed
for emerging mobility concepts evaluation. pp. 2–5.penStreetMap contributors, 2019. Planet dump retrieved from https://planet.osm.org.sorio, C., Nanduri, K., 2015. Urban transportation emissions mitigation: Coupling high-resolution vehicular emissions and traffic models for traffic signal
16
optimization. Transp. Res. B (ISSN: 01912615) 81, 520–538. http://dx.doi.org/10.1016/j.trb.2014.12.007,
Transportation Research Part D 92 (2021) 102725D. Rodriguez-Rey et al.
PQ
R
R
R
R
R
S
TTTTT
T
W
Z
Z
Pérez, J., de Andrés, J.M., Borge, R., de la Paz, D., Lumbreras, J., Rodríguez, E., 2019. Vehicle fleet characterization study in the city of Madrid and itsapplication as a support tool in urban transport and air quality policy development. Transp. Policy (ISSN: 1879310X) 74 (December 2017), 114–126.http://dx.doi.org/10.1016/j.tranpol.2018.12.002.
ort de Barcelona, 2017. RePort. http://www.portdebarcelona.cat/en/web/el-port/report.uaassdorff, C., Borge, R., Pérez, J., Lumbreras, J., de la Paz, D., de Andrés, J.M., 2016. Microscale traffic simulation and emission estimation in a heavily
trafficked roundabout in madrid (Spain). Sci. Total Environ. (ISSN: 18791026) 566–567, 416–427. http://dx.doi.org/10.1016/j.scitotenv.2016.05.051.akha, H., Yue, H., Dion, F., 2011. VT-Meso model framework for estimating hot-stabilized light-duty vehicle fuel consumption and emission rates. Can. J. Civil
Eng. 38, http://dx.doi.org/10.1139/l11-086.egional, B., 2019. Informe dels Resultats del Balanç d’Emissions i la Modelització de la Qualitat de l’Aire de la ZBE (Zona de Baixes Emissions) de Barcelona i
Municipis Propers. Tech. Rep., pp. 1–10, https://ajuntament.barcelona.cat/qualitataire/sites/default/files/br_impacteestimat_zbe_bcn.pdf.eixis, M., Dippold, M., Luz, R., Hausberger, S., Haberl, M., Krajzewicz, D., Wagner, P., Wolki, M., Blokpoel, R., Stutzle, T., Dubois-Lacoste, J., 2014. Cooperative
Self-Organizing System for low Carbon Mobility at low Penetration Rates COLOMBO: Deliverable 4.3 Pollutant Emission Models and Optimisation. pp. 1–55.exeis, M., Hausberger, S., 2009. Trend of vehicle emission levels until 2020 - Prognosis based on current vehicle measurements and future emission legislation.
Atmos. Environ. (ISSN: 13522310) 43 (31), 4689–4698. http://dx.doi.org/10.1016/j.atmosenv.2008.09.034.odriguez-Rey, D., Soret, A., Guevara, M., Linares, M.P., 2018. Evaluation of traffic emission models coupled with a microscopic traffic simulator and on-road
measures. In: Book of Abstracts. Barcelona Supercomputing Center, pp. 76–77, http://hdl.handle.net/2117/124996.mit, R., Poelman, M., Schrijver, J., 2008. Improved road traffic emission inventories by adding mean speed distributions. Atmos. Environ. (ISSN: 13522310) 42
(6), 916–926. http://dx.doi.org/10.1016/j.atmosenv.2007.10.026,homson, I., Bull, A., 2002. La congestión del tránsito: Causas y consecuencias económicas y sociales. Rev. CEPAL 76, 109–121.MB, 2019. Transport Metropolità de Barcelona. https://www.tmb.cat/es/barcelona/autobuses/lineas.MB, 2020. Basic data 2020. https://www.tmb.cat/documents/20182/94438/Dades+viatgers+bus+metro+2020_CA_EN/41aa4b84-420e-4fb0-adc9-3f3e3f87eb65.omTom, 2019. TomTom. https://www.tomtom.com.sanakas, N., Ekström, J., Olstam, J., 2020. Estimating emissions from static traffic models: Problems and solutions. J. Adv. Transp. (ISSN: 0197-6729) 2020,
1–17. http://dx.doi.org/10.1155/2020/5401792.u, R., Kamel, I., Wang, A., Abdulhai, B., Hatzopoulou, M., 2018. Development of a hybrid modelling approach for the generation of an urban on-road
transportation emission inventory. Transp. Res. D (ISSN: 13619209) 62, 604–618. http://dx.doi.org/10.1016/j.trd.2018.04.011.ismans, L., van den Brink, R., Brederode, L., Zantema, K., van Berkum, E., 2013. Comparison of estimation of emissions based on static and dynamic
traffic assignment models. In: 92th Annual Meeting of the Transportation Research Board, Washington. ISBN: 9788578110796, pp. 1689–1699. http://dx.doi.org/10.1017/CBO9781107415324.004.
hang, K., Batterman, S., Dion, F., 2011. Vehicle emissions in congestion: Comparison of work zone, rush hour and free-flow conditions. Atmos. Environ. (ISSN:13522310) 45 (11), 1929–1939. http://dx.doi.org/10.1016/j.atmosenv.2011.01.030.
hou, X., Tanvir, S., Lei, H., Taylor, J., Liu, B., Rouphail, N.M., Frey, H.C., 2015. Integrating a simplified emission estimation model and mesoscopicdynamic traffic simulator to efficiently evaluate emission impacts of traffic management strategies. Transp. Res. D (ISSN: 13619209) 37, 123–136.http://dx.doi.org/10.1016/j.trd.2015.04.013.
17