Embed Size (px)
Citation preview

A cost effectiveness comparison of a pharmacist using threemethods for identifying possible drug-related problems
Item Type text; Thesis-Reproduction (electronic)
Authors Dick, Michael Lawrence, 1945-
Publisher The University of Arizona.
Rights Copyright © is held by the author. Digital access to this materialis made possible by the University Libraries, University of Arizona.Further transmission, reproduction or presentation (such aspublic display or performance) of protected items is prohibitedexcept with permission of the author.
Download date 13/05/2018 19:48:21
Link to Item http://hdl.handle.net/10150/554839

A COST EFFECTIVENESS COMPARISON OF A PHARMACIST USING
THREE METHODS FOR IDENTIFYING POSSIBLE
DRUG-RELATED PROBLEMS
by
Michael Lawrence Dick
A Thesis Submitted to the Faculty of the
DEPARTMENT OF PHARMACEUTICAL SCIENCES
In Partial Fulfillment of the Requirements For the Degree of
MASTER OF SCIENCE WITH A MAJOR IN PHARMACY
In the Graduate College
THE UNIVERSITY OF ARIZONA
1 9 7 4
STATEMENT BY AUTHOR
This thesis has been submitted in partial fulfillment of requirements for an advanced degree at The University of Arizona and is deposited in the University Library to be made available to borrowers under rules of the Library*
Brief quotations from this thesis are allowable without special permission, provided that accurate acknowledgment of source is made» Requests for permission for extended quotation from or reproduction of this manuscript in whole or in part may be granted by the head of the major department or the Dean of the Graduate College when in his judgment the proposed use of the material is in the interests of scholarship, In all other instances, however, permission must be obtained from the author*
APPROVAL BY THESIS DIRECTOR
This thesis has been approved on the date shown below:
, 6t) - Li) L4/1& / <9 7HENRY w T l O T S H I P , ~ I I ~ ~ ~ ^Date ~~~~Professor of Pharmacy

ACKNOWLEDGMENTS
I would like to acknowledge the personal guidance and scholastic
leadership given to me by Dr* Henry W0 Winship III. His high ideals have
been a beacon to follow and his courage has been an inspiration. His
efforts on my behalf have been numerous.
I would also like to express my gratitude to Dr. George Wood
for his time and assistance in conducting this research.
TABLE OF CONTENTS
Page
LI ST OF TABLE S @ @ @ @ a o @ o o e e e a o » o » o o # o ® o e o 9 "V"
LIST OF ILLUSTRATIONS o o e e a e e e e o e o o g a s s o e 9 » o V I
ABSTRACT o o a g o o a o e e a o e a g o e e e e o o y o o o g o a V l l
INTRODUCTION 0 0 0 0 9 9 9 0 - 4 0 0 o q o q q o & o q 0 0 0 0 0 0 9 I
Purpo S e 0 9 0 0 0 9 0 0 0 9 0 0 9 0 9 9 9 9 0 9 0 0 0 9 9 0 0 ' 2Assumptions # 9 9 O O g o 9 9 o 9 @ o a a g o g a o o g 3L ITTl 11 a t 10 n S o o o o o o o o o o o o e o o o o o o o o o o o o 3DefimtlOnS O O O O e o o e O o " a o o e 0 0 9 e e o ' o » o o e 4
RELATED LITERATURE g e g o o o o e o o @ @ * @ @ e o o o o o o @ e 6
DESIGN OF STUDY o o o o o o o e o o e o o o o o o o o o o o o e o 8
Introduction o e o o . o o o o o o o o o o o o e e e o o e e a o 8Methodology @ O O O » O O O O O O O O O O O O O O O O O O O O 10
RESULTS AND DISCUSSION OF DATA............. . . ......... . 17
SUMMARY AND RECOMMENDATIONS . 28
Summary o e o g g o . o o o o o o o o o o o o o o o o o o e o 28Recommendations o o o o o o o o o o o o o o o o o o o o o o e 29
APPENDIX A: TOTAL NUMBER OF POSSIBLE DRUG-RELATEDPROBLEMS IDENTIFIED . . . . . . . . . . . . . . . . . . 30
R E F E R E N C E S o g s o o g o o o o o o o o o o o o e o o o o e e e o o 33
iv
LIST OF TABLES
Table
1.
2.
. 3.
4.
5.
6.
7 o
8.
9.
Total Number and Percentage of Possible Drug-Related Problems Identified in the Population by the Three Methods Studied @ * *
The Frequency Distribution of the Twelve Most Common Possible Drug-Related Problems Identified in the Population by the Three Methods Studied
The Frequency and Percentage of Patients Having Possible Drug-Related Problems Identified by the Three Methods
The Percentage of Males and Females with Possible Drug-Related Problems versus the Whole Population . . , «
The Ten Most Common Disease States of the Patients Studied and the Frequency (per 100) of Their Occurrence by Sex » „
The Percent Effectiveness of Investigator in Identifying Possible Drug-Related Problems in the Population by the Three Methods Studied . . . . . . . . . . . . . . .
The Average Time per Patient Spent by the Investigator in Identifying Possible Drug-Related Problems in the Population by the Three Methods Studied . . . . s . . . .
The Average Time per Review Spent by the Investigator in Identifying Possible Drug-Related Problems in the Population by the Three Methods Studied
The Cost per Possible Drug-Related Problems Identified in Population by the Three Methods Studied
Page
17
19
19
20
20
21
22
22
23
v
LIST OF ILLUSTRATIONS
Figure
1» A Sample Patient Drug Profile . . . . . . . . . . . .
2. A Sample Card Used to Record Patient Contact Time » „
3. A Sample Card Used to Record the Active Problems,Subjective and Objective Information, Assessment,and Plan of Therapy for Patient Studied (Front) . . .
4. A Sample Card of a Possible Drug-Related Problem,Date, and Evidence (Back) . . . . . . . . . . . . . . .
Page
13
14
15
16
vi
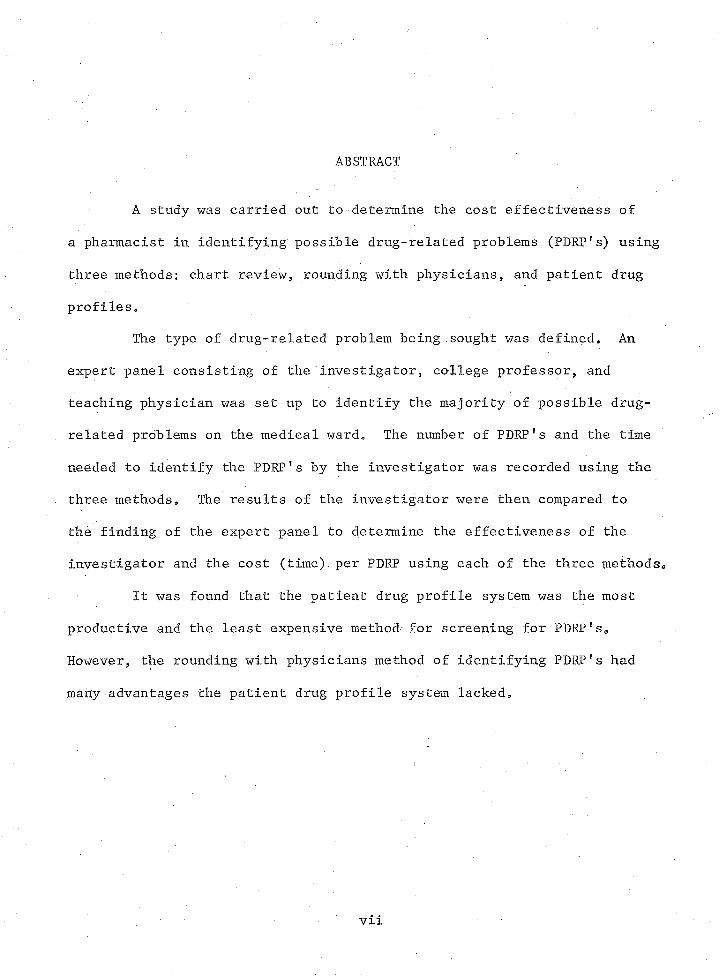
ABSTRACT
A study was carried out to determine the cost effectiveness of
a pharmacist in identifying possible drug-related problems (PDRP1s) using
three methods: chart review, rounding with physicians, and patient drug
profiles.
The type of drug-related problem being sought was defined. An
expert panel consisting of the investigator, college professor, and
teaching physician was set up to identify the majority of possible drug-
related problems on the medical ward. The number of PDRP!s and the time
needed to identify the PDRP1s by the investigator was recorded using the
three methods. The results of the investigator were then compared to
the finding of the expert panel to determine the effectiveness of the
investigator and the cost (time), per PDRP using each of the three methods.
It was found that the patient drug profile system was the most
productive and the least expensive method for screening for PDRP1s.
However, the rounding with physicians method of identifying PDRPf s had
many advantages the patient drug profile system lacked.
vii

\
INTRODUCTION
In recent years, the federal government and health professionals
have recognized that drug-related problems are a major health problem.
The Task Force on Prescription Drugs:Final Report estimated that approxi
mately three billion dollars are spent annually on the treatment of
drug-related problems (U, Department of Health, Education and Welfare
1969)» Several controlled studies have shown that many hospitalized
patients suffer adverse reactions to drugs. Schimmel (1964) found in
his study that 10 percent of the patients at the Grace New Haven Hospital
developed reactions to drugs. Seidl et al, (1966) at the Johns Hopkins
Hospital reported that 13.6 percent of the general, medical patients ex
perienced adverse reactions to drugs. However, another investigator has
found less than 1 percent adverse drug reaction in his population
(McDonald and MacKay 1964), Adverse drug reactions are becoming recog
nized as a major health problem*
Pharmacists receive more training than physicians and nurses
concerning drug-related problems* Carr's (1970) study shows that the
average medical student in his four years of training receives an average
of only 31 hours' training in clinical pharmacology and applied thera
peutics* The nursing education programs usually have only one formal
pharmacology course in their curriculum (McCord 1973)* In contrast, the
colleges of.pharmacy curriculum have included several courses concerned
1
with drug-related problems'. The intent of these drug-related courses is
to educate an individual who is better trained to identify and solve
drug-related problems. The accrediting body for colleges of pharmacy
(The American Council on Pharmaceutical Education) has formulated guide
lines for colleges which include strong recommendations for these in
stitutions to educate individuals knowledgeable in the clinical aspects
of drug therapy. The federal government has further added emphasis to
their movement by providing capitation grants to colleges of pharmacy
with specific recommendations to develop a clinical component of pharmacy
practice.
Purpose ;
The first purpose of this research was to determine the relative
effectiveness of a pharmacist and the cost involved in identifying
possible drug-related problems (PDRP’s) using three methods: rounding
with physicians; reviewing patient charts; and monitoring patient drug
profiles. The second purpose was to develop a methodology for the
practicing hospital pharmacist in identifying PDRP!s to improve patient
care.
The following general hypothesis was tested: there is a differ
ence in cost and effectiveness of a pharmacist in identifying PDRP1s by
rounding with physicians, reviewing patient charts, and monitoring
patient drug profiles.
During rounding with physicians, contamination of ideas between
the investigator and other members of the expert panel was
minimized,,
The patient population disease states did not vary significantly
during the experiment from method to method and were representa
tive of common disease states in other similar institutions*
The expert panel identified the majority of PDRP's in the patient
population during testing by any of the three methods*
Limitations
The data are more applicable to institutions employing the prob
lem oriented patient chart system* It is a superior system of
organizing and presenting medical information about a patient and
therefore requires less, time to read and study the patient
charts (Weed 1968)* Time factors affect two of the three methods
of identifying PDRP1se Because patient chart review and round
ing with physicians use the patient charts, the time needed to
read a chart organized by the problem oriented medical record
system would be less than the time needed to study a patient
chart organized in the traditional manner*
The possible drug-related problems detected in this study were
not related to actual patient drug reactions.
The patient drug profile system did not include the effects of
drugs on laboratory tests or the clinically demonstrable signs
and symptoms or abnormal diagnostic laboratory tests showing
malfunction of a body process*
4* This research used only one investigator in comparison with the
expert panel* If more than one investigator were compared to
the expert panel, the results could vary from the data collected
in this study*
Definitions
The word possible is defined as "that which may be true or a
fact, or may perhaps be the case, as something concerning that which one
has no knowledge to the contrary" (Webster's Seventh New Collegiate
Dictionary 1963)* Since the clinically significant reactions to drug-
related problems identified in this study were not established, the word
possible was used to describe the drug-related problems detected in this
study* The phrase possible drug^related problem will hereafter be
abbreviated PDRP* Drug-related situations can reasonably be expected to
be identified on the basis of available evidence, although not proven to
eventually develop into a problem* Each PDRP will be documented by using
Drug Interaction by Phillip Hansten (1971),Evaluations of Drug Interactions
by the American Pharmaceutical Association (1973), or the clinical liter
ature* A PDRP was defined for this study as any possible drug-food:■ ~
interaction, any possible drug-disease interaction, any possible drug-
drug interaction, any possible drug-hypersensitivity (allergic) reaction,
any possible dosage regimen error, or any possible drug toxicity*
A possible drug-disease interaction occurred when an order for a
drug which was contraindicated in a patient with a certain disease state
was written, e0ga, an order for a cold remedy which contains sympatho
mimetic amines for a diabetic patient,
A possible drug-drug interaction was any therapeutic incompati
bility caused by taking two drugs at the same time which have potentiat
ing, inhibiting, or opposing effect, e0gs, the potentiating effect of
phenylbutazone in a patient currently on coumadin therapy,
A possible drug-food interaction was considered to be caused by
taking a drug and food into the body at the same time and was manifested
by an altered effect of the drug in the patient, e.g., the decreased
effectiveness of tetracycline when given with meals.
A possible drug-hypersensitivity (allergic) reaction was any
adverse reaction of a patient to a drug whose symptoms were related to
the individual's increased immunologic response to the drug, e.g., an
anaphylatic reaction to a dose of penicillin.
A possible dosage regimen error occurred when the standard
dosage regimen (that listed in the literature accompanying the drug) is
not followed, e.g., a five-day course of therapy of ampicillin suspension
instead of the recommended ten-day course of therapy.
A possible drug toxicity was any pharmacologic action of a drug
that is exaggerated due to an overdose.
Usual, mild, common side effects of drugs not requiring treat-,
ment or causing undue patient discomfort or concern were not considered
as PDRP's, e.g., dryness of the mouth after administration of atropine.
Noncompliance to dosage regimen was not considered a PDRP,

RELATED LITERATURE
While the colleges of pharmacy and the federal government have
emphasized the education of clinical pharmacists, hospital pharmacies,
nursing homes, and retail pharmacies have been reluctant to hire them.
Despite federal monies being spent on the development of persons to per-,
form these professional functions, there is very little in the litera
ture to document the cost and effectiveness of pharmacists in identify
ing or solving drug-related problems. A search of the literature has
revealed very little with one exception concerning the cost and effective-Z
ness of pharmacists identifying drug-related problems. A recent study
done by Dixon, Skupin and Zajak (1973) addressed itself to the problems
of determining the incidence of potential drug interactions and to
estimate the time and cost involved in monitoring therapy. A seven
percent incidence of drug interactions for the patient population was
found. The cost of monitoring drug profiles per patient day was four
cents and the cost per interaction detected was approximately four
dollars. This study did not address itself to the problem of determin
ing effectiveness of a pharmacist in detecting drug interactions or
determining the superiority of one method of identifying drug interaction
over another.
There is a need for a study to show not only the cost of using
patient drug profiles for detecting drug interactions, but also the cost
6

and effectiveness of a pharmacist in identifying drug-related problems
using the commonly available methods of rounding with physicians,
patient chart review, and monitoring patient drug profiles„

DESIGN OF STUDY
Introduction
A sophisticated computer assisted identification system could
possibly identify most PDRP1s within an institution. Such a system
would consume large amounts of time and money and utilize specialized
personnel and equipment. Most small general hospitals do not have such
systems currently available to them. Consequently, it is impossible to
determine the absolute number of PDRP1s in an institution for a given
period of time. Therefore, the number of PDRP1s occurring in an insti
tution for a given period of time was estimated by an expert panel of
judges.
The institution used in this study was Pima County General
Hospital (PCGH). This hospital was a 140-bed hospital that treated
approximately 60,000 patients in 1972. Fifty-six thousand patients were
treated in outpatient specialty clinics, and 4,000 were admitted for in
patient treatment. The average patient stay at Pirn a County General
Hospital, for 1973 was 10.2 days. The population is made up of Mexican-
Americans, Indians, Blacks, and Caucasians. The main hospital struc
ture was constructed in 1936 and was somewhat outdated and crowded.
However, the equipment was adequate and up to date. The outpatient
clinics were internal medicine, neurology, diabetes, chest disease, ear,
nose and throat, gynecology, obesity, arthritis, cardiology, endocrine.
8
hematology9 and dermatology. The inpatient services were divided into
medical and surgical and included a neuropsychiatric service, urology,
orthopedics, chest, gynecology, neurosurgery, ear, nose and throat,
optha lino logy, and radiotherapy. Therefore, Pima County General Hospital
was considered to be representative of a small general hospital.
This study was conducted on the medical wards at Pima County
General Hospital which has 34 beds. The population of patients on this
ward were adult males" and females who were usually ill both, acutely and
subacutely. Most had multiple disease states. There were few elective
admissions on this ward.
An expert panel consisting of a professor from the College of
Pharmacy, a teaching physician, and the investigator was formed to
identify PDRP1s. The college professor graduated from the University of
Illinois College of Pharmacy with a Ph. D. He teaches biopharmaceutics,
pathology, and clinical pharmacy at The University of Arizona. The
teaching physician member of the panel is a board-certified endocrinolo
gist and is currently Chief of Medicine, Pima County General Hospital.
The investigator is a graduate of a five-year Bachelor of Science degree
program and has three years of hospital experience.
The expert panel was expected to identify a majority of the
PDRP1s of the patient population because it used all three methods of
identification simultaneously. The three members of the panel were more
thorough in identifying problems than one person, and the members of the
panel possessed a varied combination of educational backgrounds and
10
clinical experience. The patients used in the study were the patients
of the adult medical wards.
Methodology
The experiment was conducted at Pima County General Hospital
from July 28, 1973, to January 15, 1974. First, patient chart review
was conducted and took about two months. Rounding with physicians was
the second method used in the research and was conducted in two parts:
the first part being conducted from September 15, 1973, to December 1,
1973, and the second part running from January 1, 1974, to January 15, '
1974. Monitoring patient profiles was the last method used, and it also
was performed in two parts. The first part was from December 10, 1973,
to December 17, 1973, and the second part was run at the same time as
the last part of rounding with physicians--January 1, 1974, to January
15, 1974.
In reviewing patient charts, the investigator examined one-half .
of the patient medical charts on the medical ward while the other members
of the expert panel monitored the same patients. The charts were examined
every day at approximately the same time, and the time spent reading the
charts and looking for PDKPT s in texts on hand was recorded in minutes
for each patient. The charts examined were for the patients in even-
numbered beds so a cross section of the male and female patients were
obtained. The time spent looking for charts and the time lost due to
interruptions while reviewing patient charts was not included. The
PDKP1s found were not brought to the attention of the physicians and
interns as the purpose of the study was to identify, not solve, PDRP1s.

11
Also, if all the PDRP1s were discussed with physicians when detected,
this would have altered the prescribing techniques and skills of the
physicians.
The second method used in the study was the rounding with phy- .
sicians. Here the investigator attended work rounds with the attending
physician, the resident physician, the medical intern, the nurse, and
(during the first part of this method) the pharmacy intern. It was ex
plained to the physicians that the investigator was collecting data fori
experimental purposes which necessitated his keeping a time card. The
investigator assumed a passive observing role and did not initiate any
discussion concerning patient therapy. The other members of the expert
panel rounded with physicians on the same day and followed the same
patients,-, but did not round with the investigator. This was able to be
accomplished because the patients being followed had two physician teams
treating them. The investigator rounded with one-half of the patients
being followed with one physician team; the other members of the expert
panel rounded with the other half of the patients being followed. By
alternating physician teams, all the patients were followed and the
investigator and members of the expert panel did not have to be together
on rounds, thus minimizing crossover contamination. If either the in
vestigator or the other members of the expert panel received information
concerning a PDRP from another panel member, the results of that patient
were dropped from the study. The investigator was free to converse with
the patients and consult the chart at bedside as a reference. The
. 12
investigator did not study the chart for extended periods of time as he
might during reviewing patient charts.
The last method used in detecting PDRP's was the monitoring of
patient drug profiles, A patient drug profile system was already in use
at Pima.County General Hospital. The system was adequate except that it
lacked an active problem list for the patient. Therefore, an active
problem list was added to the profile system and this modified patient
drug profile system was used. The patient drug profile included aller
gies, diagnosis, height,, weight, medication and strength, route of
administration dosage schedule, and doctor (Figure 1). The patient drug
profiles were used at the same time each day. The time spent using this
method was recorded only while monitoring the patient drug profile and
did not include the time spent in preparation or maintenance of profiles.
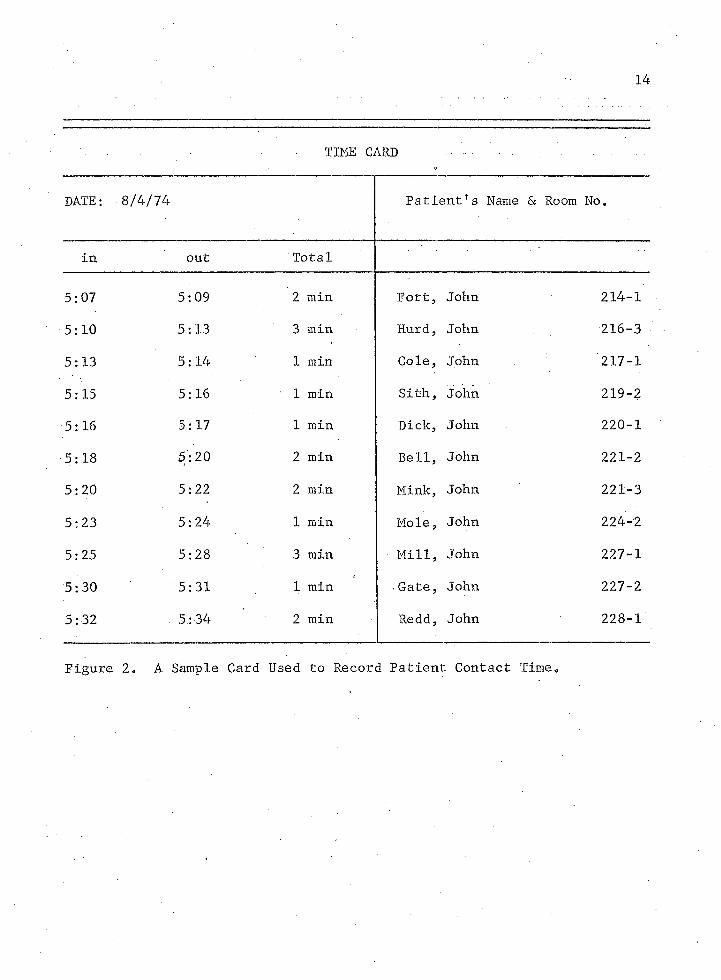
The time spent identifying PDKPf s using the three methods
described was recorded in minutes on a time card. The time card was
designed to include the date, time in and out, and the patient's name
and was used to record the time spent with each patient while rounding,
reviewing patient charts, and monitoring drug profiles (Figure 2).
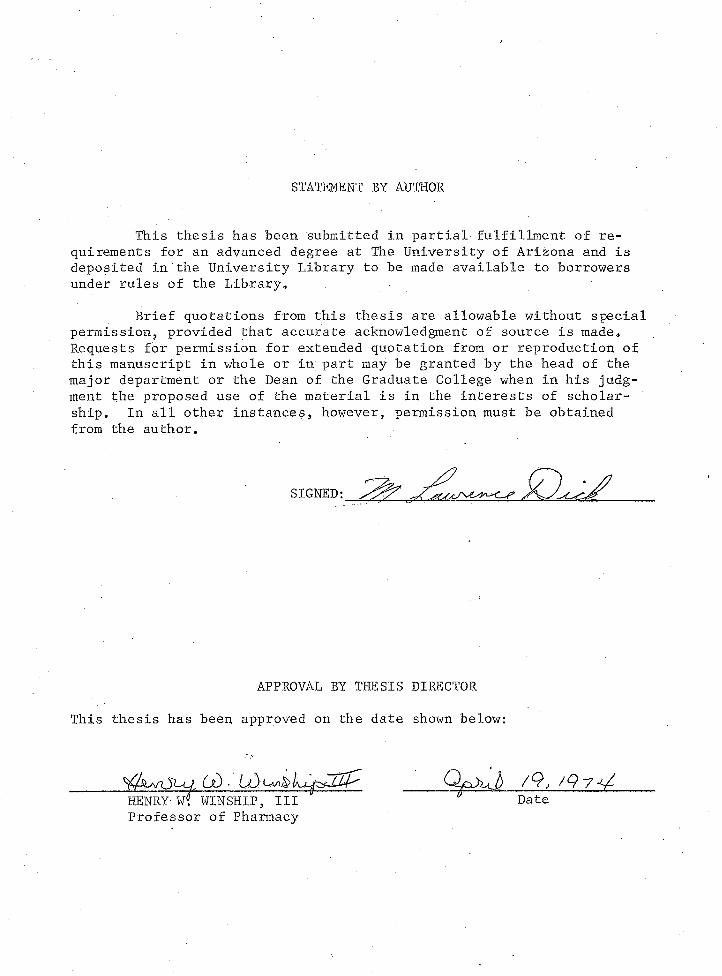
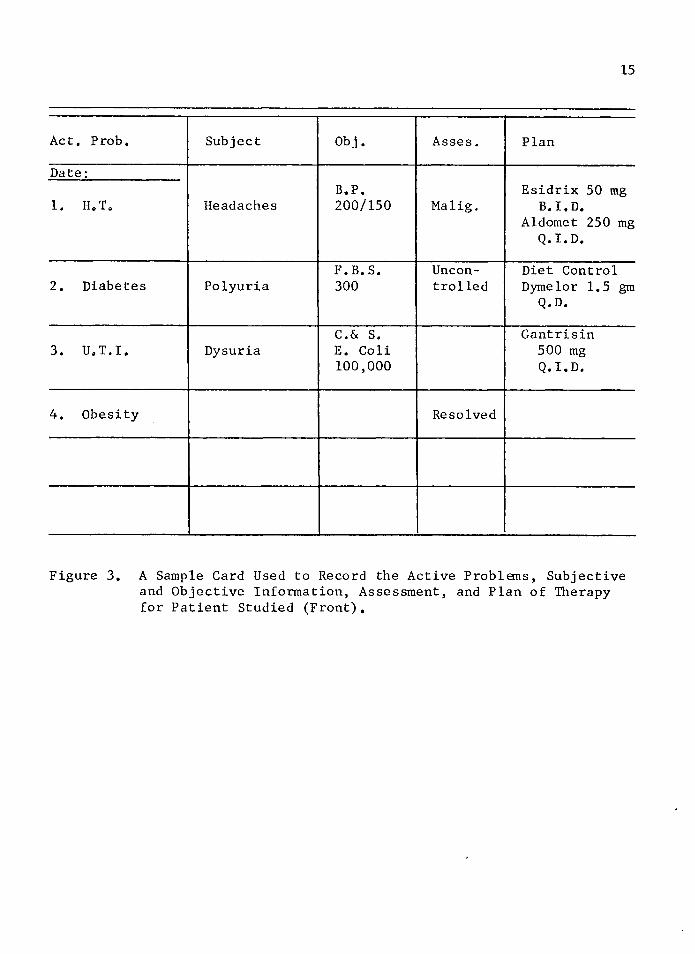
Patients were followed using a problem-oriented approach. A
card designed for this purpose was termed a SOAP card. This patient
information card included subjective patient information (e.g., signs
and symptoms), objective patient information (e.g., diagnostic examina
tion results), assessment of the patient's condition, plan for treatment
(medications or other therapy), and a list of the patient's active
problems (Figure 3). Each PDKP identified by the investigator was

Allergies: Height: Patient Demographics:
Diagnosis: Weight:
Discharge Date:
Medication Form Dosage Total MD D 8/4 8/5 8/6 8/7 8/8. 8/9& Strength Schedule Dose I
Iron ■ 300 mg P° 1 TID 3 Smith
8/4/74MLD 0
8/5/74MLD 0
8/6/74 MLD . 0
8/7/74MLD 0
8/7/74MLD 0
8/8/74MLD 0
Valium 5 mg po 1 TID 3 Smith
8/4/74MLD 0
8/5/74MLD 0
8/6/74MLD 1
8/6/74D.C. 0
Tylenol • 5 gr po 11 QID 4 Smith
8/4/74MLD 0
8/5/74MLD 0
8/6/74MLD 0
8/7/74MLD 0
8/8/74MLD 0
8/9/74MLD 0
MOM po' 30 cc HS 30 cc Smith
8/4/74MLD 0
8/5/74MLD 0
8/6/74MLD 0
8/7/74MLD 0
8/8/74MLD 0
8/9/74MLD 0
Dalmane 30 mg po 1 HS 1 Smith
8/4/74MLD 0
8/5/74MLD 0
8/6/74MLD 0
8/7/74MLD 0
8/8/74MLD 0
8/9/74MLD 0
Dymelor 500 mg po 1 QD 1 Doe
8/4/74MLD 0
8/5/74MLD 0
8/6/74MLD 0
8/7/74MLD 0
8/8/74MLD 0
8/9/74MLD 0
Active Problem List
1, Anemia 30 Adult 0n~2c Agitation set Diabetes
4„ ObesityFigure 1. A Sample Patient Drug Profile.
14
TIME CARD
DATE: 8/4/74 Patient's Name & Room No.
in out Total
5:07 5:09 2 min Fort, John 214-1
5:10 5:13 3 min Hurd, John 216-3
5:13 5:14 1 min Cole, John 217-1
5:15 5:16 1 min Sith, John 219-2
5:16 5:17 1 min Dick, John 220-1
5:18 5/i 20 2 min Bell, John 221-2
5:20 5:22 2 min Mink, John 221-3
5:23 5:24 1 min Mole, John 224-2
5:25 5:28 3 min Mill, John 227-1
5:30 5:31 1 min Gate, John 227-2
5:32 5:34 2 min Redd, John 228-1
Figure 2. A Sample Card Used to Record Patient Contact Time.
15
Act. Prob. Subject Obj. Asses. Plan
Date:
1. H.T. HeadachesB.P.200/150 Malig.
Esidrix 50 mg B.I.D.
Aldomet 250 mg Q.I.D.
2. Diabetes PolyuriaF.B.S.300
Uncontrolled
Diet Control Dymelor 1.5 gra Q.D.
3. U.T.I. DysuriaC.& S. E. Coli 100,000
Gantrisin 500 mg Q.I.D.
4. Obesity Resolved
Figure 3. A Sample Card Used to Record the Active Problems, Subjective and Objective Information, Assessment, and Plan of Therapy for Patient Studied (Front),

recorded on the reverse side of the SOAP card. It contained the date,
PDKP and evidence and references (Figure 4).
SOAP CARD.
Pt„ Doe, John
DATE PDRP8/1/73 ' Antacid used concurrently with
tetracycline
EVIDENCEHansen Page 133
Figure 4. A Sample Card of a Possible Drug-Related Problem, Date, and Evidence (Back)„

RESULTS AND DISCUSSION OF DATA
A total of 243 possible drug-related problems was detected
utilizing patient chart review, rounding with physicians, and monitor
ing patient drug profiles. Of 224 patients studied, 124 (62.5 percent)
were found,to have PDRP's. The PDRP's were subdivided into six cate
gories: drug-drug interaction, drug-food interaction, drug-disease
interaction, drug toxicity, drug allergy, and dosage regimen error. The
number of PDRP's screened using the three different methods is shown in
Table 1.
Table 1. Total Number and Percentage of Possible Drug-Related Problems Identified in the Population by the Three Methods Studied.
Category Number of PDRP's Detected
Percentage
Drug-drug interaction 174 71.6
Drug-food interaction 1 0.4
Drug-disease interaction 23 9.5
Drug-toxicity 29 11.9
Drug allergy 7 2.9
Dosage regimen error 9 3.7Combined 243 100.00
17
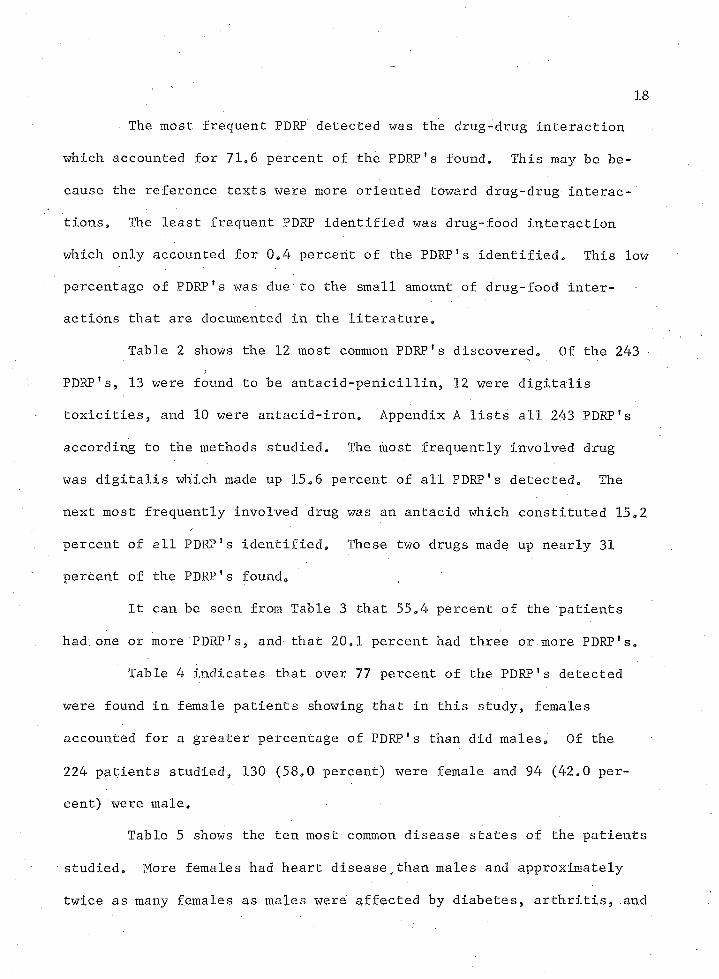
18
The most frequent PDKP detected was the drug-drug interaction
which accounted for 71,6 percent of the PDKP1s found. This may be be
cause the reference texts were more oriented toward drug-drug interac
tions, The least frequent PDKP identified was drug-food interaction
which only accounted for 0,4 percent of the PDKP1s identified. This low
percentage of PDRP's was due to the small amount of drug-food inter
actions that are documented in the literature.
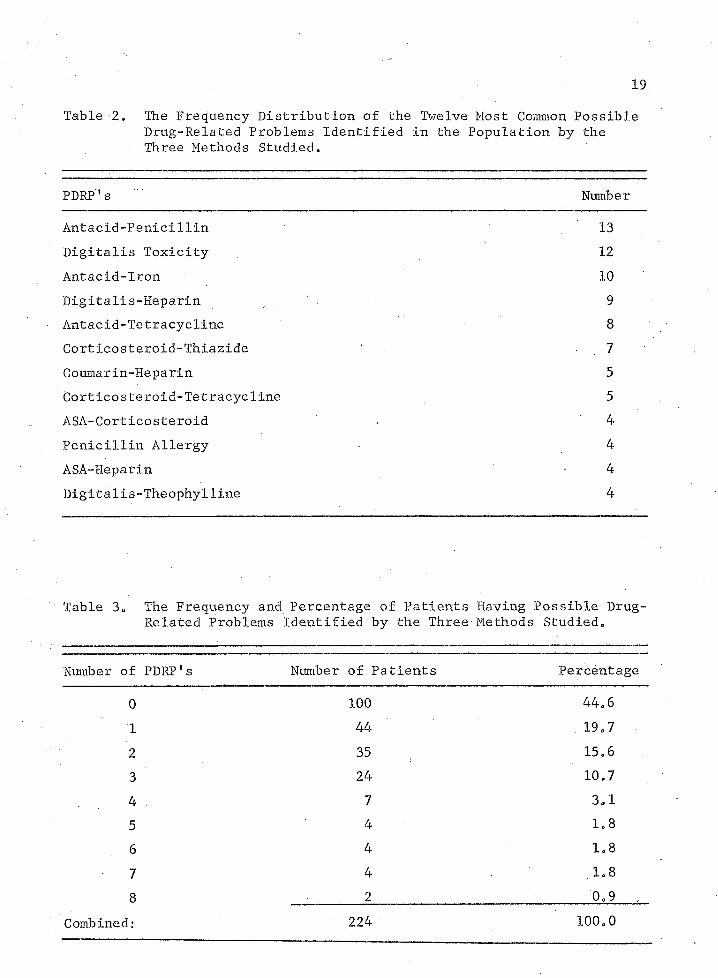
Table 2 shows the 12 most common PDKP1s discovered. Of the 243
PDKP1s, 13 were found to be antacid-penicillin, 12 were digitalis
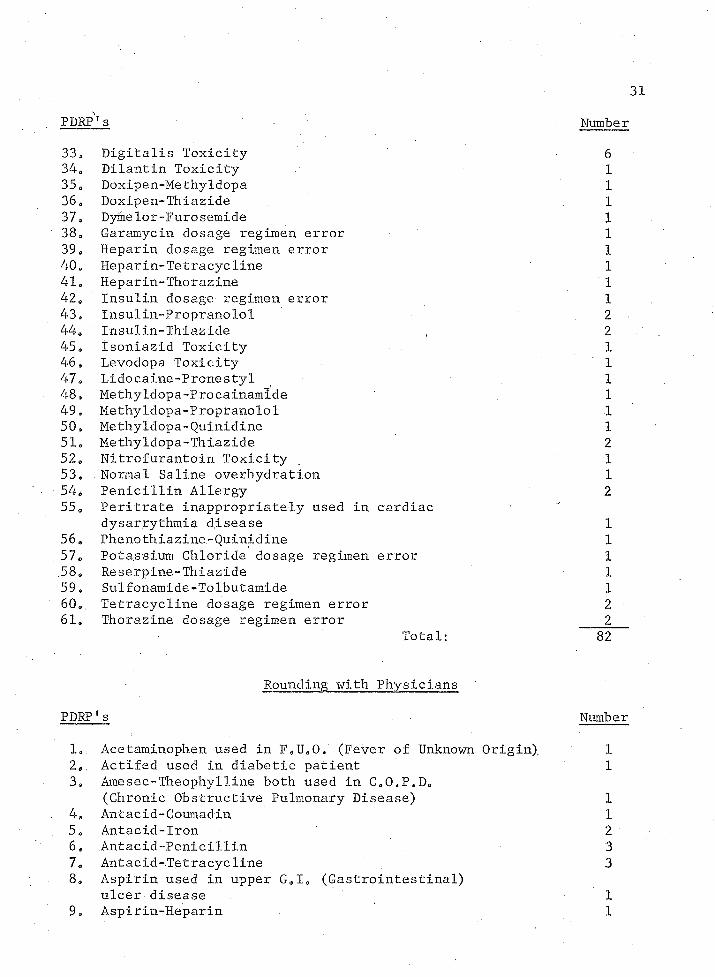
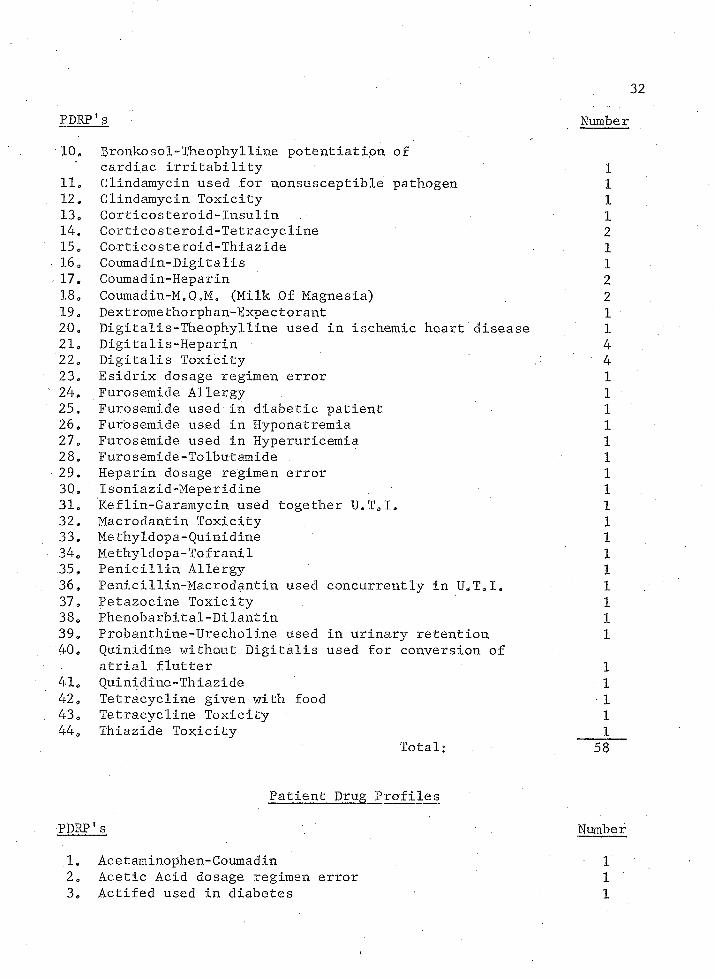
toxicities, and 10 were antacid-iron. Appendix A lists all 243 PDKP!s
according to the methods studied. The most frequently involved drug
was digitalis which made up 15.6 percent of all PDKP!s detected. The
next most frequently involved drug was an antacid which constituted 15.2
percent of all PDKP1s identified. These two drugs made up nearly 31
percent of the PDKP1s found.
It can be seen from Table 3 that 55.4 percent of the patients
had.one or more PDKP’s, and that 20,1 percent had three or more PDKP1 s.
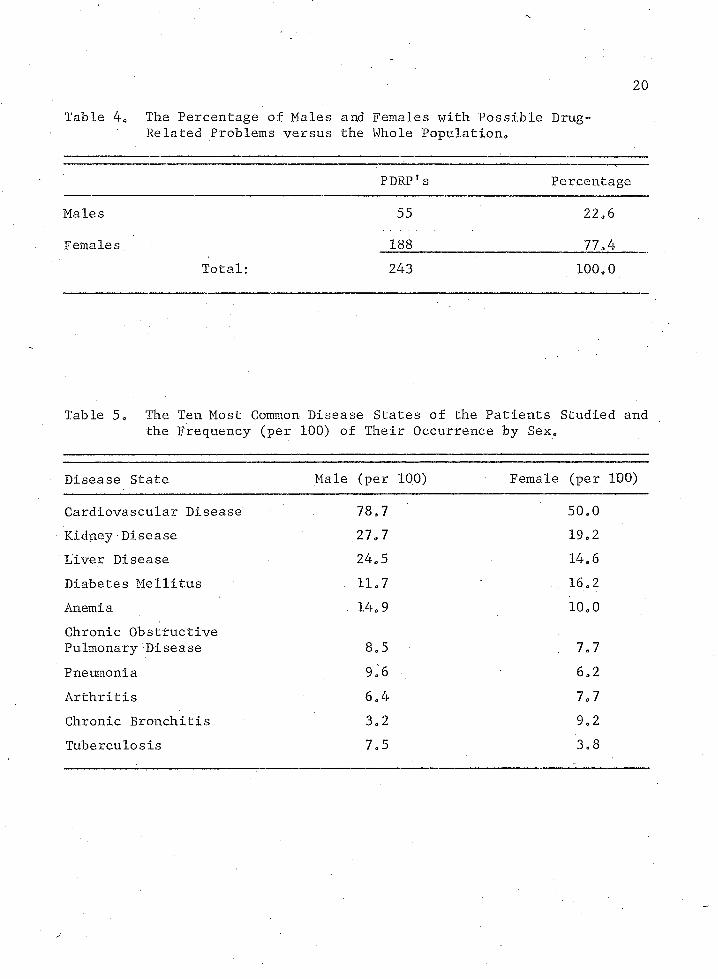
Table 4 indicates that over 77 percent of the PDKP1s detected
were found in female patients showing that in this study, females
accounted for a greater percentage of PDKPf s than did males. Of the
224 patients studied, 130 (58.0 percent) were female and 94 (42.0 per
cent) were male.
Table 5 shows the ten most common disease states of the patients
studied. More females had heart disease/than males and approximately
twice as many females as males were affected by diabetes, arthritis, and
19
Table 2. The Frequency Distribution of the Twelve Most Common Possible Drug-Related Problems Identified in the Population by the Three Methods Studied.
PDRP's Number
Antacid-Penicillin 13Digitalis Toxicity 12Antacid-Iron 10Digitalis-Heparin 9Antacid-Tetracycline 8Corticosteroid-Thiazide 7Coumarin-Heparin 5Corticosteroid-Tetracycline 5ASA-Corticosteroid . 4Penicillin Allergy 4ASA-Heparin 4Digitalis-The ophy1line 4
Table 3« The Frequency and Percentage of Patients Having Possible Drug- Related Problems Identified by the Three-Methods Studied,
Number of PDRP's Number of Patients Percentage
0 100 44.61 44 19.72 35 15.63 24 10.7
. . 4 7 3.15 4 1.86 4 1.87 4 1.88 2 0.9 ,
Combined: 224 100.0
-20
Table 40 The Percentage of Males Related Problems versus
andthe
Females with Possible Whole Population*
Drug-
PDRP's Per.centage
Males 55 22.6
Females._______________________________ 188_______________ 77.4Total: 243 100.0
Table 5. The Ten Most Common Disease States of the Patients Studied and the Frequency (per 100) of Their Occurrence by Sex.
Disease State Male (per 100) Female (per 100)
Cardiovascular Disease 78.7 50.0Kidney Disease 27.7 19.2Liver Disease 24.5 14.6Diabetes Mellitus 11.7 16.2Anemia . 14.9 10.0Chronic Obstructive Pulmonary Disease 8.5 7.7Pneumonia 9.6 . 6.2Arthritis 6.4 7.7Chronic Bronchitis 3.2 9.2Tuberculosis 7.5 3.8
21
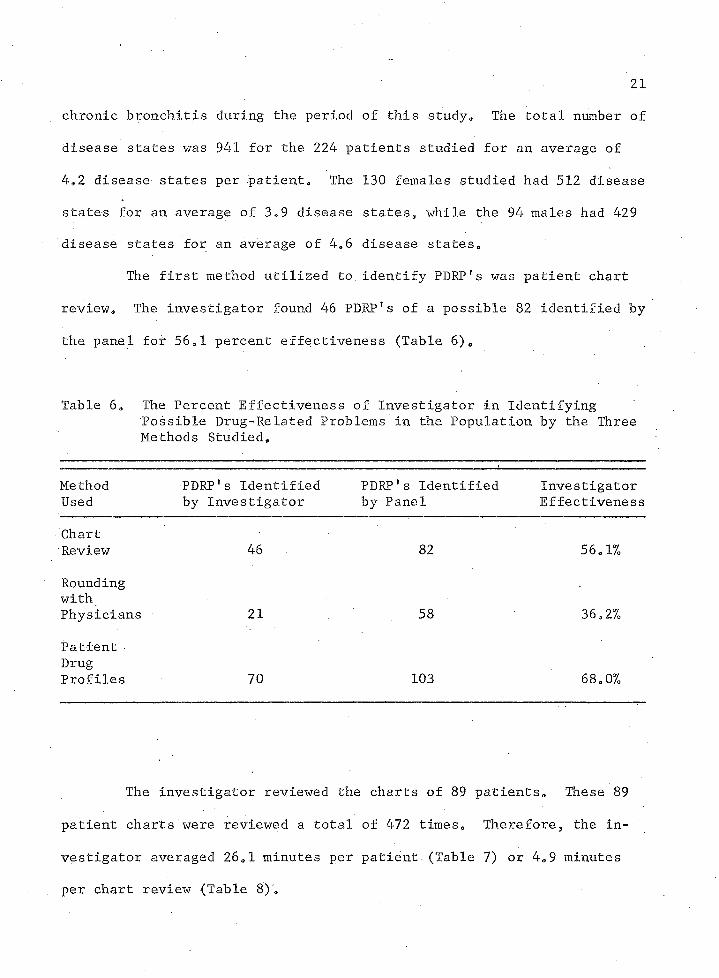
chronic bronchitis during the period of this study„ The total number of
disease states was 941 for the 224 patients studied for an average of
4,2 disease states per patient. The 130 females studied had 512 disease
states for an average of 3,9 disease states, while the 94 males had 429
disease states for an average of 4,6 disease states.
The first method utilized to. identify PDRP*s was patient chart
review. The investigator found 46 PDRP1s of a possible 82 identified by
the panel for 56,1 percent effectiveness (Table 6),
Table 6, The Percent Effectiveness of Investigator in IdentifyingPossible Drug-Related Problems in the Population by the Three Methods Studied,
MethodUsed
PDRP1s Identified by Investigator
PDRP1s Identified by Panel
InvestigatorEffectiveness
ChartReview 46 82 56.1%
RoundingwithPhysicians 21 58 36.2%
PatientDrugProfiles 70 103 68.0%
The investigator reviewed the charts of 89 patients* These 89
patient charts were reviewed a total of 472 times. Therefore, the in
vestigator averaged 26,1 minutes per patient (Table 7) or 4,9 minutes
per chart review (Table 8),
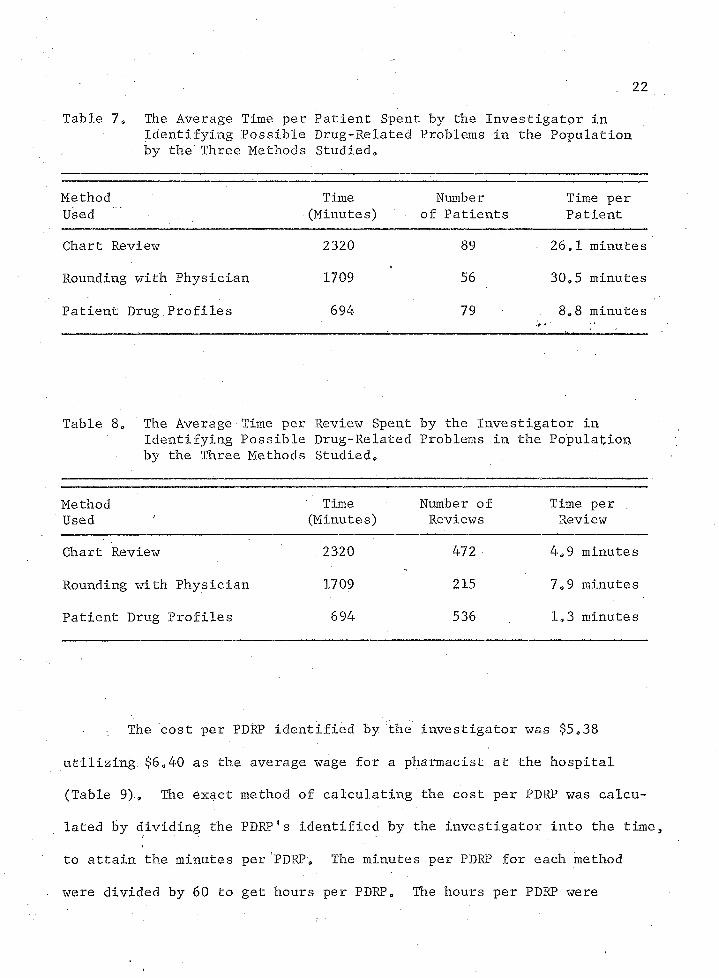
22
Table 7, The Average Time per Patient Spent by the Investigator inIdentifying Possible Drug-Related Problems in the Population by the Three Methods Studied,
MethodUsed
Time(Minutes)
Number of Patients
Time per Patient
Chart Review 2320 89 - 26.1 minutes
Rounding with Physician 1709 56 30,5 minutes
Patient Drug Profiles 694 79 : 8,8 minutes
Table 8, The Average Time per Review Spent by the Investigator inIdentifying Possible Drug-Related Problems in the Population by the Three Methods Studied,
MethodUsed
Time(Minutes)
Number of Reviews
Time per Review
Chart Review 2320 472 4,9 minutes
Rounding with Physician 1709 215 7,9 minutes
Patient Drug Profiles 694 536 1.3 minutes
The cost per PDRP identified by the investigator was $5,38
utilizing $6,40 as the average wage for a pharmacist at the hospital
(Table 9)» The exact method of calculating the cost per PDRP was calcu
lated by dividing the PDRP? s identified by the investigator into the time,
to attain the minutes per PDRP, The minutes per PDRP for each method
were divided by 60 to get hours per PDRP, The hours per PDRP were

23
Table 9. The Cost per Possible Drug-Related Problems Population by the Three Methods Studied,
Identified in
MethodUsed
Time PDRP Identified (Minutes) by Investigator
Cost per PDRP
Chart Review 2320 46 $5,38 .
Rounding withPhysician 1709 21 8,68
Patient DrugProfiles 694 70 1,06
were multiplied by $6,40 which was the average pharmacist salary at Pima
County General Hospital,
The statistic of interest would be to determine the significance
of the difference in cost per PDEP for the three methods. However, be
cause the sampling distribution of that statistic was unknown, a test of
significance was not run.
Initially chart review appeared to be a very satisfactory method
for detecting PDKP1s, However, after rounding with physicians, the in
vestigator discovered that the method of chart review had some defi
ciencies, First, the physician did not always include a reason in the
chart notes for his prescribing habits. Second, there was an inadequate
description of the patientTs complaints and daily progress in the nurses'
notes.
Using the rounding with physicians method, the investigator
found 21 of a potential 58 PDRP's for a 36,2 percent effectiveness
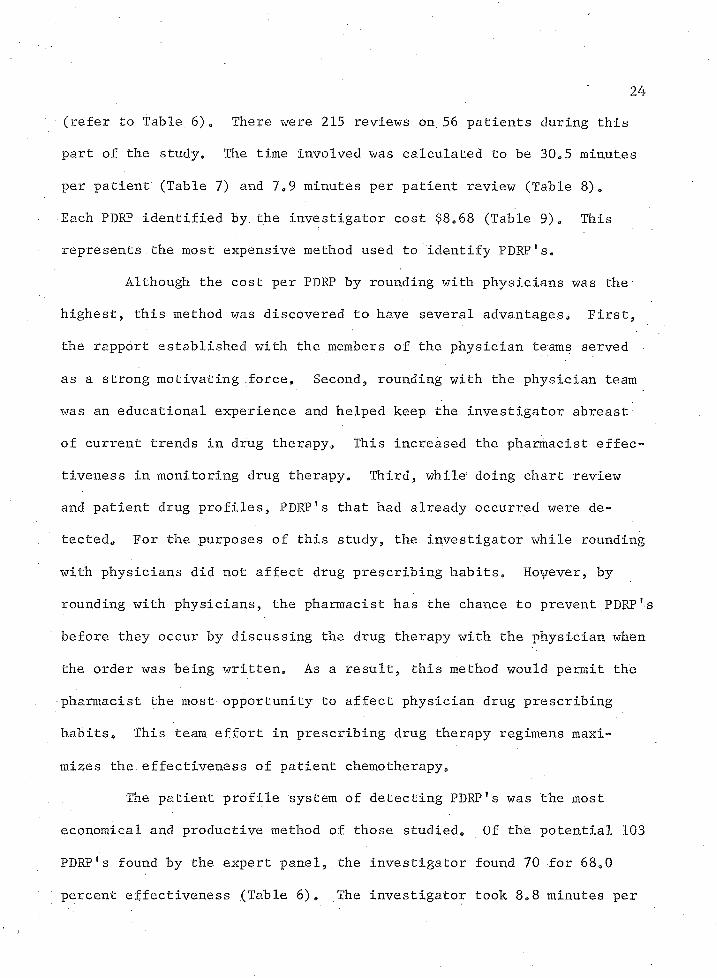
24
(refer to Table 6)0 There were 215 reviews on 56 patients during this
part of the study* The time involved was calculated to be 30*5 minutes
per patient (Table 7) and 7*9 minutes per patient review (Table 8)*
Each PDRP identified by, the investigator cost $8*68 (Table 9)* This
represents the most expensive method used to identify PDRP1s*
Although the cost per PDRP by rounding with physicians was the
highest, this method was discovered to have several advantages* First,
the rapport established with the members of the physician teams served
as a strong motivating force* Second, rounding with the physician team
was an educational experience and helped keep the investigator abreast
of current trends in drug therapy* This increased the pharmacist effec
tiveness in monitoring drug therapy. Third, while doing chart review
and patient drug profiles, PDRP1s that had already occurred were de
tected* For the purposes of this study, the investigator while rounding
with physicians did not affect drug prescribing habits, Hoyever, by
rounding with physicians, the pharmacist has the chance to prevent PDRP1s
before they occur by discussing the drug therapy with the physician when
the order was being written* As a result, this method would permit the
pharmacist the most opportunity to affect physician drug prescribing
habits* This team effort in prescribing drug therapy regimens maxi
mizes the effectiveness of patient chemotherapy*
The patient profile system of detecting PDRP1s was the most
economical and productive method of those studied* Of the potential 103
PDRP1s found by the expert panel, the investigator found 70 for 68*0
percent effectiveness (Table 6), The investigator took 8*8 minutes per
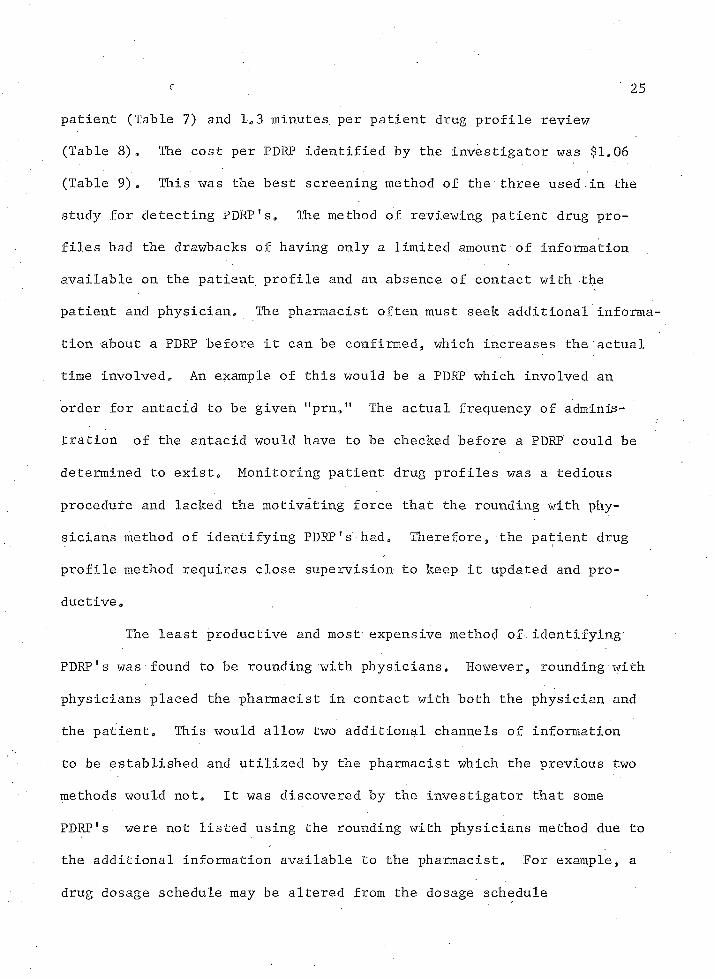
f 25patient (Table 7) and 1*3 minutes, per patient drug profile review
(Table 8)» The cost per PDRP identified by the investigator was $1*06
(Table 9)9 This was the best screening method of the three used in the
study for detecting PDRP1s» The method of reviewing patient drug pro
files had the drawbacks of having only a limited amount of information
available on the patient profile and an absence of contact with the
patient and physician. The pharmacist often must seek additional informa
tion about a PDRP before it can be confirmed, which increases the actual
time involved. An example of this would be a PDRP which involved an
order for antacid to be given "prn*11 The actual frequency of adminis
tration of the antacid would have to be checked before a PDRP could be
determined to exist* Monitoring patient drug profiles was a tedious
procedure and lacked the motivating force that the rounding with phy
sicians method of identifying PDRP1s had* Therefore, the patient drug
profile method requires close supervision to keep it updated and pro
ductive.
The least productive and most expensive method of.identifying
PDRP1s was found to be rounding with physicians. However, rounding with
physicians placed the pharmacist in contact with both the physician and
the patient. This would allow two additional channels of information
to be established and utilized by the pharmacist which the previous two
methods would not. It was discovered by the investigator that some
PDRP's were not listed using the rounding with physicians method due to
the additional information available to the pharmacist. For example, a
drug dosage schedule may be altered from the dosage schedule.
26
recommendations of the manufacturer for a patient who is either sensi
tive or resistant to the effects of a particular drug, i0e0, pain
medication, and therefore would not be recorded as a PDKPe . This would
decrease the number of PDRP * s listed by the investigator and make him
seem less effective using this method.
For the pharmacist who is considering the implementation of a
method for screening for PDKP1s,.the findings of this research would
indicate the utilization of the patient drug profile system. However,
the pharmacist should be aware of the many disadvantages of the system
previously mentioned. Although rounding with physicians was found to be
more expensive, the pharmacist would have a greater opportunity to
affect patient care. It is important that the pharmacist become an
integral part of the patient care team. This cannot be done in the
pharmacy simply by reviewing patient drug profiles*
Other investigators have shown that 18 to 30 percent of hospi
talized patients have a drug reaction (Schimmel 1964, Hoddinott et alfl
1967) and that the duration of hospitalization of these patients has
increased as a consequence (Schimmel 1964, Seidl et al0 1966, Ogilvie
and Ruedy 1967)o During the period of this study, the average patient
day stay on the medical wards at Pima County General Hospital was 10,2
days, and the average cost per patient day was $101 (Nagy 1974), If the
patients in this study which had PDRP1s exhibited clinically significant
adverse affects and their hospital stay was extended by only two days,
it would have been 12,2 patient days or $202 expense per patient due to
adverse drug reactions. This added expense due to adverse drug reactions

27
can be compared to the cost of identifying a PDRP by the methods used in
this study by examining Table 9. This study shows the pharmacist is
able to .detect PDRP1s at a reasonable cost and, therefore, can provide
needed services as well as a product in our health care system*
SUMMARY AND RECOMMENDATIONS
Summary
This research was primarily concerned with determining the cost
effectiveness of an investigator using three different commonly used
methods of identifying PDRP1s: rounding with physicians, patient chart
review, and monitoring patient drug profiles0 The results indicate that
monitoring patient drug profiles was the most productive and least ex
pensive method of identifying PDRP1s within the boundaries set up for
this study„
While the monitoring of patient drug profiles proved to be the
best method of identifying PDRP1s, the PDRP1s discovered using this
method require additional clarification, and therefore, additional time,
to be confirmed* This was because this system lacked both physician and
patient contact and placed the pharmacist out of the mainstream of
actual patient care* In this study the patient drug profile system
evaluation did not include the time necessary for preparing or updating
the profiles* This method is productive for screening for PDRP1s, but
it does not place the pharmacist in a position where he is aware of the
total patient therapy*
Patient chart review was found to be the second most productive
method of identifying PDRP1s and the second least expensive* This
method of identifying PDRP1s gave the pharmacist much more information
28

29
concerning the total patient care, but lacked the actual patient con
tact and the communication between the pharmacist and other members of
the health care team* Also, the charts were not always completely
descriptive of the patient's condition and therapy regimen,
,Recommendations
One reason the patient drug profile proved to be a productive
screening method for identifying PDRP's was that the patient profile
contained the patient's medical problems as well as drugs. It is there
fore 'recommended that, when the patient drug profile method of identify
ing PDRP's is used, it should include a daily updated active problem
list.
Although reviewing patient drug profiles was the least expensive
and most productive method of detecting possible drug-related problems,
it is recommended that research should be done to determine the clinical
significance of the identified PDRP's, It is further recommended that a
study to determine cost effectiveness of identifying clinically signi
ficant PDRP's be conducted.

APPENDIX A
TOTAL NUMBER OF POSSIBLE DRUG-RELATED PROBLEMS IDENTIFIED
Chart Review
PDRP1s Number
1, Allopurinol-Iron 22a Aminophylline-Digitalls 13„ Aminophylline induced hypertension 140 Ampicillin-Mandelamine used together in U,ToI,
(Urinary Tract Infection) 15* Antacid-Iron 36 a Antacid-Penicillin 17d Antacid-Tetracycline 28. Aspirin-Corticosteroid 29a Aspirin-Penicillin ' 110, Atropine-Propanolol 1ll* Barbiturate-Digitalis 1120 Barbiturate-Dilantin 113o Benadryl dosage regimen error 114, Benadry1-Heparin 115, Benadry1-Thorazine 216, Cholestryamine dosage regimen error 1 .17, Compazine-Dilantin 118, Corticosteroid-Insulin 119, Corticosteroid-Thiazide 320, Corticosteroid Toxicity 121, Darvon-Dilantin-Phenergan potentiation of C,N,S,
(Central Nervous System) depression 122, Diazepam Allergy 123, Diazepam used in patient malaise • 124, Diazepam-Doxipen 125, Diazepam drug dosage regimen error 126, Diazepam-Propanolol 127, Diazepam-Quinidine 128, Diazepam-Thiothixene 129, Diazepam-Talwin 130, Digitalis-Heparin 231, Digitalis-Propranolol 232, Digitalis-Ritalin 1
30
31
PDRP *s Number
33* Digitalis Toxicity 634. Dilantin Toxicity 135. Doxipen-Methyldopa 136. Doxipen-Thiazide 137. Dymelor-Furosemide 138. Garamycin dosage regimen error 139. Heparin dosage, regimen error 140. Heparin-Tetracycline 141. Heparin-Thorazine 142. Insulin dosage regimen error 143. Insulin-Propranolol 244. Insulin-Thiazide , 245. Isoniazid Toxicity 146. Levodopa Toxicity 147. Lidocaine-Pronestyl 148. Methyldopa-Procainamide 149. Methyldopa-Propranolol 150. Methyldopa-Quinidine 151. Methyldopa-Thiazide 252. Nitrofurantoin Toxicity 153. Normal Saline overhydration 154. Penicillin Allergy 255. Peritrate inappropriately used in cardiac
dysarrythmia disease 156. Phenothiazine-Quinidine 157. Potassium Chloride dosage regimen error 158* Reserpine-Thiazide 159. Sulfonamide-Tolbutamide 160.. Tetracycline dosage regimen error 261. Thorazine dosage regimen error 2
Total: 82
Rounding with Physicians
PDRP1s Number
1. Acetaminophen used in F.U.O. (Fever of Unknown Origin). 12. Actifed used in diabetic patient 13. Amesec-Theophylline both used in C.O.P.D.
(Chronic Obstructive Pulmonary Disease) 14. Antacid-Coumadin 15. Antacid-Iron 26. Antacid-Penicillin 37. Antacid-Tetracycline 38. Aspirin used in upper G.I. (Gastrointestinal)
ulcer disease 19. Aspirin-Heparin 1
32
PDRP 's Number
■10. Bronkosol^-Theophylline potentiation ofcardiac irritability 1
11. Clindamycin used for nonsusceptible pathogen 112. Clindamycin Toxicity 113. Corticosteroid-Insulin 114. Corticosteroid-Tetracycline 215. Corticosteroid-Thiazide 116. Coumadin-Digitalis 117. Coumadin-Heparin 218. Coumadin-Me0»M 6 (Milk Of Magnesia) 219. Dextromethorphan-Expectorant 120. Digitalis-Theophylline used in ischemic heart disease 121. Digitalis-Heparin 422. Digitalis Toxicity ' 423. Esidrix dosage regimen error 124. Furosemide Allergy 125. Furosemide used in diabetic patient 126. Furosemide used in Hyponatremia 127. Furosemide used in Hyperuricemia 128. Furosemide-Tolbutamide 129. Heparin dosage regimen error 130. IsoniazId-Meperidine 131. Keflin-Garamycin used together U,TeI» 132. Macrodantin Toxicity 133. Me thyId op a-Quinidine 134. Methyldopa-Tofranil 135. Penicillin Allergy 136. Penicillin-Macrodantin used concurrently in UoTdI, 137. Petazocine Toxicity 138. Phenobarbital-Dilantin 139. . Probanthine-Urecholine used in urinary retention 140. Quinidine without Digitalis used for conversion of
atrial flutter 141. Quinidine-Thiazide 142. Tetracycline given with food 143. Tetracycline Toxicity 144. Thiazide Toxicity 1
Total:
Patient Drug Profiles
58
PDRP!'a Number
1. Acetaminophen-Coumadin 12. Acetic Acid dosage regimen error 13. Actifed used in diabetes 1
33
PDRP *s Number
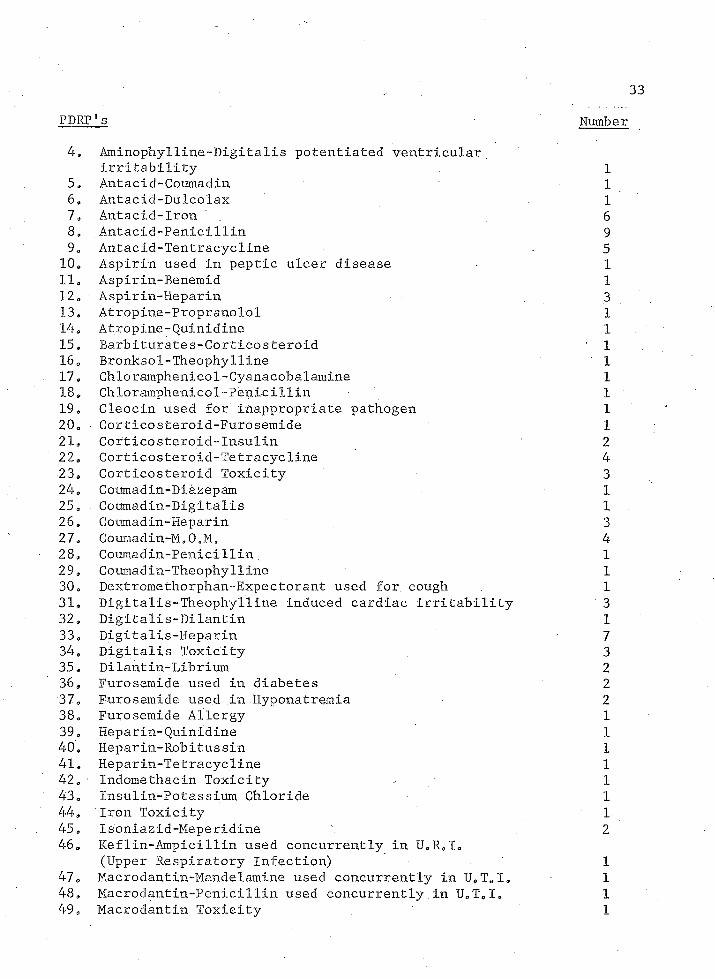
4. Aminophylline-Digitalis potentiated ventricular,irritability 1
5. Antacid-Coumadin 16» Antacid-DuIcolax 17o Antacid-Iron 680 Antacid-Penicillin 99o Antacid-Tentracycline . 510» Aspirin used in peptic ulcer disease 111. Aspirin-Benemid 112s Aspirin-Heparin 313a Atropine-Propranolol 114a Atropine-Quinidine 115 a Barbiturates-Corticosteroid ' 116e Bronksol-Theophylline ' 117o Chloramphenicol-Cyanacobalamine 118a Chloramphenicoi-Penicillin 119a Cleocin used for inappropriate pathogen 120o Corticosteroid-Furosemide 121a Corticosteroid-Insulin 222a Corticosteroid-Tetracycline 423. . Corticosteroid Toxicity 324a Coumadin-Diazepam 125 a Coumadin-Digitalis 126. Coumadin-Heparin 327d Coumadin-M, 0,M, 428* Coumadin-Penicillin.. 129® Coumadin-Theophylline 130a Dextromethorphan-Expectorant used for. cough 131a Digitalis-Theophylline induced cardiac irritability 332. Digitalis-Dilantin 133a Digitalis-Heparin 734e Digitalis Toxicity 335, Dilantin-Librium 236. Furosemide used in diabetes 237fl F-urosemide used in Hyponatremia 238, Furosemide Allergy 139a Heparin-Quinidine 140a Heparin-Robitussin 141a Heparin-Tetracycline 142o ■ Indomethacin Toxicity . 143o Insulin-Potassium Chloride 144* Iron Toxicity 145 a Isoniazid"Meperidine \ 246* Keflin-Ampicillin used concurrently in IhR010
(Upper Respiratory Infection) 147o Macrodantin-Mandelamine used concurrently in U6T»Ia 148, Macrodantin-Penicillin used concurrently in U0T01» 149o Macrodantin Toxicity 1

34
PDRP's Number
50» Methyldopa-Quinidine 1 .510 Morphine-Codeine-Dilantin-Robaxin potentiated
C»Ne S9 depression 152o Mucomyst used in asthmatic patient 253* Penicillin Allergy 154e Quinidine used without Digitalis for conversion of
atrial flutter 155* Quinidine-Thiazide 256. Tetracycline Toxicity 157o Theophylline Toxicity 1_
Total: 103

REFERENCES
American Pharmaceutical Association. Evaluations of Drug Interactions. Washington, B.C.: American Pharmaceutical Association, 1973.
Carr, E, A. "A Short Course in Clinical Pharmacology." Clinical Pharmacology and Therapeutics, 11:455, 1970,
Dixon, F. W„, D. Skupin, and K» Zajak. "Monitoring Drug Therapy at Minimum Cost." American Journal of Hospital Pharmacy,30:1005, 1973.
Hansten, P. D. Drug Interactions. Philadelphia: Lea and Febiger,1971.
Hoddinott, B. D., C. W. Gowdey, W. K» Coulter, and J. M. Parker."Drug Reactions and Errors in Administration on a Medical Ward." Canadian Medical Association Journal, 97:1001-1006, 1967.
McCord, Beverly. Assistant Dean of the College of Nursing, TheUniversity of Arizona. Personal Interview, June 28, 1973.
McDonald, M. G. and B. R, MacKay. "Adverse Drug Reactions." Journal of American Medical Association, 188:1071, 1964.
Nagy, Joseph. Cost Accountant, Pima County General Hospital, Tucson, Arizona. Personal Interview, March 14, 1974.
Ogilvie, R. I. and J. Ruedy, "Adverse Drug Reactions During Hospitalization." Canadian Medical Association Journal, 97:1450-1457,1967.
Schimmel, E. M. "The Hazards of Hospitalization." Annotated Internal Medicine, 60:100, 1964,
Seidl, L„ G., G, F, Thorton, J. W. Smith, and L. E. Cluff. "Studies oh the Epidemiology of Adverse Drug Reactions. Part III: Reaction in Patients on a General Medical Service." Bulletin of Johns
. Hopkins Hospital, 119:299, 1966.
United States Department of Health, Education and Welfare. Task Force on Prescription Drugs: Final Report. Washington, D.C.: United States Government Printing Office, 1969,
35
Webster's Seventh New Collegiate Dictionary. New York: G. & C. Merriam Company, 1963, p. 678.
Weed, L. I. "Medical Records that Guide and Teach." New England Journal of Medicine, 278:593-600, 602-637, 1968.