Embed Size (px)
Citation preview
A COOL WORLD DEF IN ING THE ENERGY CONUNDRUM OF COOL ING FOR ALL
Toby Peters is the Professor in Cold Economy at the University of Birmingham and a Fellow of the University’s Institute for Global Innovation. He is also a
Senior Research Fellow in Transformational Innovation for Sustainability at Heriot-Watt University. He is one of the inventors of Liquid Air Energy Storage
(co-Founder of both Highview Power and Dearman Engine Company) and the architect of the “Cold Economy”. He has created and leads much of the
new system-level approaches and research around delivering environmentally and economically sustainable cooling and power in both transport and the
built environment, and the role “clean cooling” has to play in emerging market transformation, including sustainably addressing post-harvest food loss in
developing economies.
Birmingham Energy Institute – University of Birmingham
The Birmingham Energy Institute is the focal point for the University and its national and international partners to create change in the way we deliver,
consume and think about energy. The Institute harnesses expertise from the fundamental sciences and engineering through to business and economics to
deliver co-ordinated research, education and the development of global partnerships. The Midlands region is renowned for its ability to drive technology
revolution and provide a nationally leading manufacturing base. It is the home of pioneers such as Watt, Boulton and Priestly, and the internationally
recognised companies of Rolls-Royce and Jaguar Land Rover. The City of Birmingham is setting the green low carbon agenda nationally. Birmingham City
Council’s Green Commission launched a Vision Statement with an aim of building a leading green city and reducing CO2 emissions by 60% by 2027
against a 1990 baseline. The UK Government is committed to facilitating a cost-effective approach to reducing the UK’s emissions by at least 80% of
1990 levels by 2050. The Birmingham Energy Institute is working with these stakeholders to realise this transition.
Institute for Global Innovation – University of Birmingham
The Institute for Global Innovation (IGI) aims to inspire, support and deliver world-leading, multi- and inter-disciplinary that seeks to address some of the
world’s most pressing challenges, affecting humanity at a global level. Their research themes revolve around the factors that challenge, and sometimes
threaten, the sustainability and resilience of individuals, communities, societies and countries. These themes include resilient cities, water challenges in a
changing world, clean cooling, pollution solutions, antimicrobial resistance, ageing and frailty, gender inequality and artificial intelligence. Their scholars
seek, not only to understand these problems, but develop and implement innovative and often disruptive solutions, made possible by their holistic inter-
disciplinary approaches.
Flexible Power Systems
Led by Michael Ayres, Flexible Power Systems is a group of cleantech entrepreneurs with experience of power, transport, energy storage and thermal
technologies. They apply technology and systems thinking to industrial energy challenges to achieve sustainability and operational goals in the most cost-
effective way possible.
EXTERNAL REVIEW
With our sincere thanks to Professor Kostadin Fikiin, R&D Project Manager, Technical University of Sofia (Bulgaria); Academician, International Academy
of Refrigeration; Executive Committee, International Institute of Refrigeration (IIR); Past Vice-President of IIR Commission D1 ‘Refrigerated Storage’;
Chairman, EHEDG Working Group ‘Food Refrigeration Equipment’; Academic Mirror Group, coolingEU; European Technology Platform ‘Renewable
Heating and Cooling’; Dr Tim Fox, Royal Academy of Engineering Visiting Professor in Clean Energy and Public Engagement at Exeter University, and
Chair, IMechE Process Industries Division Board, and Katharina Arndt, GIZ Proklima.
CONTRIBUTORS
The United Nations’ (UN) Sustainable Development Goals laid down a
new challenge – economic and social development and the environment
must live together; you can no longer have one at the expense of the
other. Rather, our aim has to be a world where everyone can live well and
within the sustainable limits of our planet; cold sits at the nexus of this
challenge.
Effective cooling is essential to preserve food and medicine. It underpins
industry and economic growth, is key to sustainable urbanisation as well
as providing a ladder out of rural poverty. With significant areas of the
world projected to experience temperature rises that place them beyond
those which humans can survive, cooling will increasingly make much of
the world bearable – or even safe – to live in.
Yet the growth of artificial cooling will create massive demand for energy
and, unless we can reduce our need for cooling and roll out solutions
for clean and sustainable cooling provision, this will cause high levels of
CO2 and pollution. The world must not solve a social crisis by creating
an environmental catastrophe; we need to ensure access to affordable
Cooling for All (C4A) with minimum environmental impact and maximum
efficient use of natural and waste resources.
We are seeing the development of more efficient cooling technologies.
However, as our analysis shows, while essential, these alone will not be
enough to achieve sustainable Cooling for All in the face of booming
global demand.
We need to explore new outcome and needs-driven, integrated, system-
level approaches that re-imagine the way we use and deliver cooling. In so
doing we need to understand the portfolio of cooling needs, the size and
location of the multiple thermal, waste and ‘wrong-time’ energy resources
available. We then need to identify the novel energy vectors, thermal
stores and cooling technologies appropriate for the societal, climate
and infrastructure context. In short, what we call the Cold Economy:
transitioning from technology to system.
Meeting the challenge will also need the policies, social, business and
financial models and skills that will enable new fit-for-market approaches
to be adopted. To ensure impact, lasting legacy and scalability, sustainable
solutions must deliver socio-economic development and unlock growth;
must be attractive politically, socially and financially, and the technologies
must underpin investor confidence that they are reliable and economically
sustainable. We must also consider the unintended consequences; other
parts of the socio-economic and environmental systems will likely shift as
a consequence of cooling – we need as best as possible to plan for and
mitigate both anticipated and currently unforeseen negative impacts as
they emerge.
Cooling is finally coming in from the cold. After many years on the side
lines of the energy debate, the importance of cooling to modern ways of
living for all, but also the damage it causes to the environment and our
health, is being recognised. And so it should be sustainable, affordable
artificial cooling with minimal global warming or environmental impact
is nothing less than critical to societal, environmental and economic
sustainability worldwide.
As we look to our energy strategies post fossil-fuels, both built
environment and transport, we have a once-in-a-lifetime opportunity to
build resilient, future proofed solutions. The challenge now is how to
embed a system-led approach to our cooling demands, better harnessing
a portfolio of energy resources and adopting efficient clean novel
technologies quickly enough to avoid locking-in cooling energy demands
and emissions for years or decades. In order to achieve this, we need to
think thermally. Stop asking ourselves ‘how much electricity do we need to
generate?’ and start asking ‘what is the service we require, and how can
we provide it in the most energy resourceful and least damaging way?’.
Professor Toby Peters
Professor in Cold Economy
Fellow of the Institute for Global Innovation
FOREWORD
The Cold Economy – ‘thinking thermally’
The Cold Economy is the development of cohesive and integrated needs-driven,
system-level strategies to meet Cooling for All sustainably, while supporting
safe and healthy living and economic growth. This involves understanding the
multiple cooling needs, and the size and location of the free, waste and wrong-
time energy resources and defining the right mix of novel energy vectors, thermal
stores, efficient, clean cooling technologies as well as the novel business models
and policy interventions to optimally integrate those resources through self-
organising systems.

3A Cool World – Defining the Energy Conundrum of Cooling for All2 A Cool World – Defining the Energy Conundrum of Cooling for All
3 INTRODUCTION
4 SUMMARY FINDINGS
5 KEY CONCLUSIONS
6-7 RECOMMENDATIONS
8-9 COOLING AND THE UN ‘SUSTAINABLE DEVELOPMENT GOALS’
10-13 METHODOLOGY
14-16 DEFINING DEMAND FOR COOLING
17 A COOLING FOR ALL SCENARIO
18-22 ENERGY AND EMISSIONS IMPLICATIONS
23-24 IMPLICATIONS FOR RENEWABLES
25-29 RECOMMENDATIONS
30 NEXT STEPS
31-33 APPENDIX 1 – ACCELERATED TECH PROGRESS SCENARIOS
TECHNOLOGY IMPROVEMENTS
CONTENTS
There is not currently a comprehensive understanding of the size of the future global cooling demand, let alone its implications on
energy systems as we transition to renewables. This piece of work sets out to provide, for the first time, an initial indication of the
scale of the energy implications of Cooling for All. It does not deliver the detailed intervention strategies, nor granular, market by
market bottom-up numbers; it does though provide an evidence-based indication of the size of the challenge and a framework and
steps for more detailed analysis and an intervention roadmap.
While we have recognised sources for our data (GCI, IEA, IIR etc), for a Cooling for All scenario, we have necessarily had to make
several assumptions and projections - and account for regional variances to the extent possible. Although ultimately the actual
detail of the numbers in a Cooling for All scenario (penetration levels, energy consumption, solution choices, etc) might have some
statistical dispersion, given the quantum of the gap between current demand projections and those including Cooling for All, the
conclusions are, however, highly likely to be correct.
With global populations increasing, rapid changes
in demographics, expanding urbanisation and
climate change impacts leading to more frequent
heatwaves and seasonal temperatures rises,
there is no question that we will demand far more
cooling in the decades ahead. Forecasts suggest
that the Asia-Pacific middle class will nearly
triple by 2030 to more than 3 billion people, i.e.
one-third of the global total population1. Their
increased affluence, changing lifestyles and
aspirations will require ever more cooling: air
conditioning for comfort; cold chains to support
food preference changes and better medical care;
and data centre cooling for the digital economy.
By 2050, according to the Green Cooling
Initiative (GCI), led by GIZ Proklima, there could
be more than 9.5 billion cooling appliances
worldwide – more than 2.5 times today’s ~3.6
billion. Cooling is however energy intensive. We
are seeing the development of more efficient
cooling technologies. But even allowing for
these and other more aggressive energy
mitigation strategies, the cooling sector will, on
current trajectory, increase its overall energy
consumption2 by 90% by 2050 to ~7,500TWh
annually compared with 2018 levels (3,900TWh);
and potentially 9,500TWh if we do not achieve
the aggressive energy efficiency improvements3.
This however is only half the picture
Under these projections much of the world would
still only have low penetration levels of cooling:
both air conditioning and refrigeration and cold
chain. We will still have high levels of food loss; a
significant percentage of the world’s population
in the hottest regions of the world without space
cooling, and medicines and vaccines spoiled in
the supply chain.
If we are to deliver on the UN’s Sustainable
Development Goals societal, health and economic
targets, Cooling for All will be essential. But what
should Cooling for All look like and what would
it mean for our renewable energy systems and
overall climate change mitigation targets? Can
we solve both the challenge of ensuring equitable
access to cooling for all humans and mitigate its
future, as well as current – and already significant
- energy and environmental impacts without
radical intervention?
As a first step towards answering this question,
we need to better understand the size of the
problem. In order to meet our Carbon budget
targets for the IEA 2°C Scenario (2DS)4, we need
to know the carbon and energy budget available
to work within whilst delivering universal access
to cooling. We equally need to understand what
we mean by Cooling for All and determine its
energy costs.
Based on these circumstances and on current
refrigerant phase down via the Kigali Amendment
and current technology efficiency projections,
what could be the size of the gap between the
energy requirements (and emissions) of achieving
Cooling for All and the budgets implied by the
IEA 2DS.
In short, can we meet the challenge with current
cooling technologies, energy efficiency and new
renewable energy generation capacity; or do we
need a new approach?
INTRODUCTION
1 www.brookings.edu/wp-content/uploads/2017/02/global_20170228_global-middle-class.pdf2 By 2050, global energy consumption from all cooling sectors is predicted to reach 9,500 TWhs annually under the GCI demand forecast (current tech progress); and 7,500 TWhs annually under the GCI demand forecast (accelerated tech progress). See Section 1 for demand forecast descriptions.
3 TWh – terawatt hours, i.e. 1,000 gigawatts hours or 1 trillion watt hours.4 The 2°C Scenario (2DS) is the main focus of IEA’s Energy Technology Perspectives which lays out an energy system deployment pathway and an emissions trajectory consistent with at least a 50% chance of limiting the average global temperature increase to 2°C. The 2°C Scenario (2DS) limits the total remaining cumulative energy-related CO2 emissions between 2015 and 2100 to 1 000 GTCO2; it reduces CO2 emissions (including emissions from fuel combustion and process and feedstock emissions in industry) by almost 60% by 2050 (compared with 2013).
5A Cool World – Defining the Energy Conundrum of Cooling for All4 A Cool World – Defining the Energy Conundrum of Cooling for All
Total (CO2e) emissions from the cooling
sectors amount to approx. 4GT5
of CO2e emissions in 2018 – equivalent to
11.8% of the world’s direct CO2 emissions
from the power and industrial sectors in the IEA
Reference Scenario.
According to United Nations Environment
Programme (UNEP), more than 80% of the
global impact of RACHP (Refrigeration, Air
Conditioning and Heat Pumps) systems is
associated with the indirect emissions of
electricity generation to drive the cooling
appliances (UNEP TEAP, 2017a).
Green Cooling Initiative (GCI) projections
show rapid growth in the amount of cooling
equipment deployed globally, growing from
3.6bn pieces of equipment to 9.5bn by 2050.
This has significant implications for energy
consumption from the sector which will grow
under the GCI demand forecast (current
technology progress) to 9,500 TWh by 2050.
This will exceed the IEA’s implied “energy
budget” for cooling in its 2°C Scenario (2DS)
by more than 50% (6,300 TWh).
If an aggressive range of technology and
operational efficiency improvements can
be implemented (GCI demand forecast –
accelerated technology progress), then an
additional 21% reduction in total sector energy
consumption could be achieved by 2050 over
and above the current technology improvement
trajectory (GCI demand forecast – current
technology progress). However, this would still
leave consumption from the sector above the
IEA 2DS implied energy budget for cooling
(see Figures 1 and 2).
However, Green Cooling Initiative (GCI)
projections of cooling equipment uptake also
still result in large portions of the world not
having access to space cooling, refrigeration or
cold chain even in 2050.
As an indication of the impact of widespread
global access to cooling – Cooling for All, a
hypothetical scenario is developed whereby
refrigeration equipment penetrations globally
converge by 2050 with those experienced in
the developed world today (USA as the proxy),
and air conditioning is made available to all
populations experiencing more than 2000
Cooling Degree Days per year6. Without action
beyond current technology progress equipment
efficiency gains, cooling related energy
consumption could result in 19,600 TWh of
energy consumption per year (Cooling for All
demand forecast – current tech progress7).
Even with the accelerated technology progress
projections delivering more aggressive energy
performance improvements, the energy
requirement still equates to 15,500 TWh which
is 2.46 times the 6,300 TWh maximum sector
allocation envisaged by the IEA 2DS (Figure 1).
To achieve the required amount of cooling with
the energy available requires us to double the
efficiency of our cooling devices on average, in
addition to the technology progress proposed
currently.
Alternatively to “green” this volume of electricity
would consume more than 50% of the
projected total renewables capacity under
the IEA 2°C Scenario and 80% of the IEA
Reference Technology Scenario projected
renewables capacity8 by 2050. This increases
to 101% in the event we do not achieve
accelerated technology progress.
The Kigali amendment to the Montreal Protocol
is crucial to reduce the sector’s environmental
footprint, but if we are to plan for a Cooling
for All goal, further accelerating the uptake
of very low-GWP9 and natural refrigerants
may be necessary in order to meet the Kigali
objectives.
SUMMARY F INDINGS
5 GT – GigaTonnes (1 billion tonnes).6 A cooling degree day (CDD) expresses the demand for cooling a building. It is the number of degrees that a day’s average temperature is above 21° C in this instance multiplied by the number of days per year. China experiences 2,030 cooling-degree days per year, whereas the United Kingdom experiences 135. The UAE experiences over 10,000 cooling degree-days per year.
7 See demand forecast descriptions in Section 1. 8 Total renewables capacity reaches 19,359 TWh/year by 2050 in this scenario. Renewables in this analysis are considered as the combination of all biomass, hydro (excl. pumped storage), geothermal, wind (on- and off-shore), solar (PV and CSP) and ocean.
9 Global Warming Potential.
2,000
4,000
6,000
8,000
10,000
12,000
14,000
16,000
18,000
20,000
All cooling sectors global annual energy consumption by scenario vs. IEA cooling sector energy allocation [TWh] GCI current tech
progress (GCI CT)
GCI acceleratedtech progress (GCIAT)
IEA 2DS coolingenergy allocation
IEA B2DS coolingenergy allocation
C4A current techprogress (C4A CT)
C4A acceleratedtech progress(C4A AT)
0
2
4
6
8
10
12
14
16
18
20
All cooling sectors global annual CO2e emissions byscenario vs. IEA cooling sector CO2e allocation [GTCO2e] GCI current tech
progress (GCI CT)
GCI acceleratedtech progress (GCIAT)
IEA 2DS coolingenergy allocation
IEA B2DS coolingenergy allocation
C4A current techprogress (C4A CT)
C4A acceleratedtech progress(C4A AT)
Figure 1 Figure 2
Access to cooling is essential for meeting
our social and economic goals but equally
unmanaged growth in cooling represents one
of the largest end user threats to achieving our
climate goals for CO2 emissions.
While the Kigali Amendment to the Montreal
Protocol has established a clear programme for
the phase down of the production and use of
high GWP refrigerants, we need a step change
reduction in primary energy consumption for
cooling.
There is not a comprehensive (all sectors
– buildings, food, health, transport, data,
industry and commercial) understanding
of the size of the cooling demand either
today or in the future, nor of the implications
this has on energy systems /new build
electricity generation requirements and the
environment (climate change and pollution).
There is therefore also currently no cohesive
and integrated strategy to either mitigate
or meet cooling needs in the most efficient,
economically and environmentally sustainable
and resilient way, while sustaining economic
growth and taking into account differing
cooling needs in different regions of the world.
If cooling provision is to be sustainable, we
need not only more efficient air-conditioners
and fridges, but also a fundamental overhaul of
the way cooling is provided. What is required
is a new needs-driven, system-level approach,
first to mitigate demand and second to
understand (i) the multiple cooling needs,
(ii) the size and location of the thermal,
waste and wrong-time energy resources and
(iii) define the right mix of the novel energy
vectors, thermal stores, and efficient
technologies to integrate those resources with
service needs optimally.
Such a complex approach necessitates the
integrated development of devices, systems
and the skilled people for deployment in key
market sector environments. It equally may
require new value and business models, as well
as end user engagement.
We are currently profligate with cooling. The
start point for intervention is to understand
the real needs for cooling, to help facilitate
the introduction of socio-technical systems
that are fit for purpose.
Bridging the critical gap in the clean cold
innovation landscape requires
- Needs assessment taking into account
region and country specific requirements
and financing opportunities;
- Bringing together technology and system
innovations into a cross-sector systems
approach;
- Creating the necessary results-driven
economic and impact models;
- The right policy and financing environments;
- Developing the skills and workforce to design,
install and maintain appliances;
- Bringing the key intervention delivery partners
into a joined-up strategy.
It is important to recognise that introducing
more affordable and readily available means of
cooling is not just a matter of adding cooling to
the status quo; it is about introducing a major
shift to dynamic socio-technical systems. In
response, other parts of the system will react
and adapt as a consequence, with varying
degrees of predictability. We need to identify
potential unintended negative social, ecological
or economic consequences and engage to
mitigate these as initiatives and deployments
take place.
We urgently need access to clean cooling10
for all. In order to achieve this, we need to stop
asking ourselves ‘how much electricity do we
need to generate?’ and start asking ‘what is the
service we require, and how can we provide it in
the least damaging way? ’.
KEY CONCLUSIONS
10 Clean cooling: Meeting our cooling needs efficiently and sustainably within our climate change, natural resource and clean air targets. Clean cooling necessarily must be affordable and accessible to all to deliver the societal, economic and health goals. It likely starts with mitigating demand.
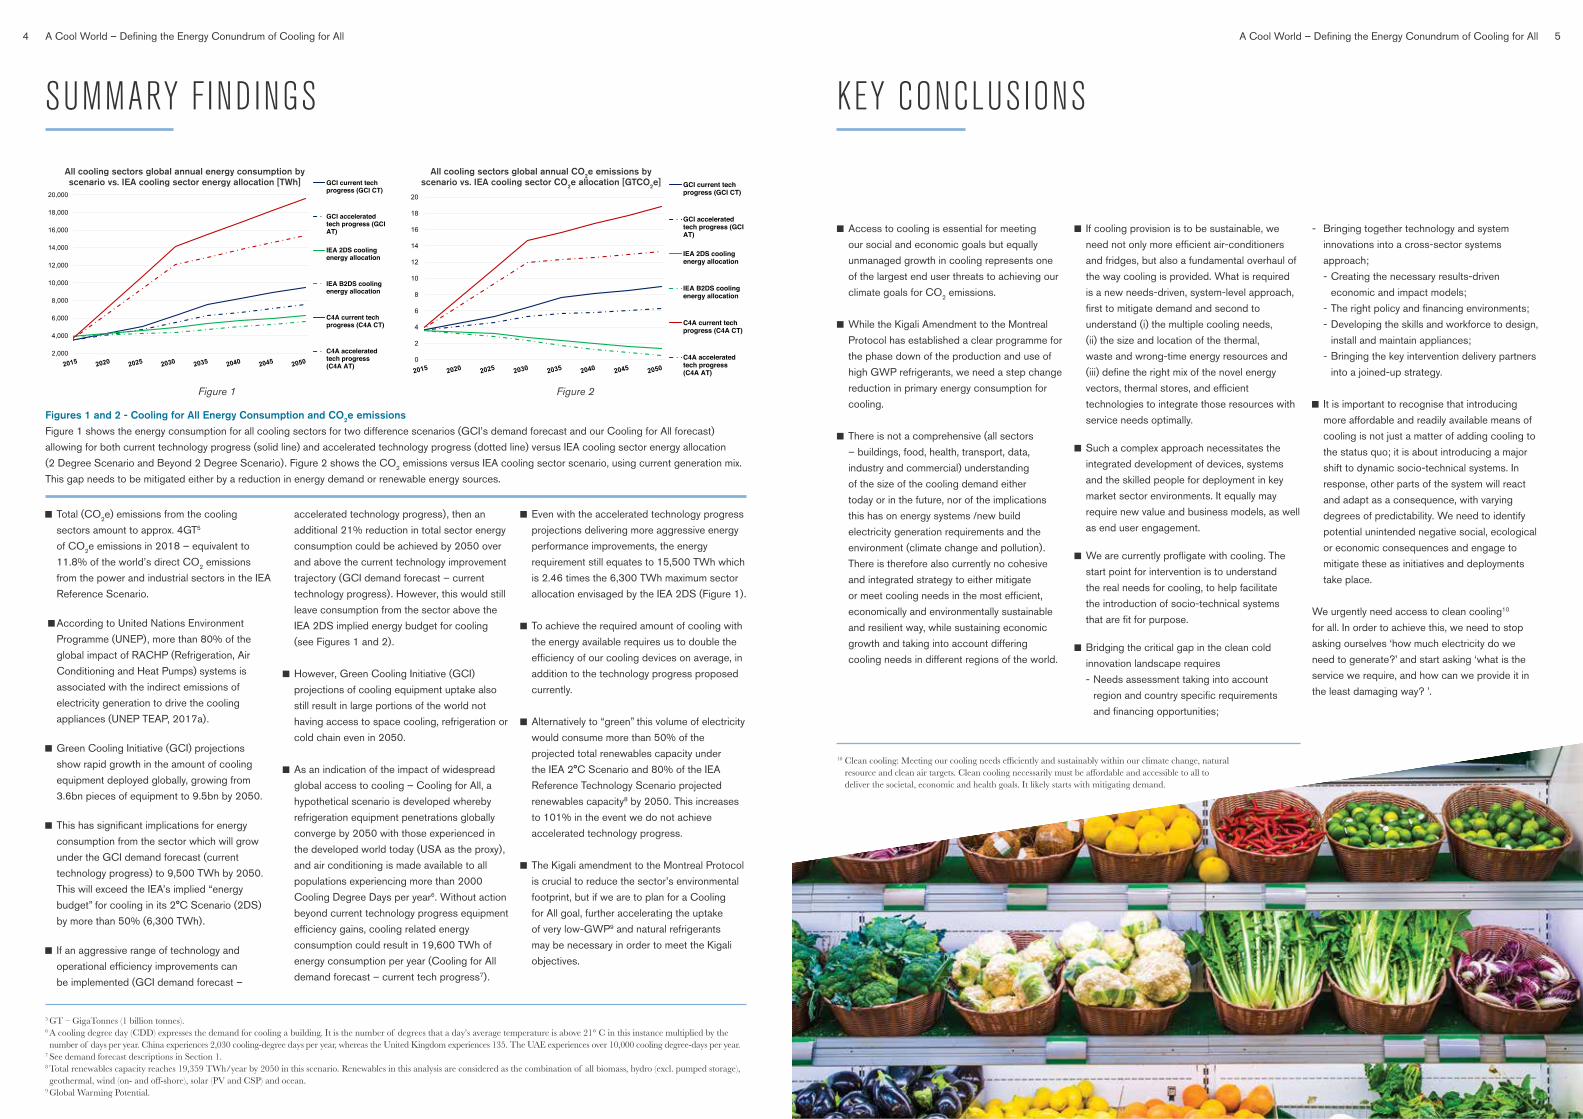
Figures 1 and 2 - Cooling for All Energy Consumption and CO2e emissions
Figure 1 shows the energy consumption for all cooling sectors for two difference scenarios (GCI’s demand forecast and our Cooling for All forecast)
allowing for both current technology progress (solid line) and accelerated technology progress (dotted line) versus IEA cooling sector energy allocation
(2 Degree Scenario and Beyond 2 Degree Scenario). Figure 2 shows the CO2 emissions versus IEA cooling sector scenario, using current generation mix.
This gap needs to be mitigated either by a reduction in energy demand or renewable energy sources.
All cooling sectors global annual energy consumption by scenario vs. IEA cooling sector energy allocation [TWh]
All cooling sectors global annual CO2e emissions by scenario vs. IEA cooling sector CO2e allocation [GTCO2e]

6 A Cool World – Defining the Energy Conundrum of Cooling for All 7A Cool World – Defining the Energy Conundrum of Cooling for All
Based on the analysis
(i) Current energy projections do not consider a
Cooling for All scenario and therefore either
we meet the UN SDGs or the Paris Climate
Targets but not both.
(ii) If we are to meet both the UN SDGs and the
Paris Climate Targets, relying on technology
efficiency and greening electricity is not
sufficient on its own.
(iii) Solutions – climate, policy, social, economics,
culture, rural or urban, as well as the localised
energy resources - need to be “fit for market”,
not one size fits all.
Recommendations :
1. Awareness - meeting cooling demand
sustainably and affordably creates a direct
intersect between three internationally agreed
goals for the first time: the Paris Agreement;
the Sustainable Development Goals; and the
Montreal Protocol’s Kigali Amendment. Yet
cooling until recently has not been on the
agenda and there is still limited recognition of
the critical role of access to clean cooling in
our energy strategies.
2. More accurately defining cooling needs and
targets to meet the Sustainable Development
Goals – this consists of updating estimates of
demand in a regional context and needs-driven
way that does not pre-suppose equipment
or technology choices. Furthermore, the
same should be used to set specific goals for
sustainably reducing the gap by country, sector
and timeline11.
3. A quantitative intervention roadmap and toolkit –
this should identify the scope for technical and
operational improvements and then the step-
change system interventions that are likely to be
required (through a ladder of opportunities) as
well as the commercial, policy, education/skills
and research actions needed to deliver these.
In addition to providing a guide to the course
of action to be taken, the roadmap, combined
with the Cooling Services Model can also be
used as a framework to test the implications of
action or inaction in certain areas.
4. Cold Community Networks – design of the
integrated system level (built environment,
logistics and transport) approach to cooling
- multi-sector, multi-technology, multi-energy
source integrated solutions to cooling provision
to deliver – and balance - maximum economic,
environmental and societal impact.
5. Cooling Services Methodology and Model -
delivery of secure, affordable low-carbon, low-
pollution optimised integrated cooling to many
thousands of rural and urban communities is
not about one size fits all. It requires the ability
to make system design and technology choices
based on the cooling and service demands and
energy needs of the local requirements, as well
as an understanding of the specific existing,
free, waste and natural energy resources, and
the local economic context, cultures, working
practices, etc. Comprehensive clean cooling
methodologies and models are required so that
communities can design ‘fit for market’ - including
‘fit for energy source’ - and ‘fit for finance’ cooling
through simulation before capital intensive
investment in on-the-ground deployment. This will
enable communities to optimise the system for
their cooling needs including consider resource
pooling and broader energy service, and assess
the economic, societal and environmental impact.
In so doing, it can support investment and
financing proposals.
6. Living Labs – an ecosystem for trialling and
developing strategy, revenue and financing and
technology mixes at scale and demonstrating
impact, providing a launch-pad for accelerated
deployment. Living Labs would test and
demonstrate not only technologies but also
the mitigation, business, governance and
funding models. They can provide a network
of centres for dissemination and training. They
will also explore the indirect and potential
consequences – positive and negative.
The UN has set a target of achieving the
Sustainable Development Goals by 2030; i.e.
we have 12 years to deliver clean and affordable
cooling to all. Given the urgency of the challenge
and the multi-partner and multi-disciplinary
research and delivery mechanisms required, we
urge the establishment of a multi-disciplinary
Centre of Excellence for Clean Cooling (CEfCC)
to lead this work by bringing together the global
expertise to research and develop the step-
change pathways (culture and social, technology,
policy, business models, financing) for achieving
(i) cheapest cost (whole of life), (ii) greatest
energy system resilience and (iii) lowest carbon
emissions while (iv) meeting social and economic
cooling needs.
RECOMMENDATIONS
11 GIZ Proklima has already started this process in various partner countries via their cooling sector inventories.
WHAT NEEDS TO HAPPEN TO DELIVER COOLING FOR ALL SUSTAINABLY?
Roadmap Delivery Accelerate
All-stakeholder EngagementEngage and drive collaboration across the main stakeholder groups (policy, customers, industry, developers and financiers).
Fund Innovation DevelopmentConnect research institutes, OEMs, VCs, policy makers and customers to collaborate on the delivery of high impact innovation.
Policies to Unlock Finance Create the market environment (policies and business models) to attract infrastructure investment to deliver Cooling for All.
Systems Level AnalysisAssess Cooling for All at the systems level - size of the challenge and alternative technologies, energy sources, business models and cross-in-dustry resource efficiency sharing mechanisms.
ProveEliminate the performance risk and demonstrate impact through live market testing and validation in Living Labs.
Skills Identify the skills gap (design through to installation and maintenance) and connect educational institutes, OEMs, policy makers and customers to collaborate on the delivery of accelerated solutions.
RoadmapCreate the Intervention roadmap (technology, policy, finance, etc) to deliver 70% reduction in electricity usage for cooling.
Scale-UpDesign manufacturing processes and engage industry to scale novel technologies; ideally using a global science, local delivery model.
Effective Knowledge TransferUse system level model, in-country living labs and manufacturing accelerator to roll out “fit for market” solutions across new geographies.
Unintended ConsequencesIdentify, plan for and mitigate potential unintended consequences.

9A Cool World – Defining the Energy Conundrum of Cooling for All8 A Cool World – Defining the Energy Conundrum of Cooling for All
The UN’s Sustainable Development Goals laid down a new challenge; economic and social development and the environment must live together; you can no longer have one at the expense of the other. Rather our aim has to be a world where everyone can live well and within the sustainable limits of our planet.
Cold sits at the nexus of this challenge and in fact a report published by the University of Birmingham Energy Institute in January 2017 was the first to point out that achieving all 17 of the Global Goals would depend to a greater or lesser extent on developing clean cooling technologies12 – and for many Goals, clean cold would be vital. But to date it has been largely ignored and as Sustainable Energy for All states: “Given that millions of people die every year from lack of cooling access, whether from food losses, damaged vaccines or severe heat impacts, this is a glaring omission”.
The need for cooling is universal but cooling means very different things to different groups of people.
In the developed world, it is about air-conditioned offices, hotel rooms and apartments; a fridge full of fresh food and convenience meals from all over the world; ice in our drinks. In Saudi Arabia, more than 70% of electricity is consumed for air conditioning and cooling13. The United States consumes more electricity for space cooling than the 1.1bn people in Africa for everything. In Europe more than 75% of our food goes through the cold chain at some point.
Subsistence farmers to informal urban (slum) dwellers equally have need for cooling but in very diverse and critical ways: extending the life of crops while trying to move them to market; ensuring access to basic vaccines; bearable or even just safe working and living environments.
Lack of access to cooling in many places has severe impacts
In developing markets, up to 50% of food can be lost post-harvest14.
● More than 1 billion people continue to live in extreme poverty; more than 75% of them reside in rural areas, primarily dependent on agricultural production. We cannot address rural poverty without cold chains connecting farmers to market.
● Equally 800M people globally are malnourished. Malnutrition is in fact the largest single contributor to disease in the world, according to the UN’s Standing Committee on Nutrition. More children die each year from malnutrition than from AIDS, malaria and tuberculosis combined.
● A 2015 World Health Organization report concluded that 600 million people – almost 1 in 10 worldwide – fall ill after eating contaminated food and 420,000 die every year.
Cold chains and food security are not just about having enough nutritious food to avoid hunger. They also allow farmers to earn more by maintaining the quality of their produce and selling it further afield, especially when this means they can reach more distant cities and major centres of consumption. However, they must be able to get it there in the same condition as one imported by air-freight from a highly developed global agri-business and cold chain. What’s more, the market connectivity afforded by a cold chain enables and incentivises farmers to raise their output because they will earn more from what they produce; whereas its absence means that any effort to increase yield will also cause higher wastage - so dousing the incentive.
The consequences are far beyond hunger, farmer poverty and inflated food prices. Post-harvest food loss occupies a land area almost twice the size of Australia, consumes 250km3 of water per year, three times the volume of Lake Geneva; and emits 3.3 billion tonnes of
CO2, making it the third biggest emitter after the US and China.
The World Health Organization estimates that nearly 25% of liquid vaccines are wasted each year primarily because of broken cold chains. An estimated 1.5 million people die each year from vaccine-preventable diseases.
Heatwaves already kill an estimated 12,000 people annually across the world. The World Health Organization forecasts that by 2050, deaths from heat waves could reach 260,000 annually unless governments (primarily cities) adapt to the threat. One study suggests that if climate change is not checked, the Gulf will suffer heatwaves beyond the limit of human survival by 2070. The study shows that the hottest days of today would by then be a near-daily occurrence.15
Clean cooling provides the rare opportunity to achieve three internationally agreed goals simultaneously: the Paris Climate Agreement; the Sustainable Development Goals; and the Kigali Amendment. In this way we can ensure that:
1. Global access to sustainable, affordable and resilient cooling is achieved to underpin health and deliver habitable, safe
housing and work places; reduce post-harvest food loss – thereby
protecting food volumes and quality, as well as facilitating efficient movement from farm to consumption centre, so as to
- Enhance economic wealth and security for farmers;
- Achieve nutritional security and deliver safe food to the wider population;
-Improve resource efficiency. meet essential demands for data (be it for
health centres, weather apps or trading platforms for farmers, or rural education and day to day communications)
reduce inequality.
2. The massive growth in demand for cooling is managed within the constraints of natural resources and local economies, as well as underpining, rather than undermining CO2, Climate Change mitigation and pollution
targets; Energy efficiency and resilience and Sustainable and affordable infrastructure.
COOLING AND THE UN ‘SUSTAINABLE DEVELOPMENT GOALS’
12 Clean Cold and the Global Goals: www.birmingham.ac.uk/Documents/college-eps/energy/Publications/Clean-Cold-and-the-Global-Goals.pdf13 www.tandfonline.com/doi/abs/10.1080/15567249.2016.1248874?journalCode=uesb2014 IMechE Global Food: Waste Not, Want Not. Institution of Mechanical Engineers; Westminster, London, UK: 2013.15 https://www.nature.com/articles/nclimate2833
Clean Cold Chain (Food)
The Cold Chain is an integrated, seamless
and resilient network of refrigerated and
temperature-controlled pack houses, cold
storage, distribution hubs and vehicles used
to maintain the safety, quality and quantity of
food, while moving it swiftly from farm gate to
consumption centre.
The cold chain enhances economic wealth,
cash flow and security for farmers and
improves food quality, safety and value to
the customer. We need to achieve this with
minimum environmental impact – through a
clean and efficient cold chain.
SUSTAINABLE DEVELOPMENT GOAL
EXAMPLES OF IMPACT OF COOLING
1. No Poverty
Cold chains enhance incomes for fishermen and farmers through improved pricing for produce and reduced food waste. Cooling has significant new employment demand from direct jobs around manufacture and maintenance to meet the massive increase in appliances to indirect jobs such as in food processing and preservation.
2. Zero Hunger
It is estimated that 1.3 bn tonnes of food is lost or wasted each year; approx 1/3 of of total food produced for human consumption. Refrigeration enhances food security through extending shelf-life of produce so that less is wasted. In addition, reduced waste increases incomes in farming and fishing communities and leads to more stable food prices.
3. Good Health and Well beingAccess to refrigeration and a robust medical cold chain leads to reduced vaccine and medicine spoilage.Access to refrigeration in the food cold chain reduces food waste and food poisoning.Air conditioning offers protection from temperature extremes.
4. Quality EducationAbility to work and thermal comfort are inter-related. Reducing the risk of malnutrition also positively impacts academic performance.
5. Gender Equality
Women make up almost half the agricultural workforce in Africa, and far more in some countries – around 70% in Kenya, Nigeria and Rwanda. If combined with policies to improve women farmers’ access to finance and resources, clean cold chains could benefit women preferentially and help narrow the gender gap.
6. Clean Water and Sanitation Prevented food spoilage saves substantial amounts of water.
7. Affordable and Clean Energy
Refrigeration and air conditioning are responsible for over 17% of the worldwide electricity consumption. Global air conditioning energy demand, driven overwhelmingly by cities in developing countries such as China, India, Indonesia, and Brazil, is forecast to rise 33-fold by 2100 to more than 10,000 TWh, roughly half the total electricity generated worldwide in 2010.
8. Decent Work and Economic Growth
Agriculture and fishing are very significant employers. Enhancing the efficiency of these industries by reducing waste, as well as increasing market connectivity will improve profitability. As an example, in India, the GOI has identified cold chains as a key pillar of doubling farmers’ incomes. Productivity and thermal comfort are interrelated and by 2050, heat-related work-hour losses in some countries are projected to be as high as 12% — worth billions of US dollars — in the worst-effected regions.
9. Industry Innovation and Infrastructure
All forms of cooling will require substantial infrastructure investments to be delivered and considerable innovation is required to enhance efficiencies. With the industry projected to double in size, there is an opportunity to create new manufacturing opportunities including in-country.
10 Reduce Inequalities
Clean cold technologies reduce inequality both within and between countries. Looking at income inequality, clean cold chains reduce poverty by lowering food prices and raising farmers’ income.Better nutrition and thermal comfort would improve the educational outcomes of the most disadvantaged in society. In terms of gender inequality, cold chains combined with support from policy will improve access of agricultural resources to female farmers which reduces the gender gap by providing female farmers with access higher value exports.
11. Sustainable Cities and Communities
Sustainable cooling and design for buildings and transport reduce energy demand and heat island effect.Food security in cities where very little farming land is available is critically dependent on a cold chain.
12. Responsible Consumption and Production
Food and vaccine loss are reduced through proper access to refrigeration and cold chains.
13. Climate Action Cooling uses substantial quantities of energy and causes direct emissions from refrigerant leakage.
14. Life Below Water Wastage of marine products before reaching market increases pressure on fish stocks.
15. Life on Land Reducing food wastage eases the main driver of deforestation and land degradation.
16. Peace and JusticeClean cold technologies indirectly help to maintain peace by suppressing potential sources of conflict, e.g. rising food prices (Arab Spring) and urban migration due to rural poverty.
17. Partnership for GoalsIn most developing countries, cooling infrastructure is currently rudimentary or non-existent.There is a brief opportunity to create partnerships through which developing countries leapfrog direct to clean cold, thereby wmaking an important contribution to every one of the Global Goals.
11A Cool World – Defining the Energy Conundrum of Cooling for All10 A Cool World – Defining the Energy Conundrum of Cooling for All
METHODOLOGY
The study relies on combining existing data
sets to explore access to cooling alongside the
associated energy and carbon implications.
SOURCES OF DATA
Green Cooling Initiative Data Set
The first data set is that produced by Green
Cooling Initiative (GCI) – a network of companies,
non-governmental organisations, universities and
governmental organisations. The data has been
collected by GIZ under the Proklima programme
on behalf of the German Federal Ministry for
Economic Cooperation and Development and
the German Federal Ministry of the Environment,
Nature Conservation and Nuclear Safety.
The data set is based on a combination of bottom
up and inferred estimations of the current cooling
equipment parc16 in 193 countries across seven
major equipment families. Projections are then
established based on population, GDP growth,
urbanization, climate mitigation and electricity
access parameters that indicate a future scenario
for equipment penetrations.
By assuming a number of representative
equipment types within these sectors, estimates
of direct and indirect impacts have been made:
Direct impacts – based on estimated
refrigerant charge and leakage rates and
estimated emissions during manufacture and
disposal of the equipment.
Indirect impacts – based on energy consumed
during use (a function of cooling energy
demand, equipment performance and carbon
intensity of fuel used).
The data set was developed in 2012 and updated
in 2016 (up to 2050), and is still more expansive
in terms of its attempt to cover the entire cooling
sector than anything subsequently developed.
IEA Data Set
The IEA dataset is taken from the most recent
Energy Technology Perspectives 2017
publication (ETP2017). The ETP modelling
approach incorporates models of global energy
demand across industry, buildings and transport.
The demand models are based on a combination
of economic, policy and process data that feeds
in to sectoral sub-models that further breakdown
demand.
Space cooling, transport and overall appliance
energy consumption are modelled within the data;
from these figures indicative cooling budgets
can be implied. The energy supply part of the
model incorporates fossil fuel, renewable and
nuclear resources as well as energy conversion
processes to meet the specific energy demands.
Both supply and demand elements of the model
are capable of incorporating varying production
and consumption technology choices.
The annual ETP study utilises a scenario-based
approach to show the current position and what
would have to change to meet climate change
mitigation targets. Three scenarios are modelled:
Reference Technology Scenario (RTS) –
is based on today’s commitments to limit
emissions and improve energy efficiency
and then an extension of current trends. This
already represents a substantial departure from
business as usual (BAU) and requires further
major shifts in policy and technology in the
period to 2060. These efforts would result in
an average increase of ~2.7°C by 2100 and an
ongoing upwards trajectory.
2°C Scenario (2DS) – is a back-cast pathway
to a CO2 trajectory with 50% chance of
limiting temperature increase to 2°C by 2100
by using currently available technologies. As
an indication of its ambition level, it requires
a 70% decrease in emissions from energy
production by 2060 and an ongoing pathway
to carbon neutrality by 2100.
Beyond 2°C Scenario (B2DS) – is intended
as an indication of how far beyond 2°C
available and in development technologies
could take us. All improvements and
deployment rates are pushed to maximum
feasible limits to get the energy system to net
zero by 2060 and then push it into negative
emissions through Carbon Capture and
Storage (CCS) and bioenergy measures
beyond this point. This scenario gives a
50% chance of limiting average temperature
increase to 1.75°C.
16 Parc: Collective number of units in a given region.
Other data sets IEA – The Future of Cooling
The International Energy Agency recently
published a report focusing on the space cooling
sector which describes the global space cooling
markets for air-conditioners and chillers including
fans and de-humidifiers. It estimates the global
stock of air-conditioning appliances (both
commercial and residential) to be 1.62 billion
units by the end of 2016 – higher than the GCI
stock of 840 million units at the same time. The
IEA further expects the global stock to continue
to grow rapidly to reach a total of approximately 5
billion units by 205017. This is against 3.7 billion
units in the GCI projections.
It is also worth noting that the difference in
estimates is lower when it comes to total energy
consumed by the space cooling sector – an
estimated 2,000 TWh in 2016 for the IEA vs.
1,550 TWh in 2016 for GCI (a 22.5% difference
compared to the IEA estimate). While the IEA
expects space cooling energy consumption to
grow to 6,200 TWh in 2050 (in the absence
of efficiency measures), GCI predicts between
4,200 TWh (accelerated tech progress, see
below) and 5,500 TWh (current tech progress)
for the sector by 205018.
There are several reasons for the difference in
GCI and IEA scenarios:
They cover different sectors – GCI focuses
on air conditioning based space cooling and
refrigeration equipment whereas the IEA figures
include fans and dehumidifiers alongside air
conditioning equipment.
The GCI and IEA projection methodologies
are different for the demand projections and
were conducted from different base years; as
a result, equipment deployment volumes differ
between the two projections.
GCI and IEA have different projections on
the likely/feasible penetration of improved
efficiency equipment for their respective
mitigation scenarios; this impacts the expected
energy consumption (and indirect emissions
estimates).
However, neither the IEA nor the GCI figures
attempt to capture universal access to cooling
in their projections. Both models are based on
GDP growth in effect determining affordability of
accessing cooling equipment in combination with
other measures like climate, electricity access and
existing equipment stocks etc.
JRAIA – The Japan Refrigeration and Air-Conditioning Industry Association
The JRAIA regularly collects and compiles market
data based on market demand surveys reported
by the member companies of the JRAIA’s Air
Conditioning Global Committee, and projects the
estimated demand in each major market. In its
April 2017 report on the World Air Conditioner
Demand by Region it reports global sales of AC
units across all sectors of 102 million units –
compared to an estimated 89 million unit sales in
the GCI database (an 11% difference).
JRAIA does not detail equipment stocks. Again, this
is a case of global demand in 2018 outstripping
the rate projected by GCI back in 2012.
Lawrence Berkeley National Laboratory
Following the Kigali amendment to the Montreal
protocol, the “Opportunities for Simultaneous
Efficiency Improvement and Refrigerant Transition
in Air Conditioning” report aimed to provide
an initial sense of the opportunities to improve
efficiency and transition to low Global Warming
Potential (GWP) refrigerants by reviewing
the Hydrochlorofluorocarbons (HCFC) and
Hydrofluorocarbons (HFC) regulatory framework
and energy efficiency standards and labelling
programs. The AC unit market data it builds upon
originates from the JRAIA publications described
above.
17 Both residential and commercial ACs, excluding fans & dehumidifiers. 18 For consistency we have used the GCI database for our analysis, but clearly were we to substitute the
IEA air conditioning assumptions the impact on total energy demand would be worse.

12 A Cool World – Defining the Energy Conundrum of Cooling for All 13A Cool World – Defining the Energy Conundrum of Cooling for All
Scenario definition. This document explores four scenarios, defined below.
1. GCI DEMAND FORECAST – CURRENT TECH PROGRESS (GCI CT): combines the GCI equipment stock forecast with the assumption that
technical innovation in the sector (as a whole) continues to follow its current pace of technical development and efficiency improvements, either in
terms of low GWP refrigerant adoption or equipment efficiency. This scenario leads to unit equipment energy use per cooling appliance reducing
(on average, between 2018 and 2050) by 15% in space cooling and 38% in stationary refrigeration (no reduction in mobile cooling equipment
energy use). 22
2. GCI DEMAND FORECAST – ACCELERATED TECH (GCI AT)23: equipment stock forecast identical to GCI CT; however technology innovation
is accelerated to deliver a range of device energy efficiency improvement steps via technology and maintenance enhancements alongside
replacement of synthetic refrigerants with very low to zero GWP refrigerants. The accelerated tech progress scenario is entirely focused on
evaluating the impacts (for both the GCI and C4A equipment stock projections) of introducing additional, more aggressive, mitigation options to
the current tech progress scenario – including switching to very low-GWP refrigerants, leakage reductions, improvements in equipment energy
efficiency, opting for more efficient system types (i.e. district cooling in-lieu of unitary AC units), etc. The accelerated tech progress scenario
disregards barriers to adoption that could limit take up of efficiency improvements. The GCI AT projections translate to unit equipment energy
efficiency improving on average, between 2018 and 2050 by 34% in space cooling, 49% in stationary refrigeration and 14% in mobile cooling.
3. C4A DEMAND FORECAST – CURRENT TECH PROGRESS (C4A CT): assumes that equipment stocks in the sector (as a whole) grow faster
than in the GCI scenarios – with refrigeration equipment penetrations globally converging with those experienced today in the United States by
2050 and air conditioning being made available to all households experiencing more than 2000 Cooling Degree Days per year. On the technology
progress side, technical innovation in the sector (as a whole) is assumed to continue following its current pace.
4. C4A DEMAND FORECAST – ACCELERATED TECH (C4A AT): equipment stock forecast identical to C4A CT. On the technology progress
side, technology innovation is accelerated in the same way as scenario two, to deliver a range of device energy efficiency improvement steps via
technology and maintenance enhancements alongside replacement of synthetic refrigerants by natural ones with very low to zero GWP.
19 It is understood that there are ways to meet our overall energy and carbon targets with sub-sector “budgets” whose relative share of energy use change over time – nonetheless this approach is likely representative of the level of change required in the cooling sector.
20 Ratio of sector’s energy consumption as per GCI data over broader sector energy use as per IEA ETP2017. 21 See “IEA Dataset” above for definitions.22 The GCI energy consumption projections incorporate factors like technology improvements, penetration rates driven by policy and varying climatic conditions between global markets.
We have used these as an input assumption to this analysis. To provide readers with an indication of improvement anticipated by GCI across the equipment park we have simply divided total energy consumption in each segment by the total number of devices in use to provide an indication of the direction of travel of energy efficiency. A reduction in per device energy consumption could be caused by reduced cooling need or enhanced efficiency of delivering cooling. Given that a great deal of the growth projected is in high ambient temperature countries, we have taken the view that these per unit energy consumption reductions are broadly representative of efficiency improvements. With regard to a definition of technology efficiency and energy reduction, a halving of energy consumption to achieve the same level of cooling implies a doubling in technology efficiency. Cutting energy to a third but achieving the same level of cooling would require a 3-fold (300%) increase in efficiency levels e.g. if 1,000 cooling units consume 3,000KWhs of energy and we wanted to reduce this to 1000KWhs i.e. one third, the efficiency of each unit would need to increase by 300%. (e.g. a device with a COP of 5 that consumed 30kWh of energy to deliver a 150kWh of cooling effect would need to increase its COP to 15 to deliver the same cooling effect with only 10kWh of energy input)
23 The technology improvements for the Accelerated Technology Scenario and associated equipment penetrations, are forecast by GCI and described in numerous areas as “optimistic”. Potential sources for these improvements are described in the Appendix have been sourced from GCI publications. They also include projected cost implications.
HOW HAS THE DATA BEEN USED?
The GCI data set has been used to provide a
picture of cooling demand across all sectors
and the technical assumptions in the work
have been used here to develop scenario-
based projections of emissions and energy
consumption for:
a) A scenario where technology innovation
continues at the current pace and
b) An ambitious scenario where technology
progress at the device level is accelerated
to deliver increased energy efficiency
improvement steps via technology and
maintenance enhancements alongside
replacement of high GWP refrigerants with
very low to zero GWP refrigerants.
The IEA data has been used to provide
an energy and carbon budget for cooling
consistent with the 2°C Scenario (2DS) and
the Beyond 2°C Scenario (B2DS) (i.e. a
lower level of warming limited to 1.75°C) for
comparison. From this we have:
1. Calculated a Cooling Sector Energy Budget.
2. Considered Cooling Energy Sector Demand
for Cooling for All Scenario versus Cooling
Sector Energy Budget.
1. A Cooling Sector Energy Budget
In order to put the cooling sector’s dynamics
in the context of the global energy sector’s
evolution, we have defined a cooling sector
“energy budget”. Because the space cooling
sector is already a large consumer of energy
and is expected to grow very rapidly over the
coming decades (see below), the IEA already
defines an energy trajectory specific to the space
cooling sector in each of its scenarios. Knowing
what share of final energy consumption cooling
represents within the stationary refrigeration
and mobile cooling sectors today, using the
space cooling data points, we can also derive
comparable trajectories (or “budgets”) for
these cooling sectors if we are to meet the IEA
2°C Scenario and the Beyond 2°C Scenario.
By design these trajectories are built on the
assumption that the share of cooling energy as a
percentage of final energy consumption in these
sectors must not increase for the budgets to be
met19. This enables the definition of an “energy
budget” for the cooling sector as a whole.
Today, stationary refrigeration equipment
represents 22.5% of appliances’ energy use
within buildings on average whilst mobile AC
and mobile refrigeration represents 3.3% of total
transport energy demand20.
With these assumptions and the IEA energy
trajectories21 from ETP2017, we estimate the total
energy budget for cooling sectors to be
● By 2030 between 4,400 TWh/year (B2DS)
and 5,000 TWh/year (2DS)
● By 2050 between 5,500 TWh/ year (B2DS)
and 6,300 TWh/year (2DS)
2. Cooling Energy Sector Demand for Cooling for All Scenario versus Cooling Sector Energy Budget.
Initially, a simple comparison as to whether the
IEA energy and carbon budget was sufficient to
accommodate the projected growth in demand for
cooling was undertaken. This was then extended
in a number of ways to:
● Review implied equipment penetrations and
then posit a Cooling for All scenario;
● Explore implications at a high-level of a
Cooling for All scenario in terms of energy
and carbon;
● Provide an indication of how large the
improvements may need to be to deliver this
outcome without exceeding the carbon and
energy budgets;
● Explore the implications in terms of
renewable energy demand for a business
as usual and mitigation scenario;
● Review the impact of the Kigali Amendment
to the Montreal Protocol on proposed levels
of mitigation.

15A Cool World – Defining the Energy Conundrum of Cooling for All14 A Cool World – Defining the Energy Conundrum of Cooling for All
DEFIN ING DEMAND FOR COOLING
SECTORS CONSIDERED
The three largest sources of global cooling
demand today include:
Space Cooling – which we define as the
provision of comfort cooling through buildings’
air-conditioning (residential, commercial and
industrial premises). Although there are still
less AC units than domestic refrigerators
globally, given its energy consumption, space
cooling already is the largest energy consumer
amongst the cooling sectors, accounting for
41% of global cooling energy consumption.
Stationary Refrigeration – which we define as
any refrigeration equipment used in buildings
(residential, commercial and industrial24) to
maintain and/or reduce the temperature of
air for process cooling, product storage and
goods and equipment cooling (e.g. industrial
processes). It is today the second largest
consumer of energy within the cooling sectors,
with 34% of global cooling energy use.
And Mobile Cooling – which we define as
the provision of cooling for both vehicle air-
conditioning equipment (AC in cars, buses &
coaches, trains, etc.) and transport refrigeration
equipment (refrigeration for vans, trucks,
containers, etc.). It accounts for the remaining
25% of the cooling sectors’ energy use.
Today these combined sectors represent a stock
of 3.6 billion pieces of equipment, of which nearly
45% are domestic refrigerators, and annual sales
of more than 350 million units in 2018, 38% of
which are domestic refrigerators.
Projected Equipment Stocks from now to 2050
The cooling equipment stock growth forecast
below (Figures 3 and 4) has been produced by
the Green Cooling Initiative (GCI, see details
above in Green Cooling Initiative Data Set). It
describes a single scenario for equipment growth
which sees the global stock reaching a total of
over 9.5 billion units in-use by 205025 – with
cumulative equipment sales between 2018 and
2050 of 19 billion new appliances.
The largest growth is expected in the space
cooling sector, with four times as many
appliances in-use by 2050 than there are today.
Despite growing at a slower rate, stationary
refrigeration and mobile cooling stocks are
also expected to more than double in the same
timeframe.
Implied per capita stock levels and Implications
Per capita equipment ownership ratios at
regional levels shows that despite the significant
growth in equipment stock, some regions remain
considerably under-served compared to the most
advanced nations.
In the Space Cooling sector, China’s staggering
growth in equipment penetration continues until
the early 2030’s at which point it surpasses the
equipment penetration rates observed in the USA
(Figure 5).
At the other end of the spectrum, uptake in
ASEAN, India and Sub-Saharan Africa grow
much slower – so much so that uptake in ASEAN
remains 5 times lower than it is in the USA by
2050 while uptake in India26 and Sub-Saharan
Africa remains 10 times lower than in the USA
by 205027.
Within the Stationary Refrigeration sector,
domestic refrigeration ownership is where most
of the growth takes place – and together with
commercial refrigeration where the gap between
developed and developing nations is the smallest
(Figure 6). In the 2018 to 2050 period, China
domestic refrigeration grows to ~65% of the
uptake in the USA; ASEAN and India grow
to ~50% of the uptake in the USA; and Sub-
Saharan Africa grows to 37% of the uptake in the
USA28.
For commercial refrigeration, China grows to
~80% of the uptake in the USA by 2050; India
grows to <60% of the uptake in the USA by
2050; and ASEAN and Sub-Saharan Africa grow
to 80% of the uptake in the USA by 2050
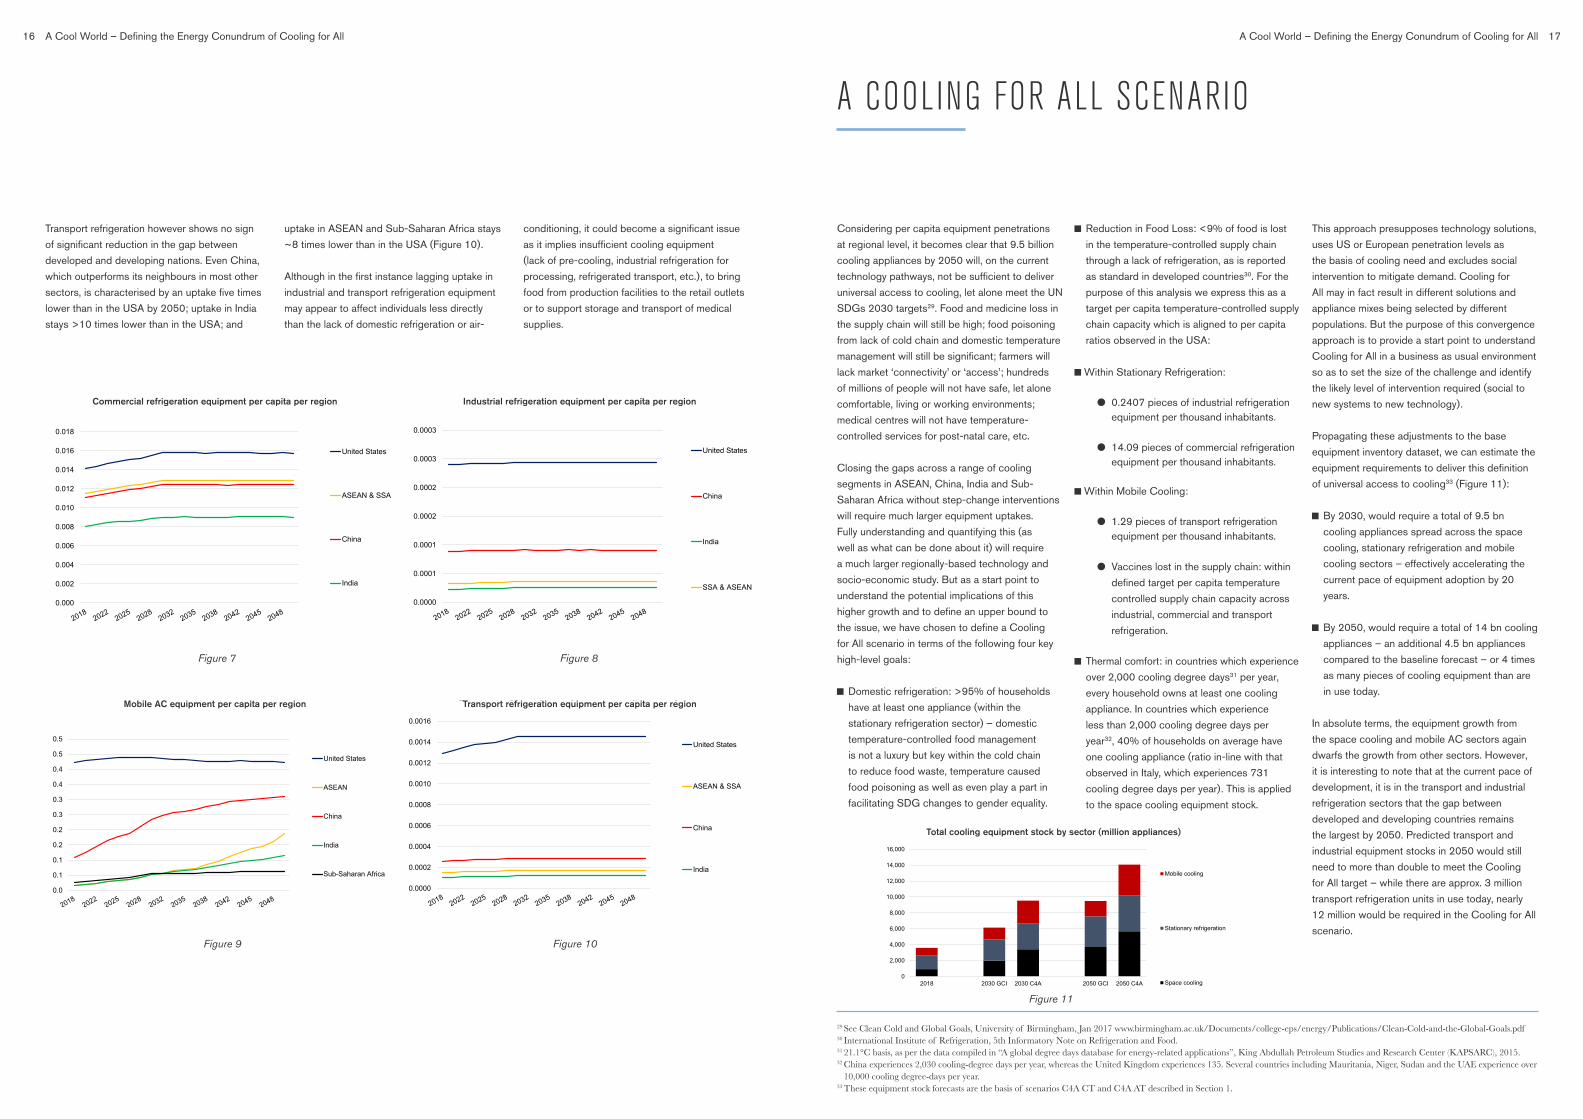
(Figure 7, overleaf).
Industrial refrigeration is where the gap between
developed and developing nations remains the
widest in the stationary refrigeration sector – with
uptake in China 3 times lower than in the USA by
2050; uptake in India over 10 times lower than in
the USA; and uptake in ASEAN and Sub-Saharan
Africa 8 times lower than in the USA (Figure 8,
overleaf).
Within the Mobile cooling sector, it is the mobile
AC segment which exhibits the fastest growth
– with uptake in China growing to ~65% of the
uptake in the US; uptake in ASEAN and India
growing to ~50% of the uptake in the USA; and
uptake in Sub-Saharan Africa growing to 37% of
the uptake in the USA (Figure 9, overleaf).
24 Commercial refrigeration relates to refrigeration systems deployed in retail and restaurant premises whereas industrial refrigeration relates to food processing and upstream distribution channels.
25 Approx. 3.76bn of these will be domestic refrigerators.
26 In 2050, India projections are 150m units vs. 400m for the USA, despite a population 3 to 4 times larger.27 A major driver for this lower penetration seems to be affordability concerns, persistently lower levels of GDP per capita in these countries is expected to lead to lower equipment
penetrations under GCI’s modelling approach.28 For consistency with other types of equipment, we have analysed domestic fridge deployments in respect to per capita penetrations as opposed to household ownership levels.
0.0
0.2
0.4
0.6
0.8
1.0
1.2
1.4
1.6
1.8
Number of AC units per capita per region
China
United States
SSA & India
ASEAN
0.0
0.1
0.2
0.3
0.4
0.5
0.6
0.7
0.8
Domestic refrigeration equipment per capita per region
United States
ASEAN & India
China
Sub-Saharan Africa
Figure 5 Figure 6Figure 3
0
2
4
6
8
10
12
Billi
ons
Number of cooling appliances in-use globally, by sector (# of units)
Space cooling Stationary refrigeration Mobile cooling
0
100
200
300
400
500
600
700
800
Milli
ons
Annual sales of cooling appliances globally, by sector (# of units)
Space cooling Stationary refrigeration Mobile cooling
Figure 4
Number of cooling appliances in-use globally, by sector (# of units) Number of AC units per capita per regionAnnual sales of cooling appliances globally, by sector (# of units) Domestic refrigeration equipment per capita per region
17A Cool World – Defining the Energy Conundrum of Cooling for All16 A Cool World – Defining the Energy Conundrum of Cooling for All
Considering per capita equipment penetrations
at regional level, it becomes clear that 9.5 billion
cooling appliances by 2050 will, on the current
technology pathways, not be sufficient to deliver
universal access to cooling, let alone meet the UN
SDGs 2030 targets29. Food and medicine loss in
the supply chain will still be high; food poisoning
from lack of cold chain and domestic temperature
management will still be significant; farmers will
lack market ‘connectivity’ or ‘access’; hundreds
of millions of people will not have safe, let alone
comfortable, living or working environments;
medical centres will not have temperature-
controlled services for post-natal care, etc.
Closing the gaps across a range of cooling
segments in ASEAN, China, India and Sub-
Saharan Africa without step-change interventions
will require much larger equipment uptakes.
Fully understanding and quantifying this (as
well as what can be done about it) will require
a much larger regionally-based technology and
socio-economic study. But as a start point to
understand the potential implications of this
higher growth and to define an upper bound to
the issue, we have chosen to define a Cooling
for All scenario in terms of the following four key
high-level goals:
Domestic refrigeration: >95% of households
have at least one appliance (within the
stationary refrigeration sector) – domestic
temperature-controlled food management
is not a luxury but key within the cold chain
to reduce food waste, temperature caused
food poisoning as well as even play a part in
facilitating SDG changes to gender equality.
Reduction in Food Loss: <9% of food is lost
in the temperature-controlled supply chain
through a lack of refrigeration, as is reported
as standard in developed countries30. For the
purpose of this analysis we express this as a
target per capita temperature-controlled supply
chain capacity which is aligned to per capita
ratios observed in the USA:
Within Stationary Refrigeration:
● 0.2407 pieces of industrial refrigeration equipment per thousand inhabitants.
● 14.09 pieces of commercial refrigeration equipment per thousand inhabitants.
Within Mobile Cooling:
● 1.29 pieces of transport refrigeration equipment per thousand inhabitants.
● Vaccines lost in the supply chain: within
defined target per capita temperature
controlled supply chain capacity across
industrial, commercial and transport
refrigeration.
Thermal comfort: in countries which experience
over 2,000 cooling degree days31 per year,
every household owns at least one cooling
appliance. In countries which experience
less than 2,000 cooling degree days per
year32, 40% of households on average have
one cooling appliance (ratio in-line with that
observed in Italy, which experiences 731
cooling degree days per year). This is applied
to the space cooling equipment stock.
This approach presupposes technology solutions,
uses US or European penetration levels as
the basis of cooling need and excludes social
intervention to mitigate demand. Cooling for
All may in fact result in different solutions and
appliance mixes being selected by different
populations. But the purpose of this convergence
approach is to provide a start point to understand
Cooling for All in a business as usual environment
so as to set the size of the challenge and identify
the likely level of intervention required (social to
new systems to new technology).
Propagating these adjustments to the base
equipment inventory dataset, we can estimate the
equipment requirements to deliver this definition
of universal access to cooling33 (Figure 11):
By 2030, would require a total of 9.5 bn
cooling appliances spread across the space
cooling, stationary refrigeration and mobile
cooling sectors – effectively accelerating the
current pace of equipment adoption by 20
years.
By 2050, would require a total of 14 bn cooling
appliances – an additional 4.5 bn appliances
compared to the baseline forecast – or 4 times
as many pieces of cooling equipment than are
in use today.
In absolute terms, the equipment growth from
the space cooling and mobile AC sectors again
dwarfs the growth from other sectors. However,
it is interesting to note that at the current pace of
development, it is in the transport and industrial
refrigeration sectors that the gap between
developed and developing countries remains
the largest by 2050. Predicted transport and
industrial equipment stocks in 2050 would still
need to more than double to meet the Cooling
for All target – while there are approx. 3 million
transport refrigeration units in use today, nearly
12 million would be required in the Cooling for All
scenario.
0.0000
0.0001
0.0001
0.0002
0.0002
0.0003
0.0003
Industrial refrigeration equipment per capita per region
United States
China
India
SSA & ASEAN
0.000
0.002
0.004
0.006
0.008
0.010
0.012
0.014
0.016
0.018
Commercial refrigeration equipment per capita per region
United States
ASEAN & SSA
China
India
Figure 7 Figure 8
0.0000
0.0002
0.0004
0.0006
0.0008
0.0010
0.0012
0.0014
0.0016
Transport refrigeration equipment per capita per region
United States
ASEAN & SSA
China
India
0.0
0.1
0.1
0.2
0.2
0.3
0.3
0.4
0.4
0.5
0.5
Mobile AC equipment per capita per region
United States
ASEAN
China
India
Sub-Saharan Africa
Figure 9 Figure 10
Transport refrigeration however shows no sign
of significant reduction in the gap between
developed and developing nations. Even China,
which outperforms its neighbours in most other
sectors, is characterised by an uptake five times
lower than in the USA by 2050; uptake in India
stays >10 times lower than in the USA; and
uptake in ASEAN and Sub-Saharan Africa stays
~8 times lower than in the USA (Figure 10).
Although in the first instance lagging uptake in
industrial and transport refrigeration equipment
may appear to affect individuals less directly
than the lack of domestic refrigeration or air-
conditioning, it could become a significant issue
as it implies insufficient cooling equipment
(lack of pre-cooling, industrial refrigeration for
processing, refrigerated transport, etc.), to bring
food from production facilities to the retail outlets
or to support storage and transport of medical
supplies.
29 See Clean Cold and Global Goals, University of Birmingham, Jan 2017 www.birmingham.ac.uk/Documents/college-eps/energy/Publications/Clean-Cold-and-the-Global-Goals.pdf 30 International Institute of Refrigeration, 5th Informatory Note on Refrigeration and Food. 31 21.1°C basis, as per the data compiled in “A global degree days database for energy-related applications”, King Abdullah Petroleum Studies and Research Center (KAPSARC), 2015. 32 China experiences 2,030 cooling-degree days per year, whereas the United Kingdom experiences 135. Several countries including Mauritania, Niger, Sudan and the UAE experience over
10,000 cooling degree-days per year.33 These equipment stock forecasts are the basis of scenarios C4A CT and C4A AT described in Section 1.
A COOLING FOR ALL SCENARIO
0
2,000
4,000
6,000
8,000
10,000
12,000
14,000
16,000
2018 2030 GCI 2030 C4A 2050 GCI 2050 C4A
Total cooling equipment stock by sector (million appliances)
Mobile cooling
Stationary refrigeration
Space cooling
Figure 11
Commercial refrigeration equipment per capita per region
Mobile AC equipment per capita per region
Industrial refrigeration equipment per capita per region
Transport refrigeration equipment per capita per region
Total cooling equipment stock by sector (million appliances)

19A Cool World – Defining the Energy Conundrum of Cooling for All18 A Cool World – Defining the Energy Conundrum of Cooling for All
34 Life Cycle Climate Performance calculation based on current technology and energy mix. It includes TEWI emissions (from energy consumption and refrigerants) and equipment manufacture and disposal.
35 GCI global grid energy demand as described in IEA Energy Technologies Perspectives 2017.36 Note that the cooling sector’s total CO2 equivalent comparison is not directly a like for like comparison with the IEA direct CO2 emissions from the power and industrial sectors. The IEA
figure does not include refrigerant emissions, equipment manufacture and disposal (approx. 30% of the cooling sector’s CO2 equivalent emissions). It should also be noted that cooling energy consumption varies by country, with each country having a more or less carbon intensive energy mix – high energy consumption in regions where the energy mix is highly carbon intensive will therefore disproportionately increase the CO2 emissions contribution.
BASELINE PROJECTIONS - GCI CURRENT TECH PROGRESS
Today – 2018
Today’s cooling equipment stock is projected
to consume ~3,900 TWh of energy in 2018
(globally) – or 3.4% of the world’s total energy
demand34 - with space cooling accounting for the
largest share of cooling energy use (1,600 TWh),
followed by stationary refrigeration (1,300 TWh)
and mobile cooling (1,000 TWh) (Figure 12).
China is already by far the largest consumer
of cooling energy – with nearly twice as much
energy consumed as the second largest user,
the USA – whereas very low equipment adoption
rates in ASEAN, India and Sub-Saharan Africa
translate to low energy use from the cooling
sector.
Total CO2 equivalent (CO2e) emissions35 from the
cooling sectors in turn will amount to 4.1GT of
CO2e emissions in 2018 – equivalent to 11.3%
of the world’s direct CO2 emissions from the
power and industrial sectors in the IEA Reference
Scenario36 (Figure 13).
Furthermore:
Mobile cooling accounts for 31% of total
cooling emissions despite only consuming
25% of the sector’s energy. Contrary to other
cooling sectors, it consumes primarily fossil-
fuels and is characterised by a higher share
of CO2e emissions from refrigerant leakage,
equipment manufacture and disposal (37% of
the sector’s CO2e emissions).
For Space Cooling and Stationary
Refrigeration, the share of CO2e emissions
from refrigerant leakage and equipment
manufacture and disposal is ~27%.
The largest cooling energy consumer, China, is
also the largest emitter of CO2e emissions with
33% of the world’s total – to which the country’s
large equipment manufacturing base is a large
contributor.
ENERGY AND EMISSIONS IMPLICAT IONS
Space cooling41%
Stationary refrigeration34%
Mobile cooling25%
Global energy consumption from the cooling sector in 2018
China27%
India8%
ASEAN7% Sub-Saharan
Africa7%EU
11%
USA14%
RoW26%
Global energy consumption from the cooling sector in 2018
Global cooling energy consumtion in 2018
By sector By region
Figure 12
Space cooling38%
Stationary refrigeration31%
Mobile cooling31%
Global CO2e emissions from the cooling sector in 2018
China33%
India12%
ASEAN6%
Sub-Saharan Africa
5%
EU10%
USA11%
RoW23%
Global CO2e emissions from the cooling sector in 2018
Global cooling sector CO2e emissions in 2018
By sector By region
Figure 13
37 This originates from the GCI data and has been calculated for each of the cooling sub-sectors (Unitary ACs, commercial refrigeration, transport refrigeration, etc.) in each country to factor local climate conditions affecting demand for cooling. It is the ratio of appliance energy use over number of appliances in use – which is presented here as a global weighted average for each of the space cooling, stationary refrigeration and mobile cooling sectors.
38 The CO2 trajectories shown here for the cooling sectors assume no decarbonisation of our energy supply. It is understood that it is not realistic to assume energy production’s carbon intensity to remain constant, however it enables the scale of the challenge from a technology perspective.
39 Note that this only relates to CO2 emissions from the sector’s energy use.
Projection – 2050
To describe the impact of equipment stock
growth on future cooling sector energy use and
carbon emissions, we first consider the baseline
GCI demand forecast current tech progress
(GCI CT) scenario – which assumes the GCI
penetration rates across all sectors and no
accelerated technical innovation in the sector (as
a whole) either in terms of low GWP refrigerant
adoption or equipment efficiency beyond what
is currently known. This scenario leads to unit
equipment energy use reducing (on average,
between 2018 and 2050) by 15% in space
cooling and 38% in stationary refrigeration; no
reduction in mobile cooling equipment energy
use37 (Figure 14).
In this scenario, total energy use grows from
3,900 TWh in 2018 to 9,500 TWh by 2050 –
with space cooling’s share growing to 58% (from
41%) of cooling sectors’ energy use at nearly
5,500 TWh of energy. In this scenario, space
cooling alone would consume more energy in
2050 than the entire cooling sector consumes
today and equal to the entire implied energy
budget for cooling under the IEA’s 2DS.
As described in the methodology section
previously, the total energy budget for cooling
sectors will be between 4,400 and 5,000 TWh/
year by 2030 and 5,500 and 6,300 TWh/year by
2050, with the lower bound based on a projected
1.75°C of warming by 2100 (IEA Beyond 2°C)
and upper bound for 2°C (IEA 2°C).
Total energy consumption from the cooling
sectors in the GCI CT scenario therefore exceeds
its budget by at least 3,200 TWh by 2050
(Figure 15).
Similarly, the challenge can be illustrated from
a CO2e emissions perspective. If electricity is
continued to be produced with the current energy
mix38, and cooling equipment energy efficiency
followed the GCI CT trajectory, CO2e emissions
from the cooling sectors would grow from 4.1
GTCO2e today to more than 8.9 GTCO2e by
2050 – of which CO2e emissions tied to energy
use alone would account for 7.4 GT. This is an
additional 6 to 6.9 GT compared to the CO2
emissions budget39 implied by the IEA’s 2DS and
2BDS energy trajectories from ETP2017 of 0.5 to
1.4 GT of CO2 respectively (Figure 16).
Space cooling
Stationary refrigeration
Mobile cooling
0
2,000
4,000
6,000
8,000
10,000
12,000
Cooling sectors energy consumption by end-use in GCI CT scenario (TWh/year)
0
1,000
2,000
3,000
4,000
5,000
6,000
7,000
8,000
9,000
10,000
All cooling sectors global annual energy consumption [TWh]
All cooling totalenergy cons. [GCI CT]
All cooling totalenergy cons. [GCI AT]
All cooling sectorsenergy allocation[From IEA 2DS]
All cooling sectorsenergy allocation[From IEA B2DS]
Figure 14 Figure 15
0
1,000
2,000
3,000
4,000
5,000
6,000
7,000
8,000
9,000
10,000
Total CO2e emissions from all cooling sectors (million TCO2e)with current energy mix
All cooling sectors total CO2e [GCI CT]
All cooling sectors total CO2e [GCI AT]
All cooling sectors CO2 allocation [From IEA 2DS]
All cooling sectors CO2 allocation [From IEA B2DS]
Figure 16
Cooling sectors energy consumption by end-use in GCI CT scenario (TWh/year)
Total CO2e emissions from all cooling sectors (million TCO2e) with current energy mix
All cooling sectors global annual energy consumption [TWh]
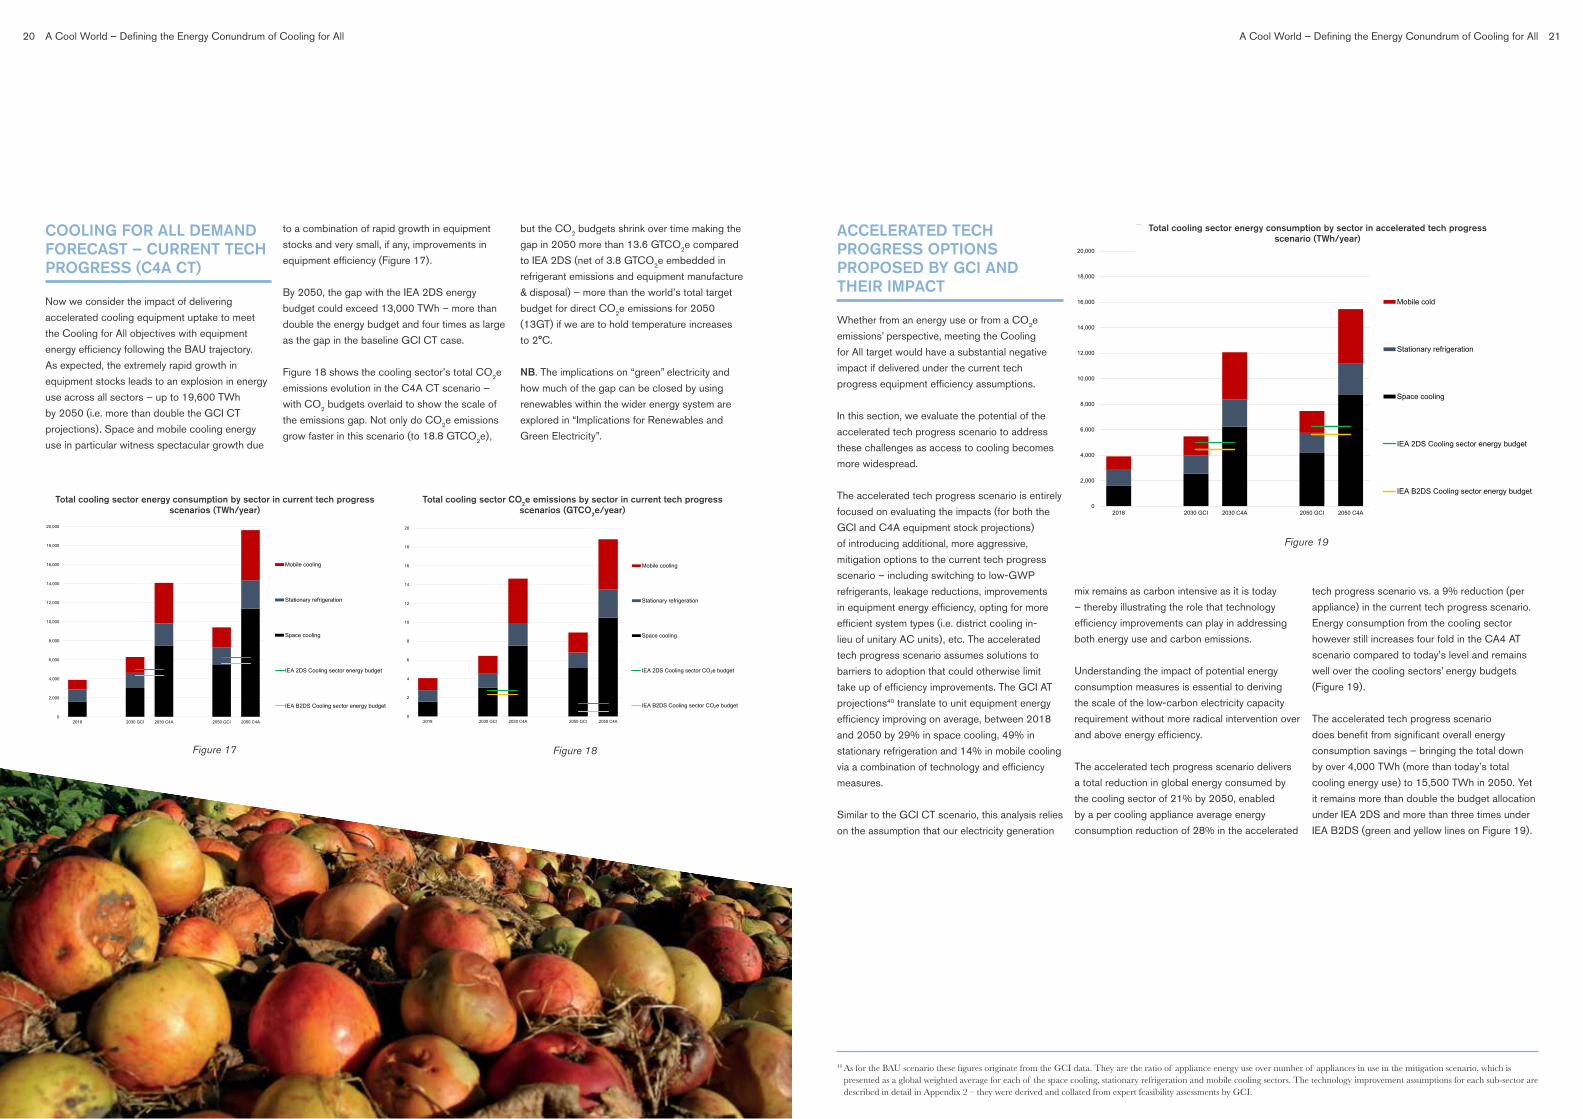
21A Cool World – Defining the Energy Conundrum of Cooling for All20 A Cool World – Defining the Energy Conundrum of Cooling for All
COOLING FOR ALL DEMAND FORECAST – CURRENT TECH PROGRESS (C4A CT)
Now we consider the impact of delivering
accelerated cooling equipment uptake to meet
the Cooling for All objectives with equipment
energy efficiency following the BAU trajectory.
As expected, the extremely rapid growth in
equipment stocks leads to an explosion in energy
use across all sectors – up to 19,600 TWh
by 2050 (i.e. more than double the GCI CT
projections). Space and mobile cooling energy
use in particular witness spectacular growth due
to a combination of rapid growth in equipment
stocks and very small, if any, improvements in
equipment efficiency (Figure 17).
By 2050, the gap with the IEA 2DS energy
budget could exceed 13,000 TWh – more than
double the energy budget and four times as large
as the gap in the baseline GCI CT case.
Figure 18 shows the cooling sector’s total CO2e
emissions evolution in the C4A CT scenario –
with CO2 budgets overlaid to show the scale of
the emissions gap. Not only do CO2e emissions
grow faster in this scenario (to 18.8 GTCO2e),
but the CO2 budgets shrink over time making the
gap in 2050 more than 13.6 GTCO2e compared
to IEA 2DS (net of 3.8 GTCO2e embedded in
refrigerant emissions and equipment manufacture
& disposal) – more than the world’s total target
budget for direct CO2e emissions for 2050
(13GT) if we are to hold temperature increases
to 2°C.
NB. The implications on “green” electricity and
how much of the gap can be closed by using
renewables within the wider energy system are
explored in “Implications for Renewables and
Green Electricity”.
Figure 17
0
2,000
4,000
6,000
8,000
10,000
12,000
14,000
16,000
18,000
20,000
2018 2030 GCI 2030 C4A 2050 GCI 2050 C4A
Total cooling sector energy consumption by sector in current tech progress scenarios (TWh/year)
Mobile cooling
Stationary refrigeration
Space cooling
IEA 2DS Cooling sector energy budget
IEA B2DS Cooling sector energy budget
0
2
4
6
8
10
12
14
16
18
20
2018 2030 GCI 2030 C4A 2050 GCI 2050 C4A
Total cooling sector CO2e emissions by sector in current tech progress scenarios (GTCO2e/year)
Mobile cooling
Stationary refrigeration
Space cooling
IEA 2DS Cooling sector CO2e budget
IEA B2DS Cooling sector CO2e budget
Figure 18
ACCELERATED TECH PROGRESS OPTIONS PROPOSED BY GCI AND THEIR IMPACT
Whether from an energy use or from a CO2e
emissions’ perspective, meeting the Cooling
for All target would have a substantial negative
impact if delivered under the current tech
progress equipment efficiency assumptions.
In this section, we evaluate the potential of the
accelerated tech progress scenario to address
these challenges as access to cooling becomes
more widespread.
The accelerated tech progress scenario is entirely
focused on evaluating the impacts (for both the
GCI and C4A equipment stock projections)
of introducing additional, more aggressive,
mitigation options to the current tech progress
scenario – including switching to low-GWP
refrigerants, leakage reductions, improvements
in equipment energy efficiency, opting for more
efficient system types (i.e. district cooling in-
lieu of unitary AC units), etc. The accelerated
tech progress scenario assumes solutions to
barriers to adoption that could otherwise limit
take up of efficiency improvements. The GCI AT
projections40 translate to unit equipment energy
efficiency improving on average, between 2018
and 2050 by 29% in space cooling, 49% in
stationary refrigeration and 14% in mobile cooling
via a combination of technology and efficiency
measures.
Similar to the GCI CT scenario, this analysis relies
on the assumption that our electricity generation
mix remains as carbon intensive as it is today
– thereby illustrating the role that technology
efficiency improvements can play in addressing
both energy use and carbon emissions.
Understanding the impact of potential energy
consumption measures is essential to deriving
the scale of the low-carbon electricity capacity
requirement without more radical intervention over
and above energy efficiency.
The accelerated tech progress scenario delivers
a total reduction in global energy consumed by
the cooling sector of 21% by 2050, enabled
by a per cooling appliance average energy
consumption reduction of 28% in the accelerated
tech progress scenario vs. a 9% reduction (per
appliance) in the current tech progress scenario.
Energy consumption from the cooling sector
however still increases four fold in the CA4 AT
scenario compared to today’s level and remains
well over the cooling sectors’ energy budgets
(Figure 19).
The accelerated tech progress scenario
does benefit from significant overall energy
consumption savings – bringing the total down
by over 4,000 TWh (more than today’s total
cooling energy use) to 15,500 TWh in 2050. Yet
it remains more than double the budget allocation
under IEA 2DS and more than three times under
IEA B2DS (green and yellow lines on Figure 19).
0
2,000
4,000
6,000
8,000
10,000
12,000
14,000
16,000
18,000
20,000
2018 2030 GCI 2030 C4A 2050 GCI 2050 C4A
Total cooling sector energy consumption by sector in accelerated tech progress scenario (TWh/year)
Mobile cold
Stationary refrigeration
Space cooling
IEA 2DS Cooling sector energy budget
IEA B2DS Cooling sector energy budget
Figure 19
40 As for the BAU scenario these figures originate from the GCI data. They are the ratio of appliance energy use over number of appliances in use in the mitigation scenario, which is presented as a global weighted average for each of the space cooling, stationary refrigeration and mobile cooling sectors. The technology improvement assumptions for each sub-sector are described in detail in Appendix 2 – they were derived and collated from expert feasibility assessments by GCI.
Total cooling sector energy consumption by sector in current tech progress scenarios (TWh/year)
Total cooling sector CO2e emissions by sector in current tech progress scenarios (GTCO2e/year)
Total cooling sector energy consumption by sector in accelerated tech progress scenario (TWh/year)
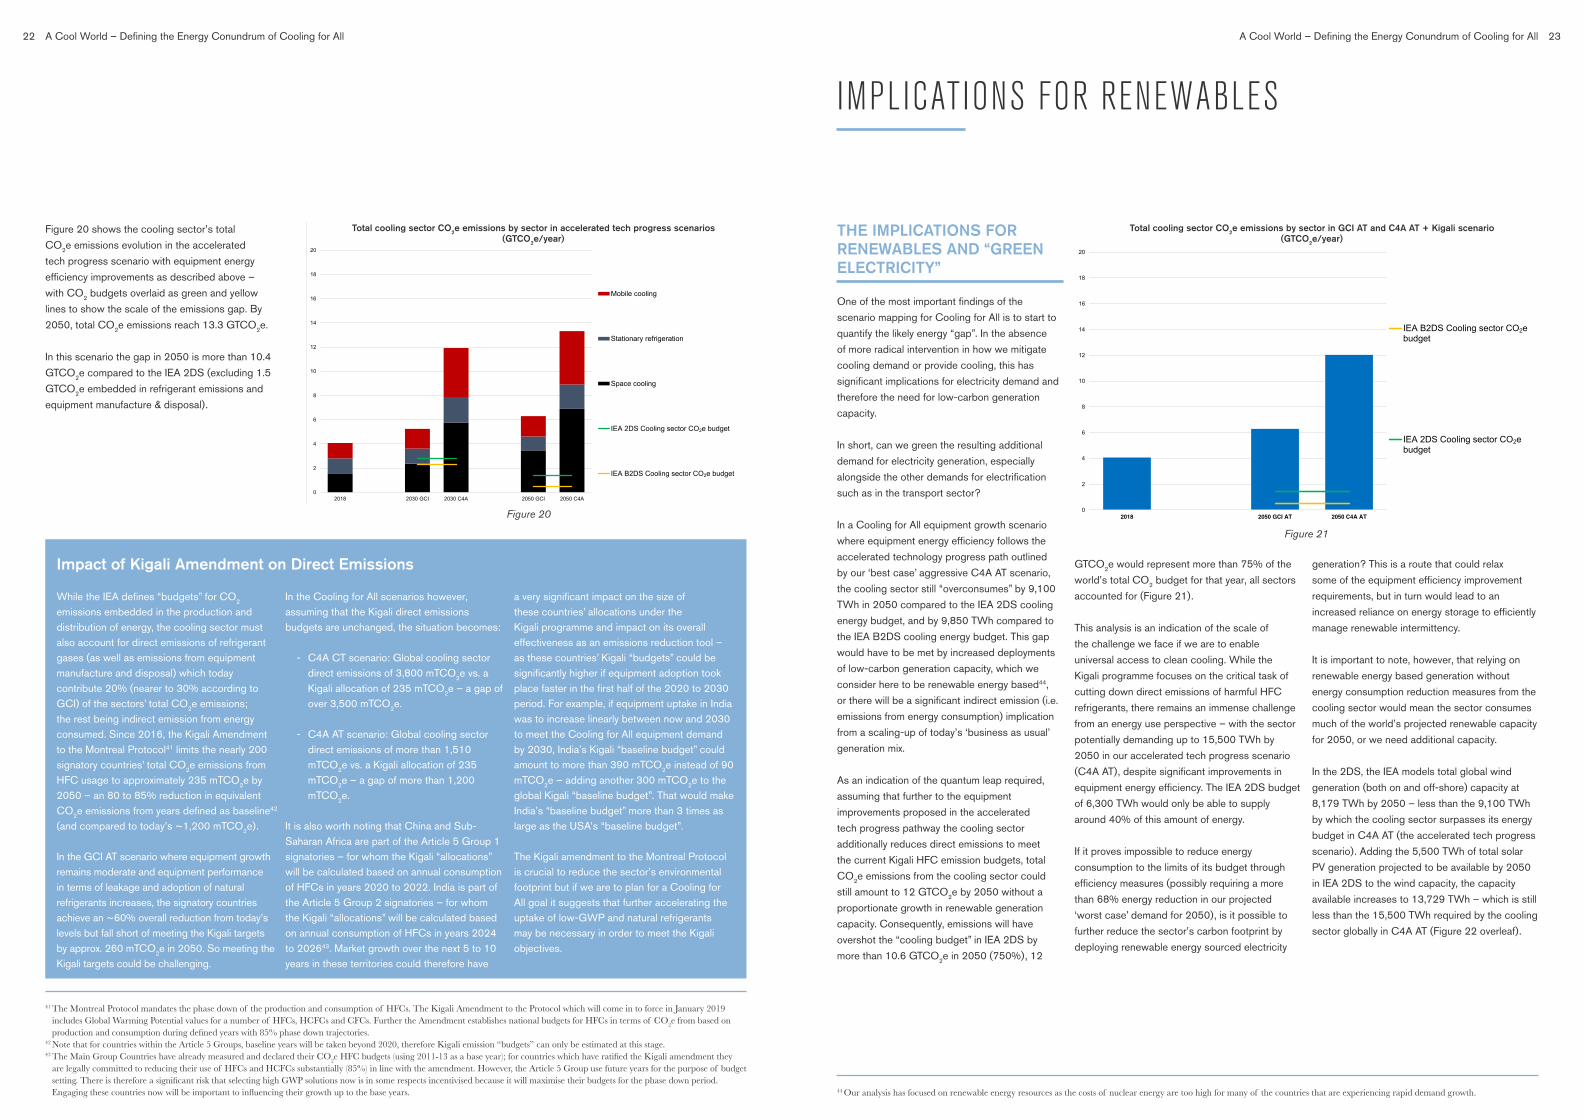
23A Cool World – Defining the Energy Conundrum of Cooling for All22 A Cool World – Defining the Energy Conundrum of Cooling for All
Figure 20 shows the cooling sector’s total
CO2e emissions evolution in the accelerated
tech progress scenario with equipment energy
efficiency improvements as described above –
with CO2 budgets overlaid as green and yellow
lines to show the scale of the emissions gap. By
2050, total CO2e emissions reach 13.3 GTCO2e.
In this scenario the gap in 2050 is more than 10.4
GTCO2e compared to the IEA 2DS (excluding 1.5
GTCO2e embedded in refrigerant emissions and
equipment manufacture & disposal).
Impact of Kigali Amendment on Direct Emissions
While the IEA defines “budgets” for CO2 emissions embedded in the production and distribution of energy, the cooling sector must also account for direct emissions of refrigerant gases (as well as emissions from equipment manufacture and disposal) which today contribute 20% (nearer to 30% according to GCI) of the sectors’ total CO2e emissions; the rest being indirect emission from energy consumed. Since 2016, the Kigali Amendment to the Montreal Protocol41 limits the nearly 200 signatory countries’ total CO2e emissions from HFC usage to approximately 235 mTCO2e by 2050 – an 80 to 85% reduction in equivalent CO2e emissions from years defined as baseline42 (and compared to today’s ~1,200 mTCO2e).
In the GCI AT scenario where equipment growth remains moderate and equipment performance in terms of leakage and adoption of natural refrigerants increases, the signatory countries achieve an ~60% overall reduction from today’s levels but fall short of meeting the Kigali targets by approx. 260 mTCO2e in 2050. So meeting the Kigali targets could be challenging.
In the Cooling for All scenarios however, assuming that the Kigali direct emissions budgets are unchanged, the situation becomes:
- C4A CT scenario: Global cooling sector direct emissions of 3,800 mTCO2e vs. a Kigali allocation of 235 mTCO2e – a gap of over 3,500 mTCO2e.
- C4A AT scenario: Global cooling sector direct emissions of more than 1,510 mTCO2e vs. a Kigali allocation of 235 mTCO2e – a gap of more than 1,200 mTCO2e.
It is also worth noting that China and Sub-Saharan Africa are part of the Article 5 Group 1 signatories – for whom the Kigali “allocations” will be calculated based on annual consumption of HFCs in years 2020 to 2022. India is part of the Article 5 Group 2 signatories – for whom the Kigali “allocations” will be calculated based on annual consumption of HFCs in years 2024 to 202643. Market growth over the next 5 to 10 years in these territories could therefore have
a very significant impact on the size of these countries’ allocations under the Kigali programme and impact on its overall effectiveness as an emissions reduction tool – as these countries’ Kigali “budgets” could be significantly higher if equipment adoption took place faster in the first half of the 2020 to 2030 period. For example, if equipment uptake in India was to increase linearly between now and 2030 to meet the Cooling for All equipment demand by 2030, India’s Kigali “baseline budget” could amount to more than 390 mTCO2e instead of 90 mTCO2e – adding another 300 mTCO2e to the global Kigali “baseline budget”. That would make India’s “baseline budget” more than 3 times as large as the USA’s “baseline budget”.
The Kigali amendment to the Montreal Protocol is crucial to reduce the sector’s environmental footprint but if we are to plan for a Cooling for All goal it suggests that further accelerating the uptake of low-GWP and natural refrigerants may be necessary in order to meet the Kigali objectives.
0
2
4
6
8
10
12
14
16
18
20
2018 2030 GCI 2030 C4A 2050 GCI 2050 C4A
Total cooling sector CO2e emissions by sector in accelerated tech progress scenarios (GTCO2e/year)
Mobile cooling
Stationary refrigeration
Space cooling
IEA 2DS Cooling sector CO2e budget
IEA B2DS Cooling sector CO2e budget
41 The Montreal Protocol mandates the phase down of the production and consumption of HFCs. The Kigali Amendment to the Protocol which will come in to force in January 2019 includes Global Warming Potential values for a number of HFCs, HCFCs and CFCs. Further the Amendment establishes national budgets for HFCs in terms of CO2e from based on production and consumption during defined years with 85% phase down trajectories.
42 Note that for countries within the Article 5 Groups, baseline years will be taken beyond 2020, therefore Kigali emission “budgets” can only be estimated at this stage. 43 The Main Group Countries have already measured and declared their CO2e HFC budgets (using 2011-13 as a base year); for countries which have ratified the Kigali amendment they
are legally committed to reducing their use of HFCs and HCFCs substantially (85%) in line with the amendment. However, the Article 5 Group use future years for the purpose of budget setting. There is therefore a significant risk that selecting high GWP solutions now is in some respects incentivised because it will maximise their budgets for the phase down period. Engaging these countries now will be important to influencing their growth up to the base years.
Figure 20
IMPLICAT IONS FOR RENEWABLES
THE IMPLICATIONS FOR RENEWABLES AND “GREEN ELECTRICITY”
One of the most important findings of the
scenario mapping for Cooling for All is to start to
quantify the likely energy “gap”. In the absence
of more radical intervention in how we mitigate
cooling demand or provide cooling, this has
significant implications for electricity demand and
therefore the need for low-carbon generation
capacity.
In short, can we green the resulting additional
demand for electricity generation, especially
alongside the other demands for electrification
such as in the transport sector?
In a Cooling for All equipment growth scenario
where equipment energy efficiency follows the
accelerated technology progress path outlined
by our ‘best case’ aggressive C4A AT scenario,
the cooling sector still “overconsumes” by 9,100
TWh in 2050 compared to the IEA 2DS cooling
energy budget, and by 9,850 TWh compared to
the IEA B2DS cooling energy budget. This gap
would have to be met by increased deployments
of low-carbon generation capacity, which we
consider here to be renewable energy based44,
or there will be a significant indirect emission (i.e.
emissions from energy consumption) implication
from a scaling-up of today’s ‘business as usual’
generation mix.
As an indication of the quantum leap required,
assuming that further to the equipment
improvements proposed in the accelerated
tech progress pathway the cooling sector
additionally reduces direct emissions to meet
the current Kigali HFC emission budgets, total
CO2e emissions from the cooling sector could
still amount to 12 GTCO2e by 2050 without a
proportionate growth in renewable generation
capacity. Consequently, emissions will have
overshot the “cooling budget” in IEA 2DS by
more than 10.6 GTCO2e in 2050 (750%), 12
GTCO2e would represent more than 75% of the
world’s total CO2 budget for that year, all sectors
accounted for (Figure 21).
This analysis is an indication of the scale of
the challenge we face if we are to enable
universal access to clean cooling. While the
Kigali programme focuses on the critical task of
cutting down direct emissions of harmful HFC
refrigerants, there remains an immense challenge
from an energy use perspective – with the sector
potentially demanding up to 15,500 TWh by
2050 in our accelerated tech progress scenario
(C4A AT), despite significant improvements in
equipment energy efficiency. The IEA 2DS budget
of 6,300 TWh would only be able to supply
around 40% of this amount of energy.
If it proves impossible to reduce energy
consumption to the limits of its budget through
efficiency measures (possibly requiring a more
than 68% energy reduction in our projected
‘worst case’ demand for 2050), is it possible to
further reduce the sector’s carbon footprint by
deploying renewable energy sourced electricity
generation? This is a route that could relax
some of the equipment efficiency improvement
requirements, but in turn would lead to an
increased reliance on energy storage to efficiently
manage renewable intermittency.
It is important to note, however, that relying on
renewable energy based generation without
energy consumption reduction measures from the
cooling sector would mean the sector consumes
much of the world’s projected renewable capacity
for 2050, or we need additional capacity.
In the 2DS, the IEA models total global wind
generation (both on and off-shore) capacity at
8,179 TWh by 2050 – less than the 9,100 TWh
by which the cooling sector surpasses its energy
budget in C4A AT (the accelerated tech progress
scenario). Adding the 5,500 TWh of total solar
PV generation projected to be available by 2050
in IEA 2DS to the wind capacity, the capacity
available increases to 13,729 TWh – which is still
less than the 15,500 TWh required by the cooling
sector globally in C4A AT (Figure 22 overleaf).
44 Our analysis has focused on renewable energy resources as the costs of nuclear energy are too high for many of the countries that are experiencing rapid demand growth.
0
2
4
6
8
10
12
14
16
18
20
2018 2050 GCI AT 2050 C4A AT
Total cooling sector CO2e emissions by sector in GCI AT and C4A AT + Kigali scenario (GTCO2e/year)
IEA B2DS Cooling sector CO2e budget
IEA 2DS Cooling sector CO2e budget
Figure 21
Total cooling sector CO2e emissions by sector in accelerated tech progress scenarios (GTCO2e/year)
Total cooling sector CO2e emissions by sector in GCI AT and C4A AT + Kigali scenario (GTCO2e/year)
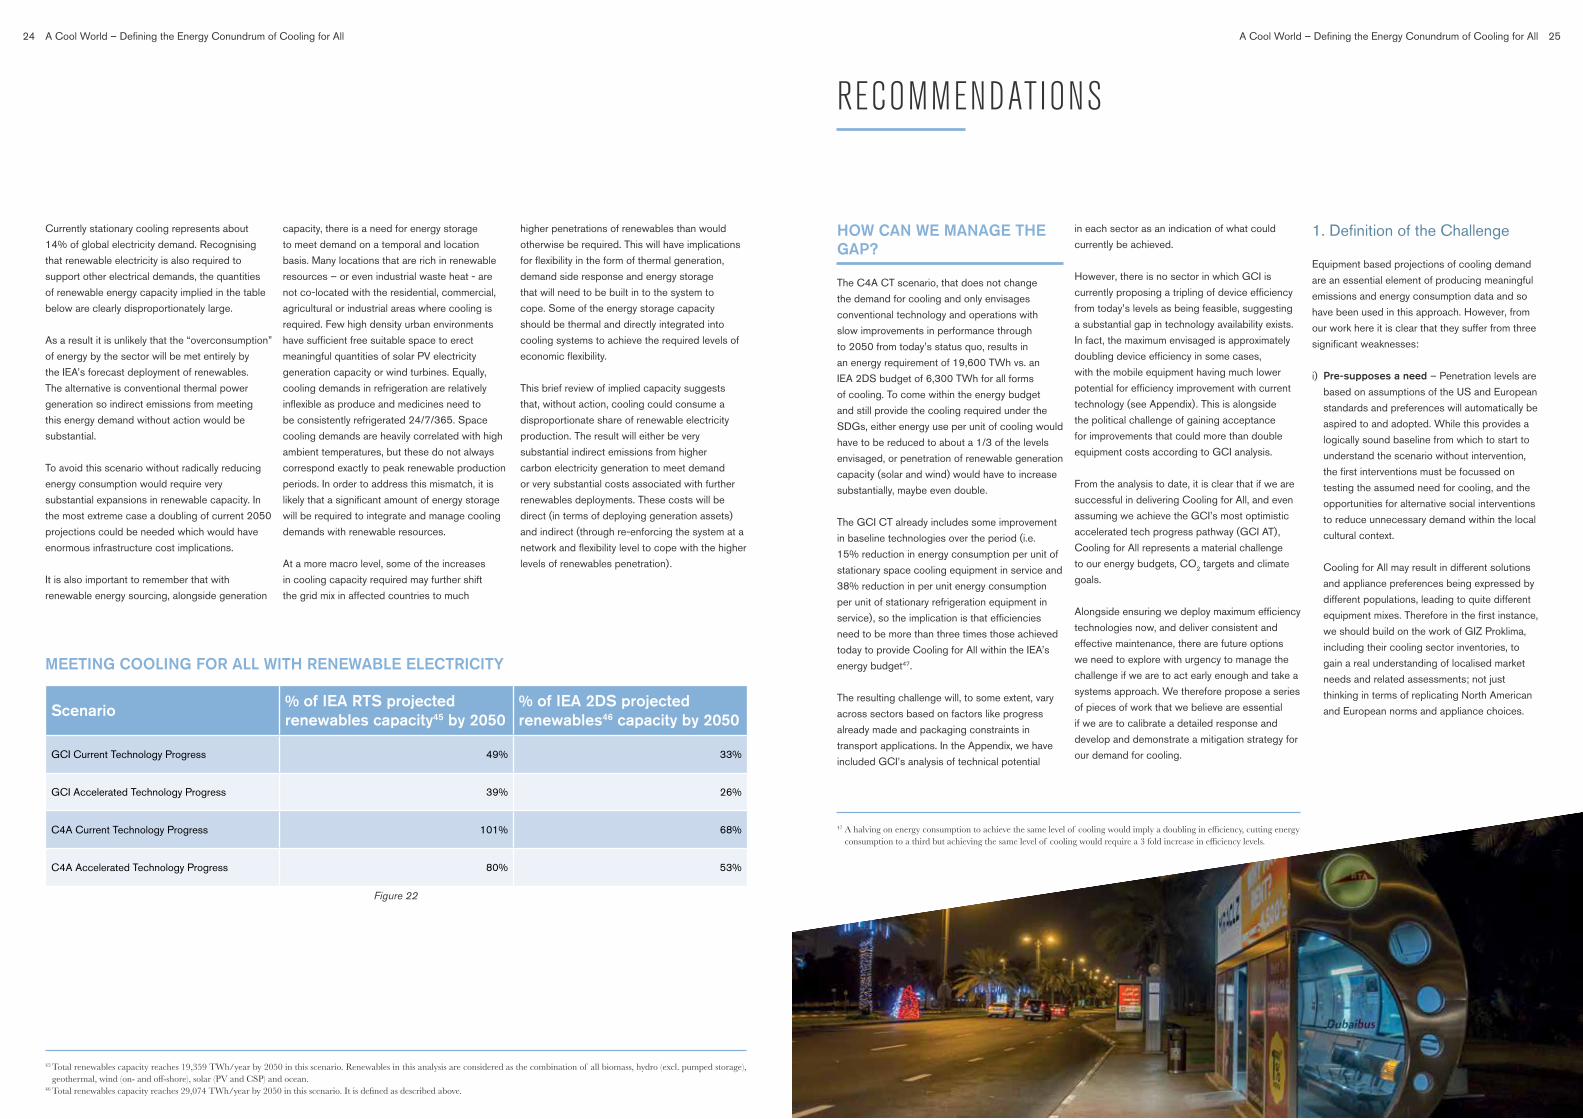
25A Cool World – Defining the Energy Conundrum of Cooling for All24 A Cool World – Defining the Energy Conundrum of Cooling for All
Currently stationary cooling represents about
14% of global electricity demand. Recognising
that renewable electricity is also required to
support other electrical demands, the quantities
of renewable energy capacity implied in the table
below are clearly disproportionately large.
As a result it is unlikely that the “overconsumption”
of energy by the sector will be met entirely by
the IEA’s forecast deployment of renewables.
The alternative is conventional thermal power
generation so indirect emissions from meeting
this energy demand without action would be
substantial.
To avoid this scenario without radically reducing
energy consumption would require very
substantial expansions in renewable capacity. In
the most extreme case a doubling of current 2050
projections could be needed which would have
enormous infrastructure cost implications.
It is also important to remember that with
renewable energy sourcing, alongside generation
capacity, there is a need for energy storage
to meet demand on a temporal and location
basis. Many locations that are rich in renewable
resources – or even industrial waste heat - are
not co-located with the residential, commercial,
agricultural or industrial areas where cooling is
required. Few high density urban environments
have sufficient free suitable space to erect
meaningful quantities of solar PV electricity
generation capacity or wind turbines. Equally,
cooling demands in refrigeration are relatively
inflexible as produce and medicines need to
be consistently refrigerated 24/7/365. Space
cooling demands are heavily correlated with high
ambient temperatures, but these do not always
correspond exactly to peak renewable production
periods. In order to address this mismatch, it is
likely that a significant amount of energy storage
will be required to integrate and manage cooling
demands with renewable resources.
At a more macro level, some of the increases
in cooling capacity required may further shift
the grid mix in affected countries to much
higher penetrations of renewables than would
otherwise be required. This will have implications
for flexibility in the form of thermal generation,
demand side response and energy storage
that will need to be built in to the system to
cope. Some of the energy storage capacity
should be thermal and directly integrated into
cooling systems to achieve the required levels of
economic flexibility.
This brief review of implied capacity suggests
that, without action, cooling could consume a
disproportionate share of renewable electricity
production. The result will either be very
substantial indirect emissions from higher
carbon electricity generation to meet demand
or very substantial costs associated with further
renewables deployments. These costs will be
direct (in terms of deploying generation assets)
and indirect (through re-enforcing the system at a
network and flexibility level to cope with the higher
levels of renewables penetration).
45 Total renewables capacity reaches 19,359 TWh/year by 2050 in this scenario. Renewables in this analysis are considered as the combination of all biomass, hydro (excl. pumped storage), geothermal, wind (on- and off-shore), solar (PV and CSP) and ocean.
46 Total renewables capacity reaches 29,074 TWh/year by 2050 in this scenario. It is defined as described above.
Scenario% of IEA RTS projected renewables capacity45 by 2050
% of IEA 2DS projected renewables46 capacity by 2050
GCI Current Technology Progress 49% 33%
GCI Accelerated Technology Progress 39% 26%
C4A Current Technology Progress 101% 68%
C4A Accelerated Technology Progress 80% 53%
MEETING COOLING FOR ALL WITH RENEWABLE ELECTRICITY
Figure 22
HOW CAN WE MANAGE THE GAP?
The C4A CT scenario, that does not change
the demand for cooling and only envisages
conventional technology and operations with
slow improvements in performance through
to 2050 from today’s status quo, results in
an energy requirement of 19,600 TWh vs. an
IEA 2DS budget of 6,300 TWh for all forms
of cooling. To come within the energy budget
and still provide the cooling required under the
SDGs, either energy use per unit of cooling would
have to be reduced to about a 1/3 of the levels
envisaged, or penetration of renewable generation
capacity (solar and wind) would have to increase
substantially, maybe even double.
The GCI CT already includes some improvement
in baseline technologies over the period (i.e.
15% reduction in energy consumption per unit of
stationary space cooling equipment in service and
38% reduction in per unit energy consumption
per unit of stationary refrigeration equipment in
service), so the implication is that efficiencies
need to be more than three times those achieved
today to provide Cooling for All within the IEA’s
energy budget47.
The resulting challenge will, to some extent, vary
across sectors based on factors like progress
already made and packaging constraints in
transport applications. In the Appendix, we have
included GCI’s analysis of technical potential
in each sector as an indication of what could
currently be achieved.
However, there is no sector in which GCI is
currently proposing a tripling of device efficiency
from today’s levels as being feasible, suggesting
a substantial gap in technology availability exists.
In fact, the maximum envisaged is approximately
doubling device efficiency in some cases,
with the mobile equipment having much lower
potential for efficiency improvement with current
technology (see Appendix). This is alongside
the political challenge of gaining acceptance
for improvements that could more than double
equipment costs according to GCI analysis.
From the analysis to date, it is clear that if we are
successful in delivering Cooling for All, and even
assuming we achieve the GCI’s most optimistic
accelerated tech progress pathway (GCI AT),
Cooling for All represents a material challenge
to our energy budgets, CO2 targets and climate
goals.
Alongside ensuring we deploy maximum efficiency
technologies now, and deliver consistent and
effective maintenance, there are future options
we need to explore with urgency to manage the
challenge if we are to act early enough and take a
systems approach. We therefore propose a series
of pieces of work that we believe are essential
if we are to calibrate a detailed response and
develop and demonstrate a mitigation strategy for
our demand for cooling.
1. Definition of the Challenge
Equipment based projections of cooling demand
are an essential element of producing meaningful
emissions and energy consumption data and so
have been used in this approach. However, from
our work here it is clear that they suffer from three
significant weaknesses:
i) Pre-supposes a need – Penetration levels are
based on assumptions of the US and European
standards and preferences will automatically be
aspired to and adopted. While this provides a
logically sound baseline from which to start to
understand the scenario without intervention,
the first interventions must be focussed on
testing the assumed need for cooling, and the
opportunities for alternative social interventions
to reduce unnecessary demand within the local
cultural context.
Cooling for All may result in different solutions
and appliance preferences being expressed by
different populations, leading to quite different
equipment mixes. Therefore in the first instance,
we should build on the work of GIZ Proklima,
including their cooling sector inventories, to
gain a real understanding of localised market
needs and related assessments; not just
thinking in terms of replicating North American
and European norms and appliance choices.
47 A halving on energy consumption to achieve the same level of cooling would imply a doubling in efficiency, cutting energy consumption to a third but achieving the same level of cooling would require a 3 fold increase in efficiency levels.
RECOMMENDATIONS
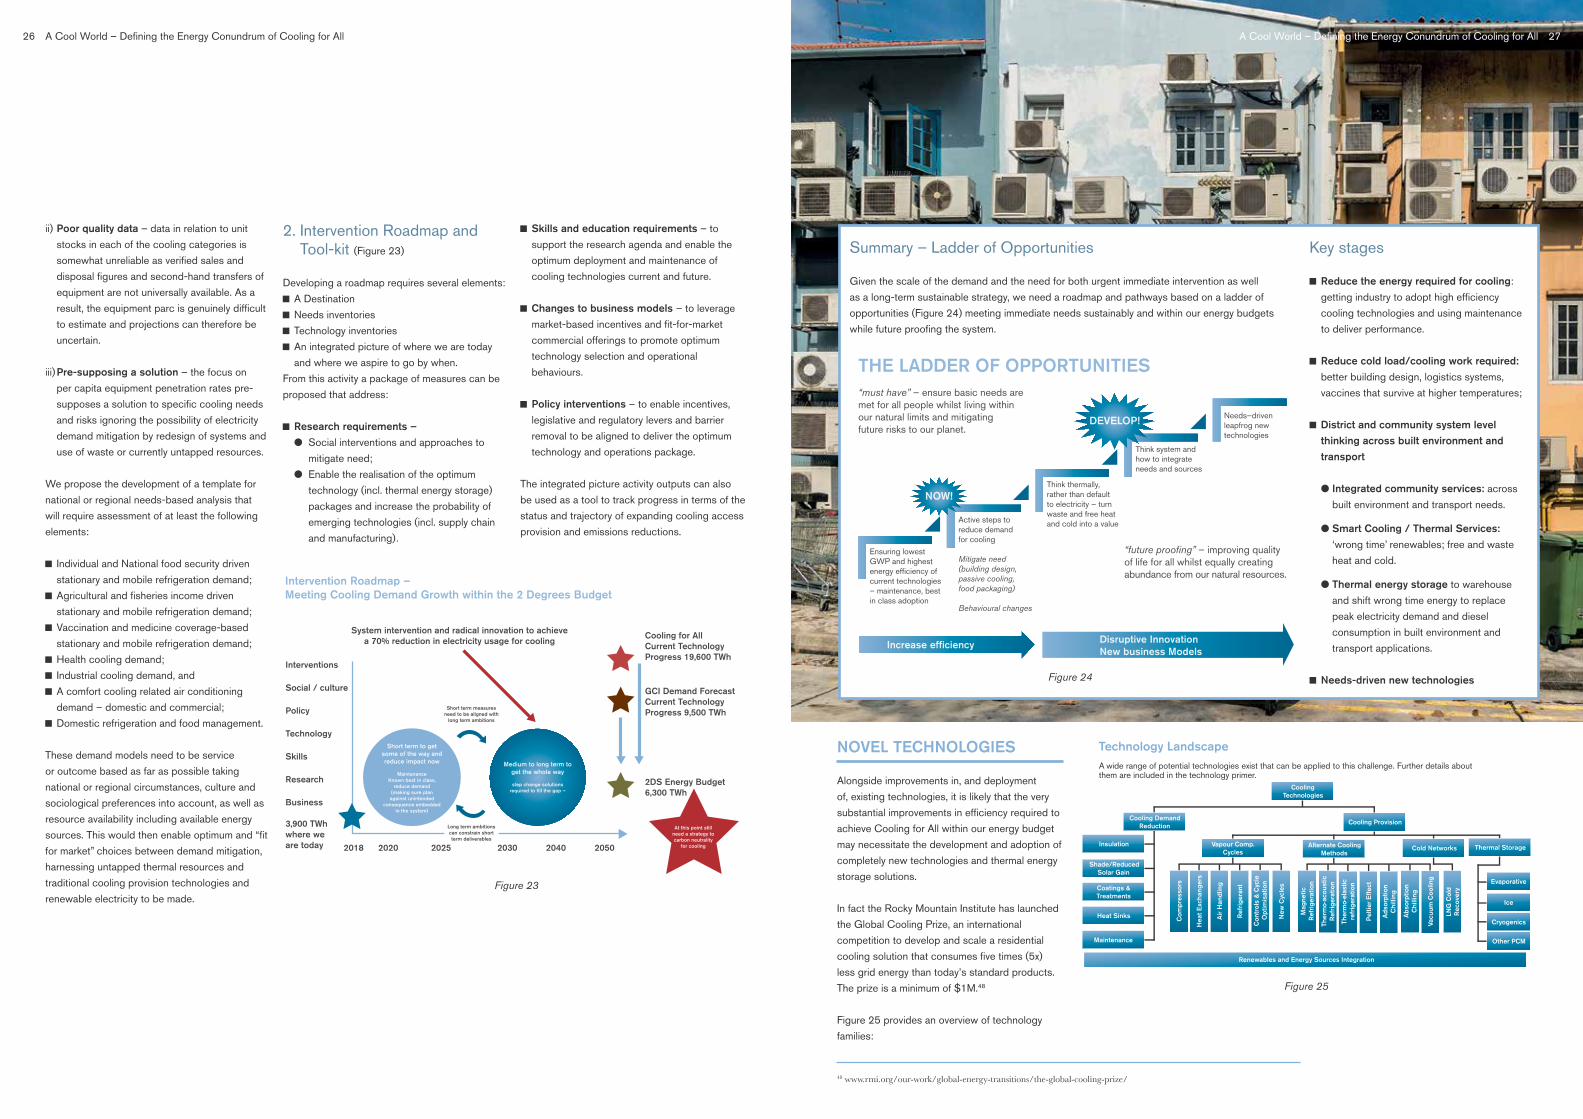
26 A Cool World – Defining the Energy Conundrum of Cooling for All
Summary – Ladder of Opportunities
Given the scale of the demand and the need for both urgent immediate intervention as well
as a long-term sustainable strategy, we need a roadmap and pathways based on a ladder of
opportunities (Figure 24) meeting immediate needs sustainably and within our energy budgets
while future proofing the system.
Key stages
Reduce the energy required for cooling:
getting industry to adopt high efficiency
cooling technologies and using maintenance
to deliver performance.
Reduce cold load/cooling work required:
better building design, logistics systems,
vaccines that survive at higher temperatures;
District and community system level
thinking across built environment and
transport
● Integrated community services: across
built environment and transport needs.
● Smart Cooling / Thermal Services:
‘wrong time’ renewables; free and waste
heat and cold.
● Thermal energy storage to warehouse
and shift wrong time energy to replace
peak electricity demand and diesel
consumption in built environment and
transport applications.
Needs-driven new technologies
THE LADDER OF OPPORTUNITIES“must have” – ensure basic needs aremet for all people whilst living withinour natural limits and mitigatingfuture risks to our planet.
“future proofing” – improving qualityof life for all whilst equally creatingabundance from our natural resources.
Ensuring lowestGWP and highestenergy efficiency ofcurrent technologies– maintenance, bestin class adoption
Active steps toreduce demandfor cooling
Mitigate need(building design,passive cooling,food packaging)
Behavioural changes
Think thermally,rather than defaultto electricity – turnwaste and free heat and cold into a value
Think system andhow to integrate needs and sources
Needs–drivenleapfrog newtechnologies
Increase efficiency Disruptive InnovationNew business Models
NOW!
DEVELOP!
Figure 24
27A Cool World – Defining the Energy Conundrum of Cooling for All
ii) Poor quality data – data in relation to unit
stocks in each of the cooling categories is
somewhat unreliable as verified sales and
disposal figures and second-hand transfers of
equipment are not universally available. As a
result, the equipment parc is genuinely difficult
to estimate and projections can therefore be
uncertain.
iii) Pre-supposing a solution – the focus on
per capita equipment penetration rates pre-
supposes a solution to specific cooling needs
and risks ignoring the possibility of electricity
demand mitigation by redesign of systems and
use of waste or currently untapped resources.
We propose the development of a template for
national or regional needs-based analysis that
will require assessment of at least the following
elements:
Individual and National food security driven
stationary and mobile refrigeration demand;
Agricultural and fisheries income driven
stationary and mobile refrigeration demand;
Vaccination and medicine coverage-based
stationary and mobile refrigeration demand;
Health cooling demand;
Industrial cooling demand, and
A comfort cooling related air conditioning
demand – domestic and commercial;
Domestic refrigeration and food management.
These demand models need to be service
or outcome based as far as possible taking
national or regional circumstances, culture and
sociological preferences into account, as well as
resource availability including available energy
sources. This would then enable optimum and “fit
for market” choices between demand mitigation,
harnessing untapped thermal resources and
traditional cooling provision technologies and
renewable electricity to be made.
2. Intervention Roadmap and Tool-kit (Figure 23)
Developing a roadmap requires several elements:
A Destination
Needs inventories
Technology inventories
An integrated picture of where we are today
and where we aspire to go by when.
From this activity a package of measures can be
proposed that address:
Research requirements –
● Social interventions and approaches to
mitigate need;
● Enable the realisation of the optimum
technology (incl. thermal energy storage)
packages and increase the probability of
emerging technologies (incl. supply chain
and manufacturing).
Skills and education requirements – to
support the research agenda and enable the
optimum deployment and maintenance of
cooling technologies current and future.
Changes to business models – to leverage
market-based incentives and fit-for-market
commercial offerings to promote optimum
technology selection and operational
behaviours.
Policy interventions – to enable incentives,
legislative and regulatory levers and barrier
removal to be aligned to deliver the optimum
technology and operations package.
The integrated picture activity outputs can also
be used as a tool to track progress in terms of the
status and trajectory of expanding cooling access
provision and emissions reductions.
NOVEL TECHNOLOGIES
Alongside improvements in, and deployment
of, existing technologies, it is likely that the very
substantial improvements in efficiency required to
achieve Cooling for All within our energy budget
may necessitate the development and adoption of
completely new technologies and thermal energy
storage solutions.
In fact the Rocky Mountain Institute has launched
the Global Cooling Prize, an international
competition to develop and scale a residential
cooling solution that consumes five times (5x)
less grid energy than today’s standard products.
The prize is a minimum of $1M.48
Figure 25 provides an overview of technology
families:
Technology LandscapeA wide range of potential technologies exist that can be applied to this challenge. Further details about them are included in the technology primer.
Cooling Technologies
Cooling Demand Reduction
Insulation
Shade/Reduced Solar Gain
Coatings & Treatments
Heat Sinks
Vapour Comp. Cycles
Alternate Cooling Methods
Cold Networks Thermal Storage
Com
pres
sors
Hea
t Exc
hang
ers
Air
Han
dlin
g
Ref
rige
rant
Con
trol
s &
Cyc
le
Opt
imis
atio
n
New
Cyc
les
Ads
orpt
ion
Chi
lling
Abs
orpt
ion
Chi
lling
Mag
netic
R
efri
gera
tion
Ther
mo-
acou
stic
R
efri
gera
tion
Ther
mo-
elas
tic
refr
iger
atio
n
Pel
tier
Eff
ect
Renewables and Energy Sources Integration
Ice
Evaporative
Cryogenics
Other PCM
LNG
Col
d R
ecov
ery
Vacu
um C
oolin
g
Maintenance
Cooling Provision
Figure 25
Intervention Roadmap –Meeting Cooling Demand Growth within the 2 Degrees Budget
System intervention and radical innovation to achievea 70% reduction in electricity usage for cooling
Cooling for AllCurrent Technology Progress 19,600 TWh
GCI Demand ForecastCurrent Technology Progress 9,500 TWh
Interventions
Social / culture
Policy
Technology
Skills
Research
Business
3,900 TWhwhere weare today
2DS Energy Budget6,300 TWh
Short term measuresneed to be aligned with
long term ambitions
Long term ambitionscan constrain shortterm deliverables
2018 2020 2025 2030 2040 2050
Short term to getsome of the way andreduce impact now
MaintenanceKnown best in class,
reduce demand(making sure planagainst unintended
consequence embeddedin the system)
Medium to long term toget the whole way
step change solutionsrequired to fill the gap –
At this point stillneed a strategy tocarbon neutrality
for cooling
48 www.rmi.org/our-work/global-energy-transitions/the-global-cooling-prize/
Figure 23
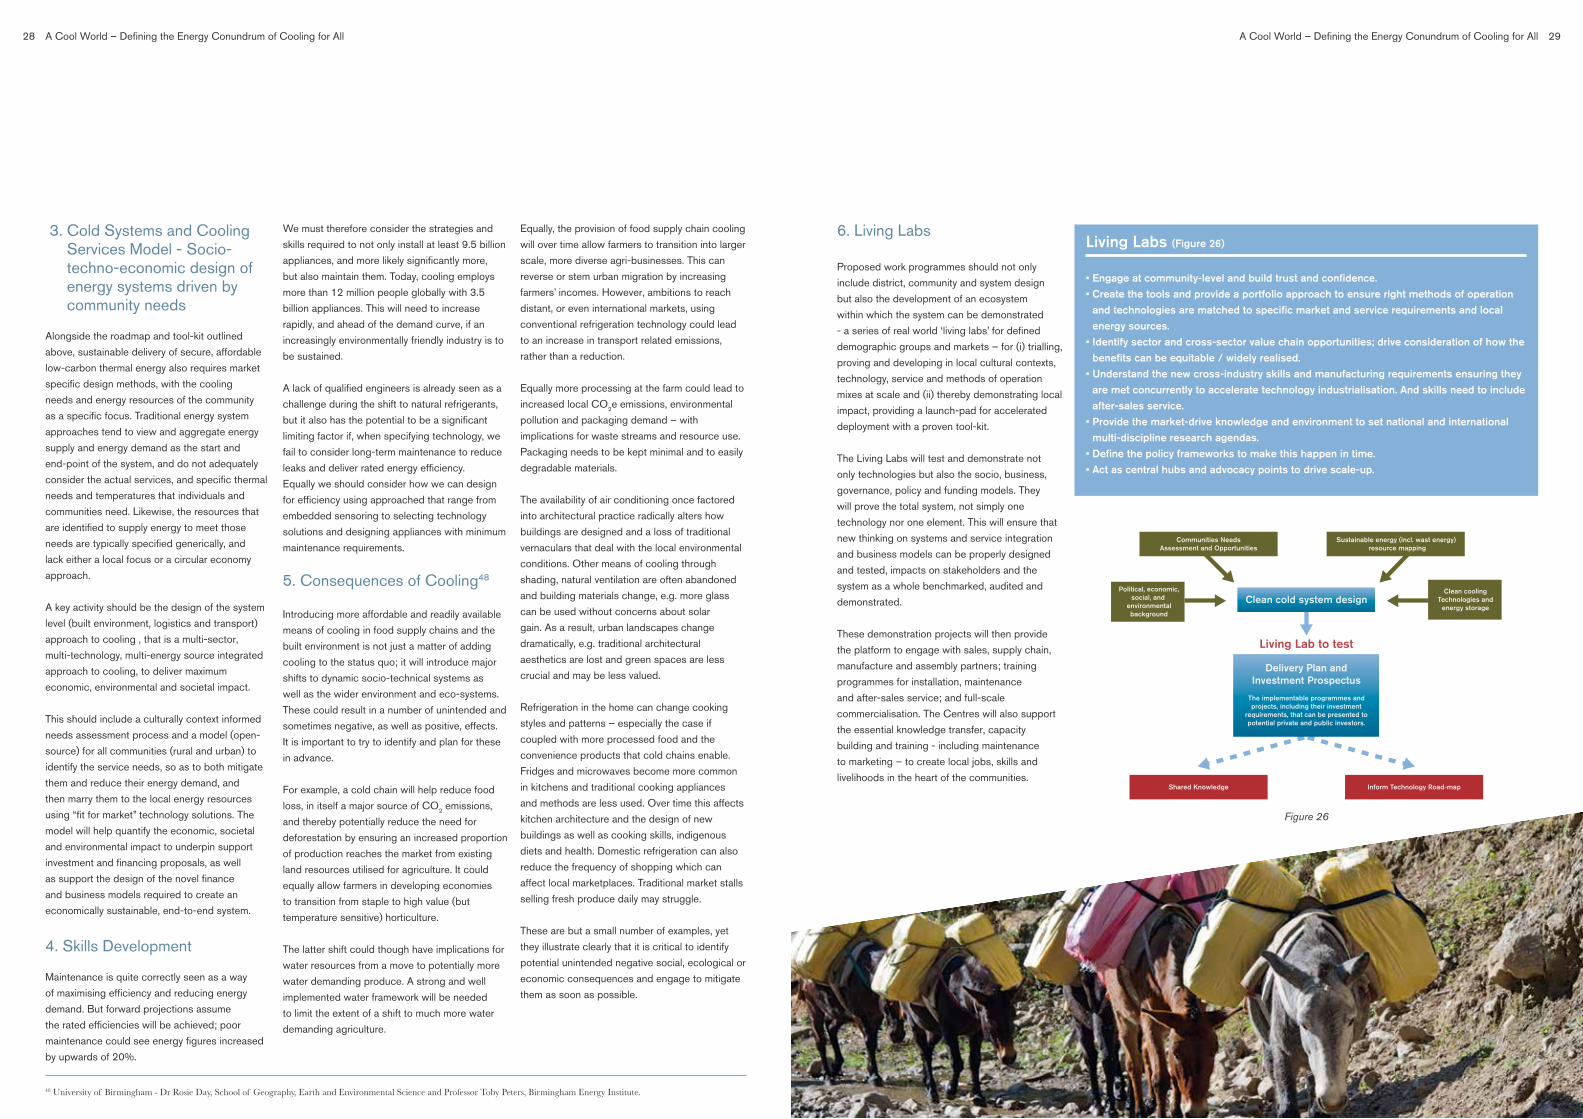
29A Cool World – Defining the Energy Conundrum of Cooling for All28 A Cool World – Defining the Energy Conundrum of Cooling for All
3. Cold Systems and Cooling Services Model - Socio-techno-economic design of energy systems driven by community needs
Alongside the roadmap and tool-kit outlined
above, sustainable delivery of secure, affordable
low-carbon thermal energy also requires market
specific design methods, with the cooling
needs and energy resources of the community
as a specific focus. Traditional energy system
approaches tend to view and aggregate energy
supply and energy demand as the start and
end-point of the system, and do not adequately
consider the actual services, and specific thermal
needs and temperatures that individuals and
communities need. Likewise, the resources that
are identified to supply energy to meet those
needs are typically specified generically, and
lack either a local focus or a circular economy
approach.
A key activity should be the design of the system
level (built environment, logistics and transport)
approach to cooling , that is a multi-sector,
multi-technology, multi-energy source integrated
approach to cooling, to deliver maximum
economic, environmental and societal impact.
This should include a culturally context informed
needs assessment process and a model (open-
source) for all communities (rural and urban) to
identify the service needs, so as to both mitigate
them and reduce their energy demand, and
then marry them to the local energy resources
using “fit for market” technology solutions. The
model will help quantify the economic, societal
and environmental impact to underpin support
investment and financing proposals, as well
as support the design of the novel finance
and business models required to create an
economically sustainable, end-to-end system.
4. Skills Development
Maintenance is quite correctly seen as a way
of maximising efficiency and reducing energy
demand. But forward projections assume
the rated efficiencies will be achieved; poor
maintenance could see energy figures increased
by upwards of 20%.
We must therefore consider the strategies and
skills required to not only install at least 9.5 billion
appliances, and more likely significantly more,
but also maintain them. Today, cooling employs
more than 12 million people globally with 3.5
billion appliances. This will need to increase
rapidly, and ahead of the demand curve, if an
increasingly environmentally friendly industry is to
be sustained.
A lack of qualified engineers is already seen as a
challenge during the shift to natural refrigerants,
but it also has the potential to be a significant
limiting factor if, when specifying technology, we
fail to consider long-term maintenance to reduce
leaks and deliver rated energy efficiency.
Equally we should consider how we can design
for efficiency using approached that range from
embedded sensoring to selecting technology
solutions and designing appliances with minimum
maintenance requirements.
5. Consequences of Cooling48
Introducing more affordable and readily available
means of cooling in food supply chains and the
built environment is not just a matter of adding
cooling to the status quo; it will introduce major
shifts to dynamic socio-technical systems as
well as the wider environment and eco-systems.
These could result in a number of unintended and
sometimes negative, as well as positive, effects.
It is important to try to identify and plan for these
in advance.
For example, a cold chain will help reduce food
loss, in itself a major source of CO2 emissions,
and thereby potentially reduce the need for
deforestation by ensuring an increased proportion
of production reaches the market from existing
land resources utilised for agriculture. It could
equally allow farmers in developing economies
to transition from staple to high value (but
temperature sensitive) horticulture.
The latter shift could though have implications for
water resources from a move to potentially more
water demanding produce. A strong and well
implemented water framework will be needed
to limit the extent of a shift to much more water
demanding agriculture.
Equally, the provision of food supply chain cooling
will over time allow farmers to transition into larger
scale, more diverse agri-businesses. This can
reverse or stem urban migration by increasing
farmers’ incomes. However, ambitions to reach
distant, or even international markets, using
conventional refrigeration technology could lead
to an increase in transport related emissions,
rather than a reduction.
Equally more processing at the farm could lead to
increased local CO2e emissions, environmental
pollution and packaging demand – with
implications for waste streams and resource use.
Packaging needs to be kept minimal and to easily
degradable materials.
The availability of air conditioning once factored
into architectural practice radically alters how
buildings are designed and a loss of traditional
vernaculars that deal with the local environmental
conditions. Other means of cooling through
shading, natural ventilation are often abandoned
and building materials change, e.g. more glass
can be used without concerns about solar
gain. As a result, urban landscapes change
dramatically, e.g. traditional architectural
aesthetics are lost and green spaces are less
crucial and may be less valued.
Refrigeration in the home can change cooking
styles and patterns – especially the case if
coupled with more processed food and the
convenience products that cold chains enable.
Fridges and microwaves become more common
in kitchens and traditional cooking appliances
and methods are less used. Over time this affects
kitchen architecture and the design of new
buildings as well as cooking skills, indigenous
diets and health. Domestic refrigeration can also
reduce the frequency of shopping which can
affect local marketplaces. Traditional market stalls
selling fresh produce daily may struggle.
These are but a small number of examples, yet
they illustrate clearly that it is critical to identify
potential unintended negative social, ecological or
economic consequences and engage to mitigate
them as soon as possible.
6. Living Labs
Proposed work programmes should not only
include district, community and system design
but also the development of an ecosystem
within which the system can be demonstrated
- a series of real world ‘living labs’ for defined
demographic groups and markets – for (i) trialling,
proving and developing in local cultural contexts,
technology, service and methods of operation
mixes at scale and (ii) thereby demonstrating local
impact, providing a launch-pad for accelerated
deployment with a proven tool-kit.
The Living Labs will test and demonstrate not
only technologies but also the socio, business,
governance, policy and funding models. They
will prove the total system, not simply one
technology nor one element. This will ensure that
new thinking on systems and service integration
and business models can be properly designed
and tested, impacts on stakeholders and the
system as a whole benchmarked, audited and
demonstrated.
These demonstration projects will then provide
the platform to engage with sales, supply chain,
manufacture and assembly partners; training
programmes for installation, maintenance
and after-sales service; and full-scale
commercialisation. The Centres will also support
the essential knowledge transfer, capacity
building and training - including maintenance
to marketing – to create local jobs, skills and
livelihoods in the heart of the communities.
Living Lab to test
Delivery Plan andInvestment Prospectus
The implementable programmes andprojects, including their investment
requirements, that can be presented topotential private and public investors.
Political, economic,social, and
environmentalbackground
Clean coolingTechnologies and
energy storage
Communities NeedsAssessment and Opportunities
Sustainable energy (incl. wast energy) resource mapping
Clean cold system design
Shared Knowledge Inform Technology Road-map
Living Labs (Figure 26)
• Engage at community-level and build trust and confidence.
• Create the tools and provide a portfolio approach to ensure right methods of operation
and technologies are matched to specific market and service requirements and local
energy sources.
• Identify sector and cross-sector value chain opportunities; drive consideration of how the
benefits can be equitable / widely realised.
• Understand the new cross-industry skills and manufacturing requirements ensuring they
are met concurrently to accelerate technology industrialisation. And skills need to include
after-sales service.
• Provide the market-drive knowledge and environment to set national and international
multi-discipline research agendas.
• Define the policy frameworks to make this happen in time.
• Act as central hubs and advocacy points to drive scale-up.
48 University of Birmingham - Dr Rosie Day, School of Geography, Earth and Environmental Science and Professor Toby Peters, Birmingham Energy Institute.
Figure 26
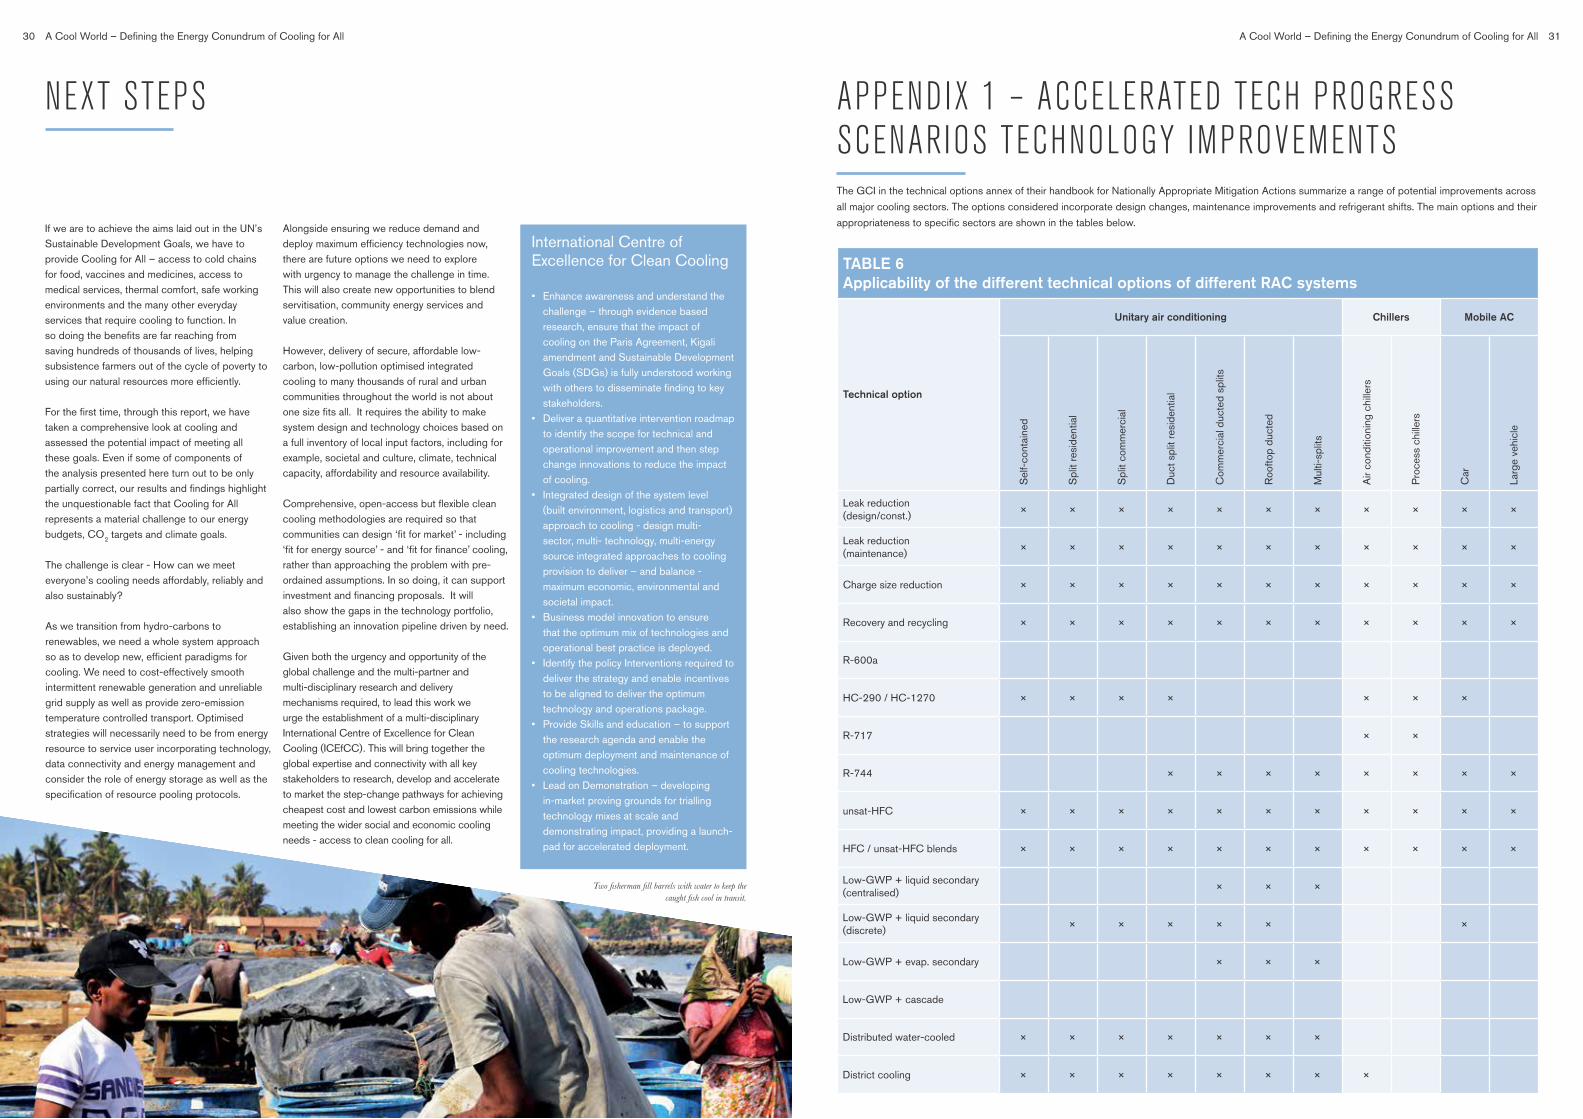
31A Cool World – Defining the Energy Conundrum of Cooling for All30 A Cool World – Defining the Energy Conundrum of Cooling for All
APPENDIX 1 – ACCELERATED TECH PROGRESS SCENARIOS TECHNOLOGY IMPROVEMENTS
TABLE 6Applicability of the different technical options of different RAC systems
Technical option
Unitary air conditioning Chillers Mobile AC
Sel
f-co
ntai
ned
Spl
it re
side
ntia
l
Spl
it co
mm
erci
al
Duc
t spl
it re
side
ntia
l
Com
mer
cial
duc
ted
split
s
Roo
ftop
duct
ed
Mul
ti-sp
lits
Air
cond
ition
ing
chill
ers
Pro
cess
chi
llers
Car
Larg
e ve
hicl
e
Leak reduction(design/const.)
× × × × × × × × × × ×
Leak reduction(maintenance)
× × × × × × × × × × ×
Charge size reduction × × × × × × × × × × ×
Recovery and recycling × × × × × × × × × × ×
R-600a
HC-290 / HC-1270 × × × × × × ×
R-717 × ×
R-744 × × × × × × × ×
unsat-HFC × × × × × × × × × × ×
HFC / unsat-HFC blends × × × × × × × × × × ×
Low-GWP + liquid secondary(centralised)
× × ×
Low-GWP + liquid secondary(discrete)
× × × × × ×
Low-GWP + evap. secondary × × ×
Low-GWP + cascade
Distributed water-cooled × × × × × × ×
District cooling × × × × × × × ×
The GCI in the technical options annex of their handbook for Nationally Appropriate Mitigation Actions summarize a range of potential improvements across
all major cooling sectors. The options considered incorporate design changes, maintenance improvements and refrigerant shifts. The main options and their
appropriateness to specific sectors are shown in the tables below.If we are to achieve the aims laid out in the UN’s Sustainable Development Goals, we have to provide Cooling for All – access to cold chains for food, vaccines and medicines, access to medical services, thermal comfort, safe working environments and the many other everyday services that require cooling to function. In so doing the benefits are far reaching from saving hundreds of thousands of lives, helping subsistence farmers out of the cycle of poverty to using our natural resources more efficiently.
For the first time, through this report, we have taken a comprehensive look at cooling and assessed the potential impact of meeting all these goals. Even if some of components of the analysis presented here turn out to be only partially correct, our results and findings highlight the unquestionable fact that Cooling for All represents a material challenge to our energy budgets, CO
2 targets and climate goals.
The challenge is clear - How can we meet everyone’s cooling needs affordably, reliably and also sustainably?
As we transition from hydro-carbons to renewables, we need a whole system approach so as to develop new, efficient paradigms for cooling. We need to cost-effectively smooth intermittent renewable generation and unreliable grid supply as well as provide zero-emission temperature controlled transport. Optimised strategies will necessarily need to be from energy resource to service user incorporating technology, data connectivity and energy management and consider the role of energy storage as well as the specification of resource pooling protocols.
Alongside ensuring we reduce demand and deploy maximum efficiency technologies now, there are future options we need to explore with urgency to manage the challenge in time. This will also create new opportunities to blend servitisation, community energy services and value creation.
However, delivery of secure, affordable low-carbon, low-pollution optimised integrated cooling to many thousands of rural and urban communities throughout the world is not about one size fits all. It requires the ability to make system design and technology choices based on a full inventory of local input factors, including for example, societal and culture, climate, technical capacity, affordability and resource availability.
Comprehensive, open-access but flexible clean cooling methodologies are required so that communities can design ‘fit for market’ - including ‘fit for energy source’ - and ‘fit for finance’ cooling, rather than approaching the problem with pre-ordained assumptions. In so doing, it can support investment and financing proposals. It will also show the gaps in the technology portfolio, establishing an innovation pipeline driven by need.
Given both the urgency and opportunity of the global challenge and the multi-partner and multi-disciplinary research and delivery mechanisms required, to lead this work we urge the establishment of a multi-disciplinary International Centre of Excellence for Clean Cooling (ICEfCC). This will bring together the global expertise and connectivity with all key stakeholders to research, develop and accelerate to market the step-change pathways for achieving cheapest cost and lowest carbon emissions while meeting the wider social and economic cooling needs - access to clean cooling for all.
NEXT STEPS
International Centre of Excellence for Clean Cooling
• Enhance awareness and understand the challenge – through evidence based research, ensure that the impact of cooling on the Paris Agreement, Kigali amendment and Sustainable Development Goals (SDGs) is fully understood working with others to disseminate finding to key stakeholders.
• Deliver a quantitative intervention roadmap to identify the scope for technical and operational improvement and then step change innovations to reduce the impact of cooling.
• Integrated design of the system level (built environment, logistics and transport) approach to cooling - design multi-sector, multi- technology, multi-energy source integrated approaches to cooling provision to deliver – and balance - maximum economic, environmental and societal impact.
• Business model innovation to ensure that the optimum mix of technologies and operational best practice is deployed.
• Identify the policy Interventions required to deliver the strategy and enable incentives to be aligned to deliver the optimum technology and operations package.
• Provide Skills and education – to support the research agenda and enable the optimum deployment and maintenance of cooling technologies.
• Lead on Demonstration – developing in-market proving grounds for trialling technology mixes at scale and demonstrating impact, providing a launch-pad for accelerated deployment.
Two fisherman fill barrels with water to keep the caught fish cool in transit.
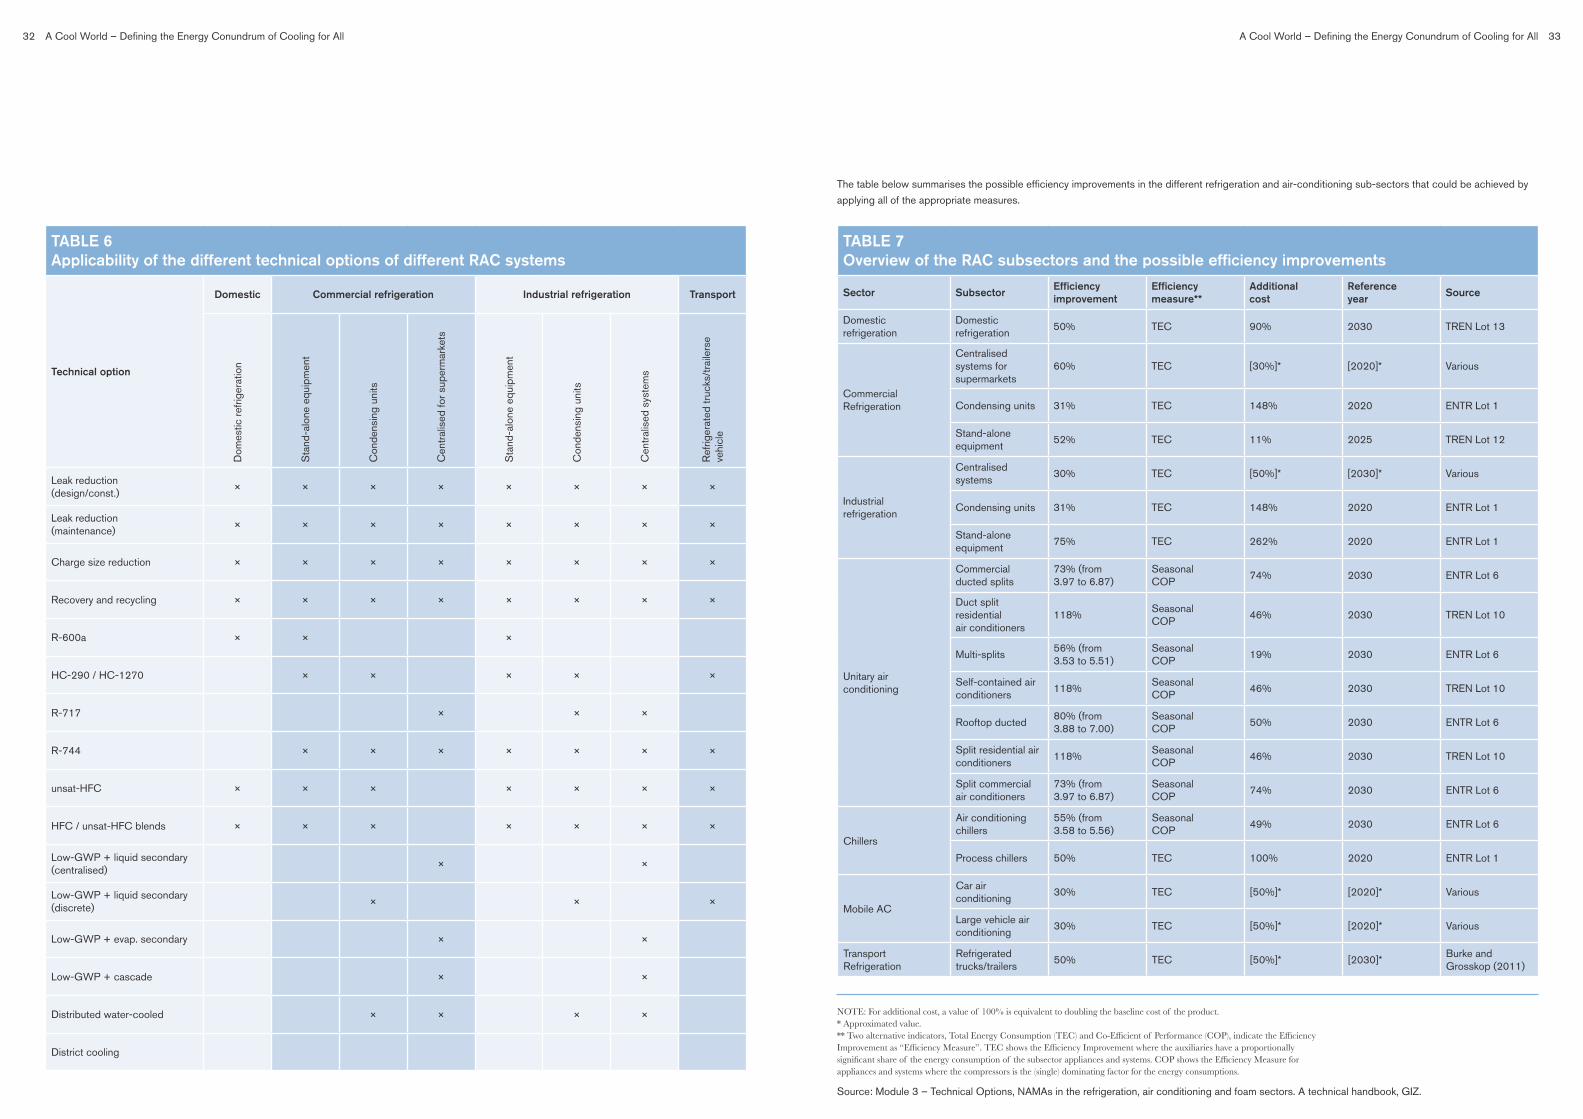
33A Cool World – Defining the Energy Conundrum of Cooling for All32 A Cool World – Defining the Energy Conundrum of Cooling for All
TABLE 6Applicability of the different technical options of different RAC systems
Technical option
Domestic Commercial refrigeration Industrial refrigeration Transport
Dom
estic
refri
gera
tion
Sta
nd-a
lone
equ
ipm
ent
Con
dens
ing
units
Cen
tral
ised
for s
uper
mar
kets
Sta
nd-a
lone
equ
ipm
ent
Con
dens
ing
units
Cen
tral
ised
sys
tem
s
Ref
riger
ated
truc
ks/t
raile
rse
vehi
cle
Leak reduction(design/const.)
× × × × × × × ×
Leak reduction(maintenance)
× × × × × × × ×
Charge size reduction × × × × × × × ×
Recovery and recycling × × × × × × × ×
R-600a × × ×
HC-290 / HC-1270 × × × × ×
R-717 × × ×
R-744 × × × × × × ×
unsat-HFC × × × × × × ×
HFC / unsat-HFC blends × × × × × × ×
Low-GWP + liquid secondary(centralised)
× ×
Low-GWP + liquid secondary(discrete)
× × ×
Low-GWP + evap. secondary × ×
Low-GWP + cascade × ×
Distributed water-cooled × × × ×
District cooling
The table below summarises the possible efficiency improvements in the different refrigeration and air-conditioning sub-sectors that could be achieved by
applying all of the appropriate measures.
Source: Module 3 – Technical Options, NAMAs in the refrigeration, air conditioning and foam sectors. A technical handbook, GIZ.
NOTE: For additional cost, a value of 100% is equivalent to doubling the baseline cost of the product. * Approximated value. ** Two alternative indicators, Total Energy Consumption (TEC) and Co-Efficient of Performance (COP), indicate the Efficiency Improvement as “Efficiency Measure”. TEC shows the Efficiency Improvement where the auxiliaries have a proportionally significant share of the energy consumption of the subsector appliances and systems. COP shows the Efficiency Measure for appliances and systems where the compressors is the (single) dominating factor for the energy consumptions.
TABLE 7Overview of the RAC subsectors and the possible efficiency improvements
Sector SubsectorEfficiencyimprovement
Efficiencymeasure**
Additionalcost
Referenceyear
Source
Domesticrefrigeration
Domestic refrigeration
50% TEC 90% 2030 TREN Lot 13
CommercialRefrigeration
Centralised systems for supermarkets
60% TEC [30%]* [2020]* Various
Condensing units 31% TEC 148% 2020 ENTR Lot 1
Stand-aloneequipment
52% TEC 11% 2025 TREN Lot 12
Industrialrefrigeration
Centralised systems
30% TEC [50%]* [2030]* Various
Condensing units 31% TEC 148% 2020 ENTR Lot 1
Stand-aloneequipment
75% TEC 262% 2020 ENTR Lot 1
Unitary airconditioning
Commercial ducted splits
73% (from3.97 to 6.87)
SeasonalCOP
74% 2030 ENTR Lot 6
Duct split residentialair conditioners
118%SeasonalCOP
46% 2030 TREN Lot 10
Multi-splits56% (from3.53 to 5.51)
SeasonalCOP
19% 2030 ENTR Lot 6
Self-contained airconditioners
118%SeasonalCOP
46% 2030 TREN Lot 10
Rooftop ducted80% (from3.88 to 7.00)
SeasonalCOP
50% 2030 ENTR Lot 6
Split residential airconditioners
118%SeasonalCOP
46% 2030 TREN Lot 10
Split commercial air conditioners
73% (from3.97 to 6.87)
SeasonalCOP
74% 2030 ENTR Lot 6
Chillers
Air conditioningchillers
55% (from3.58 to 5.56)
SeasonalCOP
49% 2030 ENTR Lot 6
Process chillers 50% TEC 100% 2020 ENTR Lot 1
Mobile AC
Car air conditioning
30% TEC [50%]* [2020]* Various
Large vehicle airconditioning
30% TEC [50%]* [2020]* Various
TransportRefrigeration
Refrigerated trucks/trailers
50% TEC [50%]* [2030]*Burke andGrosskop (2011)

Edgbaston, Birmingham, B15 2TT, United Kingdom, www.birmingham.ac.uk
#ColdEconomy
https://www.birmingham.ac.uk/coldeconomy
Designed by SCS MarketingEditorial support provided by Karen Dehal, Sam Peters and Priyanka Sharma


![[PPT]The regulatory conundrum: achieving effective …acmd.com.bd/docs/Siddiqui, 2015. The regulatory conundrum... · Web viewThe regulatory conundrum: achieving effective corporate](https://img.pdfslide.us/doc/110x75/5aa627577f8b9a7c1a8e58e9/pptthe-regulatory-conundrum-achieving-effective-acmdcombddocssiddiqui.jpg)