Embed Size (px)
Citation preview
213 IEEE TRANSACTIONS ON INSTRUMENTATION AND MEASUREMENT, VOL. 42, NO 2. APRIL 1993
A Convenient Self-checking Method for the Automated Microwave Measurement
of p and E Peter I. Somlo, Fellow, ZEEE
Abstract-A convenient, automated, self-checking method for the determination of the complex permeability /A, and permit- tivity e, is described. The sample partially fills a section of waveguide or coaxial line, and the sample length has to be known only to the nearest quarter-wavelength in air.
I. INTRODUCTION HE art of measuring complex p and E is well estab- T lished, and a large number of references may be found
in [ 11. The novel feature of this work is the particular use of an automatic network analyzer (ANA) to measure the S-parameters of a convenient sample holder, a plain waveguide, partially filled with the sample along its length. The ANA is capable of performing measurements rapidly at a relatively large number of frequencies, and this allows statistical means to be used to determine the confidence that can be placed on the results.
11. MEASUREMENT SYSTEM The measurements can be carried out in waveguide or
in coaxial line. Since the implementation of the wave- guide measurement is simpler, it is described first.
With reference to Fig. 1, port one of the ANA is con- nected to a coaxial/waveguide adaptor which is followed by a section of plain waveguide. The waveguide has a (nominally) quarter-wave long plug of PTFE placed in it so that one side of the plug is flush with the outer flange of the waveguide. This plane a is one of the ports between which the two-port measurement is camed out. (The use of such a plug is acceptable if the waveguide is operated in its fundamental TE mode, because the electric field will remain transverse on both sides of the PTFE/sample in- terface, and the PTFE is nonmagnetic.)
A coaxial/waveguide adaptor is connected to the other port of the ANA, and its flange b is the second port for the two-port measurement’.
The sample (liquid, powder, or tightly fitting solid) is placed into a plain waveguide which is connected between the two measurement planes, with one end of the sample
Manuscript received June 10, 1992; revised August 12, 1992. The author is with the CSIRO Division of Applied Physics, National
IEEE Log Number 9207002. Measurement Laboratory, Lindfield, N.S.W. 2070, Australia.
‘What is not shown in Fig. 1 is a section of waveguide permanently attached to the “upper” adapter, so that the evanescent modes set up by the adapter decay before reaching measurement plane b.
ANA port 2
b _ _ _ _ /
ANA port I
Fig. I . Components of the measurement setup in waveguide. The PTFE plug allows the sample to be flush with measurement plane ‘a’. Measure- ment plane ‘b’ is at the other end of the partially filled waveguide section.
hard against the PTFE plug (the waveguide structure is set up vertically to cater for liquid samples). The mea- surement method was devised so that the sample would only partially fill the measurement waveguide, as shown in Fig. 1. This arrangement is very convenient because while the length of the sample need not be known accu- rately, repeated measurements on samples can be carried out using different sample lengths without requiring new hardware. For instance, liquid samples may be pumped in through a small nonreflecting hole near the bottom, and the sample height may be varied between measurements without disassembly. The ability to vary the sample length is beneficial, because if the sample is too short, there is insufficient impedance transformation through it to offer good definition. If it is too long, the attenuation may be so great that usable information can be obtained only from the reflection parameters, also leading to poor definition. Furthermore, low-loss samples should not be multiples of a hal-f-wavelength long.
The ANA is calibrated between the two reference planes a and b, preferably using the TRL (“through-reflect- line”) method, which requires only a flush short circuit and a precision waveguide spacer. After calibration, the measurement waveguide containing the sample is inserted between the two reference planes, and the S parameters of the composite (sample and air) section are measured.
111. THEORY The signal flow-graph of the composite measurement
waveguide is shown in Fig. 2, with the S parameters of the sample section and air section denoted by Aij and Bij
0018-9456/93$03.00 0 1993 IEEE
1 I 214 IEEE TRANSACTIONS ON INSTRUMENTATION AND MEASUREMENT, VOL. 42, NO. 2, APRIL 1993
! p
4, E * /
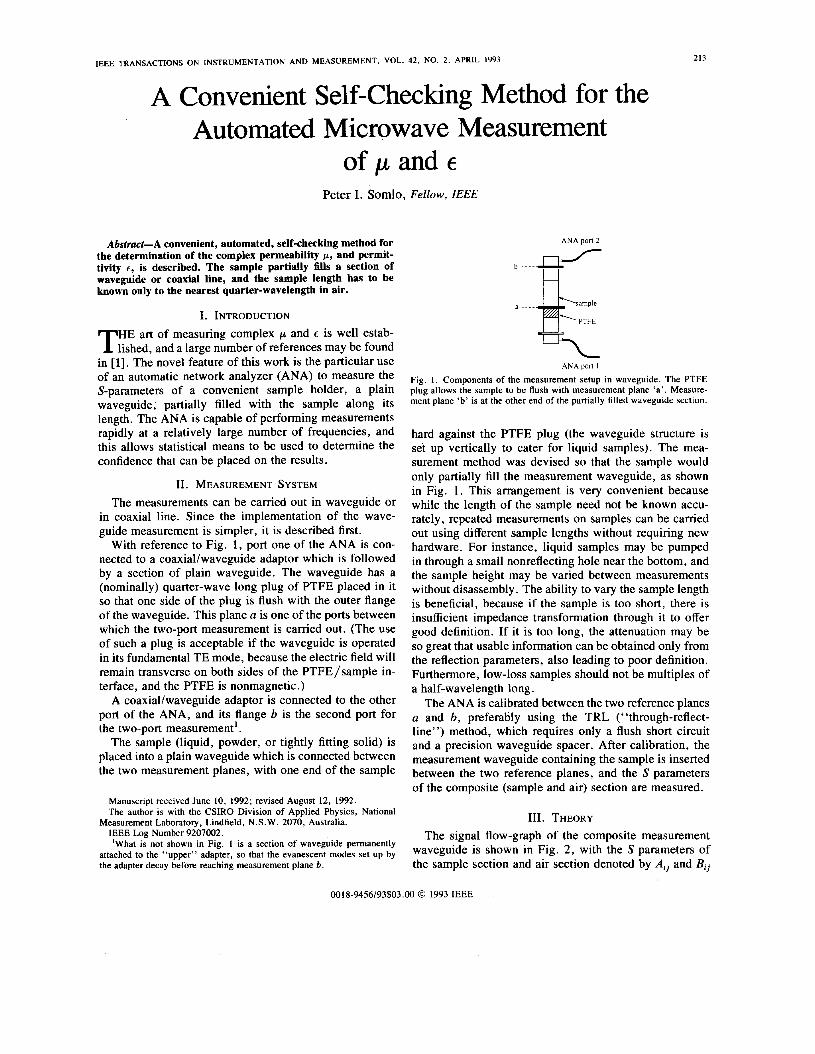
Fig. 2. Signal flow-graph of the composite of the sample-filled portion, A , and the air-filled portion, B, of the waveguide in which overall S parame- ters are measured.
respectively. Since both sections are symmetrical and re- ciprocal, only the subscripts 1 1 and 2 1 are necessary. The S parameters of the composite section are given by
quencies are recalculated with additional multiples of 27r introduced as necessary to ensure electrical length mo- notonicity with frequency. Ideally, this computed length should be a constant, and its variation is used as a measure of checking the overall quality of the measurement.
For a coaxial line, if the PTFE plug were positioned as shown in Fig. 1 then liquid or powder samples may enter between the current carrying conductors of the connector and result in unpredictable behavior. To overcome this, a coaxial line section is equipped with a PTFE plug, the bottom of which is flush with the “beadless” connector plane. Then firstly, a measurement is carried out with the sample absent to find the effective length and the S param- eters, ST, of the plug. The sample is then introduced, and the overall S parameters So are measured. The transmis- sion parameters TT and To are calculated from ST and So, respectively, and hence the transmission parameters T = TT/To of the sample-air composite, leading to So. From here on, the analysis proceeds as for the waveguide case.
The computation of p, and E , of the sample follows the method given in [2] with some minor changes. From the parameters A, and the length of the sample lS , the reflec- tion coefficient of a sample of infinite length is calculated
The air-filled section is plain waveguide of length la , where
(7) and for which the propagation constant y is known. Hence A:, - A;1 + 1
2Al I B l l = 0, and B21 = exp ( - ?la), and X =
from which pr and E, are calculated using (2) All = SI1
As (3) shows, the length of the air-filled section may and also be calculated
1 la = In (S22/SIl) (4) A
- 2 7 *
This implies that neither the sample length, l,, nor the air-filled length, la need be known2. If the length of the measuring waveguide, lg is determined once, the length of the sample is given by (4) and
1, = lg - la. (5) The calculation of la in (4) requires special considera-
tion. Because 3m( In (S22/Sll)) is periodic in 27r, la is multi-valued. To resolve this ambiguity, at the lowest fre- quency, the approximately known air-length (which is to be estimated only to the nearest quarter wavelength) is compared to the computed length, 1, and the integer mul- tiple of 27r is found which is to be added to the argument. With the electrical length thus corrected at the lowest fre- quency, the electrical lengths at all the measurement fre-
i + r I’
Having calculated p r and er , the propagation properties of the filled section may be calculated as
where
k: = p,E,k;; k ; = W ~ ~ O E O ; 7: = ( T / u ) ~ - k i (12)
and a is the width of the guide. It has been found that for nonmagnetic materials greater
accuracy in E, is obtained if p, is set to 1 + j0 initially, to avoid the numerical noise in calculating p, (from (10)) affecting the value of E,. (Similarly, in the procedure de-
of 1 /P in (9), the number of half wavelengths in the sam-
’Because the air-filled section is loss free, y = j p and l SZ2 I = I s,, I, hence both the numerator and denominator of (4) are purely imaginary, scribed above for by taking the logarithm resulting in a real value for I , .
SOMLO: A CONVENIENT SELF-CHECKING METHOD
I I
215
mean43.649 mm, std.devA.028 mm
+ + + +
2.6 2.8 3.0 3.2 3.4 3.6 3.0 4.0
Frequency (GHz)
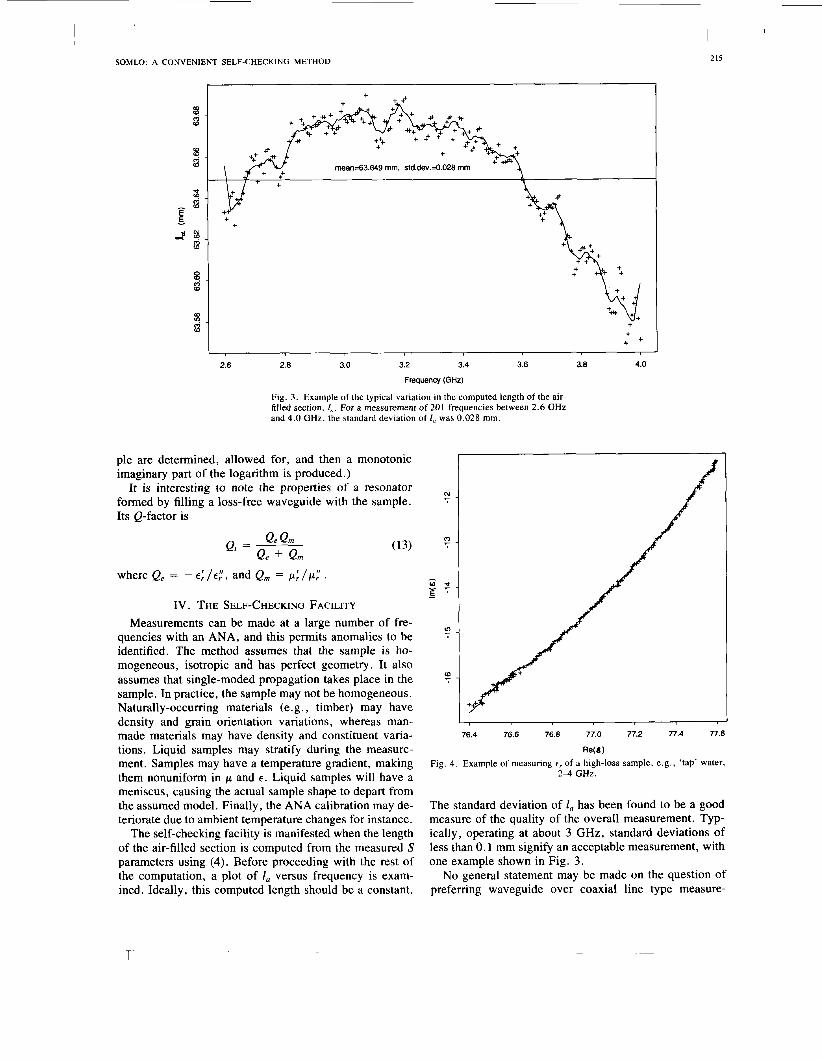
Fig. 3 . Example of the typical variation in the computed length of the air- filled section, I , . For a measurement of 201 frequencies between 2.6 GHz and 4.0 GHz, the standard deviation of I , was 0.028 mm.
ple are determined, allowed for, and then a monotonic imaginary part of the logarithm is produced.)
It is interesting to note the properties of a resonator formed by filling a loss-free waveguide with the sample. Its Q-factor is
Qe Qm
=
where Q, = - E : / € : ) , and Qm = p:/p:I .
IV. THE SELF-CHECKING FACILITY Measurements can be made at a large number of fre-
quencies with an ANA, and this permits anomalies to be identified. The method assumes that the sample is ho- mogeneous, isotropic and has perfect geometry. It also assumes that single-moded propagation takes place in the sample. In practice, the sample may not be homogeneous. Naturally-occurring materials (e. g . , timber) may have density and grain orientation variations, whereas man- made materials may have density and constituent varia- tions. Liquid samples may stratify during the measure- ment. Samples may have a temperature gradient, making them nonuniform in p and E. Liquid samples will have a meniscus, causing the actual sample shape to depart from the assumed model. Finally, the ANA calibration may de- teriorate due to ambient temperature changes for instance.
The self-checking facility is manifested when the length of the air-filled section is computed from the measured S parameters using (4). Before proceeding with the rest of the computation, a plot of 1, versus frequency is exam- ined. Ideally, this computed length should be a constant.
76.4 76.6 76.8 77.0 77.2 7’7.4 77.6
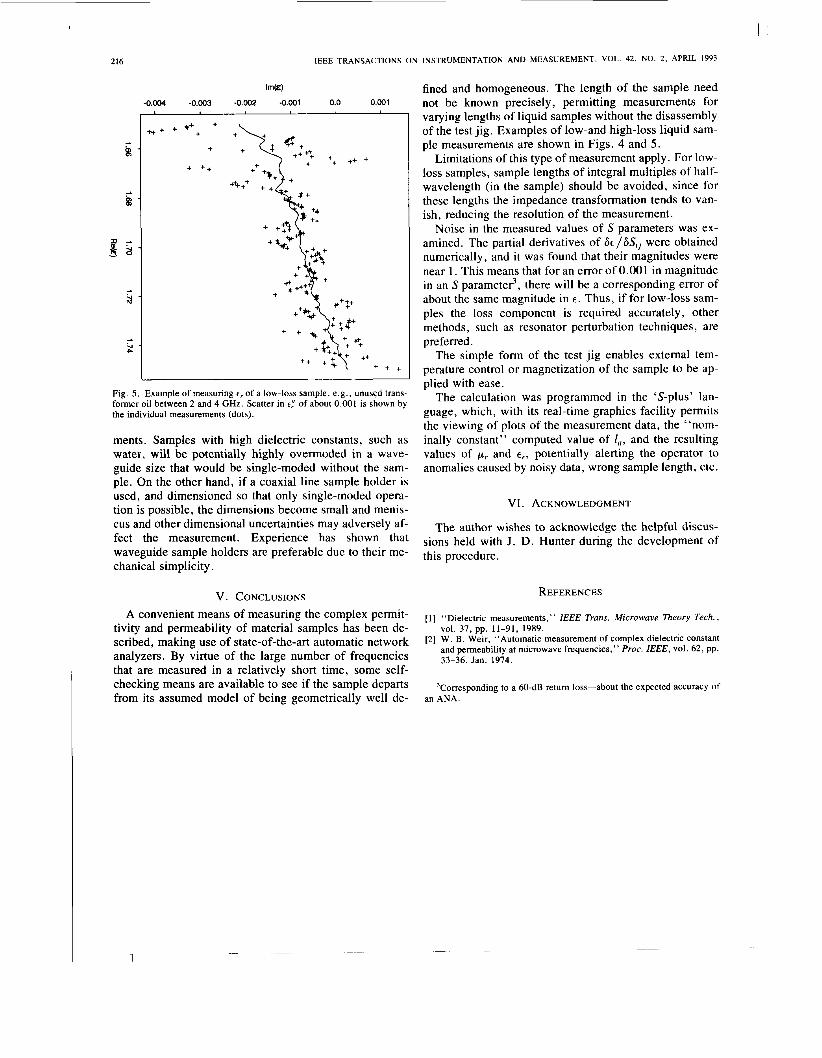
Re(€) Example of measuring t, of a high-loss sample, e . g . , ‘tap’ water,
2-4 GHz.
The standard deviation of 1, has been found to be a good measure of the quality of the overall measurement. Typ- ically, operating at about 3 GHz, standard deviations of less than 0.1 mm signify an acceptable measurement, with one example shown in Fig. 3.
No general statement may be made on the question of preferring waveguide over coaxial line type measure-
1
I
216 IEEE TRANSACTIONS ON INSTRUMENTATION AND MEASUREMENT, VOL. 42, NO. 2, APRIL 1993
-0.004 -0.003 -0.002 -0.001 0.0 0.001
t+ + + +++
+
t +t
+ + +
Fig. 5. Example of measuring er of a low-loss sample, e . g . , unused trans- former oil between 2 and 4 GHz. Scatter in E: of about 0.001 is shown by the individual measurements (dots).
ments. Samples with high dielectric constants, such as water, will be potentially highly overmoded in a wave- guide size that would be single-moded without the sam- ple. On the other hand, if a coaxial line sample holder is used, and dimensioned so that only single-moded opera- tion is possible, the dimensions become small and menis- cus and other dimensional uncertainties may adversely af- fect the measurement. Experience has shown that waveguide sample holders are preferable due to their me- chanical simplicity.
V. CONCLUSIONS A convenient means of measuring the complex permit-
tivity and permeability of material samples has been de- scribed, making use of state-of-the-art automatic network analyzers. By virtue of the large number of frequencies that are measured in a relatively short time, some self- checking means are available to see if the sample departs from its assumed model of being geometrically well de-
fined and homogeneous. The length of the sample need not be known precisely, permitting measurements for varying lengths of liquid samples without the disassembly of the test jig. Examples of low-and high-loss liquid sam- ple measurements are shown in Figs. 4 and 5 .
Limitations of this type of measurement apply. For low- loss samples, sample lengths of integral multiples of half- wavelength (in the sample) should be avoided, since for these lengths the impedance transformation tends to van- ish, reducing the resolution of the measurement.
Noise in the measured values of S parameters was ex- amined. The partial derivatives of S e / S S i j were obtained numerically, and it was found that their magnitudes were near 1. This means that for an error of 0.001 in magnitude in an S paramete8, there will be a corresponding error of about the same magnitude in e. Thus, if for low-loss sam- ples the loss component is required accurately, other methods, such as resonator perturbation techniques, are preferred.
The simple form of the test jig enables external tem- perature control or magnetization of the sample to be ap- plied with ease.
The calculation was programmed in the ‘S-plus’ lan- guage, which, with its real-time graphics facility permits the viewing of plots of the measurement data, the “nom- inally constant” computed value of I , , and the resulting values of p r and E,, potentially alerting the operator to anomalies caused by noisy data, wrong sample length, etc.
VI. ACKNOWLEDGMENT
The author wishes to acknowledge the helpful discus- sions held with J. D. Hunter during the development of this procedure.
REFERENCES
[ l ] “Dielectric measurements,” IEEE Trans. Microwave Theory Tech.,
[2] W. B. Weir, “Automatic measurement of complex dielectric constant and permeability at microwave frequencies,” Proc. IEEE, vol. 62, pp. 33-36, Jan. 1974.
vol. 37, pp. 11-91, 1989.
’Corresponding to a 60-dB return loss-about the expected accuracy of an ANA.


![Linear Algebra and its Applications · 2016. 12. 16. · Laplacian eigenvalues are all real and nonnegative [1]. The set of all N Laplacian eigenvalues μ N = 0 μ N−1 ··· μ](https://img.pdfslide.us/doc/110x75/5fc39bf132385c3e370ab1c6/linear-algebra-and-its-applications-2016-12-16-laplacian-eigenvalues-are-all.jpg)