Embed Size (px)
Citation preview

A contribution to the thermal stress behaviour of Roller-Compacted-Concrete (RCC) gravity dams
Field and numerical investigations
– Contents –
1 Introduction 1
1.1 Background of the Roller Compacted Concrete (RCC) technology 1
1.2 Evolution of RCC as mass concrete for dams 4
1.3 Basic RCC construction principles and dam design 6 1.3.1 Construction of the RCC dam body 6 1.3.2 Construction of RCC dam facings 11 1.3.3 Contraction joints 15 1.3.4 Galleries 16
2 Scope of the present work 17
3 General thermo-mechanical behaviour of mass concrete 19
3.1 Thermal stresses and deformation restraint 19
3.2 Zero-stress temperatures and temperature crack criteria 25
4 Thermal and mechanical properties of Roller Compacted Concrete 34
4.1 Basic considerations 34
4.2 Thermal properties of RCC 36 4.2.1 Hydration heat and concrete maturity 36 4.2.2 RCC specific weight 50 4.2.3 Thermal conductivity of RCC 51 4.2.4 Specific heat of RCC 56 4.2.5 Thermal diffusivity of RCC 59
4.3 Mechanical properties of RCC 60 4.3.1 Coefficient of thermal dilatation 61 4.3.2 Compressive strength of RCC 65 4.3.3 Tensile strength of RCC 70 4.3.4 Stress-strain behaviour of RCC 73 4.3.5 Modulus of elasticity of RCC 77 4.3.6 Poisson’s ratio of RCC 85

4.3.7 Consideration of creep in RCC 86 4.3.8 Tensile strain capacity of RCC 91 4.3.9 Non-thermal and stress independent volume changes of
RCC 91
4.4 Thermal and mechanical issues concerning the dam foundation 92
5 Field investigations in Jordan and China 93
5.1 Instrumentation 94 5.1.1 Distributed Fibre Optic Temperature Measurements
(DFOT) 94 5.1.2 Stressmeters 97 5.1.3 DFOT Heat-up method for in-situ acquisition of RCC
thermodynamic properties 100
5.2 Mujib Dam (Hashemite Kingdom of Jordan) 105 5.2.1 Site description 105 5.2.2 Temperature behaviour and thermodynamic RCC
properties 114 5.2.3 Stress behaviour 130
5.3 Wala Dam (Hashemite Kingdom of Jordan) 139 5.3.1 Site description 139 5.3.2 Temperature behaviour 146
5.4 Shimenzhi (Peoples Republic of China) 155 5.4.1 Site description 155 5.4.2 Temperature behaviour 161
6 Numerical modelling of thermal restraint stresses – Mujib Dam case study and parametric studies 165
6.1 Determination of ambient conditions and construction parameters 165 6.1.1 Ambient temperatures at construction site 165 6.1.2 Foundation temperature 166 6.1.3 RCC placement temperatures 166 6.1.4 Consideration of sun radiation 167 6.1.5 Surface heat transfer coefficients 173 6.1.6 RCC placement schedule 174
6.2 Model characteristics and set-up 174
6.3 Case study Mujib Dam 180 6.3.1 Assessment of the modelling methodology 180

6.3.2 Summary and valuation of the numerical models 190
6.4 Parametric study on the thermal stress behaviour of RCC gravity dams 191 6.4.1 Variation of construction start date and placement speed 194 6.4.2 Variation of location of placement breaks 198 6.4.3 Variation of placement technology 205 6.4.4 Variation of facing concrete 207 6.4.5 Variation of the monolith size 209 6.4.6 Evaluation of mass cracking 211 6.4.7 Summary of the parametric studies 214
7 Summary and recommendations for the thermal stress favourable construction of RCC dams 217
7.1 Thermal cracking types and mechanisms 217
7.2 General findings on the thermal cracking behaviour of RCC gravity dams 217
7.3 Material related recommendations 218
7.4 Construction related matters 219 7.4.1 Placement rates 219 7.4.2 Placement breaks 220 7.4.3 Placing methodology 221 7.4.4 Drainage galleries 221
Index of symbols 222 Index of figures 222 Index of tables 231 Bibliography 233
APPENDIX 251

1
1 Introduction
1.1 Background of the Roller Compacted Concrete (RCC) technology
Roller Compacted Concrete (RCC) in Dam Engineering came up in the early 1970s as an application for the construction of portions of dams, of spillways and for re-habilitation uses. Systematic research on the RCC technology in the form of exten-sive laboratory and equipment testing was initiated then and led to the first dam en-tirely built of RCC in 1983 (Willow Creek, USA, Schrader 1995). This ample re-search work is still continued today, comprising mainly the aspects of materials, planning, design and construction, technological innovations and performance of already operating RCC dams (Berga et al. 2003).
More than 250 RCC dams have been completed between 1983 up to date, ranging up to heights exceeding 180 m (La Miel I, Colombia, 188 m) and volumes of more than 7.5 Mio. m³ (Longtan, China, 7.6 Mio. m³) (Dunstan 2004). Until 1992 the majority of RCC dams has been completed in the USA, Spain, Japan, South Africa and Australia. Since then they have also been constructed in various other countries, mainly in China and Brazil. Today, RCC dams can be found on all continents ex-cept Antarctica (Fig. 1-1), they are exposed to arctic and tropical climates in regions ranging from sea level to high mountainous. RCC dams have been designed and constructed as standard gravity dam types, arch-gravity dam types and even thin arch dams.
Africa11%
Asia38%
Europe12%
Oceania3%
India, Middle East3%
North America14%
South-, Central America
19%
Fig. 1-1: World distribution and progress of RCC dams as of 2004 (276 RCC
dams, data according to Dunstan 2004).
Dam construction has always looked to three major factors: Dam safety, durability and economy. Based on the classical methods of embankment and concrete dam

2
construction, the RCC technology has been developed combining the economical and rapid placement resulting from a high degree of mechanisation with the strength and durability of concrete. Therefore, Roller Compacted Concrete does not really refer to a new material, it rather describes a concrete being transported, placed, spread and compacted using earth moving equipment in the certain RCC construc-tion process.
RCC is a concrete with no-slump consistency in its unhardened state, which has to support the heavy equipment while being compacted. The properties of hardened RCC can be similar to those of traditional mass concrete1 (conventional vibratable mass concrete, CVC), but can also be designed with hardened properties outside the typical range for traditionally placed concrete (USACE 2000, ICOLD 2003).
RCC dams normally lead to large cost savings. This is due to the much higher de-gree of mechanisation and the rapid construction speed compared to traditional con-crete dams, together with the considerable smaller dam volume and the possibility of an incorporated spillway into the dam body compared to fill dams. In respect of the mass concrete for concrete dams, significantly lower unit costs can be attributed to RCC than to CVC (25 - 50% less) (Andriolo 1998) as depicted in Figure 1-2.
Table 1-1 shows the qualitative comparison between traditional dam types and their respective construction materials, volumes and unit costs for a specific project. In case of an adequate foundation for an RCC dam, taking similar basic site conditions into consideration, overall project costs are at least competitive with rockfill dams (Andriolo 1998).
1 Mass concrete: Generally defined as a specially designed and engineered concrete for large and voluminous concrete structures like dams, navigation locks and foundation slabs.

3
RCC prices include RCC items*),facings**), conventional concrete**)
and miscellaneous items**).
CVC prices include CVC items*) only.
Mobilisation of equipment notincluded.*) incl. mixture ingredients & mixing,transport, placement & compaction,pre-, post-cooling.**) see Chapter 1.3.
0
50
100
150
1 to 5 25 to 75 200 to 400 750 to 5000
RCC, CVC dam volume [10³ m³]
RC
C, C
VC u
nit c
osts
[$U
S/m
³ - 1
994
pric
es]
average RCC
envelope RCC
average CVC
envelope CVC
Fig. 1-2: RCC prices for selected RCC dams in the world (Schrader 1995, Han-
sen 1979).
Tab. 1-1: Dam types versus their volume and material unit costs.
Dam type Material Volume Unit costs
12.3
Earthfill dam
Soil
11.7
Rockfill dam
Rock
10.8
Gravity dam
Mass concrete
Arch dam
Mass concrete

4
1.2 Evolution of RCC as mass concrete for dams
Until 1928 mass concrete was a mix of unwashed, unprocessed gravels with unfa-vourable grain size distributions, inadequate aggregate fines content and a Portland cement content between 120 and 160 kg per cubic metre of concrete. This concrete with a maximum aggregate size of 70 mm was placed in 15 to 30 cm thick layers, depending on the concrete consistency (earth-damp, soft), which were compacted with small hand-compactors. In Germany the quality of compaction of this so-called stamped concrete could be increased only since 1932 with the introduction of the machine-compactor (Wildner 2002).
Inadequate aggregate sieve curves, low cement contents and deficient compaction were characteristic for mass concrete structures until the late 1930s, resulting in re-duced strength and durability. The introduction of standard aggregate grain size dis-tributions and the tendency to use higher cement contents in the mass concrete with the consequence of higher early age strengths, but at the same time with the devel-opment of higher hydration temperatures (see Chapter 4) was observed until 1936 (Díez-Cascón Sagrado 1995). This and the increasing speeds of construction made evident the disadvantage of constructing concrete dams with normal Portland ce-ment and lead to the reflection about the problems caused by the generation of hy-dration heat and its relation to thermal induced cracking (Chapter 3), which should become one of the major concerns in concrete dam engineering.
Between 1936 and 1970 the development and utilisation of blended cements (partial substitution of cement with pozzolan2 or slag3) with lower hydration heat generation gained importance. The aggregate gradation, particularly the use of aggregate fines (grain sizes passing 0.075 mm, USACE 2000) and the maximum aggregate grain size (at that time 80 - 150 mm), was discovered as an influencing factor on the re-duction of the heat generation by means of reducing the concrete’s cement content (Díez-Cascón Sagrado 1995).
2 Pozzolan: Materials containing constituents (e.g. active silica, alumina) which will combine with lime at ordinary temperatures in the presence of water to form compounds possessing cementitious properties. A difference is made between natural (e.g. calcinated clays) and artificial pozzolans (e.g. fly-ash) (ICOLD 1972).
3 Slag: Glassy, granulated product, generally obtained by quick cooling of the molten residue from the smelting of iron in blast furnaces, which, when pulverised and suitably activated (e.g. by lime or calcium sulphate), develops cementitious properties (ICOLD 1972).

5
The time from the 1970’s to the 1990’s was characterised by the progressive devel-opment of mass concrete towards RCC and today’s state-of-the-art RCC. This com-prised concepts for the RCC mixture proportioning as well as the overall conception of RCC dams as a system (upstream impervious barriers, dam mass, downstream facings, spillway) with focus on the construction economy (Chapter 1.3). According to the binder4 content of the RCC, two mixture proportioning approaches were es-tablished. For RCC with a low binder content, the optimum water content is evalu-ated by a geotechnical procedure similar to the determination of the Proctor density for soil (Choi and Groom 2001), whereas the known concept based on the water-to-binder-ratio is applied for higher binder content RCC, both to achieve the maximum concrete density and strength after compaction. Typically, a maximum size aggre-gate of 75 mm has been used in RCC structures designed by the United States Army Corps of Engineers (USACE 2000), while also larger sizes have been successfully applied in Japan or China.
Since many features of the RCC technology were tried in this period and in isolated cases in the past, their harmonisation and systemisation was a novelty, which finally led to the current classification of RCC (Tab. 1-2, ICOLD 2003).
Tab. 1-2: Classification of RCC for dams (ICOLD 2003 and Schrader 1995).
Classification Low-
cementitiousRCD**) Medium-
cementitious High-
cementitious
Cementitious content*) [kg/m³]
< 99 120 - 130 100 - 149 > 150
Pozzolan content [% mass of cementi-
tious material] 0 - 40 20 - 35 20 - 60 30 - 80
Compressive strength [MPa]
5 - 15 11 - 21 17.5 – 31.5
*)amount of cementitious material = cement + pozzolan. **)Roller Compacted Dam (RCD) as an RCC concept unique to Japan.
4 Binder indicates the contents of all cementitious materials present in the concrete (ce-ment + pozzolan or slag).
6
A special RCC, suited to the regional conditions, was introduced in Brazil. The high fines content RCC, which is comparable to the low-cementitious content RCC, con-tains 8 to 12 % of fines (Andriolo 1998), whereas, a usual low-cementitious content RCC includes about 3 to 8 % of aggregate fines or filler to achieve an adequate den-sity with the coherent impermeability and strength (Schrader 1999).
Consecutive experiences with RCC as mass concrete have been made in various countries in the past and are still gained today, but experiences also differentiated between the countries depending on the regional boundary conditions, especially in the respect of the local availability of cementitious materials and the types of aggre-gate at each individual site. This makes, in the end, each RCC mixture with its ap-pendant properties unique. Each RCC has to be engineered according to the re-quirements for the dam. In this context, the conduction of full scale trial tests to evaluate the in-situ behaviour of the RCC as well as for studying the working se-quences belongs to the RCC state-of-the-art.
1.3 Basic RCC construction principles and dam design
1.3.1 Construction of the RCC dam body
This section deals with the fundamentals of the commonly applied methods, with some of the major options and innovations for the construction of an RCC dam and tries to reveal some basic constructive relationships. Only the most important facts are presented in this section as far as they are addressed successively, more com-prehensive information is held in Andriolo (1998), ACI (1999) and ICOLD (2003). Although Figure 1-3 shows a simplified principal sketch of a gravity dam section, the presented assembly and following statements are also valid for RCC arch dams unless otherwise mentioned.

7
Foundation
5 5
B
B
Abut
men
tAbutment
6
Foundation
Zone I
Zone II
Zone III
Zone IV
1
2 3
4
A
A
Cross section B-B Longitudinal section A-A
1 Dam body
2 Upstream facing
3 Downstream facing
4 Gallery
5 Contraction joint
6 Monolith (Block)
Fig. 1-3: Simplified principal assembly of an RCC gravity dam.
The structural design of RCC dams uses the same principles and procedures that are used for conventional concrete dams. The economy of concrete dams is achieved by the construction of the minimum section which is necessary for resisting the design loads. For RCC gravity dams, a basic gravity section with vertical or nearly vertical upstream face and a downstream face with a constant slope, which turns vertically at the dam crest, is widely chosen (Schrader 1999).
In terms of the mass concrete used for the RCC dam body, usually only one RCC mix is used throughout the entire section of dams up to 40 m in height. Higher dams may be divided into horizontal zones in the order of about 20 m thick with higher strength mixes being applied for the lower zones (Schrader 1999).
One element to make the RCC technology profitable and efficient is the high ma-chine intensity and the reduced assignment of labour. RCC is usually transported by dump trucks or high-speed conveyor belts from the mixing plant to the placement site where it is deposited in piles or windrows (USACE 1993). Dozers are then spreading it continuously in the direction from one abutment to the other, while al-ready performing a certain precompaction of the concrete. Final compaction of the concrete is achieved by heavy vibratory rollers and a sufficient number of passes to obtain the optimum compaction.

8
Tab. 1-3: RCC production steps and equipment (slectively).
Action Equipment
Transportation / Placement
High-speed conveyor + crawler placer
Dump trucks
Spreading Dozers
Final compaction Vibratory rollers
9
The multiple layered construction is the common point of all RCC dams. In terms of the methodology of placing the single layers and lifts5 two concepts are accepted.
Concept of placing single horizontal layers (traditional method)
The RCC is placed in horizontal layers. The layer thickness varies between 200 and 400 mm, 300 mm being applied in most cases. On major dams, the time for placing the single layers from one abutment to the other may be in the order of 15 to 30 hours (Forbes 2002). This time exceeds the initial and final set time of concrete, sometimes even when retarders are used, leading to deficient bonding in the inter-faces between the lower and new layer. These horizontal construction joints become critical for the structure’s stability (reduced shear and tensile strength, increased uplift pressure) at every 30 cm of the dam’s height. To obtain a homogeneous and monolithic RCC structure across the horizontal construction joints, the new RCC has to be placed and compacted within the initial set time of the previous layer (approx. 1.5 to 2.5 h after mixing without retarder) or the bonding has to be assured by placing a thin layer of high-slump bedding mortar in advance of the RCC. The traditional horizontal placing method may result in an increased risk of a defective RCC construction and reduced placement rates due to the significant effort in con-nection with the horizontal joint treatment. However, placing single horizontal RCC layers leads to an increased flexibility in respect of the structuring and forming of the dam faces.
The properties of horizontal construction joints are crucial especially for very high RCC gravity dams. The failure of an RCC gravity dam is more likely to occur along the contact with the foundation or along horizontal construction joints than through the RCC itself. So, recent methods and innovative placement techniques developed try to achieve good bonding, high shear strength and low permeability at the con-struction joints along with increased placement rates.
Sloped layer method
The sloped layer method was first introduced at Jiangya Dam (Peoples Republic of China) in late 1997 (Forbes 2002, 2003). It enables 30 cm thick layers to be placed within the initial set time of the RCC. The single layers are spread and compacted
5 Lift indicates a set of single layers.

10
on a certain slope in direction from one abutment to the other between formed up-stream and downstream faces (Fig. 1-4). So, a set of layers is placed fresh-to-fresh to obtain a lift, which may typically be 3 m high (10 layers). As the placing of each layer is managed within the initial set time of the RCC a homogeneous and mono-lithic lift results, the number of horizontal construction joints and the effort of their treatment can be reduced to about 20 %. Also, due to the quick placement, the height of one lift may reach 3 m in a very short time, its surface is then exposed to the ambient conditions until the 3 m-lift is completed between the abutments and across the full width of the dam. The period of time of exposure may be typically assumed as 10 days. Before topping the matured lift with the successive fresh RCC, the contact area between the previous and the new RCC lift is treated with bedding mortar. The volume of placed RCC per single sloped layer is adjusted according to the dam width, lift height, initial set time of the RCC and the mixing plant capacity by adapting the slope of the layers. Typical slopes range between 1 to 10 to 1 to 40. Equation 1-1 shows the relation between the layer slope and the named parameters.
CS QthHWS
⋅⋅⋅≤ Eq. 1-1
with S W H h tS QC
Slope of the RCC layer [-] Width of the dam [m] Lift height [m] Layer height [m] Initial set time of RCC [h] Capacity of mixing plant [m³/h]
Besides improving the overall lift joint quality by applying the sloped layer method, most of the ancillary works (surface preparation, formwork erection etc.) are re-moved from the critical path and placement rates are increased.

11
„Foot“ 0.3m
1 on SAbutment Abutment
3.0m Upstream form
Top of newlycompleted 3m lift0.3 m thick
RCC sloped layers
1 on S
W
Previous 3m liftDownstream form
Fig. 1-4: Procedure of the sloped layer method (Forbes 2002).
1.3.2 Construction of RCC dam facings
The decision for a certain facing system and procedure for constructing the dam face, either upstream or downstream, depends on economics and on fitting to the envisaged methodology of the construction of the dam body. RCC is not entirely suitable in those areas, as it is less workable than conventional concrete and it is less compactable with smaller equipment needed in these confined areas. Considered in detail, the upstream and downstream facing have to be distinguished according to their different requirements.
Upstream face
Watertightness and seepage control are the primary considerations for selection of the upstream face. Various types of upstream facing systems have been developed of which the following shall be briefly presented (Mass 2002):
• Conventional vibratable concrete (CVC) against formwork, placed simultane-ously with each RCC layer,
• Grout enriched vibratable RCC (GEVRCC) against formwork, • Exposed synthetic membranes (PVC-membranes) as upstream impermeable bar-
rier.
For the CVC upstream face, the CVC is immediately placed against e.g. conven-tional climbing shutters prior to the placement of the RCC. The concrete used for the facing usually is characterised by a considerable higher binder content (approx. 200 kg/m³) than is used in the RCC. The facing concrete is placed in a 30 to 50 cm wide strip along the formwork after the previous layer was covered with bedding

12
mortar close to the upstream face to provide impermeability of the horizontal con-struction joints. The CVC is then consolidated with immersion vibrators before the RCC is placed and compacted behind it. Since the interface between the conven-tional concrete and the RCC has as well to be thoroughly consolidated and inter-mixed to obtain a monolithic interconnection, a second compaction step by immer-sion vibrating is required.
Grout enriched vibratable RCC (GEVRCC) is an innovative procedure resulting in formed faces of generally comparable quality as the CVC facing (Forbes 2002). A cement based grout with a water-to-cement-ratio of 1.0 minimum is applied to the loose and uncompacted RCC which is freshly spread against the shutters. The grout is allowed to soak into the layer of RCC which is consolidated with an immersion vibrator. The method of GEVRCC perfectly fits to the rapid proceeding RCC placement and results in a completely homogeneous and monolithic RCC structure at the facings. The quality of the face is highly dependent on the applied cement grout’s water-to-cement-ratio which determines the infiltration into the RCC along with the final strength of the face. The grout rate to be distributed at the facing is approximately 67 litres per cubic metre of RCC giving an addition of 50 kg of ce-ment to the cubic metre of RCC. This indicates that the GEVRCC method is not only an economic solution, but may also contribute to a thermally advantageous behaviour of the entire structure in respect of crack control.
The imperviousness of the upstream face can also be accomplished by the installa-tion of a synthetic membrane, typically being a high performance polyvinyl-chloride (PVC) geomembrane coupled with a geotextile. This geocomposite usually covers the complete upstream facing of the RCC dam and is exposed to the reser-voir and to the ambient conditions where it is not impounded (Scuero et al. 2002). For the installation of the geocomposite, vertical U-shaped steel profiles are incor-porated into a narrow strip of conventional concrete or GEVRCC which is placed against formwork according to the above described procedures. In a later step which generally follows after completion of the RCC works, the geocomposite is then me-chanically anchored to the embedded profile by clamping profiles (Mass 2002, Fig. 1-5). Since the membrane covers cracks that will eventually appear in the up-stream facing concrete, these cracks have a negligible impact in terms of seepage and serviceability. Seepage emerging through the geotextile may be drained by the vertical steel profile before being able to enter the dam body. The upstream water-tight dam lining diminishes the disadvantages of leaking horizontal construction joints and resulting uplift pressures and may reduce the tensile strength require-
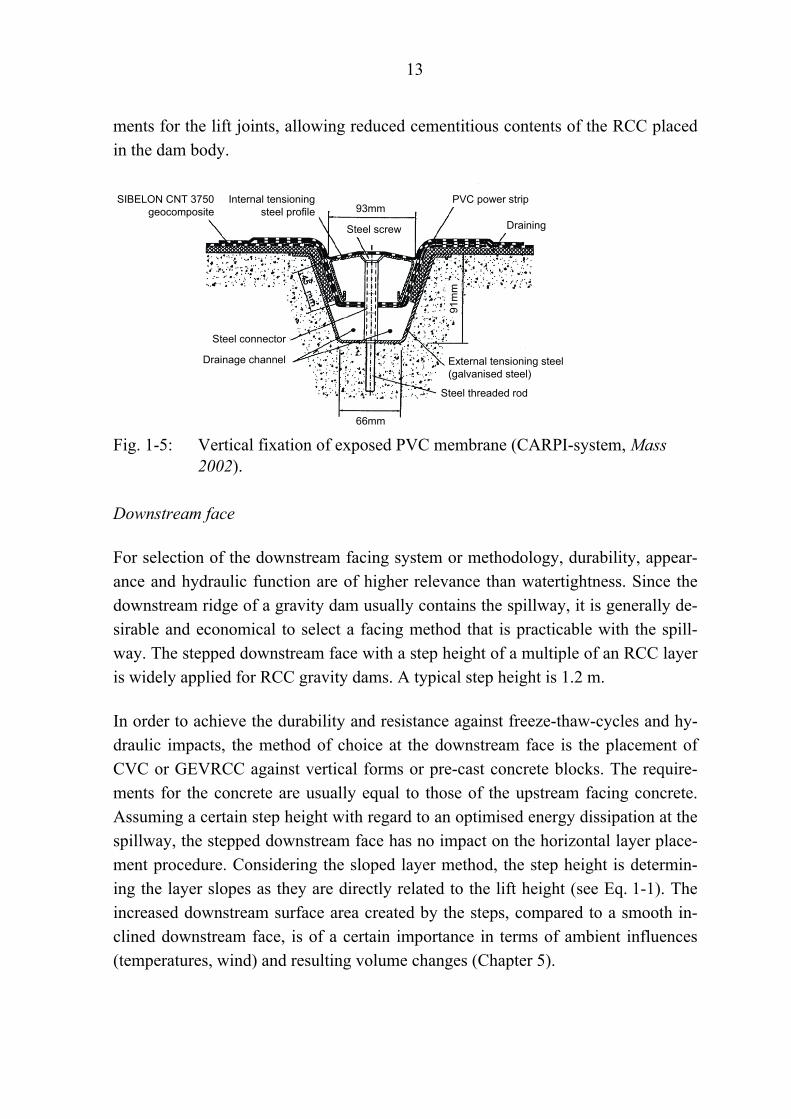
13
ments for the lift joints, allowing reduced cementitious contents of the RCC placed in the dam body.
SIBELON CNT 3750geocomposite
Internal tensioningsteel profile
Steel connector
Drainage channel
66mm
Steel threaded rod
External tensioning steel(galvanised steel)
93mm
Steel screw
PVC power strip
Draining
91m
m
Fig. 1-5: Vertical fixation of exposed PVC membrane (CARPI-system, Mass
2002).
Downstream face
For selection of the downstream facing system or methodology, durability, appear-ance and hydraulic function are of higher relevance than watertightness. Since the downstream ridge of a gravity dam usually contains the spillway, it is generally de-sirable and economical to select a facing method that is practicable with the spill-way. The stepped downstream face with a step height of a multiple of an RCC layer is widely applied for RCC gravity dams. A typical step height is 1.2 m.
In order to achieve the durability and resistance against freeze-thaw-cycles and hy-draulic impacts, the method of choice at the downstream face is the placement of CVC or GEVRCC against vertical forms or pre-cast concrete blocks. The require-ments for the concrete are usually equal to those of the upstream facing concrete. Assuming a certain step height with regard to an optimised energy dissipation at the spillway, the stepped downstream face has no impact on the horizontal layer place-ment procedure. Considering the sloped layer method, the step height is determin-ing the layer slopes as they are directly related to the lift height (see Eq. 1-1). The increased downstream surface area created by the steps, compared to a smooth in-clined downstream face, is of a certain importance in terms of ambient influences (temperatures, wind) and resulting volume changes (Chapter 5).
14
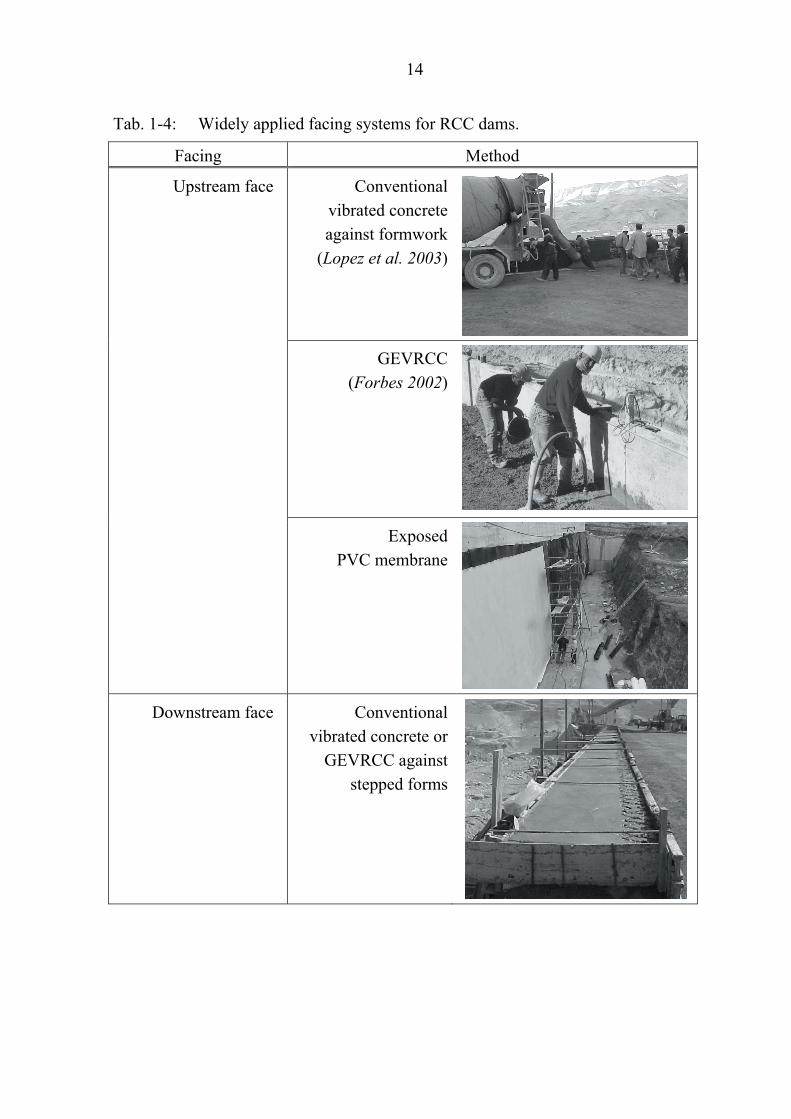
Tab. 1-4: Widely applied facing systems for RCC dams.
Facing Method
Upstream face Conventionalvibrated concreteagainst formwork
(Lopez et al. 2003)
GEVRCC
(Forbes 2002)
ExposedPVC membrane
Downstream face Conventionalvibrated concrete or
GEVRCC againststepped forms

15
1.3.3 Contraction joints
Transverse contraction joints in RCC dams are placed vertically in the dam section perpendicular to the dam axis at certain distances, dividing the dam into separated, independently acting monoliths if they are made through the entire dam section. The principal function of contraction joints is the relieving of restraint effects and the control of cracking in a concrete dam due to volume changes the RCC structure is subjected to (ACI 1999). According to ACI (1999), partial joints are also adequate, as they contribute to a propagation of assumed cracks through the weakened plane. To maintain the economic and rapid RCC placement, contraction joints of RCC gravity dams are not formed by shutters as done for conventional mass concrete dams. They are rather cut into the finally compacted RCC layer by inserting steel or plastic sheets or any other bond breaking material, e.g. sand. The cutting may be accomplished by using vehicle mounted vibrating plates or simply a pneumatic-chisel. However, the construction of contraction joints for RCC arch dams is more sophisticated due to the requirements for positively tied monoliths necessary for the assurance of the arch actions for transferring the reservoir loads into the abutments. Contraction joints for RCC arch dams are not discussed here, references in respect to this topic are Aufleger et al. (2001), Liu et al. (1999) and Zhu and Xu (1995).
Foundation
1
2
1 unjointed dam core
2 partial contraction joints
Fig. 1-6: An example of (partial) contraction joint execution.
The number, placement and the distance between contraction joints is based on thermal studies (Chapter 6), the shape of the dam foundation parallel to the dam axis and other restraints leading to a certain dam monolith arrangement (e.g. appur-tenant structures, river diversion). Typical contraction joint distances vary between 15 and 60 m, but some projects have been completed even without any joints. De-pendent on the type of facing, waterstops have to be provided at the upstream part of the contraction joints.

16
1.3.4 Galleries
The provision of galleries in RCC dams follows the same aspects as for conven-tional concrete dams. However, the integration of a gallery is more difficult in the construction of RCC dams due to the rapid RCC placement methods. Generally, galleries in RCC dams should be minimised as they may cause higher costs and re-duce placement rates. With regard to the thermal behaviour of an RCC dam, the considerable impact galleries may have on the temperature fields in the dam has to be borne in mind. For the sake of economy, the layout of the gallery should take the unlimited mobility of the RCC machinery into consideration. The schemes for con-struction of a gallery in an RCC dam may be e.g. placing the RCC against rigid forms and the ceiling section made of pre-cast slabs or all-in-one pre-cast gallery segments.

17
2 Scope of the present work
The outstanding economy of RCC dams as described before suffers from the possi-ble occurrences of thermal cracking in the mass concrete. Thermal induced cracks seldom endanger the safety of a gravity dam. They rather reduce the serviceability of the structure and often cause considerable rehabilitation and maintenance costs.
Extended knowledge about thermal cracking in existing RCC dams is still rare. Therefore, the main objective of the present work is to make a contribution to the practical a priori evaluation of the thermal cracking danger in RCC gravity dams, as well as to the optimisation of the construction progress of such dams with a particu-lar view to placement breaks.
In order to satisfy the envisaged target, the work includes the temperature and re-straint stress monitoring in different RCC dams, supplementary in-situ and labora-tory tests for the evaluation of certain thermal and mechanical RCC properties and the set-up of a numerical model for the temperature and stress simulation within an RCC gravity dam using the commercial finite element code ANSYS® (ANSYS 2003). The focal point of this thesis is the application of innovative monitoring sys-tems in RCC dams (distributed fibre optic temperature measurements (DFOT), Stressmeters) and the numerical simulation of the thermal stress behaviour of the dam during its construction. Extended laboratory testing of RCC mixtures has usu-ally not been performed within the early dam design phases. So, the evaluation of the relevant RCC properties as input for an adequate thermal stress simulation is mainly based on empirical engineering models.
With regard to the main objective, answers to following questions have to be found:
• How does an RCC gravity dam act in respect of its spatial-temporal temperature and restraint stress evolution?
• How do typical zero-stress temperature distributions and typical spatial differen-tiated temperature gradients turn out to be within an RCC gravity dam?
• Would an evaluation of restraint stresses based on zero-stress temperature distri-butions in an RCC gravity dam be practicable?
• Which are the significant parameters influencing the thermal cracking danger?
And additionally referring to in-situ instrumentation, concrete technology and nu-merical modelling:

18
• How can suitable fibre optic cables be optimally installed under the conditions of the RCC technology (robustness, implementation into construction process)?
• Are Stressmeters appropriate for restraint stress monitoring in RCC dams? • How may the temporal evolution of the stress and crack relevant RCC properties
within an RCC dam be described? • Is a simple numerical modelling adequate for a representative preliminary ther-
mal stress analysis of an RCC gravity dam?
According to the followed methodology and the stated questions the presented dis-sertation is subdivided into three major parts, (1) own investigations and literature research on RCC properties, (2) on-site instrumentation and monitoring works at two RCC gravity dams in the Hashemite Kingdom of Jordan and an RCC arch dam in the Peoples Republic of China and (3) set-up of a two- and three-dimensional fi-nite element model for the construction period of one RCC gravity dam in the Hashemite Kingdom of Jordan and subsequent parameter studies.
As well as general notes referring to the RCC technology for dams depicted in Chapter 1, a general description of the thermo-mechanical behaviour of RCC will follow as an introduction to the most relevant concrete properties for thermal crack-ing of RCC and their prediction. After the presentation of the DFOT and restraint stress investigations in Jordan and China, including the identification of important thermo-mechanical dam behaviour related parameters, the numerical modelling of the construction period of an RCC gravity dam is described. The Mujib RCC gravity dam in Jordan hereby serves as a case study. The prediction and assumption of im-portant but not available construction site conditions are focussed, emphasising a practical definition of initial and boundary conditions. Thermal and structural pa-rameter studies with the evaluated models are carried out, leading to the suggestions in respect of the thermo-mechanically optimised construction of RCC gravity dams.

19
3 General thermo-mechanical behaviour of mass concrete
3.1 Thermal stresses and deformation restraint
Temporal and spatial concrete temperature variations cause deformations of the structure, which do not lead to strains and stresses when the temperature variations across the structure are uniform and the structure is free to deform. In mass concrete structures like dams, however, this state does never occur, as deformation restraints are always present and stress relevant concrete properties are variable in time and across the structure.
The setting of concrete is immediately initiated when the cement gets into contact with the mixing water and hydration heat is generated. The exothermic cement hy-dration, the low conductivity of concrete, differential effects due to an evolutionary dam construction process (especially due to placement breaks) and environmental conditions (Cervera et al. 2000) result in a different temporal and spatial tempera-ture evolution within the mass concrete.
Since the heat generated by hydration is retained within the interior of the structure over a long period, and surface near regions are influenced by the exterior thermal boundary conditions, resulting temperature distributions lead to according differen-tial volume changes of the concrete. The warm interior constrains the cooling exte-rior from contracting, and tensile strains and stresses result in the surface near con-crete portions (Fig. 3-1). These restraint thermal stresses or eigenstresses occur due to internal restraint. When they exceed the current tensile strength of the concrete, typically surface cracking or so-called surface gradient cracking may be observed (USACE 1997).
Restraint thermal stresses may also develop in consequence of the concrete struc-tures’ bearing conditions. If the mass concrete structure as a whole contracts due to cooling from an average peak temperature, the foundation or adjacent structures hinder the deformation (Fig. 3-2). When eventually occurring tensile stresses ex-ceed the tensile strength of the concrete, mass cracks or mass gradient cracking due to external restraint may encounter (Andriolo 1998, USACE 1997).

20
Con
cret
ete
mpe
ratu
reT
[°C
]
Time t
interior temperature
surface temperature
exterior temperature
Concrete block(no fixation)
Temperature + Stress – Deformed shape
Surface cracking
Fig. 3-1: Illustration of internal restraint and surface cracking.
Con
cret
ete
mpe
ratu
reT
[°C
]
Time t
average temperature
exterior temperature
Deformed shape
Concrete block(fixed at foundation)
Temperature drop + Stress –
Mass cracking
Fig. 3-2: Illustration of external restraint and mass cracking.
In actual mass concrete structures, cracking occurs under a combination of internal and external restraint. An initiated surface crack may propagate through the mass and finally intersect the concrete block. It is usually difficult to determine the effec-tive level of restraint in a mass concrete structure, but it is crucial for accurate re-sults from a thermal stress simulation and the prediction of thermal induced crack-ing (Kjellman and Olofsson 2001). Restraint is generally expressed through a re-straint factor k [-] as the ratio of constrained and free (total) thermal strain (DBV 1996) according to Equation 3-1.
21
Tk
T
thfree
th
th
Δ⋅==
αε
εε Eq. 3-1
with k εth εth
free αT ΔT
Restraint factor [-] Constrained thermal strain [-] Free thermal strain Coefficient of thermal dilatation [K-1] Temperature change [K]
Alternatively, the restraint factor may also be expressed as the ratio of actual stress resulting from the volume change to the stress which would result at complete re-straint (ACI 1995, Kjellman and Olofsson 2001, Eq. 3-2).
ETk
T ⋅Δ⋅==
ασ
σσ
%100
Eq. 3-2
with k σ σ100%
αT ΔT E
Restraint factor [-] Actual thermal stress [MPa] Thermal stress at 100% restraint [MPa] Coefficient of thermal dilatation [K-1] Temperature change [K] Modulus of elasticity [MPa]
For a practical consideration of restraint thermal stresses from known temperature loads within a concrete structure, Equation 3-2 may be converted to Equation 3-3.
ETkk T ⋅Δ⋅⋅=⋅= ασσ %100 Eq. 3-3
With regard to the determination of the restraint factor within a mass concrete struc-ture subjected to external restraint, ACI proposes a continuous external restraint model (ACI 1995) based on measured data, which is confirmed by Jonasson and Hedlund (2001) and extended by Nilsson (2003) by numerical simulation results under the precondition that a full structural contact is given between the considered mass concrete structure and the rock foundation or adjacent structure. Figure 3-3 shows the principal setup of the ACI-model.

22
Foundation
Centre section
L
Hh
L Length of concrete block [m]H Height of concrete block [m]h considered height above
foundation [m]
Fig. 3-3: Model for determination of the degree of external restraint (ACI 1995).
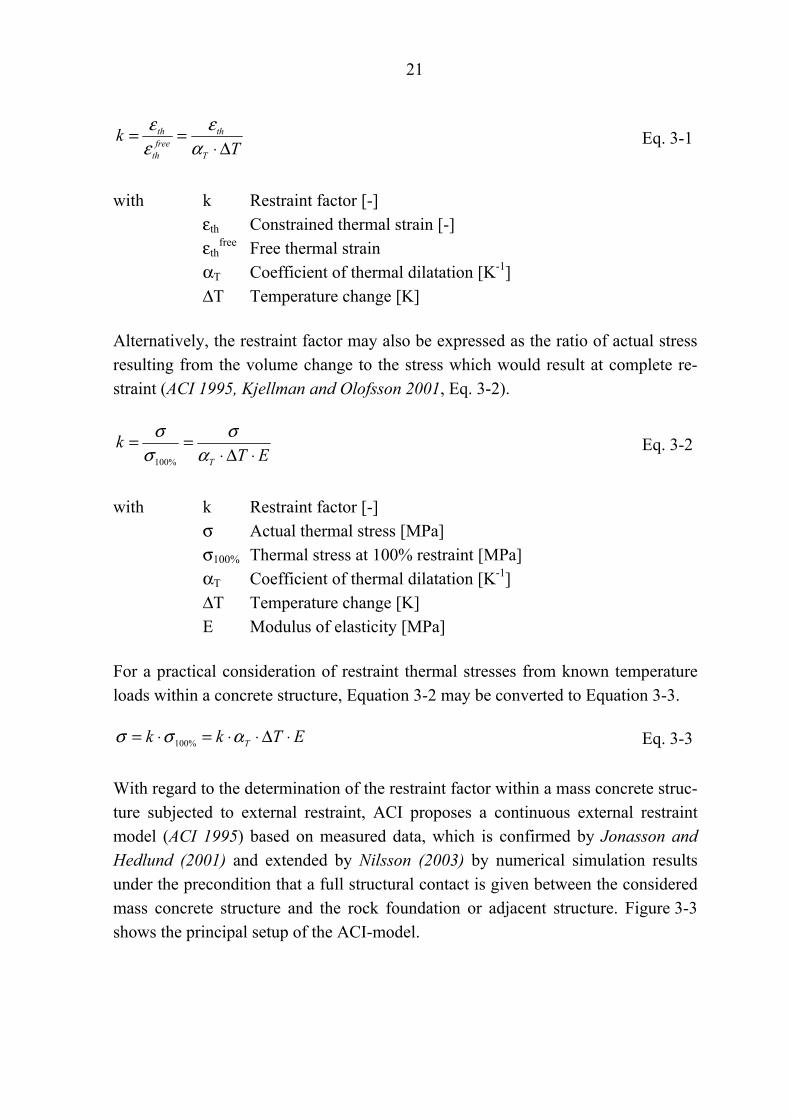
The degree of external restraint depends primarily on the relative dimensions of the concrete block and the foundation strata and their modulus of elasticity. Conse-quently, it is differed between a structural restraint factor and a multiplier taking the foundation properties into account (Eq. 3-4, ACI 1995).
FR kkk ⋅= Eq. 3-4
with k kR kF
Restraint factor [-] Structural restraint factor [-] Foundation restraint factor [-]
The structural restraint factor kR reflecting the geometry of the concrete block ac-cording to Figure 3-3 and ACI (1995) is approximated by:
5.21
2≥⇔
⎟⎟⎟⎟
⎠
⎞
⎜⎜⎜⎜
⎝
⎛
+
−=
HL
HLHL
k
Hh
R Eq. 3-5
5.210
1<⇔
⎟⎟⎟⎟
⎠
⎞
⎜⎜⎜⎜
⎝
⎛
+
−=
HL
HLHL
k
Hh
R Eq. 3-6
with L H h
Length of concrete block [m] Height of concrete block [m] Considered location above foundation [m]
Figure 3-4 shows the structural restraint factor at different distances from the base as function of the length to height ratio according to (a) ACI Equations 3-5 and 3-6
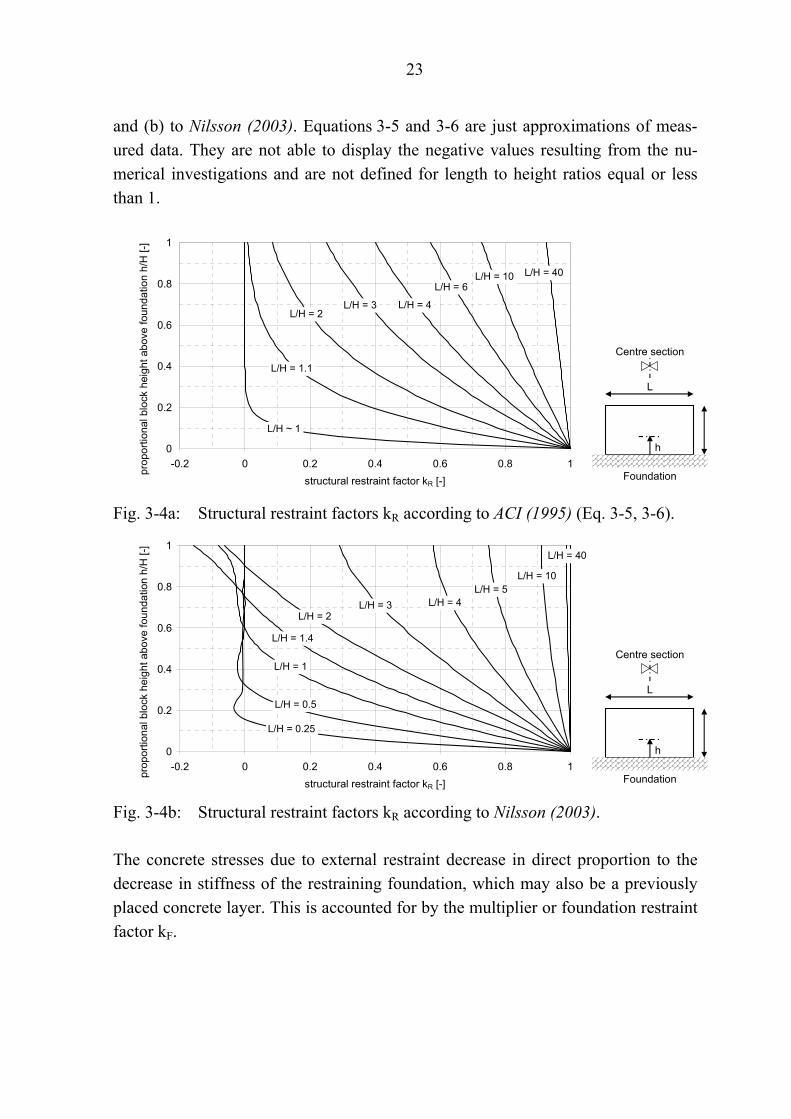
23
and (b) to Nilsson (2003). Equations 3-5 and 3-6 are just approximations of meas-ured data. They are not able to display the negative values resulting from the nu-merical investigations and are not defined for length to height ratios equal or less than 1.
0
0.2
0.4
0.6
0.8
1
-0.2 0 0.2 0.4 0.6 0.8 1structural restraint factor kR [-]
prop
ortio
nal b
lock
hei
ght a
bove
foun
datio
n h/
H [-
]
L/H = 6
L/H = 4L/H = 3
L/H ~ 1
L/H = 1.1
L/H = 2
L/H = 10 L/H = 40
Foundation
Centre section
L
h
Fig. 3-4a: Structural restraint factors kR according to ACI (1995) (Eq. 3-5, 3-6).
Foundation
Centre section
L
h0
0.2
0.4
0.6
0.8
1
-0.2 0 0.2 0.4 0.6 0.8 1structural restraint factor kR [-]
prop
ortio
nal b
lock
hei
ght a
bove
foun
datio
n h/
H [-
]
L/H = 0.25
L/H = 0.5
L/H = 1
L/H = 1.4
L/H = 2L/H = 3 L/H = 4
L/H = 5L/H = 10
L/H = 40
Fig. 3-4b: Structural restraint factors kR according to Nilsson (2003).
The concrete stresses due to external restraint decrease in direct proportion to the decrease in stiffness of the restraining foundation, which may also be a previously placed concrete layer. This is accounted for by the multiplier or foundation restraint factor kF.

24
FF
cgF
EAEAk
⋅⋅
+=
1
1 Eq. 3-7
with Ag AF Ec EF
Gross area of concrete cross section [m²] Area of restraint effective foundation [m²] Concrete modulus of elasticity [MPa] Foundation modulus of elasticity [MPa]
0
0.2
0.4
0.6
0.8
1
0.0 2.0 4.0 6.0 8.0 10.0stiffness ratio Ec/EF [-]
foun
datio
n re
stra
int f
acto
r kF
[-]
AF/Ag = 2.5
AF/Ag = 1
AF/Ag = 0.5
Fig. 3-5: Foundation restraint factor kF according to ACI (1995) (Eq. 3-7).
In conjunction with Equation 3-7 and Figure 3-5 it can be assumed that for mass concrete on rock, the maximum effective restraining area AF being 2.5-fold the con-crete cross section gross area Ag (ACI 1995).
Thermal strains and stresses due to internal restraint depend on the differential vol-ume changes resulting from temperature differentials within a concrete structure according to Figure 3-1. Its effects have to be superposed to the effects of external restraint unless their addition exceeds 100 % (ACI 1995). Therefore, where high external restraint conditions exist, the effects of internal restraints may be neglected. Figure 3-6 depicts the ACI model for internal restraint, which equals the external restraint model with the exception that the restraining plane is the plane of zero stress. Thus, the degree of internal restraint k is computed as the external structural restraint factor kR (Eq. 3-5 and 3-6), calculation of the restraint stresses follows Equation 3-3. A maximum value of kR = 1.0 will always exist at the exterior surface (USACE 1997). The location of the zero-stress-plane or its distance from the surface
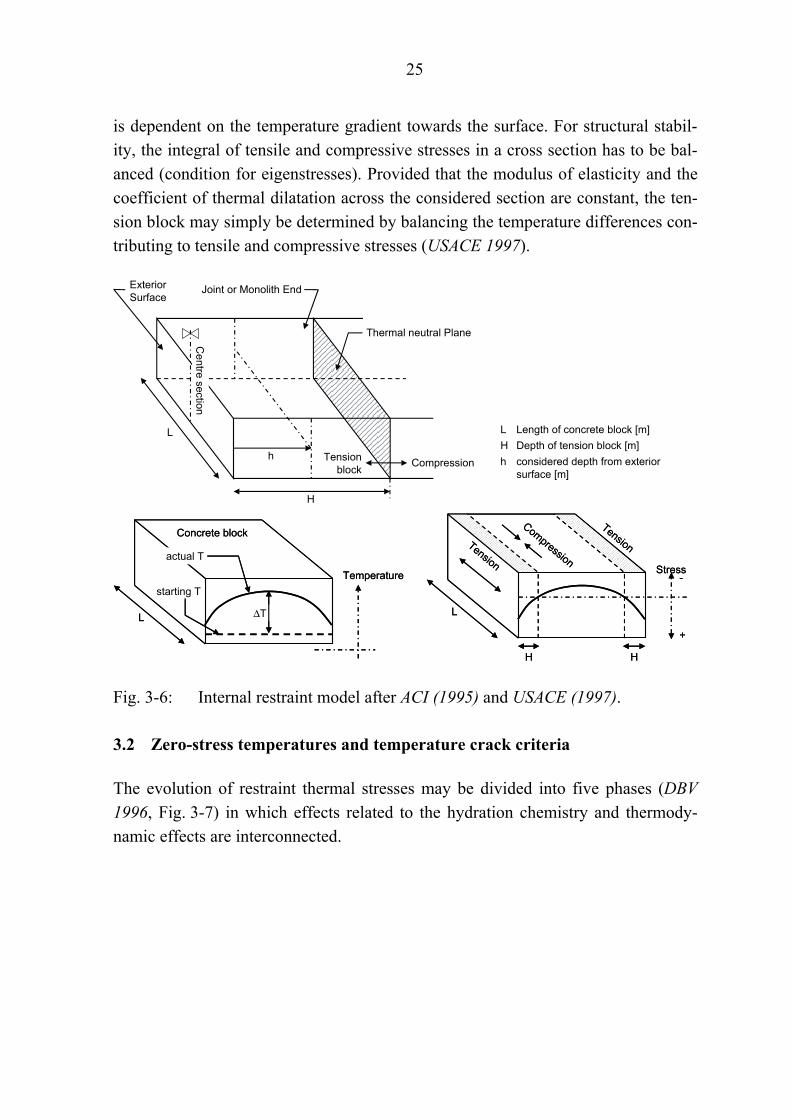
25
is dependent on the temperature gradient towards the surface. For structural stabil-ity, the integral of tensile and compressive stresses in a cross section has to be bal-anced (condition for eigenstresses). Provided that the modulus of elasticity and the coefficient of thermal dilatation across the considered section are constant, the ten-sion block may simply be determined by balancing the temperature differences con-tributing to tensile and compressive stresses (USACE 1997).
Stress
+
-
L
Tension
Compression
Tension
H H
Stress
+
-
L
Tension
Compression
Tension
H H
Concrete block
Temperature
L
actual T
starting T
ΔT
Concrete block
Temperature
L
actual T
starting T
ΔT
L Length of concrete block [m]H Depth of tension block [m]h considered depth from exterior
surface [m]CompressionTension
block
H
h
L
Joint or Monolith End
Thermal neutral Plane
ExteriorSurface
Centre secti on
Fig. 3-6: Internal restraint model after ACI (1995) and USACE (1997).
3.2 Zero-stress temperatures and temperature crack criteria
The evolution of restraint thermal stresses may be divided into five phases (DBV 1996, Fig. 3-7) in which effects related to the hydration chemistry and thermody-namic effects are interconnected.

26
placement temperatureT0
first zero-stress temperatureTN1
second zero-stress temperatureTN2
crack temperatureTcrack
tensile strengthft
placement temperatureT0
first zero-stress temperatureTN1
second zero-stress temperatureTN2
crack temperatureTcrack
tensile strengthft
Con
cret
est
ress
σ[M
Pa]
Con
cret
ete
mpe
ratu
reT
[°C
]
Time t
- Compression
+ Tension
Time t
TN1
TN2
TcrackT0
ft
tensile stresses
I II III VI V
Con
cret
est
ress
σ[M
Pa]
Con
cret
ete
mpe
ratu
reT
[°C
]
Time t
- Compression
+ Tension
Time t
TN1
TN2
TcrackT0
ft
tensile stresses
I II III VI V
Fig. 3-7: Qualitative restraint thermal stress behaviour of mass concrete.
Phase I
The contact between the cement and the mixing water directly initiates the exo-thermic hydration process within a few minutes and the clinker minerals start to turn into hydrates. The resulting temperature rise in the fresh concrete stays unno-ticed, due to the short duration of this initial impulse (Laube 1990). A subsequent dormant time decelerates the hydration reaction for approximately two hours (chemical retarders extend the dormant time). A dense shell forms around the alka-lis and prevents the free water to further hydrate the clinker minerals. Within this phase the concrete passes towards its initial set and begins to stiffen (Mindess et al. 2003). No restraint stresses are built up in this phase.
Phase II
The proceeding and accelerating concrete hydration causes a temperature rise. However, no restraint stresses evolve, due to the still considerable plastic concrete behaviour. During the second phase, the fresh concrete gains its rigidity and ap-proaches the point at which it can sustain some load (final set, Mindess et al. 2003). The first zero-stress temperature TN1 marks the end of the second phase and corre-sponds to the concrete’s change in state from a plastic liquid to a rigid body.
Phase III
The third phase denotes a major temperature rise until reaching the maximum tem-perature in the concrete. The maximum temperatures occur after some hours for

27
high cement content CVC and after some days for mass concrete and RCC. In this stage of hydration the concrete’s modulus of elasticity is still very low, accompa-nied by considerable relaxation effects. Only moderate compressive stresses are developing due to the thermal dilatation. Caused by chemical or autogenous shrink-age during the formation of hydrates (Neville and Brooks 1990), the maximum compressive stresses may be reached prior to the maximum concrete temperature.
Phase IV
The concrete cools down as more heat is dissipated than is produced within the con-crete volume. The stiffness has significantly increased and the moderate compres-sive restraint stresses disappear. The zero-stress-state, while changing from com-pressive to tensile stresses, is related to the second zero-stress temperature TN2 (Plannerer 2000), hereinafter only called zero-stress temperature, which considera-bly exceeds the first zero-stress temperature, but falls below the maximum tempera-ture. When relaxation effects are considered to be negligible (linear elastic material properties), the zero-stress temperature may be interpreted as a defined induced ma-terial property, so that during the lifetime of the concrete a zero-stress-state occurs at this certain temperature. A spatial distribution of significantly varying zero-stress temperatures results (zero-stress temperature-distribution, Springenschmid 1987) as a result of the temporal evolution of the concrete stiffness and varying temperature histories, related to the considered location within the massive concrete volume.
Phase V
At this stage, the hydration reaction starts dying out and the final concrete stiffness is approached. Further cooling of the restrained concrete mass leads to tensile stresses. A sufficient temperature drop below the zero-stress temperature may ex-ceed the tensile strength or the tensile strain capacity, and thermal cracking can oc-cur. The higher the zero-stress temperature in comparison to a finally approached stable temperature or temperature cycle in the concrete, the higher is the resulting potential of thermal induced cracking.
The knowledge about the distributed zero-stress temperatures is considered as the basis for a comprehensive determination of a possible thermal crack formation within a mass concrete structure (e.g. Plannerer 2000). However, the determination of zero-stress temperatures in a concrete structure is not a trivial problem, since all site and material related conditions actually represent influencing factors. Thus, in-

28
situ zero-stress temperatures may only be computed by use of highly sophisticated numerical models (e.g. Cervera et al. 2000 and 1999, Eierle 1999) or monitored locally by Stressmeters (Aufleger et al. 2003, Conrad et al. 2002a, Wiegrink 2002, Plannerer 2000).
Larson (2001) established an empirical equation (Eq. 3-8) for computing TN2 from a known temperature history as in Figure 3-7, considering the plastic concrete defor-mations by a plasticity coefficient k2 (Eq. 3-9). He performed numerical simulations of the thermal stress behaviour of a concrete wall, having taken different mixtures for conventional concrete (cement contents of 360 to 415 kg/m³, water-binder-ratios 0.4 to 0.5) and different restraint factors, among others, into account.
( ) 11max22 NNN TTTkT +−⋅= Eq. 3-8
with TN1 TN2 Tmax k2
First zero-stress temperature [°C] Second zero-stress temperature [°C] Peak temperature [°C] Plasticity coefficient [-]
Bwk ⋅−= 36.141.12 Eq. 3-9
with w/B Water-to-binder ratio [-]
Larson’s investigations resulted in values for k2 according to Table 3-1.
Tab. 3-1: Plasticity coefficients k2 for various concretes acc. to Larson (2001).
Concrete type 1 2 3 4 Cement content C [kg/m³]
378.5 415 380 360
Water-to-binder ratio w/B [-]
0.4 0.4 0.45 0.5
Average (comparison with Eq. 3-9)
0.836 (0.866)
0.860 (0.866)
0.804 (0.798)
0.725 (0.730)
Standard deviation ± 0.025 ± 0.046 ± 0.045 ± 0.039 Minimum - 0.773 0.715 0.646
Plasticity coefficient in Eq. 3-8 k2 [-]
Maximum - 0.949 0.895 0.813
29
The plasticity coefficient turned out to be not clearly related to ambient conditions and concrete placement temperatures. However, it decreased with decreasing re-straint.
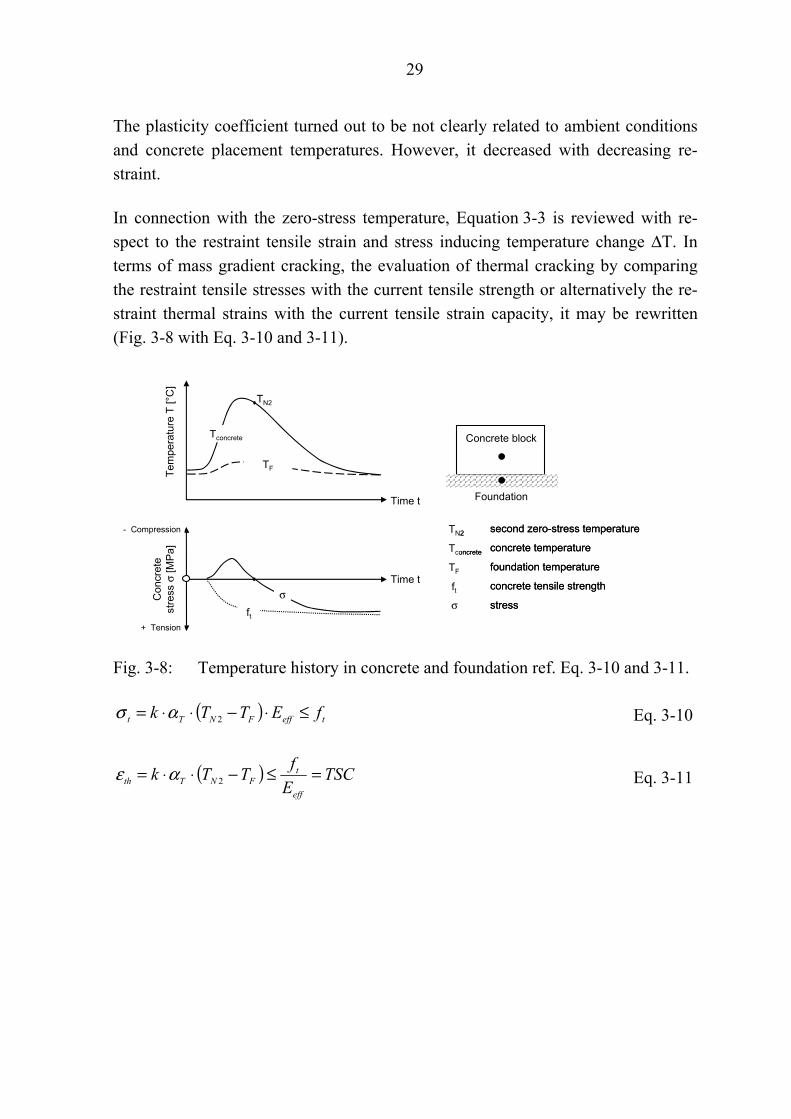
In connection with the zero-stress temperature, Equation 3-3 is reviewed with re-spect to the restraint tensile strain and stress inducing temperature change ΔT. In terms of mass gradient cracking, the evaluation of thermal cracking by comparing the restraint tensile stresses with the current tensile strength or alternatively the re-straint thermal strains with the current tensile strain capacity, it may be rewritten (Fig. 3-8 with Eq. 3-10 and 3-11).
second zero-stress temperatureTN2
concrete temperatureTconcrete
foundation temperatureTF
concrete tensile strengthft σ stress
second zero-stress temperatureTN2
concrete temperatureTconcrete
foundation temperatureTF
concrete tensile strengthft σ stress
Con
cret
est
ress
σ[M
Pa]
Tem
pera
ture
T [°
C]
Time t
- Compression
+ Tension
Time t
TN2
ft
Tconcrete
TF
σ
Foundation
Concrete block
Fig. 3-8: Temperature history in concrete and foundation ref. Eq. 3-10 and 3-11.
( ) teffFNTt fETTk ≤⋅−⋅⋅= 2ασ Eq. 3-10
( ) TSCEfTTkeff
tFNTth =≤−⋅⋅= 2αε Eq. 3-11

30
with σt αT k Eeff TN2 TF ft εth
TSC
Restraint tensile stress [MPa] Coefficient of thermal dilatation [K-1] Degree of restraint [-] Effective modulus of elasticity [MPa] (includes relaxation effects) Zero-stress temperature [°C] Foundation temperature [°C] Concrete tensile strength [MPa] Restraint thermal strain [-] Tensile strain capacity [-]
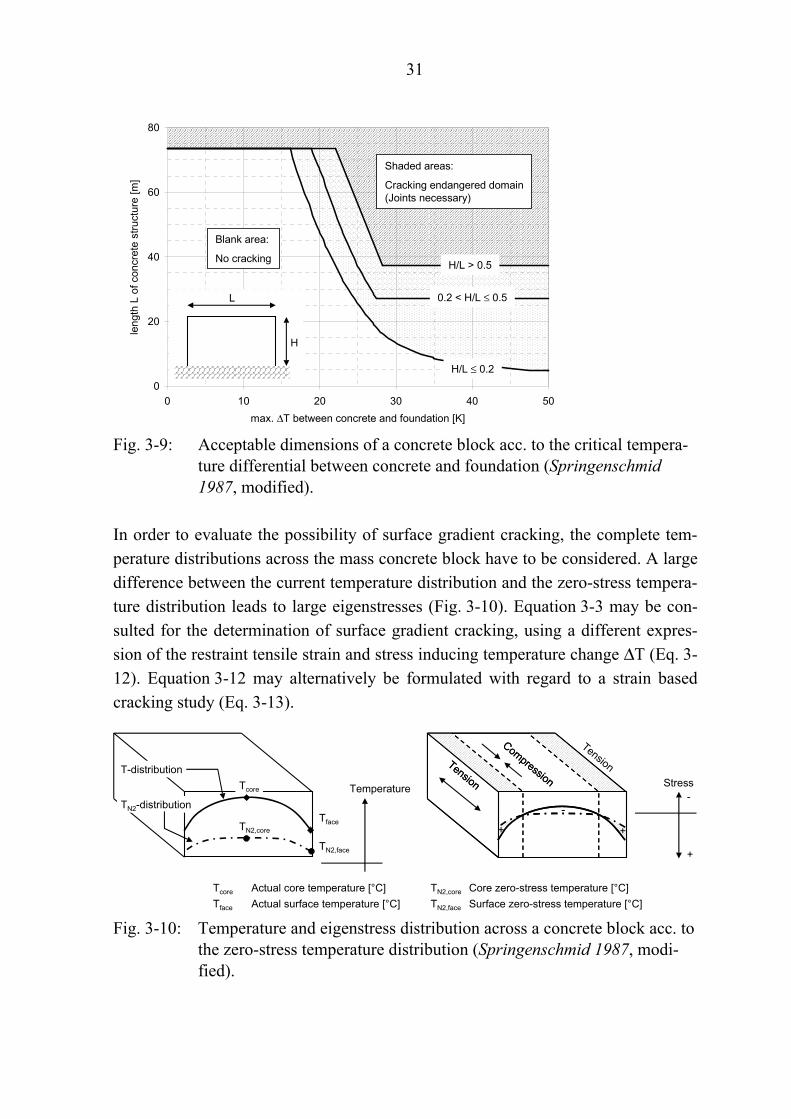
The difference between TN2 and TF in Equation 3-11 may be considered as a critical cooling magnitude. By assuming full restraint and typical RCC properties (αT ≈ 0.8 · 10-5 K-1, TSC ≈ 0.1 ‰) one may identify a critical cooling magnitude of 12.5 K below the zero-stress temperature before mass gradient cracking would oc-cur. Springenschmid (1987) states that in the construction of concrete dams, the concrete should not gain more than 25 K of heat while hydration. Translating this maximum heating into the same magnitude of cooling, a restraint multiplier kF of 0.5 has to be met at the restraining plane to avoid mass cracking. In order to prevent mass cracking in large structures, contraction joints have to be placed (see Chap-ter 1.3.3). Figure 3-9 presents the interrelation between the structures dimensions and critical cooling differentials, which were determined for arch dams. The chart shows the allowed length L of a concrete block in relation to a temperature differen-tial ΔT between the concrete block (average maximum temperature over its height H) and the restraining plane (rock or concrete). It relies on experiences and leaves the concrete’s tensile strength, relaxation properties and thermal dilatation aside.
It is obvious that critical cooling differentials are quite notable. In connection with the very slow cooling processes in the interior of a concrete dam, it turns out that mass cracks will not appear for a long period, often not until decades after the end of the dam construction in the case of gravity dams.
31
0
20
40
60
80
0 10 20 30 40 50max. ΔT between concrete and foundation [K]
leng
th L
of c
oncr
ete
stru
ctur
e [m
]
L
H
H/L ≤ 0.2
0.2 < H/L ≤ 0.5
H/L > 0.5
Shaded areas:
Cracking endangered domain(Joints necessary)
Blank area:
No cracking
Fig. 3-9: Acceptable dimensions of a concrete block acc. to the critical tempera-
ture differential between concrete and foundation (Springenschmid 1987, modified).
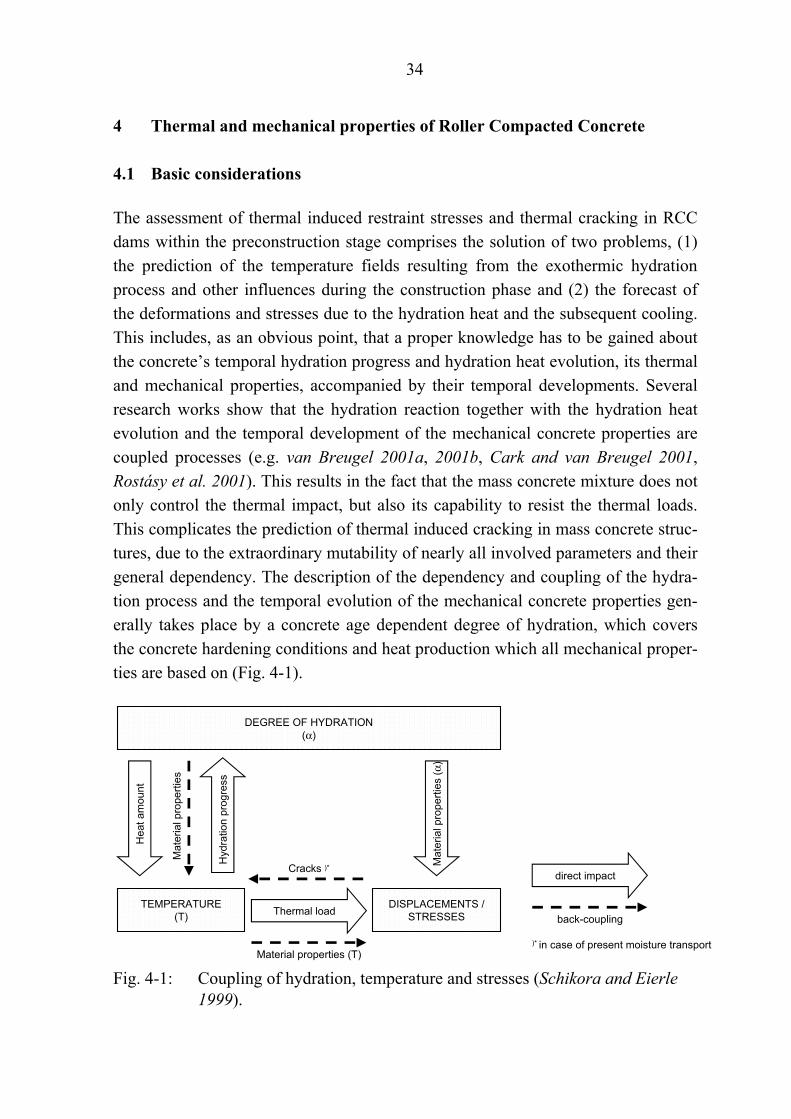
In order to evaluate the possibility of surface gradient cracking, the complete tem-perature distributions across the mass concrete block have to be considered. A large difference between the current temperature distribution and the zero-stress tempera-ture distribution leads to large eigenstresses (Fig. 3-10). Equation 3-3 may be con-sulted for the determination of surface gradient cracking, using a different expres-sion of the restraint tensile strain and stress inducing temperature change ΔT (Eq. 3-12). Equation 3-12 may alternatively be formulated with regard to a strain based cracking study (Eq. 3-13).
TN2,core Core zero-stress temperature [°C]TN2,face Surface zero-stress temperature [°C]
Tcore Actual core temperature [°C]Tface Actual surface temperature [°C]
Stress
+
-
TensionTension
Compression
++
-
Tension
Compression
++
-
Temperature
TN2,core
Tcore
Tface
TN2,face
TN2-distribution
T-distribution
Fig. 3-10: Temperature and eigenstress distribution across a concrete block acc. to
the zero-stress temperature distribution (Springenschmid 1987, modi-fied).

32
( ) teffNTt fETTk ≤⋅Δ−Δ⋅⋅= 2ασ Eq. 3-12
( ) TSCEfTTkeff
tNTth =≤Δ−Δ⋅⋅= 2αε Eq. 3-13
with ΔT ΔTN2
Current temperature differential = Tcore - Tface [K] Zero-stress temperature differential = TN2,core - TN2,face [K]
In the above context, the consideration of current and zero-stress temperature distri-butions points to the importance of temperature gradients in respect to surface cracking. In massive structures like concrete dams, these gradients especially evolv-ing at the surface near portions are of interest. Temperatures in the interior stretches are almost levelled due to the slow heat flow-off and the heat dissipation taking place at the surfaces. Consequently, surface cracking typically appears during the first low temperature period after concrete placement during dam construction. Springenschmid (1987) mentions rule-of-thumb values for critical temperature dif-ferentials regarding surface gradient cracking (Tab. 3-2), being based on then ex-periences with mass concrete for dams (binder contents between about 170 and 250 kg/m3).
Tab. 3-2: Rule-of-thumb temperature differentials acc. to Springenschmid (1987) causing surface cracking.
Structure width d [m] Critical temperature differential [K]
1 - 2 20
4 - 6 13 - 15
d
Tface
Tcore
> 2 dTface/dt ≤ 11/day (thermal shock)
The above presented temperature crack criteria in terms of maximum allowable temperature differentials reflect a ratio of the maximum tensile stress due to cooling of the structure and the current tensile strength of the concrete. This stress-to-strength ratio may also be referred to as cracking risk. The estimation of thermal induced cracking risks within a mass concrete structure based on a stress-to-strength ratio, however, is only suitable in uncracked structures. The determination of ther-mal cracking risks is afflicted with considerable uncertainties and sensitively reacts

33
on any change of the structures’ boundary conditions as occurring by any initiating crack (Eierle 1999). In this respect, a couple of constitutive approaches and material laws have been developed, which are hardly to apply accurately without having gained a full understanding of the considered concrete, generally by extensive and costly experimental campaigns. In the progress of this dissertation the expression of the cracking risk by use of the stress-to-strength ratio is therefore favoured. The de-termination of the thermal cracking risk within the preliminary planning stage of an RCC gravity dam using tangible engineering models and empirical relations is in the focus of this research work.
34
4 Thermal and mechanical properties of Roller Compacted Concrete
4.1 Basic considerations
The assessment of thermal induced restraint stresses and thermal cracking in RCC dams within the preconstruction stage comprises the solution of two problems, (1) the prediction of the temperature fields resulting from the exothermic hydration process and other influences during the construction phase and (2) the forecast of the deformations and stresses due to the hydration heat and the subsequent cooling. This includes, as an obvious point, that a proper knowledge has to be gained about the concrete’s temporal hydration progress and hydration heat evolution, its thermal and mechanical properties, accompanied by their temporal developments. Several research works show that the hydration reaction together with the hydration heat evolution and the temporal development of the mechanical concrete properties are coupled processes (e.g. van Breugel 2001a, 2001b, Cark and van Breugel 2001, Rostásy et al. 2001). This results in the fact that the mass concrete mixture does not only control the thermal impact, but also its capability to resist the thermal loads. This complicates the prediction of thermal induced cracking in mass concrete struc-tures, due to the extraordinary mutability of nearly all involved parameters and their general dependency. The description of the dependency and coupling of the hydra-tion process and the temporal evolution of the mechanical concrete properties gen-erally takes place by a concrete age dependent degree of hydration, which covers the concrete hardening conditions and heat production which all mechanical proper-ties are based on (Fig. 4-1).
Hyd
ratio
n pr
ogre
ss
Hea
t am
ount
DEGREE OF HYDRATION(α)
DISPLACEMENTS /STRESSES
TEMPERATURE(T) Thermal load
Mat
eria
l pro
perti
es (α
)
Mat
eria
l pro
perti
es
Material properties (T)
Cracks )*direct impact
back-coupling
)* in case of present moisture transport
Fig. 4-1: Coupling of hydration, temperature and stresses (Schikora and Eierle 1999).

35
The previous remarks point to the computational treatment of thermal stress and cracking predictions as an advance to Chapter 6. Two policies may be pursued, re-flecting different coupling degrees between the thermal and structural problem and according variable complexities. The approximate approach represents the quasi-static load case of dissipating hydration heat by usage of average mechanical prop-erties during the cooling phase. Corresponding equations for the estimation of strains and stresses have already been presented in Chapter 3. Alternatively, time elapsed approaches may be applied, simulating transient temperature fields and de-veloping mechanical properties under the precondition of a known hydration heat evolution. The possible coupling degrees with regard to the according problems are summed up in Table 4-1.
Tab. 4-1: Coupling degrees regarding the solution of thermal and structural prob-lems acc. to Schikora and Eierle 1999.
Coupling degree Features / Remarks
A Full coupling • Simultaneous computation of tem-
perature and strain / stress fields
B Unidirectional coupling with hydration fields calculation
• Transient computation of temperature and hydration states in a first step
• Successive separate computation of displacements / stresses with tempera-ture loads from first step
• Degree of hydration as main parame-ter for concrete properties evolution in the structural analysis
C Unidirectional coupling without hydration fields calculation
• Phased analysis referred to B • No simulation of hydration states • Explicit hydration heat input (advan-
tageous: hydration heat of considered concrete from in-situ measurements in modelled structure) or direct input of temperature and hydration evolution
D Approximate method with sub-stitute temperature load
• Substitute temperature load on struc-ture and execution of a static compu-tation
• Stress state by use of effective average mechanical properties

36
The required investigations in terms of the concrete technology are usually not on hand in the preliminary planning phase of an RCC dam and the efforts for gaining the numerous parameters for the description of the RCC properties to maintain a high degree of coupling are unjustifiable. In the frame of the numerical simulation of the thermal stress behaviour of an RCC dam presented in Chapter 6, some mate-rial and construction related parameters are estimated from others in an empirical way. The chosen type of analysis refers to the coupling degrees C with certain as-pects of D according to Table 4-1 and sets the degree of hydration aside. Conse-quently, the degree of hydration and the dependency of the RCC properties is not considered further and a phenomenological model is emphasised.
4.2 Thermal properties of RCC
The prediction of the transient temperature fields appearing in the RCC dam com-plies to the Fourier differential equation of thermal conduction presented in Equa-tion 4-1, which itemises the involved thermal RCC properties addressed subse-quently. Its derivation is shown in e.g. ANSYS (2003).
⎟⎟⎠
⎞⎜⎜⎝
⎛∂∂+
∂∂+
∂∂+⋅
⋅=
∂∂
2
2
2
2
2
2)(zT
yT
xTtq
ctT V
λρλ Eq. 4-1
with T t qV(t) λ c ρ x, y, z
Temperature [K] Time [s] Volumetric hydration heat production rate [J/s.m3] Thermal conductivity [W/m.K] Specific heat [J/kg.K] Density [kg/m3] Coordinates in Cartesian space
Equation 4-1 presumes that the RCC is a homogenous, isotropic material in which the material properties λ, c and ρ are time and temperature independent.
4.2.1 Hydration heat and concrete maturity
The rate of hydration heat q(t) evolving during the concrete hardening phase is the determining process variable for the thermal load acting on the RCC dam structure. The prediction of the hydration heat of RCC within this work especially takes the
37
cement or, more general, the binder (quantity, composition) into account. The con-crete temperatures with regard to the concrete maturity will additionally be ad-dressed, although not further regarded. Other parameters like binder grain size dis-tribution, fineness and the water-to-binder ratio, important for micro-structural mod-els, are not included, though they have attached importance in the prediction of the hydration heat (e.g. van Breugel 2001a and 2001b). The prediction of the hydration heat in this work is uniquely based on empirical findings available in literature.
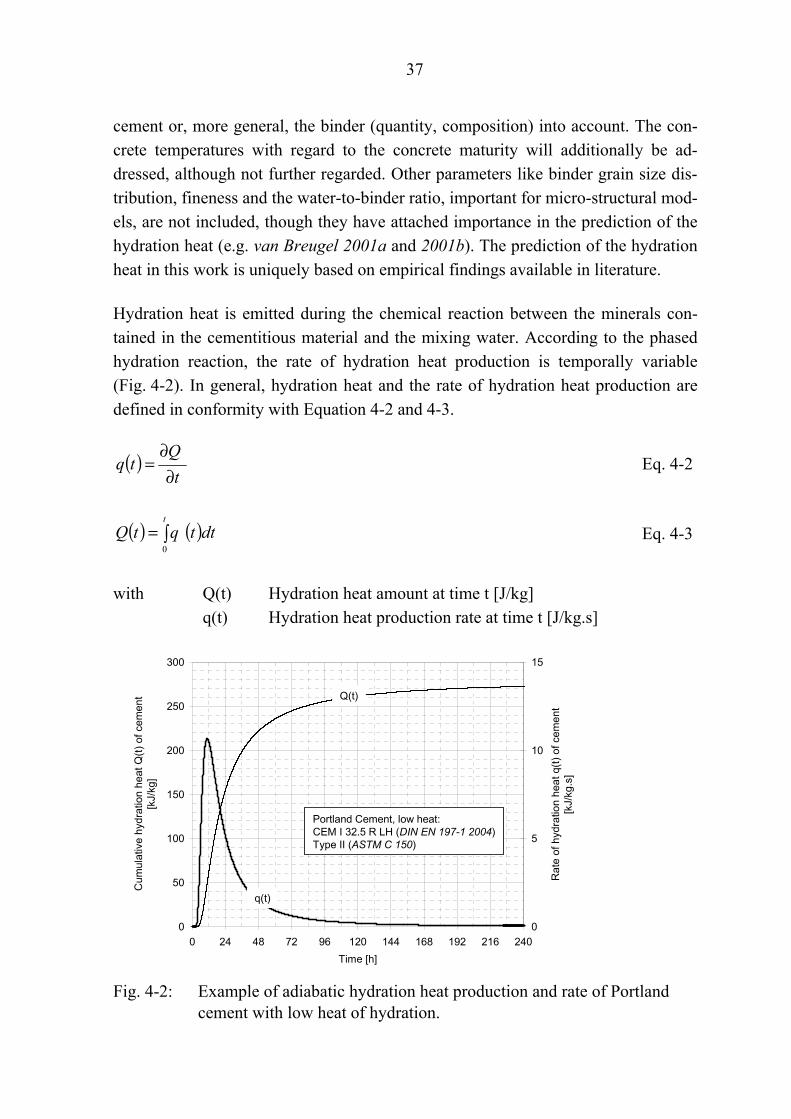
Hydration heat is emitted during the chemical reaction between the minerals con-tained in the cementitious material and the mixing water. According to the phased hydration reaction, the rate of hydration heat production is temporally variable (Fig. 4-2). In general, hydration heat and the rate of hydration heat production are defined in conformity with Equation 4-2 and 4-3.
( )t
Qtq
∂∂
= Eq. 4-2
( ) ( )∫=t
dttqtQ0
Eq. 4-3
with Q(t) q(t)
Hydration heat amount at time t [J/kg] Hydration heat production rate at time t [J/kg.s]
0
50
100
150
200
250
300
0 24 48 72 96 120 144 168 192 216 240Time [h]
Cum
ulat
ive
hydr
atio
n he
at Q
(t) o
f cem
ent
[kJ/
kg]
0
5
10
15
Rat
e of
hyd
ratio
n he
at q
(t) o
f cem
ent
[kJ/
kg.s
]
Q(t)
q(t)
Portland Cement, low heat:CEM I 32.5 R LH (DIN EN 197-1 2004)Type II (ASTM C 150)
Fig. 4-2: Example of adiabatic hydration heat production and rate of Portland
cement with low heat of hydration.

38
The hydration heat amount is determined from laboratory tests, of which different kinds are applied in practice, based on different boundary conditions. Principally, adiabatic or semi-adiabatic tests as opposite to isothermal tests6 are conducted, showing completely different results in respect of the temporal evolution of the hy-dration heat. These tests may be performed on either pure cement samples in a small scale or large concrete samples, delivering procedure and boundary condition re-lated results for a specific cement or concrete mixture. In this context, the adiabatic condition describes an isolated system in the sense of thermodynamics, without any heat losses or gains via the system’s outer boundaries. For the RCC volume, this means that the emitted hydration heat is completely transferred into a temperature increase. The hydration heat emission in an isothermal test is based on a constant ambient temperature as well as on a constant sample temperature. Finally, a semi-adiabatic test mostly relies on an almost constant ambient, but accidental sample temperature, when heat losses occur via the sample’s surfaces.
The temperature influence on the hydration reaction is covered by a maturity func-tion of which a variety exists (Lopez-Madaleno 2002, Eierle 1999). The use of such maturity function offers the possibility to transfer non-isothermal conditions into isothermal ones and vice-versa, which is done by a simple time transformation based on the equity of the total emitted hydration heat amount of a given binder, disregarding the process temperature (Eq. 4-4). The transformed time for an as-sumed standard isothermal process temperature is generally known as equivalent time or effective concrete age te, which is computed by help of a real non-isothermal temperature Ti and an assumed maturity function Ft(Ti) relying only on a standard temperature TS (Eq. 4-5). According to the followed standards in Germany and the U.S., the applied standard temperature TS is 20 °C and 23 °C, respectively. More on this topic and the evaluation of different maturity functions can be found in Eierle (1999). According to this evaluation the maturity concept of Freiesleben is preferred (Eq. 4-6). Lastly, the interlinking of the above implications in respect of the adiabatic and isothermal hydration heat rate qadiabatic and qisothermal can be ex-pressed by Equation 4-7. The maturity of a given concrete under in-situ structural conditions is most relevant in conjunction with the in-situ temporal evolution of the
6 Perfectly adiabatic or isothermal hydration heat tests are hardly to perform. Adiabatic conditions can be assumed for very large samples or for the application of insulations in order to neglect heat exchange. Isothermal conditions may exist for specimen which are small enough to neglect their temperature change.

39
mechanical concrete parameters and the evaluation of in-situ strengths in contrast to the strengths being tested in the laboratory.
)()( eisothermaliadiabatic tQtQ = Eq. 4-4
with Q te
ti
Hydration heat amount [J/kg] Equivalent time acc. to standard temperature TS [s, h, d] Process time of the non-isothermal reaction [s, h, d]
))(()(00
iit
it
ite tTFdtTFt Δ⋅≈= ∑∫ Eq. 4-5
with te
ti Ti Δti Ft(Ti)
Equivalent time according to standard temperature [s, h, d] Process time of the non-isothermal reaction [s, h, d] Average non-isothermal temperature in interval i [°C] Duration of process time interval [s, h, d] Maturity multiplier acc. to current process tempera-ture in time interval i [-]
where
⎥⎦
⎤⎢⎣
⎡⎟⎟⎠
⎞⎜⎜⎝
⎛+
−+
⋅=iS
Ait TTR
ETF273
1273
1exp)( Eq. 4-6
with EA R Ti
Activation energy [kJ/mol] For Portland cement: EA = 33.5 [kJ/mol] for Ti ≥ 20 °C EA = 33.5 + 1.47 ⋅ (273 - Ti) [kJ/mol] for Ti < 20 °C For blast furnace slag cement: EA = 49.88 [kJ/mol] Gas constant = 8.341 ⋅ 10-3 [kJ/mol.K] Average non-isothermal temperature in interval i [°C] for Ti < 68 °C
)()()( iteisothermaliadiabatic TFtqtq ⋅= Eq. 4-7

40
with qadiabatic qisothermal
Adiabatic hydration heat rate [J/kg.s] Isothermal hydration heat rate [J/kg.s]
Figure 4-3 displays the transformation of an adiabatic hydration heat evolution into an isothermal one, using the above Equations 4-4 to 4-7 applied to Figure 4-2.
0
5
10
15
0 24 48 72 96 120 144 168 192 216 240Time ti, te [h]
Hyd
ratio
n he
at ra
te q
(t) o
f cem
ent
[kJ/
kg]
0
50
100
150
200
250
300
0 24 48 72 96 120 144 168 192 216 240Time ti, te [h]
Cum
ulat
ive
hydr
atio
n he
at Q
(t) o
f cem
ent
[kJ/
kg]
Qadiabatic(ti)
Qisothermal(te)
Portland Cement, low heat:CEM I 32.5 R LH (EN 197-1 2004)Type II (ASTM C 150)TS = 20 °C
ΔQ
Δti
Δti Δte
Δte
qadiabatic(ti)
qisothermal(te)
Hyd
ratio
n he
at ra
te q
(t) o
f cem
ent
[kJ/
kg.s
]
Fig. 4-3: Adiabatic and isothermal hydration heat liberation of Portland cement
acc. to Fig. 4-2 and Eq. 4-4 to 4-7.
Considering the modelling of temperature fields within the preliminary planning stage of an RCC dam and the corresponding input of the correct hydration heat evo-lution into a numerical model, two facts have to be highlighted as important hy-

41
potheses within this thesis, finally leading to the suggested and applied generation of the hydration heat input.
(1) The thermal boundary conditions during a laboratory test for the determination of the hydration heat of a certain concrete mixture are hardly comparable to those in the real structure to be modelled.
(2) For a probably envisaged accurate micro-structural, mathematical determination of the hydration heat the various necessary concrete parameters are not on hand within the preliminary planning stage and their experimental determination for pa-rametric studies would be too costly.
Regarding these two hypotheses and the focused accurate modelling of temperature fields in the dam the question has to be raised, which of the mentioned hydration heat generation developments under the certain thermal boundary conditions are the ones best meeting those predominant in the RCC dam? It should be stated here that an experimental determination of the hydration heat development is inevitable for the detailed RCC dam design. It is generally suggested to derive it from large scale concrete blocks or trial test sections being placed close to the construction site (e.g. for Mujib Dam, Jordan, Schrader 2001) by either temperature measurements or numerical back-analyses. The realistic RCC mixture and construction site condi-tions should be reflected.
However, in the preliminary planning stage the adiabatic hydration heat generation is usually requested (e.g. USACE 2001, Tatro et al. 2000). As the rate of RCC placement is fast and mostly wooden formworks are utilised at the facings, in addi-tion to the fact that the hydration heat liberation initially occurs at a fast rate, adia-batic conditions may be assumed within the RCC dam. Formworks act as insula-tions as well as subsequently placed RCC layers, not allowing the evolving heat to dissipate (Dunstan and Ortega Santos 2001). Springenschmid (1987) also mentions that the most important thermal material characteristic, apart from the concrete placement temperature, is its adiabatic temperature rise. For large mass concrete members, Eierle (1999) mentions an estimation of the governing interior tempera-ture (e.g. foundation slabs of 1 to 2 m in height), which the hardening concrete is subjected to. It may be accounted for as the sum of concrete placement temperature and 2/3 of the adiabatic temperature rise.

42
The temperature rise due to the hydration reaction within the unit volume of a given RCC is computed according to Equation 4-8. When applying the adiabatic hydra-tion heat Qadiabatic(t), the result corresponds to the adiabatic temperature rise. Equa-tion 4-8 also demonstrates the increasing temperature rise with increasing cement or binder content.
cZtQ
ctQtT V
⋅⋅=
⋅=Δ
ρρ)()()( Eq. 4-8
with QV(t) Q(t) Z ρ c
Volumetric hydration heat of RCC at time t [J/m3] Hydration heat of cementitious material at time t [J/kg] Cementitious content of RCC [kg/m3] Density of RCC [kg/m3] Specific heat of RCC [J/kg.K]
For preliminary thermal stress studies of RCC gravity dams, the hydration heat in-put in form of the adiabatic temperature rise is taken from experiences with compa-rable RCC mixtures with equal cementitious materials and aggregate types. This is a methodology delivering results accurate enough for the mentioned studies, but, however, not reflecting the real chemical composition of the locally available ce-ments, which would be selected within the project realisation. With regard to an RCC mixture containing Portland cement without addition of pozzolan or slag, the hydration heat liberation can be determined by the chemical composition and the according hydration reactions of the individual clinker minerals. This method is usually referred to as Bogue calculations (Mindess et al. 2003) and relies on the full hydration of the cement (w/B-ratio > 0.42). The chemical composition of the ce-ment is principally known from the manufacturers’ quality control. Table 4-2 shows the typical chemical constituents (oxides) of a Portland cement.

43
Tab. 4-2: Oxide and clinker phase composition of Portland cements (Mindess et al. 2003).
Fraction Common name Short notation
CaO SiO2 Al2O3 Fe2O3 MgO K2O Na2O SO3
Lime Silica
Alumina Ferric oxide Magnesia
Alkali Alkali
Sulfur trioxide
C S A F M K N Ŝ
Clinker phases
Tricalcium silicate Dicalcium silicate
Tricalcium aluminate Tetracalcium aluminoferrite
C3S C2S C3A
C4AF
Mindess et al. (2003) present the equations in relation to a Bogue calculation of the different clinker phases from the various oxides present in a Portland cement (refer-ring to ASTM C 150 and Table 4-2). The clinker phases develop after the addition of the mixing water. The short notations in the Bogue equations refer to mass per-centages within the tested cement.
• Case A: 64.0≥FA
C3S = 4.071 C – 7.600 S – 6.718 A – 1.430 F – 2.852 Ŝ
C2S = 2.867 S – 0.7544 C3S
C3A = 2.650 A – 1.692 F
C4AF = 3.043 F
Eq. 4-9
Eq. 4-10
Eq. 4-11
Eq. 4-12

44
• Case B: 64.0<FA
C3S = 4.071 C – 7.600 S – 4.479 A – 2.859 F – 2.852 Ŝ
C2S = 2.867 S – 0.7544 C3S
C3A = 0
C4AF = 2.100 A + 3.043 F
Eq. 4-13
Eq. 4-14
Eq. 4-15
Eq. 4-16
The hydration contributions to the heat evolution are dominated by C3S and C3A, particularly in the early hydration process. When the enthalpy of the hydration reac-tion for the certain hydrate reactions and the current hydrate composition is known, the hydration heat at any given time can be computed (Eq. 4-17).
AFCdACcSCbSCatQ 4323)( ⋅+⋅+⋅+⋅= Eq. 4-17
with Q(t) a, b, c, d C3S
Hydration heat of Portland cement [kJ/kg] Factors [-], Tab. 4-4 Hydration heat liberated after full hydration of clinker phase as weight fractions of cement (Eq. 4-9 to 4-16), accordingly for other clinker phases, Tab. 4-3 [kJ/kg]
The hydration heat contributions of the single clinker phases are presented in Ta-ble 4-3. Varying values can be found in literature.
In respect of the temporal development of the hydration heat of the individual clinker phases Eierle (1999) gives values for the factors a to d according to Equa-tion 4-17 (Tab. 4-4). These factors can be interpolated for the intermediate hydra-tion stages by using a nonlinear regression function of the exponential type accord-ing to Table 4-5 including Equation 4-18.

45
Tab. 4-3: Hydration heat of clinker phases after full hydration.
Clinker phase Hydration heat [kJ/kg] Remarks
C3S
500 517 520 502
Eierle (1999) Bentz and Remond (1997) Mindess et al. (2003) Neville and Brooks (1990)
C2S 250 262 260
Eierle (1999) Bentz and Remond (1997) Mindess et al. (2003), Neville and Brooks (1990)
C3A
870 1 340 1 144 880
1 670 1 140
867
Eierle (1999) Eierle (1999), Portland cement with SO3 Bentz and Remond (1997) Mindess et al. (2003), low gypsum content Mindess et al. (2003), high gypsum contentMindess et al. (2003), medium gypsum content Neville and Brooks (1990)
C4AF
420 725 730
419
Eierle (1999), Mindess et al. (2003) Bentz and Remond (1997) Mindess et al. (2003), for ettringite forma-tion Neville and Brooks (1990)
Tab. 4-4: Factors a to d acc. to Eq. 4-17 (Eierle 1999).
Age [d] Clinker phaseFactor
3 7 28 90 180 360 a 3.4 3.8 4.2 4.6 5.0 5.0 C3S b 0.4 0.8 1.3 1.7 2.1 2.5 C2S c 7.1 7.5 8.0 8.4 8.8 9.2 C3A d 0.8 1.3 1.7 2.1 2.5 2.9 C4AF
46
)exp()()( wtgtFactortFactor ⋅⋅∞== Eq. 4-18
with Factor(t) Factor(t=∞) t g, w
Interpolated factor a, b, c, d acc. to Eq. 4-17 [-] Factor a, b, c, d at infinite time (extrapolated) [-] Time [d] Form factors for best fit regression [-]
Tab. 4-5: Nonlinear regression of factors a, b, c, d acc. to Table 4-4.
Regression parameters ref. to Eq. 4-18 Factor
Factor(t=∞) g w R2
a 5.2 -0.8 -0.44 0.997 b 2.95 -2.7 -0.42 0.989 c 11.5 -0.61 -0.17 0.999 d 4.1 -2.4 -0.33 0.993
Figure 4-4 depicts the hydration heat of the ASTM Type I cement of a Jordanian supplier, which has been determined according to Equations 4-17 and 4-18. The determined hydration heat from the clinker phases is compared to the hydration heat, which has been back-analysed within a finite element thermal study of the RCC trial test at Mujib Dam (Jordan, Schrader 2001) and further to the hydration heat measured under laboratory conditions in an adiabatic hydration heat test by Malkawi et al. (2003). Additionally, the estimated hydration heat from in-situ tem-perature measurements at Mujib Dam (Jordan) is shown. Figure 4-4 proofs the prin-cipal adequacy of the Bogue methodology in combination with the individual hy-dration heat of the clinker phases to determine the hydration heat evolution of Port-land cement in RCC gravity dams. The close correlation between these values and the ones occurring in practice confirms the general assumption of adiabatic harden-ing conditions for the RCC inside the dam.

47
0
100
200
300
400
500
0.00 0.01 1.00 100.00Time [d]
Hyd
ratio
n he
at Q
(t) [k
J/kg
]
Eq. 4-17 & Eq. 4-18Schrader (2001)Malkawi et al. (2003)Mujib Dam (Jordan)
Ordinary Portland Cement(Jordan Cement Factory)
Oxide composition[% cement mass fraction]
SiO2 19.74Al2O3 5.13Fe2O3 3.19CaO 63.93MgO 3.13Na2O 0.095K2O 0.65SO3 2.99
Time [d] Fig. 4-4: Hydration heat of a ASTM Type I cement determined by different pro-
cedures and from in-situ measurements in an RCC dam.
The Bogue methodology actually works only for RCC mixtures containing pure Portland cement without the addition of pozzolan or other additives. When poz-zolana are used as a replacement of a portion of the cement, the hydration of the Portland cement is accompanied by a pozzolanic hydration reaction, which is not considered in Equations 4-9 to 4-16. The pozzolanic reaction greatly modifies the hydration heat evolution in the RCC, especially in early ages. The different chemis-try in the formation of the clinker phases also ends up in a lower hydration heat lib-eration of the blend. The effect extensively depends on the type and composition of the pozzolan applied (ACI 1997). The same is valid when blast furnace slag is ap-plied as a substitute for the cement (De Schutter 1999). Mathematical models have been developed for the hydration of blast furnace slag cements (e.g. De Schutter 1999), but also in the frame of this topic empirical approaches can be followed, de-livering adequate results in respect of preliminary thermal studies.
ACI (1997) suggests a “fairly working well” rule of thumb that added pozzolan con-tributes to 50 % of the hydration heat normally liberated by the replaced cement. A replacement of 20 % of cement by e.g. fly ash would return a hydration heat of the blend of 90 % of that of the pure cement containing mixture. ACI (1995) has refined earlier, that the relative contribution of the pozzolan to the heat of hydration in-creases with the concrete age and is in the range of 15 to 35 % from that of the same weight of cement at early ages, which is confirmed by the results of Frías et al.

48
(2000). Atiş (2002) reports about the heat evolution of high-volume fly ash con-crete. According to his investigations a replacement of 50 % of ordinary Portland cement by a class F fly ash resulted in the reduction of the adiabatic temperature rise of 23 %. His conclusion from this is that moderate replacement rates between 20 to 30 % do not contribute considerably to the reduction of hydration heat. Mindess et al. (2003) describe the hydration of slag and fly ash with the formation of mainly C2S phases at the expense of the formation of C3S phases. The higher weight fraction of C2S phases and the lower content of C3S phases in a blended ce-ment or concrete with combined binder are the decisive factors for the decelerating hydration process and the reduced overall heat.
Applying the latter, the hydration heat of blended cements or concrete with com-bined cementitious content can be preliminarily computed according to the Bogue calculation methodology, if the clinker phases are determined from the oxide com-pounds of the pure cement being present in the mixture. The C2S phase is increased and the C3S phase is decreased by the percentage of mass fraction of the cementi-tious material being pozzolan. Figure 4-5 shows the correlation between the hydra-tion heat of pure and blended cements modelled by the Bogue calculation according to the above proposed methodology and the associated values from tests or back-analyses presented in literature.
0
100
200
300
400
500
0 100 200 300 400 500
Hydration heat Q(t) by Bogue calculation [kJ/kg]
Hyd
ratio
n he
at Q
(t) m
easu
red
/ ana
lyse
d [k
J/kg
]
Cao et al. (1999)Langan et al. (2002)Langan et al. (2002)Li et al. (2004)Li et al. (2004)Li et al. (2004), High-BeliteLin et al. (1999)Long et al. (1999)Malkawi et al. (2003)Malkawi et al. (2003)Schrader (2001)Shatnawi (2004)
Filled symbols:100% cement
Empty symbols:Binders including 10 - 65%of pozzolan
Fig. 4-5: Comparison between the prediction of the hydration heat of pure and
blended cement by the proposed Bogue calculation and according lit-erature values.

49
Figure 4-5 confirms the good applicability of the prediction suggested above for the hydration heat of pure and composite cements from the oxide compounds when Portland cement is applied (average variation of 14 %). The methodology results in worse fitting predictions for high-silica-cements with high amounts of Silica and Alumina and low amounts of Lime as seen with the data from Cao and Zhang (1999) and Li et al. (2004) due to the breaking down of Bogue’s formulas under such conditions (average variation of 90 %).
In terms of the prediction of the hydration heat of RCC or in general mass concrete for the modelling of temperature fields, it is of great importance to consider the evo-lution of the hydration heat in excess of 28 days, which is usually regarded as the typical time frame in conventional concrete technology. However, the heat devel-opment in large concrete masses with typical mass concrete mixtures (lower cement content, presence of retarding pozzolan) is significantly delayed and a temperature rise can be expected even after 28 days. ACI (1999) suggests the additional testing of the hydration heat of RCC mixes containing more than 30 % of fly ash as con-stituent of the cementitious material after 56 days. With regard to the modelling and the applied small time steps it is necessary to provide the associated hydration heat input for each time step. An interpolation by help of Equation 4-19 will be appro-priate for concrete ages in between the typically in the laboratory determined values at ages of 1, 3, 7, 14, 28 and 56 days.
)exp()()( wtgtQtQ ⋅⋅∞== Eq. 4-19
with Q(t) Q(t=∞) t g, w
Hydration heat amount [kJ/kg] Hydration heat amount at infinite time (sample age 56 d or more) [kJ/kg] Time [d] Form factors for best fit regression [-]
The presented comparisons show that laboratory tests are inevitable for advanced planning stages, when accurate hydration heat values and evolutions are demanded for detailed analyses. In particular, this is important when pozzolan or cements dif-ferent from Portland cement are applied, since their influence on the hydration heat evolution is hard to predict.
50
4.2.2 RCC specific weight
The RCC specific weight ρ [kg/m3] actually does not represent a thermodynamic property, but plays an important role within the thermodynamic processes. Typical values for mass concrete are between 2 240 and around 2 600 kg/m3. Its computa-tion from the single RCC components cementitious materials, water, aggregates and void volume after compaction is shown in Equation 4-20.
Pmmmmmmmm
Vm
W
W
G
G
F
F
C
C
WGFCconcrete
++++
+++==
ρρρρ
ρ Eq. 4-20
with ρconcrete
m V mC mF mG mW P ρC ρF
ρG ρW
RCC specific weight [kg/m3] Mass of compacted RCC volume [kg] Compacted RCC unit volume [m3] Cement mass per RCC unit volume [kg] Pozzolan mass per RCC unit volume [kg] Aggregate mass per RCC unit volume [kg] Water mass per RCC unit volume [kg] Air volume in compacted RCC [m3] Cement density [kg/m3], 3 150 kg/m3 Pozzolan density [kg/m3], 2 300 kg/m3, Slag 3 000 kg/m3 Aggregate density [kg/m3] Water density [kg/m3], 1 000 kg/m3
The RCC specific weight is dominated by the specific weight of the applied aggre-gates. Compared to CVC produced with the same aggregates, RCC mixtures result in a slightly higher density due to less entrained air and the low water content. Fully compacted RCC has a typical air volume of 0.5 to 2 % and a 2 to 4 % higher density than CVC (ACI 1999, Andriolo 1998). For the sake of completeness Figure 4-6 pre-sents the specific weights of the various aggregates adequate for RCC mixtures (da-tabase from Lama and Vutukuri (1978), Čermák and Rybach (1982)).
A variation of the specific weight within the typical range of values (variation of ± 7 % for an average specific weight of 2 400 kg/m3) results in variations of the adiabatic temperature rise of approximately ± 6 % according to Equation 4-8. An

51
underestimation of the RCC specific weight hereby leads to an almost inversely proportional higher adiabatic temperature rise.
1
2
3
4
5A
ndes
it
Bas
alt
Dia
bas
Dio
rite
Dol
erite
Gab
bro
Gra
nite
Por
phyr
y / P
orph
yrite
Sye
nite
Con
glom
erat
e
Dol
omite
/ M
arbl
e
Lim
esto
ne
San
dsto
ne
Am
phib
olite
Gne
iss
Gra
nulit
e
Gre
ywac
ke
Qua
rzite
Ser
pent
inite
Spe
cific
wei
ght [
kg/m
³]
IGNEOUS ROCKS SEDIMENT ROCKS
METAMORPHIC ROCKS
Average Range
NO
DAT
A
Fig. 4-6: Specific weights of mass concrete aggregates (Lama and Vutukuri
1978, Čermák and Rybach 1982).
4.2.3 Thermal conductivity of RCC
The thermal conductivity λ [W/m.K] describes the uniform heat flux through an RCC body of a unit thickness between two faces of a unit area, which are subjected to a unit temperature difference.
The thermal conductivity of RCC depends on its moisture content, its porosity, its density, the actual temperature and the type of aggregate used in the mixture. Prin-cipally, the RCC thermal conductivity increases with an increased thermal conduc-tivity of the aggregate and moisture content and decreased porosity. Since the ther-mal conductivity of the aggregates varies significantly, even within one group of aggregate or rock type, the prediction of the thermal conductivity of the full RCC mixture is afflicted with considerable uncertainties. Figure 4-7 depicts the band width of various rock types adequate for mass concrete aggregates (database acc. to Čermák and Rybach (1982)). Typical values of the thermal conductivity of mass concretes range between 1.73 to 3.76 W/m.K (Fig. 4-9, USACE 1997).

52
0
2
4
6
8
And
esit
Bas
alt
Dia
bas
Dio
rite
Dol
erite
Gab
bro
Gra
nite
Por
phyr
y / P
orph
yrite
Sye
nite
Con
glom
erat
e
Dol
omite
/ M
arbl
e
Lim
esto
ne
San
dsto
ne
Am
phib
olite
Gne
iss
Gra
nulit
e
Gre
ywac
ke
Qua
rzite
Ser
pent
inite
Ther
mal
con
duct
ivity
[W/m
.K]
Average Range
NO
DAT
A
NO
DAT
A
NO
DAT
A
IGNEOUS ROCKS SEDIMENT ROCKS
METAMORPHIC ROCKS
Fig. 4-7: Thermal conductivities of mass concrete aggregates (Čermák and Ry-
bach 1982).
Lura et al. (2001) propose the computation of the thermal conductivity of concrete based on the mass fractions and the single thermal conductivities of the mixture components (Eq. 4-21). The porosity or air content in the concrete is not considered. This can be assumed for medium and low cementitious content RCC, since the mix-ing water usually considerably exceeds the quantity, which is necessary for a com-plete hydration of the cement or binder. As a consequence of this, enough moisture will always be present in the pores to be able to neglect the air volume.
Equation 4-21 reflects the thermal conductivity of the RCC according to a horizon-tal stratification of the compounds, which results in a maximum value of the con-ductivity. A minimum value would result from a vertical layering, which is ex-pressed in Equation 4-22. The realistic thermal conductivity of the RCC mix can thus be determined by the arithmetic average of the two values (Eq. 4-23).

53
Agg
rega
te
Cem
ent
Wat
er
Agg
rega
te
Cem
ent
Wat
er
Aggregate
Cement
Water
Aggregate
Cement
Water
a) Eq. 4-21 b) Eq. 4-22
Dire
ctio
n of
heat
flow
Fig. 4-8: Schematic description of Equations 4-21 and 4-22.
concrete
Wi
iGiC
Hconcrete
WGC
ρ
λλλλ
⋅+⋅+⋅=
∑ ,
, Eq. 4-21
⎟⎟⎠
⎞⎜⎜⎝
⎛++⋅
=
∑i WiG
i
Cconcrete
VconcreteWGCλλλρ
λ
,
,1
1 Eq. 4-22
2,,
,VconcreteHconcrete
aveconcrete
λλλ
+= Eq. 4-23
with λconcrete, H
λconcrete, V λconcrete, ave C Gi
W λC λG,i λW ρconcrete
Thermal conductivity of concrete from horizontal stratification [W/m.K] Thermal conductivity of concrete from vertical stratification [W/m.K] Average thermal conductivity of concrete [W/m.K] Cementitious content [kg/m3] Aggregate content (i groups) [kg/m3] Water content [kg/m3] Thermal conductivity of cementitious material [W/m.K], 1.23 W/m.K (Lura et al. 2001) Thermal conductivity of aggregate group i [W/m.K] Thermal conductivity of water [W/m.K], 0.599 W/m.K at 20 °C (Lura et al. 2001) Concrete density [kg/m3]
Figure 4-9 presents the comparison between the thermal conductivities of mass con-crete mixtures (CVC and RCC) estimated according to Equation 4-23 and the asso-ciated values from literature (ACI 1997, ACI 1999). The thermal conductivities of the applied aggregates are based on data sets published by Čermák and Rybach

54
(1982) (Fig. 4-7). The values for the full mixtures using Equation 4-23 are com-puted with the average rock type properties, which are increased and decreased by the standard deviation of the according rock type. The range marked by the lines reflects a width of two coefficients of variation related to the complete data set de-picted in Figure 4-7 (± 26 %).
1
2
3
4
5
1 2 3 4 5
Thermal conductivity of mass concrete acc. to ACI [W/m.K]
Ther
mal
con
duct
ivity
acc
. to
Eq.
4-2
3 [W
/m.K
]
Average rock type
+rock type standard deviation
- rock type standard deviation
Average coefficientof variation over allrock types (26 %)
Fig. 4-9: Thermal conductivity of full mass concrete mixes: Comparison between
literature values (ACI 1997, 1999) and computed values acc. to Eq. 4-23.
The type of aggregate with its individual thermal conductivity λG,i and its propor-tion Gi in the RCC mix are the determining factors with regard to the overall ther-mal conductivity of the RCC. The variation of λG,i results in an almost proportional change of the computed thermal conductivity according to Equation 4-23. A varia-tion of the concrete density ρconcrete within the typical range of values has a negligi-ble impact.
Although the presented data do scatter from the line of balance, it can be stated that a prediction of the thermal conductivity of CVC and RCC mixes by application of Equation 4-23 and presented rock data results in suitable values in the frame of a preliminary thermal study of RCC dams. Own numerical studies on an RCC dam show that a variation of the RCC thermal conductivity by ± 10 % results in maxi-mum RCC temperatures in the dam core varying by only ± 1.5 %. Nevertheless, for
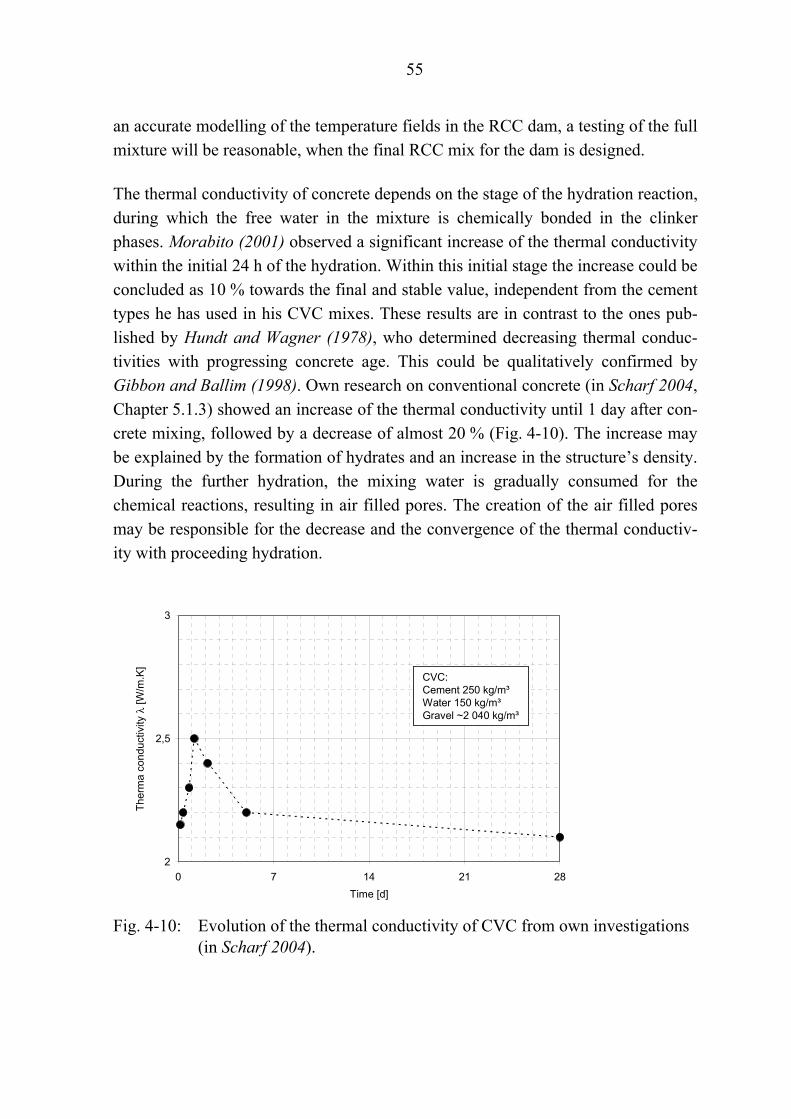
55
an accurate modelling of the temperature fields in the RCC dam, a testing of the full mixture will be reasonable, when the final RCC mix for the dam is designed.
The thermal conductivity of concrete depends on the stage of the hydration reaction, during which the free water in the mixture is chemically bonded in the clinker phases. Morabito (2001) observed a significant increase of the thermal conductivity within the initial 24 h of the hydration. Within this initial stage the increase could be concluded as 10 % towards the final and stable value, independent from the cement types he has used in his CVC mixes. These results are in contrast to the ones pub-lished by Hundt and Wagner (1978), who determined decreasing thermal conduc-tivities with progressing concrete age. This could be qualitatively confirmed by Gibbon and Ballim (1998). Own research on conventional concrete (in Scharf 2004, Chapter 5.1.3) showed an increase of the thermal conductivity until 1 day after con-crete mixing, followed by a decrease of almost 20 % (Fig. 4-10). The increase may be explained by the formation of hydrates and an increase in the structure’s density. During the further hydration, the mixing water is gradually consumed for the chemical reactions, resulting in air filled pores. The creation of the air filled pores may be responsible for the decrease and the convergence of the thermal conductiv-ity with proceeding hydration.
2
2,5
3
0 7 14 21 28Time [d]
Ther
ma
cond
uctiv
ity λ
[W/m
.K]
CVC:Cement 250 kg/m³Water 150 kg/m³Gravel ~2 040 kg/m³
Fig. 4-10: Evolution of the thermal conductivity of CVC from own investigations
(in Scharf 2004).

56
In the frame of a preliminary thermal analysis the thermal conductivity can be con-sidered to be temporally invariable and only one value can be used for the complete concrete life time. It is recommended to utilise the final thermal conductivity. This is supported by the thermodynamic behaviour of mass concrete in its early age, when it is very much influenced by the temperature rise due to the hydration heat liberation predominating the conduction effects in the concrete mass (Eierle 1999). When the conduction effects become dominant, the hydration of the concrete has advanced and the thermal conductivity is not changing much anymore.
Among other authors Morabito (2001) and Salete and Lancha (1998) describe a temperature dependency of the thermal conductivity. Morabito (2001) observed a decrease of the thermal conductivity with increasing concrete temperatures and showed a variation of 7 % within the temperature range between 0 and 50 °C (CVC with limestone aggregates). Since this variation is rather small within the typical temperature range RCC dams are experiencing, it is suggested to consider the tem-perature influence on the thermal conductivity as negligible for the thermal analysis of RCC dams.
4.2.4 Specific heat of RCC
The specific heat or heat capacity c [J/kg.K] of RCC is the amount of heat required per unit mass of RCC to cause a unit rise of temperature. The common range of the heat capacities of mass concrete is 750 to 1 200 J/kg.K (Mindess et al. 2003, USACE 1997).
The type of aggregate affects the specific heat of the RCC just to a small extent, since the average specific heats of presented rocks vary only in a small range, as presented in Figure 4-11. The specific heat of concrete rather depends on the mois-ture content, porosity and temperature, which all can be assumed to be much lower in RCC than in CVC. Since these properties are variable parameters during the hy-dration process, also the specific heat is variable with the RCC hardening time. Mo-rabito (2001) published results of his measurements of the thermal parameters of CVC according to which the specific heat increased by about 7 % with a tempera-ture increase in the spectrum of 10 to 50 °C (limestone aggregates). Within the ini-tial 15 h of the hydration process it decreased by approximately 5 % to reach a sta-ble value. These small variations justify the use of a constant RCC specific heat for the thermal analysis of RCC dams.
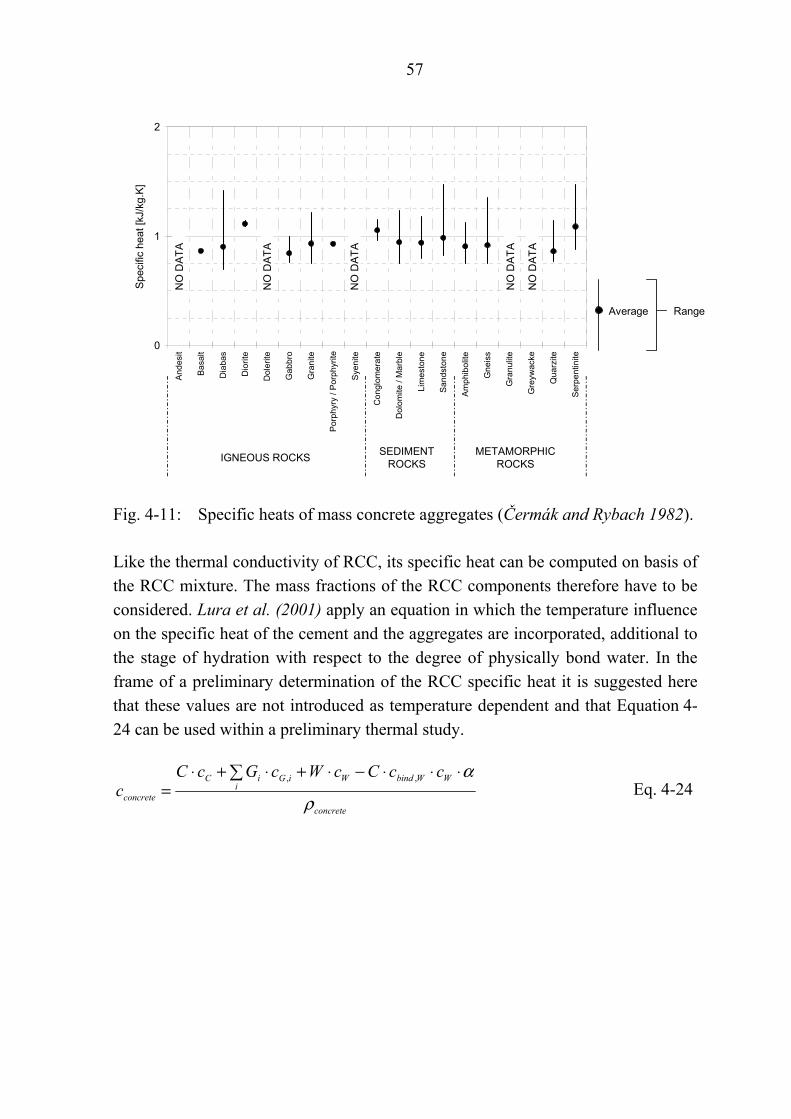
57
0
1
2
And
esit
Bas
alt
Dia
bas
Dio
rite
Dol
erite
Gab
bro
Gra
nite
Por
phyr
y / P
orph
yrite
Sye
nite
Con
glom
erat
e
Dol
omite
/ M
arbl
e
Lim
esto
ne
San
dsto
ne
Am
phib
olite
Gne
iss
Gra
nulit
e
Gre
ywac
ke
Qua
rzite
Ser
pent
inite
Spe
cific
hea
t [kJ
/kg.
K]
Average Range
NO
DAT
A
NO
DAT
A
NO
DAT
A
NO
DAT
A
NO
DAT
A
IGNEOUS ROCKS SEDIMENT ROCKS
METAMORPHIC ROCKS
Fig. 4-11: Specific heats of mass concrete aggregates (Čermák and Rybach 1982).
Like the thermal conductivity of RCC, its specific heat can be computed on basis of the RCC mixture. The mass fractions of the RCC components therefore have to be considered. Lura et al. (2001) apply an equation in which the temperature influence on the specific heat of the cement and the aggregates are incorporated, additional to the stage of hydration with respect to the degree of physically bond water. In the frame of a preliminary determination of the RCC specific heat it is suggested here that these values are not introduced as temperature dependent and that Equation 4-24 can be used within a preliminary thermal study.
concrete
WWbindWi
iGiC
concrete
ccCcWcGcCc
ρ
α⋅⋅⋅−⋅+⋅+⋅=
∑ ,, Eq. 4-24

58
with cconcrete
C Gi
W cC cG,i cW cbind,W α ρconcrete
Specific heat of concrete [J/kg.K] Cementitious content [kg/m3] Aggregate content (i groups) [kg/m3] Water content [kg/m3] Specific heat of cementitious material [J/kg.K], approx. 1 200 J/kg.K at 20 °C (Lura et al. 2001) Specific heat of aggregate group i [J/kg.K] Specific heat of water [J/kg.K], 4 186 J/kg.K at 20 °C Coefficient for considering the influence of physically bond water on the specific heat [-], 0.2 (Lura et al. 2001) Degree of hydration [-], assumed as 1.0 (theoretical fully hydrated concrete) Concrete density [kg/m3]
Figure 4-12 compares the heat capacities of mass concrete mixtures (CVC and RCC) predicted according to Equation 4-24 and the related literature values (ACI 1997, ACI 1999). The specific heats of the applied aggregates are taken from data published by Čermák and Rybach (1982) (Fig. 4-11). The values for the full mix-tures with regard to Equation 4-24 are computed with the average rock type specific heat and the average value increased and decreased by the respective standard de-viation for the individual rock type. The range marked by the lines reflects a width of two times the coefficient of variation related to all rock type data depicted in Fig-ure 4-11 (± 15 %). Equation 4-24 slightly overestimates the specific heats of the full mass concrete mixtures when using the average heat capacities of the aggregate groups. But the close vicinity of the predicted specific heats to the line of balance proves the adequacy of Equation 4-24 in the context of a preliminary thermal study of an RCC dam. For the achievement of better fitting data, a multiplier of 0.9 can be introduced in Equation 4-24 to compensate the overestimation.
Naturally, a certain variation of the specific heat cG,i within a certain rock type ex-ists (Fig. 4-11). According to Equation 4-24, these variations influence the concrete specific heat almost proportionally and thus considerably influence the temperature fields in a mass concrete structure. Own sensitivity studies on an RCC dam show a proportional impact of a specific heat variation on the maximum RCC temperatures in the dam core. A variation of the RCC specific heat by ± 10 % results in maxi-mum RCC temperatures in the dam core varying by ± 9 %.

59
0.5
1
1.5
0.5 1 1.5
Specific heat of mass concrete acc. to ACI [kJ/kg.K]
Spe
cific
hea
t acc
. to
Eq.
4-2
4 [k
J/kg
.K]
Average rock type
+ rock type standard deviation
- rock type standard deviation
Average coefficientof variation over allrock types (15 %)
Fig. 4-12: Specific heat of full mass concrete mixes: Comparison between refer-
ences (ACI 1997, 1999) and computed values acc. to Eq. 4-24.
4.2.5 Thermal diffusivity of RCC
The thermal diffusivity a [m2/s] of RCC measures the rate at which temperature changes take place in the RCC structure. It is a function of thermal conductivity and specific heat (Eq. 4-25) and consequently depends on the same factors as the al-ready described properties.
concreteconcrete
concrete
ca
ρλ
⋅= Eq. 4-25
with a λconcrete cconcrete
ρconcrete
Thermal diffusivity of concrete [m2/s] Thermal conductivity of concrete [W/m.K] Specific heat of concrete [J/kg.K] Concrete density [kg/m3]
Typical values for the thermal diffusivity of mass concrete are between 8.3·10-7 and 1.67·10-6 m2/s (USACE 1997). Figure 4-13 presents data of various rocks published by Čermák and Rybach (1982).
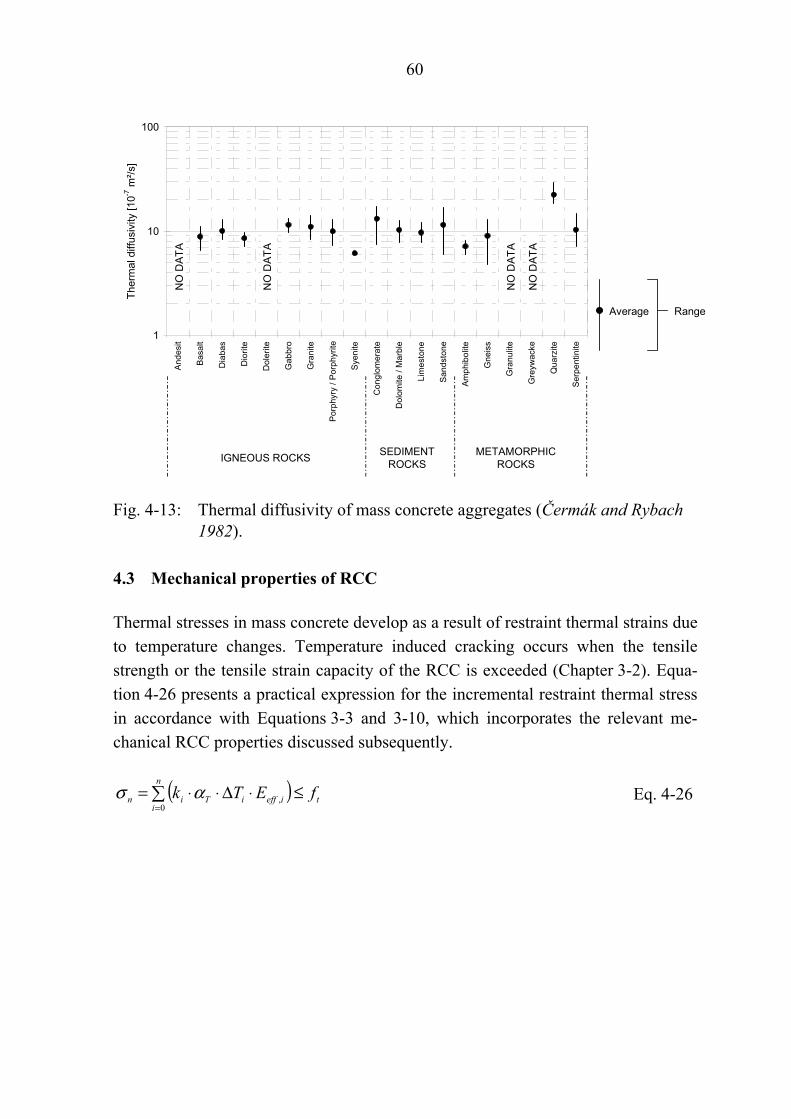
60
1
10
100
And
esit
Bas
alt
Dia
bas
Dio
rite
Dol
erite
Gab
bro
Gra
nite
Por
phyr
y / P
orph
yrite
Sye
nite
Con
glom
erat
e
Dol
omite
/ M
arbl
e
Lim
esto
ne
San
dsto
ne
Am
phib
olite
Gne
iss
Gra
nulit
e
Gre
ywac
ke
Qua
rzite
Ser
pent
inite
Ther
mal
diff
usiv
ity [1
0-7 m
²/s]
Average Range
NO
DAT
A
NO
DAT
A
NO
DAT
A
NO
DAT
A
IGNEOUS ROCKS SEDIMENT ROCKS
METAMORPHIC ROCKS
Fig. 4-13: Thermal diffusivity of mass concrete aggregates (Čermák and Rybach
1982).
4.3 Mechanical properties of RCC
Thermal stresses in mass concrete develop as a result of restraint thermal strains due to temperature changes. Temperature induced cracking occurs when the tensile strength or the tensile strain capacity of the RCC is exceeded (Chapter 3-2). Equa-tion 4-26 presents a practical expression for the incremental restraint thermal stress in accordance with Equations 3-3 and 3-10, which incorporates the relevant me-chanical RCC properties discussed subsequently.
( ) t
n
iieffiTin fETk ≤⋅Δ⋅⋅= ∑
=0,ασ Eq. 4-26

61
with n i σn αT ki
Eeff,i ΔTi ft
Number of time intervals [-] Time interval i [-] Restraint stress after n time intervals [MPa] Coefficient of thermal dilatation [K-1] Degree of restraint in time interval i [-] Effective modulus of elasticity in time interval i [MPa] (includes relaxation effects) Temperature change in time interval i [K] Concrete tensile strength [MPa]
The mechanical properties comprised in Equation 4-26 inevitably have to be con-sidered as time-dependent properties to reveal a clear picture of the thermal stress behaviour of the RCC dam, also in a preliminary thermal stress analysis. These properties and their prediction are described on an empirical basis, appropriate within a preliminary design study, where accurate laboratory test results for full RCC mixtures are not available.
4.3.1 Coefficient of thermal dilatation
The coefficient of linear thermal dilatation αT [K-1] is defined as the change in lin-ear dimension per unit length per unit temperature change.
The coefficient of thermal dilatation is dependent on the type, the amount and the size of the aggregates and the paste content present in the RCC mixture. The coeffi-cients of thermal dilatation of the paste and the aggregates are the determining fac-tors for the overall value. Furthermore, the coarse aggregates represent a major in-fluence. Figure 4-14 depicts coefficients of thermal dilatation of selected rocks ap-propriate for RCC aggregates according to data sets published in Dettling (1959).
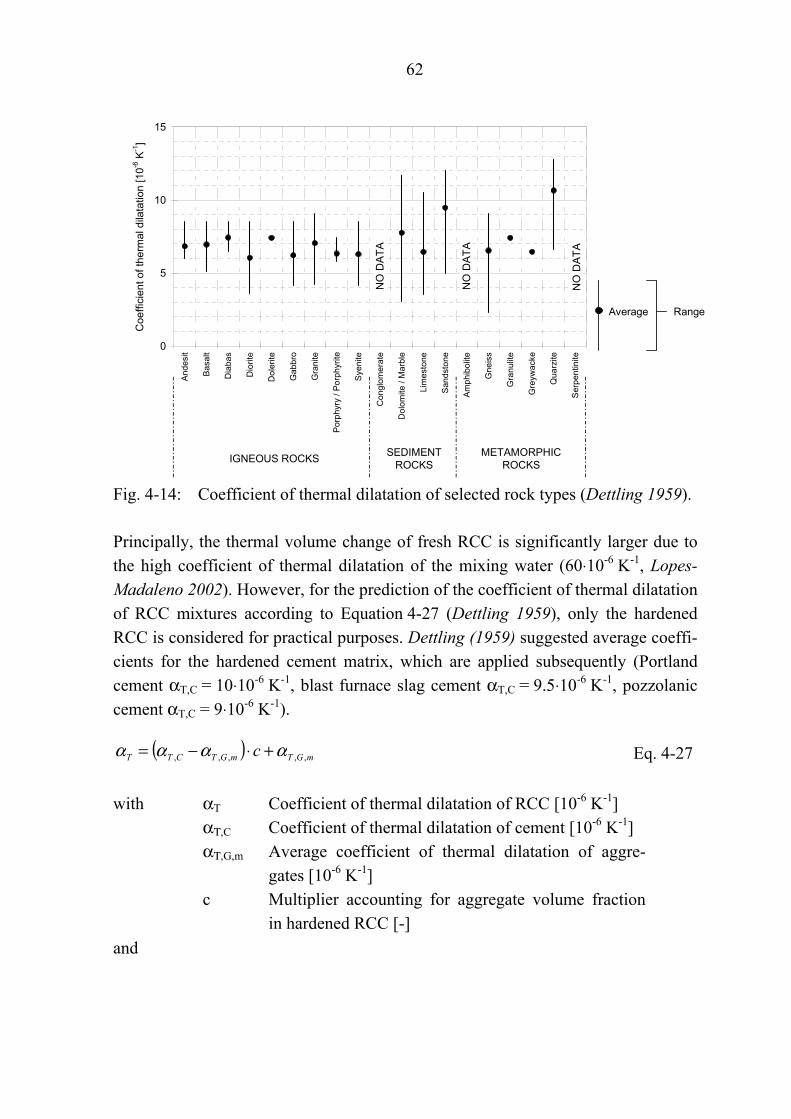
62
0
5
10
15
And
esit
Bas
alt
Dia
bas
Dio
rite
Dol
erite
Gab
bro
Gra
nite
Por
phyr
y / P
orph
yrite
Sye
nite
Con
glom
erat
e
Dol
omite
/ M
arbl
e
Lim
esto
ne
San
dsto
ne
Am
phib
olite
Gne
iss
Gra
nulit
e
Gre
ywac
ke
Qua
rzite
Ser
pent
inite
Coe
ffici
ent o
f the
rmal
dila
tatio
n [1
0-6 K
-1]
Average Range
IGNEOUS ROCKS SEDIMENT ROCKS
METAMORPHIC ROCKS
NO
DAT
A
NO
DAT
A
NO
DAT
A
Fig. 4-14: Coefficient of thermal dilatation of selected rock types (Dettling 1959).
Principally, the thermal volume change of fresh RCC is significantly larger due to the high coefficient of thermal dilatation of the mixing water (60⋅10-6 K-1, Lopes-Madaleno 2002). However, for the prediction of the coefficient of thermal dilatation of RCC mixtures according to Equation 4-27 (Dettling 1959), only the hardened RCC is considered for practical purposes. Dettling (1959) suggested average coeffi-cients for the hardened cement matrix, which are applied subsequently (Portland cement αT,C = 10⋅10-6 K-1, blast furnace slag cement αT,C = 9.5⋅10-6 K-1, pozzolanic cement αT,C = 9⋅10-6 K-1).
( ) mGTmGTCTT c ,,,,, αααα +⋅−= Eq. 4-27
with αT αΤ,C αΤ,G,m c
Coefficient of thermal dilatation of RCC [10-6 K-1] Coefficient of thermal dilatation of cement [10-6 K-1] Average coefficient of thermal dilatation of aggre-gates [10-6 K-1] Multiplier accounting for aggregate volume fraction in hardened RCC [-]
and

63
∑
∑
=
= ⎟⎟⎠
⎞⎜⎜⎝
⎛⋅
=n
i iG
i
n
i iG
iiGT
mGT G
G
1 ,
1 ,,,
,,
ρ
ρα
α Eq. 4-28
with n αΤ,G,i Gi ρG,i
Number of aggregate groups [-] Coefficient of thermal dilatation of aggregate group i [10-6 K-1] Aggregate group i in RCC [kg/m3] Specific weight of aggregate group i [kg/m3]
C
GWCs
n
ii∑
=++
= 1 Eq. 4-29
with s C W
Measure for aggregate fraction [-] Cementitious content in RCC [kg/m3] Water content in RCC [kg/m3]
∑
∑
=
==n
i iG
i
n
ii
mG G
G
1 ,
1,
ρ
ρ Eq. 4-30
with ρG,m Average specific weight of aggregate [kg/m3]
P
G
sx
mG
n
ii
concrete
−⋅⋅⋅=
∑=
100100100
,
1
ρρ Eq. 4-31
with x ρconcrete P
Measure for aggregate fraction [%] RCC density [kg/m3] Pore volume [%], 2 - 3 % in RCC
5,1
100100
⎟⎠⎞
⎜⎝⎛ −= xc Eq. 4-32
The comparison of the coefficients of thermal dilatation of mass concrete mixtures (CVC and RCC) predicted according to Equation 4-27 and the related literature val-

64
ues (ACI 1997, ACI 1999) is presented in Figure 4-15. The coefficients of thermal dilatation of the applied aggregates are assumed according to Figure 4-14, the pa-rameter for the cement matrix is introduced as the above stated value for Portland cement. The values for the full mixtures with regard to Equation 4-27 are computed with the average properties of the individual rock type, taking into account the in-crease and decrease by the individual rock types’ standard deviation. The distances between the lines reflect a width of one coefficient of variation related to all rock data depicted in Figure 4-14 (± 18 %).
It is seen in Figure 4-15 that the predicted data are mostly within the range of two coefficients of variation, but are not accurately complying with the referenced mass concrete data. This is due to the differences of the in-situ properties and the as-sumed basic coefficients of thermal dilatation of the binder matrix and the aggre-gates naturally occurring. Another important fact is that moisture is not considered in the above equations. Present moisture increases the thermal dilatation of the binder matrix. A variation of its coefficient of thermal dilatation results in an almost proportional change of the RCC coefficient of thermal dilatation and significantly exceeds the influence of the aggregate.
5
10
15
5 10 15
Thermal dilatation acc. ACI [10-6 K-1]
Ther
mal
dila
tatio
n ac
c. to
Eq.
4-2
7 [1
0-6 K
-1]
Average rock type
+ rock type standard deviation
- rock type standard deviation
Average coefficientof variation over allrock types (18 %)
Fig. 4-15: Coefficients of thermal dilatation of full mass concrete mixes: Com-
parison of references (ACI 1997, 1999) and results acc. to Eq. 4-27.
The application of either historical data of comparable RCC mixes or of an RCC coefficient of thermal dilatation of αT = 9.5⋅10-6 K-1 will be appropriate for a pre-liminary thermal stress study.

65
4.3.2 Compressive strength of RCC
The compressive strength of RCC often serves as a design and an evaluation pa-rameter for the assessment of a certain RCC mixture as the effort of its determina-tion in the laboratory is rather small and a variety of other mechanical RCC proper-ties can be empirically derived from it. Since these relations will be focussed with regard to the prediction of the subsequently addressed RCC properties, some words about the compressive strength of RCC shall be placed here. In the following para-graphs the compressive strength of RCC is generally characterising the unconfined compressive strength of cylindrical moulds of 150 mm in diameter and 300 mm in height as usually applied for strength testing of RCC with a typical maximum size aggregate of 75 mm. Although anisotropic in-situ strength properties due to the dis-tribution and orientation of aggregate particles after RCC spreading and compaction can occur, they are assumed to be isotropic within the explanations made here.
Generally, the prediction of the compressive strength of RCC is afflicted with sig-nificant uncertainties as too many factors are playing together. With regard to pre-liminary studies of RCC dams, it is often referred to available data and experiences with comparable projects. This is also due to the fact that prediction concepts used for conventional concrete with typical w/B-ratios of 0.4 to 0.6 can seldom be di-rectly transferred to RCC technology, especially when it is dealt with low-cementitious RCC, which features w/B-ratios far above 1.0. In terms of high-cementitious RCC, in which w/B-ratios are usually in the range of these typical for CVC, the often considerable replacement of cement by pozzolan requires prediction models different from such applied for conventional concrete due to their retarding effects and their considerable re-hardening features (e.g. Tangtermsirikul et al. 2004).
The compressive strength of RCC primarily depends on the composition and the properties of the hardening matrix of the cementitious material and in some extent on the aggregate quality and gradation (USACE 2000). Additional to the hardening conditions (temperature, moisture), the RCC strength is related to the w/B-ratio. It increases with the decrease of the w/B-ratio, presumed that the RCC is fully com-pacted. A full compaction with a minimum volume of voids at a specified compac-tion effort is achieved at an optimum moisture. In this context the increase of voids has a greater negative effect than the decrease of the w/B-ratio has a positive one (Andriolo 1998). The compressive strength increases with time and the progression of the cement hydration. If a certain w/B-ratio together with a certain compaction

66
effort is established, the compressive strength also increases with the amount of ce-mentitious material in the RCC mix. In relation to the strength development of RCC, especially when pozzolan is present, it has to borne in mind that it is rela-tively slow at early ages and that a considerable strength gain occurs at later ages. A design age of more than 90 to 180 days is usually required for RCC dams (Andriolo 1998), often even 365 days. Considering strength prediction, caution should be ex-ercised in extrapolating early age strengths to long-term values (USACE 2000). Strength relationships should be based on test results after at least 90 days.
The strength requirement for a planned RCC dam is concluded from static and dy-namic computations, which are performed prior to any thermal stress analyses. The strength requirement is then the starting point for the RCC mixture design in respect of the necessary cementitious content. USACE (2000) and ACI (1999) provide data for this initial step, which, however, diverge from each other. These data are based on the relation of strength to w/B-ratio (Fig. 4-16) and historical data (Fig. 4-17). The provided data are compared to RCC strengths from certain investigations found in Berga et al. (2003). The graphs clearly show the considerable scattering and the different strength evolutions of the individual mixes, actually stressing the extreme difficulty of the strength prediction. Nevertheless, the curves provided by USACE (2000) and ACI (1999) are appropriate for initial strength estimations.
0
20
40
60
0 0.5 1 1.5 2Water-to-binder-ratio w/B [-]
Com
pres
sive
stre
ngth
f c [M
Pa]
7 days28 days90 days365 days
7 days
28 days
90 days
365 days
Fig. 4-16: Compressive strength versus w/B-ratio: Regression graphs (ACI 1999)
and project data (Berga et al. 2003, ACI 1999).
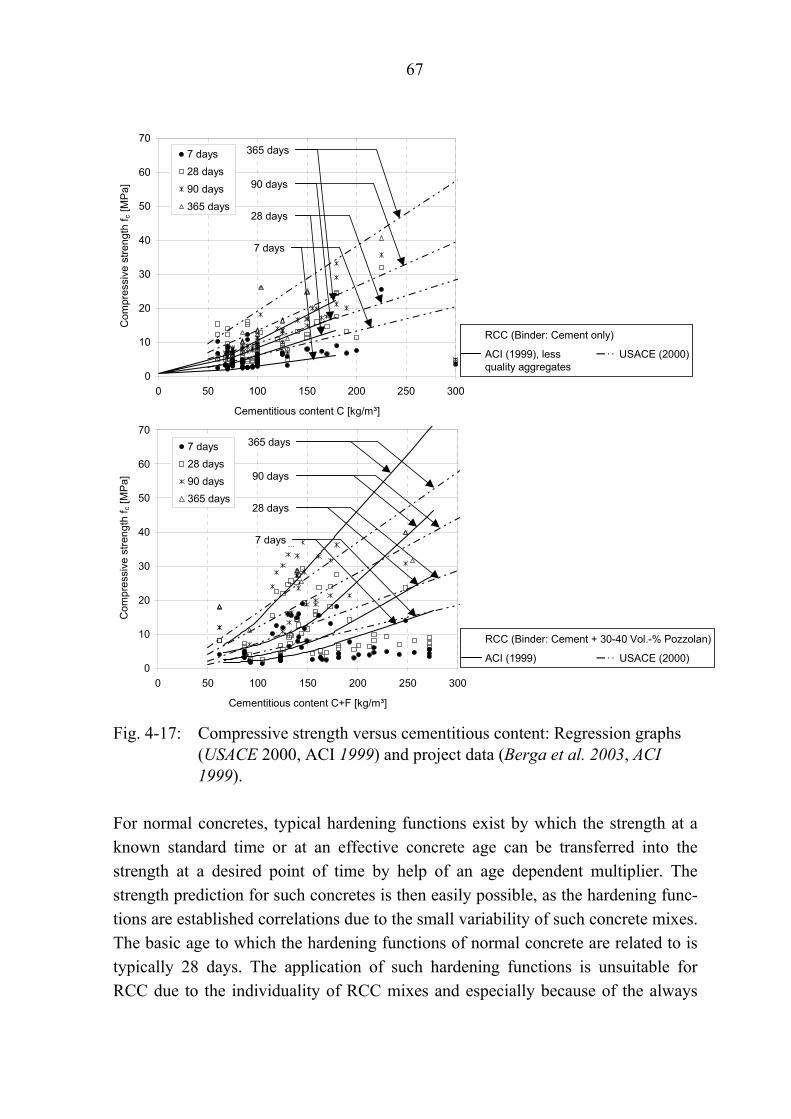
67
0
10
20
30
40
50
60
70
0 50 100 150 200 250 300
Cementitious content C [kg/m³]
Com
pres
sive
stre
ngth
f c [M
Pa]
7 days28 days90 days365 days
7 days
28 days
90 days
365 days
RCC (Binder: Cement only)
ACI (1999), less USACE (2000)quality aggregates
0
10
20
30
40
50
60
70
0 50 100 150 200 250 300
Cementitious content C+F [kg/m³]
Com
pres
sive
stre
ngth
f c [M
Pa]
7 days28 days90 days365 days
7 days
28 days
90 days
365 days
RCC (Binder: Cement + 30-40 Vol.-% Pozzolan)
ACI (1999), less USACE (2000)
Fig. 4-17: Compressive strength versus cementitious content: Regression graphs
(USACE 2000, ACI 1999) and project data (Berga et al. 2003, ACI 1999).
For normal concretes, typical hardening functions exist by which the strength at a known standard time or at an effective concrete age can be transferred into the strength at a desired point of time by help of an age dependent multiplier. The strength prediction for such concretes is then easily possible, as the hardening func-tions are established correlations due to the small variability of such concrete mixes. The basic age to which the hardening functions of normal concrete are related to is typically 28 days. The application of such hardening functions is unsuitable for RCC due to the individuality of RCC mixes and especially because of the always
68
anticipated use of pozzolan together with the already mentioned considerable re-hardening capability of mass concrete beyond the age of 28 days. For accurate stud-ies the hardening function should be derived from tests on the individual RCC mixes. The general expression of a hardening function can be written according to Equation 4-33. Two types of hardening functions shall be introduced at this place, both being of the exponential type (Eq. 4-34 (CEB-FIB-MC90), 4-35). Equation 4-35 is an own approach within this dissertation, which describes the strength devel-opment in analogy to the hydration reaction (Eq. 4-19).
)()()( scecec tftktf ⋅= Eq. 4-33
with kc te ts fc
Multiplier (normalised property) [-] Effective age [d] Standard age, basic age [d], 28, 90 or 365 d Compressive strength of cylinders ∅ 150 mm [MPa]
⎪⎭
⎪⎬⎫
⎪⎩
⎪⎨⎧
⎥⎥⎦
⎤
⎢⎢⎣
⎡⎟⎟⎠
⎞⎜⎜⎝
⎛−⋅=
5,0
1exp)(e
sec t
tstk Eq. 4-34
with s ts
Factor regarding cement type [-] s = 0.2, rapid hardening cement s = 0.25, normal hardening cement s = 0.38, slowly hardening cement Basic age 28 d (CEB-FIB-MC90)
( )cecec tbktk ⋅⋅∞= exp)()( Eq. 4-35
with kc(∞)b, c
Multiplier at infinite age [-] Hardening function shape factors [-]
Figure 4-18 depicts the comparison between Equations 4-34 and 4-35 and the com-pressive strength development of various RCC mixtures containing different amounts of cementitious material (including 30 to 50 % of fly ash or other pozzolan and cement only). The parameters comprised in Equation 4-35 result from a best fit analysis for the entirety of depicted data. The age dependent multipliers kc related to the 28-day strength are 2.1 for the 365-day strength and 2.5 for the 730-day strength, which stress the significant re-hardening properties of RCC mixtures.

69
Equation 4-35 along with the parameters given in Figure 4-18 clearly shows better results than Equation 4-34 proposed by CEB-FIB MC90 for RCC ages beyond 28 days.
0
1
2
3
4
1 10 100 1000
RCC age te [d]
Rel
ated
com
pres
sive
stre
ngth
f c(t e
) / f c
(28d
) [M
Pa]
C+F = 60-70kg/m³
C+F = 70-90kg/m³
C+F = 90-120kg/m³
C+F = 120-160kg/m³
C+F > 160kg/m³
Eq. 4-34
Eq. 4-35Equation 4-34
s = 0.25; ts = 28d
Equation 4-35
kc(∞) = 3.8; b = -3.2; c = -0.28
Fig. 4-18: Hardening relations for compressive strength development of various
RCC mixtures (Berga et al. 2003, ACI 1999) and approximation by Equations 4-34 and 4-35 acc. to a basic age of 28 d.
Figure 4-19 presents the development of the normalised compressive strength as relation to the 90-day and 365-day strength. The introduction of 90-days and 365-days as basic age results in a better correlation to the respective RCC data. The va-riety of data collected and the good accordance especially with Equation 4-35 re-lated to the basic ages 90 and 365 days shows the general applicability of Equa-tion 4-35. This type of hardening function is suitable for the prediction of the RCC strength development on basis of an acquired compressive strength at an RCC age of at least 90 days. The applied multipliers kc(∞) shown in Figure 4-19 can be con-firmed within a certain range by long-term compressive strength properties of RCC having been tested after ten years (Upper Stillwater Dam, Dolen 2003).
As a concluding remark to this paragraph, the behaviour of the multiplier kc(∞) shall be highlighted, which depends on the basic RCC age and decreases in an in-verse power as the basic age increases. At infinite basic age, kc(∞) converges to 1.

70
0
1
2
3
4
1 10 100 1000
RCC age te [d]
Rel
ated
com
pres
sive
stre
ngth
f c(t e
) / f c
(90d
) [-]
C+F = 60-70kg/m³
C+F = 70-90kg/m³
C+F = 90-120kg/m³
C+F = 120-160kg/m³
C+F > 160kg/m³
Eq. 4-34
Eq. 4-35
Equation 4-34
s = 0.25; ts = 90d
Equation 4-35
kc(∞) = 2.7; b = -3.2; c = -0.28
0
1
2
3
4
1 10 100 1000
RCC age te [d]
Rel
ated
com
pres
sive
stre
ngth
f c(t e
) / f c
(365
d) [-
]
C+F = 60-70kg/m³
C+F = 70-90kg/m³
C+F = 90-120kg/m³
C+F = 120-160kg/m³
C+F > 160kg/m³
Eq. 4-34
Eq. 4-35
Equation 4-34
s = 0.25; ts = 365d
Equation 4-35
kc(∞) = 1.9; b = -3.2; c = -0.28
Fig. 4-19: Hardening relations for compressive strength as in Fig. 4-18 and ap-
proximation by Equations 4-34 and 4-35 acc. to basic ages 90 (top) and 365 d (bottom).
4.3.3 Tensile strength of RCC
The tensile strength of RCC is generally a major concern for the dam design and is mainly dictated by structural analyses. The tensile strength is naturally linked to the same influences as the compressive strength, although it is more dependent on the aggregate bond (interface between aggregate and binder matrix) in connection with the maximum size aggregate. It has to be distinguished between three testing meth-ods, which include the direct tension method, splitting tension method (Brazilian Test) and the flexural test, which result in increasing tensile strengths according to the above order. In this paragraph it is dealt with the direct and splitting tensile

71
strength of RCC (cylindrical moulds equal to those for compressive strength test-ing) without the presence of any joints or joint bonding mixtures, without further evaluation of certain but actually important issues as e.g. load rate, stress level, cur-ing conditions and sample moisture at testing.
With focus on preliminary thermal stress studies, it is usually tried to express the tensile strength as a ratio of tensile to compressive strength, which is normally not thoroughly reliable as these ratios vary widely as the case may be (USACE 2000). Typical splitting tensile to compressive strength ratios for RCC range from 5 to 15 % (USACE 2000) or respectively 10 to 15 % (Andriolo 1998), which was con-firmed by Malkawi et al. (2003) and Malkawi and Mutasher (2003) (12.2 %). The direct tensile strength, is often 25 to 30 % lower than the splitting tensile strength and ranges between 3 to 9 % of the compressive strength with most values spanning 6 to 8 % (USACE 2000). Figure 4-20 shows the correlation between splitting and compressive strength of conventional concrete and various RCC mixes together with a selection of used nonlinear regression relations (Tab. 4-6).
Tab. 4-6: Interrelations for splitting tensile strength prediction.
Source Splitting tensile to compressive strength relations
USACE (2000) cbt ff ⋅= 7055.0 Eq. 4-36
USACE (2000) cbt ff ⋅= 4565.0 Eq. 4-37
Oluokun et al. (1991b) 79.0206.0 cbt ff ⋅= Eq. 4-38
Oluokun et al. (1991c) 73.0209.0 cbt ff ⋅= Eq. 4-39
with fc fbt
Compressive strength [MPa] Splitting tensile strength [MPa]

72
0
1
2
3
4
5
0 10 20 30 40 50Compressive strength fc [MPa]
Spl
ittin
g te
nsile
stre
ngth
f bt [
MP
a]
Eq. 4-36
Eq. 4-38
Eq. 4-37
Eq. 4-39
CVC, Mindess et al. (2003)
CVC, Oluokun et al. (1991b)
RCC, Marulanda et al. (2003)
RCC, Santana et al. (2003)
RCC, Graca et al. (2003)
RCC, Dunstan et al. (2003)
RCC, Martin et al. (2003)
RCC, Mujib Dam (site information)
RCC, Forbes et al. (1999, 1998, 1992)
Fig. 4-20: Splitting tensile and compressive strength: Comparison between vari-
ous RCC and CVC data and applied relations acc. to Tab. 4-6.
Equations 4-36 and 4-37 presented by USACE (2000) for the splitting tensile strength prediction of parent RCC cylinders with maximum size aggregates less than 75 mm cover the whole range of presented data. However, only Equation 4-37 allows a better fitting of low compressive strength concretes considering mean val-ues. With regard to average ratios Equation 4-38 turns out as most suitable for the prediction of early age as well as later age RCC splitting tensile from compressive strengths.
Considering the prediction of the direct tensile strength of RCC, Schrader et al. (2003) propose the computation on basis of the splitting and compressive RCC strength as shown with Equation 4-40. This relation works well for the determina-tion of the direct tensile RCC strength in absence of costly direct tensile strength tests (Fig. 4-21).
( )[ ] btct fff ⋅⋅⋅= 10log3.0 Eq. 4-40
with ft Direct tensile strength [MPa]

73
0
1
2
3
4
0 1 2 3 4
Direct tensile strength of parent cylinders [MPa]
Dire
ct te
nsile
stre
ngth
acc
. to
Eq.
4-4
0 [M
Pa]
RCC, Dunstan et al. (2003)
RCC, López et al. (2003)
RCC, Marulanda et al. (2003)
RCC, Wang et al. (2003)
RCC, Malkawi (2003)
RCC, Marulanda et al. (2002)
RCC, Forbes et al. (1999, 1998, 1992)
RCC, Lorenzo et al. (1992)
Fig. 4-21: Direct tensile strength correlation between RCC data and Eq. 4-40.
4.3.4 Stress-strain behaviour of RCC
The response of the RCC to stress is expressed as strain and vice versa and can be displayed as so-called stress-strain-curves, from which the modulus of elasticity as one governing RCC property in respect of the thermal stress modelling can be de-rived. Figure 4-22 displays some different elastic moduli of which the secant modulus or Young’s modulus E [MPa] is the one further focussed.
Strain ε [-]
Stre
ss σ
[MP
a]
Ultimate stress
Initial tangent modulus
Secant modulus
Tangent modulus
1
Elastic limit
12 3
2
3
εLimit
σLimit
Fig. 4-22: Stress-strain-curve of RCC and moduli (Mindess et al. 2003, modified).
The Young’s modulus of RCC is defined as the ratio of normal stress to its corre-sponding strain below the proportional elastic limit of the RCC (Andriolo 1998).

74
The elastic limit is exceeded where the portion of the stress-strain-curve cannot be approximated by a linear regression and above which the stress-strain-curve flattens as it approaches the ultimate stress. This non-linear stress-strain behaviour of RCC results in decreasing secant moduli with increasing stress levels.
For conventional concrete as well as for RCC, the elastic limit can be assumed to be at 40 % of the uniaxial compressive strength (ultimate stress in compression) for nearly all concrete ages. Eierle (1999) states that conventional concrete is character-ised by this elastic limit at ages exceeding half a day. Gaekel and Schrader (1992) concluded from numerous tests that RCC generally remains elastic up to 40 % of its strength, with slightly lower elastic limits at very early ages. For tensile loading the concrete behaves elastically close to the uniaxial direct tensile strength (Eierle 1999). Naturally, the slopes of the RCC stress-strain-curves increase with RCC age.
In order to evaluate the stress-strain behaviour of low-cementitious RCC, own in-vestigations have been performed at the Mujib Dam (see Chapter 5.2, Conrad et al. 2003). The compressive strength tests on cylindrical moulds (diameter 150 mm, height 300 mm) of parent RCC (85 kg/m3 Portland cement, no additives, see Chap-ter 5.2) with simultaneous axial deformation measurements should supplement available data of RCC ages between 3 and 365 days to especially reveal the elastic RCC properties at very early ages of less than 2 days. With the investigated RCC mixture it has not been possible to reasonably perform Young’s modulus tests at the very young age of 3 hours. Further trials with cylinders to be tested after 4 and 5 hours have also not been successful. It is thus interpreted that for such kind of low-cementitious RCC minimum ages of 6 hours have to be adopted for a suitable performance of Young’s modulus tests. It can further be interpreted that the investi-gated RCC builds up solid body properties after 6 hours of hardening, when it can resist significant stresses.
Direct tensile strength tests including the monitoring of the strains on this low-cementitious RCC have been executed for RCC ages of 182 and 365 days (Malkawi 2002). Figure 4-23 presents the relations of normalised axial stress to strain for compression and tension according to the mentioned investigations.

75
0
0.2
0.4
0.6
0.8
1
0 0.005 0.01 0.015 0.02
Compressive strain ε [-]
Nor
mal
ised
com
pres
sive
stre
ss σ
/f c [-
]
6 h
12 h
48 h
7 d28 d
182 d
365 d
0
0.2
0.4
0.6
0.8
1
0 0.00001 0.00002 0.00003 0.00004
Tensile strain ε [-]
Nor
mal
ised
tens
ile s
tress
σ/f t
[-]
182 d
365 d
Fig. 4-23: Normalised stress-strain-curves of the Mujib Dam low-cementitious
RCC in compression (top) and tension (bottom) (Conrad et al. 2003, Malkawi 2002).
Figure 4-23 confirms the elastic behaviour of low-cementitious RCC at least up to stresses of 40 % of the actual ultimate compressive strength from the very early RCC ages. At the very early age of 6 hours, the RCC shows linear stress-strain properties for the complete loading path. With increasing age, the shape of the stress-strain-curves changes to the typical nonlinear shape. This tendency could be observed for samples older than 12 h. For RCC ages of 182 and 365 days the stress-strain response to the RCC tensile loading can be assessed as linear-elastic close to the failure (direct tensile strength) of the sample. At least for RCC ages of 182 and

76
365 days the investigations also showed almost equal slopes of the stress-strain-curves in tension and compression, which is equipollent to an equal elastic modulus of the RCC in tension and compression, a generally drawn assumption, which is also applied within this dissertation.
As a final consequence of the above assessed, and as an advance to the subsequent paragraph, Equation 4.41 holds the computation of the Young’s modulus from the stress-strain-curves, which is then valid for the compressive and tensile stress states in the RCC dam.
)4.0(4.0
c
cC f
fE⋅
⋅=ε
Eq. 4-41
with EC fc ε(0.4 ⋅fc)
Elastic modulus (Young’s modulus) [MPa] Compressive strength [MPa] Compressive strain corresponding to 40 % fc [-]
Figure 4-24 presents the collection of stress-strain-curves from the Mujib Dam RCC gained at RCC ages of one week and one year to illustrate the confidence of the elastic moduli determination. In general, manufacture of low-cementitious RCC samples follows a completely different procedure than moulding normal concrete samples. Various factors in the moulding phase influence the later sample quality at testing age. As human accuracy is much more involved in the preparation of RCC samples, it is coherent that test results especially of stress-strain investigations show higher variations compared to conventional concrete samples leading to signifi-cantly distributed elastic modulus values, which is an important factor in the context of the elastic modulus prediction subsequently addressed.

77
0
5
10
15
20
0 0.005 0.01Compressive strain [-]
Com
pres
sive
stre
ss σ
c [M
Pa]
7 d
365 d
Range of σ-ε-curves for an RCC age of 365 days
Range of σ-ε-curves for an RCC age of 365 days
Fig. 4-24: Typical stress-strain-curves and ranges of dispersion from compressive
strength tests of the Mujib Dam RCC at ages of 7 d and 365 d.
4.3.5 Modulus of elasticity of RCC
As well as for strength and other considerations presented in this work, the possible exhibiting anisotropic behaviour of the elastic modulus due to aggregate orientation (USACE 2000) after RCC spreading and compacting is ignored. In the frame of this dissertation it is referred to the static elastic modulus typically measured on cylin-drical moulds with a diameter of 150 mm and a height of 300 mm, which are ade-quate for testing RCC with maximum size aggregates of 75 mm.
The influences on the modulus of elasticity exerted by the RCC mixture are basi-cally characterised by the volumetric contents of the cementitious materials and the applied aggregates, whereas the w/B-ratio of the cementitious matrix plays an im-portant role. The elastic modulus is dependent on the RCC age and increases with proceeding RCC hardening. The maximum elastic modulus that can be reached by a certain RCC mix corresponds to a maximum value of either the applied aggregate or the binder matrix (Andriolo 1998). If a rich binder matrix is present in the RCC (high cement content, low w/B-ratio), the elastic modulus can converge to the one of the aggregates at later ages. Figure 4-25 presents average elastic moduli of vari-ous aggregates applied for mass concrete and their ranges according to data pub-lished by Lama and Vutukuri (1978).

78
0
50
100
150
Ande
sit
Basa
lt
Dia
bas
Dio
rite
Dol
erite
Gab
bro
Gra
nite
Porp
hyry
/ P
orph
yrite
Syen
ite
Con
glom
erat
e
Dol
omite
/ M
arbl
e
Lim
esto
ne
Sand
ston
e
Amph
ibol
ite
Gne
iss
Gra
nulit
e
Gre
ywac
ke
Qua
rzite
Serp
entin
ite
Mod
ulus
of e
last
icity
[GP
a]
Average Range
NO
DA
TA
IGNEOUS ROCKS SEDIMENT ROCKS
METAMORPHIC ROCKS
NO
DAT
A
Fig. 4-25: Young’s moduli of selected rock types (Lama and Vutukuri 1978).
In terms of the prediction of the Young’s modulus of RCC within a preliminary dam analysis, a variety of empirical models are accessible that relate the elastic modulus to the specific weight and the compressive strength of the concrete (Mindess et al. 2003, Oluokun et al. 1991a, various concrete standards). However, such compressive strength related models are not based on mass concrete mixtures and will result in inaccurate estimations of the elastic moduli when applied to RCC (USACE 2000). It can be even proven that those existing models can lead to consid-erable misattributed elastic moduli especially of low-cementitious RCC (Conrad et al. 2003). An application of such models for the prediction of RCC elastic moduli is not further pursued in this work and a composite model approach accounting for the consideration of binder matrix (paste) and aggregate phase is presented.
A number of composite models exist to determine the elastic modulus of concrete as a two-phase or three-phase material. Two-phase models are further described in order to keep models with a minimum of parameters in the frame of preliminary studies. Mindess et al. (2003) introduce two extreme cases of concrete phase ar-rangements, the parallel Voigt model and the series Reuss model. The hybrid Hirsch’s model is composed of the two extreme cases (Tab. 4-7, Eq. 4-42, 4-43, 4-44). The grade of the composition can be adjusted by the parameter X.

79
Tab. 4-7: Concrete models and computation of elastic modulus (Mindess et al. 2003).
Model Equation
Voigt model
GGPPC EVEVE ⋅+⋅= Eq. 4-42
Reuss model
G
G
P
P
C EV
EV
E+=1
Eq. 4-43
Hirsch’s model
X
1-X( ) ⎟⎟
⎠
⎞⎜⎜⎝
⎛+⋅−+
⋅+⋅⋅=
G
G
P
P
GGPPC EV
EVX
EVEVX
E111
Eq. 4-44
Matrix
Aggregate
EC EP EG VP VG X
Young’s modulus of RCC [MPa] Young’s modulus of matrix [MPa] Young’s modulus of aggregate [MPa], Fig. 4-24 Volumetric fraction of matrix in concrete [-] Volumetric fraction of aggregates in concrete [-] Arbitrary parameter for combination of parallel and series composition within Hirsch’s model
The volumes of the RCC components are known from the required cementitious content and w/B-ratio resulting from the target RCC strength. The Young’s modulus of the binder matrix EP can be estimated along with the capillary porosity of the matrix, which determines the strength and the elasticity of the binder matrix. Garboczi et al. (2005) present an empirical formulation for the relation between the binder matrix elastic modulus and the capillary porosity, which in turn depends on

80
the w/B-ratio (Mindess et al. 2003). Equation 4-45 is valid for binders containing 100 % of Portland cement and w/B-ratios greater than 0.42.
( )16.3
16.3
32.0/36.0/103046103046 ⎟
⎠⎞
⎜⎝⎛
+−−⋅=−⋅=
BwBwPE cP Eq. 4-45
with EP Pc w/B
Elastic modulus of binder matrix [MPa] Capillary porosity [-] Water-to-binder-ratio [-]
The comparison of measured elastic moduli of both CVC and RCC mixtures with the arithmetic mean moduli resulting from the Voigt and Reuss models and the val-ues computed with the Hirsch’s model leads to the graphs presented in Figure 4-26 and 4-27. The binder matrix elastic moduli of the mixes have been computed ac-cording to Equation 4-45, the aggregate moduli have been adopted as the average values of the corresponding rock type from Figure 4-25. For the evaluation of the model fitting, a range of one coefficient of variation determined as the average coef-ficient of variation of all depicted rock types (45 %) is introduced above and below the balancing line.
0
10
20
30
40
50
60
0 10 20 30 40 50 60
Young's modulus EC at age 90 days acc. to literature [GPa]
You
ng's
mod
ulus
EC a
cc. t
o Ta
b. 4
-7 [
GP
a]
Average of Voigt and Reuss models
Hirsch's model (X = 0.8)
Average coefficient of variation over allrock types (45 %)
Data taken from:
ACI (1997)ACI (1999)Conrad et al. (2003)Lorenzo et al. (1992)Martin et al. (2003)Santana et al. (2003)Vilardell et al. (1998)Wagner et al. (2005)Wang et al. (2003)
Fig. 4-26: Modelled Young’s moduli versus measured moduli after 90 days.
Figure 4-26 shows that the majority of the predicted elastic moduli under above sta-ted assumptions is exceeding the measured values due to the still progressing hard-
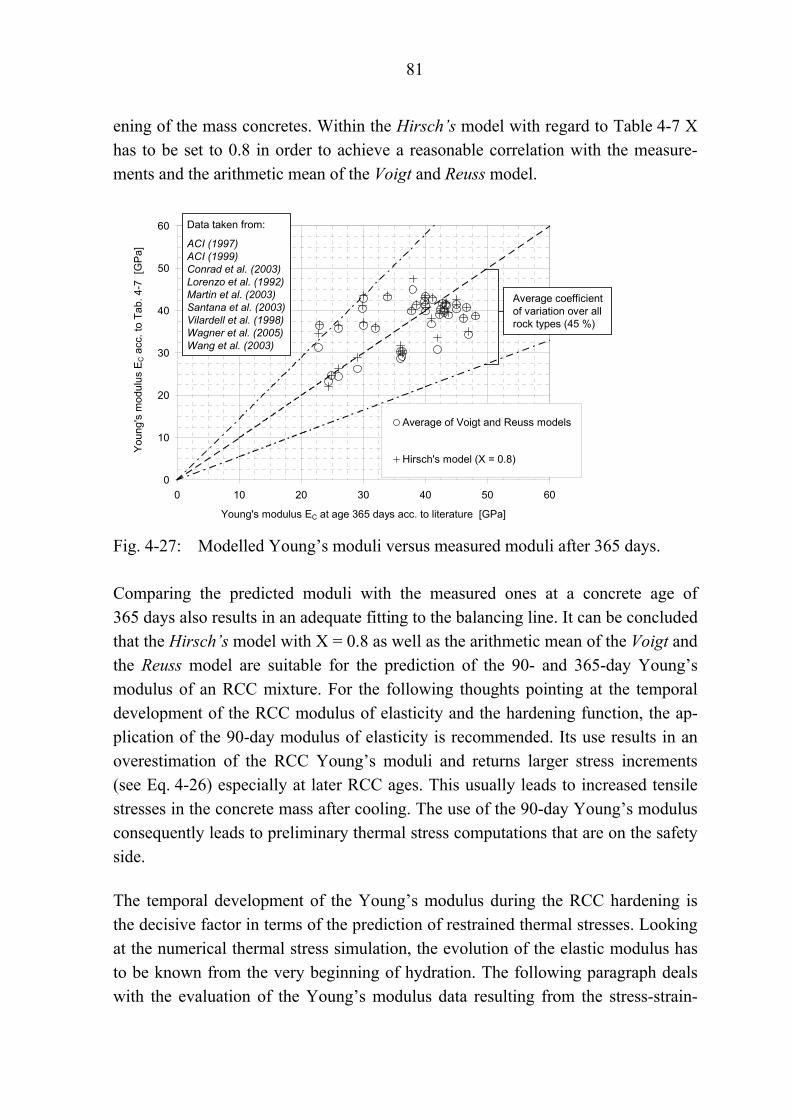
81
ening of the mass concretes. Within the Hirsch’s model with regard to Table 4-7 X has to be set to 0.8 in order to achieve a reasonable correlation with the measure-ments and the arithmetic mean of the Voigt and Reuss model.
0
10
20
30
40
50
60
0 10 20 30 40 50 60
Young's modulus EC at age 365 days acc. to literature [GPa]
Youn
g's
mod
ulus
EC a
cc. t
o Ta
b. 4
-7 [
GP
a]
Average of Voigt and Reuss models
Hirsch's model (X = 0.8)
Data taken from:
ACI (1997)ACI (1999)Conrad et al. (2003)Lorenzo et al. (1992)Martin et al. (2003)Santana et al. (2003)Vilardell et al. (1998)Wagner et al. (2005)Wang et al. (2003)
Average coefficient of variation over allrock types (45 %)
Fig. 4-27: Modelled Young’s moduli versus measured moduli after 365 days.
Comparing the predicted moduli with the measured ones at a concrete age of 365 days also results in an adequate fitting to the balancing line. It can be concluded that the Hirsch’s model with X = 0.8 as well as the arithmetic mean of the Voigt and the Reuss model are suitable for the prediction of the 90- and 365-day Young’s modulus of an RCC mixture. For the following thoughts pointing at the temporal development of the RCC modulus of elasticity and the hardening function, the ap-plication of the 90-day modulus of elasticity is recommended. Its use results in an overestimation of the RCC Young’s moduli and returns larger stress increments (see Eq. 4-26) especially at later RCC ages. This usually leads to increased tensile stresses in the concrete mass after cooling. The use of the 90-day Young’s modulus consequently leads to preliminary thermal stress computations that are on the safety side.
The temporal development of the Young’s modulus during the RCC hardening is the decisive factor in terms of the prediction of restrained thermal stresses. Looking at the numerical thermal stress simulation, the evolution of the elastic modulus has to be known from the very beginning of hydration. The following paragraph deals with the evaluation of the Young’s modulus data resulting from the stress-strain-

82
curves obtained from the investigations at the Mujib Dam. An appropriate type of hardening function with regard to the elastic modulus evolution in RCC is sug-gested from these investigations. The presented moduli are based on tests performed on isothermally cured (23 °C) cylindrical samples. Thus, the here stated concrete age corresponds to the effective concrete age. Table 4-8 gives an overview on the tests consulted for initial considerations of a suitable hardening function.
Tab. 4-8: Results from the Young’s modulus tests performed at Mujib Dam (low-cementitious RCC acc. to Tab. 5-4, Conrad et al. 2003).
RCC age [d]
No. tests [-]
Young’s modulus, average [GPa]
Standard deviation [GPa]
Coefficient of variation
[%] 0.25 4 0.05 0.01 20.0 0.5 9 0.27 0.17 62.9 1 6 0.68 0.34 50.0
1.5 6 0.90 0.40 44.4 2 6 0.95 0.14 14.7 3 62 3.39 1.82 53.7 7 250 6.30 2.68 42.5
14 190 9.25 3.49 37.7 28 178 11.97 4.20 35.1 56 90 15.76 4.40 27.9 91 156 16.92 5.54 32.7 182 108 19.97 6.19 31.0 365 29 24.40 6.32 25.9
A satisfactory approximation of the temporal evolution of the Young’s modulus for the early ages as well as for the aged RCC presented in Table 4-8 can be achieved by an exponential type hardening function being adopted also for the prediction of the compressive strength development. Such model is capable of emulating an S-shape, which is typical for the evolution of the RCC Young’s modulus. Since the presented exponential model is easy to handle and also gives agreeable results (Fig. 4-28) it is proposed as the preferred model in terms of the time dependent de-velopment representation of the RCC modulus of elasticity across all ages. Equa-tions 4-46 and 4-47 present the exponential hardening function with regard to the Young’s modulus prediction.

83
)()()( sCeEeC tEtktE ⋅= Eq. 4-46
with kE te ts EC
Multiplier (normalised property) [-] Effective age [d] Standard age, basic age [d], 28, 90 or 365 d Young’s modulus of cylinders ∅ 150 mm [MPa]
( )ceEeE tbktk ⋅⋅∞= exp)()( Eq. 4-47
with kE(∞) b, c
Multiplier at infinite age [-] Hardening function shape factors [-]
0
5
10
15
20
25
30
0.1 1 10 100 1000RCC age te [d]
You
ng's
mod
ulus
Muj
ib D
am R
CC
[GP
a]
Average elasticmodulus
Eq. 4-46 and 4-47for Mujib RCC
Equations 4-46 and 4-47 for Mujib RCC:
kE(∞) = 1.20; b = -4.75; c = -0.55EC(365d) = 24.4 GPaEC(∞) = 29.3 GPa
Mujib RCC:
OPC 85 kg/m³no pozzolanw/B 1.61 Average coefficient
of variation acc. to Tab. 4-8 (36.7 %)
Fig. 4-28: Average Young’s moduli from laboratory tests at Mujib Dam and re-
gression by Eq. 4-46 and 4-47 using presented parameters (basic age 365 d).
The application of Equations 4-46 and 4-47 with the function shape parameters pre-sented in Figure 4-28 and a multiplier kE(∞) of 1.2 related to the basic age of 365 days shows a perfect fitting to the average elastic moduli determined from the Mujib Dam RCC (coefficient of determination R2 = 0.99). The multiplier kE(∞) re-lated to the basic age of 90 days resulted in 1.73 with the same quality of fitting.
Since a general picture of the suitability of the proposed hardening function is de-sired, a set of various RCC and CVC mixes containing or not containing pozzolan has been evaluated in respect of their Young’s moduli evolution, necessarily taking

84
the effect of re-hardening on the modulus of elasticity into account. Consequently, only basic ages of 90 and 365 days have been looked at (Fig. 4-29).
0
1
2
3
4
0.1 1 10 100 1000 10000
RCC age te [d]
Rel
ated
You
ng's
mod
ulus
EC(t e
) / E
C(3
65d)
[GPa
]
C+F = 60-70kg/m³
C+F = 70-90kg/m³
C+F = 90-120kg/m³
C+F = 120-160kg/m³
C+F > 160kg/m³
Eq. 4-47
0
1
2
3
4
0.1 1 10 100 1000 10000
RCC age te [d]
Rel
ated
You
ng's
mod
ulus
EC(t e
) / E
C(9
0d) [
GPa
]
C+F = 60-70kg/m³
C+F = 70-90kg/m³
C+F = 90-120kg/m³
C+F = 120-160kg/m³
C+F > 160kg/m³
Eq. 4-47
Equation 4-47
kE(∞) = 1.75; b = -4.75; c = -0.55
Equation 4-47
kE(∞) = 1.40; b = -4.75; c = -0.55
Fig. 4-29: Hardening relations for Young’s modulus evolution of various RCC
and CVC mixes (Berga et al. 2003, ACI 1999, 1997) and approximation by Equation 4-47 acc. to basic ages of 90 (top) and 365 d (below).
Based on the results depicted in Figure 4-28, the extended data set has been ap-proximated by Equation 4-47, utilising the shape parameters concluded from the investigations at the Mujib Dam. Based on the best fit analysis of the related modulus data presented in Figure 4-29, the multipliers 1.75 with regard to a basic age of 90 days (R2 = 0.996) and 1.4 related to a basic age of 365 days (R2 = 0.992) are recommended to be used with the proposed type of hardening function. Dolen

85
(2003) conducted modulus of elasticity tests on up to 10 years old RCC specimen from Upper Stillwater Dam, which resulted in values of kE(∞) of 1.71 and 1.8 re-lated to a 90 days basic age and of 1.41 and 1.37 considering the basic age of 365 days, thus confirming the proposed hardening function and suggested parame-ters. Like the trend concluded from the compressive strength behaviour of RCC, the multipliers kE(∞) decrease with the inverse power of the increase of the basic age. The presented multipliers kE(∞) again show the considerable difference of the tem-poral behaviour compared to normal concrete for which generally a multiplier of 1.15 related to the Young’s modulus at a concrete age of 28 days is assumed (e.g. Eierle 1999).
4.3.6 Poisson’s ratio of RCC
The Poisson’s ratio is defined as the ratio of the lateral to the axial strain resulting from a uniformly distributed axial stress below the elastic limit (USACE 2000). It is an important elastic material parameter in the context of the computational stress analysis as it allows the consideration of the self-weight of the RCC dam influenc-ing the horizontal strains and stresses. The Poisson’s ratio for RCC is in the range of 0.17 to 0.22 with 0.2 recommended when testing has not been performed (USACE 2000). Extreme values from 0.11 to 0.27 are reported for mass concrete (ACI 1997). The Poisson’s ratio is influenced by the aggregate, the cementitious matrix and the relative proportions of the two. It slightly increases with the RCC age and strength (ACI 1999, 1997). However, this effect can be considered negligible. For the sake of orientation, Figure 4-30 gives the Poisson’s ratios of selected mass concrete aggre-gate types, showing that the average ratios are in the range of the reported values for mass concrete.
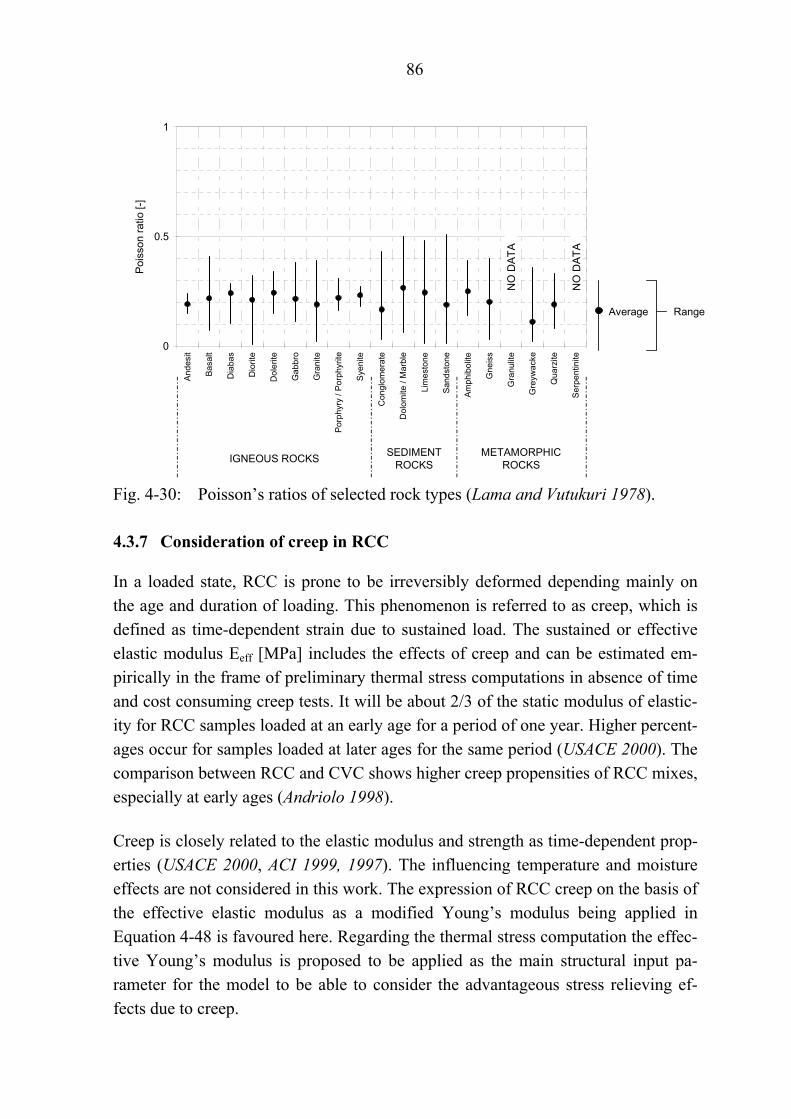
86
0
0.5
1
And
esit
Bas
alt
Dia
bas
Dio
rite
Dol
erite
Gab
bro
Gra
nite
Por
phyr
y / P
orph
yrite
Sye
nite
Con
glom
erat
e
Dol
omite
/ M
arbl
e
Lim
esto
ne
San
dsto
ne
Am
phib
olite
Gne
iss
Gra
nulit
e
Gre
ywac
ke
Qua
rzite
Ser
pent
inite
Pois
son
ratio
[-]
Average Range
NO
DAT
A
IGNEOUS ROCKS SEDIMENT ROCKS
METAMORPHIC ROCKS
NO
DAT
A
Fig. 4-30: Poisson’s ratios of selected rock types (Lama and Vutukuri 1978).
4.3.7 Consideration of creep in RCC
In a loaded state, RCC is prone to be irreversibly deformed depending mainly on the age and duration of loading. This phenomenon is referred to as creep, which is defined as time-dependent strain due to sustained load. The sustained or effective elastic modulus Eeff [MPa] includes the effects of creep and can be estimated em-pirically in the frame of preliminary thermal stress computations in absence of time and cost consuming creep tests. It will be about 2/3 of the static modulus of elastic-ity for RCC samples loaded at an early age for a period of one year. Higher percent-ages occur for samples loaded at later ages for the same period (USACE 2000). The comparison between RCC and CVC shows higher creep propensities of RCC mixes, especially at early ages (Andriolo 1998).
Creep is closely related to the elastic modulus and strength as time-dependent prop-erties (USACE 2000, ACI 1999, 1997). The influencing temperature and moisture effects are not considered in this work. The expression of RCC creep on the basis of the effective elastic modulus as a modified Young’s modulus being applied in Equation 4-48 is favoured here. Regarding the thermal stress computation the effec-tive Young’s modulus is proposed to be applied as the main structural input pa-rameter for the model to be able to consider the advantageous stress relieving ef-fects due to creep.
87
Equation 4-48 published by e.g. USACE (2000) expresses creep as specific creep, which defines the deformation per unit stress including the elastic portion. Gener-ally, for other stress levels a direct linearity is assumed within this relation (e.g. Mindess et al. 2003). This linearity can be accepted for stress levels not exceeding 50 % of the ultimate compressive strength of the concrete (Mindess et al. 2003) or more general, when the stress level is not exceeding the elastic limit. In order to obtain presented Equation 4-48 the logarithmic expression for the ageing function ln(Δt + 1) has been applied, which is valid for stress levels of maximum 40 % of the ultimate compressive strength (Buyukozturk 2004) or 35 % (Kim 2001), respec-tively. The formula consists of a part representing the initial elastic deformation 1/EC and a second part reflecting the long-term deformations.
)1ln()()(
1),(
1
00
+Δ⋅+=Δ
tKFtEttE Ceff
Eq. 4-48
with Eeff(Δt,t0) EC(t0) F(K) Δt t0
Effective elastic modulus at age t0 after loading time Δt [MPa] Static Young’s modulus at age t0 [MPa] Creep rate [-] Time after loading [d] Effective concrete age [d]
In the following it shall be looked closer at the generally applied Equation 4-48 rep-resenting the effective modulus method and especially at the ageing function F(K) ⋅ ln(Δt + 1). The total strain εtot at a certain time Δt after concrete loading can be divided into the elastic, instantaneous deformation εinst and the creep deformation εcr (Eq. 4-49).
crinsttot εεε += Eq. 4-49
with εtot εinst εcr
Total strain [-] Instantaneous strain [-] Creep strain (function of time) [-]
Buyukozturk (2004) gives the creep function (Eq. 4-50) for an applied unit stress at a concrete age t0.

88
),()(
1),(
10
00
ttCtEttEeff
Δ+=Δ
Eq. 4-50
with Eeff(Δt,t0) EC(t0) C(Δt,t0)
Effective elastic modulus at age t0 after loading time Δt [MPa] Static elastic modulus at age t0 [MPa] Specific creep function [MPa-1]
The specific creep function reflects the temporal development of the creep strain compared to the applied stress (Eq. 4-51).
)(),(
00 tE
ttCCinst
crcr
⋅==Δ
εε
σε Eq. 4-51
with σ Compressive stress [MPa]
The temporal development of the creep strain can be expressed as a logarithmic law under the precondition that stress levels do not exceed 40 % of the ultimate com-pressive strength at each concrete age. Equation 4-52 can be written accordingly (Buyukozturk 2004).
)1ln()(),( 0 +Δ⋅=Δ tKFttC Eq. 4-52
According to the proportional relation between creep strain and applied stress, only 40 % of the creep strains will result in the case of an application of 40 % of the ul-timate compressive strength. This stress level is assumed to be implicitly incorpo-rated in the denominator of Equation 4-51, resulting from the definition of the Young’s modulus (Eq. 4-41). This, together with Equation 4-52, leads to Equa-tion 4-53.
)1ln()(4.0)(
4.0),(0
0 +Δ⋅⋅=⋅
⋅=Δ tKFtE
ttCCinst
cr
εε Eq. 4-53
Consequently, Equation 4-48 can be rewritten as Equation 4-54, which will be the equation applied in the frame of the effective elastic modulus prediction for RCC within this work.
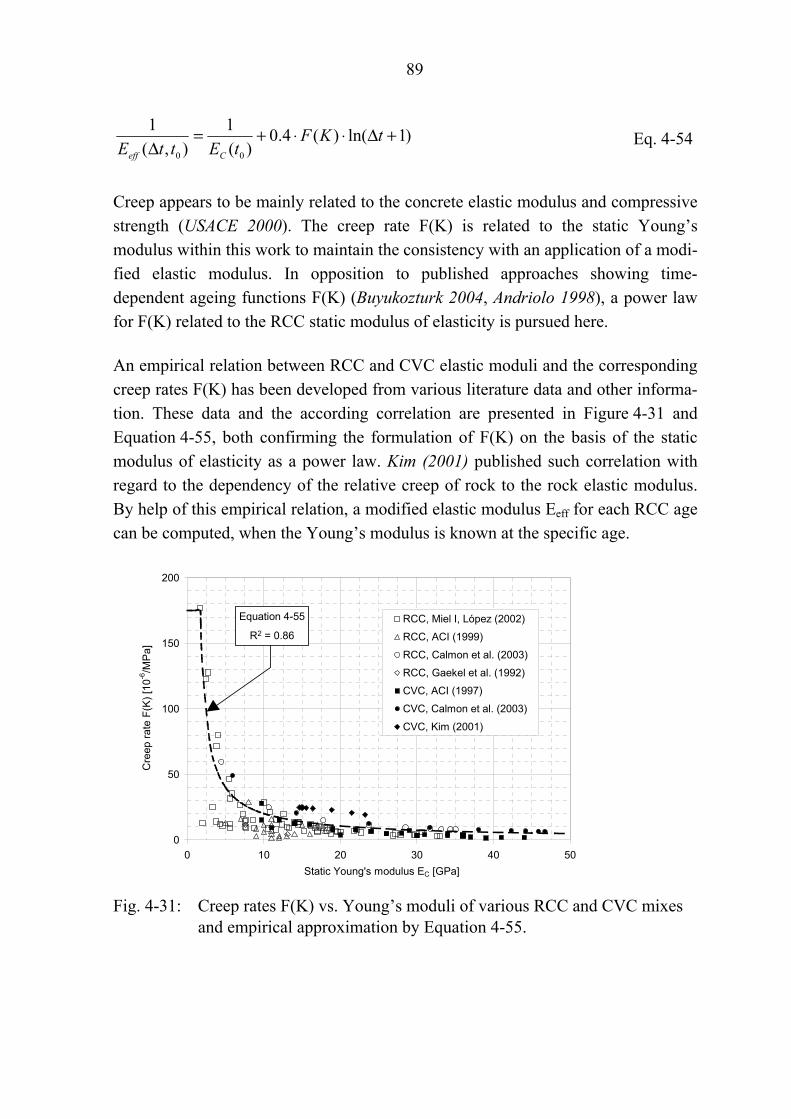
89
)1ln()(4.0)(
1),(
1
00
+Δ⋅⋅+=Δ
tKFtEttE Ceff
Eq. 4-54
Creep appears to be mainly related to the concrete elastic modulus and compressive strength (USACE 2000). The creep rate F(K) is related to the static Young’s modulus within this work to maintain the consistency with an application of a modi-fied elastic modulus. In opposition to published approaches showing time-dependent ageing functions F(K) (Buyukozturk 2004, Andriolo 1998), a power law for F(K) related to the RCC static modulus of elasticity is pursued here.
An empirical relation between RCC and CVC elastic moduli and the corresponding creep rates F(K) has been developed from various literature data and other informa-tion. These data and the according correlation are presented in Figure 4-31 and Equation 4-55, both confirming the formulation of F(K) on the basis of the static modulus of elasticity as a power law. Kim (2001) published such correlation with regard to the dependency of the relative creep of rock to the rock elastic modulus. By help of this empirical relation, a modified elastic modulus Eeff for each RCC age can be computed, when the Young’s modulus is known at the specific age.
0
50
100
150
200
0 10 20 30 40 50Static Young's modulus EC [GPa]
Cre
ep ra
te F
(K) [
10-6
/MP
a]
RCC, Miel I, López (2002)
RCC, ACI (1999)
RCC, Calmon et al. (2003)
RCC, Gaekel et al. (1992)
CVC, ACI (1997)
CVC, Calmon et al. (2003)
CVC, Kim (2001)
Equation 4-55
R2 = 0.86
Fig. 4-31: Creep rates F(K) vs. Young’s moduli of various RCC and CVC mixes
and empirical approximation by Equation 4-55.

90
85.0
10001
130)(−
⎟⎟⎠
⎞⎜⎜⎝
⎛−⋅= CEKF Eq. 4-55
with F(K) EC
Creep rate [10-6/MPa] F(K) = 175 ∀ EC ≤ 1.7 GPa Static Young’s modulus [MPa]
Proposed Equation 4-55 converges to infinity when the elastic modulus approaches 1 GPa. As no verification of creep rate data for elastic moduli less than 1.7 GPa is possible due to a lack of available data, it is suggested here to keep a constant creep rate of 175⋅10-6 [MPa-1] for Young’s moduli smaller than this value.
Equation 4-55 shall be applied to the static elastic modulus data gained from the investigations at Mujib Dam (Tab. 4-8) to demonstrate the compilation of the sus-tained or effective elastic modulus for a later implementation into a preliminary numerical thermal stress analysis of an RCC dam (Fig. 4-32). In this evaluation, the loading time Δt is included as the time span between the individual testing ages t0 corresponding to Table 4-8.
0
5
10
15
20
25
30
0.1 1 10 100 1000RCC age te [d]
You
ng's
mod
ulus
Muj
ib D
am R
CC
[GP
a]
Average static Young‘s modulus EC of Mujib Dam RCC acc. to Tab. 4-8
Effective Young‘s modulus Eeff of Mujib Dam RCC acc. to Eq. 4-54 and 4-55
EC(1000d) assumed 1.2· EC(365d)
Eeff(1000d) computed acc. to Eq. 4-54 and 4-55
Fig. 4-32: Mujib Dam RCC: Static Young’s modulus and empirically determined
effective Young’s modulus by Equations 4-54 and 4-55.
The empirically determined effective modulus of elasticity of the Mujib RCC re-sults in approximately 15.6 GPa at 365 days compared to a static elastic modulus of
91
24.4 GPa, which equals a ratio of 64 % or almost 2/3 of the static Young’s modulus of the Mujib RCC.
Regarding the reasonable values of effective moduli with respect to the Mujib Dam RCC, it can be stated that the presented equations for the prediction of creep effects in the form of the effective modulus method are an appropriate tool to simply de-termine a crucial input for numerical thermal stress computations in respect of a more realistic picture of the RCC dam behaviour at a preliminary planning stage, when extensive laboratory tests are not on hand.
4.3.8 Tensile strain capacity of RCC
Tensile strain capacity (TSC) is defined as the ultimate strain under tension that can be sustained by the RCC prior to cracking (USACE 2000, Andriolo 1998). This RCC property is typically considered, when strain based approaches are applied in terms of the thermal cracking occurence (see Chapter 3.2, Equation 3-11). The TSC depends on the direct tensile strength and the effective Young’s modulus (Eq. 4-56).
eff
t
EfTSC = Eq. 4-56
with TSC ft Eeff
Tensile strain capacity [-] Direct tensile strength [MPa] Effective Young’s modulus [MPa]
The TSC typically is in the range of 10 to 140⋅10-6 [-] (USACE 2000, Andriolo 1998).
4.3.9 Non-thermal and stress independent volume changes of RCC
Drying shrinkage and autogenous volume change (chemical shrinkage) are non-thermal volume changes, which can contribute to thermally induced cracking in mass concrete structures as the contraction strains related to these effects increase the contraction strains resulting from the concrete cooling.
Non-thermal volume changes in RCC can be expected to be minor (Andriolo 1998), primarily due to the lower cementitious and water contents compared to normal concrete. Also, drying shrinkage is limited to the dam portions close to the exterior surfaces as moisture transport in the dam mass can be considered as irrelevant. Con-

92
sequently, the non-thermal volume changes are not further accounted for within the concept for preliminary numerical thermal stress computations presented within this dissertation.
4.4 Thermal and mechanical issues concerning the dam foundation
Foundation properties, which are relevant in terms of thermal stresses in an RCC gravity dam with respect to their numerical computation, are the specific weight, thermal conductivity and specific heat of the rock in terms of the thermal analysis and the rock’s coefficient of thermal dilatation, modulus of elasticity and Poisson ratio for the structural analysis.
Within the previous paragraphs these properties have been already discussed with focus on the prediction of the thermal and mechanical RCC properties. The data presented for various aggregate types can also be utilised for the characterisation of the dam foundation and are not further discussed here.

93
5 Field investigations in Jordan and China
Temperature control of the hardening RCC is one of the most important issues in the quality control during the construction of an RCC dam in order to avoid tem-perature related cracking. Temperature control starts with the dam design and the production and storage of the aggregates. It ranges from the aspects of RCC mixing and placing to the consideration of various construction parameters (e.g. scheduling, galleries, curing).
To provide aid in respect of the determination of thermal cracking risks in RCC gravity dams within the preliminary planning phase is the main goal within the pre-sent work. The primal tool in this connection is the detailed monitoring of spatial and temporal variable temperature distributions in an up to date unique information density and quality by means of distributed fibre optic temperature measurements (DFOT). The main influences on the temperature fields during the dam construction phase are identified and important notes in respect of temperature control are given, resulting from DFOT campaigns at the two Jordanian RCC gravity dams Mujib and Wala, to which a key role within this work is assigned. With regard to more general findings, additional but less extensive DFOT has been carried out at the RCC thin arch dam Shimenzhi (Northwest China).
In-situ stress monitoring by Stressmeters at selected locations in the Mujib dam ex-tends the acquired temperature data by locally recorded in-situ stress histories. This contributes to a broad view on the thermo-mechanical behaviour of Mujib Dam and helps on the assessments with regard to thermal cracking.
Fig. 5-1: Dam views (from left to right: Mujib Dam, Wala Dam, Shimenzhi
Dam.

94
5.1 Instrumentation
5.1.1 Distributed Fibre Optic Temperature Measurements (DFOT)
The development of fibre optic temperature laser systems opens up new dimensions in dam monitoring. The technology allows accurate and economic measurements of temperature distributions along fibre optic cables. Generally, in dam engineering, the demands for monitoring are high. Here, a field of various promising applications for DFOT arises (mass concrete temperature control, leakage detection, seepage flow velocity measurements, Aufleger et al. 2003, Perzlmaier et al. 2004).
DFOT is based on the temperature dependent optical properties of the glass fibre which itself represents the temperature sensor. After sending an optical signal by means of a laser into the fibre, signals of very low intensity are back scattered at each location of the fibre. A distinctive part of the back scattered light spectrum, which is directly correlated with the temperature at the monitoring point (“Raman-Light” → “Anti-Stokes-Light”) is extracted by a high sophisticated frequency analysis. The distance xi between the light source and the monitoring point in the fibre is determined from the runtime of the light pulse (Fig. 5-2). The resulting tem-perature readings can reach an accuracy of up to ± 0.2 °C. The recording of tem-perature distributions is possible with a density of one temperature value per 0.25 m of fibre length.
FIBRE
ω0
Molecular OszillationωM = f(T)
Sto
kes
ω0 + ωMω0 - ωM
ω0 - ωM
ω0
Ray
leig
h
LASER
Xi
Inte
nsity
Frequency
Ant
i-Sto
kes
= f(T
)
ω0 + ωM
Fig. 5-2: Physical principle of DFOT and measurement set-up in an RCC dam.
Usually, mass concrete temperatures are monitored by conventional thermocouples or thermistors, permitting only spot measurements. In contrary, fibre optic cables

95
provide the possibility of continuous inline temperature measurements along up to 20 km long fibre cables integrated into the dam structure. Due to their accuracy and the high information density, DFOT allow the detailed and reliable visualisation of temperature gradients within the RCC structure (see more about DFOT in Aufleger et al. 2000). Fibre cables for the purpose of DFOT are equal to those produced for telecommunications. So, the costs for the fibre optic temperature sensor are consid-erably less than these for thermocouples.
In terms of any in-situ instrumentation, RCC is not very favourable, as high loads are applied to the sensors by heavy earthmoving equipment and other vehicles in-volved in the rapid construction process. Therefore, a cable type featuring high compressive and tensile resistance according to Figure 5-3 is recommended.
Optical fibres
Central strengthmember
Loose tubes withgel filling
(waterblock)
Loose elements
Aramid yarn(tensile resistance)
Steel armour(puncture resistance
Outer and InnerJacket (PE-HD)
Diameter ~ 12 mm
Swelling tape(waterblock)
Fig. 5-3: Recommended fibre cable type for applications in RCC resisting typical
impacts on an RCC dam site.
The installation of the fibre optic cables is performed during the continuous RCC placement operation. The working steps presented in Table 5-1 turned out to be the least labour-intensive and most flexible. With just a few tools and two persons, the cable can be installed very economically. With the up-to-date experiences it could be proved, that the installation of the fibre cables can be well integrated into the rapid RCC construction process without causing any delay or additional efforts like eventual post compaction, a decisive fact for clients, engineers and contractors.

96
Tab. 5-1: Optimised working steps for the installation of fibre cables in RCC.
Step Remarks
A
Wire
Nail
RCC
• Surveying and marking out measure-ment section for DFOT in respective dam elevation
• Equipping marked out route with nails and wire, fixed at approx. 2 m distance into maximum 6 hours old RCC
B
• Initial preparation of appropriate fibre cable length outside the placement area or inside the gallery prior to RCC placement
• Laying out of the cable and fixing it to nails on top of the old RCC (step A) just before first RCC actions at meas-urement sections
• Observation of the RCC placing proc-ess just in advance and after RCC cov-ering the cable and subsequent RCC compaction
C
• Placement of RCC directly on top of the cable without any additional provi-sions
• No post compaction necessary • Parallel start of DFOT data acquisition
DFOT proved to be a suitable tool for highly sophisticated temperature monitoring in RCC dams and stand for a differentiated quality control generally demanded for mass concrete. Resulting from the linear temperature distributions and distributed temperature gradients, a conclusion in terms of eigenstresses may directly be made. As part of the monitored temperature development in the dam during construction,

97
the hydration heat itself can be determined, delivering a clear picture of the in-situ concrete maturity in the dam. The assumption of many construction related parame-ters stated in the dam design can be controlled, thus, helping to find answers to such questions as (Duan 2004):
• Is the correct concrete mix applied? • Are the curing measures adequate and eventual cooling systems efficient? • Is the maximum dam temperature under control? • Is the dam rising in the optimum speed? • Have the design assumptions of the thermal parameters been correct?
5.1.2 Stressmeters
In-situ stress measurements usually result indirectly from measured strains as a con-sequence of deformations, assuming a modulus of elasticity for the calculation of the stresses. It is different with restraint stresses as they only result from the re-strained deformations, which are not directly measurable. Also, when measuring restraint stresses in young concrete, the evolution of the elastic modulus of early age concrete as well as of aged concrete has to be considered, since the modulus changes during hydration and varies over some magnitudes.
Since measuring stresses in young concrete by ordinary stress-gauges with a con-stant elastic modulus or by strain gages is not realistically suitable, an existing Stressmeter was enhanced by the Institute of Construction Materials and Materials Testing of the Technische Universität München (Plannerer 2000) to monitor in-situ restraint stresses even for early age concrete in real concrete structures (Fig. 5-4). Until recently, only structures consisting of CVC were equipped with these Stress-meters for unidirectional stress measurements.
PT100Strain Gauge
Tension Anchor
modified RCC
80mm 420mm
500mm
Steel Pipe + Slipjoint
surrounding RCC
70m
m
56m
m
Fig. 5-4: Schematic longitudinal section through a Stressmeter (Wiegrink 2002,
modified).

98
For measuring restraint stresses in concrete, it is essential that the Stressmeter has the same extensional stiffness as the surrounding concrete. Since the elastic modulus of the surrounding concrete increases with time, the stiffness of the Stressmeter has to increase in the same scale. To achieve a satisfying convergence of the extensional stiffness of the concrete and the Stressmeter, the Stressmeter con-sists of a strain gage of small diameter and a steel pipe usually filled with the con-crete placed in the structure. The filled steel pipe decreases the influence of the strain gage on the stress measurements, resulting in a systematic error of the Stress-meter of less than 5 %. Wiegrink (2002) gives more details about the measurement principle of Stressmeters.
As for the DFOT, the installation of the Stressmeter has to be adopted to the special RCC conditions. In comparison to CVC, where compaction of the concrete is easily possible within the Stressmeter pipe, the RCC has to be compacted layer-wise with a hammer. For the filling of the Stressmeter pipe according to Figure 5-4, the maximum aggregate has to be screened off. The modified maximum aggregate size should be in the order of one third of the Stressmeter diameter, with the conse-quence of a better compaction. Laboratory tests in advance have to clarify that the RCC density within the steel pipe does not divert from the RCC density achieved in the dam. To ensure a good bond between the Stressmeter and the surrounding RCC, the two Stressmeter pipe ends are moulded into the RCC by mortar dovetails. After installation, the working area is re-compacted by heavy rollers. The whole proce-dure is to be completed within the maximum workability time characteristic for the RCC of approximately 40 min to assure a regular compaction at the measurement location. Table 5-2 shows details of the installation of a Stressmeter in RCC for dams.

99
Tab. 5-2: Applied working steps for the installation of Stressmeters in RCC.
Step Remarks
A
RCC layer (n-1)
~15cm
~70cm
Stress-meterwith data cable
RCC (max. aggregate screenedoff) in and around stress-meter
Mortar for positive tying ofstress-meter to surrounding RCC
RCC layer (n+1)
RCC layer (n)• Ideal installation elevation and posi-
tion: Placement of RCC layers n and n+1 within their final setting time
• Excavation of a trench approx. 70 cm in length and 15 cm width and depth in RCC layer n
B
• Screening off maximum aggregates to reach maximum grain size of approx. 1/3 of the Stressmeter inner diameter (≈ 20 mm)
• Preparation of adequate RCC quantity for filling Stressmeter and surround-ing trench
C
• Filling of the Stressmeter in three sin-gle layers, each compacted with 20 hammer blows
• RCC density inside the Stressmeter equal or as close as possible to the RCC density in the dam

100
Step Remarks
D
CVC RCC
• Installation of the Stressmeter in layer n and adequate bedding into modified RCC; Stressmeter ends to be left free
• Filling of the dove tails with mortar assuring bond between structure and Stressmeter
E
• Distribution of modified RCC at trench location
• Re-compaction of layer n with vibra-tory roller (approx. 2.5 t) at Stress-meter location
5.1.3 DFOT Heat-up method for in-situ acquisition of RCC thermodynamic properties
The measuring principle of the DFOT Heat-up method does not differ from that of the conventional DFOT method. However, the applied fibre cable varies from that used with the conventional DFOT method, since additional copper wires are inte-grated into the fibre cable (Aufleger et al. 2000).
By applying voltage to the copper wires, a temperature rise is induced in the cable. The temperature increase in absence of convection is dominated by the cable de-sign, the specific heat c [J/kg.K] and the thermal conductivity λ [W/m.K] of the sur-rounding material. The in-situ acquisition of the thermal parameters of the sur-rounding material requires the thermodynamic approach of the transient cylindrical heat source theory by which the transient temperature increase in the cylinder centre is modelled (Perzlmaier et al. 2004). The DFOT Heat-up method as a tool for the determination of the thermal parameters in young RCC has initially been applied at the Mujib Dam in 2001 (Conrad et al. 2005) following so-called transient thermal response applications for geothermal questions (Sanner et al. 1999). The typical experimental set-up for the in-situ measurement of thermal parameters by the DFOT Heat-up method is depicted in Figure 5-5.

101
DFOT Laser (1)
Power supply (2)(Transformer)
Voltmeter (3)Megohmmeter
Amperemeter (3)(Clampmeter)
Copper wires
Heat-up cable (4)
(1) (2)
(3)(4)
(1) (2)
(3)(4)
Fig. 5-5: Typical experiment set-up for the DFOT Heat-up method for the in-situ
determination of thermal parameters.
As long as the voltage is applied to the heat-up cable, the inside temperature keeps rising linearly in a logarithmic time scale. The solution of the transient cylindrical conduction differential equation can only be solved numerically, but long-time ap-proximate solutions exist which allow to derive the thermal parameters of the sur-rounding material from the heat-up graphs (Perzlmaier et al. (2004), Fig. 5-6).
Tem
pera
ture
T [°
C]
Time tT0
I III
II
IV
ΔT(t)
base temperatureT0
temperature differenceΔT
reference measurement (no voltage)I
starting point of heatingII
transient temperature evolution ruled by heat-up cableIII
transient temperature evolution ruled by surrounding materialIV
base temperatureT0
temperature differenceΔT
reference measurement (no voltage)I
starting point of heatingII
transient temperature evolution ruled by heat-up cableIII
transient temperature evolution ruled by surrounding materialIV Fig. 5-6: Temperature development arising from a typical DFOT Heat-up ex-
periment (acc. to Perzlmaier et al. 2004).
According to Perzlmaier et al. (2004), a heat-up cable embedded in concrete and heated with a constant heat flux may be represented by a cylindrical heat source embedded in a homogeneous, isotropic and infinitely extended material if the radial range of the temperature increase does not exceed the extension of the surrounding material. To calculate the temperature increase the complex cross section of the heat-up cable has to be simplified by a substitute system comparable to that shown in Figure 5-7.

102
T(r)
rr
T(r)
rr
Theoretical temperaturedistribution in heat-up cable(fibre in centre of rotation-symmetric heat-up cable)
Substitute system of temperaturedistribution in heat-up cable
ΔT ΔT
Fig. 5-7: Substitute systems for the representation of the heat-up cable (acc. to
Perzlmaier et al. 2004).
The interior temperature evolution due to the transient conductive heat flow from the heat-up cable for the presented substitute system is given by Equation 5-1 under the preconditions that the thermal conductivity of the cable is infinite and the sur-face conductivity is finite. Equation 5-1 is an approximate solution according to the already mentioned long-term solution for thermal response tests (Perzlmaier et al. 2004).
⎟⎟⎠
⎞⎜⎜⎝
⎛
⋅⋅+−⎟
⎠⎞
⎜⎝⎛ ⋅⋅+⎟⎟
⎠
⎞⎜⎜⎝
⎛⋅⋅
=ΔHrr
tattqtT L λγ
λπ24lnln
4)( 2
0
0
Eq. 5-1
with ΔT(t)qL λ t t0 a c ρ r γ H
Transient temperature evolution [K] Specific thermal heat flux [W/m] Thermal conductivity [W/m.K] Time [s] Threshold time 1 s Thermal diffusivity (Eq. 4-25) [m2/s] Specific heat [J/kg.K] Specific weight [kg/m3] Cable radius [m] Euler Constant = 0.5772156... [-] Thermal contact resistance [W/m2.K]
In order to be able to determine the thermal parameters in the RCC structure, the thermal contact resistance H, which represents the influence of the cable on the temperature rise (insulation effects) and only influences the elevation but not the form and the slope of the heat-up curve, has to be calibrated for the specific heat-up

103
cable in materials of known thermal conductivity and specific heat. This should be performed in at least two different materials, which cover a wide spectrum of ther-mal conductivities. Figure 5-8 shows the DFOT Heat-up experiment set-up for the calibration of the thermal contact resistance H of a certain heat-up cable within a test campaign at the Laboratory of Hydraulic and Water Resources Engineering of the TU München. The heat-up cable has been embedded in different materials (PVC pellets, sand, conventional concrete) in an insulated box. Applied specific heat in-puts qL have been 11 W/m and 10 W/m respectively. Such heat input, while measur-ing the thermal properties of young concrete, accelerates the hardening and maturity progress in the direct vicinity of the heat-up cable. This has to be borne in mind for the evaluation of the parameters in still hydrating concrete. It turns out, resulting from this problematic, that the determination of the thermal concrete properties by the DFOT Heat-up method is best applicable for already hardened concrete.
Insulated box
Tested material
Heat-up cable
0.5m3.0m
0.5m
Fig. 5-8: Experimental set-up for basic investigations of the DFOT Heat-up
method for the estimation of thermal material properties.
The resulted temperature measurements have been fit by use of Equation 5-1 and the calibrated thermal contact resistance H (43.75 W/m2.K for the applied heat-up cable). By best fit analysis the present thermal material properties, which govern the elevation and the slope of the temperature rise, have been determined. With regard to the plausibility of the values estimated by the Heat-up method, same materials and their thermal properties have been conventionally tested in standardised heat-flow meter tests according to DIN 52616 (1977).

104
0
5
10
15
0 1 2Time [h]
Tem
pera
ture
incr
ease
ΔT
[K]
Quarzitic sand 10 W/m
Equation 5-1 Quarzitic sand 10 W/m
Concrete (CVC) 10 W/m
Equation 5-1 Concrete (CVC) 10 W/m
Quarzitic sandλ = 1.1 W/m.Kc = 880 J/kg.K
Concrete (CVC)λ = 2.1 W/m.Kc = 900 J/kg.K
0
1
2
3
0 1 2 3Thermal conductivity DFOT Heat-pulse method [W/m.K]
Ther
mal
con
duct
ivity
hea
t-flo
w m
eter
[W
/m.K
]
Concrete (CVC)
Sand + PVC-Pellets
PVC-Pellets
Insulated box
Tested material
Heat-up cable
0.5m3.0m
0.5m
No heat-flow meter valuesfor quarzitic sand available
Fig. 5-9: Heat-up curves in sand and CVC from the DFOT Heat-up method (top)
and comparison between DFOT and heat-flow meter values (bottom).
The tests proved the functionality of the DFOT Heat-up method as a thermal re-sponse test capable to estimate thermal conductivities in the range of 0.05 W/m.K to 3.5 W/m.K with an accuracy which is acceptable for applications in hydraulic engi-neering. In the described testing campaign it turned out that a higher confidence of the determined values is possible by application of high heat inputs up to 30 W/m.K.
Within the described test campaigns, an in-situ determination of the thermodynamic parameters in a CVC gravity dam has been performed as well, confirming the field

105
functionality of the presented methodology. The dam concrete consists of 120 kg/m3 cement, 40 kg/m3 fly ash, 103 kg/m3 water and mainly greywacke aggre-gates with 125 mm maximum size aggregate and a specific weight of approximately 2 400 kg/m3. The measured values for the thermal conductivity λDam,DFOT = 2.7 W/m.K and the specific heat cDam,DFOT = 1.08 kJ/kg.K turned out to be close to the afterwards by Equations 4-23 and 4-24 determined thermodynamic properties (λDam,Eq. 4-23 = 2.5 W/m.K, cDam,Eq. 4-24 = 1.14 kJ/kg.K).
5.2 Mujib Dam (Hashemite Kingdom of Jordan)
5.2.1 Site description
Mujib Dam is located in the Wadi Al Mujib, approximately 60 km south of the Jor-danian capital Amman and 30 km east of the Dead Sea. It is constructed at the con-junction of two wadi creeks as a composite dam consisting of an RCC gravity sec-tion in the valley centre, accommodating the stepped spillway, and rock fill em-bankments with clay core at the valley flanks. The location and general layout of Mujib Dam is presented in Figure 5-10, the main data are given in Table 5-3.
170 16
0
150
150
210
200
180
200
190
230 22
0 210
146.00
180
146.00
right abutmentembankment
bottom outlet
draw-off
RCC gravity section& spillway
0 100
North
left abutmentembankment
reservoir
190180
170
160
Jordan
100 km
Amman
Mujib Dam
Wala Dam
Longitude [°]34 35 36 37 38 39 40
29
30
31
32
33
34
Latit
ude
[°]
Nor
th
Fig. 5-10: Location and general layout of Mujib Dam.

106
Tab. 5-3: Main data of Mujib Dam.
Owner and project objectives
• Owner: Jordan Valley Authority (JVA) as part of the Jordan Ministry of Water and Irri-gation (MWI)
• Objectives: Regulation of wadi water re-sources and flows, water utilisation for chemical industry and tourism at the Dead Sea, agricultural development and municipal water for Amman
Hydrology • Catchment area at dam: 4 380 km2 • Probable maximum flood (PMF): 5 840 m3/s • Reservoir capacity: 35⋅106 m3
Dam data
• Type: Composite RCC / clay core rock fill • Max. height above wadi bed: 61 m • Max. height above foundation: 67 m • Total crest length: 770 m (RCC 490 m) • RCC volume: 654 000 m3 • Crest elevation: 200.2 masl • Max. water level: 194.0 masl • Year of completion: 2003
Site characteristics relevant for RCC construction
The geology of Wadi Mujib at the dam location is the decisive factor for the con-struction of Mujib Dam as a composite dam. Since weak black shale and mudstone strata with an average deformation modulus of 1 GPa are present at the wadi abut-ments, RCC gravity sections were not executed there. In the valley centre a suitable foundation, consisting of dense limestone with a characteristic deformation modulus of 20 to 25 GPa, allowed the construction of the RCC gravity dam. Detailed infor-mation on the geology at Mujib Dam is available in Abed et al. (2002).
In terms of the thermal behaviour of an RCC dam and the according issues for the concrete technology and the construction scheduling, the climate at the dam site plays an important role. Mujib Dam is exposed to the semiarid to arid climate of Jordan. The dam site is characterised by very hot and dry summers from about May to September and moderate to cold winters from November to February. The rest of

107
the year holds rather moderate, warm temperatures. The average annual precipita-tion of 154 mm/a occurs during the rainy season from November to February. Fig-ure 5-11 displays the temperature recordings at the Mujib Dam site during the con-struction time.
0
10
20
30
40
01.01.2001 01.01.2002 01.01.2003 01.01.2004
Air
tem
pera
ture
[°C
]
average day average month average year
maximum month
minimum month
Fig. 5-11: Mean daily temperatures during the construction time of Mujib Dam.
The in-situ thermal behaviour of an RCC dam is highly dependent on the construc-tion start date, the construction sequence and the placing speed. Figure 5-12 thus shows the RCC placing schedule of that part of Mujib Dam, where DFOT have been performed and which serves as a basic dam characteristic for later assess-ments. The RCC placement for the considered RCC dam section 0+906.2 began in January 23rd, 2001. An almost continuous placing process with the dam rising at approximately 30 cm/d is seen up to dam elevation 165.9 masl, where an approxi-mately one-month placing break occurred. After another continuous dam raising at roughly 40 cm/d, a further, very extended placement break of one year appeared at elevation 181.5 masl.

108
140
145
150
155
160
165
170
175
180
185
190
01.01.01 01.07.01 01.01.02 01.07.02 01.01.03Date of Placing
Dam
Ele
vatio
n [m
ASL
]
194.00189.00
145.00
0.81 10.1
0 25 m
143.00
0 100 m
200.20
Top of RCC 188.25 masl
Top of foundation 143.00 masl
SpillwayPier
Gallery
Plinth
Fig. 5-12: RCC placing schedule of Mujib Dam in DFOT measurement section.
Constructive aspects
The RCC mix designation followed a low to medium cementitious content concept. Per cubic metre of RCC, 85 kg/m3 of Ordinary Portland Cement (OPC) were util-ised without the addition of pozzolan or other additives. However, the present basalt fines may be attributed pozzolanic properties, leading to the rather fuzzy definition of the RCC mix. For the RCC placing procedure, the traditional method of placing horizontal RCC layers with a thickness of 30 cm was adopted. To achieve good strength and bond properties across the horizontal joints, a bedding mortar was used at the upstream face at least one third of the dam width at the current elevation and approximately 2 m at the downstream face.
The upstream face with a horizontal to vertical 0.1 : 1 slope was executed with con-ventional vibratable concrete against wooden formwork. The CVC was placed in a 30 to 40 cm wide strip after the spreading of the bedding mortar and prior to the placement of the RCC. In the lower portion of the RCC gravity section up to eleva-tion 150 masl, an upstream exposed PVC membrane (see Fig. 1-5, Chapter 1.3.2)
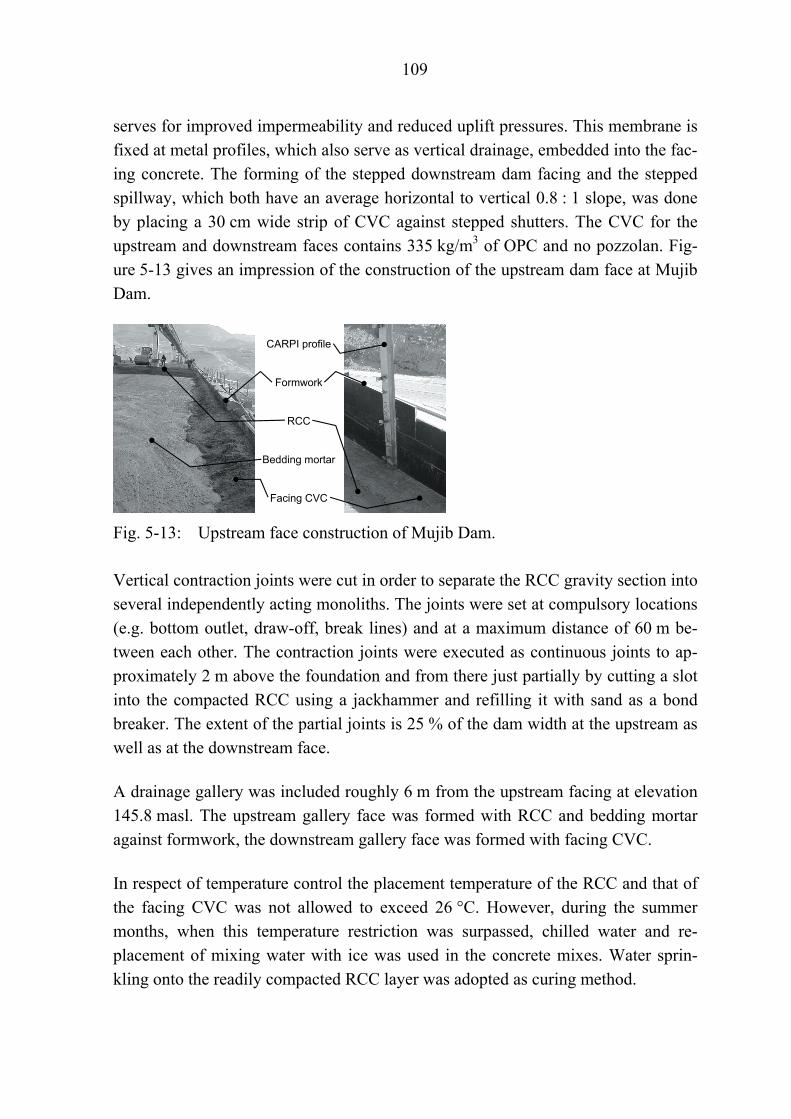
109
serves for improved impermeability and reduced uplift pressures. This membrane is fixed at metal profiles, which also serve as vertical drainage, embedded into the fac-ing concrete. The forming of the stepped downstream dam facing and the stepped spillway, which both have an average horizontal to vertical 0.8 : 1 slope, was done by placing a 30 cm wide strip of CVC against stepped shutters. The CVC for the upstream and downstream faces contains 335 kg/m3 of OPC and no pozzolan. Fig-ure 5-13 gives an impression of the construction of the upstream dam face at Mujib Dam.
CARPI profile
Formwork
RCC
Bedding mortar
Facing CVC
Fig. 5-13: Upstream face construction of Mujib Dam.
Vertical contraction joints were cut in order to separate the RCC gravity section into several independently acting monoliths. The joints were set at compulsory locations (e.g. bottom outlet, draw-off, break lines) and at a maximum distance of 60 m be-tween each other. The contraction joints were executed as continuous joints to ap-proximately 2 m above the foundation and from there just partially by cutting a slot into the compacted RCC using a jackhammer and refilling it with sand as a bond breaker. The extent of the partial joints is 25 % of the dam width at the upstream as well as at the downstream face.
A drainage gallery was included roughly 6 m from the upstream facing at elevation 145.8 masl. The upstream gallery face was formed with RCC and bedding mortar against formwork, the downstream gallery face was formed with facing CVC.
In respect of temperature control the placement temperature of the RCC and that of the facing CVC was not allowed to exceed 26 °C. However, during the summer months, when this temperature restriction was surpassed, chilled water and re-placement of mixing water with ice was used in the concrete mixes. Water sprin-kling onto the readily compacted RCC layer was adopted as curing method.

110
Table 5-4 presents the typical dosages of the RCC and CVC mixtures utilising ba-salt aggregates. These are the relevant mixtures which will serve as the basic mix-tures being considered for the subsequent assessments.
Tab. 5-4: RCC and CVC mixture dosages for DFOT and Stressmeter measure-ment sections at Mujib Dam (Stabel and Wigand 2004).
Component RCC CVC
OPC [kg/m3] 85 335
Pozzolan [kg/m3] - -
Free water [kg/m3] 136.0 - 144 171
Admixture [l/m3] - 1.43
w/B-ratio [-] 1.54 0.51
Maximum size aggregate [mm] 38 38
37.5 - 19 mm 595 27 % 383 20 %
19 - 9.5 mm 483 21 % 383 20 %
9.5 - 4.75 mm 265 12 % 345 18 %
4.75 > mm 736 33 % 192 10 % Bas
alt [
kg/m
3 ]
Added sand 154 7 % 613 32 %
Theoretical density [kg/m3] 2 512 2 438
Installation of fibre cables for DFOT and Stressmeters
A total of 4 000 m of fibre cable was installed in the centre of the two RCC mono-liths C and D (Fig. 5-14), which represent maximum size monoliths with a contrac-tion joint spacing of approximately 60 m. Altogether 13 DFOT horizontal planes were selected in four measurement sections perpendicular to the dam axis in order to monitor the transient temperature fields. In each of the two monoliths, one of the two DFOT sections is situated in the monolith centre, the second DFOT section is shifted by 5 m. The minimum distance of the fibre cable to the dam faces is 0.2 m (Fig. 5-15). For the detailed monitoring of vertical temperature distributions be-tween elevations 144.0 masl and 158.1 masl, the vertical distance between the DFOT planes was set 2.1 m. The distance was increased above elevation
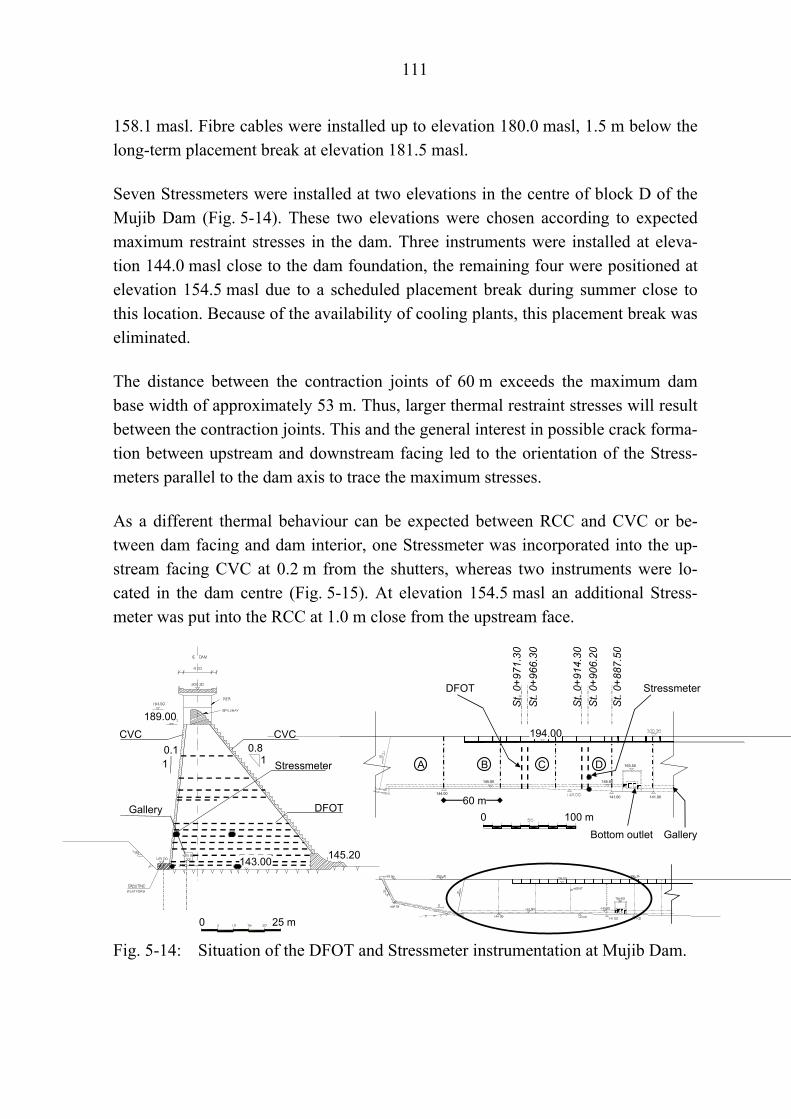
111
158.1 masl. Fibre cables were installed up to elevation 180.0 masl, 1.5 m below the long-term placement break at elevation 181.5 masl.
Seven Stressmeters were installed at two elevations in the centre of block D of the Mujib Dam (Fig. 5-14). These two elevations were chosen according to expected maximum restraint stresses in the dam. Three instruments were installed at eleva-tion 144.0 masl close to the dam foundation, the remaining four were positioned at elevation 154.5 masl due to a scheduled placement break during summer close to this location. Because of the availability of cooling plants, this placement break was eliminated.
The distance between the contraction joints of 60 m exceeds the maximum dam base width of approximately 53 m. Thus, larger thermal restraint stresses will result between the contraction joints. This and the general interest in possible crack forma-tion between upstream and downstream facing led to the orientation of the Stress-meters parallel to the dam axis to trace the maximum stresses.
As a different thermal behaviour can be expected between RCC and CVC or be-tween dam facing and dam interior, one Stressmeter was incorporated into the up-stream facing CVC at 0.2 m from the shutters, whereas two instruments were lo-cated in the dam centre (Fig. 5-15). At elevation 154.5 masl an additional Stress-meter was put into the RCC at 1.0 m close from the upstream face.
Bottom outlet
144.00
145.80
Gallery
145.80
141.00
163.50
194.00
DFOT
St.
0+97
1.30
St.
0+96
6.30
St.
0+91
4.30
St.
0+90
6.20
141.00
DC
Stressmeter
0 100 m
BA
60 m
St.
0+88
7.50
Gallery
189.00
145.20
0.81 10.1
CVC CVC
0 25 m
143.00
DFOT
Stressmeter
Fig. 5-14: Situation of the DFOT and Stressmeter instrumentation at Mujib Dam.

112
0+914.3(Centre block D)
CVC
RCC
RCC
Damcentre
2.0 m
1.0 m0.2 m
4.0 m
Upstream 0.3 m 1
2
3
4
STRESS-METER
)* Stress-meteronly at el. 154.5 masl
2
0+914.3(Centre block D)
CVC
RCC
0.2 m0.3 m
Instrumentationduct to gallery
Upstream
0+906.2
variable
Downstream
RCC
CVC0.2 m
R = 0.2 m
DFOT
Fig. 5-15: Representative layout of Stressmeters (top) and fibre cables (bottom) at
Mujib Dam.
Tab. 5-5: Locations of the DFOT instrumentation at Mujib Dam.
DFOT horizon [masl] Date of installation Dam station (± 0.2 m) 144.3 144.6
11.02.2001 15.02.2001
0+887.5; 0+911.9 0+966.3; 0+971.3
145.5 27.02.2001 0+906.2; 0+914.3 0+966.3; 0+971.3
147.6 15.04.2001 0+906.2; 0+914.3 0+966.3; 0+971.3

113
DFOT horizon [masl] Date of installation Dam station (± 0.2 m)
149.7 13.05.2001 0+906.2; 0+914.3 0+966.3; 0+971.3
151.8 07.06.2001 0+906.2; 0+914.3 0+966.3; 0+971.3
153.9 22.06.2001 0+906.2; 0+914.3 0+966.3; 0+971.3
156.0 04.07.2001 0+906.2; 0+914.3 0+966.3; 0+971.3
158.1 17.07.2001 0+906.2; 0+914.3 0+966.3; 0+971.3
165.6 29.09.2001 0+906.2; 0+914.3 0+966.3; 0+971.3
166.5 07.11.2001 0+906.2; 0+914.3 0+966.3; 0+971.3
168.9 14.11.2001 0+906.2; 0+914.3 0+966.3; 0+971.3
172.8 03.12.2001 0+906.2; 0+914.3 0+966.3; 0+971.3
180.0 15.01.2002 0+906.2; 0+914.3 0+966.3; 0+971.3
Tab. 5-6: Locations of the Stressmeter instrumentation.
Level [masl] Date of installation Dam station (± 0.2 m)
144.0 06.02.2001 0+914.3
154.5 25.06.2001 0+914.3
A hybrid fibre cable with a diameter of 14 mm and two integrated copper wires with a cross section area of 1 mm2 each (Fig. 5-16) was implemented into the Mujib Dam RCC at dam elevation 150.6 masl for the in-situ determination of the thermo-dynamic RCC properties.

114
Optical fibres
Copper wires
Central strengthmember
Jacket (PE-HD)d = 2 mm
Diameter ~ 14 mm
Gel-yarnfilling
Metal sheath
Fig. 5-16: Hybrid fibre cable used for heat-up experiments at Mujib Dam.
Resulting from an envisaged maximum specific heat flux qL of 5 W/m, according to Equation 5-1, and a total length of the connected copper wires of 153 m, a power supply delivering at least 765 W was required. An adjustable 1 000 W transformer therefore was provided in order to achieve the scheduled voltages of 25 to 60 V and currents between 6 and 15 A.
5.2.2 Temperature behaviour and thermodynamic RCC properties
5.2.2.1 In-situ acquisition of thermodynamic properties of the Mujib RCC
Since the chosen transformer turned out not to be suitable for high heat inputs of up to 10 W/m for reasons of extreme internal heating, heat-up experiments with an ap-plied power of 3 W/m and 5 W/m finally led to the evaluation of the in-situ thermo-dynamic properties of the RCC mass. The heating phase (phase II to IV according to Figure 5-6) had a duration of 2 to 3 h. Figure 5-17 displays the heat-up curves of distributed spots in the RCC mass along the embedded heat-up cable. The average heat-up curve and a deviation magnitude of ± 0.25 K from the average heat-up curve, which reflects the best accuracy of the Distributed Temperature Sensor (DTS) applied for the DFOT. Equation 5-1 has been used within a best fit analysis to determine the thermal conductivity λ [W/m.K] and the specific heat c [J/kg.K].

115
0
2
4
6
0 1 2 3Time [h]
Tem
pera
ture
incr
ease
ΔT
[K]
Data 5 W/m
Eq. 5-1 Mujib RCC 5 W/m
RCC 85 kg/m3
λ = 1.85 W/m.Kc = 930 J/kg.K
0
2
4
6
0 1 2 3Time [h]
Tem
pera
ture
incr
ease
ΔT
[K]
Data 3 W/m
Eq. 5-1 Mujib RCC 5 W/m
RCC 85 kg/m3
λ = 2.2 W/m.Kc = 1 000 J/kg.K
average ΔT
- 0.25 K
+ 0.25 K
average ΔT
- 0.25 K
+ 0.25 K
average ΔT
- 0.25 K
+ 0.25 K
average ΔT
- 0.25 K
+ 0.25 K
Fig. 5-17: Heat-up curves for 3 W/m (top) and 5 W/m (bottom) and determination
of the thermodynamic RCC properties for Mujib Dam.
Resulting from the two heat-up experiments a range of the thermal conductivities between 1.85 and 2.2 W/m.K and of the specific heats between 930 and 1 000 J/kg.K has been identified. The thermal diffusivity a [m2/s] may then be com-puted according to Equation 4-25, considering the RCC density of 2 512 kg/m3, and so reaching at 7.91⋅10-7 to 8.75⋅10-7 m2/s.
However, these values from the initial application of this measurement principle have to be considered cautiously due a notable correlation between the measure-ment confidence and the heating power qL (Scharf 2004). The lower the heat input and the lower the resulting temperature increase of the heat-up cable, the larger ac-tually will be the measurement error. Nevertheless, the results from the measure-
3
116
ments depicted in Figure 5-17 are accounted as appropriate (coefficient of determi-nation in the range of 0.88 to 0.9) in connection with the problematic of an insuffi-cient transformer and the manual power control applied at Mujib Dam.
As a comparison or reliability check of the measured thermodynamic RCC proper-ties, Equations 4-23 and 4-24 can be applied in order to evaluate these parameters from the concrete mixture constituents. Applying the average thermal properties of basalt (Fig. 4-7 and 4-11) the thermal conductivity and the heat capacity of the Mu-jib RCC results in λMujib = 2.09 W/m.K and cMujib = 990 J/kg.K showing a variation of these properties of the Mujib RCC of roughly 10 %.
5.2.2.2 Thermal behaviour during construction and early service time
In the subsequent paragraphs some aspects on the thermal behaviour of RCC grav-ity dams are presented, which substantiate the assumptions and methodologies per-sued within the numerical thermal stress modelling of RCC gravity dams addressed in Chapter 6. Due to the plenitude of the DFOT data from Mujib Dam (valid also for Wala Dam) results will be presented only selectively. Although each RCC dam and its location are unique, it is the opinion here that the facts subsequently stated and specifically based on the Jordanian dams have a global character and can be qualitatively transferred to other RCC gravity dams with the focus on temperature control.
Temperature development in the young RCC during construction time
The temperature development in the young RCC in principle designates the tem-perature history of the RCC from the time of placement until the time of the RCC reaching its maximum temperature in the dam.
The in-situ temperature development in an RCC dam starts with the delivery of the RCC on site, before it is spread and compacted. At the time of placement, the RCC is characterised by its placement temperature which is influenced by the tempera-tures of the single RCC constituents before mixing and the ambient temperatures. The aggregates used for the RCC at the Mujib Dam were stockpiled directly ex-posed to the ambient conditions and quarried from the stocks exterior. The readily mixed RCC was then transported to the site by either a high speed conveyor belt or by dump trucks over a distance of some hundred metres taking roughly two min-utes. Based on these facts, it can be expected that the RCC placement temperatures are closely related to the ambient temperatures at time of placement, if no pre-

117
cooling measures are pursued in order to not violate the specification of the maxi-mum placement temperatures. Figure 5-18 shows the average daily ambient tem-peratures measured at Mujib Dam and the measured RCC placement temperatures in this period.
10
15
20
25
30
35
01.01.01 01.04.01 30.06.01 28.09.01 27.12.01Date
Tem
pera
ture
[°C
]
Average daily ambient
RCC placementmax. placementtemperature 26°C
Fig. 5-18: Mujib Dam: Ambient air and RCC placement temperatures during
2001.
Figure 5-18 principally confirms the direct correlation of ambient and placement temperatures for periods without artificial RCC pre-cooling measures. The addition of chilled mixing water and ice flakes during the summer months in 2001 is clearly visible in the graph. The utilisation of aggregates produced during the warm months leads to a time shift between the yearly ambient air temperature and the placement temperature cycle. At the beginning of 2001 the aggregates manufactured and stockpiled over a longer period during the winter have adapted to the ambient tem-peratures at time of placement.
The RCC was placed in up to three lanes parallel to the dam axis in order to cast one RCC layer across the complete dam width. The therefore single RCC batches, mixed and transported at different points of time, lead to the assumption of distrib-uted placement temperatures within a RCC single layer. Figure 5-19 depicts the variability of very early RCC temperatures in the Mujib Dam due to different RCC batches that were placed and cured, presented by DFOT data from elevation 145.5 masl at station 0+906.2. Elevation 145.5 masl is situated in a dam portion

118
where RCC placement was decelerated and the according RCC surface was exposed to ambient conditions and curing for approximately two days.
144.00
145.80 145.80
163.50DC
20
25
30
15 20 25 30 35 40 45Distance from upstream facing [m]
Tem
pera
ture
[°C
]
directly after placement
12 h after placement
36 h after placement
3 d after placement
145.5 masl
downstream half stretch of DFOT layout
St. 0+906.2
Foundation
Fig. 5-19: Mujib Dam: Balancing of early RCC temperature differentials (DFOT
elev. 145.5. masl, station 0+906.2, Block D).
From the presented dam portion it is to recognise that variations due to different placement temperatures and curing intensities were nearly balanced after about three days. At Mujib Dam the huge influence of the further placement progress on this effect can be visualised. The tendency of balancing present temperature differ-entials was only initiated after the next RCC layer was placed after about two days. It is to conclude that the variation of placement temperatures and short placement breaks cause temperature differentials within the RCC dam, but that those will be balanced latest with the covering by the successive RCC layer.
Within a lane of RCC placement, the direction of placement can definitely be shown by DFOT measurements. At a certain time of measurement, a slope in the temperature distribution along the placement direction can be identified, which is due to the different RCC ages and stages of hydration at the time of measurement (Fig. 5-20). After already less than one day the temperature slope is balanced and an almost uniform temperature level is reached, which is even more uniform after the considered RCC layer having been covered by the successive layer. Longitudinal temperature gradients parallel to the axis of an RCC gravity dam can thus be practi-cally excluded in the early RCC age.
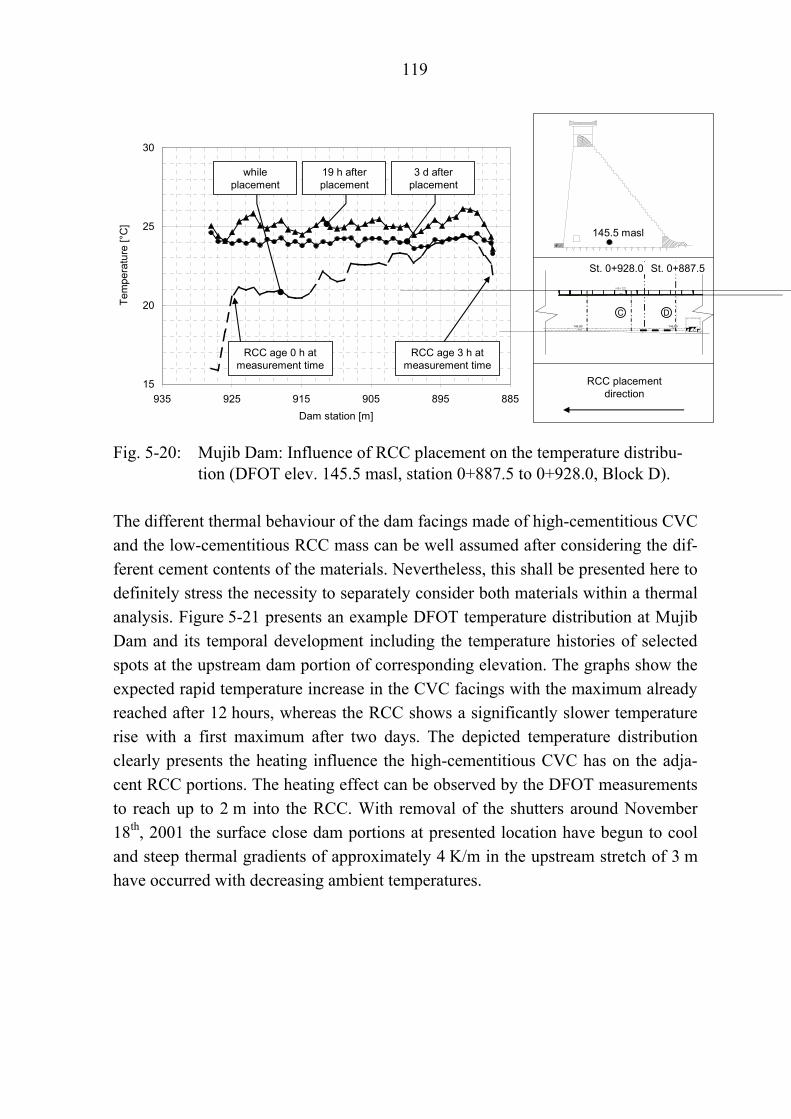
119
15
20
25
30
885895905915925935Dam station [m]
Tem
pera
ture
[°C
]
144.00
145.80 145.80
163.50DC
while placement
19 h after placement
3 d after placement
145.5 masl
St. 0+928.0
RCC placement direction
St. 0+887.5
RCC age 3 h at measurement time
RCC age 0 h at measurement time
Fig. 5-20: Mujib Dam: Influence of RCC placement on the temperature distribu-
tion (DFOT elev. 145.5 masl, station 0+887.5 to 0+928.0, Block D).
The different thermal behaviour of the dam facings made of high-cementitious CVC and the low-cementitious RCC mass can be well assumed after considering the dif-ferent cement contents of the materials. Nevertheless, this shall be presented here to definitely stress the necessity to separately consider both materials within a thermal analysis. Figure 5-21 presents an example DFOT temperature distribution at Mujib Dam and its temporal development including the temperature histories of selected spots at the upstream dam portion of corresponding elevation. The graphs show the expected rapid temperature increase in the CVC facings with the maximum already reached after 12 hours, whereas the RCC shows a significantly slower temperature rise with a first maximum after two days. The depicted temperature distribution clearly presents the heating influence the high-cementitious CVC has on the adja-cent RCC portions. The heating effect can be observed by the DFOT measurements to reach up to 2 m into the RCC. With removal of the shutters around November 18th, 2001 the surface close dam portions at presented location have begun to cool and steep thermal gradients of approximately 4 K/m in the upstream stretch of 3 m have occurred with decreasing ambient temperatures.

120
144.00
145.80 145.80
163.50DC
15
20
25
30
35
40
14.11.01 21.11.01 28.11.01Date
Tem
pera
ture
[°C
]
0,20 0,98 1,99 2,99 4,00
15
20
25
30
35
40
0 5 10 15 20 25Distance from upstream facing [m]
Tem
pera
ture
[°C
]
14.11.01 9:28 14.11.01 15:11 14.11.01 21:2515.11.01 22:26 18.11.01 10:22 5.12.01 8:08
7h
St. 0+966.3
• Facing CVC: 40cm wide strip at the up- and downstream shutters• Bedding: to approx. 10m from upstream face
Placement break169.5masl
Resumption of RCC placement
Distance from upstream facing [m]
1h
36h
12h
21d
4d
168.9 masl
Foundation
Fig. 5-21: Mujib Dam: Different thermal behaviour of CVC facing and RCC mass
(DFOT elev. 168.9 masl, station 0+966.3, Block C).
Regarding the interior of an RCC gravity dam, heat initially can only dissipate at temporary free layer surfaces, because of non-existent temperature gradients in the direction of the dam faces in the dam’s central portion during the hydration phase of the RCC. Thus, it can be concluded that the heat dissipation and its influence on the dam interior maximum temperatures depends on the placement progress and the placement speed, respectively. In opposition to this effect, heat can also be gained via the temporary layer surfaces at times of high ambient temperatures and corre-sponding sun radiation. Figure 5-22 extends Figure 5-21 and depicts the tempera-ture development of the central RCC domain.

121
144.00
145.80 145.80
163.50DC
RCC placement break at 169.5masl from
Nov. 15th to 19th, 2001
15
20
25
30
35
40
14.11.01 28.11.01 12.12.01 26.12.01Date
Tem
pera
ture
[°C
]
10,05 14,08 18,10 22,12
Placement break169.5masl
Resumption of RCC placement
Distance from upstream facing [m]
St. 0+966.3
Foundation
168.9 masl
Fig. 5-22: Mujib Dam: Early temperature development in relation to the RCC
placement progress (DFOT elev. 168.9 masl, station 0+966.3, Block C).
After a quickly reached temperature peak after two days, a cooling phase is recog-nisable as a consequence of the RCC placement having been suspended for four days. The hydration heat produced by the RCC is dissipated due to the placement break and the RCC coverage of only 60 cm and hardly contributes to the warming of the RCC mass. Reasoned by the successive continuous placement progress re-sumed on November 19th, 2001, a steady temperature increase can be seen. This temperature rise at elevation 168.9 masl mainly results from the hydration heat gen-erated by the RCC layers newly placed and the conductive heat transport towards the measurement location. The cooling and warming affinity of the presented DFOT locations after suspension and resumption of the RCC placement is lagged by the slow conductive heat transport through the RCC layers covering the DFOT layout. Despite the described placement break, but due to the combined effects of hydration heat generation and conductive hydration heat transport, the maximum RCC tem-perature at depicted DFOT location comes to 31.5 °C, which corresponds to a tem-perature rise of 10.5 K based on a placement temperature of 21 °C. This in turn complies with 68 % of the adiabatic temperature rise characteristic for the Mujib RCC (15.5 K).
The influence of the placement progress on the maximum heat preserved in the inte-rior of Mujib Dam is presented in Figure 5-23. The graph relates the exposition time of the RCC layers having been instrumented with DFOT (time from placement until
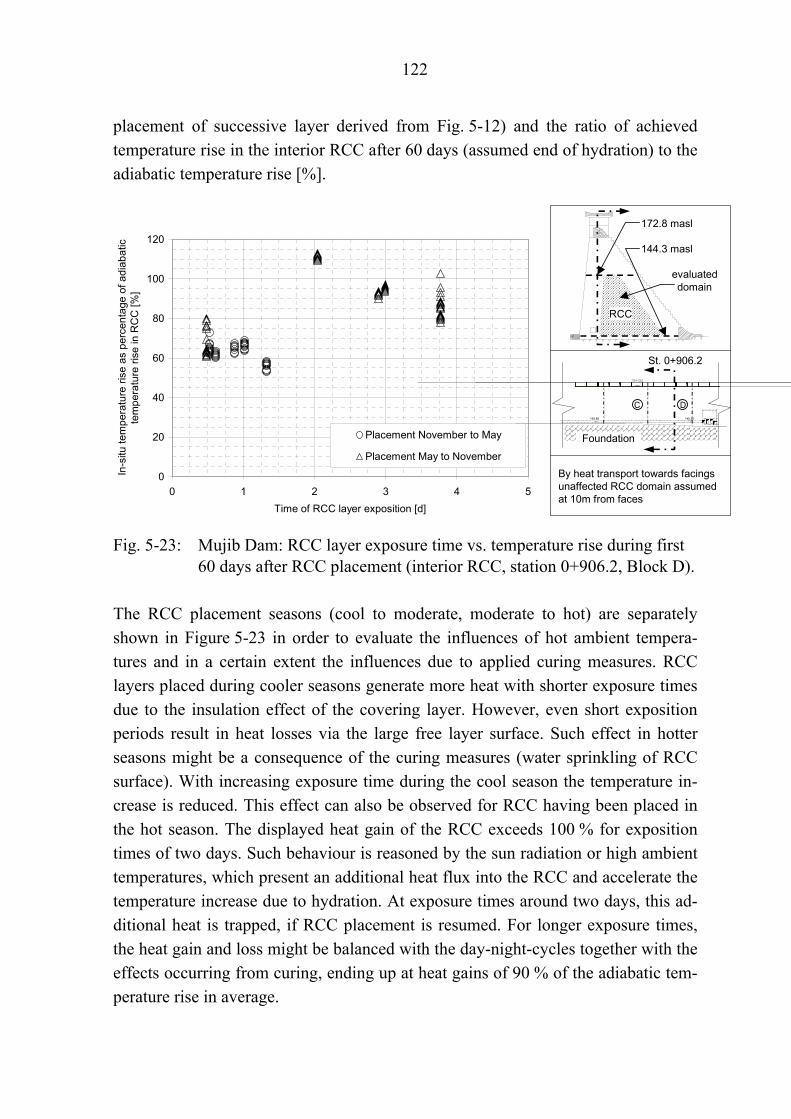
122
placement of successive layer derived from Fig. 5-12) and the ratio of achieved temperature rise in the interior RCC after 60 days (assumed end of hydration) to the adiabatic temperature rise [%].
144.00
145.80 145.80
163.50DC
By heat transport towards facings unaffected RCC domain assumed at 10m from faces
172.8 masl
St. 0+906.2
144.3 masl
RCC
0
20
40
60
80
100
120
0 1 2 3 4 5Time of RCC layer exposition [d]
In-s
itu te
mpe
ratu
re ri
se a
s pe
rcen
tage
of a
diab
atic
te
mpe
ratu
re ri
se in
RC
C [%
]
Placement November to May
Placement May to November
Foundation
evaluateddomain
Fig. 5-23: Mujib Dam: RCC layer exposure time vs. temperature rise during first
60 days after RCC placement (interior RCC, station 0+906.2, Block D).
The RCC placement seasons (cool to moderate, moderate to hot) are separately shown in Figure 5-23 in order to evaluate the influences of hot ambient tempera-tures and in a certain extent the influences due to applied curing measures. RCC layers placed during cooler seasons generate more heat with shorter exposure times due to the insulation effect of the covering layer. However, even short exposition periods result in heat losses via the large free layer surface. Such effect in hotter seasons might be a consequence of the curing measures (water sprinkling of RCC surface). With increasing exposure time during the cool season the temperature in-crease is reduced. This effect can also be observed for RCC having been placed in the hot season. The displayed heat gain of the RCC exceeds 100 % for exposition times of two days. Such behaviour is reasoned by the sun radiation or high ambient temperatures, which present an additional heat flux into the RCC and accelerate the temperature increase due to hydration. At exposure times around two days, this ad-ditional heat is trapped, if RCC placement is resumed. For longer exposure times, the heat gain and loss might be balanced with the day-night-cycles together with the effects occurring from curing, ending up at heat gains of 90 % of the adiabatic tem-perature rise in average.

123
The observations for the young RCC at Mujib Dam characterised above actually point at the important aspect of maximum temperatures being reached in the RCC gravity dam during construction time and before reservoir impoundment. They will be discussed within the long-term behaviour of Mujib Dam.
Long-term temperature development in the RCC during construction time
Figures 5-24 and 5-25 depict the relation between the ambient air temperatures at time of placement of an RCC layer, the RCC placement temperature and the RCC maximum temperature in the centre of Mujib Dam.
10
15
20
25
30
35
40
01.01.01 27.12.01 22.12.02 17.12.03Date
Tem
pera
ture
[°C
]
RCC temperature histories in dam centre of Mujib Dam
180.0 masl
St. 0+914.3
144.3 masl
Ambienttemperature
144.3 masl 147.6 masl 156.0 masl 166.5 masl 180.0 masl
144.00
145.80 145.80
163.50DC
Foundation
Fig. 5-24: Mujib Dam: Selected RCC temperature histories in dam centre until
end of 2003 (station 0+914.3, Block D).
The overall maximum temperatures in the dam centre are related to the ambient temperatures at time of placement rather than to the placement temperatures of the certain RCC layers, reasoned by the small volume-to-surface-ratio of a single RCC layer. This fact can especially be concluded from the temperature histories of the RCC layers that were placed in the summer time, when placement temperatures have significantly fallen below ambient temperatures. Figure 5-25 shows a vertical distribution of the maximum RCC temperatures in the dam centre, which were reached 60 days after placement (assumed end of hydration) and during the RCC lifetime (overall maxima). The correlation between the absolute maximum RCC temperature and the ambient temperatures at time of RCC placement is valid for the central dam portion located at an adequate distance from the facings. The compari-

124
son between the vertical distribution of absolute temperature maxima and that of temperature maxima reached at 60 days after RCC placement shows the superposi-tion of the explained ambient effects and the slow conductive heat transport along effective vertical temperature gradients between the dam’s hot spot, the dam foun-dation rock and the upper cooler dam portion. While the long-term temperatures are still increasing in the foundation near DFOT elevations 144.3 and 145.5 masl, the cooling phase in the maximum temperature dam zone commences immediately after reaching the RCC peak temperature (Fig. 5-24).
144.00
145.80 145.80
163.50DC
Vertical distribution of maximum RCC temperatures in the dam centre in relation to ambient and placement temperatures
172.8 masl
St. 0+914.3
144.3 masl
140
145
150
155
160
165
170
175
180
5 10 15 20 25 30 35 40Temperature [°C]
Dam
ele
vatio
n [m
asl]
absolute RCCmaximum
RCC maximumafter 60 days
mean daily ambient
temperature
mean monthlyambient
temperature
Placement temperature
Foundation 143.1masl
Foundation
Fig. 5-25: Mujib Dam: Vertical distribution of maximum RCC temperatures in the
dam centre related to ambient and placement temperatures (station 0+914.3, Block D).
Extended placement breaks cause irregularities within the vertical temperature dis-tribution in the dam central portion. Figure 5-26 presents the thermal behaviour of Mujib Dam due to selected placement breaks according to the placement schedule (Fig. 5-12).
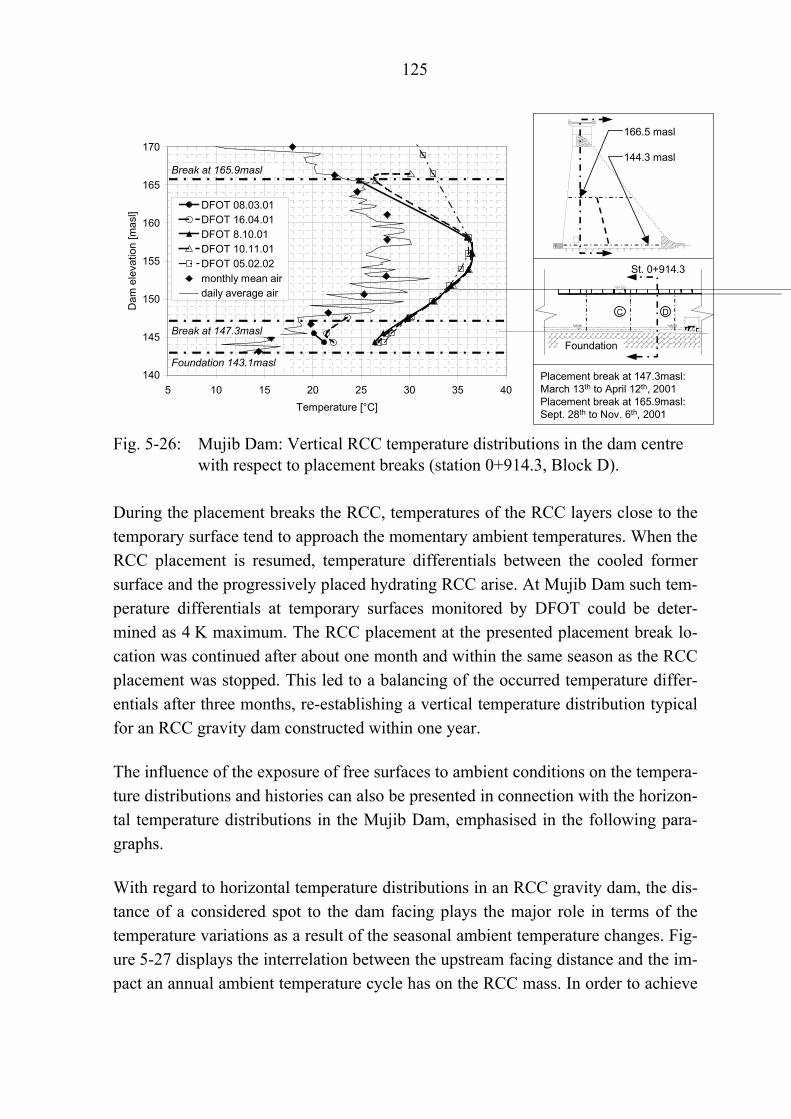
125
140
145
150
155
160
165
170
5 10 15 20 25 30 35 40Temperature [°C]
Dam
ele
vatio
n [m
asl]
DFOT 08.03.01DFOT 16.04.01DFOT 8.10.01DFOT 10.11.01DFOT 05.02.02monthly mean airdaily average air
Placement break at 147.3masl:March 13th to April 12th, 2001Placement break at 165.9masl:Sept. 28th to Nov. 6th, 2001
166.5 masl
St. 0+914.3
144.3 masl
Foundation 143.1masl
Break at 147.3masl
Break at 165.9masl
144.00
145.80 145.80
163.50DC
Foundation
Fig. 5-26: Mujib Dam: Vertical RCC temperature distributions in the dam centre
with respect to placement breaks (station 0+914.3, Block D).
During the placement breaks the RCC, temperatures of the RCC layers close to the temporary surface tend to approach the momentary ambient temperatures. When the RCC placement is resumed, temperature differentials between the cooled former surface and the progressively placed hydrating RCC arise. At Mujib Dam such tem-perature differentials at temporary surfaces monitored by DFOT could be deter-mined as 4 K maximum. The RCC placement at the presented placement break lo-cation was continued after about one month and within the same season as the RCC placement was stopped. This led to a balancing of the occurred temperature differ-entials after three months, re-establishing a vertical temperature distribution typical for an RCC gravity dam constructed within one year.
The influence of the exposure of free surfaces to ambient conditions on the tempera-ture distributions and histories can also be presented in connection with the horizon-tal temperature distributions in the Mujib Dam, emphasised in the following para-graphs.
With regard to horizontal temperature distributions in an RCC gravity dam, the dis-tance of a considered spot to the dam facing plays the major role in terms of the temperature variations as a result of the seasonal ambient temperature changes. Fig-ure 5-27 displays the interrelation between the upstream facing distance and the im-pact an annual ambient temperature cycle has on the RCC mass. In order to achieve

126
a normalisation of the horizontal temperature distributions at a specific point of time, the temperature difference ratio RΔT [%] is introduced (Eq. 5-2).
100)( ⋅−=Δcore
coreT T
TxTR Eq. 5-2
with RΔT x T(x) Tcore
Temperature difference ratio [%] Distance from upstream facing [m] Concrete temperature at location x [°C] Concrete temperature in dam core [°C]
-40
-20
0
20
40
0 5 10 15 20 25Distance from upstream facing [m]
Tem
pera
ture
diff
eren
ce ra
tio a
cc. t
o Eq
. 5-2
[%]
18.12.2001
24.04.2002
06.08.2002
28.01.2003
All DFOT temperature distributions of upstream dam half.Temperature difference ratio acc. to Eq. 5-2.
180.0 masl
St. 0+914.3
144.3 masl
144.00
145.80 145.80
163.50DC
Foundation
evaluateddomain
Fig. 5-27: Mujib Dam: Horizontal distributions of temperature variations (tem-
perature difference ratio) due to the annual ambient temperature cycle in 2000 (station 0+914.3, Block D).
The graph shows the horizontal distributions of the seasonal temperature variations and their attenuation with increasing distance from the upstream facing. The ther-mal waves’ amplitude is almost damped at depths of 10 m. The most significant seasonal temperature changes take place in the area up to 4 m from the facing.
The problematic of thermal induced surface cracking due to considerable tempera-ture gradients is severe especially during the construction time, when temperatures in the dam interior are still high and decrease only slowly, but superficial areas cool quickly. Figure 5-28 stands representatively for the overall behaviour of Mujib Dam, depicting the time-history of the superficial temperature gradients at 40 cm

127
from the upstream facing developed from the DFOT at presented locations. A posi-tive temperature gradient reflects the situation of cool exterior and warm interior temperatures and vice versa.
-8
-6
-4
-2
0
2
4
6
8
01.07.01 28.03.02 23.12.02 19.09.03Date
Tem
pera
ture
gra
dien
t [K/
m]
0
5
10
15
20
25
30
35
40
Ambi
ent t
empe
ratu
re [°
C]
158.1masl
168.9masl Temperature gradients at 40cm from upstream facing before impoundment.Positive gradient = tensile stresses
168.9 masl
St. 0+914.3
158.1 maslAmbienttemperature
144.00
145.80 145.80
163.50DC
Foundation
Fig. 5-28: Mujib Dam: History of temperature gradients at 40 cm from the up-
stream facing developed from DFOT (DFOT elev. 158.1 and 168.9 masl, station 0+914.3, Block D).
Due to the extensive hydration heat generated by the CVC facing and the resulting higher early facing temperatures, a negative temperature gradient occurs at a very early concrete age, albeit the concrete having been placed in summer or winter. Considerable positive and tensile stress inducing temperature gradients develop in the winter seasons. Maximum values of 4 to 5 K/m at 40 cm from the upstream fac-ing can be seen in Figure 5-28. These represent typical maximum temperature gra-dients for this location during the construction time of Mujib Dam.
The impact of environmental effects on horizontal temperature distributions has to include the important aspects of sun radiation and convective heat transport at the dam surfaces. Figure 5-29 qualitatively visualises the daily sun movement and the major wind direction at the Mujib Dam site. The effect of these environmental boundary conditions is further depicted with a typical DFOT temperature distribu-tion in Figure 5-30.
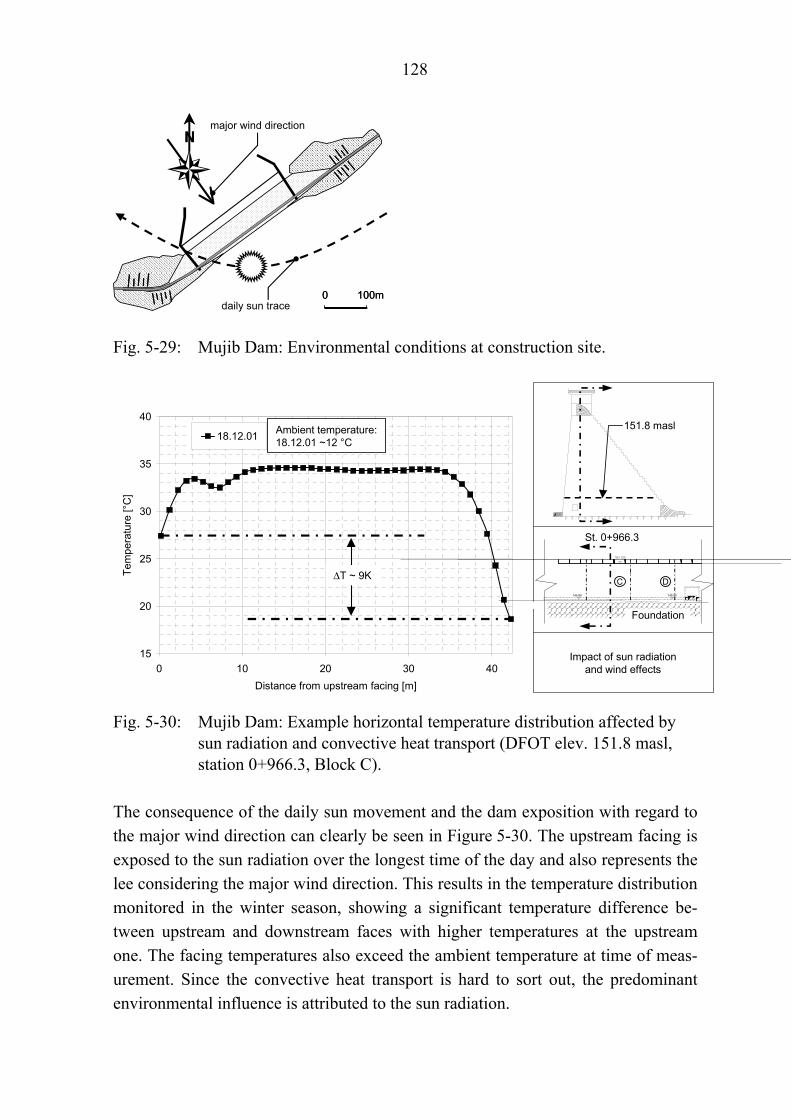
128
0 100m0 100m
NNmajor wind direction
daily sun trace
Fig. 5-29: Mujib Dam: Environmental conditions at construction site.
15
20
25
30
35
40
0 10 20 30 40Distance from upstream facing [m]
Tem
pera
ture
[°C
]
18.12.01
Impact of sun radiationand wind effects
St. 0+966.3
151.8 maslAmbient temperature:18.12.01 ~12 °C
ΔT ~ 9K
144.00
145.80 145.80
163.50DC
Foundation
Fig. 5-30: Mujib Dam: Example horizontal temperature distribution affected by
sun radiation and convective heat transport (DFOT elev. 151.8 masl, station 0+966.3, Block C).
The consequence of the daily sun movement and the dam exposition with regard to the major wind direction can clearly be seen in Figure 5-30. The upstream facing is exposed to the sun radiation over the longest time of the day and also represents the lee considering the major wind direction. This results in the temperature distribution monitored in the winter season, showing a significant temperature difference be-tween upstream and downstream faces with higher temperatures at the upstream one. The facing temperatures also exceed the ambient temperature at time of meas-urement. Since the convective heat transport is hard to sort out, the predominant environmental influence is attributed to the sun radiation.
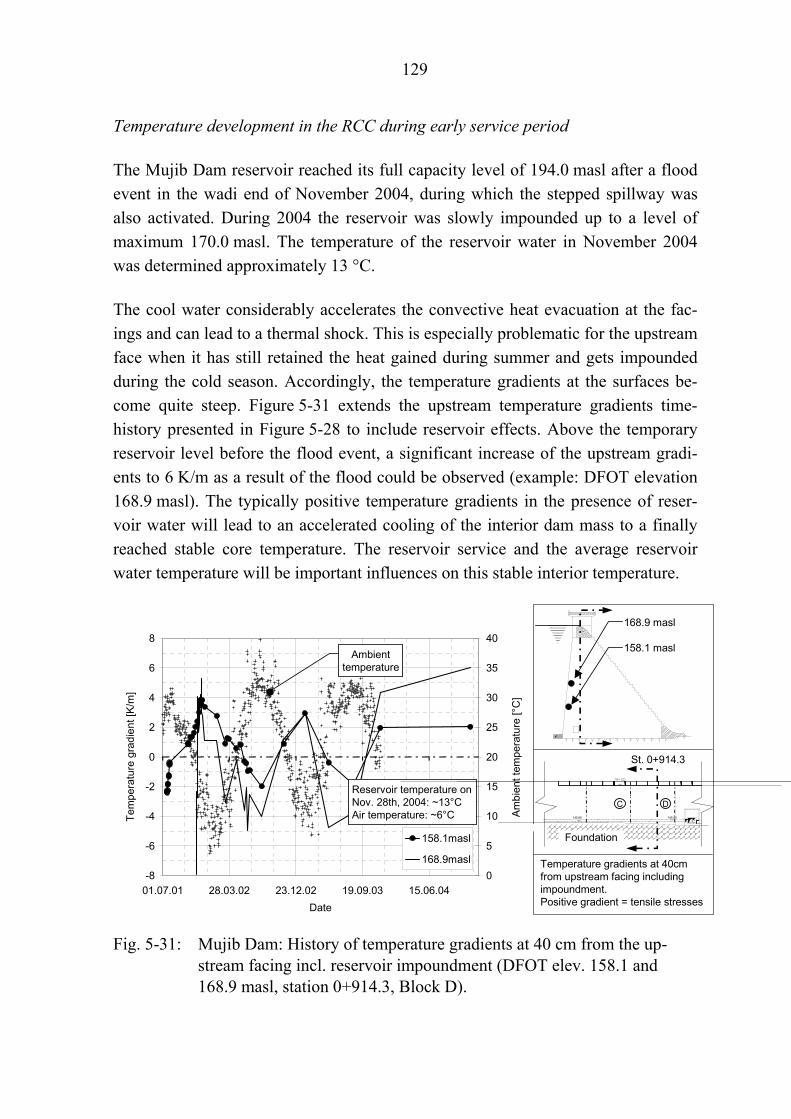
129
Temperature development in the RCC during early service period
The Mujib Dam reservoir reached its full capacity level of 194.0 masl after a flood event in the wadi end of November 2004, during which the stepped spillway was also activated. During 2004 the reservoir was slowly impounded up to a level of maximum 170.0 masl. The temperature of the reservoir water in November 2004 was determined approximately 13 °C.
The cool water considerably accelerates the convective heat evacuation at the fac-ings and can lead to a thermal shock. This is especially problematic for the upstream face when it has still retained the heat gained during summer and gets impounded during the cold season. Accordingly, the temperature gradients at the surfaces be-come quite steep. Figure 5-31 extends the upstream temperature gradients time-history presented in Figure 5-28 to include reservoir effects. Above the temporary reservoir level before the flood event, a significant increase of the upstream gradi-ents to 6 K/m as a result of the flood could be observed (example: DFOT elevation 168.9 masl). The typically positive temperature gradients in the presence of reser-voir water will lead to an accelerated cooling of the interior dam mass to a finally reached stable core temperature. The reservoir service and the average reservoir water temperature will be important influences on this stable interior temperature.
-8
-6
-4
-2
0
2
4
6
8
01.07.01 28.03.02 23.12.02 19.09.03 15.06.04Date
Tem
pera
ture
gra
dien
t [K/
m]
0
5
10
15
20
25
30
35
40
Ambi
ent t
empe
ratu
re [°
C]
158.1masl
168.9masl Temperature gradients at 40cm from upstream facing including impoundment.Positive gradient = tensile stresses
Ambienttemperature
Reservoir temperature on Nov. 28th, 2004: ~13°CAir temperature: ~6°C
168.9 masl
158.1 masl
St. 0+914.3
144.00
145.80 145.80
163.50DC
Foundation
Fig. 5-31: Mujib Dam: History of temperature gradients at 40 cm from the up-
stream facing incl. reservoir impoundment (DFOT elev. 158.1 and 168.9 masl, station 0+914.3, Block D).
130
5.2.3 Stress behaviour
The installation locations of the Stressmeters in Block D of the Mujib Dam are pre-sented in Figure 5-14, 5-15 and Table 5-6. Due to the early breakdown of the ini-tially installed instruments at dam elevation 144.0 masl, a continuous in-situ stress monitoring was only possible with the instrumentation at elevation 154.5 masl, sub-sequently being the basis for the presented phenomena and assessments. The desig-nation of positive stresses in below figures refers to tensile stresses.
Restraint stress development in the young RCC during construction time
The early restraint stress histories at dam elevation 154.5 masl typically reflect the effects of the environmental boundary conditions, the placement progress and the different types of concrete (CVC at dam faces, RCC).
Figure 5-32 presents the temperature and restraint stress development in the up-stream facing CVC (Stressmeter 1). Possible shrinkage effects shortly after CVC placing lead to small early tensile stresses. The considerable temperature rise in the high-cementitious CVC to a peak of 53.4 °C, however, results in an only moderate increase of thermal compressive stresses, which reach their maximum of approxi-mately -0.5 MPa at the same time as the peak facing temperature occurs. The CVC Young’s modulus has considerably increased 12 hours after CVC placement. The just small temperature fall from the peak temperature is therefore adequate to re-lieve the compressive stresses. The according CVC temperature at time of zero stress refers to the CVC zero-stress temperature (Chapter 3.2), which can be as-sessed from the Stressmeter measurements. During the very early heating of the CVC, a zero-stress temperature of 45.6 °C is associated with the change from the early tensile to compressive stresses. A further, much higher zero-stress temperature of 50.3 °C is assigned to the subsequent change from compressive to tensile stresses, while the CVC has cooled from its peak temperature. The further superfi-cial cooling leads to an increase of tensile stresses, which are again reduced due to the hydration heat transport from the successively placed layer 154.8 masl. The re-moval of the formwork in the evening of July 3rd, 2001 amplifies the daily tempera-ture and corresponding stress cycle in the upstream facing with maximum tensile stresses reaching almost 2 MPa. Due to CVC temperatures below the second zero-stress temperature TN2, monitored stresses are continuously tensile.

131
144.00
145.80 145.80
163.50DC
-1
0
1
2
3
Stre
ss [M
Pa]
20
25
30
35
40
45
50
55
25.06.01 02.07.01 09.07.01Date
Tem
pera
ture
[°C
]
St. 0+914.3
Stressmeter 1 situated in upstreamCVC acc. to Fig. 5-15.
Early thermal stress development.
154.5 masl
Formworkremoval
Placement ofLayer 154.8masl
Zero-stress-temperatureTN2 = 50.3°C
Zero-stress-temperatureTN1 = 45.6°C
Foundation
Fig. 5-32: Mujib Dam: Early stress history at 20 cm from the upstream facing
(CVC) (Stressmeter 1, elev. 154.5 masl, station 0+914.3, Block D).
In the early morning of July 27th, 2001 at 6:15 a.m., the monitored tensile stress evolution in the CVC facing suddenly dropped after having reached a peak tensile stress of 2.1 MPa. This value complies with the tensile strength of the facing CVC. The significant drop of the stress level results from the restraint stress relieve at the location of a crack. The surface crack event corresponds to an actually monitored facing temperature of 35 °C, which does not correspond to the actual minimum temperature the facing was subjected to before. The temperature difference between the zero-stress temperature and the CVC temperature at time of cracking is about 15 K, which can produce tensile stresses of 3.5 MPa, if full restraint and a CVC Young’s modulus of about 24 GPa (see Fig. 5-38) are assumed. The superposition of the eigenstresses (compression at the facings) will reduce the restraint tensile stresses. Nevertheless, for the explanation of the monitored and also visually con-

132
firmed surface crack, the possibility of non-thermal volume changes in conjunction with possible stress concentrations at the vertical drainage profiles embedded into the upstream facing CVC has to be included into the considerations (see Figure 1-5 and Figure 5-13 for arrangement of upstream PVC membrane at Mujib Dam).
-1
0
1
2
3
Stre
ss [M
Pa]
20
25
30
35
40
45
50
55
25.06.01 09.07.01 23.07.01 06.08.01Date
Tem
pera
ture
[°C
]
St. 0+914.3
Stressmeter 1 situated in upstreamCVC acc. to Fig. 5-15.Surface crack occurrence in upstream CVC.
154.5 masl
Formworkremoval
Crack in upstreamCVC at 2.1MPa
144.00
145.80 145.80
163.50DC
Foundation
Fig. 5-33: Mujib Dam: Surface crack event at 20 cm from the upstream facing
(CVC) (Stressmeter 1, elev. 154.5 masl, station 0+914.3, Block D).
Stressmeter 2 (Fig. 5-34) at 1.0 m from the upstream face (RCC) of dam elevation 154.5 masl shows no stresses developing with the initial temperature increase due to the RCC hydration and the afternoon sun radiation. This points at the significant relaxation in the very young RCC and the very slow evolution of the RCC Young’s modulus at early ages (see Chapters 4.2.4 to 4.2.7). By help of the Stressmeter measurements, this period can be determined to 6 hours. The successive cooling from a first mostly environmentally affected peak temperature induces small tensile

133
stresses. The first zero-stress temperature TN1 before stress initiation has been measured as 36 °C. Another daily temperature cycle due to the exposure of layer 154.5 masl to the ambient conditions results in a corresponding daily stress cycle with very moderate peak stresses reasoned by a still small elastic modulus. A sec-ond zero-stress temperature TN2 of 32.2 °C has been recorded during the second diurnal cycle. The lower value compared to the first one may be explained by the considerable relaxation of the RCC. The placement of layer 154.8 masl eventually causes the disappearance of the diurnal temperature and stress cycles. The heat transport towards layer 154.5 masl causes the development of compressive stresses, which are reduced as a consequence of the cooling of the upstream dam portion and the relaxation of the RCC.
-2
-1
0
1
2
Stre
ss [M
Pa]
20
25
30
35
40
45
25.06.01 02.07.01 09.07.01Date
Tem
pera
ture
[°C
]
St. 0+914.3
Stressmeter 2 situated in upstreamRCC acc. to Fig. 5-15.
Early thermal stress development.
154.5 masl
Placement ofLayer 154.8masl
Zero-stress-temperatureTN1 = 36.0°C
Zero-stress-temperatureTN2 = 32.2°C
144.00
145.80 145.80
163.50DC
Foundation
Fig. 5-34: Mujib Dam: Early stress history at 1.0 m from the upstream facing
(RCC) (Stressmeter 2, elev. 154.5 masl, station 0+914.3, Block D).

134
Long-term restraint stress development in the RCC during construction time
For the long-term stress evolution during the construction of Mujib Dam, only the Stressmeters 2 and 3 (dam centre at elevation 154.5 masl) will be considered.
The long-term stress evolution in the upstream RCC at dam elevation 154.5 masl (Stressmeter 2) is presented in Figure 5-35.
-2
-1
0
1
2
Stre
ss [M
Pa]
20
25
30
35
40
45
25.06.01 22.12.01 20.06.02 17.12.02 15.06.03Date
Tem
pera
ture
[°C
]
St. 0+914.3
Stressmeter 2 situated in upstreamRCC acc. to Fig. 5-15.Long-term thermal stress development.
154.5 masl
Zero-stress-temperature
37.1°C
Selective further zero-stress-temperatures
144.00
145.80 145.80
163.50DC
Foundation
Fig. 5-35: Mujib Dam: Long-term stress history at 1.0 m from the upstream facing
(RCC) (Stressmeter 2, elev. 154.5 masl, station 0+914.3, Block D).
With the cooling at the monitored location the compressive stresses turn into mod-erate tensile stresses of maximum 0.2 MPa. A further zero-stress temperature of 37.1 °C could be recorded by Stressmeter 2. This zero-stress temperature corre-sponds to the maximum zero-stress temperature characterising the RCC. The annual temperature cycle at the Stressmeter location results in a corresponding annual

135
stress cycle, whereas mainly compressive stresses are measured (superposition of RCC self-weight and thermal stresses effectively measured). The records of Stress-meter 2 show that the surface crack monitored in the facing has not propagated into the RCC. The only moderate tensile stresses of 0.2 MPa, corresponding to a tem-perature drop of 13 K below the zero-stress temperature in the first winter, however, may be a hint for an influence of the occurred crack in the CVC on the general su-perficial stress state.
Stressmeter 3 (Fig. 5-36) monitors the RCC stress evolution in the dam centre.
-2
-1
0
1
2
Stre
ss [M
Pa]
20
25
30
35
40
45
25.06.01 23.09.01 22.12.01 22.03.02 20.06.02Date
Tem
pera
ture
[°C
]
St. 0+914.3
Stressmeter 3 situated in centreRCC acc. to Fig. 5-15.Long-term stress development(DFOT from 153.9masl).
154.5 masl
Temperature recordingfrom DFOT at 153.9masl
153.9 masl
Breakdown ofStressmeter 3
144.00
145.80 145.80
163.50DC
Foundation
Fig. 5-36: Mujib Dam: Long-term history of thermal stress at dam centre (RCC)
(DFOT elev. 153.9 masl, Stressmeter 3, elev. 154.5 masl, station 0+914.3, Block D).

136
Since the temperature sensor of Stressmeter 3 broke down early, the DFOT meas-urements at dam station 0+914.3 of elevation 153.9 masl were consulted for com-parison. No environmental impacts could be detected in the temperature and stress development after the covering of layer 154.5 masl. Due to the temperature in-crease, the dam rising and the consequence of increased self-weight above the Stressmeter level, the compressive stresses continuously grow. However, the stress measurements between end of January 2002 and the end of the shown stress trace have to be considered cautiously, since the compressive stress values are actually expected to decrease due to the temperature fall and suspended RCC placement un-til December 2002 (see Fig. 5-12). At the end, Stressmeter 3 broke down as a possi-ble result of corrosion of the connectors situated in the RCC. Nevertheless, the maximum compressive stress in the nucleus of Mujib Dam could be measured as 1.4 MPa.
Zero-stress temperatures and effective Young’s moduli
The second zero-stress temperature TN2 [°C] has already been defined and described in Chapter 3.2 and is subsequently designated as simply zero-stress temperature.
A number of zero-stress temperatures could be gained from the presented Stress-meter measurements. It was generally observed that zero-stress temperatures are significantly increased by higher cementitious contents in the concrete in correlation with the different hydration characteristics. Stressmeter 2 has delivered valuable results as numerous stress changes have been monitored during more than two years of data requisition (Fig. 5-37). The measurements clearly show the temporal behav-iour of the zero-stress temperature evolution in the Mujib RCC. At the very early RCC age the zero-stress temperatures follow the RCC temperature as the relaxation properties of the RCC are still pronounced. The RCC zero-stress temperature would stay at a constant level, if the induced strains would be ideally elastic. The variabil-ity of the zero-stress temperatures in the upstream RCC with time points at the ex-traordinary relaxation and plasticity characteristics of the low-cementitious RCC applied at Mujib Dam. Last values before the Stressmeter breakdown were in the range of 23 to 25 °C, which represents a drastic decrease with regard to the previ-ously recorded values in the order of 37 °C. It can not be excluded that the moni-tored crack and the resulting change of the restraint conditions at the facings are a reason for this behaviour. It is to assume that these values will still be variable up and down, since continuous stress impacts will always act on the facings, (reservoir

137
fluctuation, annual ambient temperatures) causing, although in a decreasing manner, inelastic deformations.
20
25
30
35
40
45
01.06.01 28.11.01 27.05.02 23.11.02 22.05.03Date
Tem
pera
ture
[°C
]
St. 0+914.3
Stressmeter 2 situated in upstreamRCC acc. to Fig. 5-15.Long-term zero-stress-temperature development.
154.5 masl
144.00
145.80 145.80
163.50DC
Foundation
Fig. 5-37: Mujib Dam: Long-term development of zero-stress temperatures at
1.0 m from the upstream facing (RCC) (Stressmeter 2, elev. 154.5 masl, station 0+914.3, Block D).
The temporal development of the zero-stress temperatures in the Mujib RCC can certainly be termed erratic. It significantly complicates the determination of crack-ing risks on the basis of the comparison of actual and zero-stress temperatures. The prediction of the zero-stress temperature of such concretes, as shown with Equa-tions 3-8 and 3-9, is also difficult and should only be used for the prediction of the maximum zero-stress temperature. With regard to the maximum zero-stress tem-perature (37.1 °C) and respecting the corresponding first zero-stress temperature (36.0 °C), as well as the maximum RCC temperature (40.6 °C, Fig. 5-35), a plastic-ity coefficient k2 of 0.24 results (see Chapter 3.2, Eq. 3-9), which does not permit the forecast of subsequent zero-stress temperatures. However, this result seems to confirm the assumption of considerably decreasing plasticity coefficients with low cement contents and high w/B-ratios.
The time-histories of temperatures and stresses monitored by Stressmeters 1 and 2 can be rearranged in order to directly display the stresses versus the temperatures as a hysteresis. Resulting from the ratio of stress and corresponding temperature dif-ferential and the known coefficient of thermal dilatation, the Young’s modulus can

138
be computed according to Equation 5-3. The results of the evaluation of the re-cordings by the two superficial Stressmeters are presented in Figure 5-38.
TE
Teff Δ⋅
Δ=α
σ Eq. 5-3
with Eeff Δσ ΔT αT
Effective Young’s modulus [MPa] Stress differential along hysteresis path [MPa] Temperature differential along hysteresis path [K] Coefficient of thermal dilatation [K-1]
The Young’s moduli of the CVC and the RCC determined in Figure 5-38 character-ise the effective moduli of elasticity as described in Chapter 4.2.7.
10
20
30
40
50
-2 -1 0 1 2
Stress [MPa]
Tem
pera
ture
[°C
]
St. 0+914.3
Stressmeters 1 and 2 at upstreamCVC and RCC acc. to Fig. 5-15.
Long-term Young‘s modulus.
154.5 masl
Stressmeter 2(RCC)
Stressmeter 1(CVC)
RCC:Eeff = 15.0 GPa
CVC:Eeff = 24.1 GPa
144.00
145.80 145.80
163.50DC
Foundation
Fig. 5-38: Mujib Dam: Determination of effective Young’s moduli of CVC and
RCC from Stressmeter measurements (Stressmeters 1 and 2, elev. 154.5 masl, station 0+914.3, Block D).
According to Stressmeter 1, the effective Young’s modulus of the facing CVC could be determined as 24.1 GPa. The effective elastic modulus of the RCC of 15.0 GPa, having been evaluated for the RCC age between 365 and 720 days, shall be referenced to Chapter 4.2.7, which holds the prediction of the effective Young’s modulus on the basis of an empirical model. By application of the empirical model to the Young’s modulus values of the Mujib RCC (Tab. 4-8), effective Young’s moduli of 15.6 GPa at an age of 365 days and roughly 17.0 GPa after 720 days have

139
been predicted. The methodology for the prediction of the effective modulus of elasticity could thus be verified by the in-situ stress measurements taken at Mujib Dam.
5.3 Wala Dam (Hashemite Kingdom of Jordan)
5.3.1 Site description
Wala Dam is located in the Wadi Al Haydan (Wadi Wala), roughly 40 km south of the Jordanian capital Amman and 35 km east of the Dead Sea. It stores the wadi flow at a wadi gorge portion and is executed as a composite dam comprising of an RCC gravity section in the valley centre and clay core earthfill embankments at the valley flanks. The gravity section accommodates the stepped spillway with adjacent stilling basin. The location and general layout of Wala Dam is presented in Fig-ure 5-39, the main data are given in Table 5-7.
560
550
540
530
520
490
500
510
520
530500
490
510
520
530
540
550
0 100 0 100
NorthNorth490
500 510
520
right abutmentembankment
left abutmentembankment
reservoir
bottom outlet
RCC gravity section& spillway
stilling basin
Jordan
100 km
Amman
Mujib Dam
Wala Dam
Longitude [°]34 35 36 37 38 39 40
29
30
31
32
33
34
Latit
ude
[°]
Nor
th
Fig. 5-39: Location and general layout of Wala Dam.

140
Tab. 5-7: Main data of Wala Dam.
Owner and project objectives
• Owner: Jordan Valley Authority (JVA) as part of the Jordan Ministry of Water and Irri-gation (MWI)
• Objectives: Storing water flows during rainy season for reasons of groundwater recharge
Hydrology • Catchment area at dam: 1 770 km2 • Probable maximum flood (PMF): 2 021 m3/s • Reservoir capacity: 9.3⋅106 m3
Dam data
• Type: Composite RCC / clay core earthfill • Max. height above wadi bed: 45 m • Max. height above foundation: 52 m • Total crest length: 370 m (RCC 120 m) • RCC volume: 220 000 m3 • Crest elevation: 524.0 masl • Max. water level: 520.0 masl • Year of completion: 2002
Site characteristics relevant for RCC construction
The geological situation at Wala Dam is comparable to that at Mujib Dam. A com-pact and less jointed limestone or chalk stratum with good strength properties and a deformation modulus of 9 GPa is present in the valley centre. In contrast to the suit-able RCC gravity dam foundation in the wadi centre, only weak strata of mudstone and weathered chalk with deformation moduli of 0.45 GPa are found. These site geological facts led to the design of Wala Dam as a composite dam (Baluch and Chraibi 2002).
Climatically, the Wala Dam site is equal to that of Mujib Dam. Main basic climate data are presented by Baluch and Chraibi (2002) based on available records close to the dam site since 1954. Mean daily maximum temperatures occur in August, mean daily minimum temperatures in January, registered with 33.6 °C and 4.7 °C respec-tively. Figure 5-40 shows the mean daily temperatures recorded during the con-struction time of Wala. According to the Wala Dam’s higher elevation, the maxi-mum and average values are lower than those at Mujib Dam. The mean annual pre-
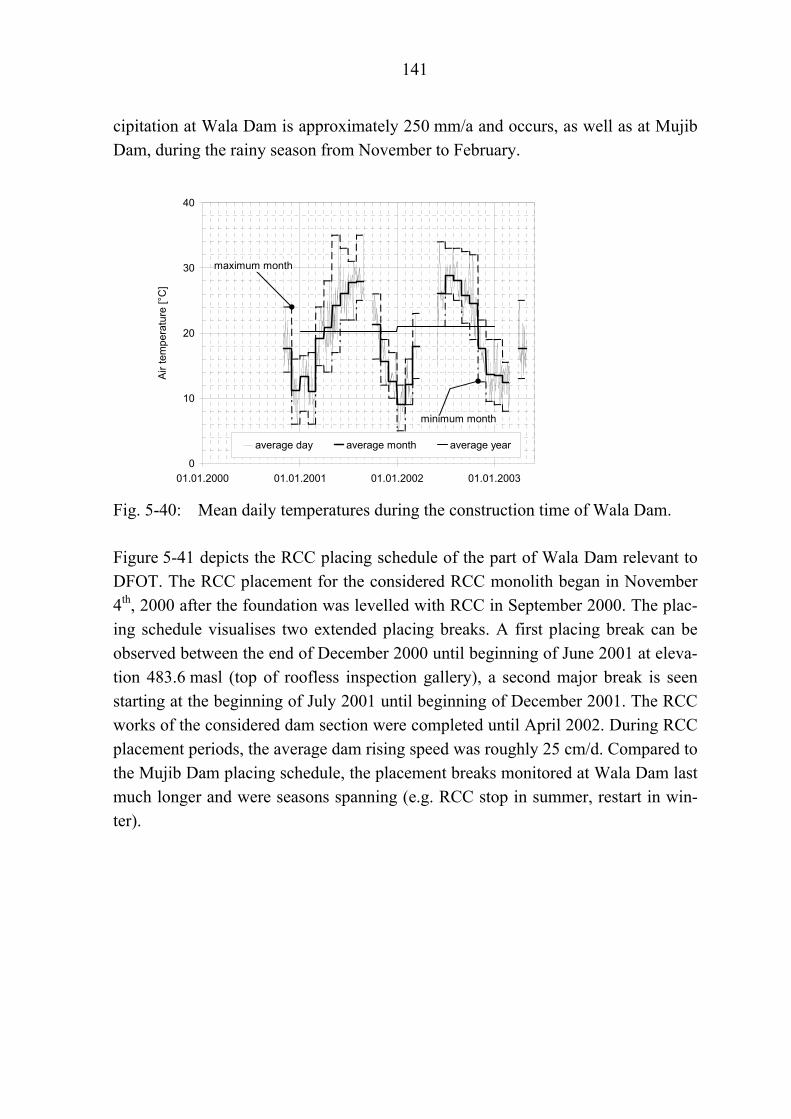
141
cipitation at Wala Dam is approximately 250 mm/a and occurs, as well as at Mujib Dam, during the rainy season from November to February.
0
10
20
30
40
01.01.2000 01.01.2001 01.01.2002 01.01.2003
Air
tem
pera
ture
[°C
]
average day average month average year
minimum month
maximum month
Fig. 5-40: Mean daily temperatures during the construction time of Wala Dam.
Figure 5-41 depicts the RCC placing schedule of the part of Wala Dam relevant to DFOT. The RCC placement for the considered RCC monolith began in November 4th, 2000 after the foundation was levelled with RCC in September 2000. The plac-ing schedule visualises two extended placing breaks. A first placing break can be observed between the end of December 2000 until beginning of June 2001 at eleva-tion 483.6 masl (top of roofless inspection gallery), a second major break is seen starting at the beginning of July 2001 until beginning of December 2001. The RCC works of the considered dam section were completed until April 2002. During RCC placement periods, the average dam rising speed was roughly 25 cm/d. Compared to the Mujib Dam placing schedule, the placement breaks monitored at Wala Dam last much longer and were seasons spanning (e.g. RCC stop in summer, restart in win-ter).

142
524.00
514.00
480.00
0.7
10.3
1
474.00
485.00
524.00 524.00
0 50 m
0 50 m470
475
480
485
490
495
500
505
510
515
520
01 11 00 01 05 01 01 11 01 01 05 02Date of Placing
Dam
Ele
vatio
n [m
AS
L]
Top of RCC 514.00 masl
Top of foundation ~474.00 masl
Fig. 5-41: RCC placement schedule of Wala Dam in DFOT measurement section.
Constructive aspects
Two classes of RCC were used for Wala Dam, both falling into the range of me-dium cementitious RCC. Up to elevation 485 masl, a mixture containing 120 kg/m3 of OPC was placed, above this level a mixture with 100 kg/m3 OPC was applied. No pozzolan and admixtures were added to the RCC mixes. Also at Wala Dam the traditional horizontal layer method was employed, the layer thickness was 30 cm after compaction. For the sake of watertightness and dynamic stability in the hori-zontal joints, a 5 - 8 m wide bedding mortar layer was placed at the upstream part of the dam.
For the forming of the horizontal to vertical 0.3 : 1 inclined upstream facing, an ap-proximately 50 cm thick strip of CVC against wooden formwork was laid ahead of the RCC placement and was consolidated by immersion vibrators. This CVC, con-
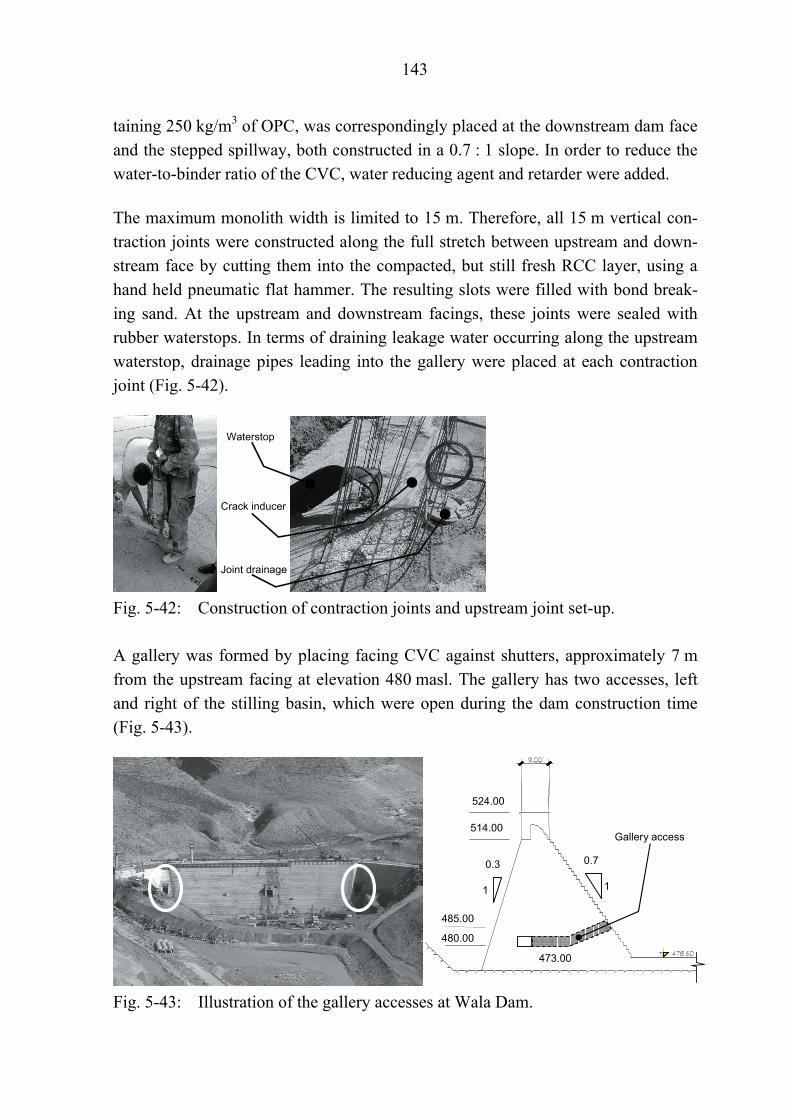
143
taining 250 kg/m3 of OPC, was correspondingly placed at the downstream dam face and the stepped spillway, both constructed in a 0.7 : 1 slope. In order to reduce the water-to-binder ratio of the CVC, water reducing agent and retarder were added.
The maximum monolith width is limited to 15 m. Therefore, all 15 m vertical con-traction joints were constructed along the full stretch between upstream and down-stream face by cutting them into the compacted, but still fresh RCC layer, using a hand held pneumatic flat hammer. The resulting slots were filled with bond break-ing sand. At the upstream and downstream facings, these joints were sealed with rubber waterstops. In terms of draining leakage water occurring along the upstream waterstop, drainage pipes leading into the gallery were placed at each contraction joint (Fig. 5-42).
Waterstop
Crack inducer
Joint drainage
Fig. 5-42: Construction of contraction joints and upstream joint set-up.
A gallery was formed by placing facing CVC against shutters, approximately 7 m from the upstream facing at elevation 480 masl. The gallery has two accesses, left and right of the stilling basin, which were open during the dam construction time (Fig. 5-43).
524.00
514.00
480.00
0.7
1
0.3
1
473.00
485.00
524.00
514.00
480.00
0.7
1
0.3
1
473.00
485.00
Gallery access
Fig. 5-43: Illustration of the gallery accesses at Wala Dam.

144
Temperature control was performed by specifying the RCC and CVC placement temperature not to exceed 26 °C. Between May and September chilled water was used in the concrete mixes and aggregates were cooled by sprinkling water in order not to violate the specifications. After completion of a layer it was cured by water spraying.
Table 5-8 shows the concrete mixture dosages applied for the RCC gravity section.
Tab. 5-8: RCC and CVC mixtures for Wala Dam (Baluch and Chraibi 2002).
Component RCC1 RCC2 CVC
OPC [kg/m3] 120 100 250
Pozzolan [kg/m3] - - -
Free water [kg/m3] 103 110 175
Admixture [l/m3] - - yes
w/B-ratio [-] 0.85 1.1 0.5
Maximum size aggregate [mm] 38 38 38
37.5 - 19 mm 737 27 % 737 34 % 623 32 %
19 - 9.5 mm 463 24 % 463 21 % 390 20 %
9.5 - 4.75 mm 210 13 % 210 10 % 257 13 %
Lim
esto
ne [k
g/m
3 ]
4.75 > mm 695 36 % 695 32 % 687 35 %
Theoretical density [kg/m3] 2 380 2 375 ~ 2 300
Installation of fibre cables for DFOT
Having started in November 2000, almost 2 500 m of fibre cable were installed at Wala Dam in 18 measurement horizons until April 2002. The inspection gallery was not completed until June 2001. Also, the request for an undisturbed RCC con-struction progress made necessary the initial cable layout from a formed contraction joint, marking the periphery of the first construction phase at station 0+190.95. The fibre cables were installed through an instrumentation duct after the completion of the gallery. For the tracing of temperature fields, two monoliths, by name block 1 and 3, were chosen. They were expected to have different temperature behaviours

145
because of their different geometry and location. The selected DFOT sections had to be moved to block 2 during certain construction stages, which is not problematic in terms of assessments, as the thermal behaviour of block 2 and 3 may be assumed to be equal. The DFOT layout and levels are designed for the monitoring of horizontal and vertical temperature distributions. The vertical distance between the DFOT ho-rizons is approximately 2 m, the distance to the dam facings is 0.2 m.
Figure 5-44, Figure 5-45 and Table 5-9 present details in respect of the DFOT in-strumentation at Wala Dam.
515.00
472.00
Draw-off,gate chambers
RIGHT BANK
145 3 2
0+25
8.45
0+24
2.95
0+23
0.95
Bottom outlet
520.00524.00
480.20
0+19
0.95
15 m DFOT
Gallery
524.00
515.00
~473.00
10.3 0.7
1
480.20
0 25 m
CVC
CVC
DFOT
RCC
485.00
524.00 524.00
Fig. 5-44: Situation of the DFOT instrumentation at Wala Dam.
15 m
Gallery480.0 masl
475.8477.6479.7
0+25
0,95
0+23
5,95
0+22
0,95
0+19
0,95
0+20
5,95
1 4 532
484.8488.4
489.3491.1497.7499.8502.5504.0506.1
507.6509.4511.2512.7513.9514.2
Upstream
DFOT
524.00
Fig. 5-45: Layout of fibre cables at Wala Dam.

146
Tab. 5-9: Locations of the DFOT instrumentation at Wala Dam.
DFOT horizon [masl] Date of installation Dam station (± 0.2 m)
475.8 19.11.2000 0+228.45; 0+258.45
477.6 23.11.2000 0+228.45; 0+258.45
479.7 29.11.2000 0+228.45; 0+258.45
484.8 17.06.2001 0+240.95; 0+245.95
488.4 28.06.2001 0+240.95; 0+245.95
489.3 09.12.2001 0+230.95; 0+242.95
491.1 19.12.2001 0+230.95; 0+242.95
497.7 13.01.2002 0+230.95; 0+242.95
499.8 17.01.2002 0+230.95; 0+242.95
502.5 18.02.2002 0+230.95
504.0 03.03.2002 0+230.95; 0+242.95
506.1 13.03.2002 0+230.95; 0+242.95
507.6 17.03.2002 0+230.95; 0+242.95
509.4 21.03.2002 0+230.95; 0+242.95
511.2 28.03.2002 0+230.95; 0+242.95
512.7 01.04.2002 0+230.95; 0+242.95
513.9 07.04.2002 0+230.95; 0+242.95
514.2 07.04.2002 0+230.95; 0+242.95
5.3.2 Temperature behaviour
Due to constructive differences between Wala Dam and Mujib Dam, together with differences in the RCC placement progress, a different overall thermal behaviour of Wala Dam compared to Mujib Dam can principally be expected. The nature of cer-tain aspects and assessments is identical, however, the absolute values diverging from those gained at Mujib Dam. These aspects will partially be considered in order to more generalise the facts assessed from the measurements at Mujib Dam.

147
Temperature development in the young RCC during construction time
Figure 5-46 presents the correlation between the RCC placement temperatures and the ambient temperatures at Wala Dam. The values additionally confirm the direct influence of the ambient temperatures on the placement temperatures when pre-cooling measures are not taken. With the Wala data it can also be seen that the an-nual placement temperature cycle is slightly delayed in comparison to the ambient temperature cycle.
10
15
20
25
30
35
01.08.00 27.07.01 22.07.02Date
Tem
pera
ture
[°C
]
RCC placement
Average daily ambientmax. placementtemperature 26°C
Fig. 5-46: Wala Dam: Ambient air and RCC placement temperatures.
The fact of hydration heat losses via the exposed horizontal surface of an RCC layer prior to be covered by a successive layer and the conductive heat transport along vertical temperature gradients has already been addressed in connection with the DFOT measurements at Mujib Dam. Figures 5-47 and 5-48 shall stress this relation by using DFOT data gained in the centre of DFOT level 499.8 masl, which was placed in the winter season at Wala Dam. A back-analysis of the cumulative heat amount Q [kJ/kg] effectively leading to a temperature rise in the RCC (based on the temperature measurements presented in Figure 5-47) was conducted. The effective heat until 28 days after placement refers to the subsequently placed RCC layer 500.1 masl and was adjusted to achieve a best-fit of the temperature data marked in Figure 5-47. In the very initial hydration phase of layer 500.1 masl, a congruent trace of adiabatic hydration heat and back-analysed effective heat can be seen in Figure 5-48. This is due to the insulating effect the fresh RCC layer has on the DFOT location 30 cm below. Resulting from the conductive heat transport via the

148
uncovered surface at 500.1 masl, the back-analysed heat increasingly deflects from the adiabatic heat of hydration, indicating the heat losses occurring at the free sur-face. When the free surface is isolated from the ambient conditions and heat losses are eliminated, adiabatic heat of hydration and back-analysed effective heat show a parallel evolution until the RCC age of 28 days.
10
15
20
25
30
35
40
17.01.02 24.01.02 31.01.02Date
Tem
pera
ture
[°C
]
Dam centre
St. 0+230.95
Early temperature history in dam centre as basis for derivation of hydration heat (Fig. 5-48).
499.8 masl
Placement temperature~ 15°C
Time frame forbest fit analysis
13 2
Foundation
Fig. 5-47: Wala Dam: Early temperature history in dam centre as basis of deriva-
tion of semi-adiabatic hydration heat in Fig. 5-48 (DFOT elev. 499.8. masl, station 0+230.95, Block 3).
Three practical conclusions can be drawn from the above presented occurrence. (1) Advantageous heat losses are achieved by the application of RCC technology and the placement of RCC layers with a large surface-to-volume ratio under advanta-geous environmental conditions (low ambient temperatures, no sun radiation). (2) However, it has to borne in mind that this effect may be reversed under disadvanta-geous environmental conditions (day placement in summer, considerable sun radia-tion) causing significant heat gains. Regarding the numerical thermal modelling of an RCC dam (3) it is inevitable to model each single RCC layer in connection with the placement progress and the ambient conditions in order to accurately depict the semi-adiabatic behaviour of the RCC dam in terms of an accurate prediction of the temperature fields in the dam.

149
0
100
200
300
400
500
0 10 20 30
Time [d]
Hyd
ratio
n he
at p
er 1
kg
cem
ent [
kJ/k
g]
Schrader (2001), seeFig. 4-4
Wala Dam (derivedfrom DFOT 499.8masl)
Back-analysed adiabatichydration heat of JordanianOPC (Schrader 2001,from Mujib trial test)
Back-analysed in-situeffective heat of JordanianOPC (Conrad et al. 2002b,from DFOT Wala)
St. 0+230.95
Reduction of overall heat leading to RCC temperature rise due to RCC layer exposure
499.8 masl
13 2
Foundation
Fig. 5-48: Wala Dam: Effect of heat losses during first 28 days as result of RCC
layer exposure (DFOT elev. 499.8. masl, station 0+230.95, Block 3).
Long-term temperature development in the RCC during construction time
Figure 5-49 presents the long-term temperature behaviour in the centre of Wala Dam, which has to be considered with respect to the placement schedule (Fig. 5-41) and the dam width according to the DFOT elevation. The two major placement breaks at elevations 483.9 masl (December 2000 to June 2001) and 489.0 masl (July 2001 to December 2001) are reflected in the dam central temperature evolutions, once again emphasising the necessity to implement a realistic construction schedule into the thermal stress considerations as part of the RCC dam design. DFOT loca-tions close to the temporary free horizontal surface follow the ambient temperatures until RCC placement is resumed. The temperature histories monitored at the DFOT horizons in the upper dam portion fluctuate in relation to the ambient temperatures. However, they are damped in their amplitude and delayed due to the attenuation of the ambient temperature oscillation with increasing distance from the surfaces. The maximum temperature rise in the Wala RCC can be concluded as approximately 17 K in the lower dam portion (120 kg/m3 OPC) and 18 K in the upper portion (100 kg/m3 OPC), which corresponds to roughly 80 % and 100 % of the adiabatic temperature rise of the two RCC grades.

150
5
10
15
20
25
30
35
40
30.09.00 25.09.01 20.09.02 15.09.03Date
Tem
pera
ture
[°C
]
St. 0+230.95
RCC temperature histories in dam centre from DFOT acc. to Tab. 5-7.Placement break I: 483.9maslPlacement break II: 489.0masl
513.9 masl
Ambienttemperature
475.8 masl
13 2
Foundation
I II
475.8 masl
479.7 masl
484.8 masl
488.4 masl
499.8 masl
507.6 masl
512.7 masl
Fig. 5-49: Wala Dam: RCC temperature histories in the dam centre until end of
2003 (station 0+230.95, Block 3).
The occurrence of possible significant irregularities in the vertical temperature dis-tribution in the centre of an RCC dam shall be pointed up with the DFOT data ac-quired at Wala Dam, since the locations and the durations of the placement breaks during the construction of Wala Dam considerably deviate from those at Mujib Dam. Figure 5-50 presents vertical temperature distributions in the centre of Wala Dam before and after the resumption of RCC placement following the placement break between June 30th and December 7th, 2001. Due to the trans-seasonal place-ment break between summer and winter, a steep vertical temperature gradient of approximately 3.8 K/m could develop until placement resumption. The temperature differential observed at Mujib Dam in the interface between hardened and newly placed RCC could basically be confirmed at Wala Dam. Here, the monitored tem-perature differentials have been at maximum 5 K. The particular characteristic of the depicted placement break is its duration from a warm into a cold season. The DFOT measurements at Mujib Dam have already showed the close relation between the ambient conditions at time of RCC placement and the finally reached maximum RCC temperatures in the dam. This relation in connection with the extended place-ment break at Wala Dam results in the non-uniform vertical temperature distribution visible in Figure 5-50, which is kept for almost 3 years.

151
St. 0+230.95
Placement break at 489.0masl:June 30th to December 7th, 2001
512.7 masl
489.0 masl
475.8 masl
470
480
490
500
510
520
5 10 15 20 25 30 35 40Temperature [°C]
Dam
ele
vatio
n [m
asl]
DFOT 01.12.01DFOT 11.12.01DFOT 03.02.02DFOT 30.03.02DFOT 28.11.04
Foundation ~474.0masl
Break at 489.0masl
Top of RCC in 01/2002
Top of RCC
13 2
Foundation
Fig. 5-50: Wala Dam: Vertical RCC temperature distributions in the dam centre
resulting from placement breaks (station 0+230.95, Block 3).
The commencement of RCC works above dam elevation 475.0 masl took place when average daily ambient temperatures have been still around 20 °C. Together with the cementitious content of 120 kg/m3, which was also used for the levelling concrete, this resulted in higher temperatures close to the foundation compared to Mujib Dam. The very different formation of temperature gradients within Wala Dam as a main consequence of the placement schedule results as well in a very dif-ferent situation of the heat fluxes in the dam. Temperatures close to the foundation are not significantly increased by the conductive heat flow along vertical gradients during the construction period. In contrary to the observations at Mujib Dam, they start to decrease notably already in the early lifetime of the dam.
Figure 5-51 displays the evolution of horizontal temperature gradients at the up-stream facing of Wala Dam, which principally act in the same way as those moni-tored at Mujib Dam. RCC layers placed during cold ambient temperatures exhibit steep temperature gradients already shortly after placement and formwork removal. They consecutively correspond to the annual ambient temperature cycle in the case of a free exposure of the facing to ambient conditions. In terms of temperature gra-dients, the dam portion at the elevation and upstream of the inspection gallery is of particular interest, since surface cracks might be easily initiated and might propa-gate through to the gallery here. The DFOT measurements at dam elevation 479.7 masl (30 cm below the gallery bottom) in fact show extraordinarily steep gra-

152
dients of 8 K/m in the very early age of the concrete. However, the temporal devel-opment of the temperature gradients does not agree with the ambient temperatures as a consequence of a clay filling at the upstream face up to elevation 485.0 masl, having an insulating effect. The temperature gradients then are balanced little by little, approaching zero as a result of the isolation from the ambient temperature changes.
-8
-6
-4
-2
0
2
4
6
8
01.12.00 30.05.01 26.11.01 25.05.02 21.11.02 20.05.03Date
Tem
pera
ture
gra
dien
t [K/
m]
0
5
10
15
20
25
30
35
40
Ambi
ent t
empe
ratu
re [°
C]
479.7masl
489.3masl
502.5masl
St. 0+230.95
Temperature gradients at 40cm from upstream facing.Positive gradient = tensile stresses
502.5 masl
Ambienttemperature 489.3 masl
479.7 masl
13 2
Foundation
Clay
Fig. 5-51: Wala Dam: Time-history of temperature gradients at 40 cm from the
upstream facing developed from DFOT (DFOT elev. 479.7, 489.3 and 502.5 masl, station 0+230.95, Block 3).
The gallery designs at Wala and Mujib Dam differ considerably. At Wala Dam two access galleries extend from the downstream into the actual inspection gallery (see Fig. 5-43), which caused a steady ventilation with ambient air when they were open during the construction time. Consequently, the gallery temperatures were closely related to the ambient air temperatures and the adjacent RCC accordingly cooled off during cold seasons, actually enhancing the problematic of steep thermal gradients also inside the gallery. Possible thermal surface cracks propagating from the up-stream facing and the upstream gallery wall may easily create a through crack. Fig-ure 5-52 gives an impression of the effects of gallery ventilation on the temperature distribution in the dam body.
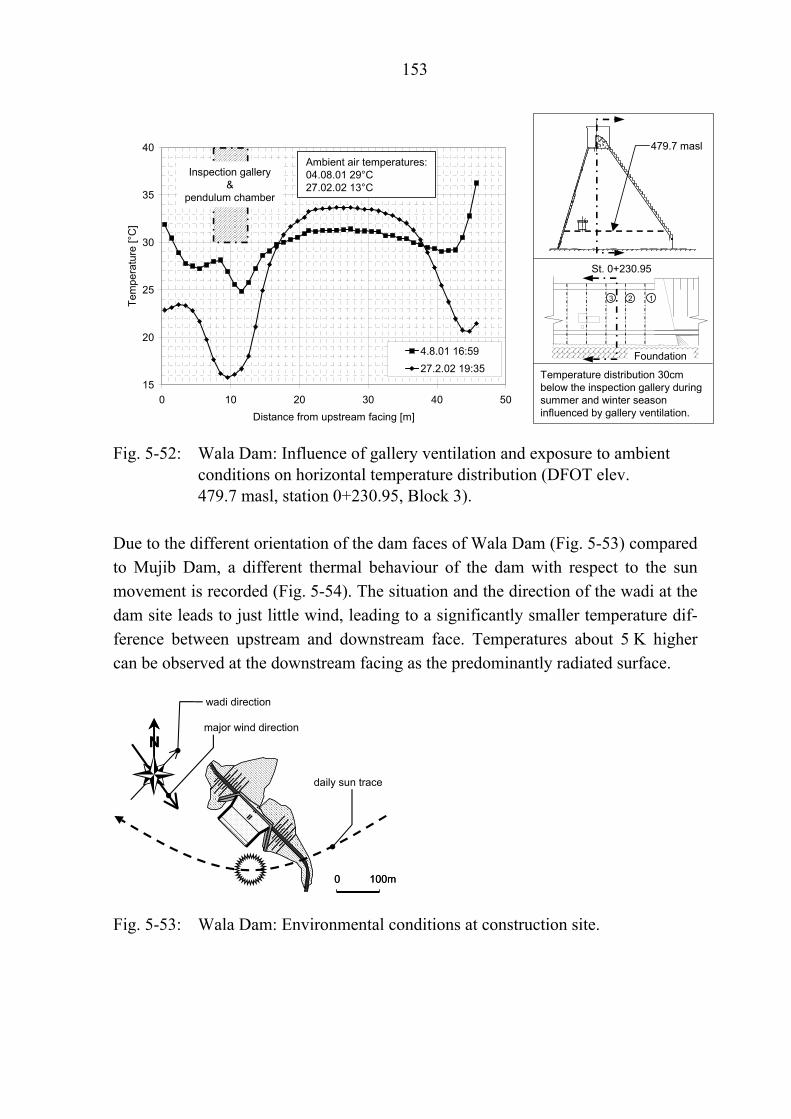
153
15
20
25
30
35
40
0 10 20 30 40 50Distance from upstream facing [m]
Tem
pera
ture
[°C
]
4.8.01 16:5927.2.02 19:35
St. 0+230.95
Temperature distribution 30cm below the inspection gallery during summer and winter season influenced by gallery ventilation.
479.7 masl
Inspection gallery&
pendulum chamber
Ambient air temperatures:04.08.01 29°C27.02.02 13°C
13 2
Foundation
Fig. 5-52: Wala Dam: Influence of gallery ventilation and exposure to ambient
conditions on horizontal temperature distribution (DFOT elev. 479.7 masl, station 0+230.95, Block 3).
Due to the different orientation of the dam faces of Wala Dam (Fig. 5-53) compared to Mujib Dam, a different thermal behaviour of the dam with respect to the sun movement is recorded (Fig. 5-54). The situation and the direction of the wadi at the dam site leads to just little wind, leading to a significantly smaller temperature dif-ference between upstream and downstream face. Temperatures about 5 K higher can be observed at the downstream facing as the predominantly radiated surface.
0 100m0 100m
NN
daily sun trace
major wind direction
wadi direction
Fig. 5-53: Wala Dam: Environmental conditions at construction site.

154
5
10
15
20
25
30
35
0 10 20 30 40Distance from upstream facing [m]
Tem
pera
ture
[°C
]
26.01.02
St. 0+230.95
484.8 maslAmbient temperature:26.01.02 ~10 °C
Impact of sun radiationand wind effects
ΔT ~ 5K13 2
Foundation
Fig. 5-54: Wala Dam: Example horizontal temperature distribution affected by
sun radiation and convective heat transport (DFOT elev. 484.8 masl, station 0+230.95, Block 3).
Long-term temperature development in the RCC during early service time
The reservoir of Wala Dam was initially impounded within the rainy season at the end of 2002. As a result of the geological wadi characteristics, the flood waters carry loads of sediments, which are deposited in the reservoir. This phenomenon, as well as the influence of the impounded water, is clearly visible in the temporal evaluation of the upstream temperature gradients depicted in Figure 5-55. The fac-tual non-existence of temperature gradients at the upstream of elevation 479.7 masl confirms the insulation effect of the clay key at the upstream, which was filled up to elevation 485.0 masl. The depicted thermal gradient evolution at the upstream of elevation 489.3 masl was influenced until end of 2002 and the first impoundment. The temperature gradient at this elevation also approaches zero, which results from a possible occurrence of sedimentation. Actually, some variation of the gradient can be expected, when the reservoir water is mixed during the occurrence of new floods (usually during winter, thus resulting in cooler reservoir temperatures). The tem-perature gradients at elevation 502.5 masl were considerably increased by the cool water, accelerating the chilling of the superficial zones.
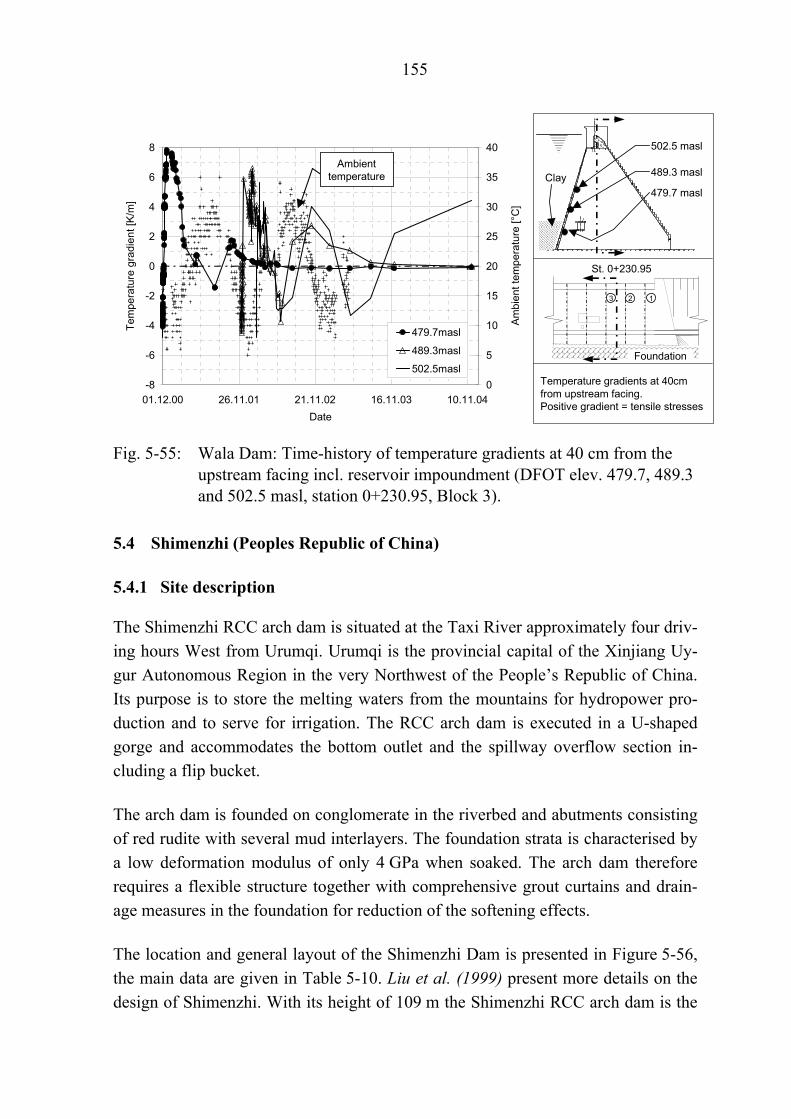
155
-8
-6
-4
-2
0
2
4
6
8
01.12.00 26.11.01 21.11.02 16.11.03 10.11.04Date
Tem
pera
ture
gra
dien
t [K/
m]
0
5
10
15
20
25
30
35
40
Ambi
ent t
empe
ratu
re [°
C]
479.7masl
489.3masl
502.5masl
Ambienttemperature
St. 0+230.95
Temperature gradients at 40cm from upstream facing.Positive gradient = tensile stresses
502.5 masl
489.3 masl
479.7 masl
13 2
Foundation
Clay
Fig. 5-55: Wala Dam: Time-history of temperature gradients at 40 cm from the
upstream facing incl. reservoir impoundment (DFOT elev. 479.7, 489.3 and 502.5 masl, station 0+230.95, Block 3).
5.4 Shimenzhi (Peoples Republic of China)
5.4.1 Site description
The Shimenzhi RCC arch dam is situated at the Taxi River approximately four driv-ing hours West from Urumqi. Urumqi is the provincial capital of the Xinjiang Uy-gur Autonomous Region in the very Northwest of the People’s Republic of China. Its purpose is to store the melting waters from the mountains for hydropower pro-duction and to serve for irrigation. The RCC arch dam is executed in a U-shaped gorge and accommodates the bottom outlet and the spillway overflow section in-cluding a flip bucket.
The arch dam is founded on conglomerate in the riverbed and abutments consisting of red rudite with several mud interlayers. The foundation strata is characterised by a low deformation modulus of only 4 GPa when soaked. The arch dam therefore requires a flexible structure together with comprehensive grout curtains and drain-age measures in the foundation for reduction of the softening effects.
The location and general layout of the Shimenzhi Dam is presented in Figure 5-56, the main data are given in Table 5-10. Liu et al. (1999) present more details on the design of Shimenzhi. With its height of 109 m the Shimenzhi RCC arch dam is the

156
second highest RCC thin arch dam in the world after the Shapai RCC arch dam in the South of China (130 m).
1300
1320
1340
1360
1380
1400
1420
1440
1460
1480
1300
1340
1360
1380
1400
1320
1420
1440
sloped embankment
hydro power plant
RCC arch dam
0 100
North
reservoir
PR China
BeijingShimenzhi
Urumqi
Longitude [°]80 100
0
10
30
40
50
Latit
ude
[°]
Nor
th
20
90 110 120 130
1500 km
Fig. 5-56: Location and general layout of Shimenzhi RCC arch dam.
Tab. 5-10: Main data of Shimenzhi RCC arch dam.
Owner and project objectives • Owner: Government of the Manasi County • Objectives: Storage of melting water for irri-
gation and hydropower
Hydrology • Catchment area at dam: 664 km2 • 1 000-years flood (HQ1000): 451 m3/s • Annual runoff: 100⋅106 m3/a
Dam data
• Type: Multi-centred thin RCC arch dam • Max. height above river bed: 104 m • Max. height above foundation: 109 m • Total crest length: 175 m • RCC volume: ~ 280 000 m3 • Crest elevation: 1394.0 masl • Max. water level: 1388.0 masl • Year of completion: 2001

157
Site characteristics relevant for RCC construction
The Shimenzhi Arch Dam is designed as a very slender structure with about 30 m thickness at the base and 15 m at mid-height, exposed to extreme temperature dif-ferentials due to the extreme continental climate (Summer: +30 °C; Winter: -20 °C) and its location in a high mountainous region (1280 masl). The mean yearly precipi-tation at Urumqi is about 175 mm/a with a maximum in July and August. Figure 5-57 shows average temperature recordings at the provincial capital Urumqi. Typical temperatures at the Shimenzhi dam site may be expected to fall approximately 2.2 °C below the Urumqi mean temperatures, if a cooling rate of -0.6 °C per 100 m of altitude gain is assumed.
-30
-20
-10
0
10
20
30
40
01.12 01.03 01.06 01.09 01.12
Air
tem
pera
ture
[°C
]
average month average year
maximum month
minimum month
Fig. 5-57: Average temperatures at Urumqi (918 masl) over a typical year.
The main part of the Shimenzhi Arch Dam was built with a high cementitious RCC, consisting of silicate cement (mineral composition comparable to ASTM Type IV cement) and fly ash. As a watertight barrier and for frost resistance, the dam facings with a thickness of roughly 1.5 m were cast with CVC containing silicate cement, fly ash and magnesiaoxide (MgO) as an expansive additive for compensation of autogenous shrinkage and thermal volume contraction. CVC was also poured in constricted dam areas, where roller compaction could not be realised. Table 5-11 describes the used concrete mixtures.

158
Tab. 5-11: RCC and CVC mixtures for Shimenzhi RCC arch dam.
Component RCC CVC
Silicate cement 525 [kg/m3] 62 93
Pozzolan [kg/m3] 110 (fly ash) 110 (fly ash)
Free water [kg/m3] ~ 81 ~ 112
Additives [%] - max. 5 % MgO
w/B-ratio [-] 0.47 0.55
Maximum size aggregate [mm] (riverbed gravel)
152 38
The dam has only one vertical transversal joint at the centre of the arch, dividing the structure into two monoliths. The repeated groutable centre joint was formed with CVC against sheet piles used as formwork, which were anchored into the concrete mass. The two blocks were placed alternately in steps of 3 m, rising at a placement speed of approximately 1 m/d. Each 3 m lift was placed in ten 30 cm horizontal lay-ers. Including the adjustment of the shutters at the facings and at the contraction joint, each 3 m lift could be completed within one week. The lift surface was ex-posed to the ambient conditions for approximately four to five days.
The severe climate and the rapid construction made a sophisticated crack and tem-perature control necessary. In addition to the expansive behaviour of the facing con-crete and to the limitation of the monolith length by the central contraction joint, specially formed short joints at special locations in the tension zones of the arch were cast by in-place bond breaking wood planks (Fig. 5-58). Steel U-profiles were set at the tips of the short joints to avoid a propagation of the formed crack. The ten-sile stress relieving short joints help to maintain a controlled, compressive arch in order to securely transfer the reservoir loads into the abutments.
With regard to temperature control of the Shimenzhi RCC arch dam, various means have been applied. Concrete placement was originally limited to the spring and au-tumn seasons from April to June and September to November. Due to delays in the placement progress, concrete works were suspended in winter only, in the hot sum-mer months the rising speed of the single monoliths was reduced. The placement temperature of the RCC and CVC was specified to a maximum of 14 °C during the

159
complete construction time in order not to exceed peak concrete temperatures of 30 °C in the dam. This was tried to be achieved with cold melting water from the Taxi River and the naturally chilled aggregates used in the concrete mixes. For the compensation of the increased temperature rise of the CVC, compared to the RCC, PVC cooling pipes were installed in the CVC facings at 1 m vertical distance. Cool-ing was usually started with the concrete pouring and ran for 30 days.
0 10m1393.71388.0
1340.0
1292.0 1290.01289.01284.0
RCC
CVC
Duct
CVC
Centre contraction joint
Upstream short joints
Downstream short joints
1
1
2
23
3
2
3
1 2 3
Fig. 5-58: Contraction and short joints at Shimenzhi RCC arch dam.
The reservoir was partially impounded during construction time in winter 2000 / 2001 for the prevention of too steep temperature gradients in the dam exte-rior portions and the resulting risk of thermal induced cracking. Additionally, an insulating polyurethane foam was put on the exposed facings above the reservoir level. The temporary lift surface during the placement suspension was covered with gravel layers. Figure 5-59 depicts some temperature control methods applied at Shimenzhi.

160
PVC cooling pipesembedded in CVC
PU foam atexposed facings
Gravel layer onexposed top
Fig. 5-59: Temperature control measures applied at Shimenzhi RCC arch dam.
Installation of fibre cables
DFOT installation took place in co-operation with the Tsinghua University Beijing in May and August 2000. Figure 5-60 shows an isometric view of Shimenzhi RCC arch dam displaying the cable layouts (Aufleger et al., 2001).
1289
1319
1340
1345
1388
1394
Cable 1/2
Cable 3
Cable 4
Contractionjoint
Fig. 5-60: Isometric view of Shimenzhi RCC arch dam and DFOT locations (Au-
fleger et al. 2001).

161
Approximately 400 m of fibre cable were implemented into the mass concrete of Shimenzhi RCC arch dam. Cables were installed in three different elevations of the dam. The layout of the cables was designed in order to monitor the temperature be-haviour at the facings influenced by the cooling pipes and therefore to provide a quality control for the cooling efficiency. Further, the temperature distributions in a cross and longitudinal section had to be traced. The fibre cables were installed at a distance of approximately 20 cm to the dam facings.
5.4.2 Temperature behaviour
The DFOT results attained at Shimenzhi are presented in order to contrast the DFOT recordings from the two RCC gravity dams in Jordan and to highlight some certain outstanding aspects of the Shimenzhi RCC arch dam.
Temperature development in the early age RCC during construction time
The facing temperatures rose faster than those of the interior RCC, due to the higher cementitious content of the CVC facings compared to that of the RCC, the insula-tion effects of the shutters and the warm ambient temperatures during the placement of dam elevation 1319.0 masl in May 2000 (Fig. 5-61). This development was de-celerated after about 4 days, due to natural (convection after shutter removal) and artificial cooling effects (PVC cooling pipes in the facings). Maximum temperature gradients of 4.8 K/m after 6 days occurred at the facings after formwork removal, which would have been more severe without the hydration heat reduction by help of the cooling pipes embedded into the facing CVC.
To keep maximum RCC temperatures for dam sections being constructed during summer time below the specified limit of 30 °C, the PVC cooling pipes were in-stalled and embedded into the RCC across the full width of the dam (distance at approx. 2.5 m), in contrary to the RCC sections placed in winter, when the cooling pipes were placed only into the CVC facing portions. The installation of cooling pipes is a very rarely used temperature control measure in RCC technology. There-fore, the monitoring of the cooling efficiency by DFOT is a new aspect for its appli-cation in RCC dams. Figure 5-62 shows the early temperature evolution at dam ele-vation 1345.0 masl, where PVC cooling hoses were installed. The cooling effect as a result of continuously circulated cool river water was monitored after 1 day, keep-ing the RCC temperatures low at the locations of the PVC pipes. In between the pipes, the temperatures were still rising with the consequence of the corrugated horizontal temperature distribution. The cooling of the RCC mass according to the
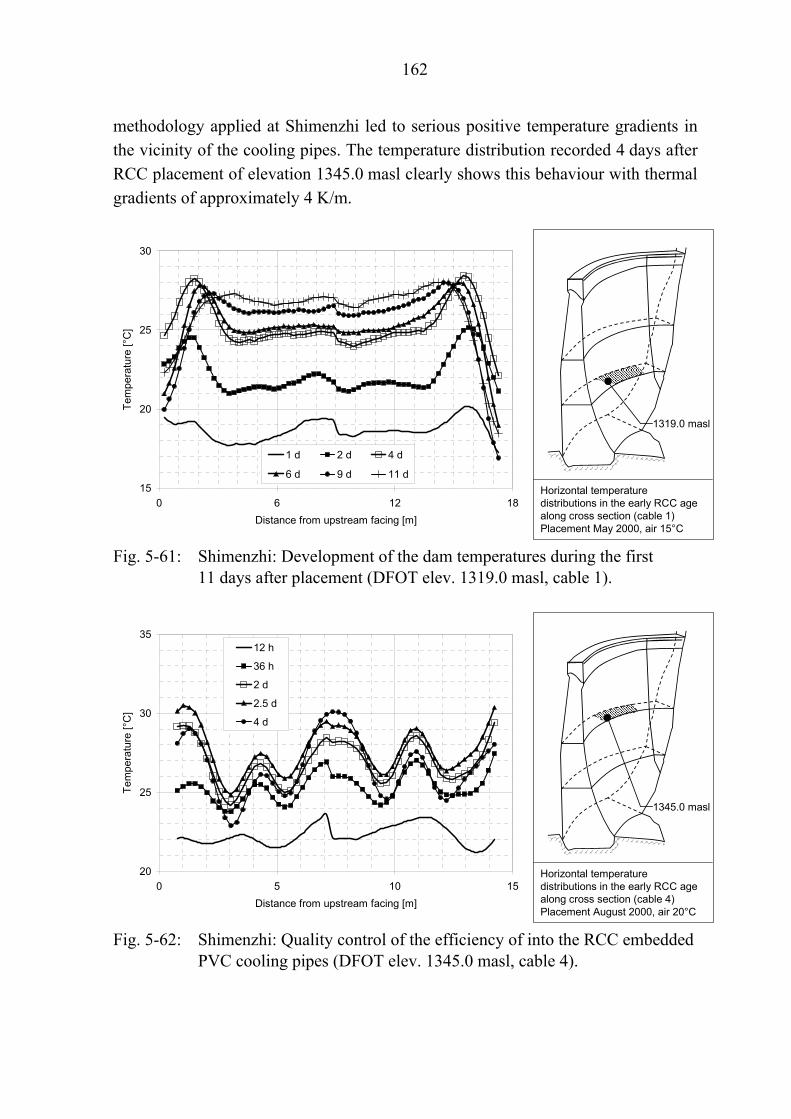
162
methodology applied at Shimenzhi led to serious positive temperature gradients in the vicinity of the cooling pipes. The temperature distribution recorded 4 days after RCC placement of elevation 1345.0 masl clearly shows this behaviour with thermal gradients of approximately 4 K/m.
15
20
25
30
0 6 12 18Distance from upstream facing [m]
Tem
pera
ture
[°C
]
1 d 2 d 4 d
6 d 9 d 11 dHorizontal temperature distributions in the early RCC age along cross section (cable 1)Placement May 2000, air 15°C
1319.0 masl
Fig. 5-61: Shimenzhi: Development of the dam temperatures during the first
11 days after placement (DFOT elev. 1319.0 masl, cable 1).
20
25
30
35
0 5 10 15Distance from upstream facing [m]
Tem
pera
ture
[°C
]
12 h
36 h
2 d
2.5 d
4 d
Horizontal temperature distributions in the early RCC age along cross section (cable 4)Placement August 2000, air 20°C
1345.0 masl
Fig. 5-62: Shimenzhi: Quality control of the efficiency of into the RCC embedded
PVC cooling pipes (DFOT elev. 1345.0 masl, cable 4).

163
Long-term temperature evolution in the RCC
The maximum temperature in the RCC was reached several weeks after concrete placement, which was caused by the high percentage of fly ash applied in the RCC mixture and the effect of the high-C2S-content cement used, which can be character-ised by a low and slow hydration heat generation (Fig. 5-63). The first cool season after RCC placement and the poor thermal conductivity of the concrete created large temperature gradients of almost 5.5 K/m at the upstream facing, which in turn led to a accelerated cooling of the dam interior.
The efficiency of the insulation covering the exposed facings during the severe win-ter (PU-foam, Fig. 5-59) could already be proven in October 2000, when facing temperatures did not fall below 5 °C at an ambient temperature of 0 °C during the day. The undeniable benefit of the insulation and of the partial reservoir impound-ment to elevation 1330.0 masl emerged during February 2001, when facing tem-peratures maintained at 6 °C despite the ambient temperatures recorded as -5 °C during the day.
5
10
15
20
25
30
35
0 6 12 18Distance from upstream facing [m]
Tem
pera
ture
[°C
]
90d (08/2000)
161d (10/2000)
282d (02/2001)
Long-term horizontal temperature distributions in the RCC along cross section (cable 1)
1319.0 masl
Fig. 5-63: Shimenzhi: Long-term temperature distributions after having reached
the maximum RCC temperature in the dam centre (DFOT elev. 1319.0 masl, cable 1).
The steep gradients and the thin cantilever structure favour the rapid cooling of the whole dam. Figure 5-64 depicts long-term temperature profiles monitored by cable 4 at elevation 1345.0 masl to demonstrate this process. Again, the development of

164
steep temperature gradients with the beginning of the cold season and the subse-quent cooling in the dam centre is visualised. At elevation 1345.0 masl the effi-ciency of the insulating PU-foam at the facings is recognisable. The centre tempera-ture has further decreased one year after RCC placement, whereas the facings have warmed as a consequence of summer temperatures (approx. 20 °C during daytime). The dam has cooled off to a stable temperature cycle at shown location after already 3 years, having approached an almost constant temperature profile at 10 °C. The characteristic of the RCC and the section width result in a decrease of the annual ambient temperature amplitude by roughly 85 % and a delay of approximately 4 months. The ambient summer temperatures reach the dam centre in winter at about 5.5 K above the annual mean temperature (4 °C, Fig. 5-57).
5
10
15
20
25
0 5 10 15Distance from upstream facing [m]
Tem
pera
ture
[°C
]
74d (10/2000)
197d (02/2001)
357d (07/2001)
1185d (11/2003)
Long-term horizontal temperature distributions in the RCC along cross section (cable 4)
1345.0 masl
Fig. 5-64: Shimenzhi: Long-term temperature distributions after having reached
the maximum RCC temperature in the dam centre (DFOT elev. 1345.0 masl, cable 4).
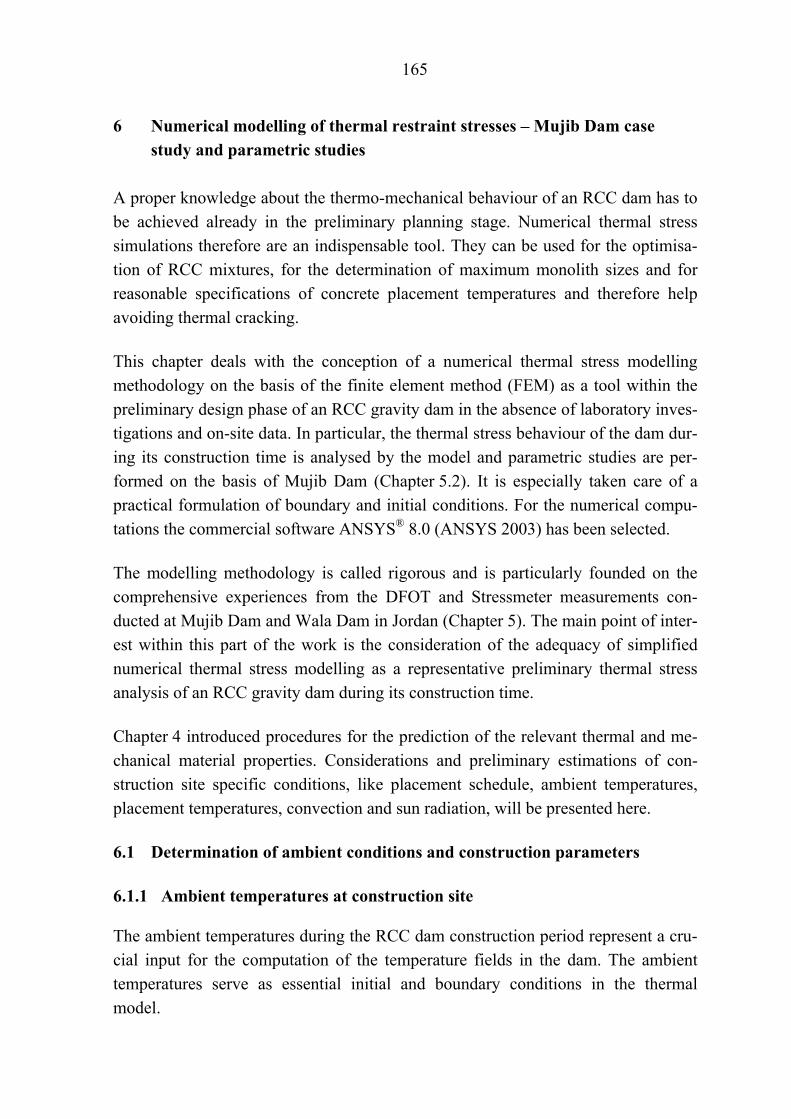
165
6 Numerical modelling of thermal restraint stresses – Mujib Dam case study and parametric studies
A proper knowledge about the thermo-mechanical behaviour of an RCC dam has to be achieved already in the preliminary planning stage. Numerical thermal stress simulations therefore are an indispensable tool. They can be used for the optimisa-tion of RCC mixtures, for the determination of maximum monolith sizes and for reasonable specifications of concrete placement temperatures and therefore help avoiding thermal cracking.
This chapter deals with the conception of a numerical thermal stress modelling methodology on the basis of the finite element method (FEM) as a tool within the preliminary design phase of an RCC gravity dam in the absence of laboratory inves-tigations and on-site data. In particular, the thermal stress behaviour of the dam dur-ing its construction time is analysed by the model and parametric studies are per-formed on the basis of Mujib Dam (Chapter 5.2). It is especially taken care of a practical formulation of boundary and initial conditions. For the numerical compu-tations the commercial software ANSYS® 8.0 (ANSYS 2003) has been selected.
The modelling methodology is called rigorous and is particularly founded on the comprehensive experiences from the DFOT and Stressmeter measurements con-ducted at Mujib Dam and Wala Dam in Jordan (Chapter 5). The main point of inter-est within this part of the work is the consideration of the adequacy of simplified numerical thermal stress modelling as a representative preliminary thermal stress analysis of an RCC gravity dam during its construction time.
Chapter 4 introduced procedures for the prediction of the relevant thermal and me-chanical material properties. Considerations and preliminary estimations of con-struction site specific conditions, like placement schedule, ambient temperatures, placement temperatures, convection and sun radiation, will be presented here.
6.1 Determination of ambient conditions and construction parameters
6.1.1 Ambient temperatures at construction site
The ambient temperatures during the RCC dam construction period represent a cru-cial input for the computation of the temperature fields in the dam. The ambient temperatures serve as essential initial and boundary conditions in the thermal model.

166
Usually, adequately long-term ambient temperature recordings can be provided by meteorological stations close to the construction site or even on site. Of course, his-torical data may never reflect the real ambient conditions during the construction time, but most problems arise when data from a meteorological station are simply transferred to the site without consideration of different altitudes and corresponding adjustment of the ambient temperatures. The adjustment can be done by considering a moist adiabatic or a dry adiabatic temperature change. According to Payer (2001) the dry adiabatic temperature change can be regarded by a temperature decrease of 0.98 K per 100 m of gain in altitude, whereas the moist adiabatic temperature change can be accounted for as a temperature decrease of 0.3 K per 100 m of alti-tude gain. The average value of 0.64 usually gives good agreement.
6.1.2 Foundation temperature
It can be assumed that the foundation rock holds the long-term average annual tem-perature as a constant value before excavation and foundation preparation. How-ever, when the foundation is excavated it is exposed to the ambient conditions until commencement of RCC placement and a vertical temperature distribution will ap-pear in the rock domain. In order to predict the foundation thermal state prior to RCC placement, a computation of the temperature fields in the foundation domain is usually conducted for the timeframe between excavation and dam construction start date, applying the long-term average annual ambient temperature as the initial condition for the rock domain and the ambient temperature cycle as thermal bound-ary condition (e.g. Amberg 2003).
A simplified procedure, which is followed within the thermal stress analysis per-formed in this thesis, is the setting of the long-term average annual ambient tem-perature for the whole foundation domain at the time of RCC placement start. Within a preliminary thermal analysis of an RCC dam during construction, this con-cept will also lead to satisfying results (e.g. Faroukh 2003).
6.1.3 RCC placement temperatures
RCC placement temperatures have to be predicted within the pre-construction ther-mal stress analysis and represent an important initial condition within the thermal stress model. As concluded from the DFOT campaigns described in Chapter 5 the RCC placement temperature is closely related to the ambient air temperatures when artificial pre-cooling measures and special aggregate stockpiling are not applied. The RCC placement temperature cycle is slightly delayed in comparison to the am-

167
bient temperature cycle. These features are included in a concept for the prediction of RCC placement temperatures presented by Tatro et al. (2000) (Tab. 6-1), whereas emphasis is on the aggregate temperature as the ruling factor.
Tab. 6-1: Prediction of RCC placement temperatures (Tatro et al. 2000).
Temperature [°C] Factor
May Jun Jul Comment
(1) Average annual 16.1 16.1 16.1 From meteorological station (2) Previous month 15.0 18.9 22.6 From meteorological station (3) Added ambient I -0.74 1.88 4.36 = 0.67⋅( (2)-(1) ) (4) Aggregate subtotal 15.4 18.0 20.5 = (1)+(3) (5) Added processing 1.1 1.1 1.1 Processing / crushing energy (6) Aggregate stockpile 16.5 19.1 21.6 = (4)+(5) (7) Current ambient 18.9 22.6 24.8 From meteorological station (8) Added ambient II 1.6 2.3 2.1 = 0.67⋅( (7)-(6) ) (9) Added mixer 1.1 1.1 1.1 Mixing energy
(10) RCC placement 19.2 22.5 24.8 = (6)+(8)+(9)
Table 6-1 introduces the RCC placement temperature prediction on the basis of monthly values. Principally, the concept may also be adopted to weekly or daily values, if the computation of weekly or daily varying placement temperatures is desired.
6.1.4 Consideration of sun radiation
Actually, the in-situ studies at Mujib Dam and Wala Dam showed that different in-tensities of sun radiation as an external heat component affect the exposed facings according to their orientation in relation to the sun movement. Within the pursued modelling concept, the sun radiation is assumed phenomenological without a sepa-ration in respect of the faces and focus is on the correct formulation for the horizon-tal RCC surfaces. The implementation of the sun radiation into the thermal model is achieved implicitly by adding the global sun radiation heat flux, composed of shortwave direct and diffuse radiation, to the average daily ambient air temperature as a daily lump-sum temperature. This results in an effective ambient temperature

168
(Eq. 6-1), which is then utilised as modified ambient boundary conditions for all free surfaces in the thermal model.
radambeffamb TTT Δ+=, Eq. 6-1
with Tamb,eff Tamb ΔTrad
Effective ambient temperature [°C] Ambient temperature [°C] Temperature lump-sum from solar radiation [K]
A procedure for the determination of the solar radiation heat flux acting on an arbi-trarily oriented and inclined surface at each day of the year in connection with the earth’s movement is presented by van Breugel and Koenders (2001). This proce-dure is applied and further extended with regard to the pre-construction thermal stress analysis performed in this thesis.
Direct solar radiation
The direct solar radiation qS,dir [W/m2] on an arbitrarily oriented surface can be computed according to Equation 6-2, which is accompanied by Figure 6-1 indicat-ing the involved model parameters.
Inclined surface
Orientation South
iqS
n
h
α
Ψn
East
Ψ0
hSouth
Azimuth
Solar elevation
Horizon
a) Inclined surface b) Earth‘s azimuth and solar elevation Fig. 6-1: Schematic representation of the inclined surface, the earth’s azimuth
and solar elevation (acc. to van Breugel and Koenders 2001).
iqq mdirS cos, ⋅= Eq. 6-2

169
with qS,dir qm i
Direct solar radiation heat flux on arbitrarily ori-ented surface [W/m2] Direct solar radiation heat flux on earth’s surface [W/m2] Angle of incidence with normal to surface [°]
The angle of incidence i [°] is derived from the geometrical configuration of the surface, earth and sun in relation to each other and the time (Eq. 6-3 with Eq. 6-4 to 6-8).
Ψ⋅⋅+⋅= coscossinsincoscos hhi αα Eq. 6-3
with α h Ψ
Surface inclination relative to horizontal plane [°] Solar elevation [°] Differential azimuth[°]
nΨ−Ψ=Ψ 0 Eq. 6-4
with Ψ0 Ψn
Solar azimuth [°] Azimuth of surface normal projection on horizontal plane [°], Ψn = 0° for surface south-orientation, Ψn positive when counting anticlockwise
hcossincossin 0
Ω⋅=Ψ δ Eq. 6-5
with δ Ω
Sun declination [°] Hour angle of the sun [°]
The hour angle of the sun Ω [°] represents the actual orientation of the earth in re-spect to the sun implying that the earth turns 15° further every hour. The hour angle is positive when counted clockwise and is starting at midnight.
t⋅=Ω 15 Eq. 6-6
with t Time of the day acc. to solar time [h], t = 0h at noon, t = [-12h ; 12h]

170
( ))sin(033.0871.4sin39782.0sin dd ⋅⋅+⋅+⋅= ηηδ Eq. 6-7
with η d M D
2π / 360 [-] Day label [-], d = 30⋅(M - 1) + D Month number [1...12] Day number [1...31]
Ω⋅⋅+⋅= coscoscossinsinsin δϕδϕh Eq. 6-8
with ϕ Earth latitude [°], ϕ = [-90° ; 90°]
Equation 6-8 finally enables the computation of the solar radiation heat flux on the earth’s surface qm [W/m2] according to Equation 6-9. The Linke turbidity TL char-acterises the radiation absorption due to pollution of the atmosphere or clouds and is lower with clearer atmosphere. For first estimations, a Linke turbidity of 4 to 5 gives good results.
⎟⎠⎞
⎜⎝⎛
⋅+−⋅=
hTqq L
m sin4.99.0exp0 Eq. 6-9
with q0 TL
Solar constant = 1367 W/m2 Linke turbidity [-], TL = [4;7], in extreme cases TL = [2.5;10]
Diffuse solar radiation
The diffuse solar radiation heat flux on an arbitrarily oriented and inclined surface is computed according to Equation 6-10 (Lopes-Madaleno 2002).
GdiffdiffS eqq ⋅=, Eq. 6-10
with qS,diff qdiff eG
Diffuse solar radiation heat flux on arbitrarily ori-ented and inclined surface [W/m2] Diffuse solar radiation heat flux on arbitrarily ori-ented surface [W/m2] Irradiation factor [-]

171
( ) hqqq mdiff sin31
0 ⋅−⋅= Eq. 6-10
( )αcos15.0 +⋅=Ge Eq. 6-11
Global solar radiation
The global radiation is generally assumed as the sum of direct and diffuse radiation.
diffSdirSglobS qqq ,,, += Eq. 6-12
with qS,glob
Global solar radiation heat flux on arbitrarily ori-ented and inclined surface [W/m2]
Effective ambient temperature
The global radiation heat flux together with a certain mass of concrete, which is assumed to be influenced by the solar radiation or a diurnal ambient temperature cycle, respectively, can be translated into a supplemental absolute temperature value according to Equation 6-13. In this context it is presumed that the diurnal tempera-ture variation penetrates by only 20 cm into the facings. The resulting temperature supplement ΔTrad [K] is derived from the daily global solar radiation energy QS,glob [J/m2].
2.0
12
12,
,
⋅⋅=
⋅=Δ
∫−
ρc
dtq
mcQ
T
h
hglobS
globSrad Eq. 6-13
with QS,glob qS,glob c m ρ t
Global solar radiation energy [J/m2] Global solar radiation heat flux [W/m2] Specific heat of concrete [J/kg.K] Superficial concrete mass of 1 m2 [kg], m = 0.2⋅ρ for assumed characteristic penetration depth of di-urnal temperature cycle of 0.2 m Concrete specific weight [kg/m3] Time of the day acc. to solar time [h]
Figure 6-2 shows the suitability of the presented solar radiation model by compar-ing the modelled data with measured global solar radiation values (horizontal plane,

172
date in Fig. 6-2 represents a place holder) from a meteorological station in Germany (IBP Holzkirchen, http://www.hoki.ibp.fhg.de/ as of April 2004). The meteorologi-cal station monitors solar radiation heat fluxes, which have been transferred to solar radiation energies for reasons of comparison (calibration by adjusting the Linke tur-bidity).
0
500
1000
1500
15.12.00 15.03.01 13.06.01 11.09.01 10.12.01
Date
Sol
ar ra
diat
ion
ener
gy [k
J/m
²]
global radiationenergy (IBP)
diffuse radiationenergy (IBP)
IBP:Earth latitude: 47.87°
Model:Linke turbidity: 6
Radiation on horizontalplane
global radiationenergy (model)
diffuse radiationenergy (model)
Fig. 6-2: Comparison of modelled and measured global and diffuse solar radia-
tion energies (measurements from http://www.hoki.ibp.fhg.de/ as of April 2004).
Figure 6-2 reveals the basic adequacy of the solar radiation model, which actually gives global solar radiation energies at the upper limit of the monitored ones. This is due to the fact that the model does not consider the real sunshine hours per day. Nevertheless, for the prediction of the solar radiation in arid countries like Jordan, the resulting values are satisfying reasoned by the mostly clear weather in particular during the dry seasons. Figure 6-3 presents the application of the radiation model and the computation of the effective ambient temperature according to Equation 6-1 in comparison with DFOT recordings gained at Mujib Dam.
Figures 6-2 and 6-3 actually show the good agreement between the computed data and the real recordings, proofing the applicability of the proposed model as an im-portant part in the pre-construction thermal stress analysis of RCC dams.

173
5
10
15
20
25
30
35
40
45
01.01.2001 27.12.2001 22.12.2002 17.12.2003Date
Tem
pera
ture
[°C
]Mujib Dam downstreamfacecomputed effective ambienttemperature
Ambienttemperature
Comparison between modelled effective ambient temperature and DFOT data at the downstream facing of Mujib Dam (St. 0+914.3).
Model:
Earth latitude ϕ: 31.4°Surface inclination α: ~51°Azimuth of surface normal Ψn: ~240°Linke turbidity L: 4 (clear sky)
149.7 masl
Fig. 6-3: Comparison of modelled effective ambient temperature and typical
DFOT measurements at the downstream facing of Mujib Dam.
6.1.5 Surface heat transfer coefficients
Surface heat transfer coefficients or film coefficients h [W/m2.K] have to be consid-ered in conjunction with the boundary conditions for the computation of the tem-perature fields. It is applied to all exposed surfaces in order to account for convec-tion effects at the surfaces. In the case of the thermal analysis of an RCC dam under construction the film coefficient represents the convective heat exchange between the dam facing and the air or the insulation effect of the formwork, respectively.
Tatro et al. (2000) give equations for the prediction of film coefficients in depend-ence of occurring wind speeds in absence of formwork (Eq. 6-14, 6-15).
hkmh /5.17vv6362.2 8.0 <⋅= Eq. 6-14
hkmh /5.17vv086.1622.5 >⋅+= Eq. 6-15
with h v
Surface heat transfer coefficient [W/m2.K] Wind speed [km/h]
For an average wind speed over the year of roughly 15 km/h (typical for Amman), which can also be assumed at Mujib Dam, the film coefficient h results to 23 W/m2.K.
174
Equations for the prediction of the film coefficients in presence of formwork are also held in Tatro et al. (2000), but will not be presented here, since insulation ef-fects due to the formwork at the dam facings are not considered in the utilised ther-mal stress model.
6.1.6 RCC placement schedule
The RCC placement schedule for the construction of the complete dam is the deci-sive construction parameter and has to be well assumed in terms of a proper nu-merical analysis for structural studies within the dam design phase. The placement schedule actually acts as the liaison between the dam under construction and the ambient conditions and represents the timetable for the activation of the initial con-ditions and the successive boundary conditions. Within high-level thermal stress studies prior to the dam construction, the prediction of placement schedule is based on the delivery capacity of the RCC mixing plant [m3/h], the layer thickness and volume of the single RCC layers, further on working hours, number of shifts, public holidays and possible construction sequences, if the dam is divided into separate construction phases. Especially the latter is the crucial element in respect of the de-termination of the occurrence and duration of logical placement breaks, which tre-mendously influence the temperature and so the stress fields in the dam.
The real placement schedule followed at Mujib Dam (Fig. 5-12) and various fictive ones have been applied in the numerical thermal stress model, without the consid-eration of construction equipment performance. The prediction of the placement schedule in the frame of construction planning is not further discussed here.
6.2 Model characteristics and set-up
The analysis concept is based on the coupling degrees C and D according to Ta-ble 4-1, relying on two separated models. In a first step the transient solution of the temperature fields is performed. The strains and stresses according to the tempera-ture field evolution from the first step are computed within a subsequent time-step analysis. The coupling degree D refers to the implementation of the material and environmental conditions as effective average values. This especially applies to the utilised material law, the methodology of the thermal strain computation and the consideration of the effective Young’s modulus evolution. The relation between the concrete maturity and the evolution of the concrete properties has been neglected in the model, which additionally stresses the simplified character of the presented model.

175
General model features
Both 2D and 3D models have been set up for the thermal as well as for the struc-tural analysis. In order not to run into inconsistencies when transferring the thermal model to the structural model, the applied set-up of the geometric entities and the applied time steps are equal for the models within the 2D case and the 3D case. Ta-ble 6-2 in conjunction with Figure 6-4 present the general model features.
Tab. 6-2: General features of the FEM-models set up in the study.
Feature 2D-model 3D-model
Dam construction
• Consideration of the inspection gallery • CVC facing domain and RCC dam body domain • Activation of each single RCC layer and corre-
sponding initial and boundary conditions accord-ing to the placement schedule (evolutionary layer-by-layer construction process)
Element height 1 RCC layer = 1 element
= 30 cm / element 1 RCC layer = 2 elements
= 15 cm / element Element width at facings 50 cm CVC = 1 element 50 cm CVC = 2 elements
Time steps • During hydration (= construction time + 60 d):
1 time step = 24 h • After end of hydration: 1 time step = 10 d
Foundation domain 30 m up- and downstream of the dam, depth of 30 m
b) Applied mesh of 3D modelsa) Applied mesh of 2D models
0 1 2m 0 1 2m
Fig. 6-4: Discretisation of Mujib Dam for 2D and 3D models (gallery section).

176
Thermal model
Figure 6-5 presents the schematic set-up of the boundary conditions applied in the 2D and 3D thermal models. Since a longitudinal heat flow parallel to the dam axis is generally excluded in gravity dams (see also Chapter 5), adiabatic boundaries are introduced at the monolith free ends. In terms of the computation of temperature fields during the construction of an RCC gravity dam a 2D thermal model is princi-pally suitable.
The boundary conditions in terms of the film coefficients at the free surfaces are applied as one constant value h [W/m2.K] for the complete simulation (no explicit consideration of formwork). The horizontal surface of an RCC layer holds the film coefficient as long as it is exposed to ambient conditions. It is switched to conduc-tive heat transport at the element boundaries when the surface is covered. The boundary condition at the exposed surfaces acting in conjunction with the convec-tive heat flow is the effective ambient temperature Tamb,eff [°C] to also account for radiation effects.
The placement temperature is the only initial condition to be considered for RCC and CVC layers in the thermal model.
RCCConduction
FoundationConduction
ConvectionConvection
X
Y
Adiabaticboundaries
Convection
a) 2D-model b) 3D-model
Convection
RCC
Conduction
Foundation
Conduction
Pla
ne o
fsym
met
ry =
Adia
batic
bou
ndar
y
X
Y
Z
Adiabaticboundaries
Convection
Fig. 6-5: Applied thermal models and thermal boundary conditions.

177
Structural model
Figure 6-6 shows the boundary conditions applied in the 2D and 3D structural mod-els. The structural boundary conditions for the foundation domain are equal in both models. The foundation domain is free to move only in the vertical (y-) direction above the bottom of the rock domain, which is fixed by pins at each node also in y-direction.
The structural boundary conditions of the dam or monolith to be simulated are dif-ferent in the two models. The 2D structural model is based on a plane-strain bound-ary condition, which is typically used for the analysis of gravity dams when a more central dam portion, trapped in between adjacent monoliths, is investigated. How-ever, the plane-strain assumption, preventing the deformations in z-direction (cross valley direction), within the thermal stress analysis is successively discussed. The 3D model represents the simulation of a full dam monolith, which is characterised by two front ends. In order to reduce the computational effort of the 3D simulation, a plane of symmetry is introduced, which bisects the monolith. Due to the symme-try, cross valley deformations are kept at zero at the plane of symmetry. At the monolith end, which represents the contraction or transversal joint, the monolith is free to deform, thus, allowing the consideration of a different extreme boundary condition in comparison with the plane-strain condition.
RCC
Foundation
U Z= 0
Plane of symmetry
U Z= 0
X
Y
Z
Monolith endUZ = 0
RCC
Foundation
X
Y
Plane strainUZ = 0
a) 2D-model b) 3D-model Fig. 6-6: Applied structural models and structural boundary conditions.
The structural models work with a linear-elastic material law, which is substantiated by the presented investigations of the stress-strain behaviour of RCC conducted at

178
Mujib Dam (Chapter 4.2.4, Fig. 4-22). The materials are further assumed as ho-mogenous and isotropic. Since it is assumed that compressive stresses will not ex-ceed 40 % of the compressive strength at each point of time and that the stress-strain relations in tension appear linear until failure, linear stress-strain-curves have been implemented into the model. The slope of the curves changes with certain concrete ages and is represented by the effective Young’s modulus in order to con-sider relaxation effects. The slope is kept constant for the periods in between the concrete ages at which the effective elastic modulus is switched. This is valid for RCC and CVC. Figure 6-7 depicts the stress-strain input for the structural models and according concrete ages at which the curves are switched.
0
3
6
9
12
15
0 0.01 0.02 0.03 0.04
Strain ε [-]
Stre
ss σ
[MP
a]
6 h12 h24 h3 d7 d28 d90 d180 d365 d
Fig. 6-7: Input of stress-strain-curves for the ANSYS structural model.
The computation of thermal strains εth [-] from appearing temperature differences ΔT [K] in ANSYS is based on following Equation 6-16, in which ANSYS asks for a reference temperature Tref [°C], which is at the same time the initial condition to be input for each RCC layer including the CVC facings.
)( refTTth TTT −⋅−=Δ⋅−= ααε Eq. 6-16
with εth αT T Tref
Thermal strain [-] Coefficient of thermal dilatation [K-1] Actual temperature [°C] Reference temperature [°C]
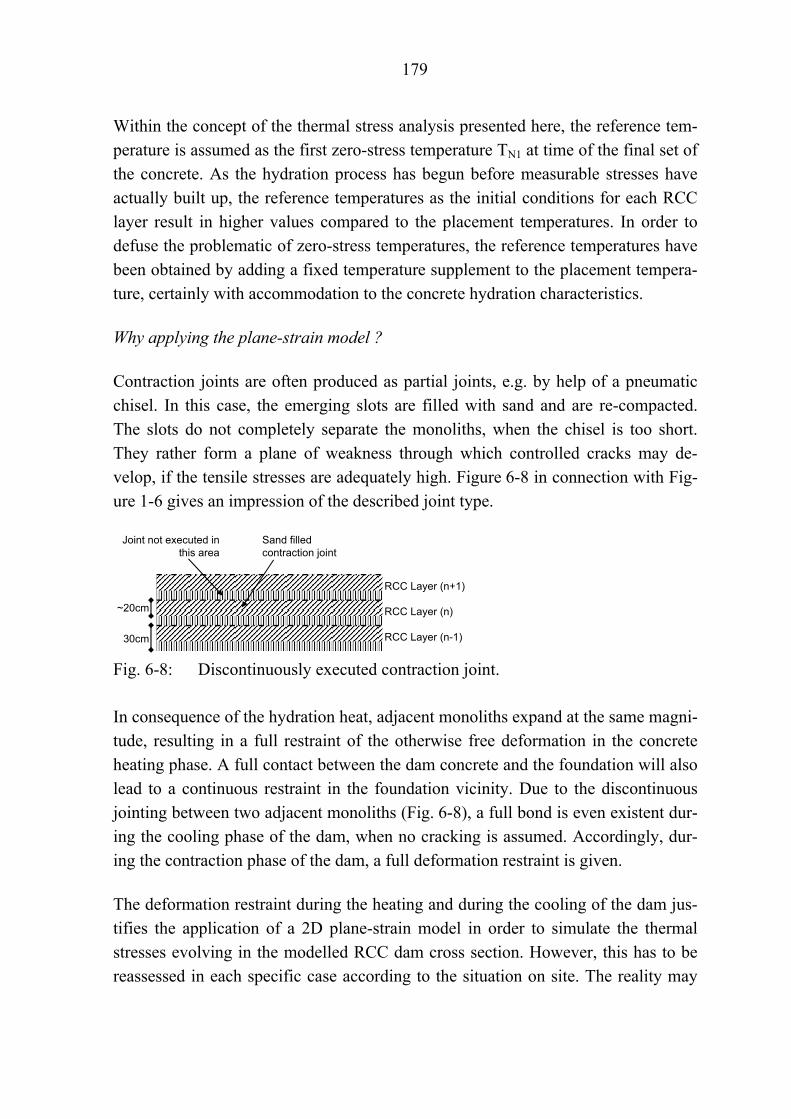
179
Within the concept of the thermal stress analysis presented here, the reference tem-perature is assumed as the first zero-stress temperature TN1 at time of the final set of the concrete. As the hydration process has begun before measurable stresses have actually built up, the reference temperatures as the initial conditions for each RCC layer result in higher values compared to the placement temperatures. In order to defuse the problematic of zero-stress temperatures, the reference temperatures have been obtained by adding a fixed temperature supplement to the placement tempera-ture, certainly with accommodation to the concrete hydration characteristics.
Why applying the plane-strain model ?
Contraction joints are often produced as partial joints, e.g. by help of a pneumatic chisel. In this case, the emerging slots are filled with sand and are re-compacted. The slots do not completely separate the monoliths, when the chisel is too short. They rather form a plane of weakness through which controlled cracks may de-velop, if the tensile stresses are adequately high. Figure 6-8 in connection with Fig-ure 1-6 gives an impression of the described joint type.
RCC Layer (n-1)
RCC Layer (n)
RCC Layer (n+1)
~20cm
Joint not executed inthis area
Sand filledcontraction joint
30cm
Fig. 6-8: Discontinuously executed contraction joint.
In consequence of the hydration heat, adjacent monoliths expand at the same magni-tude, resulting in a full restraint of the otherwise free deformation in the concrete heating phase. A full contact between the dam concrete and the foundation will also lead to a continuous restraint in the foundation vicinity. Due to the discontinuous jointing between two adjacent monoliths (Fig. 6-8), a full bond is even existent dur-ing the cooling phase of the dam, when no cracking is assumed. Accordingly, dur-ing the contraction phase of the dam, a full deformation restraint is given.
The deformation restraint during the heating and during the cooling of the dam jus-tifies the application of a 2D plane-strain model in order to simulate the thermal stresses evolving in the modelled RCC dam cross section. However, this has to be reassessed in each specific case according to the situation on site. The reality may

180
be in between the results delivered by the 2D and the 3D structural models pre-sented in Figures 6-5 and 6-6.
6.3 Case study Mujib Dam
6.3.1 Assessment of the modelling methodology
The thermal stresses in the Mujib Dam have been simulated according to the model-ling concept described so far. In the frame of the evaluation of the modelling meth-odology, the 2D and 3D thermal and structural models have been utilised as above specified. To reduce time consumption for the model calibration, only the 2D mod-els have therefore been applied. The extensive DFOT and Stressmeter measure-ments at dam station 0+914.3 have been consulted for calibration and comparison.
The basic construction period for the evaluation has been the Mujib Dam RCC placement schedule of Block D (dam station 0+887.5 to 0+942.5, Fig. 5-12) until the end of the placement break at dam elevation 181.5 masl (respective modelling period of approx. 720 days). The corresponding environmental conditions have been assumed according to the described on-site data and the described procedures.
With regard to the model conception and the phenomenological consideration of the most involved parameters, the calibration of the thermal model was tied up to the conditions of best-fitting the measured temperature histories in the dam centre and in the dam facings. Focus was on the heating rates after concrete placement, the maximum temperatures and the cooling rates after passing the temperature maxi-mum. In order to keep the calibration effort within a certain limit, the best-fit was primarily tried to be achieved close to the foundation (DFOT 144.3 masl) and in the maximum temperature zone (DFOT around 156.0 masl). The calibration of the structural model was done on the basis of the Stressmeter recordings at dam eleva-tions 144.0and 154.5 masl and just refers to the trimming of the Poisson’s ratio. In below comparisons, it is exclusively referred to the cross-valley stresses parallel to the dam axis (Z-direction in the model), corresponding to the measurement direc-tion of the Stressmeters (compare Chapters 5.1.2 and 5.2.1). Table 6-3 gives an overview on the applied parameters after the model calibration.
The prediction of the exact point of time of a thermal crack event is disregarded in the context of the model evaluation. The major attention is given to the values of maximum tensile stresses and the fact of a crack occurrence.

181
Tab. 6-3: Calibrated model parameters of the Mujib Dam FEM-model.
Item Parameter
Hydration heat generation
• Unique hydration heat generation of RCC and CVC domain
• Assumed end of hydration after 60 days • see Fig. 6-9
Specific weight • RCC, CVC ρ = 2540 kg/m3 • Limestone foundation ρ = 2600 kg/m3
Thermal conductivity • RCC, CVC λ = 1.9 W/m.K • Limestone foundation λ = 2.6 W/m.K
Specific heat • RCC, CVC c = 920 J/kg.K • Limestone foundation c = 900 J/kg.K
Foundation temperature • Uniform temperature of 23 °C for rock domain
Film coefficient • One constant film coefficient for all exposed sur-
faces h = 15 W/m2.K
Placement temperature • Equal placement temperature for RCC and facing
CVC acc. to real site conditions • see Fig. 5-18
Ambient conditions
• Mean diurnal ambient temperature cycle corre-sponding to model time step acc. to Fig. 5-11
• Consideration of sun radiation by ΔTrad = +5 K for 01.05 – 30.09. and ΔTrad = +2 K for the rest of the year derived from Eq. 6-13 for a horizontal surface
Thermal dilatation • RCC αT = 8.1⋅10-6 K-1 • CVC αT = 9.0⋅10-6 K-1 • Limestone foundation αT = 6.0⋅10-6 K-1
Poisson’s ratio • RCC ν = 0.19 • CVC, Limestone foundation ν = 0.2
Young’s modulus
• Consideration of the effective Young’s modulus • Implicitly considered by implementation of time
dependent stress-strain-curves unique for RCC and CVC valid in compression and tension
• see Fig. 6-9 • Limestone foundation Erock = 20 GPa
Reference temperature • RCC Tref = placement temperature + 1 K • CVC Tref = placement temperature + 3 K
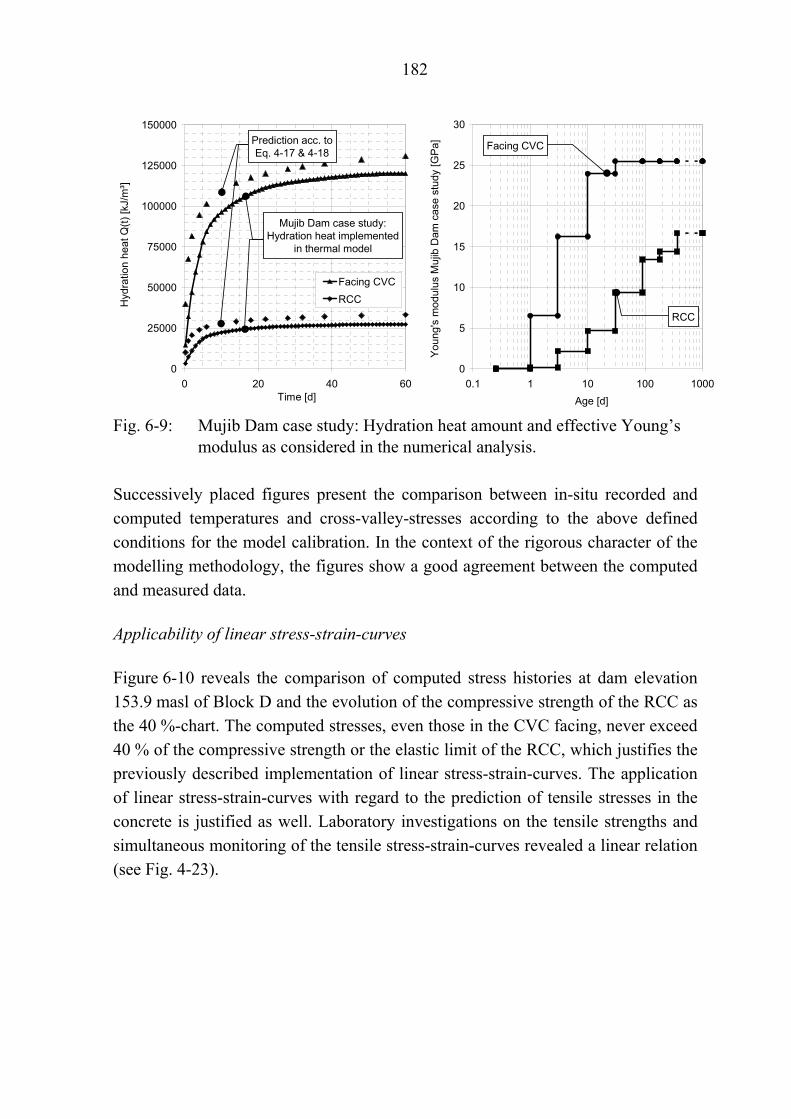
182
0
5
10
15
20
25
30
0.1 1 10 100 1000Age [d]
Youn
g's
mod
ulus
Muj
ib D
am c
ase
stud
y [G
Pa]
0
25000
50000
75000
100000
125000
150000
0 20 40 60Time [d]
Hyd
ratio
n he
at Q
(t) [k
J/m
³]
Facing CVCRCC
Facing CVCPrediction acc. toEq. 4-17 & 4-18
Mujib Dam case study:Hydration heat implemented
in thermal model
RCC
Fig. 6-9: Mujib Dam case study: Hydration heat amount and effective Young’s
modulus as considered in the numerical analysis.
Successively placed figures present the comparison between in-situ recorded and computed temperatures and cross-valley-stresses according to the above defined conditions for the model calibration. In the context of the rigorous character of the modelling methodology, the figures show a good agreement between the computed and measured data.
Applicability of linear stress-strain-curves
Figure 6-10 reveals the comparison of computed stress histories at dam elevation 153.9 masl of Block D and the evolution of the compressive strength of the RCC as the 40 %-chart. The computed stresses, even those in the CVC facing, never exceed 40 % of the compressive strength or the elastic limit of the RCC, which justifies the previously described implementation of linear stress-strain-curves. The application of linear stress-strain-curves with regard to the prediction of tensile stresses in the concrete is justified as well. Laboratory investigations on the tensile strengths and simultaneous monitoring of the tensile stress-strain-curves revealed a linear relation (see Fig. 4-23).

183
144.00
145.80 145.80
163.50DC
-6
-4
-2
0
220.06.01 17.12.01 15.06.02 12.12.02
Date
Stre
ss [M
Pa]
2D structural model evaluation
40% of compressive strength vs. modelled stresses in facing CVC, upstream and centre RCC
St. 0+914.3
153.9 masl40% fc(t) acc. to
Fig. 4-19 andfc(∞)=24.3MPa(Mujib RCC)
computed facing CVC
computed centre
computed facing RCC
cross-valley-stresses
Fig. 6-10: Mujib Dam case study: Evaluation of the 2D structural model by com-
parison of computed stress histories and the evolution of 40 % of the RCC compressive strength (Dam elev. 153.9 masl, station 0+914.3, Block D).
Evaluation for temperatures and stresses at the dam foundation
Figure 6-11 shows the computed temperatures and stresses in the upstream dam portion and in the dam centre of elevation 144.3 masl, the DFOT recordings at the corresponding locations and the Stressmeter measurements at elevation 144.0 masl until the breakdown of the Stressmeters. The comparison principally presents the good agreement of the thermal and structural model and the measurements close to the dam foundation. Divergences of the computed early temperatures from the measurements are visible, being mainly related to the assumptions of the surface heat transfer coefficient and the uniform foundation start temperature. A higher film coefficient would have enabled an intensified heat exchange at the temporary sur-face with the consequence of lower temperatures in the early age RCC. The differ-ences between the computed and measured stresses may be due to the differences in the temperature histories and the step-wise evolution of the concretes’ effective modulus of elasticity as decisive model input.

184
-1
0
1
Stre
ss [M
Pa]
10
15
20
25
30
35
29.01.01 26.02.01 26.03.01 23.04.01 21.05.01Date
Tem
pera
ture
[°C
]
St. 0+914.3
144.3 masl
2D model evaluation
DFOT elevation 144.3masl, Stress-meter at 144.0maslData from u/s facing and centre
computed upstream
DFOT upstreamDFOT centre
Breakdown ofStressmeters
computed centre
computed upstream
Stressmeter upstreamStressmeter centre
computed centre
144.00
145.80 145.80
163.50DC
cross-valley-stresses
Fig. 6-11: Mujib Dam case study: Evaluation of the 2D thermal and structural
model by comparison with DFOT and Stressmeter recordings 2.0 m from the upstream facing and at the dam centre (RCC) (Stressmeters, elev. 144.0 masl, DFOT elev. 144.3 masl, station 0+914.3, Block D).
Evaluation for temperatures and stresses in the maximum temperature zone
The comparison of the DFOT data at 1.0 m from the upstream and downstream fac-ings and the computed upstream temperatures at dam elevation 153.9 masl is de-picted in Figure 6-12. The simplified assumptions in respect of only one constant film coefficient and the derivation of the effective ambient temperatures on the ba-sis of a horizontal surface lead to the apparent differences of the temperature histo-ries, however, with a good correlation, especially regarding the matching of the maximum temperatures. The computed stress history in the RCC at the location of Stressmeter 2 perfectly fits the measurements after an RCC age of approximately
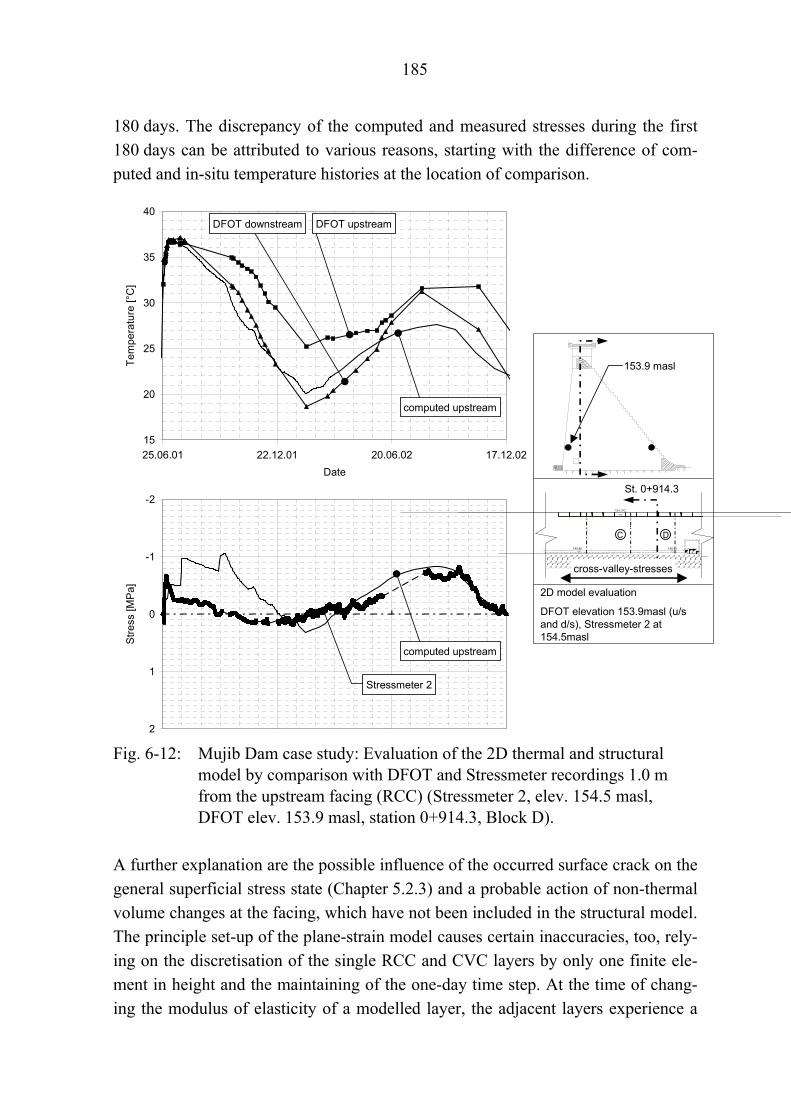
185
180 days. The discrepancy of the computed and measured stresses during the first 180 days can be attributed to various reasons, starting with the difference of com-puted and in-situ temperature histories at the location of comparison.
-2
-1
0
1
2
Stre
ss [M
Pa]
15
20
25
30
35
40
25.06.01 22.12.01 20.06.02 17.12.02Date
Tem
pera
ture
[°C
]
St. 0+914.3
153.9 masl
2D model evaluation
DFOT elevation 153.9masl (u/s and d/s), Stressmeter 2 at 154.5masl
computed upstream
DFOT upstreamDFOT downstream
Stressmeter 2
computed upstream
144.00
145.80 145.80
163.50DC
cross-valley-stresses
Fig. 6-12: Mujib Dam case study: Evaluation of the 2D thermal and structural
model by comparison with DFOT and Stressmeter recordings 1.0 m from the upstream facing (RCC) (Stressmeter 2, elev. 154.5 masl, DFOT elev. 153.9 masl, station 0+914.3, Block D).
A further explanation are the possible influence of the occurred surface crack on the general superficial stress state (Chapter 5.2.3) and a probable action of non-thermal volume changes at the facing, which have not been included in the structural model. The principle set-up of the plane-strain model causes certain inaccuracies, too, rely-ing on the discretisation of the single RCC and CVC layers by only one finite ele-ment in height and the maintaining of the one-day time step. At the time of chang-ing the modulus of elasticity of a modelled layer, the adjacent layers experience a

186
sudden property change at their upper and bottom boundaries within a relatively wide time step. Despite those rough model properties the structural computation shows moderate tensile stresses in the same magnitude as recorded by the Stress-meter, but delayed by approximately 1.5 months. The close prediction of the tensile stress value overrides the delayed matching of the value as a criteria for the evalua-tion of the structural model.
Figure 6-13 presents the computed and measured temperatures and cross-valley-stresses in the dam centre at elevation 153.9 masl.
-2
-1
0
1
2
Stre
ss [M
Pa]
15
20
25
30
35
40
25.06.01 22.12.01 20.06.02 17.12.02Date
Tem
pera
ture
[°C
]
St. 0+914.3
153.9 masl
Breakdown ofStressmeter 3
computed
2D model evaluation
DFOT elevation 153.9masl, Stress-meter at 154.5maslData from dam centre
computed
144.00
145.80 145.80
163.50DC
cross-valley-stresses
DFOT
Stressmeter 3
Fig. 6-13: Mujib Dam case study: Evaluation of the 2D thermal and structural
model by comparison with DFOT and Stressmeter recordings in the dam centre (RCC) (Stressmeter 3, elev. 154.5 masl, DFOT elev. 153.9 masl, station 0+914.3, Block D).

187
The 2D thermal and structural models both perfectly reflect the DFOT and Stress-meter readings. The computed stresses again show the distortion of the stress his-tory, when Young’s moduli are changed, however, closely following the measure-ments. Figure 6-13 is a principal proof of the quality of the presented empirical pre-dictions of environmental conditions and RCC properties, especially in terms of solar radiation and effective Young’s moduli (these parameters are a decisive model input and are not verified by in-situ values).
Figure 6-14 stresses the performance of the thermal model for the analysis of the dam interior temperatures as well as the superficial ones. The model works well during the early adiabatic temperature evolution and the maximum temperature pre-diction, when only the temporary free horizontal surface determines the heat trans-port. Due to the type of assumption of the solar radiation and the convective bound-ary condition at the facings, the measured and computed superficial temperatures diverge significantly.
20
25
30
35
40
45
25.06.01 22.12.01 20.06.02 17.12.02Date
Tem
pera
ture
[°C
]
2D thermal model evaluation
DFOT elevation 156.0masl:Data from dam centre and 2m from u/s and d/s facings
St. 0+914.3
156.0 masl
DFOT downstream
144.00
145.80 145.80
163.50DC
cross-valley-stressesDFOT upstream
DFOT centre
computed centre
computed upstream
Fig. 6-14: Mujib Dam case study: Evaluation of the 2D thermal model by com-
parison with DFOT recordings 2.0 m from the upstream facing and in the dam centre (RCC) (DFOT elev. 156.0 masl, station 0+914.3, Block D).
Evaluation for thermal cracking prediction
The computed cross-valley-stresses in the CVC facing of elevation 154.5 masl are compared to the Stressmeter recordings and the crack observation already described
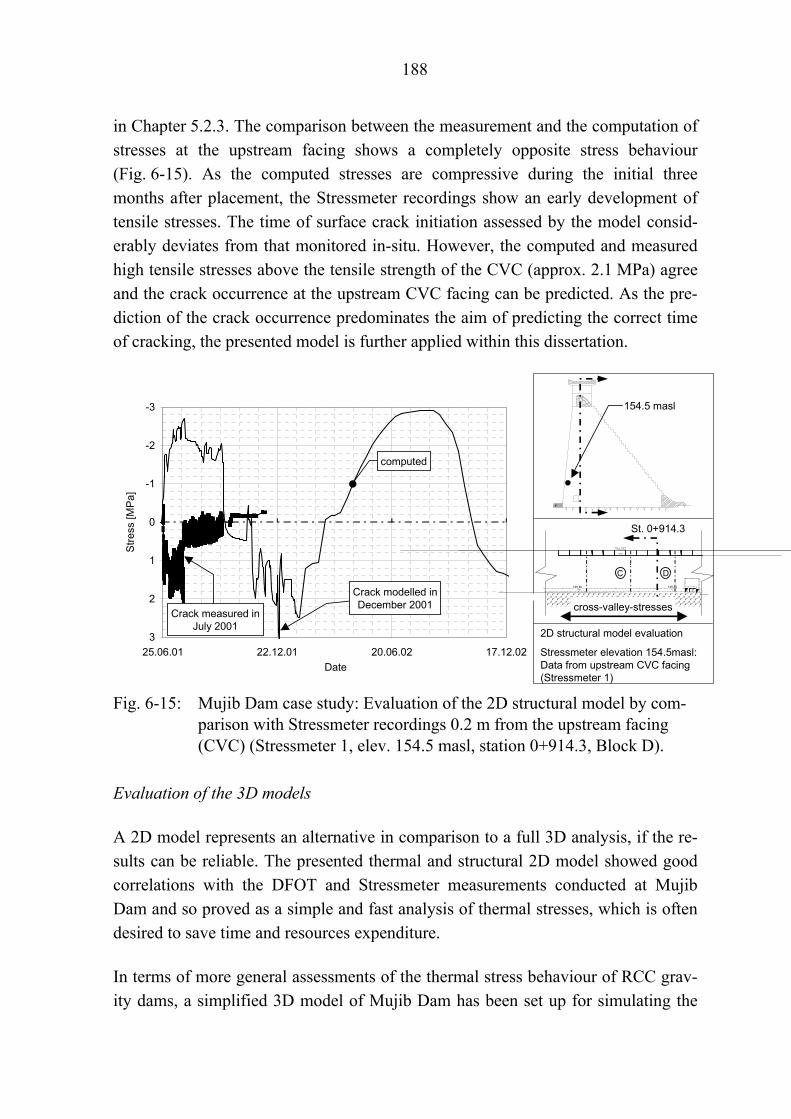
188
in Chapter 5.2.3. The comparison between the measurement and the computation of stresses at the upstream facing shows a completely opposite stress behaviour (Fig. 6-15). As the computed stresses are compressive during the initial three months after placement, the Stressmeter recordings show an early development of tensile stresses. The time of surface crack initiation assessed by the model consid-erably deviates from that monitored in-situ. However, the computed and measured high tensile stresses above the tensile strength of the CVC (approx. 2.1 MPa) agree and the crack occurrence at the upstream CVC facing can be predicted. As the pre-diction of the crack occurrence predominates the aim of predicting the correct time of cracking, the presented model is further applied within this dissertation.
-3
-2
-1
0
1
2
325.06.01 22.12.01 20.06.02 17.12.02
Date
Stre
ss [M
Pa]
2D structural model evaluation
Stressmeter elevation 154.5masl:Data from upstream CVC facing (Stressmeter 1)
St. 0+914.3
154.5 masl
computed
Crack measured inJuly 2001
Crack modelled inDecember 2001
144.00
145.80 145.80
163.50DC
cross-valley-stresses
Fig. 6-15: Mujib Dam case study: Evaluation of the 2D structural model by com-
parison with Stressmeter recordings 0.2 m from the upstream facing (CVC) (Stressmeter 1, elev. 154.5 masl, station 0+914.3, Block D).
Evaluation of the 3D models
A 2D model represents an alternative in comparison to a full 3D analysis, if the re-sults can be reliable. The presented thermal and structural 2D model showed good correlations with the DFOT and Stressmeter measurements conducted at Mujib Dam and so proved as a simple and fast analysis of thermal stresses, which is often desired to save time and resources expenditure.
In terms of more general assessments of the thermal stress behaviour of RCC grav-ity dams, a simplified 3D model of Mujib Dam has been set up for simulating the

189
thermal stresses resulting from the real construction conditions. The functionality of the 3D model has been controlled by comparing the temperature and stress results with the ones obtained from the 2D models. In the case of the structural model, the free monolith end (contraction joint) has been fixed in cross-valley direction in or-der to approach the plane-strain case. Figure 6-16 presents the comparison and the principle comparability of the two models. The different thermal models show al-most identical results at the surface and in the dam centre. Due to the slow heat conduction processes in the dam centre, the difference of element sizes in the two models (Tab. 6-2) has only minor effect. The difference in discretisation of the fac-ings may be the reason for the temperature differences visible in May 2001.
-2
-1
0
1
2
Stre
ss [M
Pa]
10
15
20
25
30
35
07.02.01 07.03.01 04.04.01 02.05.01 30.05.01Date
Tem
pera
ture
[°C
]
St. 0+914.3
144.3 masl
Comparison of 2D and 3D models
Dam elevation 144.3maslModel results at 40cm from u/s facing and dam centre
3D modelupstream facing
2D modelupstream facing
3D modeldam centre
2D modeldam centre
3D modelupstream facing
2D modelupstream facing
3D modeldam centre
2D modeldam centre
144.00
145.80 145.80
163.50DC
cross-valley-stresses
3D structural model fixedin cross-valley direction at the monolith free end
Fig. 6-16: Mujib Dam case study: Comparison of the 2D and 3D models (CVC,
RCC) (Dam elev. 144.3 masl, station 0+914.3, Block D).

190
Even with restrained cross-valley deformation, the structural boundary conditions of the two models do not correspond completely. The different deformation character-istics of the 2D and the 3D structural models in x-direction as a result of the intro-duction of a real monolith dimension in z-direction and the not completely compa-rable boundary conditions at the contraction joints may mainly cause the deviations of the stress histories computed at the dam facing.
6.3.2 Summary and valuation of the numerical models
The assumption of only one constant surface heat transfer coefficient h for all ex-posed surfaces and the adjustment of the temperature lump-sum from solar radiation ΔTrad for a horizontal plane lead to a model deficiency in terms of an accurate pre-diction of the facing temperatures. With regard to the solar radiation, a differentia-tion between upstream and downstream facing was not included. Nevertheless, a good agreement between DFOT data from the less radiated, cooler downstream fac-ing and the simulated facing temperatures is seen, as well as a good accordance be-tween measurement and simulation in the dam centre across the dam height. The resulting prediction of steeper gradients at the facings and higher temperature dif-ferentials between facings and dam interior will lead to an overestimation of crack-ing susceptibilities at the facings and consequently will be on the safe side.
The calibration of the 2D structural model for the prediction of thermally induced restraint stresses had to be done by the adjustment of the Poisson’s ratio only, which shows the high quality of the thermal model on the one side, and the prediction method for the effective modulus of elasticity Eeff on the other. The best fit between monitored and simulated cross-valley stresses was found close to the foundation and in the dam centre of the maximum temperature zone, where the assumed plane-strain condition in the 2D model meets the in-situ structural boundary conditions best. Simulated superficial cross-valley stresses deviate from the monitored ones particularly in the early concrete age as a possible result of the assumed plane-strain boundary condition and a coarse mesh resolution at the facings, in conjunction with initially in shorter intervals changing moduli of elasticity of the concrete. The simu-lated maximum tensile stresses and their time of occurrence showed satisfying agreement with the measurements in the RCC at one metre from the upstream fac-ing. The stress states could not be well simulated in the upstream CVC facing, where a monitored crack in the upstream CVC facing could be predicted by the 2D model only 6 months later. Certainly, the plane-strain condition does not comply with the in-situ conditions at an exposed surface of a real monolith, but the influ-
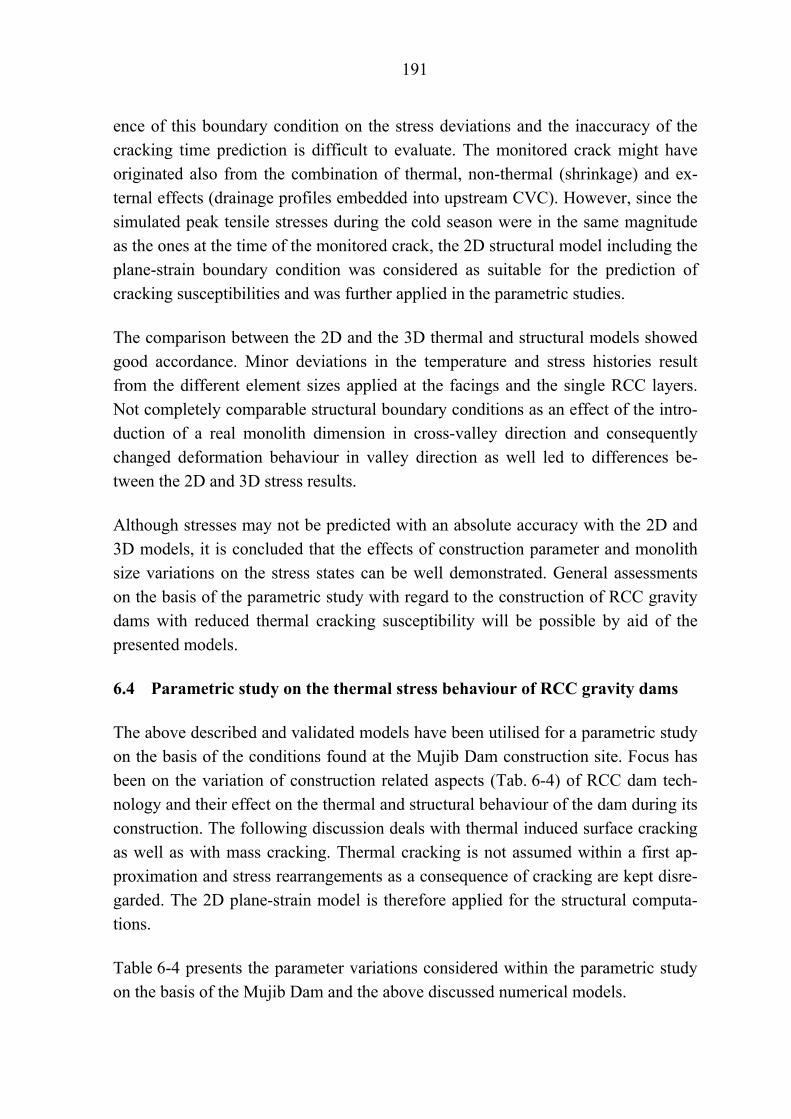
191
ence of this boundary condition on the stress deviations and the inaccuracy of the cracking time prediction is difficult to evaluate. The monitored crack might have originated also from the combination of thermal, non-thermal (shrinkage) and ex-ternal effects (drainage profiles embedded into upstream CVC). However, since the simulated peak tensile stresses during the cold season were in the same magnitude as the ones at the time of the monitored crack, the 2D structural model including the plane-strain boundary condition was considered as suitable for the prediction of cracking susceptibilities and was further applied in the parametric studies.
The comparison between the 2D and the 3D thermal and structural models showed good accordance. Minor deviations in the temperature and stress histories result from the different element sizes applied at the facings and the single RCC layers. Not completely comparable structural boundary conditions as an effect of the intro-duction of a real monolith dimension in cross-valley direction and consequently changed deformation behaviour in valley direction as well led to differences be-tween the 2D and 3D stress results.
Although stresses may not be predicted with an absolute accuracy with the 2D and 3D models, it is concluded that the effects of construction parameter and monolith size variations on the stress states can be well demonstrated. General assessments on the basis of the parametric study with regard to the construction of RCC gravity dams with reduced thermal cracking susceptibility will be possible by aid of the presented models.
6.4 Parametric study on the thermal stress behaviour of RCC gravity dams
The above described and validated models have been utilised for a parametric study on the basis of the conditions found at the Mujib Dam construction site. Focus has been on the variation of construction related aspects (Tab. 6-4) of RCC dam tech-nology and their effect on the thermal and structural behaviour of the dam during its construction. The following discussion deals with thermal induced surface cracking as well as with mass cracking. Thermal cracking is not assumed within a first ap-proximation and stress rearrangements as a consequence of cracking are kept disre-garded. The 2D plane-strain model is therefore applied for the structural computa-tions.
Table 6-4 presents the parameter variations considered within the parametric study on the basis of the Mujib Dam and the above discussed numerical models.

192
Tab. 6-4: Parameters and their variation in the parametric study.
Parameter Variation Comment Thermal RCC properties
Thermal conductivity λ λ1 = 1.8 W/m.K λ2 = 2.0 W/m.K λ3 = 2.2 W/m.K
± 10 % of the reference λ2
Specific heat c c1 = 830 J/kg.K c2 = 920 J/kg.K c3 = 1010 J/kg.K
± 10 % of the reference c2
Construction parameters
Construction start date D D1: 31.01.01 D2: 31.07.01
⇔ Winter start ⇔ Summer start
Placement speed v v1 = 10 cm/d v2 = 20 cm/d v3 = 30 cm/d
⇔ 1 layer per 3 days ⇔ 2 layers per 3 days ⇔ 1 layer per day
Placement break location L L1 = 146.1 masl L2 = 164.1 masl
⇔ 3 m above foundation ⇔ 21 m above foundation
Break extension E 0 E1 = 14 d E2 = 120 d
⇔ continuous placement ⇔ short placement suspension ⇔ season spanning break
Placement method HO SL
⇔ traditional horizontal layers ⇔ sloped layer method (3 m in
1 day, 9 days exposure)
Monolith size ∞ 15 m, 60 m
⇒ 2D plane-strain model ⇒ 3D model, free monolith ends
Facing method CVC, GEVRCC All other parameters and properties according to the Mujib Dam case study (Tab. 6-3)
Reference case for the parametric study: λ2, c2, D1, v2, 0, HO, ∞, CVC
The following sections present the results from the parametric variation of construc-tion start dates, placing speeds and locations of placement breaks. Additionally, the results from the simulations of the different placement technologies, facing methods and monolith sizes are shown.

193
The ratio of tensile stress to tensile strength R is the key value with regard to the comparison between the various parametric combinations. It is computed from the stress history in the dam and the tensile strength at a certain concrete age and fol-lows the principle depicted in Figure 3-7. A crack can be expected, if R reaches at 0.75 (Rostásy et al. 2001). Figure 6-17 shows the tensile strength evolutions of the Mujib Dam RCC and facing CVC as presented in Table 5-4. The tensile strength of the CVC is estimated from laboratory compressive strengths at concrete ages of 7 days (30 MPa) and 90 days (45 MPa). The tensile strengths are approximated by Equations 6-17 and 6-18.
( )69.0, 9exp2.1 −⋅−⋅= tf RCCt Eq. 6-17
( )55.0, 9.1exp9.2 −⋅−⋅= tf CVCt Eq. 6-18
with ft t
Tensile strength of RCC or CVC [MPa] Concrete age [d]
0
1
2
3
0.1 1 10 100 1000
Concrete age t [d]
Tens
ile s
treng
th [M
Pa]
Eq. 6-17, RCC
Laboratory RCC
Eq. 6-18, CVC
Estimated CVC
Fig. 6-17: Tensile strengths of Mujib RCC and facing CVC (acc. to López et al.
2003).
The computed temperature and cross-valley stress histories according to the para-metric study are presented in the Appendix. Only the maximum tensile stress to ten-sile strength ratio values are displayed subsequently. During the construction period and the early service time of an RCC gravity dam, those will predominantly appear
194
at the surfaces and primarily during cold seasons. The presented maximum values can so be attributed to the winter months.
Cracking evaluations were performed for the RCC at the location of the dam centre and for the CVC upstream facing at 0.4 m from the surface.
6.4.1 Variation of construction start date and placement speed
Two construction start dates and three placement speeds have been analysed (Tab. 6-4, Fig. 6-18), besides applying the reference parameters and Mujib Dam site conditions. The analysed cases within this section reflect continuous placement progresses up to the assumed top of the dam at elevation 181.5 masl.
140
145
150
155
160
165
170
175
180
185
190
01.01.01 30.06.01 27.12.01 25.06.02 22.12.02 20.06.03Date of Placing
Dam
Ele
vatio
n [m
AS
L]
Top of model 181.5 masl
Top of foundation 143.10 masl
Designation acc.to Tab. 6-4:
D1-v1-0
D1-v2-0
D1-v3-0
D2-v1-0
D2-v2-0
D2-v3-0
Fig. 6-18: Parametric study: Variation of construction start dates and placement
speeds.
Dam centre
Figure 6-19 shows the maximum tensile stress to tensile strength ratios in the RCC at the dam centre as a distribution over the dam height. RCC temperatures in the dam interior below dam elevation 177.6 masl have not cooled below the reference temperatures corresponding to the individual lower dam elevations. The RCC stresses at this dam portion are consequently in compression and no cracking can be expected during the simulated construction time. In order to assess probable mass cracking at those locations, the simulated time frame inevitably has to be extended.

195
St. 0+914.3
Parametric study
Variation of placement speed v andstarting date DMax. R of RCC at dam centre
144.00
145.80 145.80
163.50DC
144.6 masl
180.6 masl
0
0.5
1
1.5
144.
6
147.
6
150.
6
153.
6
156.
6
159.
6
162.
6
165.
6
168.
6
171.
6
174.
6
177.
6
180.
6
181.
5
Dam elevation [masl]
Max
. ten
sile
stre
ss to
tens
ile s
treng
th ra
tio [-
]
v1
v2
v3
Winter start D1
0
0.5
1
1.5
144.
6
147.
6
150.
6
153.
6
156.
6
159.
6
162.
6
165.
6
168.
6
171.
6
174.
6
177.
6
180.
6
181.
5
Dam elevation [masl]
Max
. ten
sile
stre
ss to
tens
ile s
treng
th ra
tio [-
]
v1
v2
v3
Summer start D2
R = 0.75
R = 0.75
Fig. 6-19: Parametric study: Maximum tensile stress to tensile strength ratios in
the dam centre RCC (winter and summer construction start, continuous placement progress).
Ambient temperature changes only affect the dam portions close to the exposed horizontal surface at 181.5 masl. Different maximum stress-to-strength ratios are visible at the upper dam portion, depending on the date of RCC placement and the subsequently occurring temperature falls at those elevations.
A continuous placement rate of 10 cm/d (v1) turns out to be most favourable in terms of minimising the thermal cracking risk at the top of the dam. A placement start in winter results in a placement of the upper dam portion in the following win-ter, with the consequence of minimal placement temperatures and minimal peak temperatures after hydration completion. A stress-to-strength ratio of almost 0.75 at

196
the top of the dam results from the same placement rate applied to a construction begin in summer.
The simulation of a continuous placement rate of 20 cm/d (v2) returns the maxi-mum stress-to-strength ratios within the presented parameter set. The modelled dam section can be completed within about 7 months at this placement rate. A construc-tion begin in winter leads to a completion in summer and vice versa. In the case of a winter start, the top exposed RCC considerably cools in the following winter, when the RCC tensile strength is already very developed, resulting in maximum values for R below 1.0. The top exposed RCC immediately cools after placement in the case of a summer construction start, when the RCC is still very young and the ten-sile strength is still low. Consequently, stress-to-strength ratios of up to 1.3 occur for this parameter combination.
The adoption of a placement rate of 30 cm/d (v3) delivers lower stress-to-strength ratios, compared to a placement speed of 20 cm/d. This difference is caused by the date of placement of the top dam portion. When those elevations are reached just prior to the hottest (winter start) or coolest time (summer start) of the year at 30 cm/d, they are placed exactly during these periods at a placement rate of 20 cm/d. The consequences for a placement speed of 30 cm/d are lower maximum RCC temperatures in the case of a winter start and a later tensile stressing of the top RCC in the case of a summer start.
Upstream facing
Maximum tensile stresses in the upstream facing seem to occur at the dam eleva-tions having been placed in the hot time of the year. Those elevations hold the peak interior temperatures and maximum temperature differentials between dam core and facing are created in the cold seasons during the dam construction and the early ser-vice time.
The tensile strength evolution of the facing CVC is adopted for the cracking evalua-tion depicted in Figure 6-20. Since the location of evaluation is at the upstream in-terface between CVC and RCC, this returns an optimistic assessment with respect to the cracking susceptibility of the RCC. If the tensile strength evolution of the RCC is applied for the cracking evaluation, more than doubled stress-to-strength ratios result. Within this dissertation it is assumed that a probable surface crack in

197
the CVC facing only propagates into the RCC, if a CVC cracking in the focussed interface is evaluated.
0
0.5
1
1.5
144.
6
147.
6
150.
6
153.
6
156.
6
159.
6
162.
6
165.
6
168.
6
171.
6
174.
6
177.
6
180.
6
Dam elevation [masl]
Max
. ten
sile
stre
ss to
tens
ile s
treng
th ra
tio [-
]
v1
v2
v3
0
0.5
1
1.514
4.6
147.
6
150.
6
153.
6
156.
6
159.
6
162.
6
165.
6
168.
6
171.
6
174.
6
177.
6
180.
6
Dam elevation [masl]
Max
. ten
sile
stre
ss to
tens
ile s
treng
th ra
tio [-
]
v1
v2
v3
St. 0+914.3
Parametric study
Variation of placement speed v andstarting date DMax. R of CVC at upstream facing
144.00
145.80 145.80
163.50DC
144.6 masl
180.6 masl
Winter start D1
Summer start D2
R = 0.75
R = 0.75
Fig. 6-20: Parametric study: Maximum tensile stress to tensile strength ratios in
the upstream CVC facing (winter and summer construction start, con-tinuous placement progress).
The adoption of a placement rate of 10 cm/d (v1) and the construction start in win-ter results in dam interior peak temperatures at around dam elevation 160 masl. Also maximum cracking potentials in the CVC facing are visible for this part of the dam (Fig. 6-20). As a stress-to-strength ratio of 0.75 is exceeded, a crack propaga-tion into the facing RCC can be assumed. Since the low and top dam portions are placed in cool seasons, the cracking through the facing can be excluded at these lo-cations. In case of a construction start in summer, two peak interior temperature zones develop in the dam, where placement is performed in warm seasons. Accord-
198
ingly, the maximum stress-to-strength ratios occur at the dam foundation and the top, however, exceeding the critical value of 0.75 only close to the foundation. Minimum concrete placement temperatures around mid height result in stress-to-strength ratios between 0 and 0.1.
A winter start and a placement performance of 20 cm/d (v2) result in R-values above 0.75 only at the top dam portion, where thermal cracking through the facing is likely. If a placement rate of 30 cm/d (v3) is adopted, cracking through the CVC facing can be avoided across the complete dam height. A different picture results from applying the same placement rates in the case of a construction start in sum-mer. For a placement rate of 20 cm/d, stress-to-strength ratios close to 0.75 can be seen from the foundation to dam elevation 159.6 masl, which are slightly decreasing towards the top. The simulated placement speed of 30 cm/d results in even severe values, which are indicating through cracking in the CVC facing up to dam eleva-tion 170 masl.
6.4.2 Variation of location of placement breaks
It has been observed within the DFOT campaigns and also in the thermal modelling (break E1 acc. to Tab. 6-4) that short placement breaks characterised by work sus-pension and resumption within the same season will not cause abnormally distorted vertical temperature distributions in the dam. Also the stress state will not vary sig-nificantly from that of the continuously placed dam. Consequently it has been con-centrated on season spanning placement breaks (E2 after Tab. 6-4), one 3 m (L1) the other 21 m (L2) above the foundation.
Placement break close to the foundation (L1)
Figure 6-21 presents the simulated placement schedules including a seasons span-ning placement break close to the dam foundation.

199
140
145
150
155
160
165
170
175
180
185
190
01.01.01 30.06.01 27.12.01 25.06.02 22.12.02 20.06.03Date of Placing
Dam
Ele
vatio
n [m
AS
L]
Top of model 181.5 masl
Top of foundation 143.10 masl
Designation acc.to Tab. 6-4:
D1-v1-L1-E2
D1-v2-L1-E2
D1-v3-L1-E2
D2-v1-L1-E2
D2-v2-L1-E2
D2-v3-L1-E2
Fig. 6-21: Parametric study: Placement schedules including break L1-E2.
Dam centre
Figure 6-22 shows the distribution of maximum stress-to-strength ratios in the dam centre along the dam height.
Generally, it can be seen that maximum stress-to-strength ratios appear at the tem-porary horizontal surfaces, when they are exposed to cool ambient temperatures. In the case of a construction start in winter the foundation close placement break lasts into the warm season, whereas a heat gain through ambient conditions occurs at the temporary horizontal surface. Consequently, for the construction start in winter and a placement resumption in the warm season, maximum stress-to-strength ratios can be evaluated only for the top of the dam. The peak values fall below those evaluated from the simulation of continuous placement rates and a summer start (Fig. 6-19), but thermal cracking in the uppermost exposed RCC can still be expected.
In case of a summer begin, the placement break reaches into the cold season, whereas the close to the foundation initially placed RCC is exhibited considerable cooling. Maximum stress-to-strength ratios additionally appear at the temporary placement break surface, however, thermal cracking in the RCC is not expected un-der the ambient conditions found at Mujib Dam, either at the temporary surface of the placement break or at the top of the dam.

200
0
0.5
1
1.5
144.
6
147.
6
150.
6
153.
6
156.
6
159.
6
162.
6
165.
6
168.
6
171.
6
174.
6
177.
6
180.
6
181.
5
Dam elevation [masl]
Max
. ten
sile
stre
ss to
tens
ile s
treng
th ra
tio [-
]
v1
v2
v3
0
0.5
1
1.5
144.
6
147.
6
150.
6
153.
6
156.
6
159.
6
162.
6
165.
6
168.
6
171.
6
174.
6
177.
6
180.
6
181.
5
Dam elevation [masl]
Max
. ten
sile
stre
ss to
tens
ile s
treng
th ra
tio [-
]
v1
v2
v3
St. 0+914.3
Parametric study
Variations for placement break L1 close to the dam foundationMax. R of RCC at dam centre
144.00
145.80 145.80
163.50DC
144.6 masl
180.6 masl
Winter start D1
Summer start D2
R = 0.75
R = 0.75
Break L1146.1 masl
Fig. 6-22: Parametric study: Maximum tensile stress to tensile strength ratios in
the dam centre (winter and summer construction start, placement break L1 close to the foundation).
Upstream facing
Figure 6-23 shows the distribution of maximum stress-to-strength ratios at the up-stream interface between CVC and RCC along the dam height.
The extended foundation near placement break acts as a delay of the construction start. In the case of a slow placement performance of 10 cm/d (v1), a construction begin in winter and a placement resumption in the warm season, the thermal stress behaviour resembles that of the dam started in summer and suspended until the cool season. Accordingly, minimum cracking susceptibility results for the mid height dam portion, when the dam is started in winter and RCC is placed at a rate of

201
10 cm/d. Maximum stress-to-strength values reaching 0.75 can be seen in the dam portions being placed in the summer seasons (above the placement break, close to the crest). In contrary, when the dam is started in the summer, minimum values oc-cur at these locations. Cracks propagating through the CVC facing can only be ex-pected close to the foundation, where placement takes place in the summer.
0
0.5
1
1.5
144.
6
147.
6
150.
6
153.
6
156.
6
159.
6
162.
6
165.
6
168.
6
171.
6
174.
6
177.
6
180.
6
Dam elevation [masl]
Max
. ten
sile
stre
ss to
tens
ile s
treng
th ra
tio [-
]
v1
v2
v3
0
0.5
1
1.5
144.
6
147.
6
150.
6
153.
6
156.
6
159.
6
162.
6
165.
6
168.
6
171.
6
174.
6
177.
6
180.
6
Dam elevation [masl]
Max
. ten
sile
stre
ss to
tens
ile s
treng
th ra
tio [-
]
v1
v2
v3
St. 0+914.3
Parametric study
Variations for placement break L1close to the dam foundationMax. R of CVC at upstream facing
144.00
145.80 145.80
163.50DC
Winter start D1
Summer start D2
R = 0.75
R = 0.75
144.6 masl
180.6 masl
Break L1146.1 masl
Fig. 6-23: Parametric study: Maximum tensile stress to tensile strength ratios in
the upstream CVC facing (winter and summer construction start, placement break L1 close to the foundation).
The placement suspension into the cooler season returns very favourable results in the cases of a summer construction start and a fast placement progress (20 and 30 cm/d). In these cases, the dam can be completed before the following hot season. Considerable cracking is expected only close to the dam foundation. The limit stress-to-strength ratio of 0.75 is noticeably under-run at the other dam elevations.
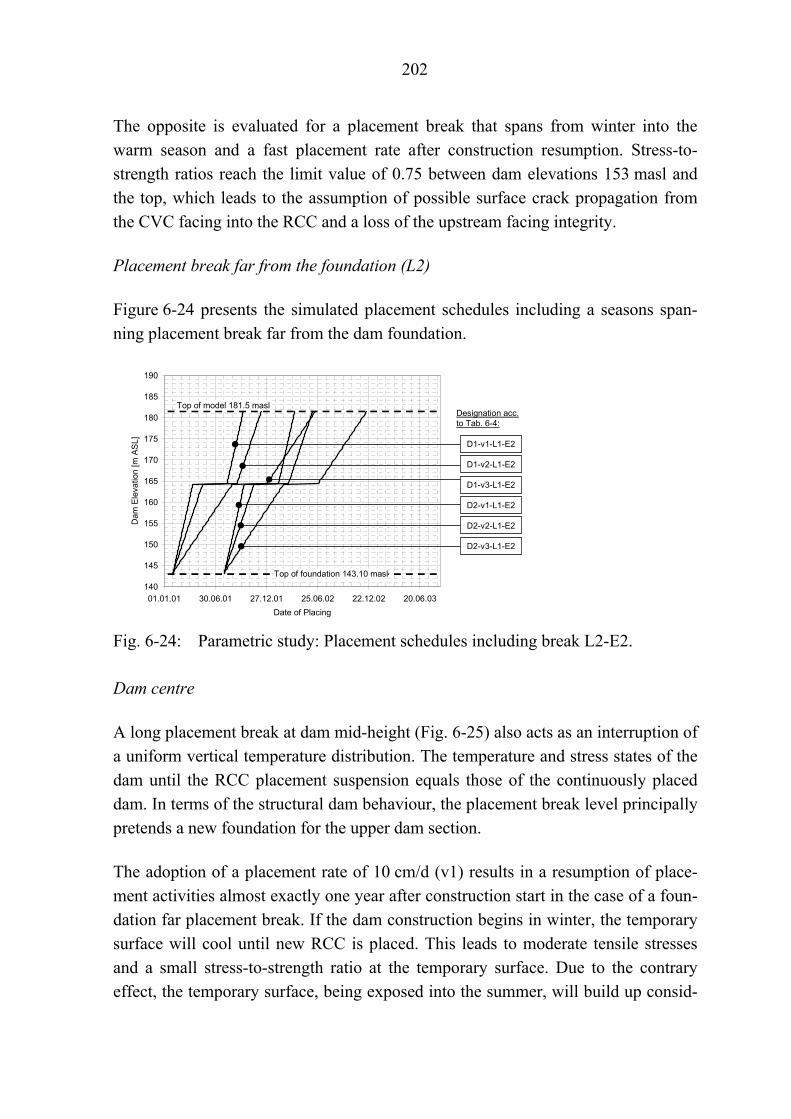
202
The opposite is evaluated for a placement break that spans from winter into the warm season and a fast placement rate after construction resumption. Stress-to-strength ratios reach the limit value of 0.75 between dam elevations 153 masl and the top, which leads to the assumption of possible surface crack propagation from the CVC facing into the RCC and a loss of the upstream facing integrity.
Placement break far from the foundation (L2)
Figure 6-24 presents the simulated placement schedules including a seasons span-ning placement break far from the dam foundation.
140
145
150
155
160
165
170
175
180
185
190
01.01.01 30.06.01 27.12.01 25.06.02 22.12.02 20.06.03Date of Placing
Dam
Ele
vatio
n [m
AS
L]
Top of model 181.5 masl
Top of foundation 143.10 masl
Designation acc.to Tab. 6-4:
D1-v1-L1-E2
D1-v2-L1-E2
D1-v3-L1-E2
D2-v1-L1-E2
D2-v2-L1-E2
D2-v3-L1-E2
Fig. 6-24: Parametric study: Placement schedules including break L2-E2.
Dam centre
A long placement break at dam mid-height (Fig. 6-25) also acts as an interruption of a uniform vertical temperature distribution. The temperature and stress states of the dam until the RCC placement suspension equals those of the continuously placed dam. In terms of the structural dam behaviour, the placement break level principally pretends a new foundation for the upper dam section.
The adoption of a placement rate of 10 cm/d (v1) results in a resumption of place-ment activities almost exactly one year after construction start in the case of a foun-dation far placement break. If the dam construction begins in winter, the temporary surface will cool until new RCC is placed. This leads to moderate tensile stresses and a small stress-to-strength ratio at the temporary surface. Due to the contrary effect, the temporary surface, being exposed into the summer, will build up consid-

203
erable compressive stresses after placement resumption. For a winter start, thermal cracking can be expected in the RCC of the dam crest. A minimum stress-to-strength ratio is evaluated for a summer start, when the dam will be completed in the winter time with the consequence of low RCC temperatures after hydration.
0
0.5
1
1.5
144.
6
147.
6
150.
6
153.
6
156.
6
159.
6
162.
6
165.
6
168.
6
171.
6
174.
6
177.
6
180.
6
181.
5
Dam elevation [masl]
Max
. ten
sile
stre
ss to
tens
ile s
treng
th ra
tio [-
]
v1
v2
v3
0
0.5
1
1.5
144.
6
147.
6
150.
6
153.
6
156.
6
159.
6
162.
6
165.
6
168.
6
171.
6
174.
6
177.
6
180.
6
181.
5
Dam elevation [masl]
Max
. ten
sile
stre
ss to
tens
ile s
treng
th ra
tio [-
]
v1
v2
v3
St. 0+914.3
Parametric study
Variations for placement break L2 far from the dam foundationMax. R of RCC at dam centre
144.00
145.80 145.80
163.50DC
144.6 masl
180.6 masl
Winter start D1
Summer start D2
R = 0.75
R = 0.75
Break L1164.1 masl
Fig. 6-25: Parametric study: Maximum tensile stress to tensile strength ratios in
the dam centre (winter and summer construction start, placement break L2 far from the foundation).
For faster placement rates (20 and 30 cm/d), no tensile stresses occur at the tempo-rary placement break surface, as no sufficient cooling occurs at this location until placement resumption. In the case of construction starts in summer and the comple-tion of the dam in the following spring, cracking in the RCC at the dam crest can be avoided. A placement begin in winter causes a dam completion in the following

204
autumn, when the commencing cool season effects a cooling of the RCC elevations around 181 masl. The corresponding tensile stressing of the early age RCC results in high stress-to-strength ratios at the dam crest in the case of a placement rate of 20 cm/d (v2) and considerable thermal cracking can be expected. At a placement rate of 30 cm/d (v3), the maximum tensile stress is at only 60 % of the according tensile strength. This is due to the further developed tensile strength at time of maximum tensile stressing of the RCC, compared to the 20 cm/d-case.
Upstream facing
The superficial stresses at the different dam elevations again reflect the date of placement of the according concrete and the location where high temperature differ-entials between dam core and exterior occur.
In the case of a winter construction start, a placement progress of 10 cm/d and the foundation far placement break taking place in summer (Fig. 6-26), a through-cracking in the upstream facing and a crack penetration into the RCC can be ex-pected at dam elevations 160.0 to 162.0 masl and 180.0 masl, where the interior peak temperature zones are located. The same parameters in combination with a construction start in summer result in severe surface cracking close to the founda-tion and high stress-to-strength ratios just above the placement break elevation of 165.6 masl.
The summer spanning placement break resulting from a construction start in winter and a adopted placement rate of 20 cm/d does actually not differ much from the conditions resulting from the continuous placement depicted in Figure 6-20. Tensile stresses reach the limit value of 75 % of the CVC tensile strength between dam ele-vations 159 to 171 masl. Especially in the dam location where the placement sus-pension has been implemented, through-cracks at the upstream facing can be ex-pected. Having started construction in the summer season, a more favourable tensile stress state results at the upstream facing with maximum CVC stress-to-strength ratios not exceeding 0.6. A crack propagation through the facing can be excluded.
Also in the case of a placement rate of 30 cm/d, the foundation far placement break and a construction start in winter, the tensile stress state at the upstream facing does not differ much from that of the continuously rising dam. A stress-to-strength ratio of about 70 % occurs above dam elevation 165 masl. Compared to the case of the continuously placed dam with construction begin in summer, the same schedule

205
with the foundation far placement break does not lead to through cracking in the upstream CVC facing above elevation 160 masl. Since the part of the dam above the placement break can be placed in the cool season, with the consequence of lower temperatures in the dam, the tensile stress state at the upstream facing turns out as more favourable for the upper dam portion.
0
0.5
1
1.5
144.
6
147.
6
150.
6
153.
6
156.
6
159.
6
162.
6
165.
6
168.
6
171.
6
174.
6
177.
6
180.
6
Dam elevation [masl]
Max
. ten
sile
stre
ss to
tens
ile s
treng
th ra
tio [-
]
v1
v2
v3
0
0.5
1
1.5
144.
6
147.
6
150.
6
153.
6
156.
6
159.
6
162.
6
165.
6
168.
6
171.
6
174.
6
177.
6
180.
6
Dam elevation [masl]
Max
. ten
sile
stre
ss to
tens
ile s
treng
th ra
tio [-
]
v1
v2
v3
St. 0+914.3
Parametric study
Variations for placement break L2 far from the dam foundationMax. R of CVC at upstream facing
144.00
145.80 145.80
163.50DC
Winter start D1
Summer start D2
R = 0.75
R = 0.75
144.6 masl
180.6 masl
Break L1164.1 masl
Fig. 6-26: Parametric study: Maximum tensile stress to tensile strength ratios in
the upstream CVC facing (winter and summer construction start, placement break L2 far from the foundation).
6.4.3 Variation of placement technology
The sloped layer method (see Chapter 1.3.1), as simulated in this parametric study, incorporates a uniform placement temperature for a 3 m lift. This actually forms the major difference in comparison to the conventional placing method for which an

206
individual placement temperature is kept for each single RCC layer. As ambient temperature variations (in particular during summer) also affect only the upper part of a 3 m lift, this fact can be of great advantage.
The sloped layer method can result in reduced overall interior dam temperatures compared to the traditional RCC placement. In the simulated cases, a temperature reduction of 1 to 2 K has been achieved, which is mainly an effect of lower placing temperatures during the hot placing season, compared to the ones applied with the conventional placing method. The reduced interior RCC temperatures can further be attributed to the extended exposure time of the sloped layer lift on the one side (hy-dration heat loss) and a reduced impact of the ambient conditions on the concrete mass during summer. However, the exposed horizontal surface at the top of the dam is more susceptible to thermal surface cracking, when the sloped layer method is applied (Fig 6-27 (top)), which is an effect of the present steeper temperature gradi-ents in the cold season.
The reduced temperature differential between dam interior and exterior shows its effect on the evolving tensile stresses in the upstream facing. In the case of the tra-ditional placement method and a continuous schedule with winter construction start (Fig. 6-27), higher stress-to-strength ratios in the CVC facing occur, compared to the ones created by the sloped layer method. Especially above elevation 170 masl, a favourable stress-to-strength ratio reduction to a maximum of about 0.5 can be ob-tained by the application of the sloped layer method. Cracking through the upstream facing is not expected.
In general respect to surface cracking in the upstream facing, the sloped layer method is more advantageous with the adoption of placement schedules starting in the cold season and showing a continuous progress. The cracking susceptibility in the facing and even the danger of severe crack propagation into the RCC can be observed with the sloped layer method and placement schedules incorporating a summer construction start (see Appendix).

207
0
0.5
1
1.5
144.
6
147.
6
150.
6
153.
6
156.
6
159.
6
162.
6
165.
6
168.
6
171.
6
174.
6
177.
6
180.
6
Dam elevation [masl]
Max
. ten
sile
stre
ss to
tens
ile s
treng
th ra
tio [-
]
v3
SL
0
0.5
1
1.5
144.
6
147.
6
150.
6
153.
6
156.
6
159.
6
162.
6
165.
6
168.
6
171.
6
174.
6
177.
6
180.
6
181.
5
Dam elevation [masl]
Max
. ten
sile
stre
ss to
tens
ile s
treng
th ra
tio [-
]
v3
SL
St. 0+914.3
Parametric study
Variations for placement technologyMax. R of RCC and CVC
144.00
145.80 145.80
163.50DC
144.6 masl
180.6 masl
Dam centre RCC
Upstream CVC facing
R = 0.75
R = 0.75
Fig. 6-27: Parametric study: Maximum tensile stress to tensile strength ratios in
the dam centre RCC and the upstream CVC facing (winter construction start, continuous placement of single 30 cm-layers (v3) and 3 m-lifts (SL)).
6.4.4 Variation of facing concrete
The consequences of a CVC with a high cement content, being applied as the facing concrete, have been presented with the in-situ measurement campaigns (Chap-ter 5.2.3). Alternative facing options are described in Chapter 1.3.2, whereas the option of the grout enriched vibratable RCC (GEVRCC) has been investigated in the parametric study. Practically, the applied GEVRCC will have a higher cementi-tious content than the dam body RCC as a result of the addition of a cementitious grout. Correspondingly, it will generate slightly more hydration heat, as well as de-velop higher elastic moduli and strengths. Nevertheless, the properties of the

208
GEVRCC are simplified considered as the ones of the dam body RCC. The simu-lated case reflects the real placement schedule of Mujib Dam.
Due to the lower hydration heat of the GEVRCC, considerably lower temperatures result in the upstream facing, compared to the CVC facing (see Appendix). Fig-ure 6-28 shows the distribution of the stress-to-strength ratios at the upstream facing over the dam height. Although lower temperatures and lower tensile stresses during the cool seasons occur in the GEVRCC facing, the tensile stress ratios show higher values, partially exceeding the limit value of 0.75 (consequential crack propagation into the RCC mass). This due to the fact of a lower tensile strength of the GEVRCC material (tensile strength evolution acc. to Fig. 6-17), compared to the one of CVC. The adoption of the RCC tensile strength evolution is a very pessimistic assumption within this study. Higher tensile strengths of the GEVRCC can be expected, but the stress-to-strength ratios will not considerably fall below the ones determined for the CVC facing. In conclusion, the main advantage of the GEVRCC methodology is not to find in an advantageous stress state, but rather in the better practicability with the RCC technology (only RCC on site, less vehicles involved in the construction process).
0
0.5
1
1.5
144.
3
145.
5
147.
6
149.
7
151.
8
153.
9
156.
0
158.
1
166.
5
168.
1
172.
8
180.
0
Dam elevation [masl]
Max
. ten
sile
stre
ss to
tens
ile s
treng
th ra
tio [-
]
GEVRCC
CVC
St. 0+914.3
Parametric study
Variations for facing technologyMax. R of RCC and CVC at upstream facing
144.00
145.80 145.80
163.50DC
Real Mujib Dam schedule(Fig. 5-12)
R = 0.75
144.6 masl
180.6 masl
Fig. 6-28: Parametric study: Maximum tensile stress to tensile strength ratios in
the upstream facing (Real Mujib Dam placement schedule acc. to Fig. 5-12, CVC and GEVRCC facing).

209
6.4.5 Variation of the monolith size
Three monolith sizes according to Table 6-4 have been investigated with respect to the evaluation of the structural behaviour of an RCC gravity dam. The three-dimensional thermal stress simulation of the real size monolith at Mujib Dam (60 m contraction joint distance) is very time and resources consuming, so, only two monolith sizes (15 and 60 m) were modelled according to the real Mujib Dam placement schedule (Fig. 5-12). In order to integrate the various model results into the already presented picture of the thermal stress behaviour of Mujib Dam, the Stressmeter locations will serve as spots for comparison. Figures 6-29 and 6-30 pre-sent the stress comparison between the 2D, the 3D-models with 15 m and 60 m dis-tance between the contraction joints and the Stressmeter recordings.
-2
-1
0
1
2
Stre
ss [M
Pa]
-2
-1
0
1
225.06.01 22.12.01 20.06.02 17.12.02
Date
Stre
ss [M
Pa]
St. 0+914.3
Variation of monolith sizes
Stressmeters 2 and 3 in upstream (bottom) and centre RCC (top) vs. computed stresses
2Dmonolith size ∞
154.5 masl
3Dmonolith size 60m
3Dmonolith size 15m
Stressmeter 3monolith size 60m
2Dmonolith size ∞
3Dmonolith size 60m
3Dmonolith size 15m
Stressmeter 2monolith size 60m
144.00
145.80 145.80
163.50DC
cross-valley-stresses
Dam centre
Upstream
Fig. 6-29: Parametric study: Cross-valley stresses in upstream (bottom) and centre
RCC (top) resulting from the variation of monolith sizes (Stressmeter 2 and 3, elev. 154.5 masl, station 0+914.3, Block D).0
210
From the values obtained in the dam centre at elevation 154.5 masl it can be seen that the maximum compressive cross-valley stresses decrease with shorter distance between the contraction joints. This is to be explained by the decreasing restraint acting in z-direction under the preconditions of a freely deforming monolith end. The same observation can be made at dam elevation 144.3 masl (Fig. 6-30).
In the RCC close to the surface at dam elevation 154.5 masl, the comparable situa-tion occurs during the expansion phase, when the computed cross-valley stresses are lower with shorter monolith lengths. In comparison with the recordings of Stress-meter 2 it turns out that the initial stresses fit best to the 3D-model simulating a 15 m wide monolith. However, this model shows a great discrepancy in the follow-ing stress history. The simulation of a 60 m wide dam monolith, which is free to deform at the monolith ends, shows the highest cross-valley tensile stresses within this comparison. This is due to the unfavourable superposition of cross-valley ten-sile stresses resulting from the thermal action in winter and the cross-valley tensile stresses at the facings as a result of the transverse strains caused by the RCC self-weight (bulging effect). The good agreement of computed cross-valley stresses us-ing the plane-strain model and the recordings of Stressmeter 2, especially at later RCC ages, emerge the 2D structural model as plausible and close to reality, when crack occurrence can be excluded.
-1
0
129.01.01 26.02.01 26.03.01 23.04.01 21.05.01
Date
Stre
ss [M
Pa]
St. 0+914.3
144.3 masl
Variation of monolith sizes
Stressmeter in dam centre of 144.3masl vs. modelled stresses
2Dmonolith size ∞
3Dmonolith size 60m
3Dmonolith size 15m
Stressmetermonolith size 60m
144.00
145.80 145.80
163.50DC
cross-valley-stresses
Fig. 6-30: Parametric study: Cross-valley stresses in the dam centre resulting from
the variation of monolith sizes (centre Stressmeter, elev. 144.3 masl, station 0+914.3, Block D).

211
6.4.6 Evaluation of mass cracking
The monolith size is one of the major influences on the thermal cracking suscepti-bility of the RCC gravity dam. In order to determine its impact on probable mass gradient cracking, long-term thermal stress simulations inevitably have to be per-formed. The computations have to include the point of time when the dam has reached its interior stable temperature or temperature cycle. Consequently, it will comprehend a considerable service time and the reservoir action has to be included into the model in order to achieve a realistic picture of probable mass cracking. The numerical model applied within this dissertation does not comprise the considera-tion of the reservoir. Mass cracking evaluations therefore rely on the maximum temperatures in the dam core. The estimation was performed according to the meth-odology of the U.S. Army Corps of Engineers (USACE 1997) on the basis of the American Concrete Institute (ACI 1995) restraint model (see Chapter 3.1). Within this methodology, computed restraint strains are compared with the tensile strain capacity of the RCC (TSC, see Chapter 4.2.8). For more information on the proce-dure of mass cracking determination, it is referred to the according literature.
The construction parameter sets according to Table 6-4 and the resulting maximum temperatures in the dam centre are adopted for the evaluation of mass gradient cracking. For the study, the final stable temperature after cooling in the dam interior is assumed to be 23 °C and the monolith size is 60 m according to the Mujib Dam situation. The tensile strain capacity of the Mujib Dam RCC is assumed as 80⋅millionths (Eq. 4-56). All other relevant parameters refer to Table 6-3. For rea-sons of result comparison, some assumptions have to be included:
• Maximum restraint tensile strains in the dam centre after cooling to the stable interior temperature principally occur below 15 m above the foundation. This corresponds to 40 % of the dam height in the simulated cases and is due to the maximum product of temperature fall and external restraint factor k (Eq. 3-4).
• An effective placement speed veff [cm/d] is defined according to Equation 6-19. Placement breaks close to the foundation, which influence the restraint strains up to 40 % of the dam height, can thus be considered.
Heff t
Hv%40
1004.0 ⋅⋅= Eq. 6-19

212
with veff H t40% H
Effective placement speed [cm/d] Dam height [m], 38.4 m in the case of Mujib Dam Time until reaching 40 % of the dam height [d]
Figure 6-31 presents the evaluation of the induced thermal restraint strains in de-pendence of the effective placement speed resulting from the variation of construc-tion parameters and external restraint through the foundation. The restraint strain values represent maximum values occurring in the dam portion up to 40 % of the dam height and are expressed as a ratio to the tensile strain capacity. A limit value of the strain-to-TSC ratio of 0.75 is also assumed as a critical value in respect to mass cracking susceptibility. It has to be remarked that the computation of the thermal restraint strains and the cracking susceptibility reacts very sensibly on the variation of the coefficient of thermal dilatation and the tensile strain capacity. The data are split into construction schedules starting in winter and summer.
Mass cracking induced by external foundation restraint is unlikely in the monolith, which is characterised by a contraction joint distance of 60 m and constructed ac-cording to the various fictive placement schedules. Although all data vary in a small range, trends for the maximum ratio of tensile strain to tensile strain capacity in de-pendence of the effective placement speed and the construction start can be identi-fied. The maximum tensile restraint strains in the dam portion up to 40 % of the dam height are increasing with increasing effective placement speed in the case of a construction begin in summer. The opposite trend is evaluated for winter starts. The reason for this behaviour is the location of the maximum temperature zone in the dam in conjunction with the development of the foundation temperatures. A more favourable condition for mass cracking avoidance will arise, if the maximum tem-perature zone is more distant from the foundation where external restraint factors are decreased. If the foundation temperatures warm up due to the hydrating con-crete, they cool down to the stable temperature simultaneously with the concrete mass. The effective cooling differential for the externally restrained concrete mass will be as lower as higher the foundation cooling differential after RCC placement.

213
0.00
0.25
0.50
0.75
0 10 20 30 40veff [cm/d]
Max
. rat
io o
f ten
sile
stra
in to
TS
C [-
] Start in Winter
Start in Summer
St. 0+914.3
Parametric study
Mass cracking susceptibility of RCC in dam centre due to foundation restraint
144.00
145.80 145.80
163.50DC
Foundation143.1 masl
40% dam height158.5 masl
Trend winter
Trend summer
Fig. 6-31: Parametric study: Mass cracking susceptibility as maximum ratios of
tensile strain to tensile strain capacity in the dam centre (variation of start dates, placement rates and placement breaks).
Figure 6-32 presents a typical relation between the maximum ratio of tensile strain to tensile strain capacity and the monolith size. It can be seen that thermal induced mass cracking as a consequence of foundation restraint does not occur for the de-picted case (RCC properties acc. to Mujib Dam) and even very long contraction joint distances. Even an increase of the thermal dilatation and a decrease of the ten-sile strain capacity by 25 % each will result in a maximum cracking susceptibility of 0.68 for a monolith length of 250 m, if the dam exclusively is evaluated up to 40 % of its height. The external restraint originating from the foundation converges to 1 across the full dam height for very long monoliths (L/H ≈ 40, Eq. 3-4 to 3-7, Fig. 3-4). The restraint strain inducing temperature difference between the peak tempera-ture and an occurring minimum temperature in the dam top portion is considerably higher than in the bottom 40 %. Consequently, transverse cracking at the crest due to external restraint is more likely for long monoliths than it is close to the founda-tion.

214
0.00
0.25
0.50
0.75
0 50 100 150 200 250 300Contraction joint distance [m]
Max
. rat
io o
f ten
sile
stra
in to
TS
C [-
]
RCC
Foundation
L = variable
Fig. 6-32: Parametric study: Typical maximum ratios of tensile strain to tensile
strain capacity in the dam centre and corresponding contraction joint distance (summer construction start, continuous placement rate of 30 cm/d).
6.4.7 Summary of the parametric studies
Above presented evaluations clearly show the predominance of thermally induced surface cracking as the main cracking type for the studied RCC material and the adopted construction parameters. The surface cracking may either develop at the facings or from temporarily exposed horizontal surfaces at placement break eleva-tions. Tensile loading of the RCC in the dam interior and at a sufficient distance from an exposed surface (approx. 10 m) can be excluded during the construction time.
For reasons of comparing and weighting, the various obtained stress-to-strength ratio distributions in the dam centre and at the upstream facing have been integrated over the dam height and added in order to receive only one value for the overall evaluation of the thermal surface cracking susceptibility of the dam during its con-struction time. The sorted results are presented in Figure 6-33.
The majority of overall high surface cracking affinities can be found for placement schedules with corresponding main placement activities in warm and hot seasons (large maximum temperature zone) and placement breaks or dam completion just prior to the cold season. High concrete placement temperatures with according high peak temperatures at the facings as well as in the dam core are typical for such

215
schedules. Also steep temperature gradients at temporary surfaces and at facings, additional to high temperature differentials between facings and dam interior, arise in the first cold season after concrete placement. This unfavourable stress state may be improved by a reduction of the placement rate. The simulated worst scenario is a continuous placement of sloped layers with a construction begin in summer. This kind of dam construction leads to an extended maximum temperature zone from the foundation up to two third of the dam height. The completion of the dam shortly in advance of the cold season is additionally unfavourable in terms of thermal cracking at the dam crest.
Generally, the individual introduction of placement breaks can help to reduce the cracking susceptibility at the surfaces of the RCC dam, if it is managed to shift the placement works into cooler months after the hot season. For disadvantageous schedules starting in summer, a placement break close to the foundation improves the situation (e.g. combination D2-v2-L1-E2). Alternatively, a decelerated but con-tinuous summer placement (e.g. combination D2-v1-0) results in noticeably better conditions, compared to a rapid summer placement.
0
10
20
30
40
D2-
v3-L
1-E2
D1-
SL-L
2-E2
D1-
SL-0
D2-
v2-L
1-E2
D1-
SL-L
1-E2
D1-
v1-L
1-E2
D2-
v3-L
2-E2
D2-
v1-L
1-E2
D1-
v3-0
D1-
v3-L
2-E2
D2-
v2-L
2-E2
D1-
v1-0
D2-
v1-L
2-E2
D1-
v2-0
D1-
v1-L
2-E2
D2-
v1-0
D1-
v2-L
2-E2
D1-
v3-L
1-E2
D2-
SL-L
1-E2
D2-
v2-0
D1-
v2-L
1-E2
D2-
v3-0
D2-
SL-L
2-E2
D2-
SL-0
Inte
grat
ed s
tress
-to-s
treng
th ra
tio o
ver d
am h
eigh
t(d
am c
entre
+ u
pstre
am C
VC
faci
ng)
Fig. 6-33: Summary of parametric study: Added integrals of stress-to-strength
ratios in the dam centre RCC and the upstream CVC facing over the dam height (results from the 2D simulations).
The variation of contraction joint distances within the 3D structural model with free deformability of the monolith end revealed larger compressive stresses with increas-ing monolith lengths. Due to the different boundary conditions at the contraction
216
joint in the 2D (plane-strain) and the 3D model (free end) and the enhanced effects of the transverse strains within the 3D model, greater tensile stresses were evaluated at the facings of the 3D model. An application of the presented 3D model with re-gard to cracking determination will move results to the safer side.
Mass cracking due to external foundation restraint showed to be no concern for the modelled dam and the assumed material properties. The results from the various parametric combinations returned a relation between the effective placement speed and the thermally induced restraint strains up to 40 % of the dam height in depend-ence on the dam construction begin (Fig. 6-31). A decreasing effective placement speed decreased the strain-to-strain capacity ratio for summer starts, the opposite is valid for winter starts. The increase of contraction joint distances and the resulting external restraint strains showed an increasing transverse cracking affinity at the dam crest, rather than close to the foundation. A contraction joint spacing of about 180 m was evaluated for the modelled dam according to Figure 6-32, before a strain-to-strain capacity ratio of 0.75 was reached at the dam crest (mass cracking at the foundation is not expected for infinite contraction joint spacing).
217
7 Summary and recommendations for the thermal stress favourable con-struction of RCC dams
7.1 Thermal cracking types and mechanisms
If thermally induced restraint stresses (strains) exceed the current RCC tensile strength (tensile strain capacity), thermal induced cracking occurs. It is generally distinguished between surface cracking and mass cracking (Chapter 3). Surface cracking may result from internally restrained deformations as a consequence of present non-linear temperature distributions or temperature gradients in the mass concrete. The according temperature differences across the concrete mass create corresponding eigenstresses. Mass cracking is due to external restraint, which origi-nates from friction between the RCC and the dam foundation and stiffness differ-ences of adjacent materials. External restraint additionally depends on the geometry of a dam monolith (length-to-height ratio). Mass cracks may occur at a certain tem-perature drop from a peak temperature in the monolith to a final stable temperature.
The introduction of zero-stress temperatures (Chapter 3.2) will change the above concept with regard to the applied temperature differences for the restraint strain computation. The zero-stress temperature is the temperature assigned to the time of a stress free condition at a certain spot and will always be lower than the peak tem-perature. Present temperatures below the zero-stress temperatures will result in ten-sile stresses. Zero-stress temperatures are highly dependent on the hydration and hardening characteristics of the concrete and are usually locally and temporally variable.
7.2 General findings on the thermal cracking behaviour of RCC gravity dams
Thermally induced surface cracking appeared to be the primary cracking type at RCC gravity dams. This relates to the dam construction time as well as to the later service time. The cracking mechanisms during the construction time are attributed to internal restraint, because of steepest thermal gradients at the facings and highest temperature differentials between facing and dam interior usually occurring in the first cold season after concrete placement. The in-situ observations at the two Jor-danian RCC gravity dams and the numerical parametric studies revealed problem-atic temperature gradients of approximately 2.5 to 3 K/m at the facings prior to sur-face cracking. Further they confirmed the general assumption of temperature differ-entials between dam core and dam exterior of 15 K prior to surface cracking. How-

218
ever, in some cases, this temperature differential may also be smaller. The observa-tions and studies showed that surface cracking won’t occur later, if it does not take place in the first cold season after placement.
Mass cracking close to the foundation due to external restraint could be excluded for all parametric variations within the numerical study based on the Mujib Dam site (evaluation acc. to USACE 1997). A temperature drop of the restraining founda-tion to the same stable temperature as assumed for the RCC core was included in the considerations, thus leading to an effective strain inducing temperature fall in the dam. This effect results in reduced restraint strains in the RCC, compared to the disregarding of the temperature behaviour of the interface between foundation and dam. Even with assumed very long contraction joint distances, mass cracking was determined not to occur in the dam portion up to 40 % of the monolith height.
External restraint may lead to thermally induced surface cracking at the dam crest during the service period, if the cross-valley length-to-height ratio of the dam mono-lith is sufficiently large (L/H ≈ 40). This is due to usually higher restraint strain in-ducing temperature differentials at the dam crest in conjunction with high restraint factors in the case of large L/H-ratios.
It can be stated as a conclusion from the performed studies that, if surface cracking due to internal or external restraint can be excluded for a certain material and mono-lith geometry configuration, mass cracking won’t take place under the same condi-tions.
7.3 Material related recommendations
The principally advantageous effects of lower cement contents, cement replacement by pozzolan, low moduli of elasticity and high creep, etc., are well known in mass concrete technology. Nevertheless, this topic is briefly discussed with focus on the dam facings and the reduction of surface cracking affinity, in particular to maintain an impervious upstream facing.
A high-cementitious CVC is characterised by high zero-stress temperatures devel-oping at a very early concrete age, due to the corresponding generation of a high hydration heat and insulating effects from present formworks. In this case the CVC is generally characterised by higher zero-stress temperatures than the adjacent and also interior RCC, leading to concave zero-stress temperature distributions. The subsequent quick temperature drop at the facing and still warm interior temperatures
219
especially after concrete placement in cold seasons lead to very high tensile eigen-stresses at the facing. Although a high-cementitious CVC will develop higher ten-sile strengths, surface cracking under such conditions is mostly inevitable. This ef-fect was observed and monitored by Stressmeters installed in the facing of Mujib Dam. A surface crack occurred after the facing temperature dropped by 16 K below the local zero-stress temperature of roughly 50 °C (Fig. 5-33). The reduction of the cement content in the facing concrete is therefore an important measure in order to reduce the thermal cracking risk.
GEVRCC offers an option for reduced zero-stress temperatures at the facing. How-ever, the considerable lower cement content in the GEVRCC, compared to the CVC, will also lead to reduced tensile strengths. This correlation may not necessar-ily decrease the surface cracking affinity at the facings. It is therefore recommended to perform an optimisation procedure for the facing mix design, taking thermal properties and strength requirements as well as economic superficial contraction joint distances into account.
The option of exposed PVC membranes as impervious upstream barriers shall be mentioned with respect to material related recommendations. The partial installation of an exposed PVC membrane with an adequate drainage system will be a good al-ternative, if significant surface cracking in the lower dam part is inevitable. It is considered 100 % tight and it might also contribute to relaxed facing specifications in the area of the membrane installation. If a partial installation is considered, de-spite, it has to be designed well with respect to its vertical extent. It could be ob-served that the drainage profiles, embedded into the upstream facing concrete, act as surface crack inducers. It is therefore recommended to avoid such profiles in loca-tions, where a membrane location is actually not foreseen.
7.4 Construction related matters
7.4.1 Placement rates
Economy rules the RCC dam construction and only little attention is actually given to the placement rate as mostly the maximum economically sensible placement rate is chosen in order to meet an envisaged commissioning date. This has to be done also in order to stress the competitiveness of RCC dams. However, the placement schedule and the placement rate show to have a significant influence on the surface and mass cracking susceptibility of the RCC gravity dam.
220
An optimum placement rate can be adopted in terms of hydration heat losses and minimal heat gains from solar radiation via temporarily exposed horizontal surfaces in order to achieve reduced peak temperature in the dam interior. The evaluation of temperature rise in relation to exposure time of an RCC layer at the Mujib Dam led to favourable placement rates, depending on the placement season. Either rapid (60 cm/d = 0.5 d exposure) or slow (8 cm/d = 3.75 d exposure) placement rates re-sulted in reduced temperature increases in the dam core for hot month placement. A placement rate of 15 cm/d turned out to be unfavourable with regard to peak tem-peratures. Generally reduced peak temperatures occurred for cold months place-ments, when even rapid placement rates resulted in temperature rises of only 70 % of the adiabatic temperature rise. Regarding cost aspects, RCC placement has not to be necessarily suspended during hot seasons. The choice of an optimised placement rate keeps the construction site busy and proceeds the project. Adequate tempera-ture control and curing measures may help in this point.
Rapid placement rates are recommended for construction starts in winter in order to quickly leave the areas of high foundation restraint. The location of the maximum temperature zone should be achieved as high above the foundation as possible. In contrary, a slow placement rate is recommended to be adopted for summer con-struction starts. With the beginning of the cooler months and at still low elevation, also lower peak temperatures will be created close to the foundation. These findings are valid for the reduction of mass cracking susceptibility as well as for that of sur-face cracking.
7.4.2 Placement breaks
When the RCC dam is divided into separate construction phases including the in-troduction of according placement breaks, such placement breaks can be planned in a thermally optimised way. The location and duration of the placement suspension together with the adoption of adequate placement rates can be utilised as a tempera-ture control in order to actively influence the location and vertical extend of the maximum temperature zone. It is generally recommended to aim at the location of the maximum temperature zone outside the zone, where a maximum product of temperature cooling differential and external restraint factor evolves. The vertical extent of the maximum temperature zone should be as small as possible with re-spect of surface cracking. Surface cracking is very likely at the elevations of maxi-mum interior dam temperatures, since maximum temperature differentials between facing and interior occur in the following cold season.

221
The danger of surface cracking from the temporarily exposed horizontal surface of a long-term placement break can be reduced by timing the placement break in the cold season prior to the first warmer months. Beneficial higher compressive stresses due to the initial low placement temperatures and slowly warming exposed surface will build up.
Shorter placement breaks of about 14 d (not seasons spanning) won’t have a signifi-cant impact of the temperature and stress states in the RCC dam. They can be con-sidered as comparable to continuous placement schedules without placement breaks. Especially long-term placement breaks of 120 d and more and lasting from hot into cold seasons will enhance the thermal cracking affinity at the exposed sur-face.
7.4.3 Placing methodology
The traditional method of placing horizontal 30 cm high layers has been investi-gated in the numerical parametric studies as well as the sloped layer method. Im-mensely depending on the placement schedule, the sloped layer method may be ei-ther more advantageous or less favourable than the traditional placing method. Prin-cipally, the sloped layer method showed smaller peak temperatures in the dam inte-rior than were obtained by the traditional method. Resulting from the parametric studies it is recommended to preferably apply the sloped layer method with place-ment schedules incorporating a construction start in winter, due to a considerably reduced danger of surface cracking at the facings and at the exposed top of the dam. An adoption of the method for summer placement schedules should comprise pre-cooling effort in order to maintain low placement temperatures.
7.4.4 Drainage galleries
Galleries should not excessively be ventilated with ambient air, especially in cold seasons. Steep thermal gradients will consequently occur at the gallery walls in ad-dition to steep temperature gradients at the upstream facing. As the distance be-tween upstream facing and upstream gallery wall is naturally short, the gradients possibly lead to a through-crack between the two planes and respective seepage into the gallery while first impoundment.
222
Symbols
Adopted symbols will be explained in the text or in connection with the illustrated equations. Some symbols or indices will have different definitions in the progress of this dissertation (e.g. h for the surface heat transfer coefficient [W/m2.K] and the considered location above the foundation [m]). Due to the unification of symbols in this dissertation, they can differ from the corresponding cited literature.
Figures
Fig. 1-1: World distribution and progress of RCC dams as of 2004 (276 RCC dams, data according to Dunstan 2004). 1
Fig. 1-2: RCC prices for selected RCC dams in the world (Schrader 1995, Hansen 1979). 3
Fig. 1-3: Simplified principal assembly of an RCC gravity dam. 7 Fig. 1-4: Procedure of the sloped layer method (Forbes 2002). 11 Fig. 1-5: Vertical fixation of exposed PVC membrane (CARPI-system, Mass
2002). 13 Fig. 1-6: An example of (partial) contraction joint execution. 15 Fig. 3-1: Illustration of internal restraint and surface cracking. 20 Fig. 3-2: Illustration of external restraint and mass cracking. 20 Fig. 3-3: Model for determination of the degree of external restraint (ACI
1995). 22 Fig. 3-4a: Structural restraint factors kR according to ACI (1995) (Eq. 3-5, 3-
6). 23 Fig. 3-5: Foundation restraint factor kF according to ACI (1995) (Eq. 3-7). 24 Fig. 3-6: Internal restraint model after ACI (1995) and USACE (1997). 25 Fig. 3-7: Qualitative restraint thermal stress behaviour of mass concrete. 26 Fig. 3-8: Temperature history in concrete and foundation ref. Eq. 3-10 and 3-
11. 29 Fig. 3-9: Acceptable dimensions of a concrete block acc. to the critical
temperature differential between concrete and foundation (Springenschmid 1987, modified). 31

223
Fig. 3-10: Temperature and eigenstress distribution across a concrete block acc. to the zero-stress temperature distribution (Springenschmid 1987, modified). 31
Fig. 4-1: Coupling of hydration, temperature and stresses (Schikora and Eierle 1999). 34
Fig. 4-2: Example of adiabatic hydration heat production and rate of Portland cement with low heat of hydration. 37
Fig. 4-3: Adiabatic and isothermal hydration heat liberation of Portland cement acc. to Fig. 4-2 and Eq. 4-4 to 4-7. 40
Fig. 4-4: Hydration heat of a ASTM Type I cement determined by different procedures and from in-situ measurements in an RCC dam. 47
Fig. 4-5: Comparison between the prediction of the hydration heat of pure and blended cement by the proposed Bogue calculation and according literature values. 48
Fig. 4-6: Specific weights of mass concrete aggregates (Lama and Vutukuri 1978, Čermák and Rybach 1982). 51
Fig. 4-7: Thermal conductivities of mass concrete aggregates (Čermák and Rybach 1982). 52
Fig. 4-8: Schematic description of Equations 4-21 and 4-22. 53 Fig. 4-9: Thermal conductivity of full mass concrete mixes: Comparison
between literature values (ACI 1997, 1999) and computed values acc. to Eq. 4-23. 54
Fig. 4-10: Evolution of the thermal conductivity of CVC from own investigations (in Scharf 2004). 55
Fig. 4-11: Specific heats of mass concrete aggregates (Čermák and Rybach 1982). 57
Fig. 4-12: Specific heat of full mass concrete mixes: Comparison between references (ACI 1997, 1999) and computed values acc. to Eq. 4-24. 59
Fig. 4-13: Thermal diffusivity of mass concrete aggregates (Čermák and Rybach 1982). 60
Fig. 4-14: Coefficient of thermal dilatation of selected rock types (Dettling 1959). 62
Fig. 4-15: Coefficients of thermal dilatation of full mass concrete mixes: Comparison of references (ACI 1997, 1999) and results acc. to Eq. 4-27. 64
Fig. 4-16: Compressive strength versus w/B-ratio: Regression graphs (ACI 1999) and project data (Berga et al. 2003, ACI 1999). 66
224
Fig. 4-17: Compressive strength versus cementitious content: Regression graphs (USACE 2000, ACI 1999) and project data (Berga et al. 2003, ACI 1999). 67
Fig. 4-18: Hardening relations for compressive strength development of various RCC mixtures (Berga et al. 2003, ACI 1999) and approximation by Equations 4-34 and 4-35 acc. to a basic age of 28 d. 69
Fig. 4-19: Hardening relations for compressive strength as in Fig. 4-18 and approximation by Equations 4-34 and 4-35 acc. to basic ages 90 (top) and 365 d (bottom). 70
Fig. 4-20: Splitting tensile and compressive strength: Comparison between various RCC and CVC data and applied relations acc. to Tab. 4-6. 72
Fig. 4-21: Direct tensile strength correlation between RCC data and Eq. 4-40. 73 Fig. 4-22: Stress-strain-curve of RCC and moduli (Mindess et al. 2003,
modified). 73 Fig. 4-23: Normalised stress-strain-curves of the Mujib Dam low-
cementitious RCC in compression (top) and tension (bottom) (Conrad et al. 2003, Malkawi 2002). 75
Fig. 4-24: Typical stress-strain-curves and ranges of dispersion from compressive strength tests of the Mujib Dam RCC at ages of 7 d and 365 d. 77
Fig. 4-25: Young’s moduli of selected rock types (Lama and Vutukuri 1978). 78 Fig. 4-26: Modelled Young’s moduli versus measured moduli after 90 days. 80 Fig. 4-27: Modelled Young’s moduli versus measured moduli after 365 days. 81 Fig. 4-28: Average Young’s moduli from laboratory tests at Mujib Dam and
regression by Eq. 4-46 and 4-47 using presented parameters (basic age 365 d). 83
Fig. 4-29: Hardening relations for Young’s modulus evolution of various RCC and CVC mixes (Berga et al. 2003, ACI 1999, 1997) and approximation by Equation 4-47 acc. to basic ages of 90 (top) and 365 d (below). 84
Fig. 4-30: Poisson’s ratios of selected rock types (Lama and Vutukuri 1978). 86 Fig. 4-31: Creep rates F(K) vs. Young’s moduli of various RCC and CVC
mixes and empirical approximation by Equation 4-55. 89 Fig. 4-32: Mujib Dam RCC: Static Young’s modulus and empirically
determined effective Young’s modulus by Equations 4-54 and 4-55. 90 Fig. 5-1: Dam views (from left to right: Mujib Dam, Wala Dam, Shimenzhi
Dam. 93
225
Fig. 5-2: Physical principle of DFOT and measurement set-up in an RCC dam. 94
Fig. 5-3: Recommended fibre cable type for applications in RCC resisting typical impacts on an RCC dam site. 95
Fig. 5-4: Schematic longitudinal section through a Stressmeter (Wiegrink 2002, modified). 97
Fig. 5-5: Typical experiment set-up for the DFOT Heat-up method for the in-situ determination of thermal parameters. 101
Fig. 5-6: Temperature development arising from a typical DFOT Heat-up experiment (acc. to Perzlmaier et al. 2004). 101
Fig. 5-7: Substitute systems for the representation of the heat-up cable (acc. to Perzlmaier et al. 2004). 102
Fig. 5-8: Experimental set-up for basic investigations of the DFOT Heat-up method for the estimation of thermal material properties. 103
Fig. 5-9: Heat-up curves in sand and CVC from the DFOT Heat-up method (top) and comparison between DFOT and heat-flow meter values (bottom). 104
Fig. 5-10: Location and general layout of Mujib Dam. 105 Fig. 5-11: Mean daily temperatures during the construction time of Mujib
Dam. 107 Fig. 5-12: RCC placing schedule of Mujib Dam in DFOT measurement
section. 108 Fig. 5-13: Upstream face construction of Mujib Dam. 109 Fig. 5-14: Situation of the DFOT and Stressmeter instrumentation at Mujib
Dam. 111 Fig. 5-15: Representative layout of Stressmeters (top) and fibre cables
(bottom) at Mujib Dam. 112 Fig. 5-16: Hybrid fibre cable used for heat-up experiments at Mujib Dam. 114 Fig. 5-17: Heat-up curves for 3 W/m (top) and 5 W/m (bottom) and
determination of the thermodynamic RCC properties for Mujib Dam. 115
Fig. 5-18: Mujib Dam: Ambient air and RCC placement temperatures during 2001. 117
Fig. 5-19: Mujib Dam: Balancing of early RCC temperature differentials (DFOT elev. 145.5. masl, station 0+906.2, Block D). 118
Fig. 5-20: Mujib Dam: Influence of RCC placement on the temperature distribution (DFOT elev. 145.5 masl, station 0+887.5 to 0+928.0, Block D). 119

226
Fig. 5-21: Mujib Dam: Different thermal behaviour of CVC facing and RCC mass (DFOT elev. 168.9 masl, station 0+966.3, Block C). 120
Fig. 5-22: Mujib Dam: Early temperature development in relation to the RCC placement progress (DFOT elev. 168.9 masl, station 0+966.3, Block C). 121
Fig. 5-23: Mujib Dam: RCC layer exposure time vs. temperature rise during first 60 days after RCC placement (interior RCC, station 0+906.2, Block D). 122
Fig. 5-24: Mujib Dam: Selected RCC temperature histories in dam centre until end of 2003 (station 0+914.3, Block D). 123
Fig. 5-25: Mujib Dam: Vertical distribution of maximum RCC temperatures in the dam centre related to ambient and placement temperatures (station 0+914.3, Block D). 124
Fig. 5-26: Mujib Dam: Vertical RCC temperature distributions in the dam centre with respect to placement breaks (station 0+914.3, Block D). 125
Fig. 5-27: Mujib Dam: Horizontal distributions of temperature variations (temperature difference ratio) due to the annual ambient temperature cycle in 2000 (station 0+914.3, Block D). 126
Fig. 5-28: Mujib Dam: History of temperature gradients at 40 cm from the upstream facing developed from DFOT (DFOT elev. 158.1 and 168.9 masl, station 0+914.3, Block D). 127
Fig. 5-29: Mujib Dam: Environmental conditions at construction site. 128 Fig. 5-30: Mujib Dam: Example horizontal temperature distribution affected
by sun radiation and convective heat transport (DFOT elev. 151.8 masl, station 0+966.3, Block C). 128
Fig. 5-31: Mujib Dam: History of temperature gradients at 40 cm from the upstream facing incl. reservoir impoundment (DFOT elev. 158.1 and 168.9 masl, station 0+914.3, Block D). 129
Fig. 5-32: Mujib Dam: Early stress history at 20 cm from the upstream facing (CVC) (Stressmeter 1, elev. 154.5 masl, station 0+914.3, Block D). 131
Fig. 5-33: Mujib Dam: Surface crack event at 20 cm from the upstream facing (CVC) (Stressmeter 1, elev. 154.5 masl, station 0+914.3, Block D). 132
Fig. 5-34: Mujib Dam: Early stress history at 1.0 m from the upstream facing (RCC) (Stressmeter 2, elev. 154.5 masl, station 0+914.3, Block D). 133
Fig. 5-35: Mujib Dam: Long-term stress history at 1.0 m from the upstream facing (RCC) (Stressmeter 2, elev. 154.5 masl, station 0+914.3, Block D). 134
Fig. 5-36: Mujib Dam: Long-term history of thermal stress at dam centre (RCC) (DFOT elev. 153.9 masl, Stressmeter 3, elev. 154.5 masl, station 0+914.3, Block D). 135

227
Fig. 5-37: Mujib Dam: Long-term development of zero-stress temperatures at 1.0 m from the upstream facing (RCC) (Stressmeter 2, elev. 154.5 masl, station 0+914.3, Block D). 137
Fig. 5-38: Mujib Dam: Determination of effective Young’s moduli of CVC and RCC from Stressmeter measurements (Stressmeters 1 and 2, elev. 154.5 masl, station 0+914.3, Block D). 138
Fig. 5-39: Location and general layout of Wala Dam. 139 Fig. 5-40: Mean daily temperatures during the construction time of Wala
Dam. 141 Fig. 5-41: RCC placement schedule of Wala Dam in DFOT measurement
section. 142 Fig. 5-42: Construction of contraction joints and upstream joint set-up. 143 Fig. 5-43: Illustration of the gallery accesses at Wala Dam. 143 Fig. 5-44: Situation of the DFOT instrumentation at Wala Dam. 145 Fig. 5-45: Layout of fibre cables at Wala Dam. 145 Fig. 5-46: Wala Dam: Ambient air and RCC placement temperatures. 147 Fig. 5-47: Wala Dam: Early temperature history in dam centre as basis of
derivation of semi-adiabatic hydration heat in Fig. 5-48 (DFOT elev. 499.8. masl, station 0+230.95, Block 3). 148
Fig. 5-48: Wala Dam: Effect of heat losses during first 28 days as result of RCC layer exposure (DFOT elev. 499.8. masl, station 0+230.95, Block 3). 149
Fig. 5-49: Wala Dam: RCC temperature histories in the dam centre until end of 2003 (station 0+230.95, Block 3). 150
Fig. 5-50: Wala Dam: Vertical RCC temperature distributions in the dam centre resulting from placement breaks (station 0+230.95, Block 3). 151
Fig. 5-51: Wala Dam: Time-history of temperature gradients at 40 cm from the upstream facing developed from DFOT (DFOT elev. 479.7, 489.3 and 502.5 masl, station 0+230.95, Block 3). 152
Fig. 5-52: Wala Dam: Influence of gallery ventilation and exposure to ambient conditions on horizontal temperature distribution (DFOT elev. 479.7 masl, station 0+230.95, Block 3). 153
Fig. 5-53: Wala Dam: Environmental conditions at construction site. 153 Fig. 5-54: Wala Dam: Example horizontal temperature distribution affected
by sun radiation and convective heat transport (DFOT elev. 484.8 masl, station 0+230.95, Block 3). 154
Fig. 5-55: Wala Dam: Time-history of temperature gradients at 40 cm from the upstream facing incl. reservoir impoundment (DFOT elev. 479.7, 489.3 and 502.5 masl, station 0+230.95, Block 3). 155

228
Fig. 5-56: Location and general layout of Shimenzhi RCC arch dam. 156 Fig. 5-57: Average temperatures at Urumqi (918 masl) over a typical year. 157 Fig. 5-58: Contraction and short joints at Shimenzhi RCC arch dam. 159 Fig. 5-59: Temperature control measures applied at Shimenzhi RCC arch
dam. 160 Fig. 5-60: Isometric view of Shimenzhi RCC arch dam and DFOT locations
(Aufleger et al. 2001). 160 Fig. 5-61: Shimenzhi: Development of the dam temperatures during the first
11 days after placement (DFOT elev. 1319.0 masl, cable 1). 162 Fig. 5-62: Shimenzhi: Quality control of the efficiency of into the RCC
embedded PVC cooling pipes (DFOT elev. 1345.0 masl, cable 4). 162 Fig. 5-63: Shimenzhi: Long-term temperature distributions after having
reached the maximum RCC temperature in the dam centre (DFOT elev. 1319.0 masl, cable 1). 163
Fig. 5-64: Shimenzhi: Long-term temperature distributions after having reached the maximum RCC temperature in the dam centre (DFOT elev. 1345.0 masl, cable 4). 164
Fig. 6-1: Schematic representation of the inclined surface, the earth’s azimuth and solar elevation (acc. to van Breugel and Koenders 2001). 168
Fig. 6-2: Comparison of modelled and measured global and diffuse solar radiation energies (measurements from http://www.hoki.ibp.fhg.de/ as of April 2004). 172
Fig. 6-3: Comparison of modelled effective ambient temperature and typical DFOT measurements at the downstream facing of Mujib Dam. 173
Fig. 6-4: Discretisation of Mujib Dam for 2D and 3D models (gallery section). 175
Fig. 6-5: Applied thermal models and thermal boundary conditions. 176 Fig. 6-6: Applied structural models and structural boundary conditions. 177 Fig. 6-7: Input of stress-strain-curves for the ANSYS structural model. 178 Fig. 6-8: Discontinuously executed contraction joint. 179 Fig. 6-9: Mujib Dam case study: Hydration heat amount and effective
Young’s modulus as considered in the numerical analysis. 182 Fig. 6-10: Mujib Dam case study: Evaluation of the 2D structural model by
comparison of computed stress histories and the evolution of 40 % of the RCC compressive strength (Dam elev. 153.9 masl, station 0+914.3, Block D). 183
Fig. 6-11: Mujib Dam case study: Evaluation of the 2D thermal and structural model by comparison with DFOT and Stressmeter recordings 2.0 m

229
from the upstream facing and at the dam centre (RCC) (Stressmeters, elev. 144.0 masl, DFOT elev. 144.3 masl, station 0+914.3, Block D). 184
Fig. 6-12: Mujib Dam case study: Evaluation of the 2D thermal and structural model by comparison with DFOT and Stressmeter recordings 1.0 m from the upstream facing (RCC) (Stressmeter 2, elev. 154.5 masl, DFOT elev. 153.9 masl, station 0+914.3, Block D). 185
Fig. 6-13: Mujib Dam case study: Evaluation of the 2D thermal and structural model by comparison with DFOT and Stressmeter recordings in the dam centre (RCC) (Stressmeter 3, elev. 154.5 masl, DFOT elev. 153.9 masl, station 0+914.3, Block D). 186
Fig. 6-14: Mujib Dam case study: Evaluation of the 2D thermal model by comparison with DFOT recordings 2.0 m from the upstream facing and in the dam centre (RCC) (DFOT elev. 156.0 masl, station 0+914.3, Block D). 187
Fig. 6-15: Mujib Dam case study: Evaluation of the 2D structural model by comparison with Stressmeter recordings 0.2 m from the upstream facing (CVC) (Stressmeter 1, elev. 154.5 masl, station 0+914.3, Block D). 188
Fig. 6-16: Mujib Dam case study: Comparison of the 2D and 3D models (CVC, RCC) (Dam elev. 144.3 masl, station 0+914.3, Block D). 189
Fig. 6-17: Tensile strengths of Mujib RCC and facing CVC (acc. to López et al. 2003). 193
Fig. 6-18: Parametric study: Variation of construction start dates and placement speeds. 194
Fig. 6-19: Parametric study: Maximum tensile stress to tensile strength ratios in the dam centre RCC (winter and summer construction start, continuous placement progress). 195
Fig. 6-20: Parametric study: Maximum tensile stress to tensile strength ratios in the upstream CVC facing (winter and summer construction start, continuous placement progress). 197
Fig. 6-21: Parametric study: Placement schedules including break L1-E2. 199 Fig. 6-22: Parametric study: Maximum tensile stress to tensile strength ratios
in the dam centre (winter and summer construction start, placement break L1 close to the foundation). 200
Fig. 6-23: Parametric study: Maximum tensile stress to tensile strength ratios in the upstream CVC facing (winter and summer construction start, placement break L1 close to the foundation). 201
Fig. 6-24: Parametric study: Placement schedules including break L2-E2. 202

230
Fig. 6-25: Parametric study: Maximum tensile stress to tensile strength ratios in the dam centre (winter and summer construction start, placement break L2 far from the foundation). 203
Fig. 6-26: Parametric study: Maximum tensile stress to tensile strength ratios in the upstream CVC facing (winter and summer construction start, placement break L2 far from the foundation). 205
Fig. 6-27: Parametric study: Maximum tensile stress to tensile strength ratios in the dam centre RCC and the upstream CVC facing (winter construction start, continuous placement of single 30 cm-layers (v3) and 3 m-lifts (SL)). 207
Fig. 6-28: Parametric study: Maximum tensile stress to tensile strength ratios in the upstream facing (Real Mujib Dam placement schedule acc. to Fig. 5-12, CVC and GEVRCC facing). 208
Fig. 6-29: Parametric study: Cross-valley stresses in upstream (bottom) and centre RCC (top) resulting from the variation of monolith sizes (Stressmeter 2 and 3, elev. 154.5 masl, station 0+914.3, Block D).0 209
Fig. 6-30: Parametric study: Cross-valley stresses in the dam centre resulting from the variation of monolith sizes (centre Stressmeter, elev. 144.3 masl, station 0+914.3, Block D). 210
Fig. 6-31: Parametric study: Mass cracking susceptibility as maximum ratios of tensile strain to tensile strain capacity in the dam centre (variation of start dates, placement rates and placement breaks). 213
Fig. 6-32: Parametric study: Typical maximum ratios of tensile strain to tensile strain capacity in the dam centre and corresponding contraction joint distance (summer construction start, continuous placement rate of 30 cm/d). 214
Fig. 6-33: Summary of parametric study: Added integrals of stress-to-strength ratios in the dam centre RCC and the upstream CVC facing over the dam height (results from the 2D simulations). 215

231
Tables:
Tab. 1-1: Dam types versus their volume and material unit costs. 3 Tab. 1-2: Classification of RCC for dams (ICOLD 2003 and Schrader 1995). 5 Tab. 1-3: RCC production steps and equipment (slectively). 8 Tab. 1-4: Widely applied facing systems for RCC dams. 14 Tab. 3-1: Plasticity coefficients k2 for various concretes acc. to Larson
(2001). 28 Tab. 3-2: Rule-of-thumb temperature differentials acc. to Springenschmid
(1987) causing surface cracking. 32 Tab. 4-1: Coupling degrees regarding the solution of thermal and structural
problems acc. to Schikora and Eierle 1999. 35 Tab. 4-2: Oxide and clinker phase composition of Portland cements (Mindess
et al. 2003). 43 Tab. 4-3: Hydration heat of clinker phases after full hydration. 45 Tab. 4-4: Factors a to d acc. to Eq. 4-17 (Eierle 1999). 45 Tab. 4-5: Nonlinear regression of factors a, b, c, d acc. to Table 4-4. 46 Tab. 4-6: Interrelations for splitting tensile strength prediction. 71 Tab. 4-7: Concrete models and computation of elastic modulus (Mindess et
al. 2003). 79 Tab. 4-8: Results from the Young’s modulus tests performed at Mujib Dam
(low-cementitious RCC acc. to Tab. 5-4, Conrad et al. 2003). 82 Tab. 5-1: Optimised working steps for the installation of fibre cables in RCC. 96 Tab. 5-2: Applied working steps for the installation of Stressmeters in RCC. 99 Tab. 5-3: Main data of Mujib Dam. 106 Tab. 5-4: RCC and CVC mixture dosages for DFOT and Stressmeter
measurement sections at Mujib Dam (Stabel and Wigand 2004). 110 Tab. 5-5: Locations of the DFOT instrumentation at Mujib Dam. 112 Tab. 5-6: Locations of the Stressmeter instrumentation. 113 Tab. 5-7: Main data of Wala Dam. 140 Tab. 5-8: RCC and CVC mixtures for Wala Dam (Baluch and Chraibi 2002). 144 Tab. 5-9: Locations of the DFOT instrumentation at Wala Dam. 146 Tab. 5-10: Main data of Shimenzhi RCC arch dam. 156 Tab. 5-11: RCC and CVC mixtures for Shimenzhi RCC arch dam. 158 Tab. 6-1: Prediction of RCC placement temperatures (Tatro et al. 2000). 167 Tab. 6-2: General features of the FEM-models set up in the study. 175 Tab. 6-3: Calibrated model parameters of the Mujib Dam FEM-model. 181

232
Tab. 6-4: Parameters and their variation in the parametric study. 192

233
Bibliography
Abed, A.M.; Darwiesh, A.M.A.; Naser, R. (2002): Certain geological problems associated with RCC dams: Case study for Wala and Mujib Dams. Proceed-ings of the International Conference on RCC Dams Construction in the Mid-dle East, April 7th-10th 2002, Irbid, Jordan, p. 513-525, Jordan University of Science & Technology, 2002.
ACI (1995): Effect of restraint, volume change and reinforcement on cracking of mass concrete. ACI 207.2R-95, Report by ACI Committee 207, American Concrete Institute (ACI), Detroit, 1995.
ACI (1997): Mass concrete. ACI 207.1R-96, Report by ACI Committee 207, American Concrete Institute (ACI), Farmington Hills, 1997.
ACI (1999): Roller Compacted Mass Concrete. ACI 207.5R-99, Report by ACI Committee 207, American Concrete Institute (ACI), Farmington Hills, 1999.
Al-Jammal, M. (2004): Computation of thermal stresses unsing nonlinear Roller Compacted Concrete properties. Master Thesis, Faculty of Graduate Studies, Jordan University of Science and Technology, 2004, (unpublished).
Amberg, F. (2003): Thermal analysis of a RCC dam during construction. Proceed-ings of the 7th Benchmark Workshop on Numerical Analysis of Dams, Sep-tember 24th-26th 2003, Bucharest, Romania, p. 172-187, ICOLD Ad-hoc Committee on Computational Aspects of Analysis and Design of Dams, ISBN 973 8165 88 1, Romanian Committee on Large Dams (ROCOLD), 2003.
Andriolo, F.R. (1998): The use of Roller Compacted Concrete. Officina de Textos, Sao Paulo, 1998.
Andriolo, F.R. (2002): RCC – Brazilian practices. Oficina de Textos, Sao Paulo, 2002.
ANSYS (2003): ANSYS Release 8.0 Documentation. ANSYS Inc., Canonsburg, 2003.
Atiş, C.D. (2002): Heat evolution of high-volume fly ash concrete. Cement and Concrete Research, Vol. 32, No. 5 (2002), p. 751-756, 2002.
Atiş, C.D. (2004): Strength properties of high-volume fly ash roller compacted and workable concrete and influence of curing condition. Cement and Concrete Research, accepted paper as of July, 23rd 2004, article in press, 2004.

234
Aufleger, M.; Conrad,M.; Strobl, Th.; Malkawi, A.I.H.; Duan, Y. (2003): Dis-tributed fibre optic temperature measurements in RCC dams in Jordan and China. Proceedings of the International Symposium on Roller Compacted Concrete Dams, November 17th-19th 2003, Madrid, Spain, p. 401-407, Ed.: Berga, L.; Buil, J.M.; Jofré, C.; Chonggang, S., ISBN 90 5809 564 9, A.A. Balkema, 2003.
Aufleger, M.; Malkawi, A.I.H.; Duan, Y. (2002): Distributed fiber optic tempera-ture measurements in RCC dams – An international research project. Pro-ceedings of the International Conference on RCC Dams Construction in the Middle East, April 7th-10th 2002, Irbid, Jordan, p. 483-493, Jordan University of Science & Technology, 2002.
Aufleger, M.; Perzlmaier, S.; Strobl, T.; Duan, Y.; Godde, D. (2001): Advanced technology for a high RCC-dam. Workshop on Modern Techniques for Dams, Proceedings of the 69th ICOLD Annual Meeting, September 14th 2001, Dresden, Germany, p. 84-98, German Committee on Large Dams (DTK), 2001.
Aufleger, M.; Strobl, Th.; Dornstädter, J. (2000): Fibre optic temperature meas-urements in dam monitoring – Four years of experience. Proceedings of the 20th Congress on Large Dams, Q78 R.1, Beijing, International Commission on Large Dams (ICOLD), 2000.
Baluch, S.Q.; Chraibi, A.F. (2002): Design and construction aspects of RCC works at Wala Dam project, Jordan. Proceedings of the International Con-ference on RCC Dams Construction in the Middle East, April 7th-10th 2002, Irbid, Jordan, p. 526-538, Jordan University of Science & Technology, 2002.
Bentz, D.P.; Remond, S. (1997): Incorporation of fly ash into a 3D cement hydra-tion microstructure model. Report NISTIR 6050, Building and Fire Research Laboratory, National Institute of Standards and Technology NIST, Gathers-burg, August, 1997.
Berga, L.; Buil, J.M.; Jofré, C.; Chonggang, S. (Editors) (2003): Proceedings of the International Symposium on Roller Compacted Concrete Dams. Novem-ber 17th-19th 2003, Madrid, Spain, ISBN 90 5809 564 9, A.A. Balkema, 2003.
Bouyge, B. (2003): RCC dam construction state-of-the-art in 2003. Proceedings of the 7th Benchmark Workshop on Numerical Analysis of Dams, September 24th-26th 2003, Bucharest, Romania, p. 121-133, ICOLD Ad-hoc Committee on Computational Aspects of Analysis and Design of Dams, ISBN 973 8165 88 1, Romanian Committee on Large Dams (ROCOLD), 2003.
235
Buyukozturk, O. (2004): Creep and shrinkage deformation. Course 1.054/1.541 Mechanics and Design of Concrete Structures (3-0-9), Massachusetts Insti-tute of Technology MIT, as of spring 2004, 2004.
Calmon, J.L.; Murcia, J.; Botassi, S.; Gambale, E.; da Silva, C.J. (2003): Nu-merical modelling of thermal stress in RCC dams using 2-D finite element method – case study. Proceedings of the International Symposium on Roller Compacted Concrete Dams, November 17th-19th 2003, Madrid, Spain, p. 569-577, Ed.: Berga, L.; Buil, J.M.; Jofré, C.; Chonggang, S., ISBN 90 5809 564 9, A.A. Balkema, 2003.
Cao, C.; Sun, W.; Qin, H. (2000): The analysis on strength and fly ash effect of roller-compacted-concrete with high volume fly ash. Cement and Concrete Research, Vol. 30, No. 1 (2000), p. 71-75, 2000.
Cao, G.; Zhang, G. (1999): Mix design of RCC and applications for the Fenhe II Dam. Proceedings of the International Symposium on Roller Compacted Concrete Dams, April 21st-25th 1999, Chengdu, China, p. 372-382, Ed.: Dept. of Structures and Materials of the China Institute of Water Resources and Hydropower Research (IWHR), Beijing, 1999.
Carino, N.J.; Lew, H.S. (2001): The maturity method: From theory to application. Proceedings of the 2001 Structures Congress & Exposition, May 21st-23rd 2001, Washington D.C., Ed.: Chang, P.C., American Society of Civil Engi-neers (ASCE), Reston, Virginia, 2001.
Cark, A.I.; van Breugel, K. (2001): Estimation of mechanical properties of con-crete using the hydration concept. Report BE96-3843/2001:41-9, Improved Production of Advanced Concrete Structures (IPACS), Luleå University of Technology, ISBN 91-89580-41-9, 2001.
Carlson, R. (1937): A simple method for the computation of temperatures in con-crete structures. Journal Proceedings of the American Concrete Institute (ACI), Vol. 34, No. 2, p. 89-102, 1937.
CEB-FIB MC90 (1990): CEB-FIB Model Code 1990. Comité Euro-International du Béton, 1990.
Čermák, V.; Rybach, L. (1982): Thermal conductivity and specific heat of miner-als and rock. In: Landoldt-Börnstein: Numerical Data and Functional Rela-tionships in Science and Technology, New Series, Group V, Vol. 1a, Ed.: G. Angenheister, Springer, Berlin-Heidelberg, 1982.

236
Cervera, M.; Oliver, J.; Prato, T. (1998): A thermo-chemo-mechanical model for concrete. Publication CIMNE No. 146, International Center for Numerical Methods in Engineering, Barcelona, November 1998.
Cervera, M.; Oliver, J.; Prato, T. (1999): A thermo-chemo-mechanical model for concrete – Part I: Hydration and aging. ASCE Journal of Engineering Me-chanics, Vol. 125, No. 9 (1999), p. 1018-1027, 1999.
Cervera, M.; Oliver, J.; Prato, T. (1999): A thermo-chemo-mechanical model for concrete – Part II: Damage and creep. ASCE Journal of Engineering Me-chanics, Vol. 125, No. 9 (1999), p. 1028-1039, 1999.
Cervera, M.; Oliver, J.; Prato, T. (2000): Simulation of construction of RCC dams – Part I: Temperature and aging. ASCE Journal of Engineering Me-chanics, Vol. 126, No. 9 (2000), p. 1053-1061, 2000.
Cervera, M.; Oliver, J.; Prato, T. (2000): Simulation of construction of RCC dams – Part II: Stress and damage. ASCE Journal of Engineering Mechan-ics, Vol. 126, No. 9 (2000), p. 1062-1069, 2000.
Choi, Y.-K.; Groom, J.L. (2001): RCC mix design – Soils approach. Journal of Materials in Civil Engineering, Vol. 13, No. 1 (2001), American Society of Civil Engineers (ASCE), p. 71-76, 2001.
Choi, Y.-K.; Neighbors, J.D.; Reichler, J.D. (2003): Cold weather placement of RCC. ASCE Journal of Materials in Civil Engineering, Vol. 15, No. 2 (2003), p. 118-124, 2003.
Chonggang, S. (2003): Chinese innovations and experiences in building RCC dams. HRW, Vol. 11, No. 6 (2003), p. 14-17, 2003.
Conrad, M.; Aufleger, M.; Malkawi, A.I.H. (2002a): An advanced temperature monitoring system at Mujib and Wala Dam – First results. Proceedings of the International Conference on RCC Dams Construction in the Middle East, April 7th-10th 2002, Irbid, Jordan, p. 319-330, Jordan University of Science & Technology, 2002.
Conrad, M.; Aufleger, M.; Malkawi, A.I.H. (2002b): Das Temperaturverhalten von zwei Walzbeton-Staumauern in Jordanien. Proceedings of the Internatio-nal Symposium on Moderne Methoden und Konzepte im Wasserbau, Octo-ber 7th-9th 2002, Zürich, Switzerland, p. 457-466, Ed.: Minor, H.-E., Ver-suchsanstalt für Wasserbau, Hydrologie und Glaziologie der ETH Zürich, 2002, (in German).

237
Conrad, M.; Aufleger, M.; Strobl, Th. (2005): Temperature and restraint stress evolution in Roller Compacted Concrete (RCC) dams. Wasserwirtschaft, No. 1/2 2005, p. 45-51, Vieweg Verlag, Wiesbaden, 2005, (in German).
Conrad,M.; Aufleger, M.; Malkawi, A.I.H. (2003): Investigations on the modulus of elasticity of young RCC. Proceedings of the International Symposium on Roller Compacted Concrete Dams, November 17th-19th 2003, Madrid, Spain, p. 729-733, Ed.: Berga, L.; Buil, J.M.; Jofré, C.; Chonggang, S., ISBN 90 5809 564 9, A.A. Balkema, 2003.
DBV (1996): Beschränkung von Temperaturrissen im Beton. DBV-Sachstandsbericht (Oktober 1996), Deutscher Beton-Verein (DBV), Wiesba-den, 1996, (in German).
De Schutter, G. (1999): Hydration and temperature development of concrete made with blast-furnace slag cement. Cement and Concrete Research, Vol. 29, No. 1 (1999), p. 143-149, 1999.
De Schutter, G. (2002): Fundamental study of early age concrete behaviour as a basis for durable concrete structures. Materials and Structures, Vol. 35, No. 1 (2002), p. 15-21, 2002.
Dettling, H. (1961): Die Wärmedehnung des Zementsteines, der Gesteine und der Betone. Dissertation, Technische Hochschule Stuttgart, Stuttgart, 1961, (in German).
Díez-Cascón Sagrado, J. (1995): General Report on Theme 1: Materials. Proceed-ings of the International Symposium on Roller Compacted Concrete Dams, October 2nd-4th, 1995, Santander, Spain, p. 1219-1243, Ed.: IECA; CNEGP, ISBN 84-920356-1-7, 1995.
DIN 52 616 (1977): Testing of thermal insulation materials – Determination of thermal conductivity by means of a heat-flow meter. Deutsches Institut für Normung (DIN), as of November 1977, Beuth Verlag, Berlin, 1977, (in Ger-man).
DIN EN 197-1 (2004): Cement – Part 1: Composition, specification and conformity criteria for common cements. Deutsches Institut für Normung (DIN), as of August 2004, Beuth Verlag, Berlin, 2004, (German version).
Dolen, T.P. (2003): Long-term performance of Roller Compacted Concrete at Up-per Stillwater Dam, Utah, USA. Proceedings of the International Symposium on Roller Compacted Concrete Dams, November 17th-19th 2003, Madrid, Spain, p. 1117-1126, Ed.: Berga, L.; Buil, J.M.; Jofré, C.; Chonggang, S., ISBN 90 5809 564 9, A.A. Balkema, 2003.

238
Duan, Y. (2004): RCC arch dams and the DTS. Presentation at the Conclusion Workshop of the DFG/BMZ-Project Distributed fibre optic temperature measurements in RCC dams, September 27th-28th 2004, Obernach, Germany, Institute and Laboratory of Hydraulic and Water Resources Engineering, Te-chnische Universität München, Munich, 2004.
Dunstan, M.R.H (2004): RCC dams data-base. http://www.rccdams.com, as of August 2004.
Dunstan, M.R.H (2004): The state-of-the-art of RCC dams in 2003 - an update of ICOLD Bulletin No. 125. Proceedings of the International Symposium on Roller Compacted Concrete Dams, November 17th-19th 2003, Madrid, Spain, p. 39-48, Ed.: Berga, L.; Buil, J.M.; Jofré, C.; Chonggang, S., ISBN 90 5809 564 9, A.A. Balkema, 2003.
Dunstan, M.R.H.; Ibánez-de-Aldecoa, R. (2003): Quality control in RCC dams using the direct tensile test on jointed cores. Proceedings of the International Symposium on Roller Compacted Concrete Dams, November 17th-19th 2003, Madrid, Spain, p. 943-950, Ed.: Berga, L.; Buil, J.M.; Jofré, C.; Chonggang, S., ISBN 90 5809 564 9, A.A. Balkema, 2003.
Dunstan, M.R.H.; Ortega Santos, F. (2001): The interrelationship between design and construction for efficient RCC dams. Proceedings of the 69th ICOLD Annual Meeting, September 14th 2001, Dresden, Germany, p. 45-63, German Committee on Large Dams (DTK), 2001.
Eierle, B. (1999): Berechnungsmodelle für rissgefährdete Betonbauteile unter frü-hem Temperaturzwang. Dissertation, Lehrstuhl für Statik der Technischen Universität München, Munich, Germany, 1999, (in German).
Faroukh, M. (2003): Thermal analysis of a RCC dam body during construction. Proceedings of the 7th Benchmark Workshop on Numerical Analysis of Dams, September 24th-26th 2003, Bucharest, Romania, p. 203-214, ICOLD Ad-hoc Committee on Computational Aspects of Analysis and Design of Dams, ISBN 973 8165 88 1, Romanian Committee on Large Dams (RO-COLD), 2003.
Fernández, R.; Rubin de Célix, M.; Gómez Laá, G. (1995): The behaviour of RCC dams in Spain. International Journal on Hydropower & Dams, Vol. 2, No. 5 (1995), p. 76-79, 1995.

239
Forbes, B.A. (2002): The sloped layer method and other techniques for improving quality and productivity on modern RCC dams. Proceedings of the Interna-tional Conference on RCC Dams Construction in the Middle East, April 7th-10th 2002, Irbid, Jordan, p. 1-16, Jordan University of Science & Technol-ogy, 2002.
Forbes, B.A. (2003): Some recent innovative methods and techniques in the design and construction of RCC dams. Proceedings of the International Symposium on Roller Compacted Concrete Dams, November 17th-19th 2003, Madrid, Spain, p. 49-60, Ed.: Berga, L.; Buil, J.M.; Jofré, C.; Chonggang, S., ISBN 90 5809 564 9, A.A. Balkema, 2003.
Forbes, B; Croquevielle, D.; Zabaleta H. (1992): Design and proposed construc-tion techniques for Pangue Dam. Proceedings of the Roller Compacted Con-crete III Conference, February, 2nd-5th 1992, San Diego, USA, Ed.:Hansen, K.D., McLean, F.G., 1992.
Forbes, B; Lichen, Y.; Guojin, T.; Kangning, Y. (1999): Jiangya Dam, China: Some interesting techniques developed for high quality RCC construction. Proceedings of the International Symposium on Roller Compacted Concrete Dams, April 21st-25th 1999, Chengdu, China, Ed.: Dept. of Structures and Materials of the China Institute of Water Resources and Hydropower Re-search (IWHR), Beijing, 1999.
Forbes, B; Williams, J.T. (1998): Thermal stress modelling, high sand RCC mixes and in-situ modification of RCC used for construction of the Cadiangullong Dam NSW. Proceedings of the Conference on Dams, August 1998, Sydney, Australia, Ed.: Australian National Committee on Large Dams (ANCOLD), 1998.
Frías, M.; Sánchez de Rojas, M.I.; Cabrera, J. (2000): The effect that pozzolanic reaction of metakaolin has on the heat evolution in metakaolin-cement mor-tars. Cement and Concrete Research, Vol. 30, No. 2 (2000), p. 209-216, 2000.
Gaekel, L.; Schrader, E.K. (1992): RCC mixes and properties using poor quality materials: Concepcion Dam. Proceedings of the Roller Compacted Concrete III Conference, February, 2nd-5th 1992, San Diego, USA, p. 358-373, Ed.:Hansen, K.D., McLean, F.G., 1992.
240
Garboczi, E.J.; Bentz, D.P.; Snyder, K.A.; Martys, N.S.; Stutzman, P.E. et al. (2005): Modeling and measuring the structure and properties of cement-based materials. Electronic Monograph, National Institute of Standards and Technology (NIST), Gaithersburg, USA, http://www.nist.gov, as of April 2005, 2005.
Gibbon, G.J.; Ballim, Y. (1998): Determination of the thermal conductivity of concrete during the early stages of hydration. Magazine of Concrete Re-search, 50, No. 3 (1998), p. 229-235, 1998.
Goltz, M. (2001): Simulation of temperature and stress during and after RCC dams construction. Diploma Thesis, Institut für Baustatik, Universität Karlsruhe (TH), Karlsruhe, 2001, (unpublished).
Graça, N.G.; Batista, E.L.; Bittencourt, R.M. (2003): The use of pulverized ag-gregates for concrete production. Proceedings of the International Sympo-sium on Roller Compacted Concrete Dams, November 17th-19th 2003, Ma-drid, Spain, p. 433-437, Ed.: Berga, L.; Buil, J.M.; Jofré, C.; Chonggang, S., ISBN 90 5809 564 9, A.A. Balkema, 2003.
Grube, H.; Hintzen, W. (1993): Prüfverfahren zur Voraussage der Temperaturer-höhung im Beton infolge Hydratationswärme des Zements (Teil 2). Beton-technische Berichte des Forschungsinstitut der Zementindustrie, in Beton 6/93, p. 292-295, 1993, (in German).
Hannant, D.J.; Branch, J.; Mulheron, M. (1999): Equipment for tensile testing of fresh concrete. Magazine of Concrete Research, 51, No. 4 (1999), p. 263-267, 1999.
Hansen, K.D. (1979): Cost of mass concrete in dams. Portland Cement Association (PCA), Skokie, USA, 1979.
Hennecke, M. (2001): Rechnerische Beurteilung der Temperaturbelastung und der Rissgefahr infolge Eigenspannungen bei jungem Hochleistungsbeton. Disser-tation, Lehrstuhl für Massivbau der Technischen Universität München, Mu-nich, Germany, 2001, (in German).
Hundt, J.; Wagner, A. (1978): Einfluss des Feuchtegehaltes und des Reifegrades auf die Wärmeleitfähigkeit von Beton. Deutscher Ausschuss für Stahlbeton (DAStb), Heft 297, Verlag Ernst & Sohn, Berlin, 1978, (in German).
ICOLD (1972): Pozzolans and slags for concrete for large dams. ICOLD Bulletin No. 22, Committee on Concrete for Dams, International Commission on Large Dams (ICOLD), 1972.

241
ICOLD (2003): State-of-the-art of Roller Compacted Concrete dams. ICOLD Bul-letin No. 125, Committee on Concrete for Dams, International Commission on Large Dams (ICOLD), 2003.
Jonasson, J.-E.; Hedlund, H. (2001): Framework for restraint factors. Report BE96-3843/2001:65-6, Improved Production of Advanced Concrete Struc-tures (IPACS), Luleå University of Technology, ISBN 91-89580-65-6, 2001.
Kim, H.-M. (2001): Creep characteristicsof rocks and concrete - A comparison. Korean Tunneling Association (KTA), Vol. 3, No. 2 (2001), p. 33-56, 2001, http://www.tunnel.or.kr/paper/2001_6_4.pdf, as of December 2004.
Kim, J.-K.; Han, S.H.; Song, Y.C. (2002): Effect of temperature and aging on the mechanical properties of concrete – Part I. Experimental results. Cement and Concrete Research, Vol. 32, No. 7 (2002), p. 1087-1094, 2002.
Kim, J.-K.; Han, S.H.; Song, Y.C. (2002): Effect of temperature and aging on the mechanical properties of concrete – Part II. Prediction model. Cement and Concrete Research, Vol. 32, No. 7 (2002), p. 1095-1100, 2002.
Kjellman, O.; Olofsson, J. (2001): 3D structural analysis of crack risk in harden-ing concrete. Report BE96-3843/2001:53-2, Improved Production of Ad-vanced Concrete Structures (IPACS), Luleå University of Technology, ISBN 91-89580-53-2, 2001.
Lackner, R.; Hellmich, Ch.; Mang, H.A. (2002): Constitutive modeling of cemen-titious materials in the framework of chemoplasticity. International Journal for Numerical Methods in Engineering, 2002, 53, p. 2357-2388, John Wiley & Sons Ltd., 2002.
Lackner, R.; Mang, H.A. (2004): Chemoplastic material model for the simulation of early-age cracking: From the constitutive law to numerical analyses of massive concrete structures. Cement & Concrete Composites, 2004, 26, p. 551-562, Elsevier., 2004.
Lackner, R.; Pichler, Ch.; Mang, H.A. (2004): Thermochemomechanics of ce-ment-based materials at finer scales of observation: Application to hybrid analyses of shotcrete tunnel linings. Proceedings of the NATO Advanced Research Workshop “Multi-physics and multi-scale computer models in non-linear analysis and optimal design of engineering structures under extreme conditions”, June 13th-17th, 2004, Bled, Slovenia, 2004.

242
LI, HA, ACE (2003): Mujib Dam Project – RCC Final Report. Final Report on RCC matters at the Mujib Dam Project, Lahmeyer International (LI), Hamza Associates (HA) in co-operation with Arab Consultant Engineers (ACE), as of August 2003, Mujib Dam, Jordan, 2003.
Lama, R.D.; Vutukuri, V.S. (1978): Handbook on mechanical properties of rock. Testing techniques and results. Vol. II, Clausthal, 1978.
Langan, B.W.; Weng, K.; Ward, M.A. (2002): Effect of silica fume and fly ash on heat of hydration of portland cement. Cement and Concrete Research, Vol. 32, No. 7 (2002), p. 1045-1051, 2002.
Larson, M. (2001): Improved hand calculation method. Report BE96-3843/2001:56-7, Improved Production of Advanced Concrete Structures (IPACS), Luleå University of Technology, ISBN 91-89580-56-7, 2001.
Larson, M.; Jonasson, J.-E. (2003): Linear logarithmic model for concrete creep – I. Formulation and evaluation. Journal of advanced Concrete Technology, Vol. 1, No. 2 (2003), p. 172-187, 2003.
Larson, M.; Jonasson, J.-E. (2003): Linear logarithmic model for concrete creep – II. Prediction formulas for description of creep behaviour. Journal of ad-vanced Concrete Technology, Vol. 1, No. 2 (2003), p. 188-200, 2003.
Laube, M. (1990): Werkstoffmodell zur Berechnung von Temperaturspannungen in massigen Betonbauteilen im jungen Alter. Dissertation, Institut für Baustoffe, Massivbau und Brandschutz der Technischen Universität Carolo-Wilhelmina zu Braunschweig, Braunschweig, Germany, 1990, (in German).
Li, J.; Peng, X.; Cao, J.; Chen, G.; Tian, J. et al. (2004): Development and re-search of high belite cement dam concrete with low heat and high crack re-sistance. Proceedings of the International Workshop on Sustainable Devel-opment and Concrete Technology, May 20th-21st 2004, Beijing, China, p. 251-265, Ed.: Iowa State University, ISBN 0-9652310-7-0, 2004.
Li, Q.; Zhang, F.; Zhang, W.; Yang, L. (2002): Fracture and tension properties of Roller Compacted Concrete cores in uniaxial tension. ASCE Journal of Materials in Civil Engineering, Vol. 14, No. 5 (2002), p. 366-373, 2002.
Lin, Ch.; Tu, Ch. (1999): Study on properties of RCC with high temperature water reducing retarder. Proceedings of the International Symposium on Roller Compacted Concrete Dams, April 21st-25th 1999, Chengdu, China, p. 213-225, Ed.: Dept. of Structures and Materials of the China Institute of Water Resources and Hydropower Research (IWHR), Beijing, 1999.

243
Liu, G.; Gao, H.; Chen, F.Q. (2002): Microstudy on creep of concrete at early age under biaxial compression. Cement and Concrete Research, Vol. 32, No. 1 (2002), p. 1-6, 2002.
Liu, G.; Li, P.; Hu, Y.; Zhang, F. (1999): The RCC arch dam structure on Taxi River and water storage measure during construction. Proceedings of the In-ternational Symposium on Roller Compacted Concrete Dams, April 21st-25th 1999, Chengdu, China, p. 110-121, Ed.: Dept. of Structures and Materials of the China Institute of Water Resources and Hydropower Research (IWHR), Beijing, 1999.
Liu, G.; Lu, J.; Wang, Z.; Xiao, S. (2002): Study on the reduction of tensile strength of concrete due to triaxial compressive loading history. Magazine of Concrete Research, 54, No. 2 (2002), p. 113-124, 2002.
Long, D.; Luo, M. (1999): Mix design of RCC in Dachaoshan Hydropower Pro-ject. Proceedings of the International Symposium on Roller Compacted Con-crete Dams, April 21st-25th 1999, Chengdu, China, p. 349-355, Ed.: Dept. of Structures and Materials of the China Institute of Water Resources and Hy-dropower Research (IWHR), Beijing, 1999.
Lopes-Madaleno, A.C. (2002): Erfassung von Verformungs- und Spannungszu-ständen im jungen Beton infolge Temperatur. Dissertation, Fakultät Bauin-genieurwesen der Bauhaus Universität Weimar, Weimar, Germany, 2002, (in German).
López, J. (2002): Private discussion on RCC matters. Mujib Dam Site, Jordan, 2002.
López, J.; Aridah, M.F.; Schrader, E.K. (2003): RCC quality control for Mujib dam. Proceedings of the International Symposium on Roller Compacted Concrete Dams, November 17th-19th 2003, Madrid, Spain, p. 983-994, Ed.: Berga, L.; Buil, J.M.; Jofré, C.; Chonggang, S., ISBN 90 5809 564 9, A.A. Balkema, 2003.
López, J.; Castro, G.; Schrader, E.K. (2003): RCC mix and thermal behaviour of Miel I dam – design stage. Proceedings of the International Symposium on Roller Compacted Concrete Dams, November 17th-19th 2003, Madrid, Spain, p. 789-797, Ed.: Berga, L.; Buil, J.M.; Jofré, C.; Chonggang, S., ISBN 90 5809 564 9, A.A. Balkema, 2003.
Lorenzo, A.C.; Calivari, S.S. (1992): Behaviour of Urugua I Dam. Proceedings of the Roller Compacted Concrete III Conference, February, 2nd-5th 1992, San Diego, USA, p. 272-290, Ed.:Hansen, K.D., McLean, F.G., 1992.

244
Lura, P.; van Breugel, K. (2001): Thermal properties of concrete: Sensitivity stud-ies. Report BE96-3843/2001:15-X, Improved Production of Advanced Con-crete Structures (IPACS), Luleå University of Technology, ISBN 91-89580-15-X, 2001.
Malkawi, A.H.I. (2002): Quality program for RCC at Mujib Dam project: Direct tension test. Laboratory Report, Consultative Center for Science and Tech-nology of the Jordan University of Science and Technology, Irbid, Jordan, 2002.
Malkawi, A.I.H.; Shaia, H.; Mutasher, S.; Aridah, M. (2003): A comparative study of mechanical properties of RCC trial mix using two different cementi-tious materials (fly ash and natural pozzolan). Proceedings of the Interna-tional Symposium on Roller Compacted Concrete Dams, November 17th-19th 2003, Madrid, Spain, p. 809-815, Ed.: Berga, L.; Buil, J.M.; Jofré, C.; Chonggang, S., ISBN 90 5809 564 9, A.A. Balkema, 2003.
Martin, J.; Sánchez, J.F.; Gil, A.; Ortega, F.; Manueco, M.G. (2003): Design, construction and operation of Cenza Dam (Spain). Proceedings of the Inter-national Symposium on Roller Compacted Concrete Dams, November 17th-19th 2003, Madrid, Spain, p. 1149-1159, Ed.: Berga, L.; Buil, J.M.; Jofré, C.; Chonggang, S., ISBN 90 5809 564 9, A.A. Balkema, 2003.
Marulanda, A.; Castro, A. (2003): Design features for Porce III RCC dam. Pro-ceedings of the International Symposium on Roller Compacted Concrete Dams, November 17th-19th 2003, Madrid, Spain, p. 661-667, Ed.: Berga, L.; Buil, J.M.; Jofré, C.; Chonggang, S., ISBN 90 5809 564 9, A.A. Balkema, 2003.
Marulanda, A.; Castro, A.; Rubiano, N. (2002): RCC quality control for Miel I Dam. Proceedings of the International Conference on RCC Dams Construc-tion in the Middle East, April 7th-10th 2002, Irbid, Jordan, p. 178-190, Jordan University of Science & Technology, 2002.
Mass, G.R. (2002): Facing methods and materials for RCC construction. Proceed-ings of the International Conference on RCC Dams Construction in the Mid-dle East, April 7th-10th 2002, Irbid, Jordan, p. 222-236, Jordan University of Science & Technology, 2002.
Metcalf, M.; Dolen, T.P.; Hendricks, P.A. (1992): Santa Cruz dam modification. Proceedings of the Roller Compacted Concrete III Conference, February, 2nd-5th 1992, San Diego, USA, p. 459-475, Ed.:Hansen, K.D., McLean, F.G., 1992.

245
Mindess, S.; Young, J.F.; Darwin, D. (2003): Concrete. Second edition, ISBN 0-13-064632-6, Prentice Hall, Upper Saddle River, 2003.
Morabito, P. (2001): Thermal properties of concrete. Variations with the tempera-ture and during hydration phase. Report BE96-3843/2001:18-4, Improved Production of Advanced Concrete Structures (IPACS), Luleå University of Technology, ISBN 91-89580-18-4, 2001.
Neville, A.M.; Brooks, J.J. (1990): Concrete Technology. Revised reprint, ISBN 0-582-98859-4, Prentice Hall, Harlow, 1990.
Nilsson, M. (2003): Restraint factors and partial coefficients for crack risk analysis of early age concrete structures. Doctoral thesis, Division of Structural En-gineering, Luleå University of Technology, ISBN 91-89580-05-2, 2003.
Oluokun, F.A. (1991c): Prediction of concrete tensile strength from its compres-sive strength: Evaluation of existing relations for normal weight concrete. ACI Materials Journal, Vol. 88, No. 3 (1991), p. 302-309, 1991.
Oluokun, F.A.; Burdette, E.G.; Deatherage, J.H. (1991a): Elastic modulus, Pois-son’s ratio and compressive strength relationships at early ages. ACI Mate-rials Journal, Vol. 88, No. 1 (1991), p. 3-10, 1991.
Oluokun, F.A.; Burdette, E.G.; Deatherage, J.H. (1991b): Splitting tensile strength and compressive strength relationship at early ages. ACI Materials Journal, Vol. 88, No. 2 (1991), p. 115-121, 1991.
Payer, A. (2001): Climate, weather, water. In: Developing country studies, Chapter 2, Ed.: Payer, M., Stuttgart, Germany, http://www.payer.de/entwicklung, as of March 2005, 2001.
Pendse, V.N.; Damani, R.L.; Kshirsagar, S.L.; Narkhede, C.L. (2003): Mix de-sign of Roller Compacted Concrete for Ghatghar pumped storage scheme in India. Proceedings of the International Symposium on Roller Compacted Concrete Dams, November 17th-19th 2003, Madrid, Spain, p. 839-848, Ed.: Berga, L.; Buil, J.M.; Jofré, C.; Chonggang, S., ISBN 90 5809 564 9, A.A. Balkema, 2003.
Perzlmaier, S.; Aufleger, M.; Conrad, M. (2004): Distributed fibre optic tem-perature measurements in Hydraulic Engineering – Prospects of the Heat-up Method. Proceedings of the 72nd ICOLD Annual Meeting, May 16th-22nd 2004, Seoul, South Korea, International Commission on Large Dams (ICOLD), 2004.

246
Plannerer, M. (2000): Temperaturspannungen in massigen Bauteilen. Beiträge zum 38. Forschungskolloquium des Deutschen Ausschuss für Stahlbeton (DAStb), March 2nd-3rd 2000, Munich, Germany, p. 27-39, Ed.: Lehrstuhl für Baustoffkunde und Werkstoffprüfung, Lehrstuhl für Massivbau, TU Mün-chen, 2000, (in German).
Raphael, J.M. (1992): The optimum gravity dam. Reprint of the 1970 published paper in Proceedings of the Roller Compacted Concrete III Conference, Feb-ruary 2nd-5th 1992, San Diego, California, p. 5-19, Ed.: Hansen, K.D.; McLean, F.G., American Society of Civil Engineers (ASCE), New York, 1992.
Rostásy, F.S.; Gutsch, A.W.; Krauß,M. (2001): Computation of stressesand cracking criteria for early age concrete – Methods of the IBMB. Report BE96-3843/2001:35-4, Improved Production of Advanced Concrete Struc-tures (IPACS), Luleå University of Technology, ISBN 91-89580-35-4, 2001.
Salete, E.; Lancha, J.C. (1998): Presas de hormigón – Problemas térmicos evo-lutivos. Colección Seinor No. 18, Colegio de Ingenieros de Caminos, Canales y Puertos, Madrid, ISBN 84-380-0132-7, Madrid, 1998, (in Spanish).
Sanner, B.; Reuß, M.; Mands, E.; Müller, J. (1999): Erfahrungen mit dem Ther-mal Response Test in Deutschland. Institut für Angewandte Geowissenschaf-ten der Justus-Liebig-Universität Gießen, 1999, (in German).
Santafé, J.M. (1995): Opening of the Symposium. Proceedings of the International Symposium on Roller Compacted Concrete Dams, October 2nd-4th, 1995, Santander, Spain, p. 1206-1210, Ed.: IECA; CNEGP, ISBN 84-920356-1-7, 1995.
Santana, H.; Castell, E. (2003): Miel I: RCC dam, height world record. Proceed-ings of the International Symposium on Roller Compacted Concrete Dams, November 17th-19th 2003, Madrid, Spain, p. 345-353, Ed.: Berga, L.; Buil, J.M.; Jofré, C.; Chonggang, S., ISBN 90 5809 564 9, A.A. Balkema, 2003.
Scharf, F. (2004): Ermittlung der Wärmeleitfähigkeit mit der Aufheizmethode – Versuche und theoretische Berechnungen. Diploma Thesis, Institute and Laboratory of Hydraulic and Water Resources Engineering, Technische Uni-versität München, 2004, (in German, unpublished).
Schikora, K.; Eierle, B. (1999): Berechnungsmodelle für Betonbauteile unter frü-hem Temperaturzwang. Proceedings of “Baustatik – Baupraxis 7”, p. 423-430, A.A. Balkema, 1999, (in German).

247
Schrader, E.K. (1995): RCC: current practices, controversies and options. Interna-tional Journal on Hydropower & Dams, September 1995, p. 80-88, 1995.
Schrader, E.K. (1999): Roller Compacted Concrete (RCC) for dams. General overview and comments for Lahmayer/Hamza pertinent to the Mujib project, (not published).
Schrader, E.K. (2001): Mujib Dam Project – Updated thermal analysis. Report to the Jordan Ministry of Water and Irrigation and Jordan Valley Authority, January 2001, Lahmeyer International, Hamza Associates and ACE, 2001, (not published).
Schrader, E.K.; López, J.; Aridah, M.F. (2003): Mix design and properties of RCC at Mujib Dam – high and low cementitious content. Proceedings of the International Symposium on Roller Compacted Concrete Dams, November 17th-19th 2003, Madrid, Spain, p. 859-864, Ed.: Berga, L.; Buil, J.M.; Jofré, C.; Chonggang, S., ISBN 90 5809 564 9, A.A. Balkema, 2003.
Scuero, A.M.; Vaschetti, G.L.; Wilkes, J.A. (2002): State-of-the-art of geomem-brane facing systems for RCC dams. Proceedings of the International Con-ference on RCC Dams Construction in the Middle East, April 7th-10th 2002, Irbid, Jordan, p. 237-249, Jordan University of Science & Technology, 2002.
Shatnawi, E.S. (2004): Determination of temperature distributions and thermal stresses for RCC dams using two different finite element codes. Master The-sis, Faculty of Graduate Studies, Jordan University of Science and Technol-ogy, 2004, (unpublished).
Springenschmid, H. (1987): Betontechnologie im Wasserbau. Wasserbauten aus Beton, Berlin, Ed.: Blind, H., ISBN 3-433-01009-9, Ernst & Sohn, Berlin, 1987, (in German).
Stabel, B.; Wigand, R. (2004): Mujib Talsperre, Jordanien. Proceedings of the 13.
Deutsches Talsperrensymposium, October 13th-14nd 2004, Weimar, Ger-many, German National Committee on Large Dams (DTK), Essen, 2004.
Tangtermsirikul, S.; Kaewkhluab, T.; Jitvutikrai, P. (2004): A compressive strength model for Roller Compacted Concrete with fly ash. Magazine of Concrete Research, 56, No. 1 (2004), p. 35-44, 2004.
Tank, R.C.; Carino, N.J. (1991): Rat constant functions for strength development of concrete. ACI Materials Journal, Vol. 88, No. 1 (1991), p. 74-83, 1991.

248
Tasdemir, M.A.; Karihaloo, B.L. (2001): Effect of aggregate volume fraction on the fracture parameters of concrete: a meso-mechanical approach. Maga-zine of Concrete Research, 53, No. 6 (2001), p. 405-415, 2001.
Tatro, S.; Schrader, E.K. (1992): Thermal analysis for RCC – A practical ap-proach. Proceedings of the Roller Compacted Concrete III Conference, Feb-ruary, 2nd-5th 1992, San Diego, USA, p. 389-406, Ed.:Hansen, K.D., McLean, F.G., 1992.
Tatro, S.B.; Bombich, A.A.; Hess J.R. (2000): Case histories of mass concrete thermal studies. Final Report of the Structures Laboratory of the ERDC/SL, TR-00-8, Engineer Research and Development Center (ERDC), US Army Corps of Engineers (USACE), 2000.
Tsivilis, S.; Parissakis, G. (1995): A mathematical model for the prediction of ce-ment strength.. Cement and Concrete Research, Vol. 25, No. 1 (1995), p. 9-14, 1995.
USACE (1993): Engineering and Design: Structural design using the Roller Com-pacted Concrete (RCC) construction process. Engineer Technical Letter ETL 1110-2-343 (May 1993), U.S. Army Corps of Engineers, Washington D.C., 1993.
USACE (1997): Engineering and Design: Thermal studies of mass concrete struc-tures. Engineer Technical Letter ETL 1110-2-542 (May 1997), U.S. Army Corps of Engineers, Washington D.C., 1997.
USACE (2000): Engineering and Design: Roller Compacted Concrete. Engineer Manual EM 1110-2-2006 (January 2000), U.S. Army Corps of Engineers, Washington D.C., 2000.
USACE (2001): Engineering and Design: Standard practice for concrete for civil works structures. Engineer Manual EM 1110-2-2000 (March 2001), U.S. Army Corps of Engineers, Washington D.C., 2001.
van Breugel, K. (2001a): Stress predictions in hardening concrete. Report BE96-3843/2001:37-0, Improved Production of Advanced Concrete Structures (IPACS), Luleå University of Technology, ISBN 91-89580-37-0, 2001.
van Breugel, K. (2001b): Modelling of strength development in hardening con-crete. Report BE96-3843/2001:40-0, Improved Production of Advanced Concrete Structures (IPACS), Luleå University of Technology, ISBN 91-89580-40-0, 2001.
249
van Breugel, K.; Koenders, E:A:B. (2001): Solar radiation. Report BE96-3843/2001:31-1, Improved Production of Advanced Concrete Structures (IPACS), Luleå University of Technology, ISBN 91-89580-31-1, 2001.
Vilardell, J.; Aguado, A.; Agullo, L.; Gettu, R. (1998): Estimation of the modulus of elasticity for dam concrete. Cement and Concrete Research, Vol. 28, No. 1 (1998), p. 93-101, 1998.
Vitharana, N.; Wark, R. (2002): Thermal cracking in large concrete placements: Theory and applications. Proceedings of the 2002 Conference on Dams, Australian National Commitee On Large Dams (ANCOLD), 2002.
Wagner, J.-P.; Nietner, L.; Nicklas, M. (2005): The Leibis/Lichte Dam: Concrete concept and temperature management. Wasserwirtschaft, No. 1/2 2005, p. 48-53, Vieweg Verlag, Wiesbaden, 2005, (in German).
Wang, Y.; Chen, Y.; Li, J.; Xiao, H.; Yang, H. (2003): Study on properties of RCC for cofferdam III of the Three Gorges Project. Proceedings of the Inter-national Symposium on Roller Compacted Concrete Dams, November 17th-19th 2003, Madrid, Spain, p. 1085-1088, Ed.: Berga, L.; Buil, J.M.; Jofré, C.; Chonggang, S., ISBN 90 5809 564 9, A.A. Balkema, 2003.
Wee, T.H.; Lu, H.R.; Swaddiwudhipong, S. (2000): Tensile strain capacity of concrete under various states of stress. Magazine of Concrete Research, 52, No. 3 (2000), p. 185-193, 2000.
Weigler, H.; Karl, S. (1989): Beton. Arten, Herstellung, Eigenschaften. Handbuch für Beton-, Stahlbeton- und Spannbetonbau, Berlin, Ed.: Kupfer, H., ISBN 3-433-01332-2, Ernst & Sohn, Berlin, 1989.
Wiegrink, K.-H. (2001): Mujib Dam: Stressmeter measurements. Intermediate Re-port to the DFG/BMZ-Project Au 167/1-1 “Distributed fibre optic tempera-ture measurements in RCC dams”, Institute of Construction Materials and Materials Testing, Technische Universität München, Munich, 2004, (in Ger-man, unpublished).
Wiegrink, K.-H. (2002): Stress measurements in RCC with stressmeter. Proceed-ings of the International Conference on RCC Dams Construction in the Mid-dle East, April 7th-10th 2002, Irbid, Jordan, p. 494-501, Jordan University of Science & Technology, 2002.

250
Wildner, H. (2002): Injektion von porösem Massenbeton mit hydraulischen Bin-demitteln. Dissertation, Berichte des Lehrstuhls und der Versuchsanstalt für Wasserbau und Wasserwirtschaft der Technischen Universität München, No. 92 (2002), Munich, Germany, Ed.: Strobl, Th., ISSN 1437-3513, 2002, (in German).
Wood, S.L. (1991): Evaluation of the long-term properties of concrete. ACI Mate-rials Journal, Vol. 88, No. 6 (1991), p. 630-643, 1991.
Ye, G.; van Breugel, K.; Fraaij, A.L.A. (2002): Experimental study and numeri-cal simulation on the formation of microstructure in cementitious materials at early age. Cement and Concrete Research, Vol. 32, No. 1 (2002), p. 1-7, 2002.
Yue, Y.; Huang, S.; Hu, P.; Ding, B. (1999): The key techniques to control ther-mal cracking in RCC dams in cold regions. Proceedings of the International Symposium on Roller Compacted Concrete Dams, April 21st-25th 1999, Chengdu, China, p. 501-513, Ed.: Dept. of Structures and Materials of the China Institute of Water Resources and Hydropower Research (IWHR), Bei-jing, 1999.
Zhang, G.; Zhu, B.; Guo, N. (2003): Thermal stress simulation and possible crack analysis of Mianhuatan RCC dam. Proceedings of the International Sympo-sium on Roller Compacted Concrete Dams, November 17th-19th 2003, Ma-drid, Spain, p. 603-609, Ed.: Berga, L.; Buil, J.M.; Jofré, C.; Chonggang, S., ISBN 90 5809 564 9, A.A. Balkema, 2003.
Zhou, F.P.; Lydon, F.D., Barr, B.I.G. (1995): Effect of coarse aggregate on elas-tic modulus and compressive strength of high performance concrete. Cement and Concrete Research, Vol. 25, No. 1 (1995), p. 177-186, 1995.
Zhu, B.; Xu, P. (1995): Thermal stresses in Roller Compacted Concrete Dams. Dam Engineering, Vol. VI, Issue 3 (1995), p. 199-220, 1995.

251
APPENDIX
A0 Designation of construction parameters varied in the parametric study
A1 Parametric study: Temperature and stress histories corresponding to the variation of construction start date and placement speed
A2 Parametric study: Temperature and stress histories corresponding to the variation of placement break locations
A2-1 Placement break close to the foundation
A2-2 Placement break far from the foundation
A3 Parametric study: Temperature and stress histories corresponding to the variation of placement technology
A4 Parametric study: Temperature and stress histories corresponding to the variation of facing concrete

252
A0 Designation of construction parameters varied in the parametric study
Parameter Variation Comment
Construction start date D D1: 31.01.01 D2: 31.07.01
Placement speed v v1 = 10 cm/d v2 = 20 cm/d v3 = 30 cm/d
⇔ 1 layer per 3 days ⇔ 2 layers per 3 days ⇔ 1 layer per day
Placement break location L L1 = 146.1 masl L2 = 164.1 masl
⇔ 3 m above foundation ⇔ 21 m above foundation
Break extension E 0 E2 = 120 d
⇔ continuous placement ⇔ season spanning break
Placement method HO SL
⇔ traditional horizontal layers ⇔ sloped layer method (3 m in
1 day, 9 days exposure) Facing method CVC, GEVRCC

253
A1 Parametric study: Temperature and stress histories corresponding to the variation of construction start date and placement speed
-3
-2
-1
0
1
2
3
Stre
ss [M
Pa]
5
10
15
20
25
30
35
40
45
01.07.2001 26.06.2002 21.06.2003Date
Tem
pera
ture
[°C
]
-3
-2
-1
0
1
2
3
Stre
ss [M
Pa]
5
10
15
20
25
30
35
40
45
01.01.2001 27.12.2001 22.12.2002Date
Tem
pera
ture
[°C
]
a) D1 – v1 b) D2 – v1
143.1 to 181.5masl ΔH=3m
143.1 to 181.5masl ΔH=3m 143.1 to 181.5masl ΔH=3m
143.1 to 181.5masl ΔH=3m
ft(14d)=0.4MPaft(90d)=0.7MPaft(360d)=1.1MPa
ft(14d)=0.4MPaft(90d)=0.7MPaft(360d)=1.1MPa
Fig. A1-1: Parametric study: Temperature and cross-valley stress histories in dam
centre in dependence on construction start date (10 cm/d).
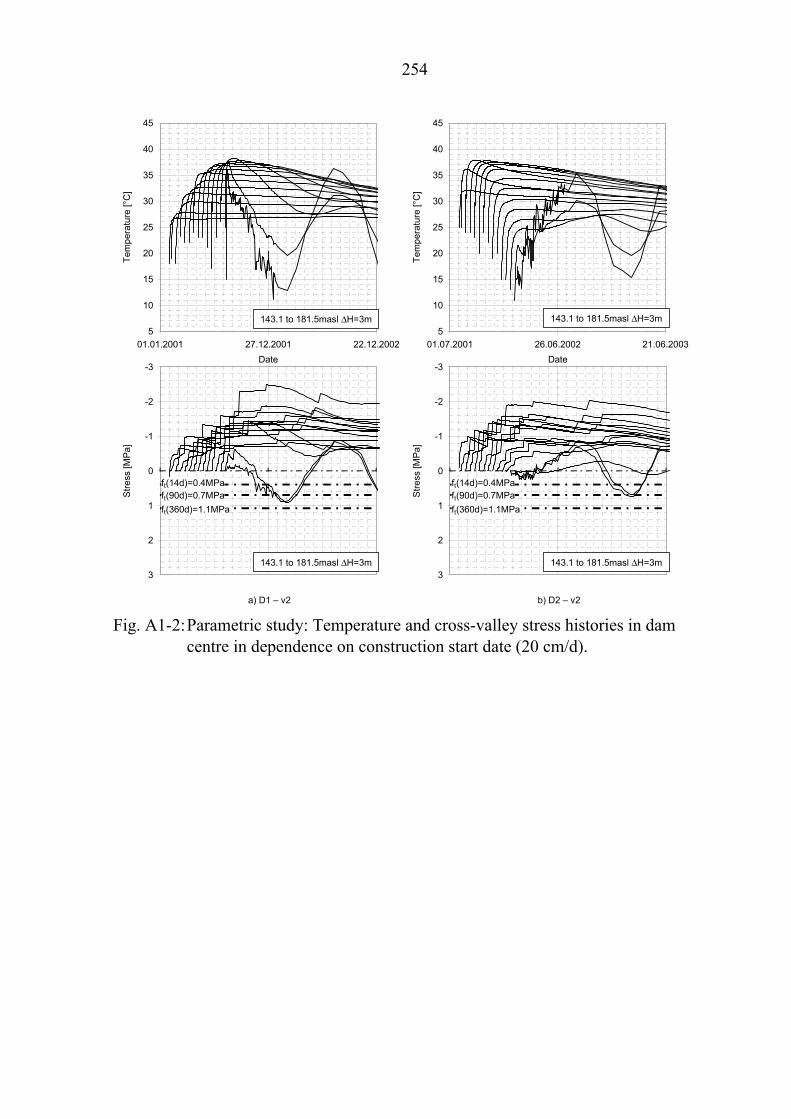
254
-3
-2
-1
0
1
2
3
Stre
ss [M
Pa]
5
10
15
20
25
30
35
40
45
01.07.2001 26.06.2002 21.06.2003Date
Tem
pera
ture
[°C
]
-3
-2
-1
0
1
2
3
Stre
ss [M
Pa]
5
10
15
20
25
30
35
40
45
01.01.2001 27.12.2001 22.12.2002Date
Tem
pera
ture
[°C
]
a) D1 – v2 b) D2 – v2
143.1 to 181.5masl ΔH=3m
143.1 to 181.5masl ΔH=3m 143.1 to 181.5masl ΔH=3m
143.1 to 181.5masl ΔH=3m
ft(14d)=0.4MPaft(90d)=0.7MPaft(360d)=1.1MPa
ft(14d)=0.4MPaft(90d)=0.7MPaft(360d)=1.1MPa
Fig. A1-2: Parametric study: Temperature and cross-valley stress histories in dam
centre in dependence on construction start date (20 cm/d).
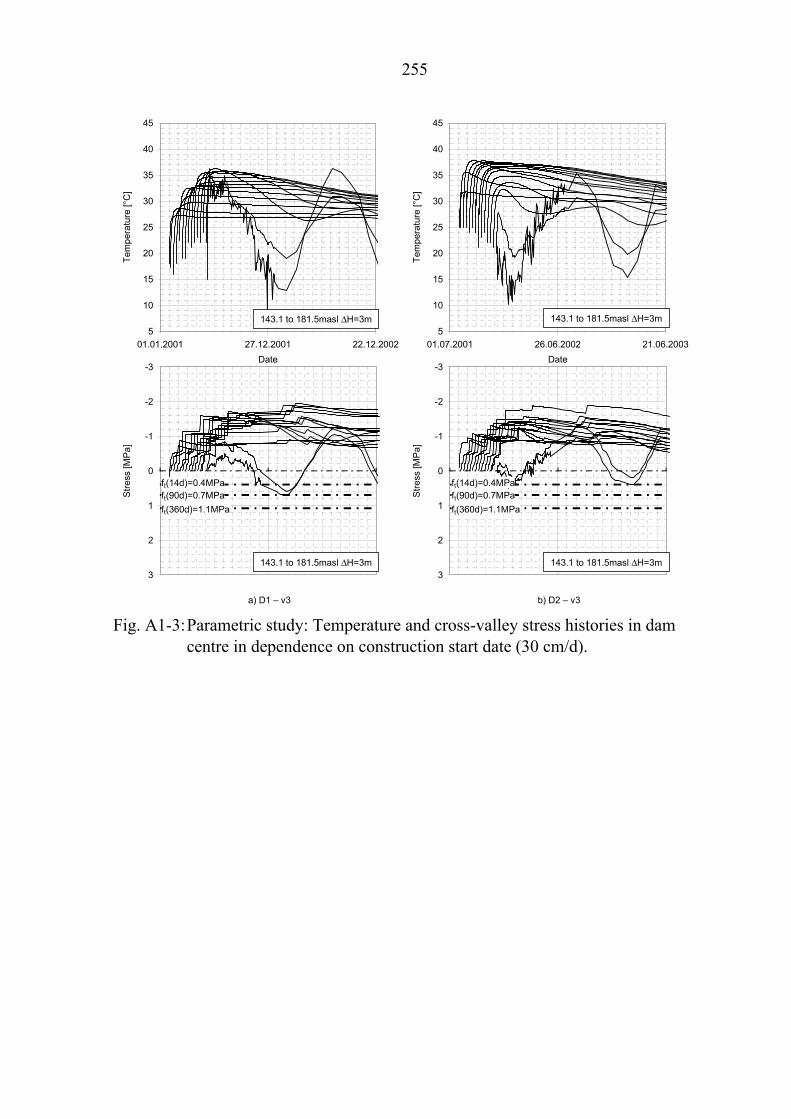
255
-3
-2
-1
0
1
2
3
Stre
ss [M
Pa]
5
10
15
20
25
30
35
40
45
01.07.2001 26.06.2002 21.06.2003Date
Tem
pera
ture
[°C
]
-3
-2
-1
0
1
2
3
Stre
ss [M
Pa]
5
10
15
20
25
30
35
40
45
01.01.2001 27.12.2001 22.12.2002Date
Tem
pera
ture
[°C
]
a) D1 – v3 b) D2 – v3
143.1 to 181.5masl ΔH=3m
143.1 to 181.5masl ΔH=3m 143.1 to 181.5masl ΔH=3m
143.1 to 181.5masl ΔH=3m
ft(14d)=0.4MPaft(90d)=0.7MPaft(360d)=1.1MPa
ft(14d)=0.4MPaft(90d)=0.7MPaft(360d)=1.1MPa
Fig. A1-3: Parametric study: Temperature and cross-valley stress histories in dam
centre in dependence on construction start date (30 cm/d).

256
-3
-2
-1
0
1
2
3
Stre
ss [M
Pa]
5
10
15
20
25
30
35
40
45
01.07.2001 26.06.2002 21.06.2003Date
Tem
pera
ture
[°C
]
-3
-2
-1
0
1
2
3
Stre
ss [M
Pa]
5
10
15
20
25
30
35
40
45
01.01.2001 27.12.2001 22.12.2002Date
Tem
pera
ture
[°C
]
a) D1 – v1 b) D2 – v1
144.6 to 180.6masl ΔH=3m 144.6 to 180.6masl ΔH=3m
ft(14d)=1.9MPa
ft(90d)=2.5MPa 144.6 to 180.6masl ΔH=3m
ft(14d)=1.9MPa
ft(90d)=2.5MPa 144.6 to 180.6masl ΔH=3m
Fig. A1-4: Parametric study: Temperature and cross-valley stress histories in up-
stream facing in dependence on construction start date (10 cm/d).
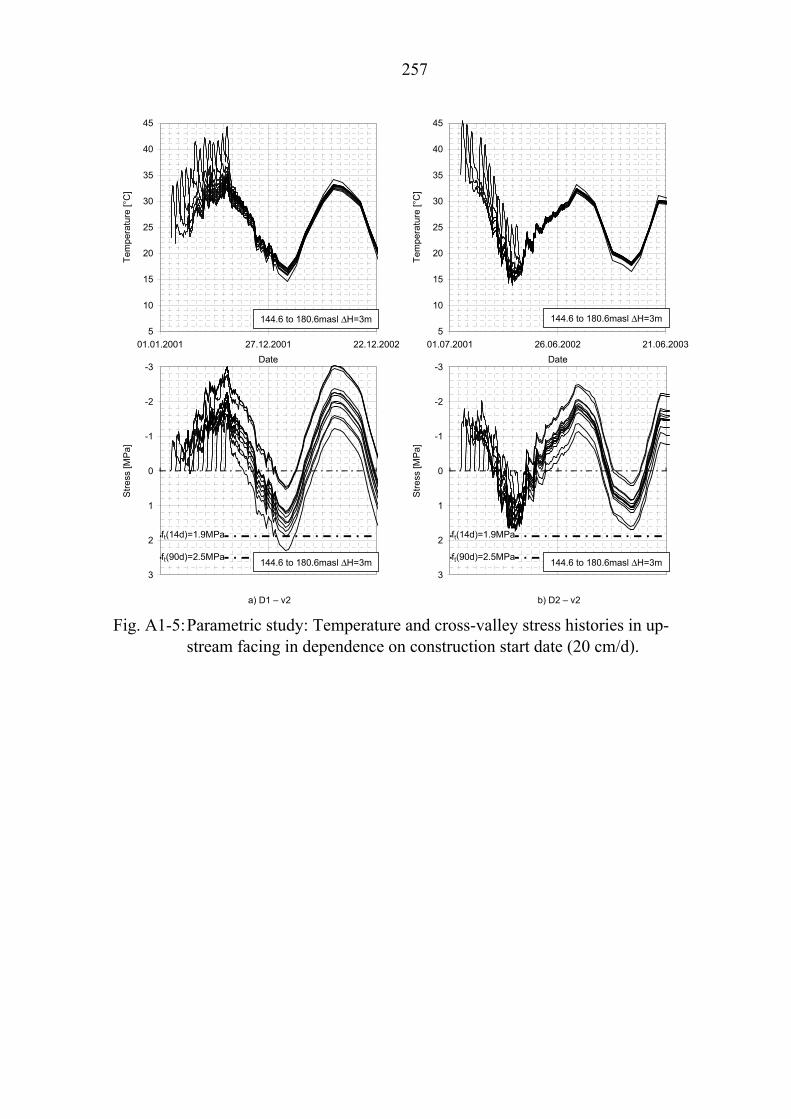
257
-3
-2
-1
0
1
2
3
Stre
ss [M
Pa]
5
10
15
20
25
30
35
40
45
01.07.2001 26.06.2002 21.06.2003Date
Tem
pera
ture
[°C
]
-3
-2
-1
0
1
2
3
Stre
ss [M
Pa]
5
10
15
20
25
30
35
40
45
01.01.2001 27.12.2001 22.12.2002Date
Tem
pera
ture
[°C
]
a) D1 – v2 b) D2 – v2
144.6 to 180.6masl ΔH=3m 144.6 to 180.6masl ΔH=3m
ft(14d)=1.9MPa
ft(90d)=2.5MPa 144.6 to 180.6masl ΔH=3m
ft(14d)=1.9MPa
ft(90d)=2.5MPa 144.6 to 180.6masl ΔH=3m
Fig. A1-5: Parametric study: Temperature and cross-valley stress histories in up-
stream facing in dependence on construction start date (20 cm/d).

258
-3
-2
-1
0
1
2
3
Stre
ss [M
Pa]
5
10
15
20
25
30
35
40
45
01.07.2001 26.06.2002 21.06.2003Date
Tem
pera
ture
[°C
]
-3
-2
-1
0
1
2
3
Stre
ss [M
Pa]
5
10
15
20
25
30
35
40
45
01.01.2001 27.12.2001 22.12.2002Date
Tem
pera
ture
[°C
]
a) D1 – v3 b) D2 – v3
144.6 to 180.6masl ΔH=3m 144.6 to 180.6masl ΔH=3m
ft(14d)=1.9MPa
ft(90d)=2.5MPa 144.6 to 180.6masl ΔH=3m
ft(14d)=1.9MPa
ft(90d)=2.5MPa 144.6 to 180.6masl ΔH=3m
Fig. A1-6: Parametric study: Temperature and cross-valley stress histories in up-
stream facing in dependence on construction start date (30 cm/d).

259
A2 Parametric study: Temperature and stress histories corresponding to the variation of placement break locations
A2-1 Placement break close to the foundation
-3
-2
-1
0
1
2
3
Stre
ss [M
Pa]
5
10
15
20
25
30
35
40
45
01.07.2001 26.06.2002 21.06.2003Date
Tem
pera
ture
[°C
]
-3
-2
-1
0
1
2
3
Stre
ss [M
Pa]
5
10
15
20
25
30
35
40
45
01.01.2001 27.12.2001 22.12.2002Date
Tem
pera
ture
[°C
]
a) D1 – v1 – L1 – E2 b) D2 – v1 – L1 – E2
143.1 to 181.5masl ΔH=3m
143.1 to 181.5masl ΔH=3m 143.1 to 181.5masl ΔH=3m
143.1 to 181.5masl ΔH=3m
ft(14d)=0.4MPaft(90d)=0.7MPaft(360d)=1.1MPa
ft(14d)=0.4MPaft(90d)=0.7MPaft(360d)=1.1MPa
Fig. A2-1: Parametric study: Temperature and cross-valley stress histories in dam
centre in dependence on construction start date and foundation close placement break (10 cm/d).

260
-3
-2
-1
0
1
2
3
Stre
ss [M
Pa]
5
10
15
20
25
30
35
40
45
01.07.2001 26.06.2002 21.06.2003Date
Tem
pera
ture
[°C
]
-3
-2
-1
0
1
2
3
Stre
ss [M
Pa]
5
10
15
20
25
30
35
40
45
01.01.2001 27.12.2001 22.12.2002Date
Tem
pera
ture
[°C
]
143.1 to 181.5masl ΔH=3m
143.1 to 181.5masl ΔH=3m 143.1 to 181.5masl ΔH=3m
143.1 to 181.5masl ΔH=3m
ft(14d)=0.4MPaft(90d)=0.7MPaft(360d)=1.1MPa
ft(14d)=0.4MPaft(90d)=0.7MPaft(360d)=1.1MPa
a) D1 – v2 – L1 – E2 b) D2 – v2 – L1 – E2 Fig. A2-2: Parametric study: Temperature and cross-valley stress histories in dam
centre in dependence on construction start date and foundation close placement break (20 cm/d).
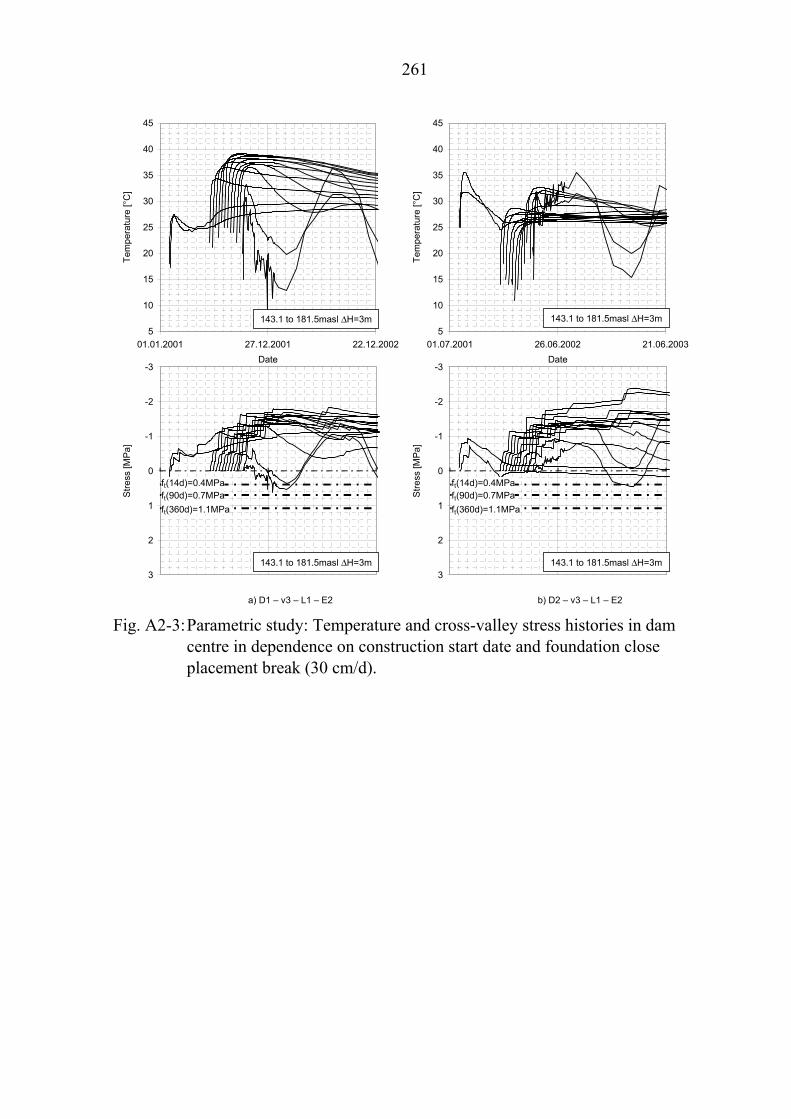
261
-3
-2
-1
0
1
2
3
Stre
ss [M
Pa]
5
10
15
20
25
30
35
40
45
01.07.2001 26.06.2002 21.06.2003Date
Tem
pera
ture
[°C
]
-3
-2
-1
0
1
2
3
Stre
ss [M
Pa]
5
10
15
20
25
30
35
40
45
01.01.2001 27.12.2001 22.12.2002Date
Tem
pera
ture
[°C
]
143.1 to 181.5masl ΔH=3m
143.1 to 181.5masl ΔH=3m 143.1 to 181.5masl ΔH=3m
143.1 to 181.5masl ΔH=3m
ft(14d)=0.4MPaft(90d)=0.7MPaft(360d)=1.1MPa
ft(14d)=0.4MPaft(90d)=0.7MPaft(360d)=1.1MPa
a) D1 – v3 – L1 – E2 b) D2 – v3 – L1 – E2 Fig. A2-3: Parametric study: Temperature and cross-valley stress histories in dam
centre in dependence on construction start date and foundation close placement break (30 cm/d).
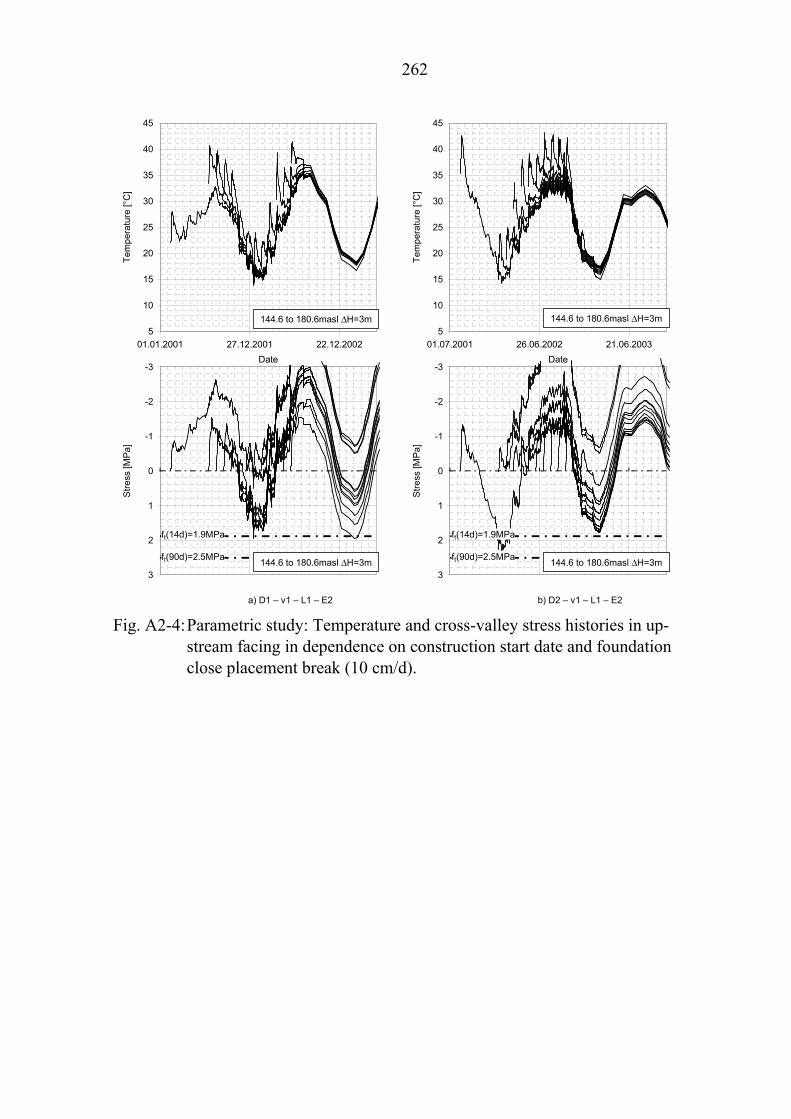
262
-3
-2
-1
0
1
2
3
Stre
ss [M
Pa]
5
10
15
20
25
30
35
40
45
01.07.2001 26.06.2002 21.06.2003Date
Tem
pera
ture
[°C
]
5
10
15
20
25
30
35
40
45
01.01.2001 27.12.2001 22.12.2002Date
Tem
pera
ture
[°C
]
-3
-2
-1
0
1
2
3
Stre
ss [M
Pa]
144.6 to 180.6masl ΔH=3m 144.6 to 180.6masl ΔH=3m
a) D1 – v1 – L1 – E2 b) D2 – v1 – L1 – E2
ft(14d)=1.9MPa
ft(90d)=2.5MPa 144.6 to 180.6masl ΔH=3m
ft(14d)=1.9MPa
ft(90d)=2.5MPa 144.6 to 180.6masl ΔH=3m
Fig. A2-4: Parametric study: Temperature and cross-valley stress histories in up-
stream facing in dependence on construction start date and foundation close placement break (10 cm/d).

263
-3
-2
-1
0
1
2
3
Stre
ss [M
Pa]
5
10
15
20
25
30
35
40
45
01.07.2001 26.06.2002 21.06.2003Date
Tem
pera
ture
[°C
]
-3
-2
-1
0
1
2
3
Stre
ss [M
Pa]
5
10
15
20
25
30
35
40
45
01.01.2001 27.12.2001 22.12.2002Date
Tem
pera
ture
[°C
]
144.6 to 180.6masl ΔH=3m 144.6 to 180.6masl ΔH=3m
a) D1 – v2 – L1 – E2 b) D2 – v2 – L1 – E2
ft(14d)=1.9MPa
ft(90d)=2.5MPa 144.6 to 180.6masl ΔH=3m
ft(14d)=1.9MPa
ft(90d)=2.5MPa 144.6 to 180.6masl ΔH=3m
Fig. A2-5: Parametric study: Temperature and cross-valley stress histories in up-
stream facing in dependence on construction start date and foundation close placement break (20 cm/d).

264
-3
-2
-1
0
1
2
3
Stre
ss [M
Pa]
5
10
15
20
25
30
35
40
45
01.07.2001 26.06.2002 21.06.2003Date
Tem
pera
ture
[°C
]
-3
-2
-1
0
1
2
3
Stre
ss [M
Pa]
5
10
15
20
25
30
35
40
45
01.01.2001 27.12.2001 22.12.2002Date
Tem
pera
ture
[°C
]
144.6 to 180.6masl ΔH=3m 144.6 to 180.6masl ΔH=3m
a) D1 – v3 – L1 – E2 b) D2 – v3 – L1 – E2
ft(14d)=1.9MPa
ft(90d)=2.5MPa 144.6 to 180.6masl ΔH=3m
ft(14d)=1.9MPa
ft(90d)=2.5MPa 144.6 to 180.6masl ΔH=3m
Fig. A2-6: Parametric study: Temperature and cross-valley stress histories in up-
stream facing in dependence on construction start date and foundation close placement break (30 cm/d).

265
A2-2 Placement break far from the foundation
-3
-2
-1
0
1
2
3
Stre
ss [M
Pa]
5
10
15
20
25
30
35
40
45
01.07.2001 26.06.2002 21.06.2003Date
Tem
pera
ture
[°C
]
-3
-2
-1
0
1
2
3
Stre
ss [M
Pa]
5
10
15
20
25
30
35
40
45
01.01.2001 27.12.2001 22.12.2002Date
Tem
pera
ture
[°C
]
a) D1 – v1 – L2 – E2 b) D2 – v1 – L2 – E2
143.1 to 181.5masl ΔH=3m
143.1 to 181.5masl ΔH=3m 143.1 to 181.5masl ΔH=3m
143.1 to 181.5masl ΔH=3m
ft(14d)=0.4MPaft(90d)=0.7MPaft(360d)=1.1MPa
ft(14d)=0.4MPaft(90d)=0.7MPaft(360d)=1.1MPa
Fig. A2-7: Parametric study: Temperature and cross-valley stress histories in dam
centre in dependence on construction start date and foundation far placement break (10 cm/d).

266
-3
-2
-1
0
1
2
3
Stre
ss [M
Pa]
5
10
15
20
25
30
35
40
45
01.07.2001 26.06.2002 21.06.2003Date
Tem
pera
ture
[°C
]
-3
-2
-1
0
1
2
3
Stre
ss [M
Pa]
5
10
15
20
25
30
35
40
45
01.01.2001 27.12.2001 22.12.2002Date
Tem
pera
ture
[°C
]
143.1 to 181.5masl ΔH=3m
143.1 to 181.5masl ΔH=3m 143.1 to 181.5masl ΔH=3m
143.1 to 181.5masl ΔH=3m
ft(14d)=0.4MPaft(90d)=0.7MPaft(360d)=1.1MPa
ft(14d)=0.4MPaft(90d)=0.7MPaft(360d)=1.1MPa
a) D1 – v2 – L2 – E2 b) D2 – v2 – L2 – E2 Fig. A2-8: Parametric study: Temperature and cross-valley stress histories in dam
centre in dependence on construction start date and foundation far placement break (20 cm/d).
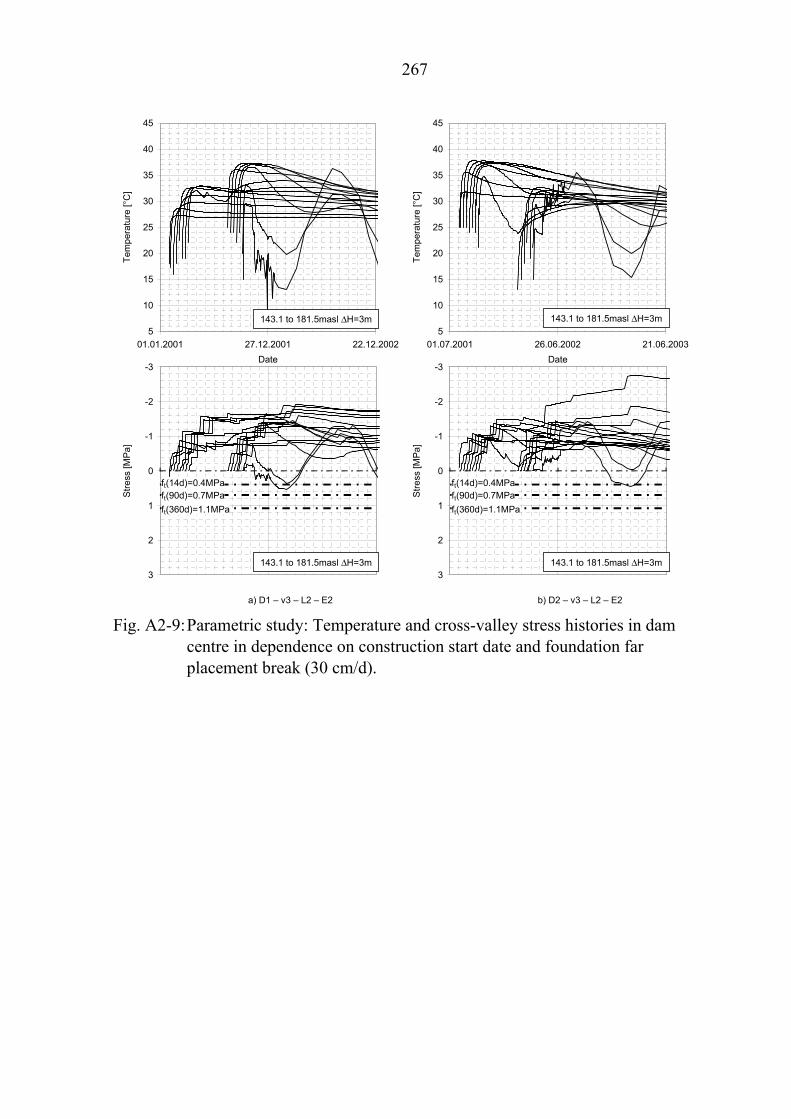
267
-3
-2
-1
0
1
2
3
Stre
ss [M
Pa]
5
10
15
20
25
30
35
40
45
01.07.2001 26.06.2002 21.06.2003Date
Tem
pera
ture
[°C
]
-3
-2
-1
0
1
2
3
Stre
ss [M
Pa]
5
10
15
20
25
30
35
40
45
01.01.2001 27.12.2001 22.12.2002Date
Tem
pera
ture
[°C
]
143.1 to 181.5masl ΔH=3m
143.1 to 181.5masl ΔH=3m 143.1 to 181.5masl ΔH=3m
143.1 to 181.5masl ΔH=3m
ft(14d)=0.4MPaft(90d)=0.7MPaft(360d)=1.1MPa
ft(14d)=0.4MPaft(90d)=0.7MPaft(360d)=1.1MPa
a) D1 – v3 – L2 – E2 b) D2 – v3 – L2 – E2 Fig. A2-9: Parametric study: Temperature and cross-valley stress histories in dam
centre in dependence on construction start date and foundation far placement break (30 cm/d).

268
-3
-2
-1
0
1
2
3
Stre
ss [M
Pa]
5
10
15
20
25
30
35
40
45
01.07.2001 26.06.2002 21.06.2003Date
Tem
pera
ture
[°C
]
-3
-2
-1
0
1
2
3
Stre
ss [M
Pa]
5
10
15
20
25
30
35
40
45
01.01.2001 27.12.2001 22.12.2002Date
Tem
pera
ture
[°C
]
144.6 to 180.6masl ΔH=3m 144.6 to 180.6masl ΔH=3m
a) D1 – v1 – L2 – E2 b) D2 – v1 – L2 – E2
ft(14d)=1.9MPa
ft(90d)=2.5MPa 144.6 to 180.6masl ΔH=3m
ft(14d)=1.9MPa
ft(90d)=2.5MPa 144.6 to 180.6masl ΔH=3m
Fig. A2-10: Parametric study: Temperature and cross-valley stress histories in up-
stream facing in dependence on construction start date and foundation far placement break (10 cm/d).
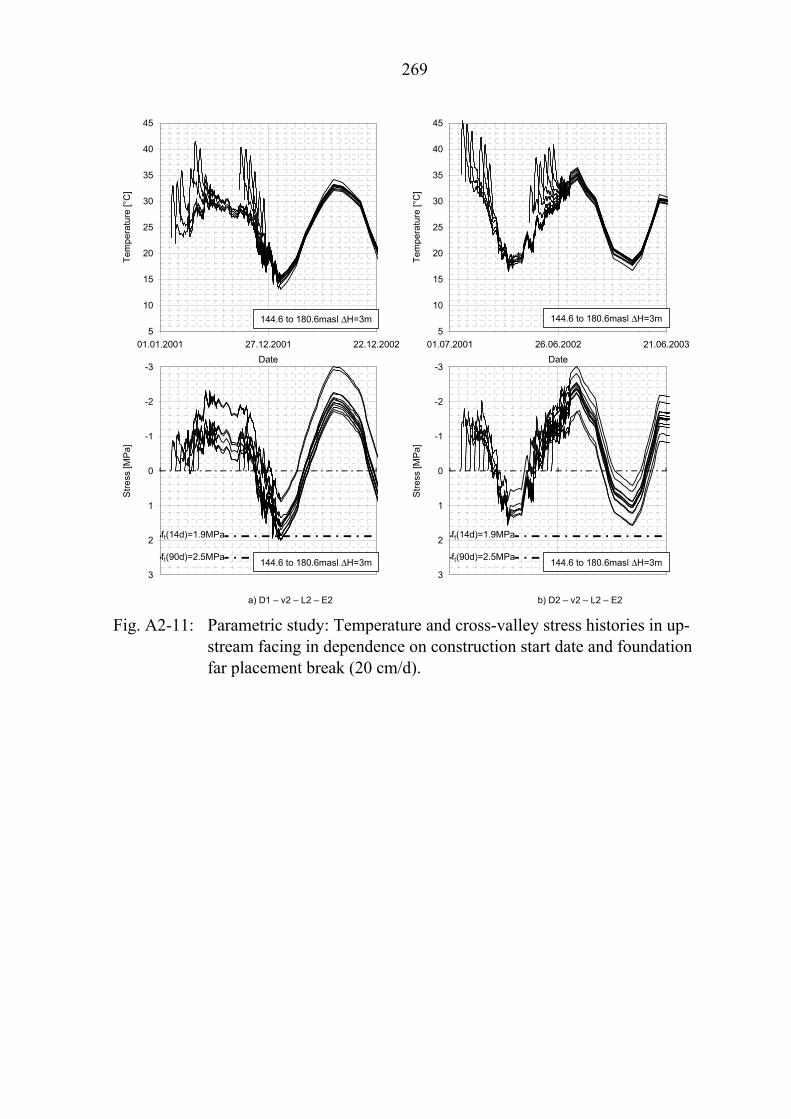
269
-3
-2
-1
0
1
2
3
Stre
ss [M
Pa]
5
10
15
20
25
30
35
40
45
01.07.2001 26.06.2002 21.06.2003Date
Tem
pera
ture
[°C
]
-3
-2
-1
0
1
2
3
Stre
ss [M
Pa]
5
10
15
20
25
30
35
40
45
01.01.2001 27.12.2001 22.12.2002Date
Tem
pera
ture
[°C
]
144.6 to 180.6masl ΔH=3m 144.6 to 180.6masl ΔH=3m
a) D1 – v2 – L2 – E2 b) D2 – v2 – L2 – E2
ft(14d)=1.9MPa
ft(90d)=2.5MPa 144.6 to 180.6masl ΔH=3m
ft(14d)=1.9MPa
ft(90d)=2.5MPa 144.6 to 180.6masl ΔH=3m
Fig. A2-11: Parametric study: Temperature and cross-valley stress histories in up-
stream facing in dependence on construction start date and foundation far placement break (20 cm/d).

270
-3
-2
-1
0
1
2
3
Stre
ss [M
Pa]
5
10
15
20
25
30
35
40
45
01.07.2001 26.06.2002 21.06.2003Date
Tem
pera
ture
[°C
]
-3
-2
-1
0
1
2
3
Stre
ss [M
Pa]
5
10
15
20
25
30
35
40
45
01.01.2001 27.12.2001 22.12.2002Date
Tem
pera
ture
[°C
]
144.6 to 180.6masl ΔH=3m 144.6 to 180.6masl ΔH=3m
a) D1 – v3 – L2 – E2 b) D2 – v3 – L2 – E2
ft(14d)=1.9MPa
ft(90d)=2.5MPa 144.6 to 180.6masl ΔH=3m
ft(14d)=1.9MPa
ft(90d)=2.5MPa 144.6 to 180.6masl ΔH=3m
Fig. A2-12: Parametric study: Temperature and cross-valley stress histories in up-
stream facing in dependence on construction start date and foundation far placement break (30 cm/d).

271
A3 Parametric study: Temperature and stress histories corresponding to the variation of placement technology
-3
-2
-1
0
1
2
3
Stre
ss [M
Pa]
5
10
15
20
25
30
35
40
45
01.01.2001 27.12.2001 22.12.2002Date
Tem
pera
ture
[°C
]
a) D1 – v3
143.1 to 181.5masl ΔH=3m
143.1 to 181.5masl ΔH=3m
ft(14d)=0.4MPaft(90d)=0.7MPaft(360d)=1.1MPa
-3
-2
-1
0
1
2
3
Stre
ss [M
Pa]
5
10
15
20
25
30
35
40
45
01.01.2001 27.12.2001 22.12.2002Date
Tem
pera
ture
[°C
]
b) D1 – SL
143.1 to 181.5masl ΔH=3m
143.1 to 181.5masl ΔH=3m
ft(14d)=0.4MPaft(90d)=0.7MPaft(360d)=1.1MPa
Fig. A3-1: Parametric study: Temperature and cross-valley stress histories in dam
centre in dependence on placement technology (HO-v3-0, SL-0).

272
-3
-2
-1
0
1
2
3
Stre
ss [M
Pa]
5
10
15
20
25
30
35
40
45
01.01.2001 27.12.2001 22.12.2002Date
Tem
pera
ture
[°C
]
a) D1 – v3
144.6 to 180.6masl ΔH=3m
-3
-2
-1
0
1
2
3
Stre
ss [M
Pa]
5
10
15
20
25
30
35
40
45
01.01.2001 27.12.2001 22.12.2002Date
Tem
pera
ture
[°C
]
b) D1 – SL
144.6 to 180.6masl ΔH=3m
ft(14d)=1.9MPa
ft(90d)=2.5MPa 144.6 to 180.6masl ΔH=3m
ft(14d)=1.9MPa
ft(90d)=2.5MPa 144.6 to 180.6masl ΔH=3m
Fig. A3-2: Parametric study: Temperature and cross-valley stress histories in up-
stream facing in dependence on placement technology (HO-v3-0, SL-0).
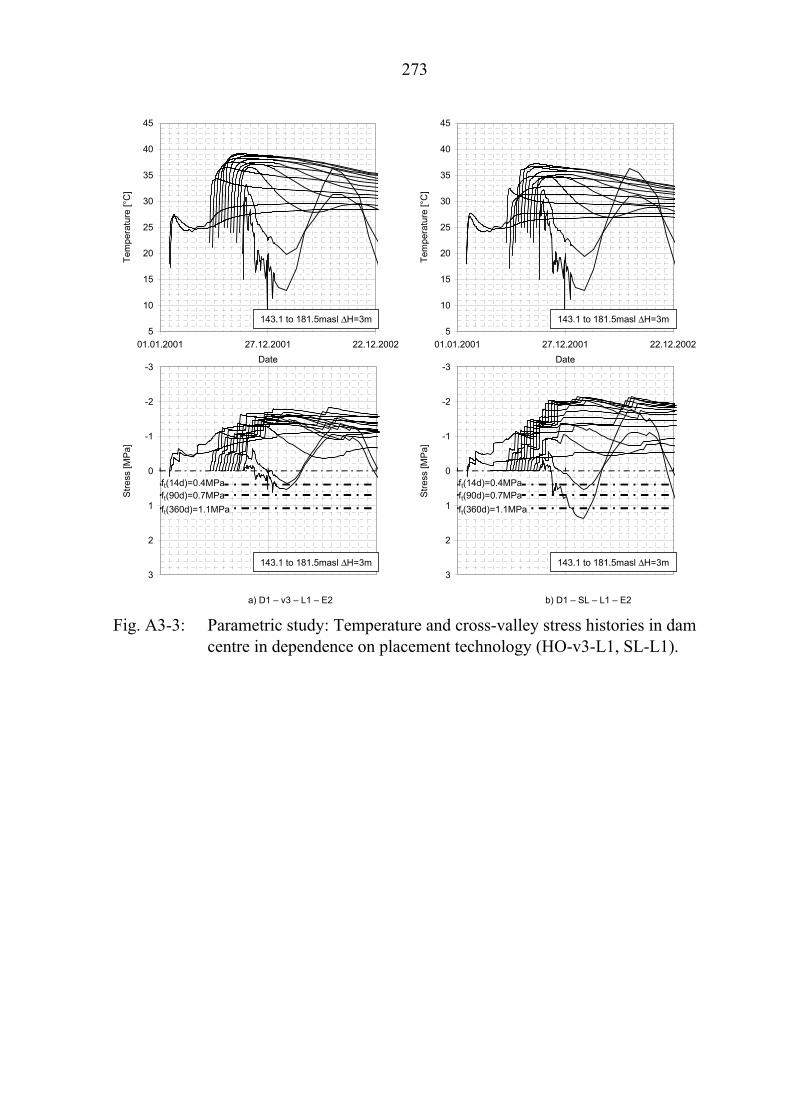
273
-3
-2
-1
0
1
2
3
Stre
ss [M
Pa]
5
10
15
20
25
30
35
40
45
01.01.2001 27.12.2001 22.12.2002Date
Tem
pera
ture
[°C
]
143.1 to 181.5masl ΔH=3m
143.1 to 181.5masl ΔH=3m
ft(14d)=0.4MPaft(90d)=0.7MPaft(360d)=1.1MPa
a) D1 – v3 – L1 – E2
-3
-2
-1
0
1
2
3
Stre
ss [M
Pa]
5
10
15
20
25
30
35
40
45
01.01.2001 27.12.2001 22.12.2002Date
Tem
pera
ture
[°C
]
b) D1 – SL – L1 – E2
143.1 to 181.5masl ΔH=3m
143.1 to 181.5masl ΔH=3m
ft(14d)=0.4MPaft(90d)=0.7MPaft(360d)=1.1MPa
Fig. A3-3: Parametric study: Temperature and cross-valley stress histories in dam
centre in dependence on placement technology (HO-v3-L1, SL-L1).
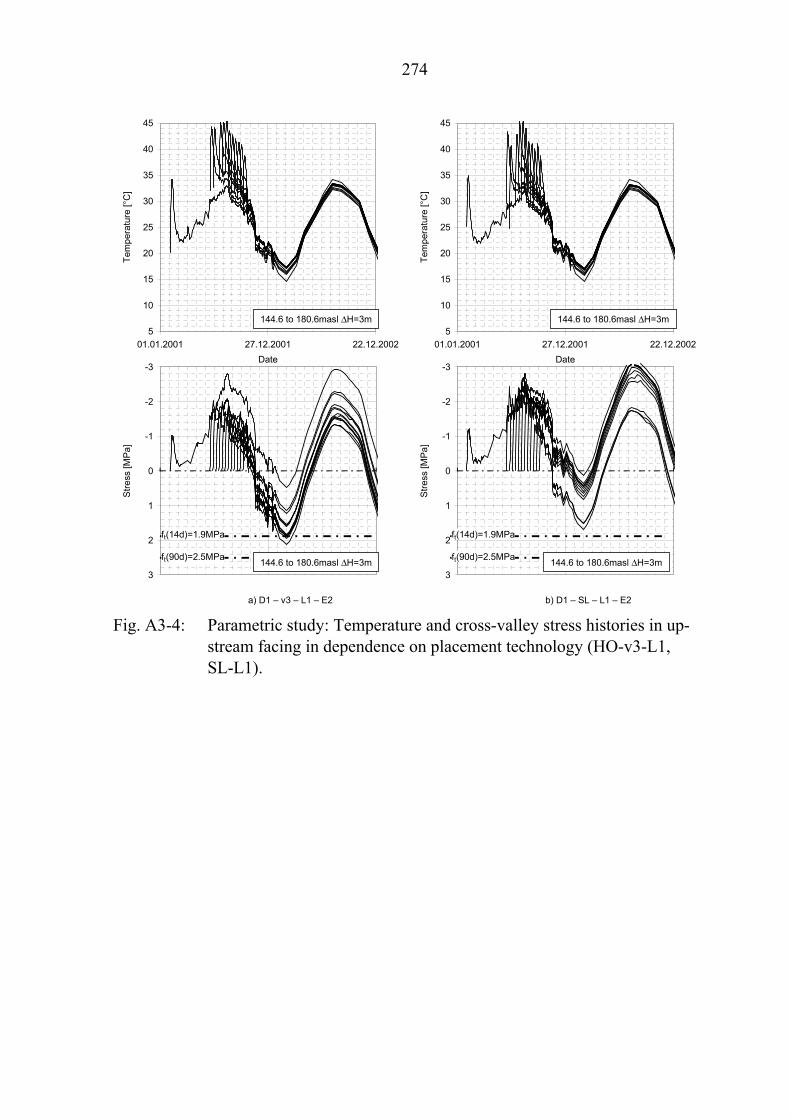
274
-3
-2
-1
0
1
2
3
Stre
ss [M
Pa]
5
10
15
20
25
30
35
40
45
01.01.2001 27.12.2001 22.12.2002Date
Tem
pera
ture
[°C
]
144.6 to 180.6masl ΔH=3m
a) D1 – v3 – L1 – E2
-3
-2
-1
0
1
2
3
Stre
ss [M
Pa]
5
10
15
20
25
30
35
40
45
01.01.2001 27.12.2001 22.12.2002Date
Tem
pera
ture
[°C
]
144.6 to 180.6masl ΔH=3m
b) D1 – SL – L1 – E2
ft(14d)=1.9MPa
ft(90d)=2.5MPa 144.6 to 180.6masl ΔH=3m
ft(14d)=1.9MPa
ft(90d)=2.5MPa 144.6 to 180.6masl ΔH=3m
Fig. A3-4: Parametric study: Temperature and cross-valley stress histories in up-
stream facing in dependence on placement technology (HO-v3-L1, SL-L1).

275
A4 Parametric study: Temperature and stress histories corresponding to the variation of facing concrete
-3
-2
-1
0
1
2
3
Stre
ss [M
Pa]
-3
-2
-1
0
1
2
3
Stre
ss [M
Pa]
5
10
15
20
25
30
35
40
45
01.01.2001 27.12.2001 22.12.2002Date
Tem
pera
ture
[°C
]
.
5
10
15
20
25
30
35
40
45
01.01.2001 27.12.2001 22.12.2002Date
Tem
pera
ture
[°C
]
a) CVC facing b) GEVRCC facing
144.3 to 180.0masl (DFOT) 144.3 to 180.0masl (DFOT)
ft(14d)=1.9MPa
ft(90d)=2.5MPa 144.6 to 180.6masl ΔH=3m
ft(14d)=1.9MPa
ft(90d)=2.5MPa 144.6 to 180.6masl ΔH=3m
Fig. A4-1: Parametric study: Temperature and cross-valley stress histories in up-
stream facing in dependence on facing concrete acc. to real placement schedule of Mujib Dam (CVC, GEVRCC).

276