Embed Size (px)
Citation preview
A Contingent Valuation Study of theValue of Reducing Fire Hazards toOld-Growth Forests in the PacificNorthwest
John B. Loomis Armando González-Cabán Robin Gregory
United StatesDepartment ofAgriculture
Forest Service
Pacific SouthwestResearch Station
Research PaperPSW-RP-229-Web
Abstract:Loomis, John B.; González-Cabán, Armando; Gregory, Robin. 1996. A contingent valuation
study of the value of reducing fire hazards to old-growth forests in the PacificNorthwest. Res. Paper PSW-RP-229-Web. Albany, CA: Pacific Southwest ResearchStation, Forest Service, U.S. Department of Agriculture; 24 p.
A contingent valuation methodology was applied to old-growth forests and criticalhabitat units for the Northern Spotted Owl in Oregon to estimate the economic value to thepublic in knowing that rare and unique ecosystems will be protected from fire for currentand future generations. Generalizing to the whole state, the total annual willingness-to-payof Oregon residents ranges from $49.6 to $99 million. In terms of old-growth forestsprotected from fire, the value is $28 per acre.
Retrieval terms: contingent valuation, fire economics, NOAA, nonmarket resources, old-growth valuation, willingness-to-pay
The Authors:John B. Loomis is Professor, Department of Agricultural and Resource Economics,Colorado State University, Fort Collins, CO 80523. Armando González-Cabán is aneconomist with the Pacific Southwest Research Station at the Forest Fire Laboratory (4955Canyon Crest Drive, Riverside, CA 92507). Robin Gregory is Senior Researcher withDecision Research, 1201 Oak Street, Eugene, OR 97401.
AcknowledgmentsWe thank Paula Stevens and Sunny Williams, University of California, Davis, forassistance in survey mailing and data entry. Kari Nelson and Geri Hanson at DecisionResearch facilitated the mailing and checking of surveys. Dr. Peter Teensma, Bureau ofLand Management, and Harold Legard and Dean Longrie, USDA Forest Service, providedmuch technical information and guidance on fire risk to old-growth forests and effects onspotted owls. Thomas Brown and Thomas Holmes, USDA Forest Service, and Joe Cooper,USDA Economic Research Service, provided numerous valuable suggestions to improvethe clarity of exposition. The assistance of all of these individuals is greatly appreciated,but they bear no responsibility for the contents of this paper.
Publisher:Albany, California
Mailing address:PO Box 245, Berkeley CA
94701-0245
510 559-6300
http://www.pswfs.gov
July 1996
Pacific Southwest Research StationForest ServiceUS Department of Agriculture
A Contingent Valuation Study of theValue of Reducing Fire Hazards toOld-Growth Forests in the PacificNorthwest
John B. Loomis Armando González-Cabán Robin Gregory
ContentsIn Brief ................................................................................................................... iiiIntroduction............................................................................................................ 1Literature Review .................................................................................................. 1Development of the Survey ................................................................................ 2
Development of Technical Information on Fire ............................................ 2Focus Groups and Pretesting ........................................................................... 2
Structure of the Survey ........................................................................................ 3Nonmonetary Measures of Relative Importance .......................................... 3
Steps in Developing a Contingent Valuation Method Survey ............... 3Two Survey Versions for Hypothesis Testing ........................................... 5
Sample Design ....................................................................................................... 6Results ..................................................................................................................... 6
Response Rate ..................................................................................................... 6Why People Answered the Willingness-to-Pay Questions as They Did .. 7
Why They Would Not Pay: Protest Responses ........................................ 7Statistical Analysis ............................................................................................. 8
Logit ....................................................................................................................... 10Statistical Coefficients and Willingness-to-Pay .......................................... 10
Results of Hypothesis Tests ............................................................................. 10Discussion............................................................................................................. 11
Multivariate Dichotomous Choice Results .................................................. 11Expanding the Sample to the Population: Preliminary Estimates .......... 12
Conclusion and Future Research ..................................................................... 14References ............................................................................................................. 15Appendix A: Survey Instrument .................................................................... 17Appendix B: Percent “Yes” Responses by Bid Amount for the TwoSurvey Versions .................................................................................................. 24
USDA Forest ServiceResearch Paper
PSW-RP-229-Web
July 1996
4USDA Forest Service Research Paper PSW-RP-229-Web. 1996.
Reducing Fire Hazards to Old-Growth Forests Loomis, González-Cabán and Gregory
There is a growing recognition that protection of forest products beyondrecreation needs to be incorporated into decisionmaking. Valuation of
these other products often reflects people’s desire to know that rare andunique ecosystems exist (existence value) and will be protected for futuregenerations (bequest values) and that they will be available for visits atfuture times (option values). Existence and bequest values have beenquantified (in dollar terms) to stop logging of old-growth forests inWashington and Colorado but not to protect these ecosystems from fire.
About 7 million acres of the remaining old-growth forests in the PacificNorthwest have been designated as Critical Habitat Units (CHU’s) for theNorthern Spotted Owl by the USDI Fish and Wildlife Service. Thisdesignation eliminates clearcutting and severely restricts the logging thatcan be done. The last significant threat to preservation of these habitatsstems from possible catastrophic fires. Fire management policies can reducethe frequency of human-caused fires and the extent and severity of all fires.
The main objective of this research is to provide a case study of thecontingent valuation method (CVM) for measuring the economic value(sum of recreation use, option, existence, and bequest values), and thuswillingness-to-pay (WTP), for protecting old-growth forests in Oregon fromcatastrophic fires. The CVM obtains an individual’s estimate of WTP for useor preservation of natural resources through creation of a simulated market.The simulated market is conveyed in a mail questionnaire or a telephone orin-person interview. In this research, we used a mail questionnaire.
All technical information on fire and fire effects was obtained fromUSDA Forest Service and USDI Fish and Wildlife personnel in Oregon andwas used in the development and pretesting of the survey questionnaire.The following are three important elements of all CVM surveys: resourceto be valued, financial mechanism to be used to pay, and the questionformat used to elicit the respondent’s dollar amount of WTP.
Two versions of the survey were sent to two random samplings of 500Oregon households each. In Version 2, respondents were reminded, beforethey answered the willingness-to-pay question, about other substituteresources and their budget constraint; in Version 1, respondents were notreminded. Households were randomly assigned to one of 20 alternativeprogram cost levels of the two treatment samples. The overall surveydesign and mailing procedure followed Dillman’s total design method.The results and response rates between versions were almost identical. Themean open-ended WTP responses were $33 for Version 1 and $36 forVersion 2. The mean dichotomous choice WTP responses were $92 forVersion 1 and $98 for Version 2. Pooling the data showed a meandichotomous choice WTP of $90 per household.
The similarity of WTP responses across survey versions can beinterpreted to mean that respondents already take into account their budgetand competing public and private alternative expenditures when providingtheir WTP responses. An alternative interpretation is that when dealingwith any hypothetical scenario, people do not seriously consider the realdollar consequences of their survey responses regardless of whether theyare reminded. Without a validity test forcing respondents to actually pay,we cannot distinguish between these two possible explanations.
The external validity of the sample values is of critical concern whenapplying the findings to the population (Arrow and others 1993). Applyingthe findings to Oregon’s population yields WTP values ranging from $45 to$90 per household or a state aggregate of $49.5 million to $99 million
Loomis, John B.; González-Cabán,Armando; Gregory, Robin.1996. A contingent valuationstudy of the value of reducingfire hazards to old-growthforests in the Pacific North-west. Res. Paper PSW-RP-229-Web. Albany, CA: PacificSouthwest Research Station,Forest Service, U.S. Departmentof Agriculture; 24 p.
R e t r i e v a l t e r m s : c o n t i n g e n tvaluation, fire economics, NOAA,nonmarket resources, old-growthvaluation, willingness-to-pay
In Brief
iii
5USDA Forest Service Research Paper PSW-RP-229-Web. 1996.
Reducing Fire Hazards to Old-Growth Forests Loomis, González-Cabán and Gregory
annually, depending on how similar the values of nonrespondents are tothose of respondents.
Dividing a middle estimate of WTP of $84.6 million annually by the 3,500acres that would no longer burn results in a value to the public of $24,170 peracre saved from fire. In terms consistent with the USDA Forest Service firemanagement analysis system, dividing the $84.6 million by the total acreage ofold-growth forests in CHU’s for the Northern Spotted Owl yields a value to thepublic of $28 per acre protected.
Current Federal fire management policies take into account the economicvalues of several traditional forest products such as timber, range, water, gamewildlife, and recreation in decisions about the type and level of fire suppression.Many other important forest “products” including preservation of biodiversityand related nongame animals, however, are not formally included as part of theUSDA National Fire Management Analysis System (NFMAS).
There is a growing recognition within the Wildland-Urban InterfaceResearch Work Unit at the Pacific Southwest Research Station’s Forest FireLaboratory in Riverside, California, that protection of forest products beyondrecreation needs to be incorporated into decisionmaking (González-Cabán andChase 1991, González-Cabán 1993). Valuation of these other products oftenreflects peoples’ desire to know that rare and unique ecosystems exist (e.g.,existence value, first proposed by Krutilla [1967]) and will be protected forfuture generations (bequest value) and that they will be available for visits atfuture times (option value). The existence and bequest values have beenquantified (in dollar terms) to stop logging of old-growth forests in Washington(Rubin and others 1991) and Colorado (Walsh and others 1984), but not forprotecting these ecosystem types from fire.
In the Pacific Northwest only a small percentage of old-growth ecosystemremains on National Forest lands. About 7 million acres of these old-growthforests have been designated as critical habitat units (CHU’s) for NorthernSpotted Owl by the USDI Fish and Wildlife Service. This designation eliminatesclearcutting and severely restricts logging. However, one significant threat topreservation of habitat in these areas stems from possible catastrophic fires. Firemanagement policies can reduce the frequency of human-caused fires and theextent and severity of all fires.
iv USDA Forest Service Research Paper PSW-RP-229-Web. 1996.
1USDA Forest Service Research Paper PSW-RP-229-Web. 1996.
The protection of old-growth forests was identified as a major concern atworkshops on defining what fire managers thought were the major fire
management issues in the Pacific Northwest (Gregory and von Winterfeldt1992). These workshops were held in Regions 5 (California) and 6 (Oregonand Washington) of the Forest Service. The workshops’ primary purposewas to develop an understanding of the nature and structure of thenonmarket forest resource values that could be affected by alternative firemanagement strategies. Participants specifically identified lack of economicvalues of protection of old-growth forest that could be formally representedin fire management models. This paper provides a case study of thecontingent valuation method (CVM) for measuring the total economicvalue (the sum of recreation use, option, existence, and bequest values)(Randall and Stoll 1983) of protecting old-growth forests in Oregon fromcatastrophic fires.
Vaux, Gardner, and Mills (1984), in one of the first studies of the perceptionof fire-influenced landscapes and its effect on the land’s recreation quality,stated, “Both economic and psychological methods could be used toevaluate the effects of fire on forest recreation. These methods rely ondirect and inferential means to assess the values of outdoor recreation. Themost suitable of these approaches appears to be contingent marketvaluation—a direct economic technique that uses personal interviews. Ahypothetical market transaction environment is set up within which valuesare estimated.” This approach has been used to assess the impact of insectinfestations and timber cutting on forest environments. The effects of suchinfestations and cuttings are similar to the effects of fire. Vaux, Gardner,and Mills go on to state that “willingness-to-pay (WTP) is an appropriatemeasure for valuing the effects of fire on forest recreation” (Vaux andothers 1984:1). Willingness-to-pay represents the maximum amount aperson would be willing to pay for the resource in question under theproposed scenario (Mitchell and Carson 1989). The study by Vaux andothers (1984) involved about 70 students rating photographs of burned andunburned forests and then expressing a willingness-to-pay for the preferredscene. The primary objective of their research was to demonstrate theviability of such an approach.
Our proposed research takes the study by Vaux and others (1984)forward in several directions. First, our sample is much larger in size thantheirs and represents the general population rather than college students.Second, we are interested not only in how fire affects recreational benefits ofthe forest over time but also in the magnitude of what are sometimes callednon-use or preservation values associated with maintaining the forest in itscurrent condition (Walsh and others 1984). These preservation valuesinclude the option for future recreation use, the benefit from just knowingthe forests are maintained as habitats for wildlife, and the knowledge thatfuture generations will have these forests in much the same form as we dotoday. In this study, we emphasize these values as well as the benefits ofecosystem and critical habitat that old-growth forests provide for nongamewildlife such as spotted owls, salmon, and steelhead, as well as scenicbeauty and water quality. Third, we explicitly include the concept ofopportunity costs in that we ask participants to state their willingness-to-pay, in dollars of personal income, to receive the specified benefits.
Literature Review
Introduction
2 USDA Forest Service Research Paper PSW-RP-229-Web. 1996.
Reducing Fire Hazards to Old-Growth Forests Loomis, González-Cabán and Gregory
In this sense, our study is an extension of the studies by Rubin andothers (1991), Hagen and others (1992), and Lockwood and others (1993) inwhich individuals were asked their maximum WTP to protect old-growthforests from logging and to ensure their continued existence as habitat forspotted owls. In many cases, fire is the next major threat to the protection ofthese forests. Our study and survey design will draw from elements in eachone of these CVM studies. In addition, we draw upon the workshops ofGregory and von Winterfeldt (1992), who investigated the nonmarket forestresource values that are affected by alternative fire management strategies.
Contingent valuation is a widely used method for obtaining WTP forrecreation, option, existence, and bequest values (Mitchell and Carson1989). It is recommended for use by Federal agencies for performing benefitcost analysis (U.S. Water Resources Council 1983), for valuing naturalresource damages (U.S. Department of Interior 1986). Its use was upheld bythe Federal courts (U.S. District Court of Appeals 1989).
The CVM obtains an individual’s estimate of their WTP for use orpreservation of natural resources through creation of a simulated market.The simulated market is conveyed in a mail questionnaire or a telephone orin-person interview.
Development of Technical Information on FireBefore the survey design, the research team met with USDA Forest Servicefire management specialists and wildlife biologists to ensure a goodunderstanding of the natural resources at risk from fire in old-growthforests and spotted owl critical habitat areas. These specialists were fromthe Willamette National Forest in Eugene, Oregon and the USDA ForestService Regional Office in Portland, Oregon. We went through a checklistof multiple uses and species and asked whether the forest resources wouldbe either adversely affected by fire in the short term, positively affected byfire in the short term, or not affected by fire. The results of this discussionwere used to describe to respondents the likely effects of fire.
In addition, this meeting provided initial information on the frequencyand extent of actual fires under current management. As a result of thismeeting, we secured map overlays from the Forest Service on fire frequencyand from the USDI Fish and Wildlife Service on CHU’s. From theseoverlays, we developed our statistics on frequency and extent of fire inspotted owl CHU’s.
The other main accomplishment of this meeting was the initialdevelopment of a list of additional fire management actions that could beundertaken by the Forest Service and Bureau of Land Management (BLM)to reduce the frequency and extent of fire in the CHU’s. We titled this theFire Prevention and Control Program. After discussion with firemanagement officials, three main categories of this program wereidentified. These are: “greater fire prevention efforts,” “earlier firedetection,” and “quicker and larger fire control response.” In the survey,the respondent is given one-sentence elaborations of each of these threemanagement actions (appendix A).
Focus Groups and Pretesting
Once the fire statistics and maps of CHU’s for Oregon were developed, weheld two small focus groups at Decision Research (a scientific research firm)in Eugene with Oregon residents. One of the primary objectives was to
Developmentof the Survey
3USDA Forest Service Research Paper PSW-RP-229-Web. 1996.
Reducing Fire Hazards to Old-Growth Forests Loomis, González-Cabán and Gregory
determine whether our basic Fire Prevention and Control Program wasunderstandable and realistic. We also sought to explore alternative ways todescribe the extent or amount of area burned each year. Another objectivewas to discuss acceptable ways of funding this program. For example, weasked whether it was believable that only Oregon residents would pay for theprogram or whether all residents of the United States must pay. In addition,the focus groups provided us with a better understanding of the languagethat participants normally used to describe events related to forest fire.
After meeting with these focus groups, a complete survey was draftedby members of the study team. The revised instrument was pretested on asmall sample of Oregon residents who filled out the survey at DecisionResearch in Eugene, by Forest Service employees at the Forest FireLaboratory in Riverside, California, and by several staff members at theUniversity of California, Davis. Each individual participating in the pretestwas asked to answer a follow-up checklist to investigate several items thathave been problems for past CVM surveys. For example, we checked to seewhether individuals understood that the fire control program protectedjust spotted owl areas in Oregon and whether they realized that all residentsof the United States would pay. Several modifications were made to thesurvey instrument on the basis of these results (e.g., bolding or underliningwas added for emphasis or survey layout was changed). Finally the pretestwas used to establish an appropriate range of bid amounts for thedichotomous choice question.
Nonmonetary Measures of Relative Importance
Before directly asking how much respondents would pay for a fireprotection program for old-growth forests, it is important to allow therespondents an opportunity to reflect on why they might care about theseforests. Cummings and others (1986) call this “researching theirpreferences” or, in other words, collecting your thoughts on this topic.Certainly residents of Oregon have been exposed to large and repeatedmedia coverage about old-growth forests and spotted owls. In the weeksbefore the first mailing of our survey, the President, Vice-President, andnearly half of the President’s cabinet came to Portland, Oregon, for an “OwlSummit.” This event was highlighted, in one way or another, in every localnewspaper and received extensive television network coverage. Thus, webelieve Oregon residents have some knowledge about the natural resourcespresent in old-growth forests and have had much opportunity to reflect onwhat these resources mean to them.
The first set of questions asked about the relative importance of old-growth forests for recreation use, providing timber, as habitat for plantsand wildlife, providing jobs, and providing scenic beauty in Oregon. A 5-point Likert scale allowed individuals to rate the relative importance ofthese various reasons for valuing old-growth forests in Oregon. This neutralresponse format (that precedes the dollar valuation questions) also aided inunderstanding the WTP amounts people provide later in the survey.
Steps in Developing a Contingent Valuation Method Survey
Any CVM survey design involves three elements: (a) portrayal of theresource to be valued; (b) description of the particular financial mechanismto be used to pay for the resource; e.g., property taxes, utility bills, trustfunds, etc.; and (c) the question format used to elicit the respondent’s dollaramount of WTP.
Structure of the Survey
4 USDA Forest Service Research Paper PSW-RP-229-Web. 1996.
Reducing Fire Hazards to Old-Growth Forests Loomis, González-Cabán and Gregory
In this case, the resource to be valued was a fire prevention and controlprogram for 3 million acres of old-growth forests in CHU’s of Northern SpottedOwl in Oregon. This point was emphasized by the half-page map of westernOregon showing the CHU’s on the third page of the survey (directly acrossfrom the WTP question). Discussion with USDA Forest Service fire managementspecialists suggested that increasing three fire program elements would reducethe number and extent of fires. After several focus groups and pretests(discussed above), these three elements were refined into the Fire Preventionand Control Program that were listed and briefly described to respondents inthe survey: (a) Greater Fire Prevention; (b) Earlier Fire Detection; and (c)Quicker and Larger Fire Response. The respondents were told that greatereffort and funding in all three of these areas would cut in half the currentannual number of fires (300) and acreage (7,000) burned in the CHU’s. Thestatistics on the current number of fires and acreage burned were developedfrom map overlays supplied by the USDA Forest Service and USDI Fish andWildlife Service. To make the reduction more meaningful, we described theacreage relative to the number of city blocks and square miles involved.
The means by which all households would pay was framed as a voterreferendum. Individuals were told Because Oregon’s old-growth forests are alsoFederally designated CHU’s for the threatened Northern Spotted Owl, all householdsin the United States would pay into a Special Oregon Old-Growth Fire ControlProgram. By law this fund could be used only for fire protection in Federally ownedold-growth forests shown on the map. Adoption of the program would be decided aspart of a national election. Following this statement was the actual WTP question:Suppose the Oregon Old-Growth Fire Prevention and Control Program proposal wereon the next ballot. This program would reduce by half the number of acres of old-growth forests in CHU’s that would burn in Oregon each year. If it cost yourhousehold $ each year, would you vote for this program? This was followed by theopen-ended WTP question What is the maximum your household would pay each yearfor the Fire Prevention and Control Program to reduce in half the number of acres ofold-growth forests in CHU’s that burn each year in Oregon? (See appendix A for thecomplete survey).
Questions to check comprehension following the pretest indicated that amajority of individuals understood that this program pertained only toOregon’s old-growth forests and that all U.S. households would pay.
Given the voter referendum question, the WTP question format was of thedichotomous (yes/no) type. The dichotomous choice format mimics an actualvote by simply asking whether the person would vote (e.g., pay) for the item ifit would cost the household a particular dollar amount each year. In this casethe individual must just decide whether the value to him or her is worth at leastthis price. Since the printed dollar amount varies across the sample, thedichotomous choice format allows the analyst to statistically trace out a demandrelationship between the probability of a “yes” response and the dollar amount.The basic relationship is:
Prob(Yes) = 1 – {1 + exp[B0 – B1X1 + B2X2
+ B3X3 +...BnXn]}–1 (1)
where B’s are coefficients to be estimated using logit statistical techniques andX is the dollar amount the household is asked to pay.
From equation 1, Hanemann (1989) provides a formula to calculate theexpected value of WTP as:
Mean WTP =(1/B0) × ln (1 + exp[B0– B1X1+B2X2+B3X3+...BnXn]) (2)
This formula applies if reducing fire is seen as beneficial by all respondents.However, if this is not the case, then the unrestricted WTP (B0/B1) is appropriate,which is also equal to the median in a linear model.
5USDA Forest Service Research Paper PSW-RP-229-Web. 1996.
Reducing Fire Hazards to Old-Growth Forests Loomis, González-Cabán and Gregory
Twenty different bid amounts ranging from $2 to $300 were randomlyassigned to survey respondents. The range was picked such that at the lowend, anyone who valued old-growth forests or the Northern Spotted Owlwould very likely indicate they would pay $2, while almost no one wasexpected to pay $300 each year.
Following the WTP question were two questions designed toinvestigate the reasons behind a person’s answers to the WTP questions.One question probed responses for persons indicating they would not payanything at all for the fire prevention and control program (respondentsindicated whether they would pay or not when responding to the WTPquestions). It is customary to determine whether such response representsa valid value or a protest to some feature of the simulated market. Sixresponse categories were provided including: (a) this program is not worthanything to me; (b) I cannot afford to pay at this time; (c) I do not think theprogram would work; (d) It is unfair to expect me to pay; (e) I am opposedto any new government programs; (f) other. Categories (a) and (b) representvalid reasons for not being willing to pay. These responses are retained forcalculating WTP. However, responses (c)-(e) represent rejection of the basicpremise of the simulated market and are not retained for purposes ofcalculating WTP. These rejections may not reflect signals about the value ofthe commodity, but rather may reflect the respondent’s concerns about theeffectiveness of the program, equity of the financing, other features of thesurvey, or simply the political ideology of the respondent.
The second WTP check question was asked of those individuals whoindicated they would pay the posited amount. The five categories were (a)This program is worth at least this much to me; (b) I feel we have a duty toprotect old-growth forests; (c) to contribute to a good cause; (d) to pay myfair share to protect old-growth forests; (e) other. Clearly, category (a) is avalid response as this is what we are trying to measure. There has beensome debate about whether those checking off (b), (c), or (d) are reallyvaluing the resource or program, simply donating out of a sense of duty, orfor a “warm glow” that donating to a good cause provides (Kahnemannand Knetsch 1992).
Finally, simple demographic questions such as age, education,membership in environmental organizations, and income were asked. Thefinal survey instrument was typeset and made into a booklet containingtext and graphics.
Two Survey Versions for Hypothesis Testing
As part of the survey development process, we identified a criticalCVM design issue that could be tested: whether making explicit to therespondent that there were many substitute public programs that neededfunding and that their limited household budget would limit therespondent’s WTP. Both of these points were recommendations of theNational Oceanic and Atmospheric Administration’s (NOAA) Blue RibbonPanel on Contingent Valuation (Arrow and others 1993). To allow fortesting of whether reminding respondents that they may have to pay forother environmental programs and that they had a limited budget, weadded the following text immediately before the WTP question in one-halfthe surveys mailed: Before you vote, we would like you to keep in mind that thisfire control program would affect only old-growth forests and spotted owls inOregon, not other states. Also remember that about 1,000 other endangered speciesin the United States need protection for their critical habitat. Additional moneywill be needed for these species and other costly environmental programs such ascleanup of abandoned hazardous waste sites and reducing air pollution. Money

6 USDA Forest Service Research Paper PSW-RP-229-Web. 1996.
Reducing Fire Hazards to Old-Growth Forests Loomis, González-Cabán and Gregory
Results
you spend on the fire program would reduce the amount of money your householdwill have available to spend on the other environmental problems mentioned aswell as on the everyday products you buy.
If the NOAA panel is correct, WTP—with this statement included—will be lower than WTP elicited without the statement on substitute uses oftheir money. The difference in WTP for the open-ended question can beevaluated with a student’s t-test using the sample means and theirrespective standard errors. In the case of dichotomous choice CVM, thedifferences in responses can be compared by a statistical likelihood ratiotest that will be explained in more detail later.
The two versions of the questionnaire were sent to a random sample of1,000 Oregon households during spring 1993. The sample was provided bySurvey Sampling Inc. Survey Sampling Inc. assigned households randomlyto the two treatment samples; no other selection criteria were imposed onthe sampling. The overall survey design and mailing procedure followDillman’s (1978) Total Design Method (first mailing/postcard/secondmailing). Each individual was sent a personalized cover letter on DecisionResearch letterhead with a personal signature. The first mailing was sentout the first week in May, with a reminder postcard 4 business days later.A second mailing of the survey, with a new cover letter, was sent tononrespondents the first week in June.
Response RateTable 1 provides a tally of the response rate by version and the overallresponse rate. The response rates were nearly identical between versions,50 percent for version 1 and 49 percent for version 2 (table 1). This responserate is typical for a general population survey using a first mailing/postcard/second mailing without any financial incentives. In addition,Oregon residents may have become overwhelmed by all the attention tothe Northern Spotted Owl controversy, and some persons may have justrefused to devote further attention to the issue. Below, we provide twoadjustments to account for the nonresponse when generalizing the sampleresults to the population.
Table 1—Response rate of survey mailing
Variable Version 1 Version 21
Total surveys mailed 500 500Received 220 205Undeliverable 59 66Deceased 2 13Refused 9 7Response rate (pct)2 50.11 48.69
1Following the recommendation of the NOOA Panel (Arrow and others,1991) this version of the questionnaire included reminder that they may haveto pay for other environmental programs and that they have a limited budget.
2Response rate = Questionnaires received/(Total surveys mailed – Unde-liverable – Deceased)
Sample Design
7USDA Forest Service Research Paper PSW-RP-229-Web. 1996.
Reducing Fire Hazards to Old-Growth Forests Loomis, González-Cabán and Gregory
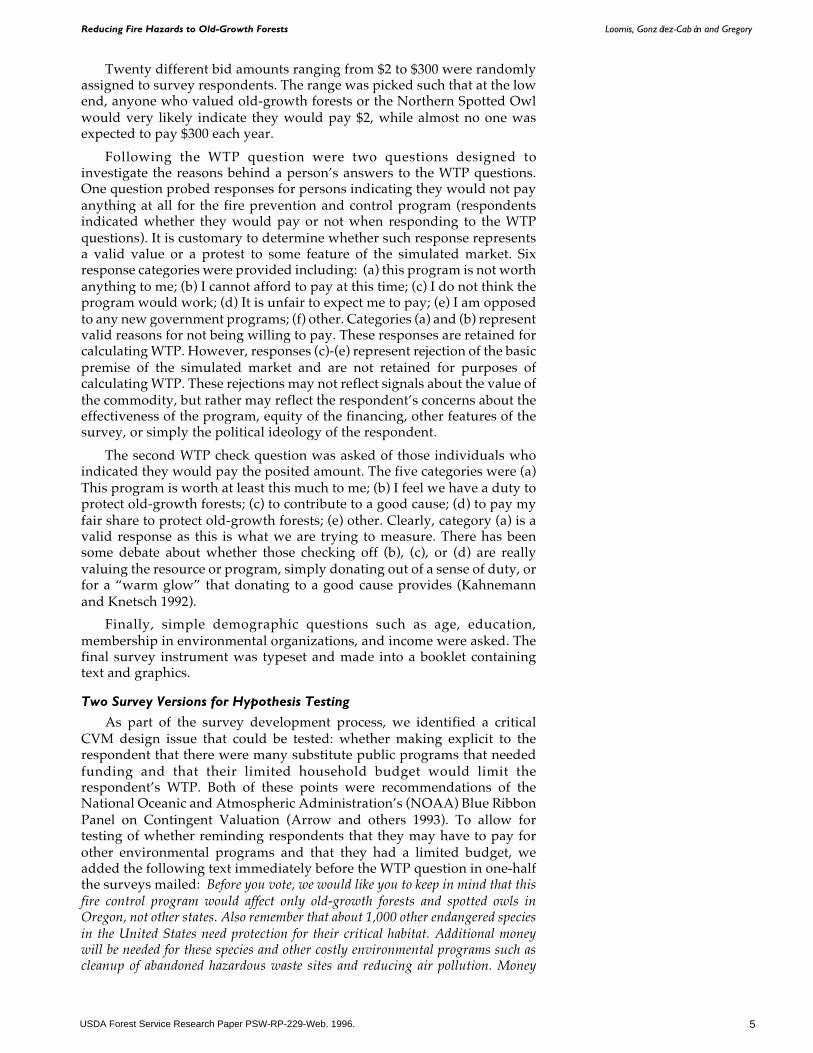
Respondents to the two versions of the survey questionnaire are similarin terms of education; but, as is typical in mail surveys, the educationallevel of the respondents in each sample is greater than the averageeducational level of residents of the State of Oregon (table 2). The twosamples are relatively close in terms of age; but again, as is typical in mailsurveys, the age of the sample exceeds the average age of the population.The income of version-1 respondents is within 1.5 standard errors of theincome of version-2 respondents, so they are not statistically different.Because Survey Sampling Inc. draws the majority of names from telephonebooks, which are traditionally listed under the male’s name, the sampleoverrepresents males.
As discussed below, only education was statistically significant inexplaining WTP responses in the dichotomous choice question format. Wealso use the average level of education in the State of Oregon rather than thesample average as one way of adjusting our estimated WTP values from thedichotomous choice CVM to better reflect state demographics.
Why People Answered the Willingness-to-Pay Questions as They Did
Why They Would Not Pay: Protest Responses
Table 3 presents the reasons why some people in the two samples said theywould not pay anything for the fire prevention and response program. Thefirst two categories are not considered protest responses but, in fact, reflectlegitimate reasons for stating “no, they would not pay anything.” Wefound it encouraging to see that people indicated they could not afford topay. This meant they took the commitment in the survey seriously.
The third through fifth categories represent what are usually classifiedas protest responses. These responses are usually not considered valid
Table 3—Reasons why the subset of people would not pay
Reason Version 1 Version 2
————percent————This program is not worth anything to me 2.3 4.4I cannot afford to pay at this time 6.8 8.3Subtotal 9.1 12.7I do not think program would work1 8.2 6.8It is unfair to expect me to pay1 4.6 6.3I am opposed to new government programs1 17.4 11.7Fire is natural and benefits forest 6.8 5.3Other 3.2 3.9Subtotal 40.2 34.0Total2 49.3 46.7
1Usually classified as protest responses.2Total does not add to 100 percent because not all respondents answered their respective
questions.
Table 2—Comparison of Version 1 and Version 2 demographic characteristics with Oregon’shouseholds
Demographic Characteristics Version 1 Version 2 Oregon1
Age (yr) 53.45 51.78 49.00Education (yr) 14.36 14.20 13.00Annual income ($) 35,800 39,863 32,336Percent male 74.00 65.00 49.00
1Source: 1990 U.S. Census
8 USDA Forest Service Research Paper PSW-RP-229-Web. 1996.
Reducing Fire Hazards to Old-Growth Forests Loomis, González-Cabán and Gregory
representations of the individual’s willingness-to-pay, though they dorepresent valid concerns. These concerns may include a rejection of thebasic premise of the CVM market, some feature of the scenario, otherconcerns about the survey, or generalized concerns about the overall issue.These WTP responses are normally not included when WTP is computed.Thus, implicitly, the sample average WTP is applied to these individualswhen the sample is expanded to the population.
Overall, 40 percent of version-1 and 34 percent of version-2 responseswere considered protests. This is an unusually high protest rate; therefore,the sample average WTP is conditioned on valid survey responses, asdescribed above, of the remaining 60 and 66 percent. In part, some of thismay be due to not convincing the respondent that the fire prevention andresponse program would work. Respondents can perhaps be convinced infuture surveys by a better explanation of how such a program would workand examples of how similar programs had worked in other areas.Alternatively, these expressions may represent opinions about governmentprograms in general or a feeling that too much attention has been focusedon the spotted owl in Oregon. To resolve the motivations behind theseresponses would take an in-person interview and is an important priorityfor future research.
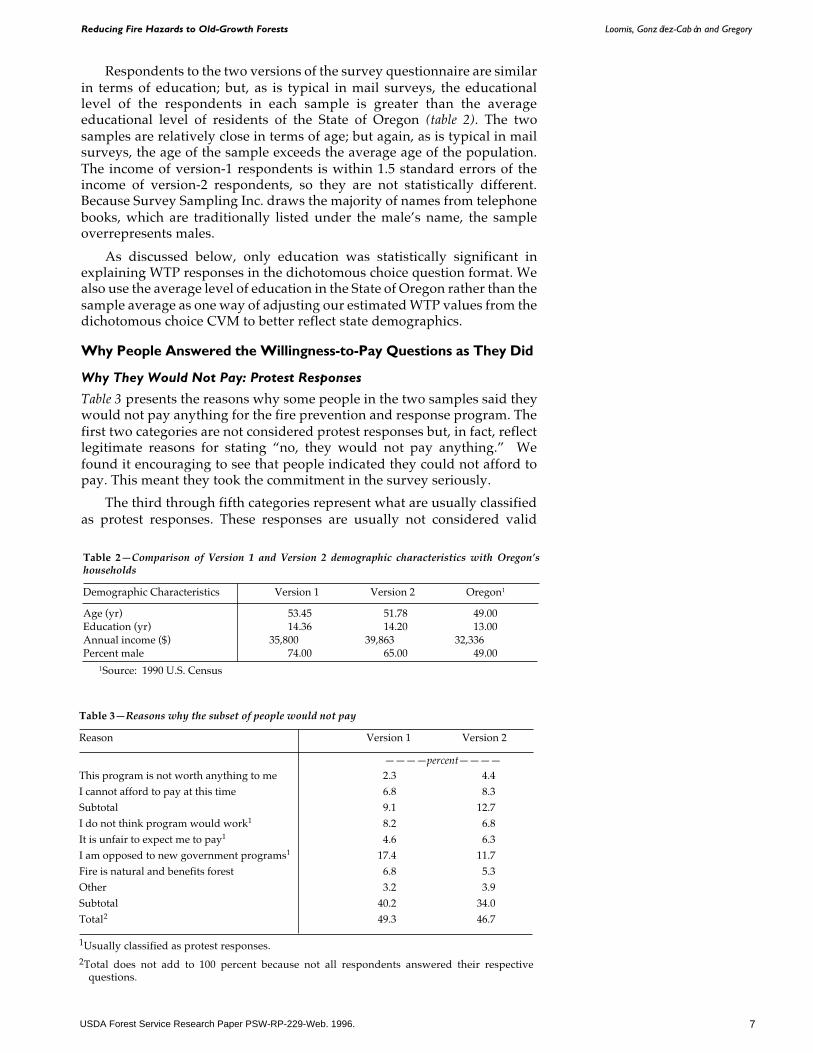
Table 4 presents reasons why individuals reporting positive WTP wouldpay such amounts. The first category most closely matches an economicinterpretation, and 17 percent (46/266) of the people providing positiveWTP gave this reason. The next motivations, including having a duty toprotect and paying one’s fair share, reflect the majority of the respondents.Only 7 percent indicated they would pay simply to give money to a goodcause. Further research is needed to better analyze and evaluate how thesemotivations relate to both economic and psychological indicators of value.Future work should include refinement of these categories and perhapslinking with satisfaction gained from knowing that old-growth forests andhabitat are protected (Stevens and others 1991). In keeping with theeconomic paradigm that what matters is willingness-to-pay regardless ofmotivation, all positive WTP amounts and nonprotest zeros are retained inthe analysis that follows.
Statistical AnalysisA second data set for statistical analysis was created from the main data setby removing protest responses. This section provides estimates of WTPbased on both the open-ended WTP and the dichotomous choice questions.The empirical advantage of the dichotomous choice relates to the ease ofresponding to this question format. Ease of responding is evidenced by the
Table 4—Reasons why the subset of people would pay
Reason Version 1 Version 2
————percent———This program is worth at least this much 10.0 11.7I feel we have a duty to protect these 13.7 21.8 old-growth forestsTo contribute to a good cause 6.4 2.4To pay my fair share to protect the 14.2 8.7 old-growth forestsOther 0.9 3.4
Total1 45.2 48.0
1Total does not sum to 100 percent because not everyone answeredhis/her respective questions.
9USDA Forest Service Research Paper PSW-RP-229-Web. 1996.
Reducing Fire Hazards to Old-Growth Forests Loomis, González-Cabán and Gregory
fact that about 10 to 15 percent more respondents answered thedichotomous question than the open-ended questions. Nonetheless, theopen-ended format provides more information per respondent and allowsfor a simpler comparison of WTP across versions.
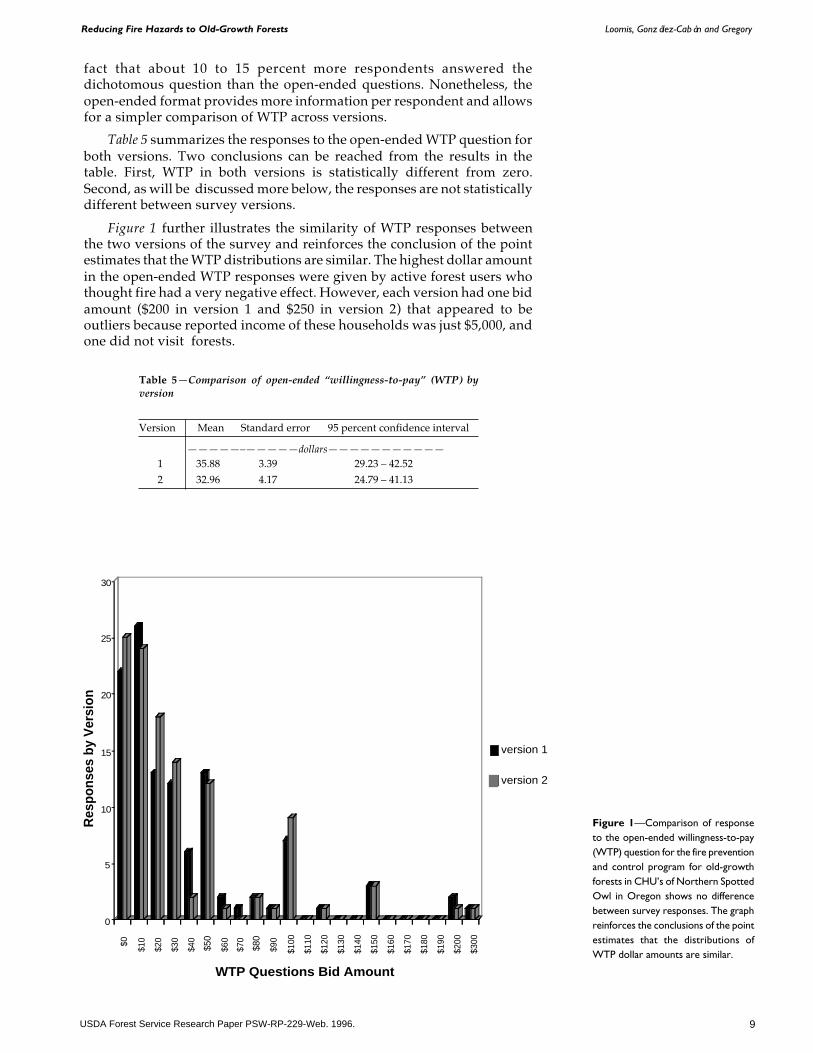
Table 5 summarizes the responses to the open-ended WTP question forboth versions. Two conclusions can be reached from the results in thetable. First, WTP in both versions is statistically different from zero.Second, as will be discussed more below, the responses are not statisticallydifferent between survey versions.
Figure 1 further illustrates the similarity of WTP responses betweenthe two versions of the survey and reinforces the conclusion of the pointestimates that the WTP distributions are similar. The highest dollar amountin the open-ended WTP responses were given by active forest users whothought fire had a very negative effect. However, each version had one bidamount ($200 in version 1 and $250 in version 2) that appeared to beoutliers because reported income of these households was just $5,000, andone did not visit forests.
Figure 1—Comparison of responseto the open-ended willingness-to-pay(WTP) question for the fire preventionand control program for old-growthforests in CHU’s of Northern SpottedOwl in Oregon shows no differencebetween survey responses. The graphreinforces the conclusions of the pointestimates that the distributions ofWTP dollar amounts are similar.
$0
$10
$20
$30
$40
$60
$70
$90
$100
$110
$120
$130
$140
$150
$160
$170
$180
$190
$200
$300
0
5
10
15
20
25
30
Res
pons
es b
y V
ersi
on
$50
$80
WTP Questions Bid Amount
version 1
version 2
Table 5—Comparison of open-ended “willingness-to-pay” (WTP) byversion
Version Mean Standard error 95 percent confidence interval
—————–—————dollars———————————1 35.88 3.39 29.23 – 42.522 32.96 4.17 24.79 – 41.13
10 USDA Forest Service Research Paper PSW-RP-229-Web. 1996.
Reducing Fire Hazards to Old-Growth Forests Loomis, González-Cabán and Gregory
Statistical Coefficients and Willingness-To-Pay
Mean WTP with the dichotomous choice WTP format is calculated from thecoefficients relating the yes and no response to the bid amount usingequation 2. The coefficients are typically estimated using a logisticregression (Hanemann 1984). The logit equations for the two versions areshown in table 6. Appendix B shows the distribution of yes/no responses bybid amount.
The coefficients are all statistically significant at the 0.01 level as are theoverall goodness-of-fit statistics (the chi-square). The pseudo R squared,which is also calculated by comparing the restricted and unrestricted loglikelihood, indicates that 13 percent (version 2) and 18 percent (version 1)of the variation in responses is explained by bid amount alone.
Using equation 2, WTP is calculated for the two versions. Once againthe WTP values are quite close. As has been found in other studies (Kealyand Turner 1993), WTP from the dichotomous choice is higher than foropen-ended questions (tables 3 and 4). Hoehn and Randall (1987) rigorouslydiscuss the incentives and decision process of individuals in the tworesponse formats. They show that the open-ended WTP response format islikely to yield estimates of WTP below that of dichotomous choice, which ismore incentive compatible. Of course, it is possible that more conservativeopen-ended results are more accurate estimates of WTP. Without askingfor actual cash payment to test the validity of the two question formats, wecannot say definitely which is most accurate.
Results of Hypothesis TestsGiven the expectations of the NOAA panel, respondents who had receivedversion 2 and had been reminded about competing programs and theirown budget constraint should have produced lower WTP estimates thanthose of respondents who had received version 1. However, the means ofresponses to the open-ended WTP questions are similar ($33 versus $36),and the confidence intervals overlap (table 5). Thus, there is no evidence ofa difference between responses to the open-ended WTP questions elicitedfrom the two versions.
In the case of dichotomous choice CVM (table 6), the estimates of WTPare also similar across the two versions ($92 versus $98). Testing thestatistical significance of differences in dichotomous choice responsesinvolves performing a likelihood ratio test, which tests the equality of thelogit equation’s slope and intercept for the two survey versions. If the
Logit
Table 6—Bivariate logistic regressions by version
Variable Version 1 Version 2
Constant 1.048 1.482 (t statistics) (3.720) (5.050)Bid –0.015 –0.017 (t statistics) (–3.760) (–4.540)Log-likelihood –75.280 –73.880Chi-square 23.309 32.917Pseudo R squared 0.134 0.182Mean willingness-to-pay (WTP > 0) $91.57 $98.32Median WTP $71.28 $86.69
Results ofHypothesis Tests
11USDA Forest Service Research Paper PSW-RP-229-Web. 1996.
Reducing Fire Hazards to Old-Growth Forests Loomis, González-Cabán and Gregory
response behavior (e.g., slope and intercepts) is the same in the two versions,there should be no difference between the log likelihood value when thedata are pooled i.e., the coefficients in equation 1 are restricted to beingequal across the two versions) versus the sum of the separately estimatedlog likelihoods (i.e., the coefficients are allowed to be different across thetwo versions). The likelihood ratio test (LLR) is two times the difference inthe pooled log likelihood value and the sum of the individual log likelihoodvalue (–2[–149.85 – (–75.28 + –73.88)]). The test statistic has a chi-squaredistribution when the coefficients are not different across versions.
The pooled log likelihood is –149.85. As reported in table 6, theindividual log likelihoods are –75.28 and –73.88. Given the fact that thesum of the two individual log likelihoods is nearly identical to the pooledvalue (–149.85 vs 149.16), it is not surprising that the LLR test for thebivariate logit equations produces a calculated chi-square of 1.36. This iswell below the critical value at the 0.01 level of significance of 6.635. Thuswe can say that no difference was detected in the response to dichotomouschoice with the two different versions of the survey. This is consistent withwhat we found with responses to the open-ended WTP questions as well.
DiscussionThere are several interpretations of the similarity of WTP responses acrosssurvey versions. The most optimistic is that respondents in a WTPframework already take into account their budget and expenditures forcompeting public and private alternatives when providing their WTPresponses. This is similar to what Boyle and others (1990) found withregard to explicitly reminding respondents about substitute huntingopportunities. If we continue to find this in other studies, then there maybe no need to remind respondents about competing public demands ortheir budget constraint as originally recommended by the NOAA panel.
An alternative interpretation is that when dealing with anyhypothetical scenario, people do not seriously consider the real dollarconsequences of their survey responses. Thus, the budget reminderstatement does not modify behavior since the dollars to be paid in thesurvey are still hypothetical. Without a validity test forcing respondentsto actually pay (Bishop and Herberlein 1979, Duffield and Patterson 1992),we cannot definitely distinguish between these two possible explanations.The fact that the bid amount has a negative coefficient, however, doesindicate that households were less likely to pay the higher (hypothesized)dollar amounts.
A third interpretation is that, although participants understood thetask, the dollar values were sufficiently vague and respondents with orwithout considering their own budget constraints could not distinguish aspecific value. Thus their own unfamiliarity with the valuation processoverwhelmed the finer distinction about considering their budget andcompeting needs.
In this case, subjects who were not used to thinking about a fireprotection program in dollar terms may simply have been unable tosufficiently optimize their response (this is consistent with Hoehn andRandall [1987] for the open-ended responses), and thus the additionalreminder about their household budget and other species was not used.
Multivariate Dichotomous Choice ResultsSince the LLR tests indicate similarity of dichotomous choice WTP
behavior across versions, we can safely pool the data for the two versions.
Discussion
12 USDA Forest Service Research Paper PSW-RP-229-Web. 1996.
Reducing Fire Hazards to Old-Growth Forests Loomis, González-Cabán and Gregory
Doing so allows us to investigate the effect of other independent or explanatoryvariables on dichotomous choice WTP responses.
Table 7 provides the coefficients and t-statistics for this multivariateequation. As can be seen, all of the coefficients have the intuitively expectedsign and are significant at the 0.05 level or higher. The pseudo R squared is 0.31,much higher than that in the bivariate model. The multivariate logit equationvariables are the following:
Fire Harm: A person’s perception of whether fire is harmful to diversity ofplants and animals, health of trees, muddying of salmon spawning habitat, orNorthern Spotted Owl habitat. Responses are –1 for “fire is beneficial,” 0 for“fire has no effect,” and +1 for “fire is harmful.” Thus a score of +4 would be“fire is harmful to all,” while a –4 would be “fire is beneficial to all.” Scoresclose to zero indicate that fire has neither a positive or negative effect.
Existence Importance: The importance of knowing old-growth forests exist in Oregon.It is measured on a 1-to-4 scale, 4 being very important and 1 being not important.
Education: The level of education in years.
Forest Recreation: A dummy variable for whether participants had visited forestsfor recreation in the past 12 months; 1 if they have visited the forest, 0 if not.
Bid Amount: The dollar amount participants were asked to pay.
Income, age, and gender were not statistically significant. A statisticallysignificant effect was not found for income even when education was excludedfrom the equation. This may be because the dollar amounts people were askedto pay were relatively small compared to their income or because in reality,there is no association of the response with income.
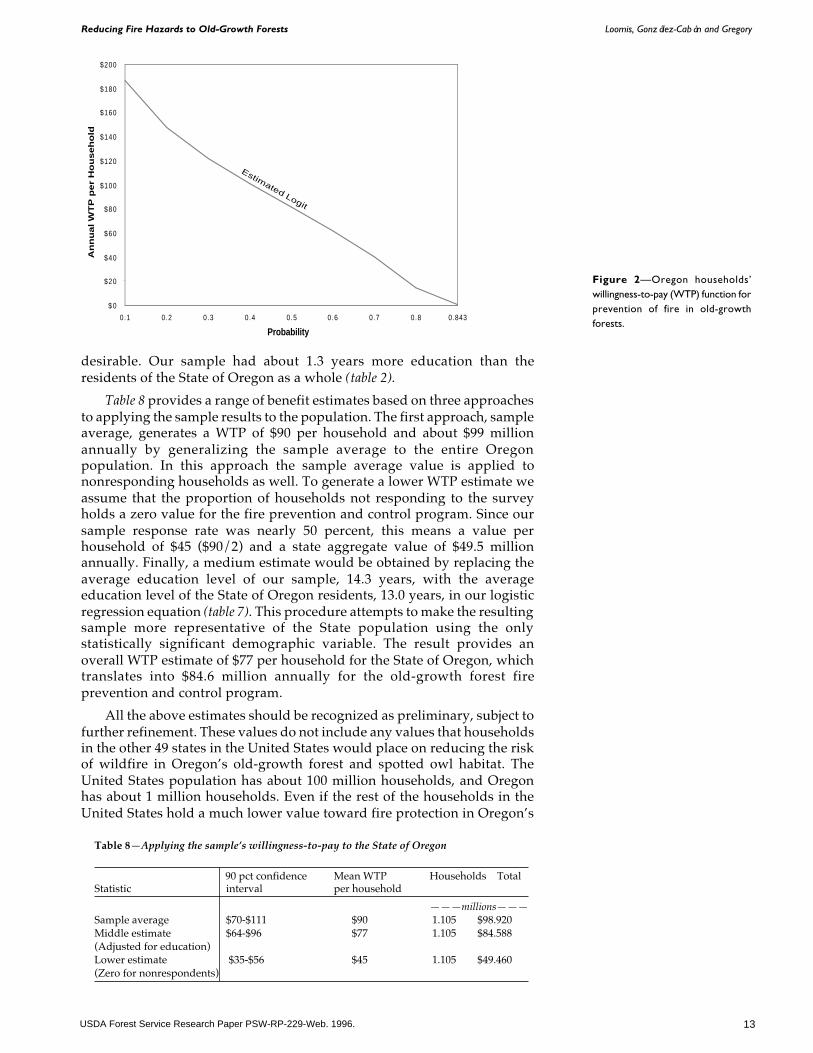
Figure 2 presents the logit curve derived from the multivariate logit model intable 7. The distribution is relatively symmetric and well-behaved. This isevidenced by the median (i.e., the 50th percentile) being $81 while the mean is$90. The median of $81 allows for some people to be adversely affected by thefire program.
Expanding the Sample to the Population: Preliminary EstimatesWhen applying the results from the sample to the population, one criticalconcern is the external validity or generalizability of the sample values to thepopulation. This is partly dependent on the representativeness of the sampleframe and the survey response rate. While our sample frame was a randomsample of Oregon’s households, the response rate was a little lower than
Table 7—Multivariate logit equation for data pooled across versions
Variable Coefficient t-Statistic
Constant –3.840 –3.93Fire harm 0.308 3.79Existence importance 0.409 2.46Education 0.241 3.99Forest recreation 0.717 1.98Bid amount –0.021 –3.94Chi-square 102.4651
Pseudo R squared 0.3092
1There are 5 degrees of freedom for the chi-square (Kmenta, Jan. 1986. 2nd.ed., p. 556). He states, “Note that in general the number of degrees of freedomof the chi-square variable is given by the number of explanatory variables inthe model.”
2See Kmenta (1986). The computational formula is 1 – (LLFmax/LLFnull)where LLF
max is the log likelihood function under the full model and LLF
nullis the log likelihood function under the null hypothesis (all the B’s set equalto zero).
13USDA Forest Service Research Paper PSW-RP-229-Web. 1996.
Reducing Fire Hazards to Old-Growth Forests Loomis, González-Cabán and Gregory
desirable. Our sample had about 1.3 years more education than theresidents of the State of Oregon as a whole (table 2).
Table 8 provides a range of benefit estimates based on three approachesto applying the sample results to the population. The first approach, sampleaverage, generates a WTP of $90 per household and about $99 millionannually by generalizing the sample average to the entire Oregonpopulation. In this approach the sample average value is applied tononresponding households as well. To generate a lower WTP estimate weassume that the proportion of households not responding to the surveyholds a zero value for the fire prevention and control program. Since oursample response rate was nearly 50 percent, this means a value perhousehold of $45 ($90/2) and a state aggregate value of $49.5 millionannually. Finally, a medium estimate would be obtained by replacing theaverage education level of our sample, 14.3 years, with the averageeducation level of the State of Oregon residents, 13.0 years, in our logisticregression equation (table 7). This procedure attempts to make the resultingsample more representative of the State population using the onlystatistically significant demographic variable. The result provides anoverall WTP estimate of $77 per household for the State of Oregon, whichtranslates into $84.6 million annually for the old-growth forest fireprevention and control program.
All the above estimates should be recognized as preliminary, subject tofurther refinement. These values do not include any values that householdsin the other 49 states in the United States would place on reducing the riskof wildfire in Oregon’s old-growth forest and spotted owl habitat. TheUnited States population has about 100 million households, and Oregonhas about 1 million households. Even if the rest of the households in theUnited States hold a much lower value toward fire protection in Oregon’s
Table 8—Applying the sample’s willingness-to-pay to the State of Oregon
90 pct confidence Mean WTP Households TotalStatistic interval per household
———millions———Sample average $70-$111 $90 1.105 $98.920Middle estimate $64-$96 $77 1.105 $84.588(Adjusted for education)Lower estimate $35-$56 $45 1.105 $49.460(Zero for nonrespondents)
Figure 2—Oregon households’willingness-to-pay (WTP) function forprevention of fire in old-growthforests.
$ 0
$20
$40
$60
$80
$100
$120
$140
$160
$180
$200
0.1 0.2 0.3 0.4 0.5 0.6 0.7 0.8 0.843
Probability
An
nu
al W
TP
per
Ho
useh
old
Estimated Logit
Estimated Logit
14 USDA Forest Service Research Paper PSW-RP-229-Web. 1996.
Reducing Fire Hazards to Old-Growth Forests Loomis, González-Cabán and Gregory
old-growth forests, the rest of the United States’ value would likely dwarfthe value held by just Oregon’s residents. Respondents were told in thesurvey that the fire prevention and control program would reduce by halfthe number of acres of old-growth forests that would burn each year. Thisrepresents a reduction of 3,500 acres of old-growth forest that would nolonger burn each year. If we take the middle WTP estimate of $84.6 millionannually and divide it by 3,500 acres that would no longer burn, theresulting value to the public per acre saved from fire is $24,170. Additionalreduction in acres burned would be valued less on a per-acre basis.
In terms of putting the values on a per-acre basis consistent with howeconomic values are used in USDA Forest Service National FireManagement Analysis System (NFMAS), we would divide the $84.6 millionby the 3 million acres of old-growth forests in protected CHU’s of NorthernSpotted Owl. This results in a value to the public of $28 per acre protected.
Overall, the survey was relatively successful in eliciting willingness-to-payvalues for protecting old-growth forests in Oregon from wildfire. Thesurvey did receive nearly a 50 percent response rate, and the WTP amountsfrom both open-ended and dichotomous choice were statistically differentfrom zero. There was no difference between results from the two surveyversions, leading us to believe that individuals took their budget constraintinto account when answering WTP even without being reminded. Thisdoes not preclude different interpretations of the findings as presented inthe section on Statistical Coefficients and WTP. The annual value perhousehold in the sample was $90. Depending on how this is generalized tothe State, the total annual Oregon residents’ willingness-to-pay rangesfrom $49.5 to $99 million with a middle estimate of approximately $85million annually. On a per-acre basis of old-growth forest protected fromfire, this is $28.
The absence of well-documented statements that the fire preventionand control program would technically work may have contributed to therelatively high protest response to the willingness-to-pay question. Evenso, many people indicated they were opposed to any new governmentprograms. This opposition is a difficult issue that must be dealt with infuture focus groups and survey pretesting. One possible strategy to use indealing with this issue would be to identify those aspects of the fireprevention and control program that elicited this anti-governmentresponse, and determine how the program can be differentiated from othergeneral government programs. Another possibility is to frame the forestprotection effort as a private, local or nonprofit (i.e., not State or Federalgovernment) fire prevention district or insurance program. For example,WTP could be asked as an annual insurance premium for the fireprevention and control program. Another more promising alternative is toconduct in-person interviews, so that respondents are clearly focused onthe economic issue of the study.
Although demographics of the sample were similar across surveyversions, they over-represented older, better-educated, and higher-incomehouseholds. The sample also over-represented males. Only education wasstatistically significant in explaining WTP in the dichotomous choice logitregression. Therefore, in applying the result from the sample to thepopulation, we accounted for the difference in education level of thesample and the State residents in our midlevel estimate of WTP. More
Conclusion andFuture Research
15USDA Forest Service Research Paper PSW-RP-229-Web. 1996.
Reducing Fire Hazards to Old-Growth Forests Loomis, González-Cabán and Gregory
representative demographics could be obtained in future surveys if thesample frame is generated from a more expensive random-digit dialingapproach of all households.
Arrow, Kenneth; Solow, Robert; Portney, Paul; Leamer, Edward; Radner, Roy; Schuman,Howard. 1993. Report of the NOAA Panel on contingent valuation. Federal Register58(10): 4602-4614.
Bishop, Richard; Herberlein, Thomas. 1979. Measuring values of extra market goods: aredirect measures biased? American Journal of Agricultural Economics 61(5): 926-930.
Boyle, Kevin; Reiling, Stephen; Phillips, Marcia. 1990. Species substitution and questionssequencing in contingent valuation surveys evaluating the hunting of several types ofwildlife. Leisure Science 12: 103-118.
Cummings, Ronald; Brookshire, David; Schulze, William. 1986. Valuing environmental goods.Totowa, NJ: Roman and Allanheld; 270 p.
Dillman, Donald. 1978. Mail and telephone surveys. New York: John Wiley and Sons; 325 p.
Duffield, John; Patterson, David. 1992. Field testing existence values: comparison ofhypothetical and cash transactions values. In: Rettig, Bruce, ed. Benefit and costs in naturalresource planning. Fifth Interim Report. Corvallis, OR: Oregon State University, Departmentof Agriculture and Resource Economics; 226 p.
González-Cabán, Armando. 1993. The economic impact of fire on forest resources: Improvingthe U.S. Forest Service’s Fire Management Planning System capabilities to use non-market values. Wildfire 2(4): 16-21.
González-Cabán, Armando; Chase, Richard. 1991. Nonmarket commodities valuation problemand its implications for the Forest Service National Fire Management Analysis PlanningSystem. USDA Forest Service, Pacific Southwest Research Station, Forest Fire Laboratory,Riverside, CA. (Unpublished report).
Gregory, Robin; von Winterfeldt, Detlof. 1992. Incorporating noncommodity values in forestfire management planning. Value Scope, Eugene, OR. (Unpublished report).
Hagen, Daniel; Vincent, James; Welle, Patrick. 1992. Benefits of preserving old-growth forestsand the Spotted Owl. Contemporary Policy Issues 10(2): 13-26.
Hanemann, Michael. 1984. Welfare evaluations in contingent valuation experiments withdiscrete responses. American Journal of Agricultural Economics 66(3): 332-341.
Hanemann, Michael. 1989. Welfare evaluations in contingent valuation experimentswith discrete responses data: reply. American Journal of Agricultural Economics71(4): 1057-1061.
Hoehn, John; Randall, Alan. 1987. A satisfactory benefit cost indicator from contingentvaluation. Journal of Environmental Economics and Management 14(3): 226-247.
Kahnemann, David; Knetsch, Jack. 1992. Valuing public goods; the purchase of moralsatisfaction. Journal of Environmental Economics and Management 22(1): 57-70.
Kealy, Mary Jo; Turner, Robert. 1993. A test of the equality of close-ended and open-endedcontingent valuations. American Journal of Agricultural Economics 75(2): 321-331.
Kmenta, Jan. 1986. Elements of econometrics. New York: MacMillan Publishing; 655 p.
Krutilla, John. 1967. Conservation reconsidered. American Economic Review 57: 777-786.
Lockwood, Michael; Loomis, John; DeLacy, Terry. 1993. A contingent valuation survey andbenefit cost analysis of forest preservation in East Gippsland, Australia. Journal ofEnvironmental Management 38(3): 233-243.
Mitchell, Robert; Carson, Richard. 1989. Using surveys to value public goods: the contingentvaluation method. Washington, DC: Resources for the Future; 463 p.
Randall, Alan; Stoll, John. 1983. Existence value in a total valuation framework. In: Rowe,Robert; Chestnut, Lauraine, eds. Managing air quality and scenic resources at nationalparks and wilderness areas. Boulder, CO: Westview Press; 314 p.
Rubin, Jonathan; Helfand, Gloria; Loomis, John. 1991. A benefit-cost analysis of the NorthernSpotted Owl. Journal of Forestry 89(12): 25-30.
Stevens, Thomas; Echeverria, Jaime; Glass, Ronald; Hager, Tim; More, Thomas. 1991.Measuring the existence value of wildlife. Land Economics 67(4): 390-400.
U.S. Department of Interior. 1986. Natural resource damage assessments; Final rule. FederalRegister 51. Washington, DC.
U.S. District Court of Appeals (for the District of Columbia). July 14, 1989. State of Ohio v. U.S.Department of Interior. Case No. 86-1575.
References
16 USDA Forest Service Research Paper PSW-RP-229-Web. 1996.
Reducing Fire Hazards to Old-Growth Forests Loomis, González-Cabán and Gregory
U.S. Water Resources Council. 1983. Economic and environmental principles for water andrelated land resources implementation studies. Washington, DC: U.S. Water ResourcesCouncil.
Vaux, Henry; Gardner, Phillip; Mills, Thomas. 1984. Methods for assessing the impact of fireon forest recreation. Gen. Tech. Rep. PSW-79. Berkeley, CA: Pacific Southwest Forest andRange Experiment Station, Forest Service, U.S. Department of Agriculture; 13 p.
Walsh, Richard; Loomis, John; Gillman, Richard. 1984. Valuing option, existence and bequestdemand for wilderness. Land Economics 60(4): 14-29.
17USDA Forest Service Research Paper PSW-RP-229-Web. 1996.
Reducing Fire Hazards to Old-Growth Forests Loomis, González-Cabán and Gregory
Appendix A — Survey Instrument
YOUR THOUGHTS ON OREGON’S OLD GROWTH FORESTS
Since the public’s desired uses of Oregon’s old growth forests have been changing wewould appreciate your thoughts on how these forests should be managed. Yourresponses are completely confidential. Please mail the survey back in the postagepaid return envelope we provided.
In this survey the term old growth forest means natural forests composed of a varietyof trees of different ages but dominated by many large, old trees. These forests takeabout 200 years to regenerate following severe fire or cutting.
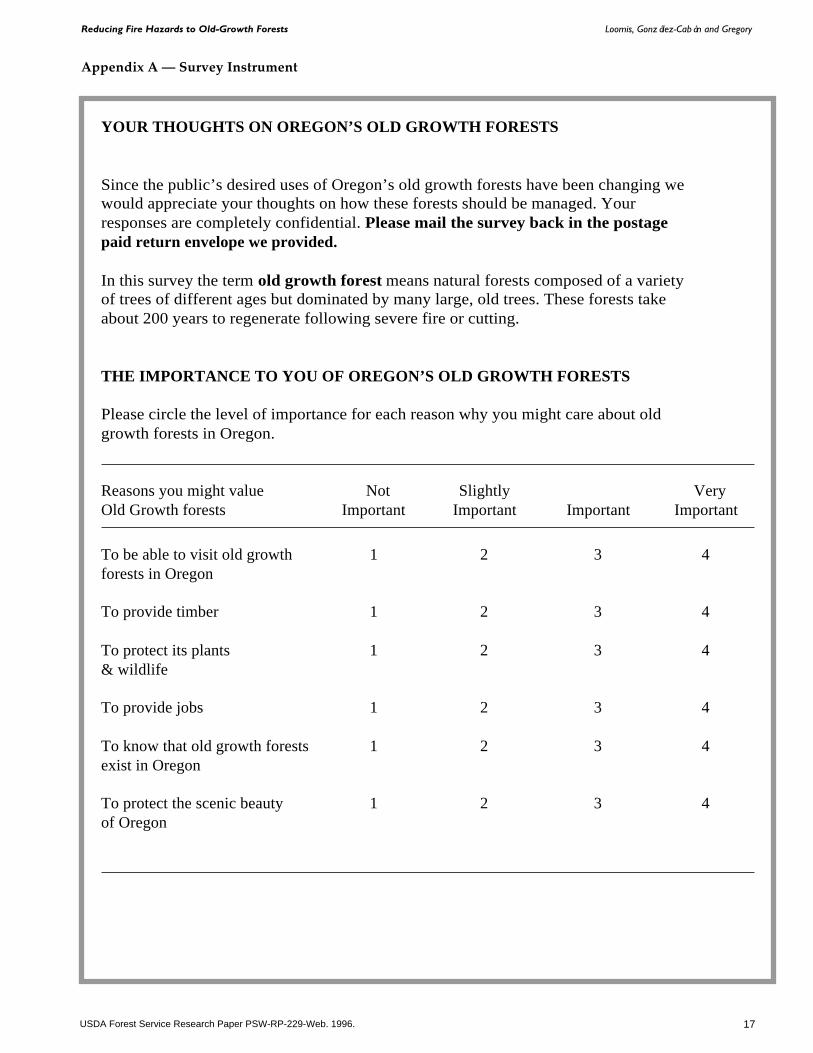
THE IMPORTANCE TO YOU OF OREGON’S OLD GROWTH FORESTS
Please circle the level of importance for each reason why you might care about oldgrowth forests in Oregon.
Reasons you might value Not Slightly VeryOld Growth forests Important Important Important Important
To be able to visit old growth 1 2 3 4forests in Oregon
To provide timber 1 2 3 4
To protect its plants 1 2 3 4& wildlife
To provide jobs 1 2 3 4
To know that old growth forests 1 2 3 4exist in Oregon
To protect the scenic beauty 1 2 3 4of Oregon
18 USDA Forest Service Research Paper PSW-RP-229-Web. 1996.
Reducing Fire Hazards to Old-Growth Forests Loomis, González-Cabán and Gregory
Appendix A — (continued)
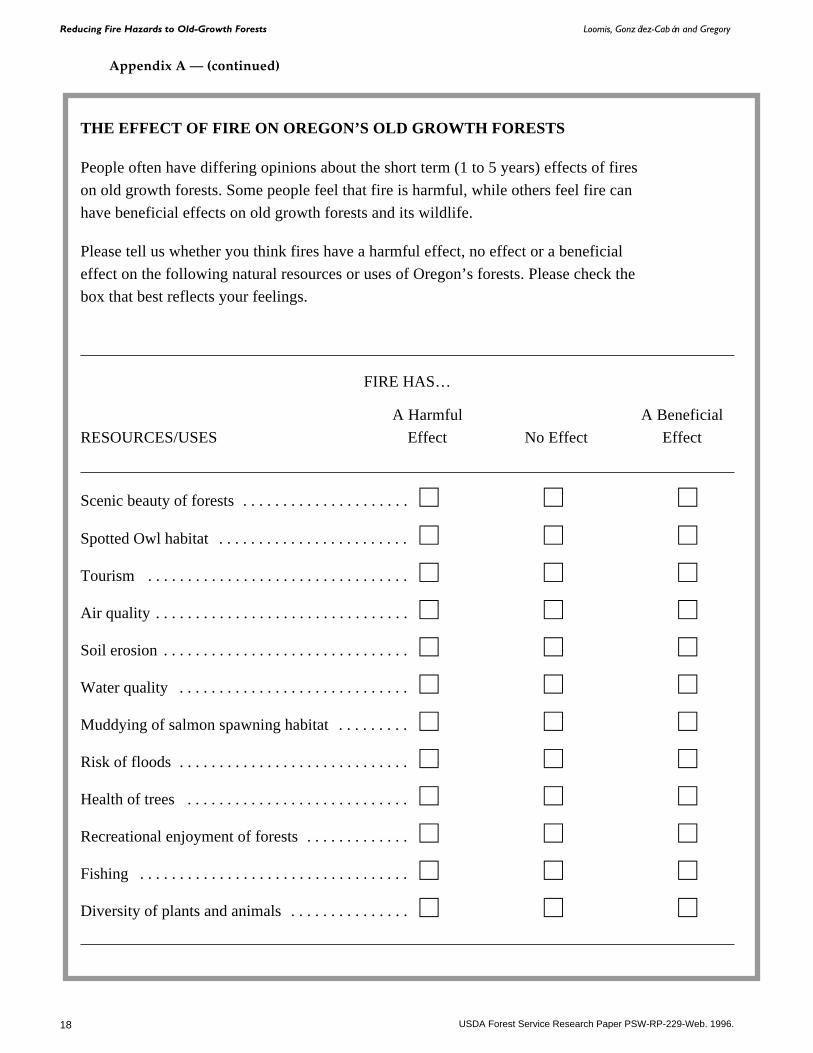
THE EFFECT OF FIRE ON OREGON’S OLD GROWTH FORESTS
People often have differing opinions about the short term (1 to 5 years) effects of fires
on old growth forests. Some people feel that fire is harmful, while others feel fire can
have beneficial effects on old growth forests and its wildlife.
Please tell us whether you think fires have a harmful effect, no effect or a beneficial
effect on the following natural resources or uses of Oregon’s forests. Please check the
box that best reflects your feelings.
FIRE HAS…
A Harmful A Beneficial
RESOURCES/USES Effect No Effect Effect
Scenic beauty of forests . . . . . . . . . . . . . . . . . . . . .@ @ @Spotted Owl habitat . . . . . . . . . . . . . . . . . . . . . . . .@ @ @Tourism . . . . . . . . . . . . . . . . . . . . . . . . . . . . . . . . .@ @ @Air quality . . . . . . . . . . . . . . . . . . . . . . . . . . . . . . . .@ @ @Soil erosion . . . . . . . . . . . . . . . . . . . . . . . . . . . . . . .@ @ @Water quality . . . . . . . . . . . . . . . . . . . . . . . . . . . . .@ @ @Muddying of salmon spawning habitat . . . . . . . . .@ @ @Risk of floods . . . . . . . . . . . . . . . . . . . . . . . . . . . . .@ @ @Health of trees . . . . . . . . . . . . . . . . . . . . . . . . . . . .@ @ @Recreational enjoyment of forests . . . . . . . . . . . . .@ @ @Fishing . . . . . . . . . . . . . . . . . . . . . . . . . . . . . . . . . .@ @ @Diversity of plants and animals . . . . . . . . . . . . . . .@ @ @
19USDA Forest Service Research Paper PSW-RP-229-Web. 1996.
Reducing Fire Hazards to Old-Growth Forests Loomis, González-Cabán and Gregory
Appendix A — (continued)
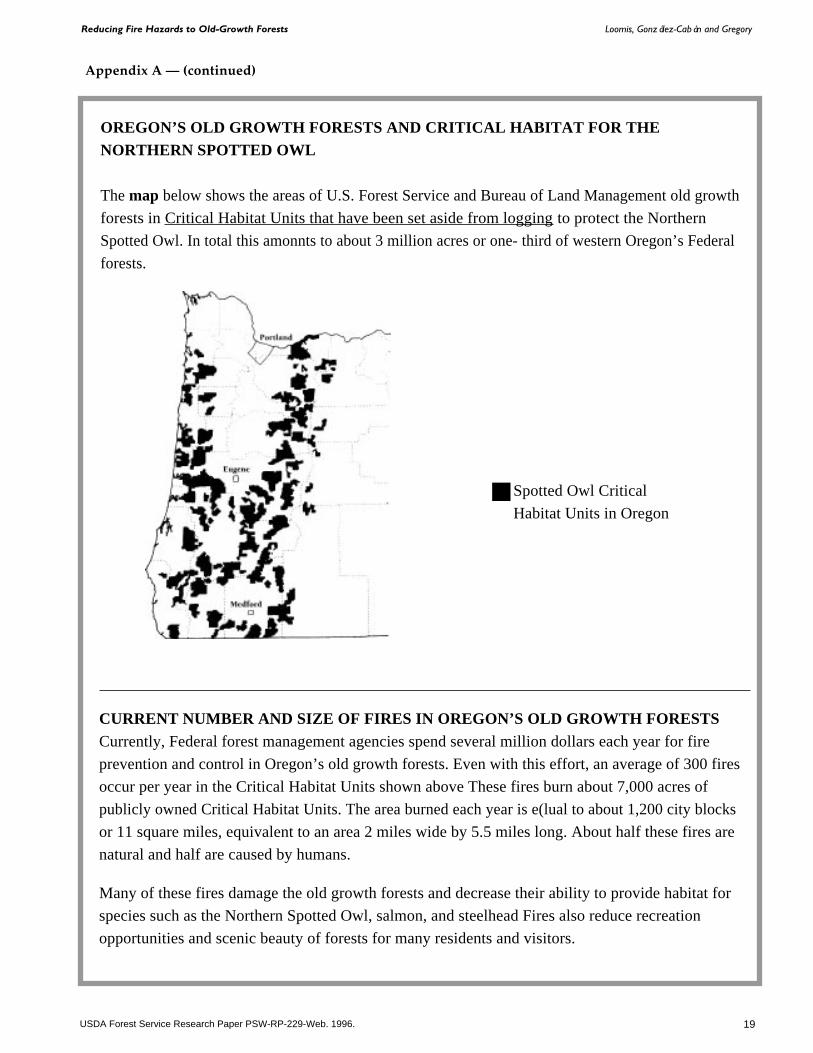
OREGON’S OLD GROWTH FORESTS AND CRITICAL HABITAT FOR THENORTHERN SPOTTED OWL
The map below shows the areas of U.S. Forest Service and Bureau of Land Management old growth
forests in Critical Habitat Units that have been set aside from logging to protect the Northern
Spotted Owl. In total this amonnts to about 3 million acres or one- third of western Oregon’s Federal
forests.
CURRENT NUMBER AND SIZE OF FIRES IN OREGON’S OLD GROWTH FORESTSCurrently, Federal forest management agencies spend several million dollars each year for fire
prevention and control in Oregon’s old growth forests. Even with this effort, an average of 300 fires
occur per year in the Critical Habitat Units shown above These fires burn about 7,000 acres of
publicly owned Critical Habitat Units. The area burned each year is e(lual to about 1,200 city blocks
or 11 square miles, equivalent to an area 2 miles wide by 5.5 miles long. About half these fires are
natural and half are caused by humans.
Many of these fires damage the old growth forests and decrease their ability to provide habitat for
species such as the Northern Spotted Owl, salmon, and steelhead Fires also reduce recreation
opportunities and scenic beauty of forests for many residents and visitors.
Spotted Owl Critical
Habitat Units in Oregon
20 USDA Forest Service Research Paper PSW-RP-229-Web. 1996.
Reducing Fire Hazards to Old-Growth Forests Loomis, González-Cabán and Gregory
Appendix A — (continued)
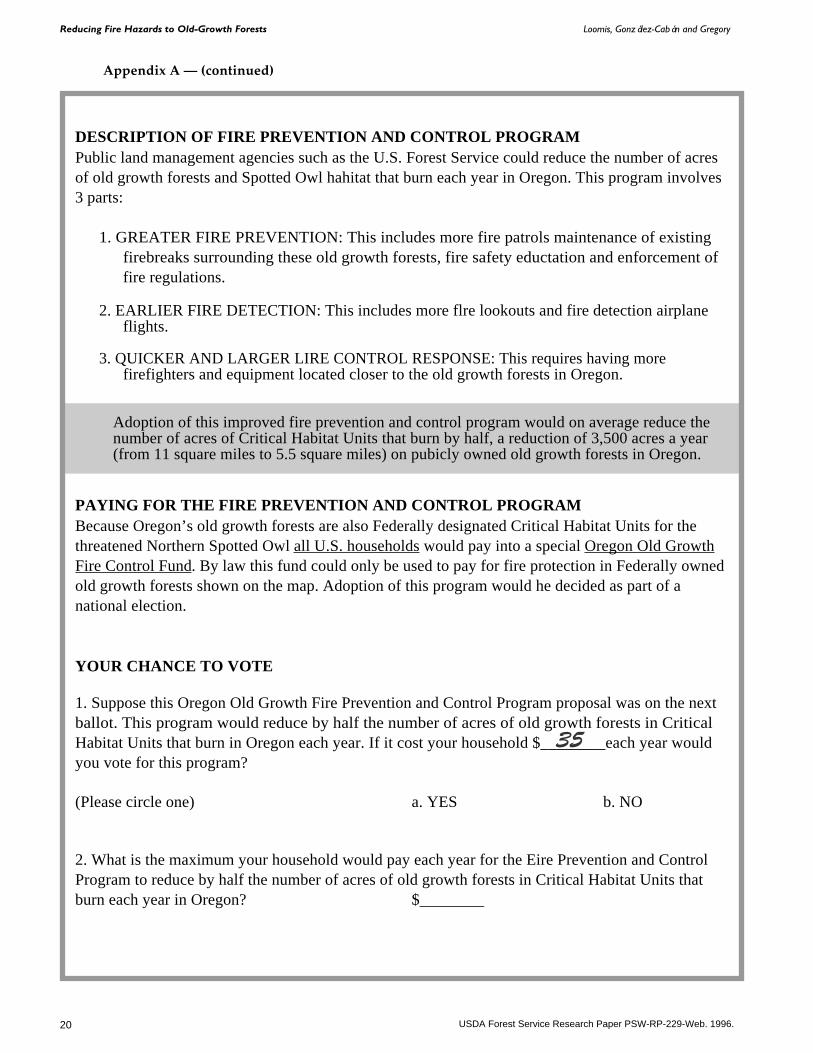
DESCRIPTION OF FIRE PREVENTION AND CONTROL PROGRAMPublic land management agencies such as the U.S. Forest Service could reduce the number of acresof old growth forests and Spotted Owl hahitat that burn each year in Oregon. This program involves3 parts:
1. GREATER FIRE PREVENTION: This includes more fire patrols maintenance of existingfirebreaks surrounding these old growth forests, fire safety eductation and enforcement offire regulations.
2. EARLIER FIRE DETECTION: This includes more flre lookouts and fire detection airplaneflights.
3. QUICKER AND LARGER LIRE CONTROL RESPONSE: This requires having morefirefighters and equipment located closer to the old growth forests in Oregon.
Adoption of this improved fire prevention and control program would on average reduce thenumber of acres of Critical Habitat Units that burn by half, a reduction of 3,500 acres a year(from 11 square miles to 5.5 square miles) on pubicly owned old growth forests in Oregon.
PAYING FOR THE FIRE PREVENTION AND CONTROL PROGRAMBecause Oregon’s old growth forests are also Federally designated Critical Habitat Units for thethreatened Northern Spotted Owl all U.S. households would pay into a special Oregon Old GrowthFire Control Fund. By law this fund could only be used to pay for fire protection in Federally ownedold growth forests shown on the map. Adoption of this program would he decided as part of anational election.
YOUR CHANCE TO VOTE
1. Suppose this Oregon Old Growth Fire Prevention and Control Program proposal was on the nextballot. This program would reduce by half the number of acres of old growth forests in CriticalHabitat Units that burn in Oregon each year. If it cost your household $________each year wouldyou vote for this program?
(Please circle one) a. YES b. NO
2. What is the maximum your household would pay each year for the Eire Prevention and ControlProgram to reduce by half the number of acres of old growth forests in Critical Habitat Units thatburn each year in Oregon? $________
35
21USDA Forest Service Research Paper PSW-RP-229-Web. 1996.
Reducing Fire Hazards to Old-Growth Forests Loomis, González-Cabán and Gregory
Appendix A — (continued)
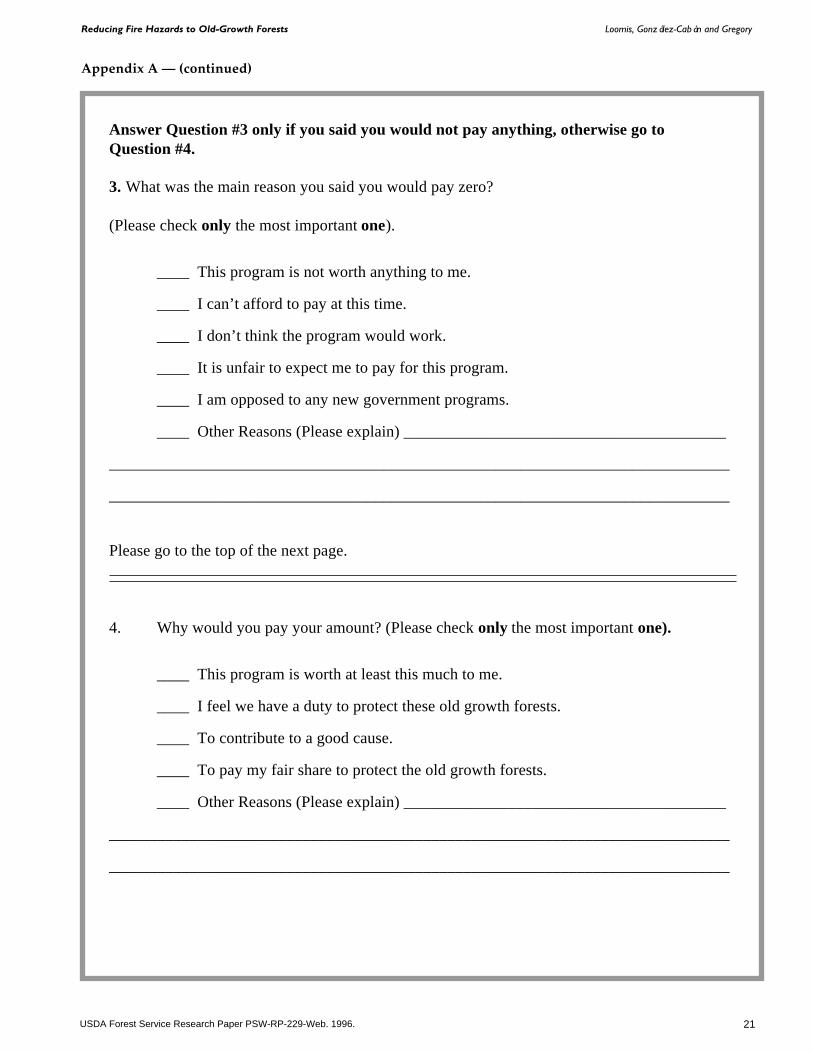
Answer Question #3 only if you said you would not pay anything, otherwise go toQuestion #4.
3. What was the main reason you said you would pay zero?
(Please check only the most important one).
____ This program is not worth anything to me.
____ I can’t afford to pay at this time.
____ I don’t think the program would work.
____ It is unfair to expect me to pay for this program.
____ I am opposed to any new government programs.
____ Other Reasons (Please explain) ________________________________________
_____________________________________________________________________________
_____________________________________________________________________________
Please go to the top of the next page.
4. Why would you pay your amount? (Please check only the most important one).
____ This program is worth at least this much to me.
____ I feel we have a duty to protect these old growth forests.
____ To contribute to a good cause.
____ To pay my fair share to protect the old growth forests.
____ Other Reasons (Please explain) ________________________________________
_____________________________________________________________________________
_____________________________________________________________________________
22 USDA Forest Service Research Paper PSW-RP-229-Web. 1996.
Reducing Fire Hazards to Old-Growth Forests Loomis, González-Cabán and Gregory
Appendix A (continued)
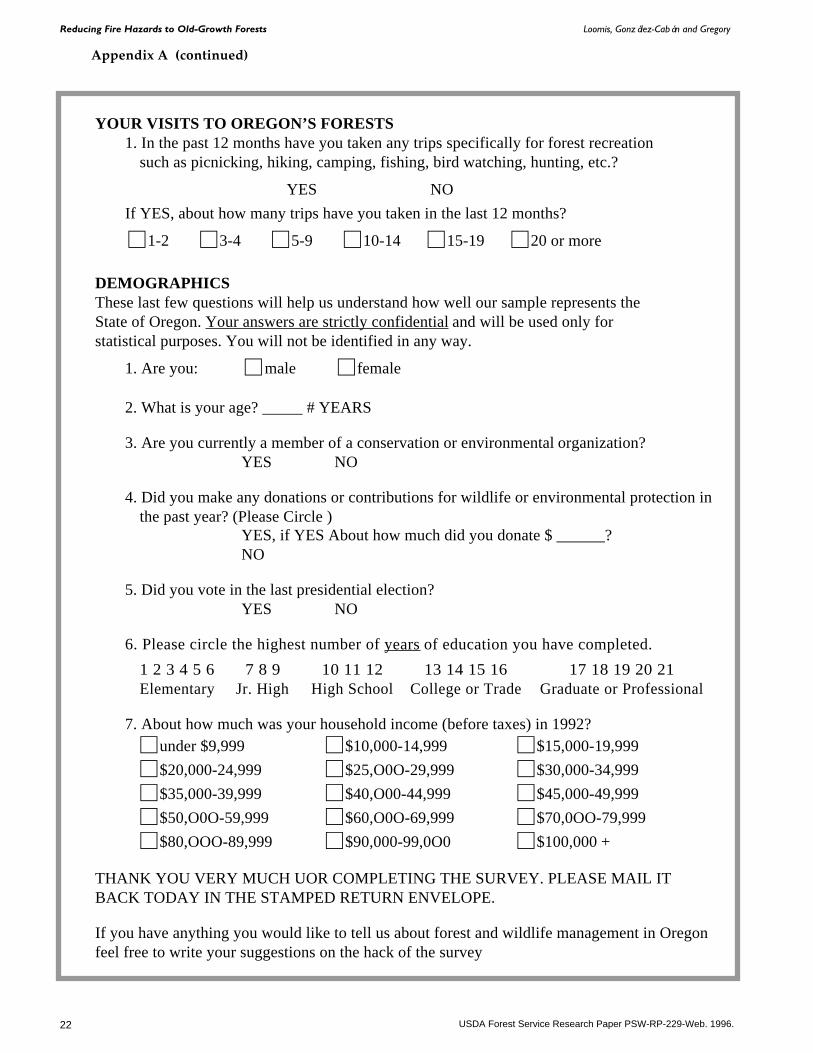
YOUR VISITS TO OREGON’S FORESTS1. In the past 12 months have you taken any trips specifically for forest recreation
such as picnicking, hiking, camping, fishing, bird watching, hunting, etc.?
YES NO
If YES, about how many trips have you taken in the last 12 months?@1-2 @3-4 @5-9 @10-14 @15-19 @20 or more
DEMOGRAPHICSThese last few questions will help us understand how well our sample represents theState of Oregon. Your answers are strictly confidential and will be used only forstatistical purposes. You will not be identified in any way.
1. Are you: @male @female
2. What is your age? _____ # YEARS
3. Are you currently a member of a conservation or environmental organization?YES NO
4. Did you make any donations or contributions for wildlife or environmental protection inthe past year? (Please Circle )
YES, if YES About how much did you donate $ ______?NO
5. Did you vote in the last presidential election?YES NO
6. Please circle the highest number of years of education you have completed.
1 2 3 4 5 6 7 8 9 10 11 12 13 14 15 16 17 18 19 20 21Elementary Jr. High High School College or Trade Graduate or Professional
7. About how much was your household income (before taxes) in 1992?@under $9,999 @$10,000-14,999 @$15,000-19,999@$20,000-24,999 @$25,O0O-29,999 @$30,000-34,999@$35,000-39,999 @$40,O00-44,999 @$45,000-49,999@$50,O0O-59,999 @$60,O0O-69,999 @$70,0OO-79,999@$80,OOO-89,999 @$90,000-99,0O0 @$100,000 +
THANK YOU VERY MUCH UOR COMPLETING THE SURVEY. PLEASE MAIL ITBACK TODAY IN THE STAMPED RETURN ENVELOPE.
If you have anything you would like to tell us about forest and wildlife management in Oregonfeel free to write your suggestions on the hack of the survey

23USDA Forest Service Research Paper PSW-RP-229-Web. 1996.
Reducing Fire Hazards to Old-Growth Forests Loomis, González-Cabán and Gregory
Appendix A — (continued)
Thank you for your participation!Please add any additional comments here:
DECISION RESEARCH
1201 Oak Street
Eugene, Oregon 97401
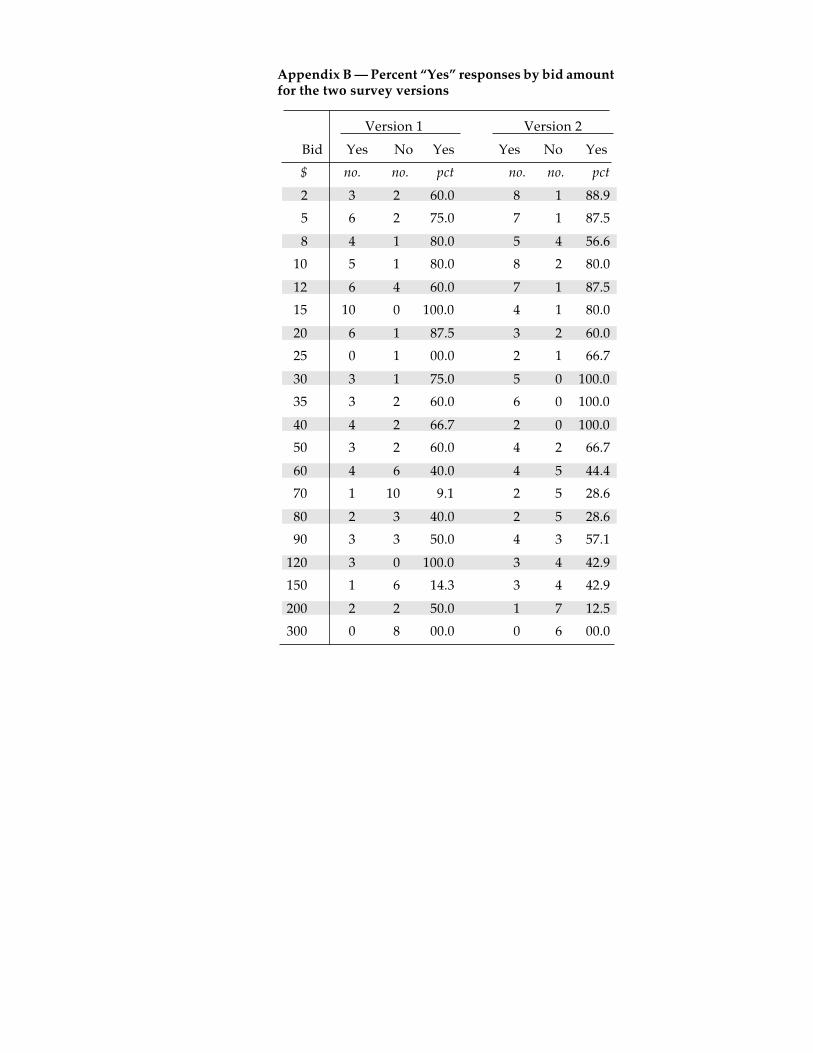
Appendix B — Percent “Yes” responses by bid amountfor the two survey versions
Version 1 Version 2
Bid Yes No Yes Yes No Yes
$ no. no. pct no. no. pct
2 3 2 60.0 8 1 88.9
5 6 2 75.0 7 1 87.5
8 4 1 80.0 5 4 56.6
10 5 1 80.0 8 2 80.0
12 6 4 60.0 7 1 87.5
15 10 0 100.0 4 1 80.0
20 6 1 87.5 3 2 60.0
25 0 1 00.0 2 1 66.7
30 3 1 75.0 5 0 100.0
35 3 2 60.0 6 0 100.0
40 4 2 66.7 2 0 100.0
50 3 2 60.0 4 2 66.7
60 4 6 40.0 4 5 44.4
70 1 10 9.1 2 5 28.6
80 2 3 40.0 2 5 28.6
90 3 3 50.0 4 3 57.1
120 3 0 100.0 3 4 42.9
150 1 6 14.3 3 4 42.9
200 2 2 50.0 1 7 12.5
300 0 8 00.0 0 6 00.0
The Forest Service, U.S. Department of Agriculture, is responsible for Federal Leadership in forestry.It carries out this role through four main activities:
• Protection and management of resources on 191 million acres of National Forest System lands
• Cooperation with State and local governments, forest industries, and private landowners to help protect andmanage non-Federal forest and associated range and watershed lands
• Participation with other agencies in human resource and community assistance programs to improve livingconditions in rural areas
• Research on all aspects of forestry, rangeland management, and forest resources utilization.
The Pacific Southwest Research Station
• Represents the research branch of the Forest Service in California, Hawaii, American Samoa, and thewestern Pacific.
The U.S. Department of Agriculture prohibits discrimination in its programs on the basis of race, color,national origin, sex, religion, age, disability, political beliefs, and marital or familial status. (Not all prohibitedbases apply to all programs.) Persons with disabilities who require alternative means for communicationsof program information (braille, large print, audiotape, etc.) should contact the USDA Office of Communicationsat (202) 720-5881 (voice) or (202) 720-7808 (TDD). To file a complaint, write the Secretary of Agriculture,U.S. Department of Agriculture, Washington, DC 20250 or call (202) 720-7327 (voice) or (202) 720-1127.USDA is an equal employment opportunity employer.