Embed Size (px)
Citation preview
MARCH 2015 | VOLUME 13 | NO. 1
Learning Disabilities:A Contemporary Journal
AN INTERNATIONAL JOURNALPublished byLearning Disabilities Worldwidewww.ldworldwide.org
ISBN: 1930877153 ISSN: 1937-6928
EditorsTeresa Allissa CitroMatthias Grünke
Associate EditorsMarco G.P. Hessels Bruce Saddler
Guest EditorsCheryl A. Utley Festus E. Obiakor
179 Bear Hill Road | Waltham, MA 02451781-890-5399 | Fax 781-466-8887www.ldworldwide.org
Non Profit OrganizationSTANDARD
U. S. POSTAGEPAID
BOSTON, MAPERMIT NO. 54146
MARCH 2015 LEARNING DISABILITIES: A CO
NTEMPO
RARY JOURNAL 13 (1) 1-110
ISBN 1-930877-15-3
9
781930 877153
90000
Learning Disabilities: A Contemporary Journal
Consulting Editors Ioannis Agaliotis University of Macedonia
Margaret Beebe-FrankenbergerUniversity of Montana
Donald DeshlerUniversity of Kansas
George DuPaulLehigh University
Linda ElksninThe Citadel
Nick Elksnin The Citadel
Franco Fabbro University of Udine
Angela FawcettUniversity of Sheffield
Doug FuchsVanderbilt University
Bob Gates University of West London
Russell Gersten Instructional Research Group
Steven GrahamArizona State University
Charles GreenwoodJuniper Gardens Children’s Project
Noel GreggThe University of Georgia
Elena GrigorenkoYale University
Charles HughesThe Pennsylvania State University
EditorsTeresa Allissa Citro
Learning Disabilities Worldwide
Matthias GrünkeUniversity of Cologne
Associate EditorsMarco G.P. Hessels
University of Geneva
Bruce SaddlerState University of New York at Albany
Guest EditorsCheryl A. Utley
University of Illinois-Chicago
Festus E. ObiakorValdosta State University
Editorial AssistantTimo Lüke
University of Wuppertal
Copy EditorMona Weichselbaum
Design EditorMary Laity
Doris JohnsonNorthwestern University
Tevhide KarginAnkara University
James LeffertUniversity of Massachusetts, Boston
Jennifer H. LindstromThe University of Georgia
Daniela LucangeliUniversity of Padua
Larry MaheadySUNY at Fredonia
Margo MastropieriGeorge Mason University
Paul Morgan The Pennsylvania State University
John NezlekCollege of William & Mary
Festus ObiakorValdosta State University
Anthony J. OnwuegbuzieUniversity of South Florida
Susana PadeliaduUniversity of Thessaly
Edward PollowayLynchburg College
Deanna SandsUniversity of Colorado at Denver
David ScanlonBoston College
Bennett A. ShaywitzYale University, Child Study Center
Sally E. ShaywitzYale University, Child Study Center
Susanne SchwabUniversity of Bielefeld
Gary SipersteinUniversity of Massachusetts, Boston
Margaret SnowlingUniversity of York
Keith StanovichUniversity of Toronto
Lee SwansonUniversity of California, Riverside
Harvey SwitzkyUniversity of Northern Illinois
Nadia Jameel Taibah King Abdulaziz University
Melody Tankersley Kent State University
Gary A. TroiaMichigan State University
Cheryl UtleyUniversity of Illinois-Chicago
Sharon VaughnThe University of Texas at Austin
Marja VaurasUniversity of Turku
Jürgen Wilbert University of Potsdam

Students with learning and reading disabilities need special instruction to
achieve. Their teachers need specialized skills to help their students learn
and succeed. offers eight online learning modules that cover
crucial skills for reading
teachers. Learn from
programs developed by the
Center for Research on
Learning at the University
of Kansas – a leader in the
research and development
of teaching interventions for
special needs students.
When they learn to read,they gain the world.
To see a demo of these modules click on http://reading.elearningcreations.com
is pleased to offer these
modules at nearly a 40% discount to LDW
members.
Help them learn. Give them the world.
11184 Antioch, #400Overland Park, KS 66210-2420
Phone: 816.213.6092www. elearningcreations.com
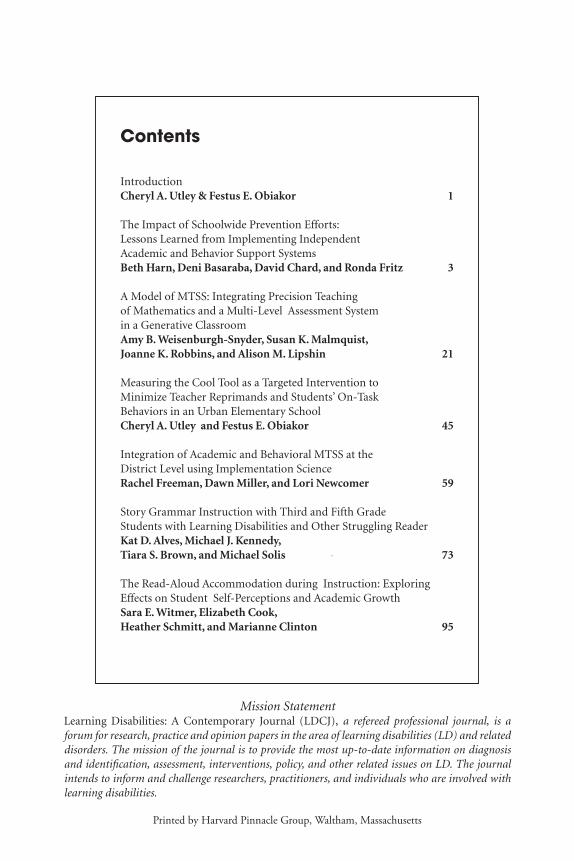
Mission StatementLearning Disabilities: A Contemporary Journal (LDCJ), a refereed professional journal, is a forum for research, practice and opinion papers in the area of learning disabilities (LD) and related disorders. The mission of the journal is to provide the most up-to-date information on diagnosis and identification, assessment, interventions, policy, and other related issues on LD. The journal intends to inform and challenge researchers, practitioners, and individuals who are involved with learning disabilities.
Printed by Harvard Pinnacle Group, Waltham, Massachusetts
Contents
IntroductionCheryl A. Utley & Festus E. Obiakor 1
The Impact of Schoolwide Prevention Efforts: Lessons Learned from Implementing Independent Academic and Behavior Support SystemsBeth Harn, Deni Basaraba, David Chard, and Ronda Fritz 3
A Model of MTSS: Integrating Precision Teaching of Mathematics and a Multi-Level Assessment System in a Generative ClassroomAmy B. Weisenburgh-Snyder, Susan K. Malmquist, Joanne K. Robbins, and Alison M. Lipshin 21
Measuring the Cool Tool as a Targeted Intervention to Minimize Teacher Reprimands and Students’ On-Task Behaviors in an Urban Elementary School Cheryl A. Utley and Festus E. Obiakor 45
Integration of Academic and Behavioral MTSS at the District Level using Implementation ScienceRachel Freeman, Dawn Miller, and Lori Newcomer 59
Story Grammar Instruction with Third and Fifth Grade Students with Learning Disabilities and Other Struggling ReaderKat D. Alves, Michael J. Kennedy, Tiara S. Brown, and Michael Solis 73
The Read-Aloud Accommodation during Instruction: Exploring Effects on Student Self-Perceptions and Academic GrowthSara E. Witmer, Elizabeth Cook, Heather Schmitt, and Marianne Clinton 95
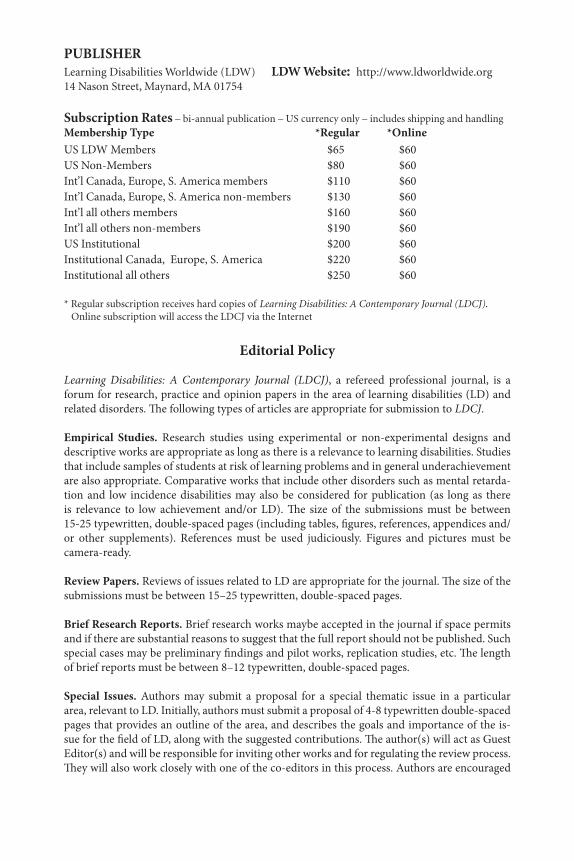
PUBLISHER Learning Disabilities Worldwide (LDW) LDW Website: http://www.ldworldwide.org14 Nason Street, Maynard, MA 01754
Subscription Rates – bi-annual publication – US currency only – includes shipping and handling Membership Type *Regular *OnlineUS LDW Members $65 $60US Non-Members $80 $60Int’l Canada, Europe, S. America members $110 $60Int’l Canada, Europe, S. America non-members $130 $60Int’l all others members $160 $60Int’l all others non-members $190 $60US Institutional $200 $60Institutional Canada, Europe, S. America $220 $60 Institutional all others $250 $60
* Regular subscription receives hard copies of Learning Disabilities: A Contemporary Journal (LDCJ). Online subscription will access the LDCJ via the Internet
Editorial Policy
Learning Disabilities: A Contemporary Journal (LDCJ), a refereed professional journal, is a forum for research, practice and opinion papers in the area of learning disabilities (LD) and related disorders. The following types of articles are appropriate for submission to LDCJ.
Empirical Studies. Research studies using experimental or non-experimental designs and descriptive works are appropriate as long as there is a relevance to learning disabilities. Studies that include samples of students at risk of learning problems and in general underachievement are also appropriate. Comparative works that include other disorders such as mental retarda-tion and low incidence disabilities may also be considered for publication (as long as there is relevance to low achievement and/or LD). The size of the submissions must be between 15-25 typewritten, double-spaced pages (including tables, figures, references, appendices and/or other supplements). References must be used judiciously. Figures and pictures must be camera-ready.
Review Papers. Reviews of issues related to LD are appropriate for the journal. The size of the submissions must be between 15–25 typewritten, double-spaced pages.
Brief Research Reports. Brief research works maybe accepted in the journal if space permits and if there are substantial reasons to suggest that the full report should not be published. Such special cases may be preliminary findings and pilot works, replication studies, etc. The length of brief reports must be between 8–12 typewritten, double-spaced pages.
Special Issues. Authors may submit a proposal for a special thematic issue in a particular area, relevant to LD. Initially, authors must submit a proposal of 4-8 typewritten double-spaced pages that provides an outline of the area, and describes the goals and importance of the is-sue for the field of LD, along with the suggested contributions. The author(s) will act as Guest Editor(s) and will be responsible for inviting other works and for regulating the review process. They will also work closely with one of the co-editors in this process. Authors are encouraged
PUBLISHER Continuedto consult the co-editors, prior to submitting their proposal, in order to verify appropriateness and relevance of the topic to the LD field. Practice Papers. These are reports of practical nature that have relevance and importance to educators, practitioners, and researchers. They may describe innovative instructional prac-tices, behavior modification programs, etc. The length of these reports must be between 8-15 typewritten, double-spaced pages. Opinion Papers. These papers may address issues of policy, legislation, mandates and laws relevant to the LD population, etc. They may be the basis for a forum for discussion by other members of the field of LD. Research Methodology Reports. The purpose of these reports is to convey methodological and/or data analytic advances that have particular relevance for the LD field. The length of these reports must be between 8–15 typewritten, double-spaced pages.
Manuscript Preparation
Authors must adhere to the writing guidelines described in latest edition of the Publication Manual of the American Psychological Association. For sample guidelines authors may visit APA at http://www.apastyle.org. With their submission, authors must send a cover letter in-dicating the title and length of the paper and must state that their work is not currently under review in another journal. Authors should include two title pages (one with title only) and the other with full author information. Manuscripts will be sent for a blind review to 2–3 members of the editorial board. Authors will be notified of the editorial decision with a formal letter from one of the co-editors. If the manuscript is accepted, authors will be asked to send it electronically as a document in Word—Figures and diagrams should be individual black & white PDF files (both PC and Mac formats are acceptable) and they will also need to fill in a copyright waiver form. Electronic submission should be sent via email to Matthias Grünke ([email protected]). The editors reserve the right to make final editorial changes to the manuscripts (without, however, altering the content of the original submission).

At Landmark School we embrace the potential ofevery student through daily one-to-one tutorials andan individualized approach to teaching. Landmark isa leader in the field of language-based learning disabili-ties, and 92% of our graduates go on to college.
Grades 2 - 12Boarding and Day • Summer Programs
Professional Development Courses & Publications
One-to-One, Every Day
Landmark SchoolPrides Crossing, Massachusetts • 978.236.3000
www.landmarkschoolorg
Embracing Potential. Empowering Lives.Educating students with language-based learning disabilities.
ONE TO ONE 4.5 x 7.5 7/13/09 1:28 PM Page 1
Learning Disabilities: A Contemporary Journal 13(1), 1–2, 2015 Copyright @ by LDW 2015
Special Issue: Research Perspectives on Multi-tiered System of Support
Cheryl A. UtleyUniversity of Illinois-Chicago (USA)
Festus E. ObiakorValdosta State University (USA)
IntroductIon to the SpecIal ISSue
Evidence-based programs and interventions targeting special education programs fall within a multi-tiered system of support (MTSS) which consists of in-creased instructional time, interventions, and improved educational outcomes for students in general and special education. The NASP Position Statement, “Appropri-ate Behavioral, Social, and Emotional Supports to Meet the Needs of All Students” (NASP, 2009) recommends the MTSS comprehensive framework to address the ac-ademic and social, emotional, and behavioral development of children and youth. The MTTS framework consists of principles of response to intervention (RtI) and positive behavioral interventions and supports (PBIS) and integrates a continuum of system-wide resources, strategies, structures, and evidence-based practices for ad-dressing barriers to student learning and discipline. Successful implementation of MTSS requires schools to implement a continuum of systematic, coordinated, evi-dence-based practices targeted to being responsive to the varying intensity of needs students have related to their academic and social emotional/behavioral development (Harn, Chard, Biancarosa, & Kame`enui, 2011; Horner, Sugai, & Anderson, 2010).
The first article by Harn, Basaraba, Chard, and Fritz presents information and data on a longitudinal study designed to accelerate first graders at-risk for read-ing difficulties until the end of third grade. Interventions and student outcomes, in-cluding data on students’ progress across each year and information on how many continued to need instructional supports across time were described. The study con-cludes with a discussion on students continuing to demonstrate significant reading difficulties even after this level of intensive support. Lessons learned and reflections were provided on how these efforts may have been improved through more coordi-nated academic and behavioral supports.
The second article by Weisenburgh-Snyder, Malmquist, Robbins, and Lip-shin is a case study detailing the rapid progress of a class of students during using Precision Teaching (PT), a frequency building instructional intervention, which con-sists of a multi-level assessment system, combined with evidence-based practices of teaching and learning within a RtI framework. The implementation of PT results in the systematic acceleration of student progress in mathematics. In addition, this study showed that PT contributed to MTSS by creating a common language between and amongst students, teachers, families, and administrators. In this unique blended system, the data collected by administrators, teachers, and students were continu-ously assessed and used to inform instruction and teacher training needs.
Within a PBIS conceptual framework, the third article by Utley and Obia-kor examined a targeted intervention, the Cool Tool, at the secondary prevention
Learning Disabilities: A Contemporary Journal 13(1), 1–2, 2015
2
level to address problem behaviors of elementary students in an urban school. Todd, Campbell, Meyer, & Horner (2008) noted that targeted interventions are designed to “provide efficient behavior support for students at risk of more intense problem behavior” (pp. 46-47). Key elements in the targeted intervention included organi-zational systems, intervention practices, and data use. The Cool Tool, a social skills intervention, focused on (a) teaching students appropriate social skills, (b) when to use social skills, and (c) routines for using the targeted intervention. Multiple as-sessments included pre-posttest classroom observations to measure teacher praise vs. reprimand and students’ on versus off task behaviors.
The fourth article by Freeman, Miller, and Newcomer incorporated both RtI and School-wide Positive Behavior Support (SWPBS) in the MTSS and describes the integration of several tiered implementation models into one coherent, combined system designed to address literacy and social competence (Lane, Menzies, Ennis, & Bezdek, 2013; McIntosh & Goodman, in press). These authors discuss the role of school district leadership as an essential component for successful MTSS implemen-tation. District leadership in MTSS provides schools with political and administra-tive support, training and technical assistance, layered in-service curricula, data-based decision making systems for ongoing evaluation, and access to interagency relationships for supporting student health and wellbeing. This article addressed key district mechanisms that are used to integrate academic and behavioral interventions as school personnel learn new strategies for improving outcomes for students.
referenceS
Harn, B. A., Biancarosa, G., Chard, D. J., & Kame`enui, E. J. (2011). Coordinating instructional supports to accelerate at-risk first grade readers’ performance: An essential mecha-nism for effective RTI. Elementary School Journal. Retrieved from http://www.jstor.org/stable/10.1086/661997
Horner, R. H., Sugai, G., & Anderson, C. M. (2010). Examining the evidence base for school-wide positive behavior support. Focus on Exceptional Children, 42, 1-14.
Lane, K. L., Menzies, H. M., Ennis, R. P., & Bezdek, J. (2013). School-wide systems to promote positive behaviors and facilitate instruction. Journal of Curriculum and Instruction, 7, 6-31.
McIntosh, K., & Goodman, S. (in press). Multi-tiered systems of support: Integrating academic RTI and school-wide PBIS. New York: Guilford Press.
National Association of School Psychologists. (2009). Appropriate academic supports to meet the needs of all students [Position Statement]. Bethesda, MD: Author.
Todd, A., Campbell, A.L., Meyer, G.G., & Horner, R.H. (2008). The effects of a targeted inter-vention to reduce problem behaviors: Elementary school implementation of check in-check out. Journal of Positive Behavior Interventions, 10, 46-55.
note from the journal edItorS
This edition also includes a paper by Kat D. Alves, Michael J. Kennedy, Tiara S. Brown, and Michael Solis on story grammar instruction with third and fifth grade students and one by Sara E. Witmer, Elizabeth Cook, Heather Schmitt, and Marianne Clinton on the read-aloud accommodation during instruction, which are not part of the special issue guest-edited by Cheryl A. Utley and Festus E. Obiakor.
Learning Disabilities: A Contemporary Journal 13(1), 3-20, 2015 Copyright @ by LDW 2015
*Please send correspondence to: Beth Harn, Ph.D., University of Oregon, College of Education, 5261 University of Oregon, Eugene, OR 97403-5261 USA, Email: [email protected].
The Impact of Schoolwide Prevention Efforts: Lessons Learned from Implementing Independent
Academic and Behavior Support SystemsBeth Harn
University of Oregon, Eugene, OR (USA)
Deni Basaraba David Chard
Southern Methodist University, Dallas, TX (USA)
Ronda FritzUniversity of Oregon, Eugene, OR (USA)
Great progress has been made in learning how to provide more respon-sive instructional and behavioral supports to students through efforts in Response to Intervention and Positive Behavior and Intervention Sup-ports. This article presents information and data on a longitudinal study designed to accelerate first graders at-risk for reading difficulties until the end of third grade. Interventions are described along with outcomes following students across this time including data on students’ progress across each year and information on how many continued to need in-structional supports. The paper finishes with a discussion on students continuing to demonstrate significant reading difficulties even after this level of intensive support. Lessons learned and reflections are provided on how these efforts may have been improved through more coordinated academic and behavioral supports with implications for implementing Multi-tiered Systems of Support (MTSS).
Keywords: Response to Intervention, Positive Behavior and Inter-vention Supports, Reading Difficulties, Longitudinal Study.
IntroductIon
Successful implementation of Multi-tiered System of Supports (MTSS) requires schools to implement a continuum of systematic, coordinated, evidence-based practices targeted to being responsive to the varying intensity of needs stu-dents have related to their academic and social emotional/behavioral development (Harn, Chard, Biancarosa, & Kame`enui, 2011; Horner, Sugai, & Anderson, 2010). This inherently preventive approach is built upon the understanding that we can do more to prevent students from developing intractable academic and behavioral dif-ficulties while students are in early elementary grades than attempting remediation efforts later in schooling (Bradley, Danielson, & Doolittle, 2005; Torgeson, 2000). While MTSS was initially developed and implemented in relation to Response to In-tervention (RTI) and focused on improving reading outcomes, Positive Behavioral and Intervention Supports (PBIS) uses similar features and components to promote social development and prevent the development of significant challenging behavior
Learning Disabilities: A Contemporary Journal 13(1), 3-20, 2015
4
with great success (Bradshaw, Mitch, & Leaf, 2010; Horner, Sugai, & Anderson, 2010; Simonsen & Sugai, 2013). While there is a call for the integration of academic and behavioral MTSS due to the known interaction of academic and behavioral issues in many students who struggle (Mclntosh, Horner, Chard, Boland, & Good, 2006), in general most schools are operating these schoolwide efforts independently (McIn-tosh, Goodman, & Bohanan, 2010).
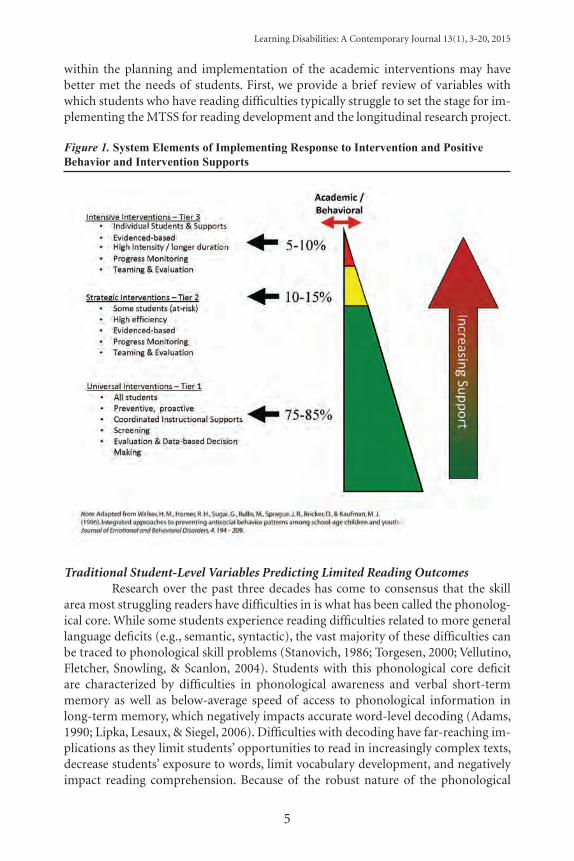
The common features to implementing RTI and PBIS include the follow-ing: (a) coordination of schoolwide prevention efforts and systems, (b) universal screening and progress monitoring, (c) selection and use of evidence-based practices, (d) professional development that targets evidence-based practice, (e) evaluating outcomes using data-based decision making, and (f) leadership commitment from administrators and school-based teams that supports school-wide implementation (Kame’enui, Good, & Harn, 2005; Sugai & Horner, 2006). See Figure 1 for a depiction of how these elements work together to support a responsive support system. Coor-dinating schoolwide prevention efforts means that schools regularly teach and rein-force the behavioral expectations for appropriate social and learning behavior as well as teach the essential skills in literacy development. Both PBIS and RTI collect data regularly to identify students early on that are at risk for later challenges. For RTI, formative evaluation measures such as the Dynamic Indicators of Basic Early Literacy Skills (Good & Kaminski, 2006) or AIMSWeb (Shinn, 2008) have developed techni-cally adequate measures to screen all students quarterly as well as progress monitor-ing tools for monitoring students learning in response to intervention efforts. For PBIS, the most commonly used measure is office discipline referrals (ODRs) to iden-tify students who are displaying inappropriate behaviors at an alarming rate (Sugai & Horner, 2006). Both approaches advocate schools implement practices that have established research demonstrating their efficacy, which requires that schools ensure that adequate professional development is provided to all staff to deliver these prac-tices as intended to maximize student outcomes. To ensure that these coordinated efforts continue to meet the needs of all students, both approaches also heavily em-phasize evaluating outcomes using data-based decision making procedures within a given school year, as well as to annually review to plan and prioritize efforts to ensure continuous improvement. Both approaches also require significant commit-ment from leaders, teachers, and specialists to implement the schoolwide approach, coordinate efforts, and maximize resources. However, within this feature, there has historically been a difference in terms of how the school-based teams are constructed and implemented. Most likely because of the differences in specialist skill sets and availability, specifically behavioral and reading specialists, schools have frequently set up separate teams to support implementation of PBIS and RTI (Chard, Harn, Horner & Sugai, 2008; McIntosh, Goodman, & Bohanan, 2010).
The purpose of this paper is to discuss the impact of a longitudinal project implementing MTSS for reading in two Districts that had established PBIS efforts. The academic intervention efforts across grades 1-3 will be discussed and the impact it had on a group of students identified as at-risk for reading difficulties in first grade will be shared. An emphasis will be placed on students who continued to need inten-sive intervention efforts in third grade with implications of how potentially integrat-ing PBIS technology (i.e., functional behavior assessments, behavior support plans)
Learning Disabilities: A Contemporary Journal 13(1), 3-20, 2015
5
within the planning and implementation of the academic interventions may have better met the needs of students. First, we provide a brief review of variables with which students who have reading difficulties typically struggle to set the stage for im-plementing the MTSS for reading development and the longitudinal research project.
Figure 1. System Elements of Implementing Response to Intervention and Positive Behavior and Intervention Supports
Traditional Student-Level Variables Predicting Limited Reading OutcomesResearch over the past three decades has come to consensus that the skill
area most struggling readers have difficulties in is what has been called the phonolog-ical core. While some students experience reading difficulties related to more general language deficits (e.g., semantic, syntactic), the vast majority of these difficulties can be traced to phonological skill problems (Stanovich, 1986; Torgesen, 2000; Vellutino, Fletcher, Snowling, & Scanlon, 2004). Students with this phonological core deficit are characterized by difficulties in phonological awareness and verbal short-term memory as well as below-average speed of access to phonological information in long-term memory, which negatively impacts accurate word-level decoding (Adams, 1990; Lipka, Lesaux, & Siegel, 2006). Difficulties with decoding have far-reaching im-plications as they limit students’ opportunities to read in increasingly complex texts, decrease students’ exposure to words, limit vocabulary development, and negatively impact reading comprehension. Because of the robust nature of the phonological
Learning Disabilities: A Contemporary Journal 13(1), 3-20, 2015
6
core deficit in struggling readers and the pervasive effect it can have on long term reading achievement, most early reading interventions have focused almost exclu-sively on improving students’ phonological awareness, early decoding skills/word analysis, sight word identification, and fluency development. A good deal of research has demonstrated the benefits of this content focus to prevent the development of long term reading difficulties (McMaster, Fuchs, Fuchs, & Compton, 2005; Simmons et al., 2007; Simmons et al., 2008; Vellutino et al., 1996).
Beyond these traditional early reading skills often implicated in reading fail-ure, there are other variables also predictive of risk. Research reviews of intervention studies revealed the following to also be predictors of later reading difficulty: (a) stu-dent demographics (e.g., race, socioeconomic status, home language), (b) vocabulary or verbal ability, (c) attention or behavior problems, (d) rapid automatized naming (RAN)/executive functioning, and (e) orthographic awareness (Al-Otaiba & Fuchs, 2002; Nelson, Benner, & Gonzales, 2003). Some of these predictors and their contri-bution to reading difficulties are more thoroughly understood than others. One of the more closely studied areas is the link between students who have comorbid academ-ics and attention/behavior difficulties (Dally, 2006; McKinney, 1989). One possible connection between reading and behavioral difficulties may be attentional problems (Fleming, Harachi, Cortes, Abbott, & Catalano, 2004; Posner & Petersen, 1990; Smith, Borkowski, & Whitman, 2008). These attentional problems may simultaneously in-terfere with learning and lead to problem behavior (Blair & Diamond, 2008; Fleming et al., 2004; McIntosh, Horner, Chard, Boland, & Good, 2006; Morrison, Anthony, Storino, & Dillon, 2001). However, the mechanism for other predictors, like rapid automatized naming/executive functions, are less well understood in their role on reading development (Fuchs et al., 2012; Savage & Frederickson, 2006). It should be noted that very few predictors have been examined within the same study or in the same intervention context making it difficult to determine the directionality of effect (i.e., reading difficulties cause later deficits or initial deficits cause later reading dif-ficulties; Al-Otaiba & Fuchs, 2006; Torgesen & Davis, 1996; Torgesen et al., 1999; Vel-lutino et al., 1996). While there is much research showing the predictiveness of these student characteristics, the utilization of MTSS is designed to ruin these predictions by creating a school and instructional context that intensifies efforts in response to the magnitude of student needs (Harn, Chard, Biancarosa, & Kameenui, 2011).
Features of Schools Implementing MTSSWhile there are a number of variations within the MTSS approach, this pa-
per will discuss the Schoolwide Reading Model (SWRM) (Baker et al., 2011; Coyne, Kame’enui, Simmons, & Harn, 2004). Schools implementing the SWRM have dem-onstrated that this systems-level prevention approach is significantly and positively related to reading outcomes (Baker et al., 2011; Chard et al., 2008; Sanford, Park, & Baker, 2013). Broadly speaking, the SWRM has three foundational features: (a) estab-lishing systems of supports to meet the needs of groups and individual students, (b) implementing a prevention-oriented approach designed to implement responsive and intentional intervention efforts to accelerate learning, and (c) enacting the practice of data-based decision making (Coyne, Kame’enui, Simmons, & Harn, 2004; Fien,
Learning Disabilities: A Contemporary Journal 13(1), 3-20, 2015
7
Kame’enui, & Good, 2009). More specifically, the SWRM includes the following sev-en essential components (Baker et al., 2011):
1. Adoption of schoolwide priorities and implementation of practice that focus on the essential reading skills;
2. Systematic collection of reliable and valid assessment data to inform instructional practices;
3. Establishment of a schoolwide schedule that allocates and protects suf-ficient time for reading instruction;
4. Emphasis for all staff on high-quality implementation of evidence-based instructional programs;
5. Provision of differentiated, multi-tiered instruction designed to meet the needs of all students;
6. Use of data-based decision making at the student and school level to evaluate the quality of implementation; and
7. Provision of high quality professional development to support schools’ focus on continuous improvement.
This approach was used in implementing Project CIRCUITS: Center for Im-proving Reading Competence Using Intensive Treatments Schoolwide, a longitudinal study funded by the Office of Special Education Programs (Chard & Harn, 2008). We partnered with two school Districts (see description below) that had already fully im-plemented PBIS for more than three years to implement the SWRM. With the behav-ioral systems established, the focus of this project’s efforts was to (a) describe features of instruction in classrooms implementing evidenced-based programs, and (b) de-velop and evaluate procedures and practices to implement a systemic, preventive ap-proach to reading instruction that would address the reading development of all k-3 students. A cohort of students (N=84) was identified as at-risk for reading difficulties in first grade and their progress was followed until the end of third grade to evalu-ate how students responded to the implemented interventions (described later) and examine the effectiveness of the SWRM in decreasing the number of students needing intensive academic supports. Here we provide a synopsis of these efforts including re-search findings, lessons learned, and a reflection on the missed opportunity of overtly integrating the established PBIS efforts with initial implementation of an academic MTSS. Additional detail and results are discussed in other papers (Chard & Harn, 2008; Chard, Stoolmiller, et al., 2008; Harn, Chard, Biancarosa, & Kameenui, 2011).
Context of this SynopsisBoth districts participating in the project were in the Pacific Northwest and
considered fast-growing suburban districts. District A was a smaller school district and is in a suburb of a medium-sized city. The students in the two elementary schools participating in District A were predominantly Caucasian (57%) or Hispanic (43%), and English language learners (ELL) (28%) Participating schools served students grades K–5 and averaged about 440 students per school. District B was in a suburb of a larger city, served grades K–5, and averaged about 475 students per school. The stu-dents in the three elementary schools participating in District B were predominantly Caucasian (73%), Hispanic (17%), African American (5%), Native Hawaiian (5%), and 12% were ELL. As part of district procedures, all students were screened using the
Learning Disabilities: A Contemporary Journal 13(1), 3-20, 2015
8
Dynamic Indicators of Basic Early Literacy Skills (DIBELS; Good & Kaminski, 2003; see descriptions below), and any students identified as at-risk based on the measures’ established criteria were invited to participate in the study. With these procedures, 84 (District A=24; District B=60), or 20% of the school’s total population, was identified for the intervention cohort (interventions are discussed in the next section), fol-lowed until they completed grade 3, and are the focus of this paper.
Measures
DIBELS. Both districts gathered screening data on students as part of their typical practice using the DIBELS. These measures are standardized, individually ad-ministered, 1-minute measures designed to efficiently measure critical early literacy skills, including phonological awareness (PSF), letter knowledge (LNF), alphabetic principle (NWF), and fluency with connected text (ORF; Good & Kaminski, 2003). Specific information about the reliability and validity of each measure is provided as reported from the technical manual (Good & Kaminski, 2003).
The Phoneme Segmentation Fluency (PSF) measure is designed to assess a student’s ability to segment words into their individual sounds. The examiner orally presents one word at a time, and the student segments the word into its individual sounds. The total score is the number of correct segments produced in one minute. The Letter Naming Fluency (LNF) measure is designed to assess a student’s ability to readily name letters. The student is presented with a sheet of mixed upper- and lowercase letters, and the score is the number of correct letter names produced in one minute. The Nonsense Word Fluency (NWF) measure is designed to assess a student’s ability to produce correct letter-sound correspondences or phonologically recode nonwords. The measure is comprised of consonant-vowel-consonant (CVC) and vowel-consonant (VC) nonwords words (e.g., rav, ep) arranged in rows. The total score is the number of correct letter-sound correspondences produced in one min-ute. The Oral Reading Fluency (ORF) measure is designed to assess a student’s ability to accurately and fluently read connected text. The student is presented with a grade-level passage and asked to read the passage aloud; the final score is the number of correctly-read words in 1 minute.
Woodcock Reading Mastery Test–Revised. The Woodcock Reading Mas-tery Test–Revised (WRMT-R) (Woodcock, 1987) is a standardized, un-timed, in-dividually administered test. The Word Identification, Word Attack, and Passage Comprehension subtests were administered to all students in the fall and spring of each year. Test-retest reliabilities and validity coefficients are within acceptable ranges across subtests for grade one students (Woodcock, 1987). The Word Identification (WID) subtest requires the student to read words from a list that increases with dif-ficulty. The Word Attack (WAT) subtest has students read a list of nonwords to assess phonetic analysis skills. The Passage Comprehension (PComp) subtest provides the student with a sentence or brief passage with one word missing and requires the stu-dent to provide the best word for the passage.
Learning Disabilities: A Contemporary Journal 13(1), 3-20, 2015
9
General FIndInGs
Year 1: Documenting Nature of Instructional SupportsThe Districts had many features in common (commitment to prevention,
use of evidenced-based reading programs, etc.), so our focus in year one of the Proj-ect (none-intervention year) documented the nature of the established reading ap-proach (i.e., what they were independently doing prior to the Project intervention). Both Districts had adopted the same core reading program, Open Court Reading (Adams et al., 2000), for Tier 1 and each had a Tier 2 system of support that varied between schools. In year one, we observed the at-risk students in both Tiers 1 and 2 using a standardized coding system. While the districts mandated 90 minutes of daily reading instruction, schools averaged just over 70 minutes with up to 30% of this time directed toward content other than reading (more information on the spe-cific content is detailed in Chard & Harn, 2008). General education teachers reported creating and delivering their own materials and there was very little differentiation provided to any of the students. All students identified as at risk did receive supple-mental instruction; however, it was not differentiated by need and there was no Tier 3 support during this initial year.
The degree of variation in reading instruction within a given school as well as across tiers of instructional support was surprising. Some students received as many as five different programs on a regular basis (e.g., some programs used five times a week, some two times, others one). Additionally, observers noted that the programs used within and across instructional support settings (Tiers 1 and 2) varied significantly their instructional approach (explicit/systematic as well as whole word). Additionally, students identified as at-risk did not receive the full “core” reading pro-gram in addition to their reading intervention. These findings led us to work with the Districts to examine the effect of creating greater consistency in literacy instruction as well as coordinating instructional support across tiers of the MTSS.
Year 2: First Grade-Coordinating Instructional Supports to Accelerate LearningRather than drastically altering Tier 1 instruction, we collaborated with dis-
trict leadership to determine ways to enhance the MTSS by coordinating instruction across tiers and ensuring at-risk students received systematic reading instruction. To improve Tier 1 support, principals recommitted to ensuring that 90 minutes of in-struction would be allocated and delivered daily, and that teachers would use the core reading program. Both districts provided additional training to teachers on using the core program.
Tier 2 intervention. Students needing Tier 2 supports (N=50) received 30 minutes of intervention in addition to the 90 minutes of language arts instruction provided in Tier 1 in groups of 4–5 students by trained, school-based personnel. Project personnel developed the “Booster” program to closely align with Tier 1 in-struction by focusing on re-teaching the same content from the core program but provided students additional practice in sight word reading, word analysis, connected text reading, and comprehension skills in a more systematic manner. The interven-tion was intensified by increasing instructional time, prioritizing essential content, decreasing group size, and using explicit and systematic delivery practices (Archer &
Learning Disabilities: A Contemporary Journal 13(1), 3-20, 2015
10
Hughes, 2011; Denton & Vaughn, 2010; Harn et al., 2008). The following instruction-al delivery aspects were emphasized: (a) explicit and consistent teacher wording, (b) a focus on critical skills from the core reading program, (c) immediate feedback on student performance, (d) systematic review of target skills, and (e) activities that ac-tively engaged the student in reading (i.e., many opportunities to respond as a group and individually with feedback). These features were embedded within each lesson of the intervention using content from the core program.
Tier 3 intervention. Students identified as needing Tier 3 supports (i.e., stu-dent with deficient skills on both PSF and NWF; N=34) received 60 minutes of inter-vention, in addition to most of the typical language arts instruction provided in Tier 1, in groups of 3–4 students by trained, school-based personnel. The scheduling chal-lenges for delivering the 60-minute intervention caused variation in the total reading time students received, but, in general, students received 50 minutes of instruction in Tier 1 and the additional 60 minutes of Tier 3 intervention for a total of at least 110 minutes of daily reading instruction. The Proactive Beginning Reading program (PBR Mathes, Torgesen, Menchetti, Wahl, & Grek, 1999) was selected because the authors had designed the program to align with the schools’ core program. This in-tervention targeted the early literacy skills of phonological awareness, letter-sound correspondence, word analysis, fluency, and comprehension strategies. PBR typically takes 45 minutes to deliver, but we allocated 60 minutes so that additional opportuni-ties to practice and review were provided daily.
Results from aligning interventions across tiers in terms of features of ef-fective intervention (i.e., time, content, instructional delivery, and group size) and coordination and collaboration of personnel for at-risk students was statistically and practically significant across a range of literacy measures. After aligning supports across tiers, at-risk students performed significantly better than similar students in the prior year (i.e., historical control) on measures of word reading, fluency and pas-sage comprehension, with effect sizes in the small to medium range. In addition, on PSF and PCOMP the lowest-performing students that received the aligned interven-tions benefitted significantly more than similar students in the prior year. These in-teraction effects imply that coordinated instruction differentially benefitted the most at-risk students (e.g., students receiving Tier 3; see Harn, Chard, Biancarosa, & Ka-meenui, 2011 for more detail).
Year 3: Second Grade-Aligning and Intensifying SupportsTier 2 Intervention. Students who continued in the longitudinal study iden-
tified as needing Tier 2 supports on the DIBELS (i.e., strategic), received 90 minutes of Tier 1 literacy instruction, plus a 45 minute intervention in groups of 5-8. In ex-amining their reading skills, students were identified as having weaknesses in both word reading and fluency in connected text skills. These skills were addressed using an alternating schedule of Read Naturally and Phonics for Reading during a 45-min-ute intervention period. As part of the research project, schools implemented this instructional support plan for 14 weeks to determine the efficacy of this combina-tion of programs. Average words per week growth was 2.75 for District A and 1.76 for District B, which is higher than the typical rate of 1.4 words per week reported by Fuchs, Fuchs, Hamlet, Walz, and German (1993). After the 14 week research pe-
Learning Disabilities: A Contemporary Journal 13(1), 3-20, 2015
11
riod, schools evaluated each student’s progress to determine the level of instructional support necessary. Some students demonstrated they no longer needed instructional support beyond Tier 1, some displayed continued need for Tier 2 support, and a few demonstrated a need for increased instructional support.
Tier 3 Intervention. Students identified as needing Tier 3 supports on the DIBELS (i.e., intensive) or displayed limited growth in response to additional in-structional supports in tier two, instructional support was further intensified. For many of these students, the gap between the instructional objectives of the Tier 1 reading program in some areas (e.g., advanced phonic elements) and student skill level was so large that the school-level reading team and parents determined that other instructional material would be more appropriate. Careful decisions were made on what skills (e.g., vocabulary, listening comprehension) to teach during the time students were in the general education classroom so that this time would be beneficial to all students. Critical skills that needed to be taught with urgency (i.e., alphabetic principle, word reading, reading connected text) were thought to be best addressed by acceleration programs specifically designed using explicit instructional approach-es (i.e., Reading Mastery). To accelerate learning, students were provided with more than 90 minutes of reading instruction each day, with the majority of it provided in small groups by Title 1 and/or Special Education personnel.
Initially, only Reading Mastery was used in small groups (i.e., four or less) across two-45 minute sessions each day. Instructors were trained to accelerate pace through the program to fill students’ skill gaps as quickly as possible. Student prog-ress and fidelity of implementation were monitored regularly, but student growth was disappointingly low. In considering the instructional objectives taught within the program, limited student progress, and general instructional needs of the students, we decided to increase the amount of time spent in fluency building, so we supple-mented with the Read Naturally program. The 90 minutes of small group instruction was divided so that students received 60 minutes of instruction within Reading Mas-tery and 30 minutes of Read Naturally each day. This change in instructional focus had a dramatic effect on student performance. Prior to this alteration, the 17 students had an average ORF slope of 1.59 words a week (range 0-2.3); however, with the instructional modification students averaged 2.4 words a week (range 1.2-4.7). Six students improved so much the team moved them out of Tier 3 supports by the end of the year. While five other students (all of which were receiving special education services as learning disabled, autistic, or speech and language) continued to display significantly low reading skills (i.e., reading below 40 on Oral Reading Fluency).
Year 4: Third Grade-Characteristics of Students Needing Individualized SupportsFor the 11 students in third grade continuing to need tier 3 intervention sup-
ports, they were provided individualized (i.e., 1-on-1) reading intervention using the Reading Mastery and Read Naturally programs similar to how it was delivered during their second grade year. Students received two, 45-minute doses of reading instruc-tion daily that was tailored to their specific instructional needs based on procedures of the Reading Mastery program. Interventionists were monitored at least monthly to document fidelity of implementation and student progress was monitored twice a month. In general, students made progress; however, it was not sufficient to warrant decreasing intervention intensity across the year.
Learning Disabilities: A Contemporary Journal 13(1), 3-20, 2015
12
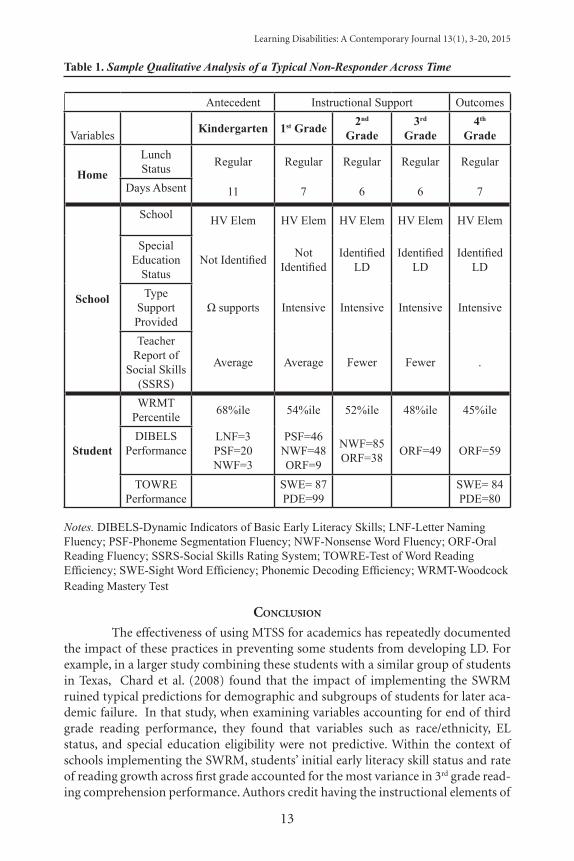
We did a retrospective analysis on the background of these “nonresponders” to determine similarities or differences across this small, but important group of stu-dents. Using a qualitative, multiple method, case study approach (Miles & Huber-man, 1994) we categorized the data as: (a) school, (b) family, (c) intervention, or (d) student-level. School-level data consisted of teacher demographics and name of reading curriculum. Family data consisted of home language and free/reduced lunch status. Intervention data included program type, observational information, and intensity of support. Student-level data consisted of reading performance on a number of measures, language status, attendance, and ethnicity. We then organized this information across the duration of the project into (a) antecedents, (b) instruc-tional supports, and (c) outcomes. Antecedents were variables that happened prior to providing instructional supports in first grade (i.e., initial student skills, student/family demographics). Instructional supports were related to the nature of interven-tion provided (i.e., strategic, intensive). Outcomes were the student’s achievement scores at the end of the Project (Jamgochian, Harn, & Parisi, 2008). A sample of the data examined across all students is presented in the case display of one of these stu-dents in Table 1.
Similarities Across Students. Through this examination we found two early characteristics in first grade (antecedents) that were similar across these students: (a) weaknesses on fluency-based measures and (b) teacher report of low academic competence. We do not have data for two students at the end of first grade, so these findings were based on the nine students with complete data. In the fall of first grade, eight of nine non-responders had a score below 25 on the Letter Naming Fluency (Good & Kaminski, 2003). Similarly, six of nine students had a standard score be-low 90 on the Sight Word Efficiency subtest of the Test of Word Reading Efficiency (Torgesen, Wagner, & Rashotte, 1999). Additionally, teachers completed a Social Skills Rating System (Gresham & Elliott, 1990) for each year of the project. At the end of first grade, seven of nine non-responders were rated low on the Academic Compe-tence subscale. This subscale measures a teacher’s perception of a student’s overall classroom behavior, academic performance, intellectual ability, and parental support in comparison to classmates.
Differences Across Students. Through this analysis, we discovered a num-ber of variables that were not similar across this small, yet important group of stu-dents. Variables related to the family (i.e., home language, free and reduced lunch) varied across the group, and only one student was ELL. Additionally, attendance wasn’t a predictor as none of the students missed more than 10% in any given school year. Finally, untimed measures of reading performance (i.e., WRMT-R) were not ef-fective predictors as most scores were within the average range.
For the students who did not respond to these intensive efforts, the typical issues of attendance, free and reduced lunch, and English language learner status were not variables this group had in common. In the current study, low performance on flu-ency-based measures as well as a teacher report of low academic competence were com-mon across most students. Within this responsive, coordinated, and systematic reading context, the vast majority of at-risk readers no longer needed intensive support by third grade. In fact, only 7% of students across these districts still needed such support.
Learning Disabilities: A Contemporary Journal 13(1), 3-20, 2015
13
Table 1. Sample Qualitative Analysis of a Typical Non-Responder Across Time
Antecedent Instructional Support Outcomes
Variables Kindergarten 1st Grade 2nd Grade
3rd Grade
4th Grade
Home
Lunch Status Regular Regular Regular Regular Regular
Days Absent 11 7 6 6 7
School
School HV Elem HV Elem HV Elem HV Elem HV Elem
Special Education
StatusNot Identified Not
IdentifiedIdentified
LDIdentified
LDIdentified
LD
Type Support Provided
Ω supports Intensive Intensive Intensive Intensive
Teacher Report of
Social Skills (SSRS)
Average Average Fewer Fewer .
Student
WRMT Percentile 68%ile 54%ile 52%ile 48%ile 45%ile
DIBELS Performance
LNF=3PSF=20NWF=3
PSF=46NWF=48ORF=9
NWF=85ORF=38 ORF=49 ORF=59
TOWRE Performance
SWE= 87PDE=99
SWE= 84PDE=80
Notes. DIBELS-Dynamic Indicators of Basic Early Literacy Skills; LNF-Letter Naming Fluency; PSF-Phoneme Segmentation Fluency; NWF-Nonsense Word Fluency; ORF-Oral Reading Fluency; SSRS-Social Skills Rating System; TOWRE-Test of Word Reading Efficiency; SWE-Sight Word Efficiency; Phonemic Decoding Efficiency; WRMT-Woodcock Reading Mastery Test
conclusIon
The effectiveness of using MTSS for academics has repeatedly documented the impact of these practices in preventing some students from developing LD. For example, in a larger study combining these students with a similar group of students in Texas, Chard et al. (2008) found that the impact of implementing the SWRM ruined typical predictions for demographic and subgroups of students for later aca-demic failure. In that study, when examining variables accounting for end of third grade reading performance, they found that variables such as race/ethnicity, EL status, and special education eligibility were not predictive. Within the context of schools implementing the SWRM, students’ initial early literacy skill status and rate of reading growth across first grade accounted for the most variance in 3rd grade read-ing comprehension performance. Authors credit having the instructional elements of
Learning Disabilities: A Contemporary Journal 13(1), 3-20, 2015
14
the SWRM in place that created a more responsive and effective instructional context that mitigated the effects of traditional, non-alterable, predictors on student literacy performance (Chard et al., 2008). Similar positive effects for the SWRM were found for ELLs (Baker et al., 2012) and students receiving special education services (San-ford et al., 2013). According to Denton, Foorman, and Mathes (2003), this success “points to the importance of looking beyond instructional methodology to other factors that influence the effectiveness of reading programs for high-risk students” (p. 258), including the other elements of MTSS (e.g., data-based decision making, professional development, high quality implementation, etc.; Averill & Rinaldi, 2014; Harn et al., 2011) as well as determining which components are essential.
Analyses of multi-faceted interventions like the SWRM are needed to iden-tify the essential core components necessary to improve outcomes and see how these may vary by school site (Harn et al., 2011; Odom, 2009). Further exploration of these variables may allow us to identify the relevant features of the context (e.g., school and children) and the intervention (e.g., SWRM, PBIS) that may produce the most optimal outcomes for students. As discussed by Koveleski and Black (2010), MTSS, or RTI, is so multifacteted that it is difficult to determine what aspects have causal impli-cations on student performance. Unpacking the active ingredients both individually (e.g., explicitness of instruction, time, program, group size, etc.) as well as potential interaction or collective synergistic effects (i.e., the SWRM with PBIS) is a challenge for future research. These ingredients can also play out differentially depending on the specific context/school characteristics (e.g., personnel, student demographics, size, etc.) already in place.
Research to Practice Implications The intervention efforts implemented across the years in this study align
with the recommendations of the recently released report on the features of effec-tive intensive interventions for students with LD (Vaughn, Zumeta, Wanzek, Cook, & Klingner, 2014). We implemented the best of what the research has shown to be effective, along with truly individualizing services as expected in special education (Zigmond & Kloo, 2011). While these efforts did decrease the percent students need-ing to receive special education services to approximately 7% in these schools, with the national average as 13% (National Center for Education Statistics, 2013), we re-flect on things that we could have done differently to further enhance these outcomes, which relate to a) truly integrating the academic and behavioral systems of support and b) broadening the focus of intervention efforts.
We did not capitalize on the Districts’ established PBIS efforts in imple-menting the SWRM. In hindsight this was a mistake because of the similarities in implementing schoolwide MTSS approaches like the SWRM and PBIS (e.g., data-based decision making, coordinating time/efforts across tiers, use of evidenced-based practices; McIntosh, Goodman, & Bohanan, 2010). But potentially the biggest mis-take was not integrating the expertise of the PBIS coaches/behavior specialists in sup-porting the delivery of intervention efforts, especially for students receiving Tier 3 interventions. While we don’t have specific data on how many students across the years of intervention were on behavior support plans (BSP), we do know that of the 11 students needing intensive intervention in third grade, all of them had been on
Learning Disabilities: A Contemporary Journal 13(1), 3-20, 2015
15
a BSP at one point in time and five students were on one during third grade. These BSPs were developed independently using the established school-based approach within PBIS. This was a missed opportunity as the interventionists delivering the reading intervention were not consulted in the development of the BSP and then had to try to implement the BSP while simultaneously delivering the intensive reading intervention, a very challenging task. Potentially, had we worked with the behavior specialists, we could have designed the intervention differently to better meet these students’ academic and behavioral needs. Needless to say, these 11 students had many behavioral and attention issues that may have led to limited reading success or been a consequence of limited progress in reading. Had we capitalized on the behavioral expertise from their initial identification the implemented behavioral or academic interventions may have been more effective. Rodriguez and Anderson (2014) dem-onstrated that implementing an EBP behavior management intervention within the context of delivering an intensive reading intervention did not negatively impact fi-delity of the reading intervention, increased time on task, and decreased displays of problem behavior. As Denton (2012) discussed in her reflection on the effectiveness of early reading interventions in the RTI era, having this persistent small group of students not responding to our efforts means we still haven’t figured out how to meet each student’s needs. Broadening the scope of intervention supports to actively in-clude the expertise of behavior support specialist along the RTI process should be a part of any school implementing MTSS.
Related to broadening our focus on intervention supports to include the support from behavior specialists is broadening the content of our interventions. Chard (2012) emphasized the need for moving beyond interventions solely focusing on the phonological core issues in reading interventions to include content/interven-tions targeting cognitive processing skills such as RAN and executive function. Relat-ed to both of these dimensions is the concept of self-regulation, a multi-dimensional construct that includes a student’s ability to control and direct attention, cognition, emotions and behavior (Eisenberg, Valiente, & Eggum, 2010; McClelland & Camer-on, 2011; Rueda, Posner, & Rothbart, 2005). Self-regulation (SR) has been an ongoing focus in preschool and school-readiness research and is critical in a classroom setting as it supports students’ sustained efforts toward the teacher’s instructional goals, and keeps students engaged across the lesson and school day to support the acquisition of new skills and learning (Saez, Folson, Al Otaiba, & Schatschneider, 2012; Smith et al., 2008). Rothbart and Bates (2006) define SR as “the efficiency of executive atten-tion—including the ability to inhibit a dominant response and/or to activate a sub-dominant response, to plan, and to detect errors” (p. 129). These skills are particu-larly important for struggling students. Potentially providing additional training to general education teachers and interventionists in behavioral practices that promote the development of SR would improve the behavioral and academic outcomes of our students. Interventions like the Incredible Years (Webster-Stratton & Reid, 2004) are very much aligned with PBIS and have been found effective in promoting procsocial development and academic outcomes in the most at-risk populations. The effective-ness of integrated explicit and systematic instruction with quality classroom manage-ment practices was also demonstrated in Connor’s Individualizing Student Instruction research (Connor et al., 2009; Connor et al., 2010). In her research, she documented
Learning Disabilities: A Contemporary Journal 13(1), 3-20, 2015
16
that students with difficulties in SR who received quality reading intervention from teachers with good classroom management practices made greater academic gains than similar students with SR issues in classrooms with poorer classroom manage-ment skills. Ensuring that our intervention delivery includes behavioral practices to support issues with SR and executive function, areas in which many struggling learn-ers have difficulties, could improve overall student development.
As a field we have learned much from our efforts in RTI, PBIS, and now MTSS. We need to capitalize on this momentum and create truly integrated systems to promote the development of students. Rather than having teams think separately about academic and behavioral needs, we need our schools, teachers, and specialists to consider the overall needs of the students, which will require better collaboration across our specialists (academic interventionists/instructional coaches and behavior specialists). Having these specialists working as part of the overall intervention plan-ning and evaluation process (data-teams/student study teams) may enable us to bet-ter meet the full academic and social emotional needs of each student.
reFerences
Adams, M. J. (1990). Beginning to read: Thinking and learning about print. Cambridge, MA: Massachusetts Institute of Technology.
Adams, M. J., Bereiter, C., Brown, A., Campione, J., Carruthers, I., Case, R., Treadway Jr., G. H. (2000). Open Court Reading. Columbus, OH: SRA.
Archer, A. L. & Hughes, C. A. (2011). Explicit instruction: Effective and efficient teaching. New York, NY: Guilford.
Averill, O.H. & Rinaldi, C. (2014). Research Brief: Multi-tier system of supports (MTSS). New-ton, MA: Urban Special Education Leadership Collaborative.
Baker, D. L., Park, Y., Baker, S. K., Basaraba, D. L., Kame’enui, E. J., & Thomas Beck, C. (2012). Effects of a paired bilingual reading program and an English-only program on the reading performance of English learners in Grades 1-3. Journal of School Psychology, 50, 737-578.
Baker, S. K., Smolkowski, K., Smith, J. M., Fien, H., Kame’enui, E. J., & Thomas Beck, C. (2011). The impact of Oregon Reading First on student reading outcomes. The Elementary School Journal, 112, 307-331.
Blair, C. & Diamond, A. (2008). Biological processes in prevention and intervention: The pro-motion of self-regulation as a means of preventing school failure. Development and Psychopathology, 20, 899-911.
Bradley, R., Danielson, L., & Doolittle, J. (2005). Response to intervention. Journal of Learning Disabilities, 38, 8-13.
Bradshaw, C. P., Mitchell, M. M., & Leaf, P. J. (2010). Examining the effects of schoolwide positive behavioral interventions and supports on student outcomes: Results from a randomized controlled effectiveness trial in elementary schools. Journal of Positive Behavior Interventions, 12, 133-148.
Chard, D. (2012). A Glass Half Full: A Commentary on the Special Issue. Journal of Learning Disabilities, 45, 270-273.
Chard, D. & Harn, B. (2008). Project CIRCUITS: Center for Improving Reading Competence Using Intensive Treatments Schoolwide. In C. Greenwood, T. Kratochwill, & M. Cle-ments (Eds.), Schoolwide Prevention Models: Lessons Learned in Elementary Schools (pp. 70-83). New York, NY: Guilford.
Learning Disabilities: A Contemporary Journal 13(1), 3-20, 2015
17
Chard, D. J., Harn, B. A., Horner, R., & Sugai, G. (2008). Core features of multi-tier systems of reading and behavioral support. In C. Greenwood, T. Kratochwill, & M. Clements (Eds.), Schoolwide Prevention Models: Lessons Learned in Elementary Schools (pp. 18-26). New York, NY: Guilford.
Chard, D. J., Stoolmiller, M., Harn, B. A., Wanzek, J., Vaughn, S., Linan-Thompson, S., & Kame`enui, E. K. (2008). Predicting reading success in a multilevel schoolwide read-ing model: A retrospective analysis. Journal of Learning Disabilities, 41, 174-188.
Connor, C. M., Piasta, S. B., Fishman, B., Glasney, S., Schatschneider, C., Crowe, E. et al. (2009). Individualizing student instruction precisely: Effects of child x instruction interac-tions on first graders’ literacy development. Child Development, 80, 77-100.
Connor, C. M., Ponitz, C. C., Phillips, B. M., Travis, Q., Glasney, S., & Morrison, F. J. (2010). First graders’ literacy and self-regulation gains: The effect of individualizing student instruction. Journal of School Psychology, 48, 433-456.
Coyne, M. D., Kame’enui, E. J., Simmons, D. C., & Harn, B. A. (2004). Beginning reading in-tervention as inoculation or insulin: First-grade reading performance of strong re-sponders to kindergarten intervention. Journal of Learning Disabilities, 37, 90-104.
Dally, K. (2006). The influence of phonological processing and inattentive behavior on reading acquisition. Journal of Educational Psychology, 98, 420-437.
Denton, C. A. (2012). Response to intervention for reading difficulties in the primary grades: Some answers and lingering questions. Journal of Learning Disabilities, 45, 232-243.
Denton, C. A., Foorman, B. R., & Mathes, P. G. (2003). Perspective: Schools that “beat the odds”: Implications for reading instruction. Remedial and Special Education, 24, 258-261.
Denton, C. A. & Vaugh, S. (2010). Preventing and remediating reading difficulties. In M. R. Shinn, H. M. Walker, & G. Stoner (Eds.) Interventions for achievement and behavior problems: Preventive and remedial approaches (pp. 469-500). Bethesda, MD: National Association of School Psychologists.
Eisenberg, N., Valiente, C., & Eggum, N. D. (2010). Self-regulation and school readiness. Early Education and Development, 21, 681-698.
Fien, H., Kame’enui, E. J., & Good, R. (2009). Schools engaged in school-wide reading reform: An examination of the school and individual student predictors of kindergarten early reading outcomes. School Effectiveness and School Improvement, 20, 1-25.
Fleming, C. B., Harachi, T. W., Cortes, R. C., Abbott, R. D., & Catalano, R. F. (2004). Level and change in reading scores and attention problems during elementary school as pre-dictors of problem behavior in middle school. Journal of Emotional and Behavioral Disorders, 12, 29-35.
Fuchs, D., Compton, D. L., Fuchs, L. S., Bryant, V. J., Hamlett, C. L., & Lambert, W. (2012). First-grade cognitive abilities as long-term predictors of reading comprehension and disability status. Journal of Learning Disabilities, 45, 217-231.
Fuchs, L.S., Fuchs, D., Hamlett, C.L., Walz, L. & German, G. (1993). Formative evaluation of academic progress: How much growth can we expect? School Psychology Review, 22, 27-48.
Good, R. H. & Kaminski, R. A. (Eds.) (2003). DIBELSTM: Dynamic indicators of basic early lit-eracy skills (6th ed.) Longmont, CO: Sopris West.
Good, R. H. & Kaminski, R. A. (Eds.) (2006). Dynamic indicators of basic early literacy skills (6th ed. rev.). Eugene, OR: Institute for the Development of Educational Achievement. Retrieved from http://dibels.uoregon.edu.
Gresham, F. M. & Elliott, S. N. (1990). Social skills rating scale. Circle Pines, MN: American Guidance Services.
Harn, B. A., Chard, D. J., Biancarosa, G., & Kame’enui, E. J. (2011). Coordinating instructional supports to accelerate at-risk first-grade readers’ performance. Elementary School Journal, 112, 332-355.
Learning Disabilities: A Contemporary Journal 13(1), 3-20, 2015
18
Horner, R. H., Sugai, G., & Anderson, C. M. (2010). Examining the evidence base for school-wide positive behavior support. Focus on Exceptional Children, 42, 1-14.
Jamgochian, E., Harn, B. A., & Parisi, D. (2008). Characteristics of students who don’t respond to research-based interventions. CEC Today retrieved from http://www.cec.sped.org/AM/Template.cfm?Section=CEC_Today1&TEMPLATE=/CM/ContentDisplay.cfm&CONTENTID=10645.
Kame’enui, E. J., Good, R. H., & Harn, B. A. (2005). Beginning reading failure and the quan-tification of risk. In H. L. Heward, T. E. Heron, N. A. Neef, S. M. Peterson, D. M., Sainato, G. Cargledge, et al. (Eds.), Focus on behavior analysis in education: Achieve-ments, challenges, and opportunities (pp. 69-89). Upper Saddle River, NJ: Pearson Education, Inc.
Kovaleski, J. F. & Black, L. (2010). Multi-tier service delivery. In T. A. Glover & S. Vaughn (Eds.), The promise of response to intervention: Evaluating current science and practice (pp. 23-56). New York, NY: Guilford.
Lipka, O., Lesaux, N. K., & Siegel, L. S. (2006). Retrospective analyses of the reading develop-ment of grade 4 students with reading disabilities: Risk status and profiles over 5 years. Journal of Learning Disabilities, 39, 364-378.
Mathes, P. G., Torgesen, J. K., Menchetti, J. C., Wahl, M., & Grek, M. K. (1999). Proactive begin-ning reading. Available from P. G. Mathes, Institute for Reading Research, Southern Methodist University, Post Office Box 750381, Dallas, TX 75275.
McClelland, M. M. & Cameron, C. E. (2011). Self-regulation and academic achievement in elementary school children. New Directions for Child and Adolescent Development, 133, 29-44.
McIntosh, K., Goodman, S., & Bohanan, H. (2010). Toward true integration of academic and behavior response to intervention systems, part one: Tier 1 support. Communiqué, 39, 1- 15.
McIntosh, K., Horner, R.H., Chard, D.J., Boland, J.B., & Good, R.H. (2006). The use of reading and behavior screening measures to predict non-response to school-wide positive behavior support: A longitudinal analysis. School Psychology Review, 35, 275-291.
McKinney, J. D. (1989). Longitudinal research on the behavioral characteristics of children with learning disabilities. Journal of Learning Disabilities, 22, 141-150.
McMaster, K. L., Fuchs, D., Fuchs, L. S., & Compton, D. L. (2005). Responding to nonre-sponders: An experimental field trial of identification and intervention methods. Exceptional Children, 71, 445-463.
Miles, M. B. & Huberman, A. M. (1994). Qualitative data analysis: An expanded sourcebook. New York, NY: Sage.
Morrison, G. M., Anthony, S., Storino, M., & Dillon, C. (2001). An examination of the disci-plinary histories and the individual and educational characteristics of students who participate in a school suspension program. Education and Treatment of Children, 24, 276-293.
National Center for Education Statistics (2013). Fast Facts: Students with disabilities. Retreived from http://nces.ed.gov/fastfacts/display.asp?id=64.
Nelson, J. R., Benner, G. J., & Gonzalez, J. (2003). Learner characteristics that influence the treatment effectiveness of early literacy interventions: A meta-analytic review. Learn-ing Disabilities Research & Practice, 18, 255-267.
Odom, S. L. (2009). The tie that binds evidence-based practice, implementation science, and outcomes for children. Topics in Special Education, 29, 53-61.
Posner, M. I. & Peterson, S. E. (1990). The attention system of the human brain. Annual Review of Neuroscience, 13, 25-42.
Learning Disabilities: A Contemporary Journal 13(1), 3-20, 2015
19
Rodriguez, B. & Anderson, C. M. (2014). Integrating a social behavior intervention during small group academic instruction using a total group criterion intervention. Journal of Positive Behavior Interventions, 16, 234-245.
Rothbart, M. K. & Bates, J. E. (2006). Temperament. In W. Damon & R. Lerner (Series Eds.) & N. Eisenberg (Vol. Ed.) Handbook of Child Psychology (Vol. 3) Social, emotional, and personality development (6th ed.) (pp. 99-166). New York, NY: Wiley.
Rueda, M. R., Posner, M. I., & Rothbart, M. K. (2005). The development of executive attention: Contributions to the emergence of self-regulation. Developmental Neuropsychology, 28, 573-594.
Saéz, L., Folsom, J. S., Al Otaiba, S., & Schatschneider, C. (2012). Relations among student attention behaviors, teacher practices, and beginning word reading skill. Journal of Learning Disabilities, 45, 418-432.
Sanford, A. K., Park, Y., & Baker, S. K. (2013). Reading growth of students with disabilities in the context of a large-scale statewide reading reform effort. The Journal of Special Education, 47, 83-95.
Savage, R. S. & Frederikson, N. (2006). Beyond phonology: What else is needed to describe the problems of below-average readers and spellers? Journal of Learning Disabilities, 39, 399-413.
Shinn, M. R. (2008). Best practices in curriculum-based measurement and its use in a prob-lem-solving model. In A. Thomas & J. Grimes (Eds.), Best practices in school psychol-ogy V (pp. 243-262). Bethesda, MD: National Association of School Psychologists.
Simonsen, B. & Sugai, G. (2013). PBIA in alternative education settings: Positive support for youth with high-risk behavior. Education and Treatment of Children, 36, 3-14.
Simmons, D. C., Kame’enui, E. J., Harn, B. A., Coyne, M. D., Stoolmiller, M., Edwards Santoro, L. et al. (2007). Attributes of effective and efficient kindergarten reading interven-tion: An examination of instructional time and design specificity. Journal of Learning Disabilities, 40, 331-347.
Simmons, D. S., Coyne, M., Kwok, O., McDonagh, S., Harn, B. A., & Kame`enui, E. J. (2008). Indexing response to intervention: A longitudinal study of reading risk from kinder-garten through third grade. Journal of Learning Disabilities, 41, 158-173.
Smith, L. E., Borkowski, J. G., & Whitman, T. L. (2008). From reading readiness to reading competence: The role of self-regulation in at-risk children. Scientific Studies of Read-ing, 12, 131-152.
Stanovich, K. E. (1986). Matthew effects in reading: Some consequences of individual differ-ences in the acquisition of literacy. Reading Research Quarterly, 21, 360-407.
Sugai, G. & Horner, R. R. (2006). A promising approach for expanding and sustaining school-wide positive behavior support. School Psychology Review, 35, 245-259.
Torgesen, J. K. (2000). Individual differences in response to early interventions in reading: The lingering problem of treatment resisters. Learning Disabilities Research and Practice, 15, 55-64.
Torgesen, J. K. & Davis, C. (1996). Individual difference variables that predict response to train-ing in phonological awareness. Journal of Experimental Child Psychology, 63, 1-21.
Torgesen, J. K., Wagner, R. K., & Rashotte, C. A. (1999). Test of word reading efficiency (TOW-RE). Austin, TX: Pro-Ed.
Torgesen, J. K., Wagner, R. K., Rashotte, C. A., Rose, E. Lindamood, P., Conway, T., & Garvin, C. (1999). Preventing reading failure in young children with phonological processing disabilities: Group and individual responses to instruction. Journal of Educational Psychology, 91, 579-593.
Learning Disabilities: A Contemporary Journal 13(1), 3-20, 2015
20
Vaughn, S., Zumeta, R., Wanzek, J., Cook, B., & Klingner, J. (2014). Intensive interventions for students with learning disabilities in the RtI era: Position statement of the division for learning disabilities, Council for Exceptional Children. Learning Disabilities Re-search & Practice, 29, 90-92.
Vellutino, F. R., Fletcher, J. M., Snowling, M. J., & Scanlon, D. M. (2004). Specific reading dis-ability (dyslexia): What have we learned in the past four decades? Journal of Child Psychology and Psychiatry, 45, 2-44.
Vellutino, F. R., Scanlon, D. M., Sipay, E. R., Small, S. G., Pratt, A., Chen, R. S., & Denckla, M. B. (1996). Cognitive profiles of difficult to remediate and readily remediated poor readers: Early intervention as a vehicle for distinguishing between cognitive and ex-periential deficits as basic causes of specific reading disability. Journal of Educational Psychology, 88, 601-638.
Webster-Stratton, C. & Reid, M. J. (2004). Strengthening social and emotional competence in young children – the foundation for early school readiness and success: Incredible years classroom social skills and problem solving curriculum. Infants & Young Chil-dren, 17, 96-113.
Woodcock, R. (1987). Woodcock Reading Mastery Test – Revised. Circle Pines, MN: American Guidance Services.
Zigmond, N. & Kloo, A. (2011). General and special education are (and should be) different. In J. M. Kauffman & D. P. Hallahan (Eds.), Handbook of special education (pp. 160-172). New York, NY: Routledge.
authors’ note
Preparation of this manuscript was supported in part by Project CIRCUITS, grant no. H324X010014, OSEP, U.S. Department of Education. This material does not necessarily represent the policy of the U.S. Department of Education, nor is the material necessarily endorsed by the Federal Government.
The authors would like to acknowledge and recognize the amazing district leaders, teachers, educational assistants, and students in the Bethel and Tigard-Tual-atin School Districts of Oregon where this research was done.
Learning Disabilities: A Contemporary Journal 13(1), 21-41, 2015 Copyright @ by LDW 2015
*Please send correspondence to: Amy B. Weisenburgh-Snyder, Ph.D., PEER International, 4705 S. Dakota Street, Seattle WA 98118, Email: [email protected].
A Model of MTSS: Integrating Precision Teaching of Mathematics and a Multi-Level
Assessment System in a Generative ClassroomAmy B. Weisenburgh-Snyder
PEER International (USA and South Africa)
Susan K. MalmquistIndependent Consultant, Seattle, WA (USA)
Joanne K. RobbinsMorningside Academy, Seattle, WA (USA)
Alison M. LipshinAcademy for Precision Learning, Seattle, WA (USA)
In the generative classroom, teachers provide well-designed learning en-vironments that result in the combination, recombination, and reorga-nization of repertoires such that new untaught repertoires are likely to occur. One component that can contribute to such generativity is Preci-sion Teaching (PT), a frequency building instructional intervention. A multi-level assessment system, combined with evidence-based practices of teaching and learning can result in systematically accelerated student progress in mathematics thus enhancing RtI frameworks. Additionally, PT contributes to nourishing a Multi-tiered System of Support (MTSS) implementation by creating a common language between and amongst students, teachers, families, and administrators. In this unique blended system, the data collected by administrators, teachers, and students are continuously assessed and used to inform instruction and teacher train-ing needs. A graphic presentation of these data on the Standard Celera-tion Chart (SCC) guides goal setting and interventions. This paper pres-ents a case study detailing the rapid progress of a class of students during one academic school year using PT.
Keywords: Response to Intervention, Multi-Tier System of Support, Precision Teaching, Multi-Level Assessment System, Progress Moni-toring, Curriculum-Based Measurement, Frequency-Based Instruc-tion, Education Reform, Responsiveness to Intervention, Response to Intervention, Mathematics, Assessment, Intervention, Inclusion, Generative Instruction, TAPS, Talk Aloud Problem Solving
IntroductIon
Response to Intervention (RtI) was developed on a foundation of research that helped to identify the need for multiple tiers of service delivery in education to meet the learning needs of all students. These tiers, or levels, vary in terms of the intensity of intervention needed, as well as in the manner in which data inform each tier of service delivery (Vaughn & Linan-Thompson, 2003). Batsche (2014) identified
22
Learning Disabilities: A Contemporary Journal 13(1), 21-42, 2015
one key difference that defines the multi-tiered method of service when IDEA was reauthorized in 2004. “The tiers were now defined in terms of intensity (time and focus) of instruction rather than as a place, provider, or instructional strategy. In this new context, theoretically any tier of instruction could occur in any place” (p.183). The term Multi-Tier System of Supports (MTSS) is used to describe the larger frame-work that encompasses an RtI model. Specifically, MTSS refers to a research based framework driven to create successful and sustainable system change and provide the most effective instruction possible to every student, which includes those with learning deficits and those with advanced learning needs (Riccomini & Wetzel, 2009).
Employing MTSS places the RtI model in the center of the educational or-ganization. As our needs, discoveries, and trends in education evolve, the movement to implement evidence-based practices requires us to use instructional interventions that blend the learning sciences with our knowledge of healthy social environments. Any school system, whether it be an independent, charter, or contract school or part of a public school district, can take advantage of the methodologies arising from MTSS. However, there are several variables that significantly impact the effectiveness of MTSS systems, such as the: a) extent to which sensitive instructional placement procedures are employed, b) degree to which high quality teaching methodologies are used, c) depth and breadth of teacher training and support initiatives, and d) adequa-cy of student assessment systems and procedures in producing improved outcomes.
Certainly, one variable that greatly impacts RtI for vulnerable and at-risk learners is the degree to which the initial assessment procedures help to inform pre-cise instructional placement. The use of homogeneous skill groupings is predicated on the assumption that children with marked skill deficits will learn better and make more progress when their teacher is best equipped to meet the specific challenge. When the primary goal of academic instruction is to close an academic gap, then relatively homogeneous skill groupings are highly preferable to very divergent, het-erogeneous skill groupings because of the specific and intensive instruction that is needed to address skill deficits. When schools and teachers select reputable curri-cula that align with large-scale policies in education such as the Common Core State Standards, many students are likely to benefit. However, accelerated academic skill growth, which goes beyond what typically occurs for students with learning chal-lenges, requires a much greater emphasis on diagnostic and prescriptive solutions that enhance a lesson-by-lesson approach to instructional planning.
Such diagnostic and prescriptive assessments often result in identifying component skills that make up the composite performances that occasioned the as-sessment in the first place. Learners who have problems mastering the same compos-ite skill may experience this as a result of missing different components. In the gen-erative classroom as described here, carefully identifying, establishing, and practicing these components may result in success with the composite performance with little or no direct teaching of the composite, hence the term generative instruction. Genera-tive instruction, defined by Johnson and Layng (1992, 1994), is rooted in important discoveries from basic behavior analytic laboratory research (Andronis, 1983; Andro-nis, Goldiamond, & Layng, 1983; Epstein, 1981, 1985, 1991) and applied behavioral research (Alessi, 1987). What results from this generative approach is the rapid acqui-sition of critical component skills that facilitate the combination, recombination, and
23
Learning Disabilities: A Contemporary Journal 13(1), 21-42, 2015
reorganization of repertoires such that new, untaught repertoires are likely to occur. In this sense, not only would advanced algebraic skills be more likely to emerge with-out explicit instruction using a generative approach to learning, so would bursts of creativity and scientific discovery (Epstein, 1991; Goldiamond & Layng, 1983; Pryor, Haag & O’Reilly, 1969; Sidman, 1994).
Many evidence-based practices can be employed in the context of an MTSS system to achieve generative outcomes. These include: a) the content analysis and sequencing of Direct Instruction (Archer & Hughes, 2011; Engelmann & Carnine, 1982) b) explicit instruction (Hunter, 1994; Markle, 1990; Tiemann & Markle, 1991); c) Precision Teaching (Lindsley, 1990); d) dynamic assessment systems (Malmquist, 2004); e) student-driven motivation systems with social and emotional learning, us-ing a constructional approach (Colvin, 2004; Goldiamond, 1974; Latham, 1998); f) strategy teaching, such as Talk Aloud Problem Solving (Robbins, 1996, 2011, 2014) and questioning strategies (Robbins, Layng, & Jackson, 1995); as well as g) compre-hensive professional development opportunities (Johnson & Street, 2004).
A critical and unique instructional feature incorporated in the generative classroom described in this paper is the application of Precision Teaching (Johnson & Street, 2013; Lindsley, 1990, 1991), which can be used to accelerate learning outcomes while informing the instructional process. This highly effective teaching framework relies on frequency-based practice as well as the notion of component/composite analysis (Johnson & Layng, 1992). Component/composite analysis involves break-ing larger, more complex skills down into their distinct component parts which are then targeted for frequency-based practice. The frequency-based practice yields daily data points charted on a Standard Celeration Chart (Calkin, 2005; Kubina & Yurich, 2012; Pennypacker, Koenig, & Lindsley, 1972) that reveal small, yet crucial increments of growth on the component skills that form the larger composite skills (White & Haring, 1980). The data on a Standard Celeration Chart are indicated as the number of correct and incorrect movements, or units, achieved by the student during that timing interval. Students typically complete several one minute timings on a specific component skill and then graph the “best” performance of the day on the “Daily per Minute” Celeration Chart. The teacher analyzes the graphed data across practice sessions and determines if the rate of learning, or celeration, is adequate enough for the student to achieve fluency in an efficient manner. If the student does not seem to be making sufficient progress, additional instruction or frequency-based component skill practice is prescribed. The goal of Precision Teaching is fluency, which Johnson & Layng (1996) defined as “…flowing, effortless, well-practiced, and accurate perfor-
mance” (p. 281).Ultimately, Precision Teachers are primarily interested in helping students
build fluency on individual component skills so the skills become automatic and readily accessible by the student when working on composite skills and their recom-bination. Precision Teaching further provides a means of formative evaluation, which results from monitoring performance of the composite skills while the component skills are still being developed. For instance, a teacher may determine that a student incorrectly answering complex multiplication problems has deficient component skills, including quickly solving basic math facts and adding columns of numbers from right to left. The teacher would then incorporate isolated frequency-based prac-
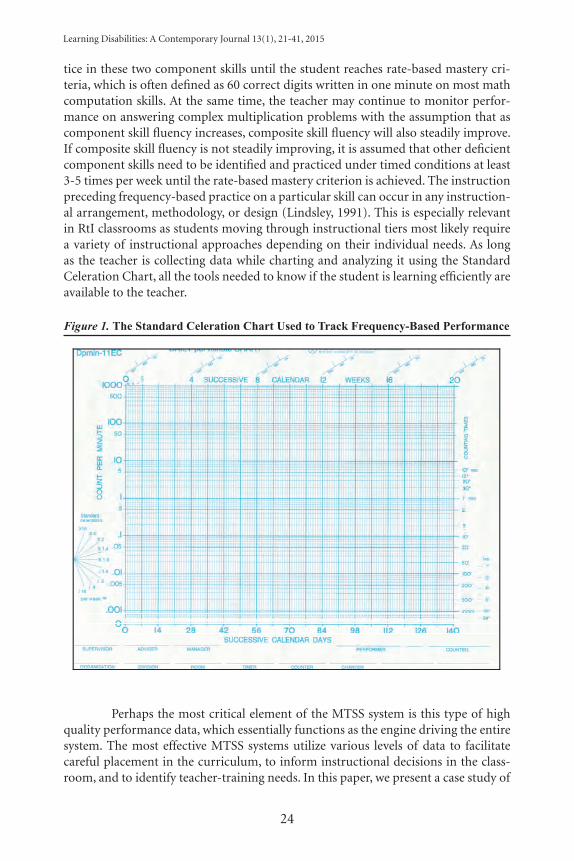
Learning Disabilities: A Contemporary Journal 13(1), 21-41, 2015
24
tice in these two component skills until the student reaches rate-based mastery cri-teria, which is often defined as 60 correct digits written in one minute on most math computation skills. At the same time, the teacher may continue to monitor perfor-mance on answering complex multiplication problems with the assumption that as component skill fluency increases, composite skill fluency will also steadily improve. If composite skill fluency is not steadily improving, it is assumed that other deficient component skills need to be identified and practiced under timed conditions at least 3-5 times per week until the rate-based mastery criterion is achieved. The instruction preceding frequency-based practice on a particular skill can occur in any instruction-al arrangement, methodology, or design (Lindsley, 1991). This is especially relevant in RtI classrooms as students moving through instructional tiers most likely require a variety of instructional approaches depending on their individual needs. As long as the teacher is collecting data while charting and analyzing it using the Standard Celeration Chart, all the tools needed to know if the student is learning efficiently are available to the teacher.
Figure 1. The Standard Celeration Chart Used to Track Frequency-Based Performance
Perhaps the most critical element of the MTSS system is this type of high quality performance data, which essentially functions as the engine driving the entire system. The most effective MTSS systems utilize various levels of data to facilitate careful placement in the curriculum, to inform instructional decisions in the class-room, and to identify teacher-training needs. In this paper, we present a case study of
Learning Disabilities: A Contemporary Journal 13(1), 21-41, 2015
25
a successful MTSS system in which Precision Teaching (Lindsley, 1990) and a Multi-Level Assessment System (Malmquist, 2004; Moors, Weisenburgh-Snyder, & Robbins, 2010) were integrated into a generative classroom. The accelerated academic gains in math achieved by the participants are described below.
A cAse study
SettingThis case study was conducted at a private school in Seattle. The student
population of approximately 70 students had not experienced academic or social success in traditional public or private schools. Most students were identified with various mild to moderate disabilities. All students demonstrated some degree of aca-demic deficit, typically ranging between six months to three years behind same age peers at the elementary school level.
Assessment Sequence & MeasuresA Multi-Level Assessment System (Malmquist, 2004) was used in this case
study to evaluate student learning outcomes. The specific system elements selected were driven by the important evaluation questions we sought to answer for each stu-dent following the principles of Deno’s (1985) Problem-Solving Model. This evalu-ation system included Macro, Meta, and Micro Levels of analysis (Malmquist, 2004; Moors, Weisenburgh-Snyder, & Robbins, 2010).
Macro Level Assessment. The first step in the assessment sequence involved Macro Level assessment to examine the entering math skills of all students. Macro Level Assessment included norm-referenced achievement tests that were administered: (1) at the beginning of the school year to inform the instructional placement process and (2) at the end of the year to deter-mine the general effectiveness of instructional programming while informing future teacher training needs. From the list of measures that were determined to have adequate technical adequacy, specific norm-referenced achievement tests were selected for the Macro Level Assessment using the following criteria:
1) Is there a close match between what is assessed and what is likely to be taught (i.e., testing/teaching overlap)?
2) Is the assessment instrument widely used both regionally and nationally, such that major stakeholders are more likely to share a common framework for interpretation of results?
3) Does the assessment instrument allow for meaningful pre- and post-testing measurement to help determine instructional impact within the same academic school year (i.e., September-June)?
In the current case study, two norm-referenced achievement tests were used to determine general guidelines for placement of students into homogeneous instructional groups. First, math subtest scores from the Woodcock-Johnson Tests of Achievement® III, Basic Battery (Woodcock, McGrew, & Mather, 2001) were analyzed to determine relative skill proficiency and specific instructional needs. Because this assessment instrument includes production-type responses from students rather
Learning Disabilities: A Contemporary Journal 13(1), 21-41, 2015
26
than a multiple-choice format, more detailed item analysis was possible and assisted in instructional placement decisions.
The Iowa Test of Basic Skills (ITBS) (Hoover, Dunbar, & Frisbie, 2001) was administered the following day. The ITBS math related subtests that were admin-istered included: (1) Concepts and Estimation, (2) Problem Solving, and (3) Math Computation, yielding scores for each individual subtest as well as a Math Total Score. In the present example, the students’ chronological grade levels were used to select the appropriate testing level of the ITBS. If a student’s entry-level basic skills were known to be greatly below typical peers, out-of-level testing was considered as an alternative to grade-level measurement to allow for more sensitive measurement. However, this was not an issue with students included in the current case study.
Meta Level Assessment. The next step in the assessment sequence was to use Meta Level data to provide more precise measures of academic skill performance. Meta Level Assessment is characterized by an increased frequency of administration and a higher level of sensitivity to small, incremental skill growth that is unlikely to be detected at the Macro Level. As Waldron, Parker, and McLeskey summarized (2014), “Research has revealed that the most critical factor related to the effectiveness of using CBM for progress monitoring concerns how teachers use these data to make instructional decisions” (p. 163). In this example, Curriculum-Based Measurement (CBM) tools that were closely aligned to the curricular content were administered on a weekly basis. The measurement materials selected included: 1) Monitoring Ba-sic Skills Progress (MBSP), Math Computation (Fuchs, Hamlett, & Fuchs, 1990) and 2) Monitoring Basic Skills Progress (MBSP), Math Applications and Problem Solving (Fuchs, Hamlett, & Fuchs, 1994).
In the beginning of the school year, probes from three different grade lev-els were administered, scored, and interpreted to facilitate appropriate instructional placement and to determine a progress monitoring level that would be sensitive to growth over time. In addition to helping form cohesive instructional groupings, the baseline CBM scores also provided the basis for annual, measurable goals that were set and depicted using a time series graphic display of data (Deno, Fuchs, Marston, & Shinn, 2001). Each CBM graph included: (1) baseline data at a measurement level that was either at the student’s chronological grade level, or at the highest grade level possible using out-of-level-testing procedures if necessary to achieve appropriate sensitivity to growth over time; and (2) an annual goal depicted on the graph, with an aimline (a projection of growth) drawn from baseline data. The graphed CBM performance data enabled an analysis of trend in performance to be determined in comparison to the aimline using the well-established practices of formative evalua-tion (Deno, 1985; Fuchs & Fuchs, 2008; Jenkins & Fuchs, 2012; Shinn, 1989; White &
Haring, 1980).Micro Level Assessment. The final step in the assessment sequence was to
collect Micro Level data to further inform instructional decision-making. Micro Lev-el Assessment requires daily data collection using measures that are highly sensitive to growth over time (Johnson & Layng, 1992; Lindsley, 1990). In the MTSS model dis-cussed in this paper, the Micro Level Assessment was informed by Precision Teaching data. These data included measuring progress on component skills such as answering
Learning Disabilities: A Contemporary Journal 13(1), 21-41, 2015
27
basic math facts and composite skills such as the completion of complex arithmetic problems. Both level changes as well as slope, or celeration, depicting growth over time were analyzed to determine if a student was making adequate progress (Kubina & Yurich, 2012; Johnson & Street, 2004; White & Haring, 1980).
Placement Procedures After analyzing these three layers of data, students were placed into homo-
geneous instructional groups. In this case, the math subtest results from the ITBS and WJ-III were analyzed first to determine which students were functioning at their chronological grade level and those who were not using norm-referenced compari-sons. Given the number of enrolled students and number of teachers that were ex-pected to run math groups during the school year, a sketch was created of preliminary instructional groups based on the results obtained from the initial assessment. Next, data from the Meta and Micro Levels were carefully considered to solidify instruc-tional groupings. The core administrative staff of the school, including the Executive Director, the Principal, and the Director of Student Assessment, worked with the fac-ulty to finalize the groupings.
For each instructional group, a blend of curriculum materials and instruc-tional approaches were identified. Because an important feature of this instructional approach was that student data drove each decision made, the initial curriculum and instruction chosen were considered to be “hypotheses” and amenable to change as needed. For instance, it was determined that the instructional needs of the students in the present case study closely paralleled the scope and sequence of the Saxon Math 54 and Saxon Math 65 curricula (Hake & Saxon, 1994, 1995).
It is important to note that after initial placement decisions were made, teachers and administrators continued to use each layer of the Multi-Level Assess-ment System to inform the next. Daily decision-making was possible using Precision Teaching performance outcomes (Micro Level Assessment). Trends in performance from the weekly CBM probes (Meta Level Assessment) were used to validate the ef-ficacy of the math curriculum and Precision Teaching instructional programming. The Meta Level data further enabled accurate predictions to be made regarding larger skill gains that were expected by the end of the school year using more widely ac-cepted, but less sensitive, measures of skill improvement and achievement, such as the ITBS and WJ III (Macro Level Assessment). A flowchart illustrating this data based decision-making model and the relationship between assessment and intervention is
depicted in Figure 2.
ParticipantsThere were ten students included in the math class examined in this case
study. All students were male. Ethnic breakdown included five students (50%) who were Caucasian, one (10%) was mixed race African American / Indian, and four (40%) were of Asian descent. Using their chronological grade placements, four of the students (40%) were considered to be in 4th grade, five students (50%) were con-sidered to be in 5th grade, and one student (10%) was considered to be in 6th grade. However, on average, the students were performing between the end of third-grade and beginning of fourth-grade level based on their initial ITBS scores. Special edu-
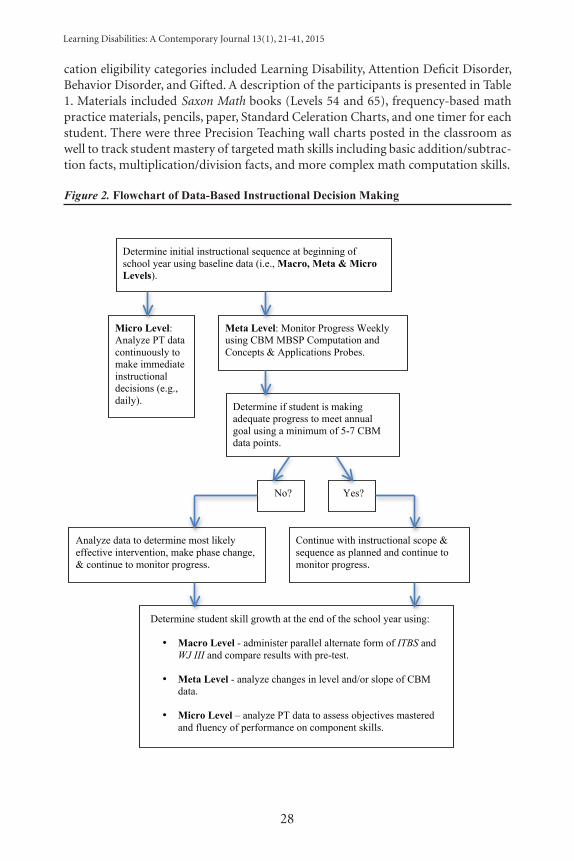
Learning Disabilities: A Contemporary Journal 13(1), 21-41, 2015
28
cation eligibility categories included Learning Disability, Attention Deficit Disorder, Behavior Disorder, and Gifted. A description of the participants is presented in Table 1. Materials included Saxon Math books (Levels 54 and 65), frequency-based math practice materials, pencils, paper, Standard Celeration Charts, and one timer for each student. There were three Precision Teaching wall charts posted in the classroom as well to track student mastery of targeted math skills including basic addition/subtrac-tion facts, multiplication/division facts, and more complex math computation skills.
Figure 2. Flowchart of Data-Based Instructional Decision MakingA MODEL OF MTSS INTEGRATING PRECISION TEACHING! 34!
Figure 2. Flowchart of Data-Based Instructional Decision Making
Determine initial instructional sequence at beginning of school year using baseline data (i.e., Macro, Meta & Micro Levels).
Micro Level: Analyze PT data continuously to make immediate instructional decisions (e.g., daily).
Meta Level: Monitor Progress Weekly using CBM MBSP Computation and Concepts & Applications Probes.
Determine if student is making adequate progress to meet annual goal using a minimum of 5-7 CBM data points.
Determine student skill growth at the end of the school year using:
• Macro Level - administer parallel alternate form of ITBS and WJ III and compare results with pre-test.
• Meta Level - analyze changes in level and/or slope of CBM data.
• Micro Level – analyze PT data to assess objectives mastered and fluency of performance on component skills.
Yes?
Continue with instructional scope & sequence as planned and continue to monitor progress.
No?
Analyze data to determine most likely effective intervention, make phase change, & continue to monitor progress.
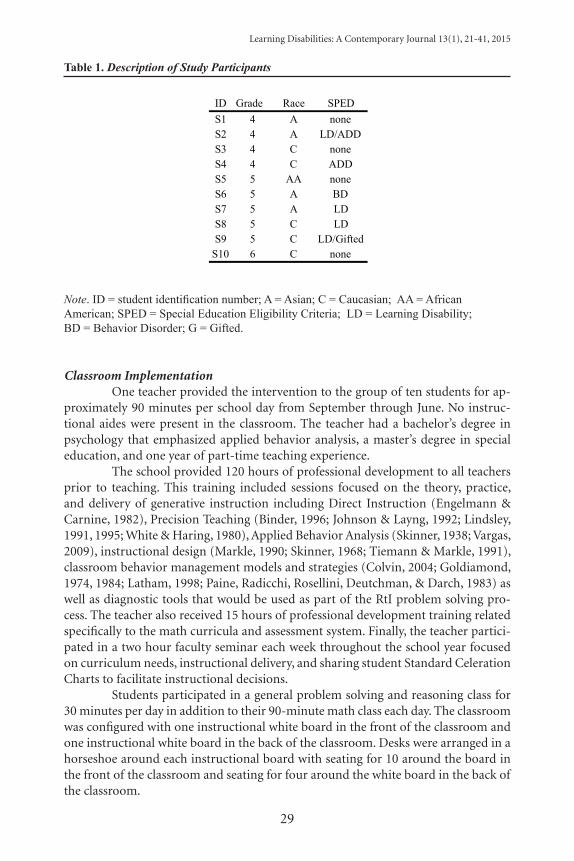
Learning Disabilities: A Contemporary Journal 13(1), 21-41, 2015
29
Table 1. Description of Study Participants
ID Grade Race SPEDS1 4 A noneS2 4 A LD/ADDS3 4 C noneS4 4 C ADDS5 5 AA noneS6 5 A BDS7 5 A LDS8 5 C LDS9 5 C LD/Gifted
S10 6 C none
Note. ID = student identification number; A = Asian; C = Caucasian; AA = African American; SPED = Special Education Eligibility Criteria; LD = Learning Disability; BD = Behavior Disorder; G = Gifted.
Classroom ImplementationOne teacher provided the intervention to the group of ten students for ap-
proximately 90 minutes per school day from September through June. No instruc-tional aides were present in the classroom. The teacher had a bachelor’s degree in psychology that emphasized applied behavior analysis, a master’s degree in special education, and one year of part-time teaching experience.
The school provided 120 hours of professional development to all teachers prior to teaching. This training included sessions focused on the theory, practice, and delivery of generative instruction including Direct Instruction (Engelmann & Carnine, 1982), Precision Teaching (Binder, 1996; Johnson & Layng, 1992; Lindsley, 1991, 1995; White & Haring, 1980), Applied Behavior Analysis (Skinner, 1938; Vargas, 2009), instructional design (Markle, 1990; Skinner, 1968; Tiemann & Markle, 1991), classroom behavior management models and strategies (Colvin, 2004; Goldiamond, 1974, 1984; Latham, 1998; Paine, Radicchi, Rosellini, Deutchman, & Darch, 1983) as well as diagnostic tools that would be used as part of the RtI problem solving pro-cess. The teacher also received 15 hours of professional development training related specifically to the math curricula and assessment system. Finally, the teacher partici-pated in a two hour faculty seminar each week throughout the school year focused on curriculum needs, instructional delivery, and sharing student Standard Celeration Charts to facilitate instructional decisions.
Students participated in a general problem solving and reasoning class for 30 minutes per day in addition to their 90-minute math class each day. The classroom was configured with one instructional white board in the front of the classroom and one instructional white board in the back of the classroom. Desks were arranged in a horseshoe around each instructional board with seating for 10 around the board in the front of the classroom and seating for four around the white board in the back of the classroom.
Learning Disabilities: A Contemporary Journal 13(1), 21-41, 2015
30
In the problem solving and reasoning class, the entire class received a 10-15 minute lesson focused on a critical component of the problem solving process or introducing a new type of problem using a program called Talk Aloud Problem Solving, or TAPS (Robbins, 1996, 2011, 2014). Next, students worked in pairs to solve problems provided by the teacher on worksheets. The TAPS program enabled students to develop two repertoires, becoming both a Problem Solver and an Active Listener, while using increasingly difficult content-free logic problems that made the talk aloud process more probable. Having a positive attitude, breaking a problem into parts, working carefully, following along like a teacher, checking for mistakes, and answering with confidence were all key competencies of the TAPS program.
In the math class, students were divided into two instructional groups us-ing initial learning rate on various math skills, displayed on the Standard Celera-tion Chart, to classify students as fast or slow responders. This classification was used to create two instructional groups within the math class: Group A (6 students) and Group B (4 students). Group A comprised learners that demonstrated faster learning rates on the (1) Standard Celeration Charts, (2) CBM math computation, and (3) CBM concepts and applications charts during the first month (baseline period) of the school year.
As illustrated by the class schedule in Table 2, Group A (n=6) received a 10-15 minute Saxon Math lesson (in the front of the classroom) while Group B (n=4) practiced their skills using frequency building exercises in math computation (in the back of the classroom). Saxon math lessons were delivered using Direct Instruc-tion methods that included choral responding and individual student responding to check for understanding of the lesson. If students answered incorrectly during choral responding, additional example/non-example sets were included until all students answered correctly. After Group A started to work independently on the Saxon Prob-lem Set assigned for the day, the teacher went to the back of the classroom to deliver a 10-15 minute Saxon lesson to Group B. It is important to note that during both lessons, the teacher was giving explicit and frequent positive feedback to the distant group for staying on task and following directions. Contingencies were also estab-lished such that groups that stayed on task throughout the class and completed all work would have a 10 minute break at the end of the class period.
Using their personal timers, students tracked the total amount of time re-quired to complete the Saxon Problem Set. Next, they were expected to self-correct the assignment using one of the answer keys provided by the teacher. Students recorded the total amount of time required to complete the assignment and the total number of errors on the top of their paper. The teacher would quickly review the mistakes made across instructional groups at the end of each class to evaluate the need for ad-ditional instruction on certain concepts the following day.
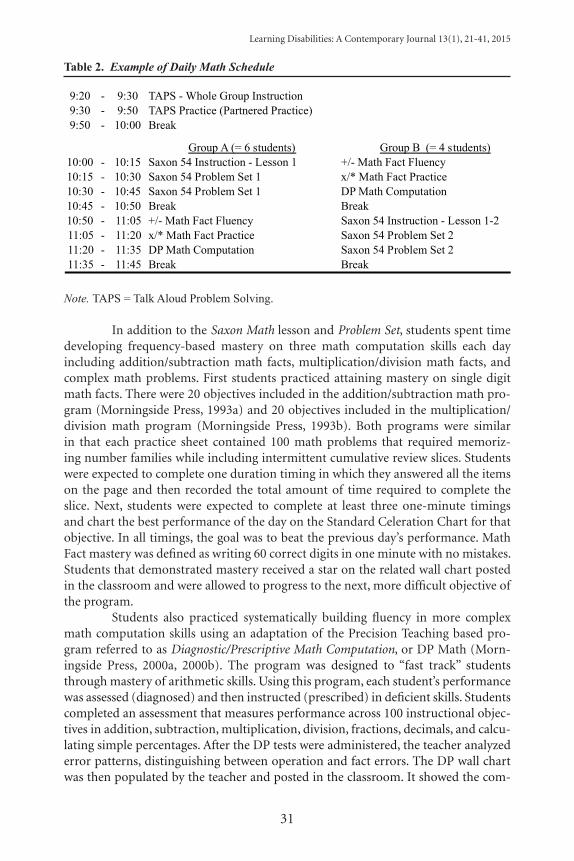
Learning Disabilities: A Contemporary Journal 13(1), 21-41, 2015
31
Table 2. Example of Daily Math Schedule
9:20 - 9:30 TAPS - Whole Group Instruction9:30 - 9:50 TAPS Practice (Partnered Practice)9:50 - 10:00 Break
Group A (= 6 students) Group B (= 4 students)10:00 - 10:15 Saxon 54 Instruction - Lesson 1 +/- Math Fact Fluency 10:15 - 10:30 Saxon 54 Problem Set 1 x/* Math Fact Practice 10:30 - 10:45 Saxon 54 Problem Set 1 DP Math Computation10:45 - 10:50 Break Break10:50 - 11:05 +/- Math Fact Fluency Saxon 54 Instruction - Lesson 1-211:05 - 11:20 x/* Math Fact Practice Saxon 54 Problem Set 2 11:20 - 11:35 DP Math Computation Saxon 54 Problem Set 2 11:35 - 11:45 Break Break
Note. TAPS = Talk Aloud Problem Solving.
In addition to the Saxon Math lesson and Problem Set, students spent time developing frequency-based mastery on three math computation skills each day including addition/subtraction math facts, multiplication/division math facts, and complex math problems. First students practiced attaining mastery on single digit math facts. There were 20 objectives included in the addition/subtraction math pro-gram (Morningside Press, 1993a) and 20 objectives included in the multiplication/division math program (Morningside Press, 1993b). Both programs were similar in that each practice sheet contained 100 math problems that required memoriz-ing number families while including intermittent cumulative review slices. Students were expected to complete one duration timing in which they answered all the items on the page and then recorded the total amount of time required to complete the slice. Next, students were expected to complete at least three one-minute timings and chart the best performance of the day on the Standard Celeration Chart for that objective. In all timings, the goal was to beat the previous day’s performance. Math Fact mastery was defined as writing 60 correct digits in one minute with no mistakes. Students that demonstrated mastery received a star on the related wall chart posted in the classroom and were allowed to progress to the next, more difficult objective of the program.
Students also practiced systematically building fluency in more complex math computation skills using an adaptation of the Precision Teaching based pro-gram referred to as Diagnostic/Prescriptive Math Computation, or DP Math (Morn-ingside Press, 2000a, 2000b). The program was designed to “fast track” students through mastery of arithmetic skills. Using this program, each student’s performance was assessed (diagnosed) and then instructed (prescribed) in deficient skills. Students completed an assessment that measures performance across 100 instructional objec-tives in addition, subtraction, multiplication, division, fractions, decimals, and calcu-lating simple percentages. After the DP tests were administered, the teacher analyzed error patterns, distinguishing between operation and fact errors. The DP wall chart was then populated by the teacher and posted in the classroom. It showed the com-
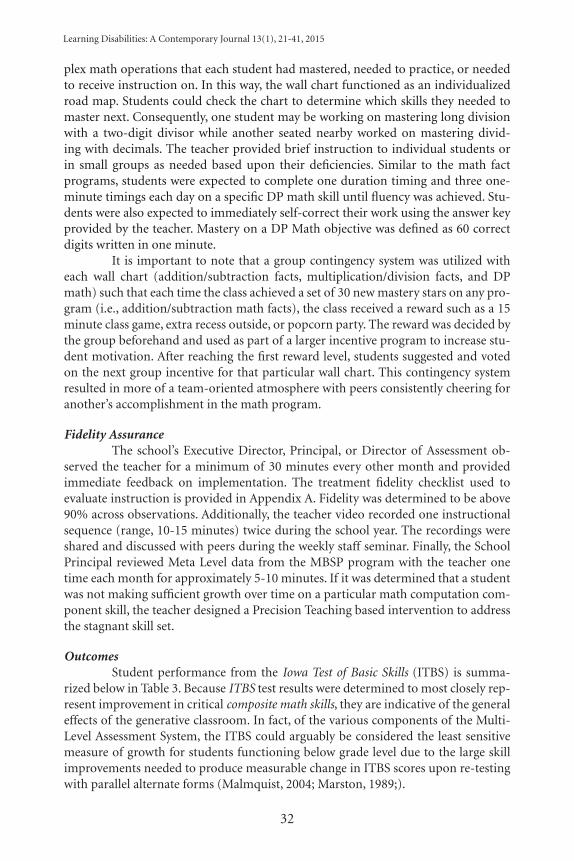
Learning Disabilities: A Contemporary Journal 13(1), 21-41, 2015
32
plex math operations that each student had mastered, needed to practice, or needed to receive instruction on. In this way, the wall chart functioned as an individualized road map. Students could check the chart to determine which skills they needed to master next. Consequently, one student may be working on mastering long division with a two-digit divisor while another seated nearby worked on mastering divid-ing with decimals. The teacher provided brief instruction to individual students or in small groups as needed based upon their deficiencies. Similar to the math fact programs, students were expected to complete one duration timing and three one-minute timings each day on a specific DP math skill until fluency was achieved. Stu-dents were also expected to immediately self-correct their work using the answer key provided by the teacher. Mastery on a DP Math objective was defined as 60 correct digits written in one minute.
It is important to note that a group contingency system was utilized with each wall chart (addition/subtraction facts, multiplication/division facts, and DP math) such that each time the class achieved a set of 30 new mastery stars on any pro-gram (i.e., addition/subtraction math facts), the class received a reward such as a 15 minute class game, extra recess outside, or popcorn party. The reward was decided by the group beforehand and used as part of a larger incentive program to increase stu-dent motivation. After reaching the first reward level, students suggested and voted on the next group incentive for that particular wall chart. This contingency system resulted in more of a team-oriented atmosphere with peers consistently cheering for another’s accomplishment in the math program.
Fidelity AssuranceThe school’s Executive Director, Principal, or Director of Assessment ob-
served the teacher for a minimum of 30 minutes every other month and provided immediate feedback on implementation. The treatment fidelity checklist used to evaluate instruction is provided in Appendix A. Fidelity was determined to be above 90% across observations. Additionally, the teacher video recorded one instructional sequence (range, 10-15 minutes) twice during the school year. The recordings were shared and discussed with peers during the weekly staff seminar. Finally, the School Principal reviewed Meta Level data from the MBSP program with the teacher one time each month for approximately 5-10 minutes. If it was determined that a student was not making sufficient growth over time on a particular math computation com-ponent skill, the teacher designed a Precision Teaching based intervention to address the stagnant skill set.
OutcomesStudent performance from the Iowa Test of Basic Skills (ITBS) is summa-
rized below in Table 3. Because ITBS test results were determined to most closely rep-resent improvement in critical composite math skills, they are indicative of the general effects of the generative classroom. In fact, of the various components of the Multi-Level Assessment System, the ITBS could arguably be considered the least sensitive measure of growth for students functioning below grade level due to the large skill improvements needed to produce measurable change in ITBS scores upon re-testing with parallel alternate forms (Malmquist, 2004; Marston, 1989;).
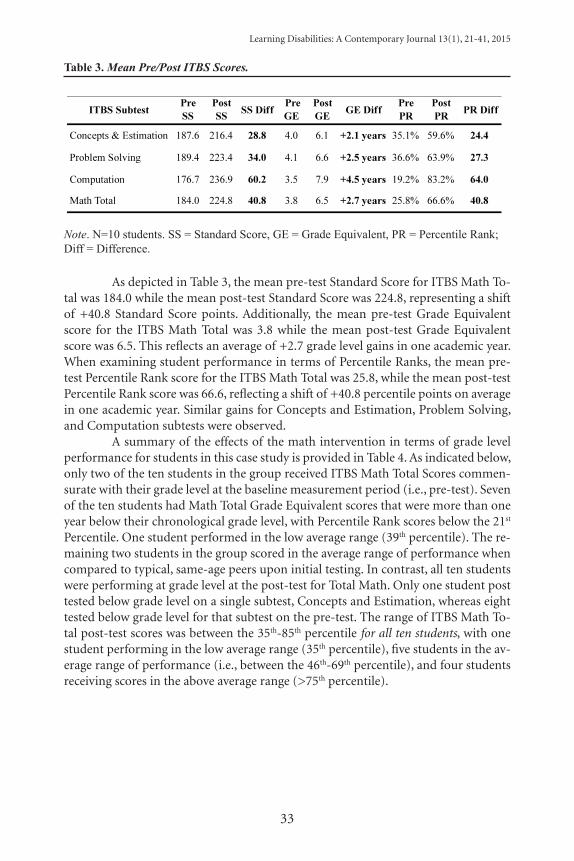
Learning Disabilities: A Contemporary Journal 13(1), 21-41, 2015
33
Table 3. Mean Pre/Post ITBS Scores.
A MODEL OF MTSS INTEGRATING PRECISION TEACHING
38
Table 3.
Mean Pre/Post ITBS Scores.
Note. N=10 students. SS = Standard Score, GE = Grade Equivalent, PR = Percentile Rank; Diff = Difference. Note. N=10 students. SS = Standard Score, GE = Grade Equivalent, PR = Percentile Rank; Diff = Difference.
As depicted in Table 3, the mean pre-test Standard Score for ITBS Math To-tal was 184.0 while the mean post-test Standard Score was 224.8, representing a shift of +40.8 Standard Score points. Additionally, the mean pre-test Grade Equivalent score for the ITBS Math Total was 3.8 while the mean post-test Grade Equivalent score was 6.5. This reflects an average of +2.7 grade level gains in one academic year. When examining student performance in terms of Percentile Ranks, the mean pre-test Percentile Rank score for the ITBS Math Total was 25.8, while the mean post-test Percentile Rank score was 66.6, reflecting a shift of +40.8 percentile points on average in one academic year. Similar gains for Concepts and Estimation, Problem Solving, and Computation subtests were observed.
A summary of the effects of the math intervention in terms of grade level performance for students in this case study is provided in Table 4. As indicated below, only two of the ten students in the group received ITBS Math Total Scores commen-surate with their grade level at the baseline measurement period (i.e., pre-test). Seven of the ten students had Math Total Grade Equivalent scores that were more than one year below their chronological grade level, with Percentile Rank scores below the 21st Percentile. One student performed in the low average range (39th percentile). The re-maining two students in the group scored in the average range of performance when compared to typical, same-age peers upon initial testing. In contrast, all ten students were performing at grade level at the post-test for Total Math. Only one student post tested below grade level on a single subtest, Concepts and Estimation, whereas eight tested below grade level for that subtest on the pre-test. The range of ITBS Math To-tal post-test scores was between the 35th-85th percentile for all ten students, with one student performing in the low average range (35th percentile), five students in the av-erage range of performance (i.e., between the 46th-69th percentile), and four students receiving scores in the above average range (>75th percentile).
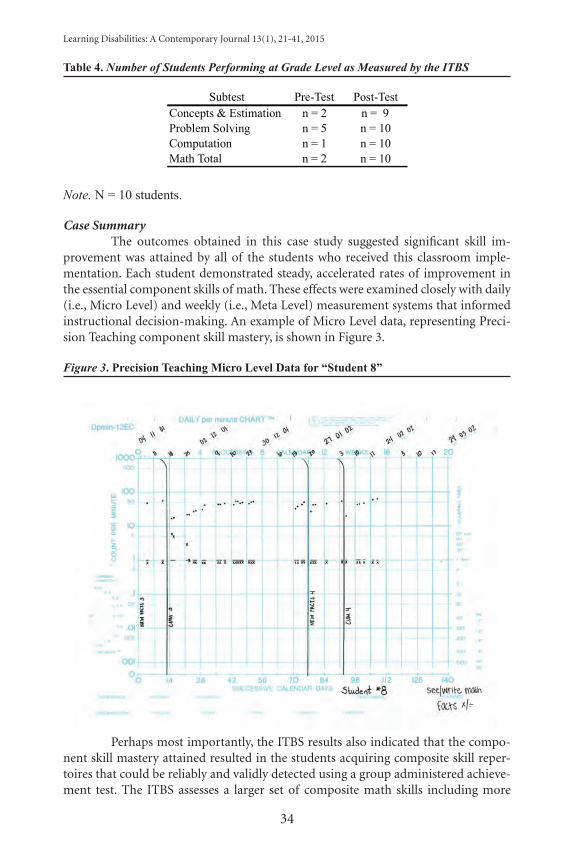
Learning Disabilities: A Contemporary Journal 13(1), 21-41, 2015
34
Table 4. Number of Students Performing at Grade Level as Measured by the ITBS
Subtest Pre-Test Post-TestConcepts & Estimation n = 2 n = 9Problem Solving n = 5 n = 10Computation n = 1 n = 10Math Total n = 2 n = 10
Note. N = 10 students.
Case SummaryThe outcomes obtained in this case study suggested significant skill im-
provement was attained by all of the students who received this classroom imple-mentation. Each student demonstrated steady, accelerated rates of improvement in the essential component skills of math. These effects were examined closely with daily (i.e., Micro Level) and weekly (i.e., Meta Level) measurement systems that informed instructional decision-making. An example of Micro Level data, representing Preci-sion Teaching component skill mastery, is shown in Figure 3.
Figure 3. Precision Teaching Micro Level Data for “Student 8”
Perhaps most importantly, the ITBS results also indicated that the compo-nent skill mastery attained resulted in the students acquiring composite skill reper-toires that could be reliably and validly detected using a group administered achieve-ment test. The ITBS assesses a larger set of composite math skills including more
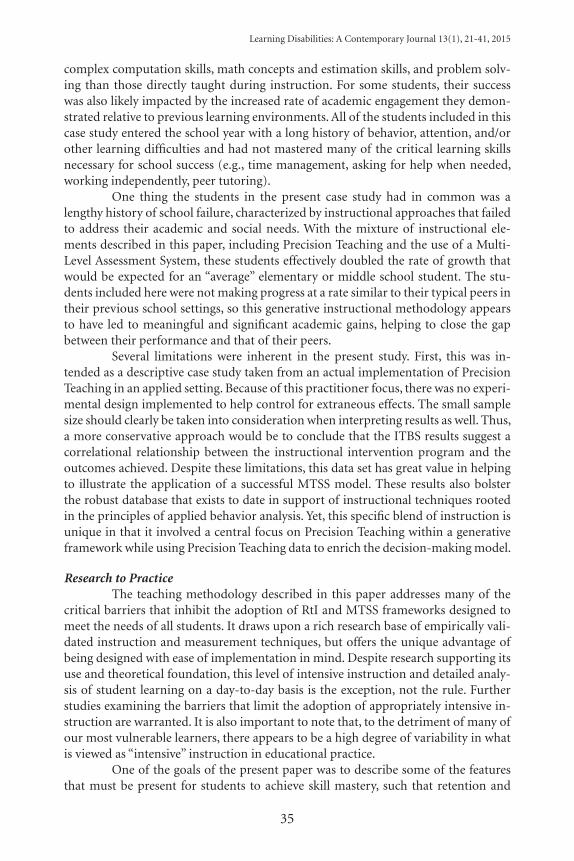
Learning Disabilities: A Contemporary Journal 13(1), 21-41, 2015
35
complex computation skills, math concepts and estimation skills, and problem solv-ing than those directly taught during instruction. For some students, their success was also likely impacted by the increased rate of academic engagement they demon-strated relative to previous learning environments. All of the students included in this case study entered the school year with a long history of behavior, attention, and/or other learning difficulties and had not mastered many of the critical learning skills necessary for school success (e.g., time management, asking for help when needed, working independently, peer tutoring).
One thing the students in the present case study had in common was a lengthy history of school failure, characterized by instructional approaches that failed to address their academic and social needs. With the mixture of instructional ele-ments described in this paper, including Precision Teaching and the use of a Multi-Level Assessment System, these students effectively doubled the rate of growth that would be expected for an “average” elementary or middle school student. The stu-dents included here were not making progress at a rate similar to their typical peers in their previous school settings, so this generative instructional methodology appears to have led to meaningful and significant academic gains, helping to close the gap between their performance and that of their peers.
Several limitations were inherent in the present study. First, this was in-tended as a descriptive case study taken from an actual implementation of Precision Teaching in an applied setting. Because of this practitioner focus, there was no experi-mental design implemented to help control for extraneous effects. The small sample size should clearly be taken into consideration when interpreting results as well. Thus, a more conservative approach would be to conclude that the ITBS results suggest a correlational relationship between the instructional intervention program and the outcomes achieved. Despite these limitations, this data set has great value in helping to illustrate the application of a successful MTSS model. These results also bolster the robust database that exists to date in support of instructional techniques rooted in the principles of applied behavior analysis. Yet, this specific blend of instruction is unique in that it involved a central focus on Precision Teaching within a generative framework while using Precision Teaching data to enrich the decision-making model.
Research to PracticeThe teaching methodology described in this paper addresses many of the
critical barriers that inhibit the adoption of RtI and MTSS frameworks designed to meet the needs of all students. It draws upon a rich research base of empirically vali-dated instruction and measurement techniques, but offers the unique advantage of being designed with ease of implementation in mind. Despite research supporting its use and theoretical foundation, this level of intensive instruction and detailed analy-sis of student learning on a day-to-day basis is the exception, not the rule. Further studies examining the barriers that limit the adoption of appropriately intensive in-struction are warranted. It is also important to note that, to the detriment of many of our most vulnerable learners, there appears to be a high degree of variability in what is viewed as “intensive” instruction in educational practice.
One of the goals of the present paper was to describe some of the features that must be present for students to achieve skill mastery, such that retention and
Learning Disabilities: A Contemporary Journal 13(1), 21-41, 2015
36
application of new skills occurs and leads to more complex learning and success over time. This detailed programming for retention and application of component skills is a hallmark of generative instruction and provides the closest match we know of to the unique challenges that children with special education needs may face. In fact, it could be argued that these techniques offer the most thorough approach to what we think of as “learning” because the conceptual underpinnings of learning are broken
down into smaller chunks so that systematic mastery of the larger skills can be obtained.
conclusIon
A primary goal in presenting this case study was to describe a solution to a pervasive problem that exists in educational practice today – the adoption of a teaching approach that is characterized by an attempt to “teach” the composite skills a student must learn directly, out of order, and regardless of the specific entering skill proficiency of the student because the composite skill is the terminal objective for that particular grade level (i.e., aligns with the Common Core State Standards). This approach is often characterized by “exposing” students to instruction and then mov-ing to the next lesson either regardless of mastery or otherwise assuming that if the student answers a specific problem type with 80-100% accuracy at one point in time, that mastery was achieved. While this may make sense from the perspective that, yes, we do want the child to ultimately master the higher-order composite skills, we be-lieve this approach ultimately short circuits the learning process.
One of the most critical elements in the instructional program presented in this case study was the use of rate-based criteria to establish mastery in math com-putation skills, which requires accurate and fluent performance. Specifically, students practiced building fluency in sequentially ordered math computation component skills to a rate of 60 correct digits written in one minute before progressing on to the next more difficult skill. However, just as the skill of “learning to read” is not complete after mastering phonemic awareness and decoding, competency in math cannot be viewed as simply becoming proficient in number sense or math fact fluency. Yet, at the same time, it is dangerous to assume that these foundational skills are not crucial component skills that form the building blocks of the more complex skill repertoires. For instance, we do not consider a student who has difficulty with algebra to have an “algebra disability.” Rather, we find that in every instance in which students struggle with certain higher order math competencies, it is due to dysfluency in one or more of the essential component skills of that skill domain.
In closing, it is important to consider a related developing cultural problem we now face as well. Teachers and parents appear to be “rebelling” against “standard-ized testing” and “the common core” in alarming numbers (Eng, 2012; Lahey, 2014). Rather than suggesting we abandon sound assessment practices and empirically vali-dated goal setting in education, we ought to view this problem as an unintended side effect of the instructional mismatch that may be built into current educational prac-tice. Therefore, progress in achieving educational equality will require better align-ment of our stated values with our practice.
It should be assumed that providing a free, appropriate public education for all children strengthens the U.S. as a nation, as it does any culture or society that
Learning Disabilities: A Contemporary Journal 13(1), 21-41, 2015
37
adopts a similar priority. However, this has turned out to be a daunting task. Because of the challenges inherent in such an undertaking, many reasons why we have fallen short of this goal have been proposed. In studying trends in educational practice over the last few decades, it is clear that more emphasis is needed relative to the quality and intensity of daily instructional delivery for at risk learners. While continued atten-tion on the adequacy of learning standards (e.g., Common Core State Standards) is certainly warranted, any viable solution for truly meeting the unique academic needs of all students must go further and involve a careful examination of the very specific details of our teaching methodology and the manner in which we assess progress. The good news is that the solution to these challenges has never been closer. The progress that has been made in determining what works could be considered one of our greatest achievements of the past 100 years. The discoveries that have been made in the fields of learning and neuroscience are now at our fingertips. The challenge we are left with is determining the best way to get truly effective, empirically validated instructional programs and methods into the hands of those who need them.
Fortunately, instructional technologies are available that offer what is likely the best solution we have found to date for these complex problems; and, they are predicated on the extensive knowledge we have of learning and behavioral science. Including and further evaluating techniques derived from Precision Teaching, gen-erative instruction, and a Multi-Level Assessment System within RtI instructional de-livery models could help bolster MTSS frameworks and revolutionize the education of struggling students. It is only when we close the gap between our collective knowl-edge of how to provide a free, appropriate education for all learners and our ability to implement these strategies effectively in our nation’s schools for all children, regard-
less of race, disability, and socioeconomic status, that our mission will be complete.
references
Alessi, G. (1987). Generative strategies and teaching for generalization. The Analysis of Verbal Behavior, 5, 15-27.
Andronis, P. T. (1983). Symbolic aggression by pigeons: Contingency coadduction. Unpublished doctoral dissertation, University of Chicago, Department of Psychiatry and Behavior Analysis.
Andronis, P. T., Goldiamond, I., & Layng, T. V. J. (1983, May). “Symbolic aggression by pigeons: Contingency coadduction. Paper presented at the meeting of the Associa-tion for Behavior Analysis International, Milwaukie, WI.
Archer, A., & Hughes, C. (2011). Explicit instruction: Effective and efficient teaching. New York: Guilford Press.
Batsche, G. (2014). Multi-Tiered System of Supports for Inclusive Schools. In McLeskey, J., Waldron, N.L., Spooner, F. & Algozzine, B. (Eds), Handbook of Effective Inclusive Schools: Research and Practice (pp. 183-196). New York and London: Routledge
Binder, C. (1996). Behavioral fluency: Evolution of a new paradigm. The Behavior Analyst, 19, 163-197.
Calkin, A. B. (2005). Precision teaching: The standard celeration chart. The Behavior Analyst Today, 6, 207-213.
Colvin, G. (2004). Managing the cycle of acting-out behavior in the classroom. Eugene, OR: Be-havior Associates.
Deno, S. L. (1985). Curriculum-based measurement: The emerging alternative. Exceptional Children, 52, 219-232.
Learning Disabilities: A Contemporary Journal 13(1), 21-41, 2015
38
Deno, S. L., Fuchs, L. S., Marston, D., & Shin, J. (2001). Using curriculum-based measurement to establish growth standards for students with learning disabilities. School Psychol-ogy Review Special Issue: Mini-series: Issues in Data-Based Decision Making in Special Education, 30, 507-524.
Eng, J. (2012). Iowa test on way out of classrooms? NBC News Online. Retrieved on July 25th. 2014, from http://usnews.nbcnews.com/_news/2012/02/07/10343262-iowa-test-on-way-out-of-classrooms.
Engelmann, S. E., & Carnine, D. (1982). Theory of instruction: Principles and applications. New York: Irvington Publishers.
Epstein, R. (1981). On pigeons and people: A preliminary look at the Columban simulation project. The Behavior Analyst, 4, 43-55.
Epstein, R. (1985). The spontaneous interconnection of three repertoires. The Psychological Record, 35, 131-143.
Epstein, R. (1991). Skinner, creativity, and the problem of spontaneous behavior. Psychological Science, 2, 362-370.
Fuchs, L. S., & Fuchs, D. (2008). Best practices in progress monitoring reading and mathemat-ics at the elementary grades. In J. Grimes & A. Thomas (Eds.), Best Practices in School Psychology, 5, 2147-2164. Bethesda, MD: National Association of School Psychologists.
Fuchs, L. S., Hamlett, C. L., & Fuchs, D. (1990). Monitoring basic skills progress: Basic math computation manual. Austin, TX: Pro-Ed.
Fuchs, L. S., Hamlett, C. L., & Fuchs, D. (1994). Monitoring basic skills progress: Basic math concepts and applications manual. Austin, TX: Pro-Ed.
Goldiamond, I. (1974). Toward a constructional approach to social problems: Ethical and con-stitutional issues raised by applied behavior analysis. Behaviorism, 2, 1-84.
Goldiamond, I. (1984) Training parents and ethicists in nonlinear behavior analysis. In Dangel, R. F., & Polster, R. A. (Eds.) (pp.504-536). Parent Training: Foundations of Research and Practice. New York: Guilford.
Hake, S., & Saxon, J. (1994). SAXON Math 65: An incremental development. Norman, OK: Saxon Publishing.
Hake, S., & Saxon, J. (1995). SAXON Math 54: An incremental development, 2nd Edition. Norman, OK: Saxon Publishing.
Hoover, H. D., Dunbar, S. B., & Frisbie, D. A. (2001). The Iowa Tests of Basic Skills® (ITBS). Chicago, IL: Riverside Publishing.
Hunter, M. (1994). Enhancing teaching: Planning for effective instruction, lesson design. New York: Macmillan.
Jenkins, J. R., & Fuchs, L. S. (2012). Curriculum-based measurement: The paradigm, history, and legacy. In C. A. Espin, K. McKaster, S. Rose, & M. Wayman (Eds.), A measure of success: How curriculum-based measurement has informed education and learning (pp. 7-26). Minneapolis, MN: University of Minnesota Press.
Johnson, K. R., & Layng, T. V. J. (1992). Breaking the structuralist barrier: Literacy and numeracy with fluency. American Psychologist, 47, 1475-1490.
Johnson, K. R., & Layng, T. V. J. (1994). The Morningside model of generative instruction. In R. Gardner III, et al. (Eds.). Behavior analysis in education: Focus on measurably superior instruction (pp. 173-197). Pacific Grove: CA: Brooks/Cole.
Johnson, K. R., & Layng, T. V. J. (1996). On terms and procedures: Fluency. The Behavior Analyst, 19, 281-288.
Johnson, K. R., & Street, L. (Eds.). (2004). The Morningside Model of Generative Instruc-tion: What it means to leave no child behind. Concord: MA: Cambridge Center for Behavioral Studies.
Johnson, K., & Street, E. M. (2013). Response to Intervention and Precision Teaching: Creating Synergy in the Classroom. New York, NY: Guildford Press.
Learning Disabilities: A Contemporary Journal 13(1), 21-41, 2015
39
Kubina, R., & Yurich, K. (2012). The precision peaching book. Lemont, PA: Greatness Achieved Publishing Company.
Lahey, J. (2014). Why students are tested, and why some parents opt out. New York Times On-line. Retrieved on July 25th, 2014 from htpp://parenting.blogs.nytimes.com/2014/04/ 04/10/why-students-are-tested-and-why-some-parents-opt-out/?_php=true&_true=blogs&_r=0.
Latham, G. (1998). Keys to classroom management. North Logan, UT: P&T Ink.Lindsley, O. R. (1990). Precision teaching: By teachers for children. Teaching Exceptional Chil-
dren, 22, 10-15.Lindsley, O. R. (1991). Precision teaching’s unique legacy from B. F. Skinner. Journal of Behav-
ioral Education, 1, 253-266.Lindsley, O. R. (1995). Ten products of fluency. Journal of Precision Teaching, 13, 2-11.Malmquist, S. (2004). Using a multi-level system of assessment to form instructional decisions
and determine program effectiveness. In K. Johnson & L. Street (Eds.) The Morn-ingside Model of Generative Instruction: What it means to leave no child behind. (pp. 52-93). Concord: MA: Cambridge Center for Behavioral Studies.
Markle, S. M. (1990). Designs for instructional designers. Champaign, IL: Stipes Publishing Company.
Marston, D. (1989). A curriculum-based measurement approach to assessing academic perfor-mance: What is it and why do it. In M. Shinn (Ed.), Curriculum-based measurement: Assessing special children (pp. 18-78). New York: Guilford Press.
Moors, A., Weisenburgh-Snyder A., & Robbins, J. (2010). Integrating frequency-based math-ematics instruction with a multi-level assessment system to enhance response to in-tervention frameworks. The Behavior Analyst Today, 11, 226-244.
Morningside Press (1993a). Morningside Mathematics Fluency: Addition and Subtraction (2 volumes). Seattle, WA: Morningside Press.
Morningside Press (1993b). Morningside Mathematics Fluency: Multiplication and Division (3 volumes). Seattle, WA: Morningside Press.
Morningside Press (2001a). Teaching computation skills: A diagnostic and prescriptive instruc-tional sequence, add and subtract. Seattle, WA: Morningside Press.
Morningside Press (2001b). Teaching computation skills: A diagnostic and prescriptive instruc-tional sequence, multiply and divide. Seattle, WA: Morningside Press.
Paine, S., Radicchi, J., Rosellini, L., Deutchman, L., & Darch, C. (1983). Structuring your class-room for academic success. Champaign, IL: Research Press Company.
Pennypacker, H. S., Koenig, C. H., & Lindsley, O. R. (1972). Handbook of the standard celeration chart. Kansas City, MO: Precision Media.
Pryor, K., Haag, R., & O’Reilly, J. (1969). The creative porpoise: Training for novel behavior. Journal of the Experimental Analysis of Behavior, 12, 653-661.
Riccomini, P., & Witzel, B. (2009). Response to intervention in math. Thousand Oaks, CA: Sage.Robbins, J. K. (1996). TAPS for teachers. Seattle, WA: Robbins/Layng & Associates.Robbins, J. K. (2011). Problem solving, reasoning, and analytical thinking in a classroom envi-
ronment, The Behavior Analyst Today, 12, 40-47.Robbins, J. K. (2014) Learn to reason with TAPS: A talk aloud problem solving approach.
Seattle, WA: Robbins/Layng Associates.Robbins, J. K., Layng, T. V. J., & Jackson, P. (1995). Fluent thinking skills. Seattle, WA: Robbins/
Layng & Associates.Shinn, M. R. (Ed.) (1989). Curriculum-based measurement: Assessing special children. New
York: Guilford.Sidman, M. (1994). Stimulus equivalence. Boston, MA: Authors Cooperative.Skinner, B. F. (1938). The behavior of organisms. Englewood Cliffs, NJ: Prentice-Hall.Skinner, B. F. (1968). The technology of teaching. New York: Appleton-Century-Crofts.
Learning Disabilities: A Contemporary Journal 13(1), 21-41, 2015
40
Tiemann, P. W., & Markle, S. M. (1991). Analyzing instructional content. Champaign, IL: Stipes Publishing Company.
Vargas, J. (2009). Behavior analysis for effective teaching. New York: Routledge.Vaughn, S., & Linan-Thompson, S. (2003). What is special about special education for students
with learning disabilities? Journal of Special Education, 37, 140-147.Waldron, N. L., Parke, J., & McLeskey, J. (2014). How are data systems used in inclusive schools?
In J. McLeskey, N. L. Waldron, F. Spooner, & B. Algozzine (Eds), Handbook of Effec-tive Inclusive Schools: Research and Practice (pp. 155-166). New York, NY: Routledge.
White, O. R., & Haring, N. G. (1980). Exceptional teaching (2nd Ed.). Columbus, OH: Merrill.Woodcock, R. W., McGrew, K. S., & Mather, N. (2001). Woodcock Johnson III Tests of Achieve-
ment®. Chicago, IL: Riverside Publishing.
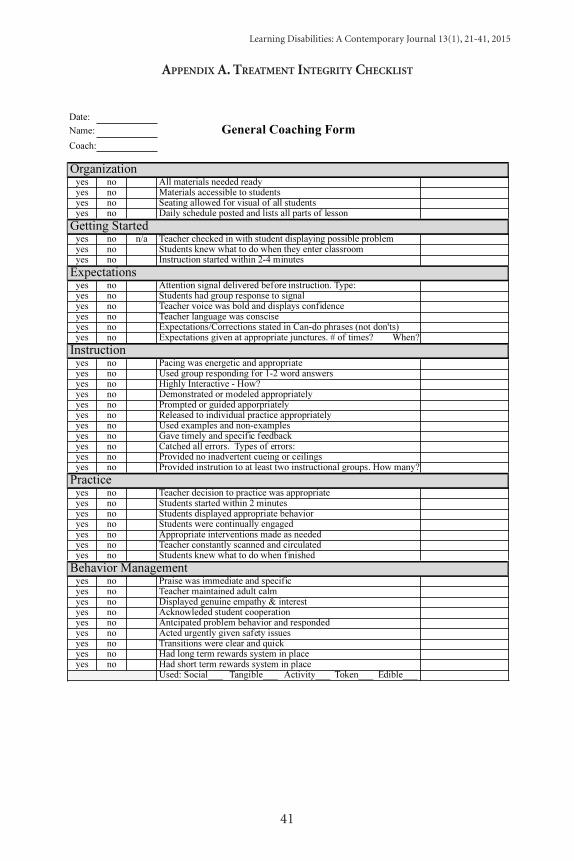
Learning Disabilities: A Contemporary Journal 13(1), 21-41, 2015
41
AppendIx A. treAtment IntegrIty checklIst
A MODEL OF MTSS INTEGRATING PRECISION TEACHING
40
Appendix A. Treatment Integrity Checklist

www.readspeaker.com
Give your website a voiceOffer an alternative way toaccess your online content:
listening to it!ReadSpeaker speech-enables online
content, on PC or mobile
ReadSpeaker1600 Tysons Blvd., Floor 8McLean, Virginia 22102 Phone: 703 657 7801 | [email protected]
Available in more than 30 languages
Learning Disabilities: A Contemporary Journal 13(1), 43-57, 2015 Copyright @ by LDW 2015
*Please send correspondence to: Cheryl A. Utley, University of Illinois-Chicago, Department of Special Educa-tion, College of Education, 1040 West Harrison Street, Chicago, IL 60607 USA, Email: [email protected].
Measuring the Cool Tool as a Targeted Intervention to Minimize Teacher Reprimands
and Students’ On-Task Behaviors in an Urban Elementary School
Cheryl A. Utley University of Illinois-Chicago (USA)
Festus E. ObiakorValdosta State University, Valdosta, GA (USA)
This study measured the effects of a targeted intervention, The Cool Tool, implemented in the secondary prevention tier to minimize teacher reprimands and students’ on-task behaviors in an urban elementary school. The participants in the social skills intervention programs were seven teachers, across grades K-5. Assessments included pre-posttest classroom observations to measure teacher praise versus reprimand and students’ on versus off task behaviors. Data on the effects of the social skills program showed that teachers did not increase their rates of praise statements toward students, however, levels of students’ on task behaviors increased following the implementation of a social skill program.
Keywords: Targeted Intervention, Social Skills, Teacher Praise, Stu-dents’ On/Off Task Behaviors
IntroductIon
Consistently, the research literature has documented disproportional-ity among students of different racial and ethnic backgrounds in special education. Learning disability (LD) identifications are not distributed proportionately through-out the school population. Although previous literature has tended to focus on the disproportional identification of African American students with cognitive disability and emotional disturbance (Obiakor, 2001, 2006, 2007; Obiakor et al., 2004; Skiba et al., 2008; Skiba, Shure, & Williams, 2012), there is evidence to suggest that the gap between African American and White students in rates of identification with LD have increased since the 1970s, with African American students being increasingly more likely to be identified (Oswald et al., 1999; U.S. Department of Education, 2010); Asian students are at lower risk than White students of being in receipt of special edu-cation services for LD (U.S. Department of Education, 2010). Research shows that English Language Learners (ELLs) are typically either over-represented or under-represented in district special education programs across the U.S. The ELL popula-tion percentages are disproportionate when compared to their English speaking peer populations’ percentages. Research demonstrates that ELLs with the least amount of language support are most likely to be referred to special education. ELLs receiving all of their instruction in English were almost three times as likely to be in special educa-tion as those receiving some native language support (Artiles et al., 2005).
Learning Disabilities: A Contemporary Journal 13(1), 43-57, 2015
44
Researchers have noted that disproportionality is a complex phenomenon and is influenced by a number of factors (e.g., poverty, schools, multiple risk factors) (see Obiakor et al., 2004; Skiba et al., 2008). Urban students who are at-risk for being labeled as LD often come to school with interpersonal issues and antisocial behaviors (e.g., hitting, lying, and aggression) that interfere with the teachers’ strategies to focus their attention on academic instruction. These students who are at-risk for being la-beled as LD may experience emotional, behavioral, and interpersonal issues with gen-eral educators that may impede academic achievement gains and the development of pro-social skills (Bullis, Walker, & Sprague, 2001; Utley, Obiakor, & Bakken, 2011; Vaughn et al., 2010). Shifrer, Muller, & Callahan (2011) noted that “disproportionate identification with a learning disability is perceived to be one of the central problems within special education for several reasons: (a) students may be referred to special education in response to issues other than a LD, (b) the identification process may be inconsistent and/or inaccurate, and (c) the disproportionately under-identified may not receive needed services.” (p. 247) Unfortunately, little research is available on empirically-validated interventions to decrease racial and ethnic disproportionate student academic and behavioral outcomes (e.g., Skiba et al. 2008; Utley, Obiakor, & Bakken, 2011).
Evidence-based programs and interventions targeting special education programs fall within a multi-tiered system of support (MTSS) which consists of in-creased instructional time, interventions, and improved educational outcomes for students in general and special education. The National Association of School Psy-chologist (NASP) Position Statement, “Appropriate Behavioral, Social, and Emotional Supports to Meet the Needs of All Students” (NASP, 2009) recommended the MTSS comprehensive framework to address the academic, social, emotional, and behavioral development of children and youth. The MTTS framework consists of principles of response-to-intervention (RTI) and positive behavioral interventions and supports (PBIS) and integrates a continuum of system-wide resources, strategies, structures, and evidence-based practices for addressing barriers to student learning and disci-pline. Sugai and Horner (2009) identified the following features of the MTTS model: (a) interventions supported by scientifically based research; (b) interventions orga-nized along a tiered continuum that increases in intensity (e.g., frequency, duration, individualization, specialized supports); (c) standardized problem solving protocol for assessment and instructional decision making; (d) explicit databased decision rules for assessing student progress and making instructional and intervention ad-justments; (e) emphasis on assessing and ensuring implementation integrity; and (f) regular and systematic screening for early identification.
Within the MTTS model, one educational approach to solving problem behaviors in school-aged populations is the implementation of school-wide posi-tive behavior support (SWPBS). Features of a successful SWPBS program includes implementing (a) positive behavioral expectations, (b) specific methods to teach these expectations to staff and students, (c) proactive supervision or monitoring of behaviors, (d) contingency management systems to reinforce and correct behavior, and (e) methods to measure outcomes and to evaluate progress (Luiselli, Putnam, & Sutherland, 2002; Taylor-Greene et al., 1997).
Learning Disabilities: A Contemporary Journal 13(1), 43-57, 2015
45
The SWPBS model has three tiers with specific core elements at the (1) pri-mary prevention/school-wide, including universal school-wide management strate-gies to reduce disruptive behavior and teach prosocial skills to all students; (2) se-condary prevention, including targeted or group-based intervention strategies for students at risk of developing more serious antisocial behaviors (about 5% to 10%); and (3) tertiary prevention, including functionally derived treatment strategies for the small number of students (about 1%-3%) who engage in more chronic patterns of antisocial behavior (Horner, Crone, & Stiller, 2001; Horner, Sugai, & Lewis, 2005; Lewis & Sugai, 1999; Irvin et al., 2007; Luiselli et al., 2005; Luiselli, Putnam, & Suther-land, 2002; Sugai et al., 2000).
Recently, targeted interventions at the secondary prevention level have recei-ved more attention as educators search for evidenced-based strategies to address pro-blem behaviors of students with LD. According to Todd, Campbell, Meyer, & Horner (2008), targeted interventions are designed to “provide efficient behavior support for students at risk of more intense problem behavior. Three elements have been identi-fied as key to effective, targeted interventions: organizational systems, intervention practices, and data use. Intervention practices include strategies such as social skills training that focus on teaching the student (a) appropriate social skills, (b) when to use the skill, and (c) routines for using the targeted intervention” (pp. 46-47). The acquisition and learning of social skills occurs through the environmental interac-tions of parents, peers, and significant others. Thus, social skills are learned behaviors that require individuals to evaluate situations, choose social skills, and perform so-cial tasks. The pedagogical practices (modeling/demonstrations, positive and negative feedback, student-centered learning, activation and use of participants’ background knowledge, maintenance/generalization strategies, and inclusion of community in training) have been identified as effective (Cartledge & Koureau, 2008).
School data variables may include individual student progress (e.g., on task versus off task data) and teacher variables (e.g., praise versus reprimand). Research conducted by Witzel and Mercer (2003) revealed that “students who received contin-gent verbal praise (praise given only for appropriate student behaviors and not for general tasks) demonstrated significantly higher intrinsic motivation, as measured by both time on task and attitudes, than did the students who received no contingent verbal praise” (p. 88). More than two decades ago, research by Alber, Craft, & Heward (1998) stated that contingent teacher praise and attention produced reliable and sig-nificant improvement in children’s behavior. Research has indicated highest behav-ioral benefits when the ratio of praises to reprimands is in excess of 5:1 (Partin, 2010).
The primary purpose of this article is to present data measuring the imple-mentation of a targeted intervention (i.e., social skills instruction) at the secondary (classroom) prevention tier of a PBIS program conducted in an urban elementary school. The major research questions that guided this study were: (1) To what extent does a social skills program implemented at the targeted level in the classroom im-prove teacher behaviors (praise versus reprimand)? (2) To what extent does a social skills program implemented at the targeted intervention level in the general educa-tion classroom improve students’ on-task behaviors?
Learning Disabilities: A Contemporary Journal 13(1), 43-57, 2015
46
Method
Participants and SettingsThe school’s composition consisted of 335 students enrolled in grades kin-
dergarten through 5th grade. The student population in the school was Hispanic (68%), followed by African American (24%), White (4%), and Other (4%). The gen-der breakdown was 52% (female) and 48% (male), respectively. The ethnic/racial composition of the teaching staff was White (68%), Hispanic (19%), and African American (13%). The participants in the social skills intervention programs were seven teachers, across grades K-5.
School-wide Behavioral Expectations and SkillsThe teachers and research staff discussed the problem behaviors of students
in the classroom and school. The 5 most troubling problem behaviors of students were: (1) an inability to focus and complete tasks/assignments, (2) poor attitudes to-ward school, (3) attention seeking, escape, and avoidance behaviors (e.g., out of seat), (4) disruptive and destructive behaviors, and (5) not listening to adults. Additional group meetings with the research staff and teachers were held to: (a) provide an over-view of social skills strategies, (b) discuss behavioral expectations and skills, and (c) outline a schedule of the program.
Two behavioral expectations and skills were agreed upon by teachers and research staff: (1) Be Respectful of Others and Self, and (2) Be Safe. The skills for Be Re-spectful of Others and Self consisted of (a) always doing your best, (b) listening to the teacher and following directions, and (c) respecting yourself and others. The skills for Be Safe consisted of (a) keeping feet and hands to self, and (b) walking at all times in the school and classroom.
Social Skill Intervention Training Program The social skill intervention program involved 7 out of the 14 tea-
chers in the school. Based upon school-wide observation data, teachers whose praise vs. reprimand ratios and students’ on-task behaviors were below the school’s avera-ged scores of 90% participated in the intervention program.
Social Skill Strategy. The Cool Tool, a six-week group-based social skill strategies, was adapted to teach behavioral expectations and skills (Langland, Le-wis-Palmer, & Sugai, 1998). Instructional components of the Cool Tool consisted of (a) teaching appropriate skills and de-emphasizing inappropriate behaviors; (b) systematic teaching of social skills; (c) personalization of instruction to fit the class-room environment; and (d) elimination of extensive teacher preparation. The lesson format for teaching behavioral expectations and skills consisted of (a) a skill name to label and communicate specific behaviors and activities; (b) teaching examples and non-examples across a number of contexts in which a social skill should be applied (e.g., classroom, and hallway), (c) implementing student activities (e.g., role playing), and (d) implementing after the lesson activities to enhance acquisition, build fluency, and facilitate generalization and maintenance of skills. These activities involved the use of pre-corrections, prompts, reminders, tokens, and teacher praise. (See Figure 1)
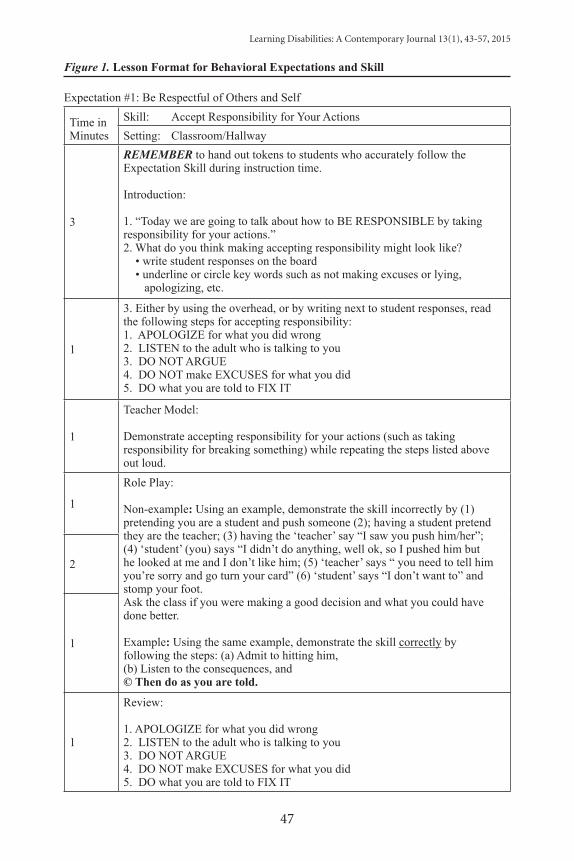
Learning Disabilities: A Contemporary Journal 13(1), 43-57, 2015
47
Figure 1. Lesson Format for Behavioral Expectations and Skill
Expectation #1: Be Respectful of Others and Self
Time in Minutes
Skill: Accept Responsibility for Your ActionsSetting: Classroom/Hallway
3
REMEMBER to hand out tokens to students who accurately follow the Expectation Skill during instruction time.
Introduction:
1. “Today we are going to talk about how to BE RESPONSIBLE by taking responsibility for your actions.”2. What do you think making accepting responsibility might look like? • write student responses on the board • underline or circle key words such as not making excuses or lying, apologizing, etc.
1
3. Either by using the overhead, or by writing next to student responses, read the following steps for accepting responsibility: 1. APOLOGIZE for what you did wrong2. LISTEN to the adult who is talking to you3. DO NOT ARGUE4. DO NOT make EXCUSES for what you did5. DO what you are told to FIX IT
1
Teacher Model:
Demonstrate accepting responsibility for your actions (such as taking responsibility for breaking something) while repeating the steps listed above out loud.
1
Role Play:
Non-example: Using an example, demonstrate the skill incorrectly by (1) pretending you are a student and push someone (2); having a student pretend they are the teacher; (3) having the ‘teacher’ say “I saw you push him/her”; (4) ‘student’ (you) says “I didn’t do anything, well ok, so I pushed him but he looked at me and I don’t like him; (5) ‘teacher’ says “ you need to tell him you’re sorry and go turn your card” (6) ‘student’ says “I don’t want to” and stomp your foot.Ask the class if you were making a good decision and what you could have done better.
Example: Using the same example, demonstrate the skill correctly by following the steps: (a) Admit to hitting him, (b) Listen to the consequences, and © Then do as you are told.
2
1
1
Review:
1. APOLOGIZE for what you did wrong2. LISTEN to the adult who is talking to you3. DO NOT ARGUE4. DO NOT make EXCUSES for what you did5. DO what you are told to FIX IT
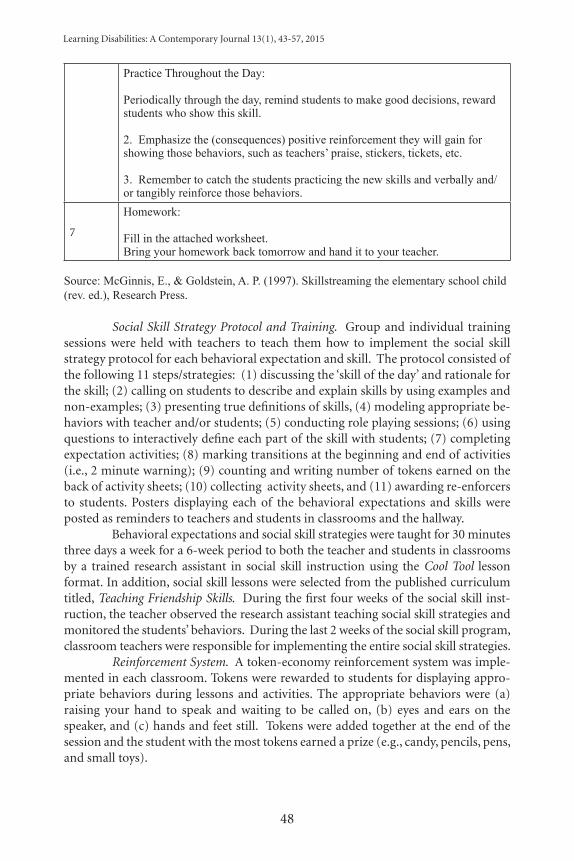
Learning Disabilities: A Contemporary Journal 13(1), 43-57, 2015
48
Practice Throughout the Day:
Periodically through the day, remind students to make good decisions, reward students who show this skill.
2. Emphasize the (consequences) positive reinforcement they will gain for showing those behaviors, such as teachers’ praise, stickers, tickets, etc.
3. Remember to catch the students practicing the new skills and verbally and/or tangibly reinforce those behaviors.
7
Homework:
Fill in the attached worksheet. Bring your homework back tomorrow and hand it to your teacher.
Source: McGinnis, E., & Goldstein, A. P. (1997). Skillstreaming the elementary school child (rev. ed.), Research Press.
Social Skill Strategy Protocol and Training. Group and individual training sessions were held with teachers to teach them how to implement the social skill strategy protocol for each behavioral expectation and skill. The protocol consisted of the following 11 steps/strategies: (1) discussing the ‘skill of the day’ and rationale for the skill; (2) calling on students to describe and explain skills by using examples and non-examples; (3) presenting true definitions of skills, (4) modeling appropriate be-haviors with teacher and/or students; (5) conducting role playing sessions; (6) using questions to interactively define each part of the skill with students; (7) completing expectation activities; (8) marking transitions at the beginning and end of activities (i.e., 2 minute warning); (9) counting and writing number of tokens earned on the back of activity sheets; (10) collecting activity sheets, and (11) awarding re-enforcers to students. Posters displaying each of the behavioral expectations and skills were posted as reminders to teachers and students in classrooms and the hallway.
Behavioral expectations and social skill strategies were taught for 30 minutes three days a week for a 6-week period to both the teacher and students in classrooms by a trained research assistant in social skill instruction using the Cool Tool lesson format. In addition, social skill lessons were selected from the published curriculum titled, Teaching Friendship Skills. During the first four weeks of the social skill inst-ruction, the teacher observed the research assistant teaching social skill strategies and monitored the students’ behaviors. During the last 2 weeks of the social skill program, classroom teachers were responsible for implementing the entire social skill strategies.
Reinforcement System. A token-economy reinforcement system was imple-mented in each classroom. Tokens were rewarded to students for displaying appro-priate behaviors during lessons and activities. The appropriate behaviors were (a) raising your hand to speak and waiting to be called on, (b) eyes and ears on the speaker, and (c) hands and feet still. Tokens were added together at the end of the session and the student with the most tokens earned a prize (e.g., candy, pencils, pens, and small toys).
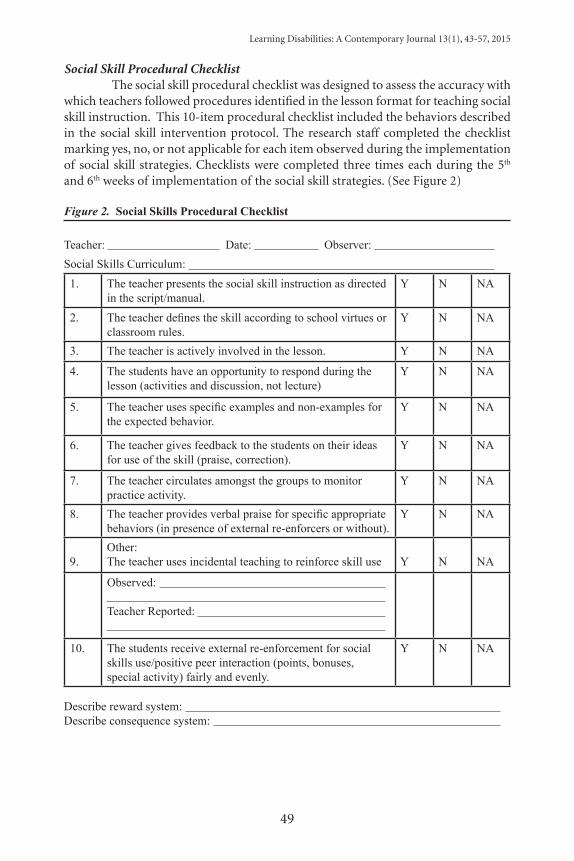
Learning Disabilities: A Contemporary Journal 13(1), 43-57, 2015
49
Social Skill Procedural ChecklistThe social skill procedural checklist was designed to assess the accuracy with
which teachers followed procedures identified in the lesson format for teaching social skill instruction. This 10-item procedural checklist included the behaviors described in the social skill intervention protocol. The research staff completed the checklist marking yes, no, or not applicable for each item observed during the implementation of social skill strategies. Checklists were completed three times each during the 5th and 6th weeks of implementation of the social skill strategies. (See Figure 2)
Figure 2. Social Skills Procedural Checklist
Teacher: Date: Observer: Social Skills Curriculum:
1. The teacher presents the social skill instruction as directed in the script/manual.
Y N NA
2. The teacher defines the skill according to school virtues or classroom rules.
Y N NA
3. The teacher is actively involved in the lesson. Y N NA
4. The students have an opportunity to respond during the lesson (activities and discussion, not lecture)
Y N NA
5. The teacher uses specific examples and non-examples for the expected behavior.
Y N NA
6. The teacher gives feedback to the students on their ideas for use of the skill (praise, correction).
Y N NA
7. The teacher circulates amongst the groups to monitor practice activity.
Y N NA
8. The teacher provides verbal praise for specific appropriate behaviors (in presence of external re-enforcers or without).
Y N NA
9.Other:The teacher uses incidental teaching to reinforce skill use Y N NA
Observed: Teacher Reported:
10. The students receive external re-enforcement for social skills use/positive peer interaction (points, bonuses, special activity) fairly and evenly.
Y N NA
Describe reward system: Describe consequence system:
Learning Disabilities: A Contemporary Journal 13(1), 43-57, 2015
50
Measurement of School-wide ObservationsClassroom observations of teachers and students. The benchmark for determi-
ning the average teacher praise vs. reprimand ratio for a classroom is 5:1 (Sutherland, Wehby, & Yoder, 2002). In this study, two classroom observations were conducted across grades kindergarten through 5th grade with 14 teachers to determine the aver-age school-wide teacher praise vs. reprimand ratio. The results of aggregated data showed that the averaged school-wide teacher praise vs. reprimand ratio was 3.2:1.
In the research literature, the benchmark for student on/task behavior is 85% (Lewis, 2006). In this study, two classroom observations were conducted across each grade from kindergarten through 5th grade with approximately 14 teachers to determine the school-wide averaged students’ on task versus off task behaviors. The averaged student on-task behavior was 77%; the averaged student off-task behavior was 23%.
Measurement of Teacher and Student BehaviorsObservation training procedures and reliability. Direct classroom observa-
tions were conducted by trained research assistants and doctoral students employed at a large research institution. Training procedures consisted of reliability sessions until three consecutive sessions at 80% or higher were completed across each obser-vation measure and social skills procedural checklist. Inter-observer agreement for conducting observations of students’ on-task/off-task behaviors, and teacher’s praise/reprimands were obtained with a second observer in the classroom. The reliability observer also completed the social skills procedural checklist for teachers. Reliability across instruments was collected for 10% of the total observations and averaged at 96%. The inter-observer agreement score among observers for the procedural check-list was 99.5%.
Teacher praise versus reprimand. Teacher praise/reprimand statements were observed and scored. The average ratio of praise and reprimand statements was com-puted over three 20 minute observations with a timed stopwatch. During each clas-sroom observations, tallies (e.g., ‘I’ for individual teacher praise or reprimand; ‘G’ for group teacher praise or reprimand) were used to count praises or reprimands du-ring 1-minute intervals for 20 minutes with a timed stopwatch. Observations varied across subject matter and consisted of three 20 minute intervals. The average ratio of praise statements was computed by adding all tallies from each the 1-minute intervals praise category and rationed against the total number of reprimands. The average ratio of reprimand statements was computed by adding all tallies from each of the 1-minute and rationed against the total number of praise statements. The ratio of teacher praise versus reprimand statements was computed on a number:1 ratio basis by dividing each number by the second number.
Students’ on-task versus off-task behaviors. This observation instrument was based upon a coding system that measured (a) classroom activities (e.g., group and individual student behaviors), (b) classroom transitions, (c) teacher behaviors (e.g., attention, instruction, praise, and reprimand), and (d) behavior (e.g., students’ be-haviors in a specified group). To determine the percentage of time students were on/off task, the teacher divided students into groups by their location in the classroom. Group on-task versus off-task students’ behaviors were recorded during 20-minute
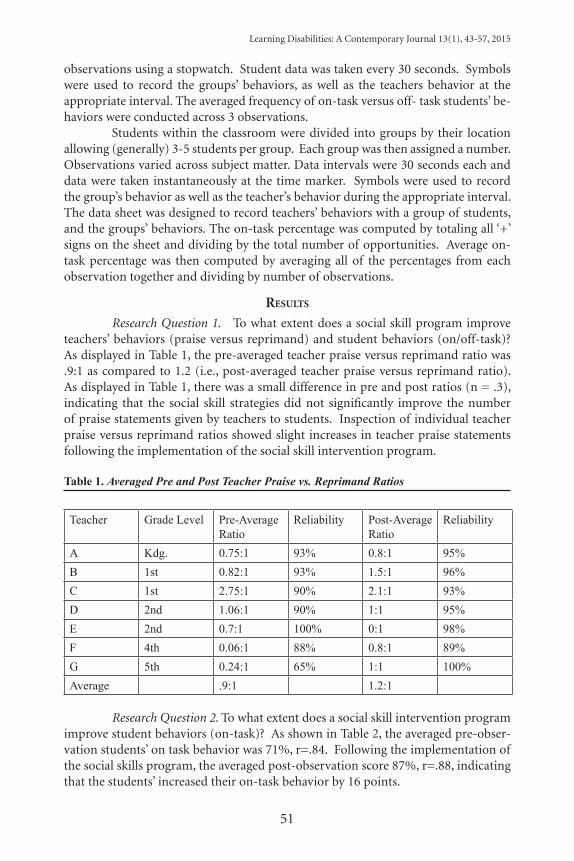
Learning Disabilities: A Contemporary Journal 13(1), 43-57, 2015
51
observations using a stopwatch. Student data was taken every 30 seconds. Symbols were used to record the groups’ behaviors, as well as the teachers behavior at the appropriate interval. The averaged frequency of on-task versus off- task students’ be-haviors were conducted across 3 observations.
Students within the classroom were divided into groups by their location allowing (generally) 3-5 students per group. Each group was then assigned a number. Observations varied across subject matter. Data intervals were 30 seconds each and data were taken instantaneously at the time marker. Symbols were used to record the group’s behavior as well as the teacher’s behavior during the appropriate interval. The data sheet was designed to record teachers’ behaviors with a group of students, and the groups’ behaviors. The on-task percentage was computed by totaling all ‘+’ signs on the sheet and dividing by the total number of opportunities. Average on-task percentage was then computed by averaging all of the percentages from each observation together and dividing by number of observations.
results
Research Question 1. To what extent does a social skill program improve teachers’ behaviors (praise versus reprimand) and student behaviors (on/off-task)? As displayed in Table 1, the pre-averaged teacher praise versus reprimand ratio was .9:1 as compared to 1.2 (i.e., post-averaged teacher praise versus reprimand ratio). As displayed in Table 1, there was a small difference in pre and post ratios (n = .3), indicating that the social skill strategies did not significantly improve the number of praise statements given by teachers to students. Inspection of individual teacher praise versus reprimand ratios showed slight increases in teacher praise statements following the implementation of the social skill intervention program.
Table 1. Averaged Pre and Post Teacher Praise vs. Reprimand Ratios
Teacher Grade Level Pre-Average Ratio
Reliability Post-AverageRatio
Reliability
A Kdg. 0.75:1 93% 0.8:1 95%B 1st 0.82:1 93% 1.5:1 96%C 1st 2.75:1 90% 2.1:1 93%D 2nd 1.06:1 90% 1:1 95%E 2nd 0.7:1 100% 0:1 98%F 4th 0.06:1 88% 0.8:1 89%G 5th 0.24:1 65% 1:1 100%Average .9:1 1.2:1
Research Question 2. To what extent does a social skill intervention program improve student behaviors (on-task)? As shown in Table 2, the averaged pre-obser-vation students’ on task behavior was 71%, r=.84. Following the implementation of the social skills program, the averaged post-observation score 87%, r=.88, indicating that the students’ increased their on-task behavior by 16 points.
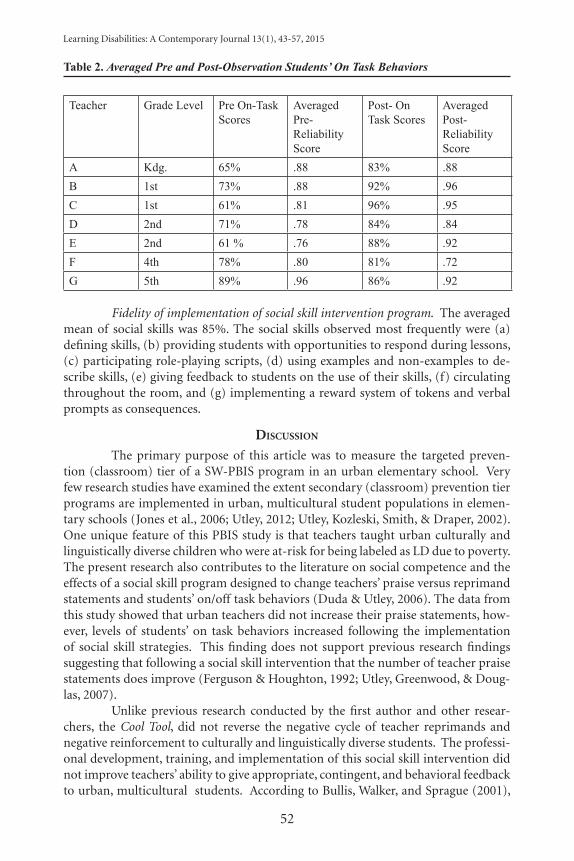
Learning Disabilities: A Contemporary Journal 13(1), 43-57, 2015
52
Table 2. Averaged Pre and Post-Observation Students’ On Task Behaviors
Teacher Grade Level Pre On-Task Scores
Averaged Pre-Reliability Score
Post- On Task Scores
Averaged Post-Reliability Score
A Kdg. 65% .88 83% .88B 1st 73% .88 92% .96C 1st 61% .81 96% .95D 2nd 71% .78 84% .84E 2nd 61 % .76 88% .92F 4th 78% .80 81% .72G 5th 89% .96 86% .92
Fidelity of implementation of social skill intervention program. The averaged mean of social skills was 85%. The social skills observed most frequently were (a) defining skills, (b) providing students with opportunities to respond during lessons, (c) participating role-playing scripts, (d) using examples and non-examples to de-scribe skills, (e) giving feedback to students on the use of their skills, (f) circulating throughout the room, and (g) implementing a reward system of tokens and verbal prompts as consequences.
dIscussIon
The primary purpose of this article was to measure the targeted preven-tion (classroom) tier of a SW-PBIS program in an urban elementary school. Very few research studies have examined the extent secondary (classroom) prevention tier programs are implemented in urban, multicultural student populations in elemen-tary schools (Jones et al., 2006; Utley, 2012; Utley, Kozleski, Smith, & Draper, 2002). One unique feature of this PBIS study is that teachers taught urban culturally and linguistically diverse children who were at-risk for being labeled as LD due to poverty. The present research also contributes to the literature on social competence and the effects of a social skill program designed to change teachers’ praise versus reprimand statements and students’ on/off task behaviors (Duda & Utley, 2006). The data from this study showed that urban teachers did not increase their praise statements, how-ever, levels of students’ on task behaviors increased following the implementation of social skill strategies. This finding does not support previous research findings suggesting that following a social skill intervention that the number of teacher praise statements does improve (Ferguson & Houghton, 1992; Utley, Greenwood, & Doug-las, 2007).
Unlike previous research conducted by the first author and other resear-chers, the Cool Tool, did not reverse the negative cycle of teacher reprimands and negative reinforcement to culturally and linguistically diverse students. The professi-onal development, training, and implementation of this social skill intervention did not improve teachers’ ability to give appropriate, contingent, and behavioral feedback to urban, multicultural students. According to Bullis, Walker, and Sprague (2001),
Learning Disabilities: A Contemporary Journal 13(1), 43-57, 2015
53
the length and intensity of the social skill intervention have significant effects on pro-ducing short-and long-term consequences. These authors noted that social skill trai-ning programs are “conceptualized in terms of weeks, rather than months or years, an exposure that is simply too weak, in most cases, to impact at-risk or antisocial child-ren in an enduring, positive way. For example, social skill training (SST) frequently is offered much like a class or a set of therapeutic meetings with a finite and relatively short-term duration (e.g., a few weeks to a few months); and instruction is cons-trained to the classroom setting and usually does not include training in the target environments (e.g., the general school setting, community, or employment.” (p. 71).
A second plausible reason for the lack of significant effects of the social skill intervention program on increasing teacher praises with culturally and linguistically diverse at-risk students is that this intervention is an integral piece of a multiple, comprehensive intervention, family support, and academic program, and not a sin-gular or isolated intervention. In this study, the length and duration of the social skill strategies were not offered over a substantial period of time and with sufficient intensity to alter teacher behaviors. In addition, social skill strategies must be embed-ded as a multi-component intervention within the academic program and viewed by teachers as a necessary and critical component of the teaching-learning program.
A third plausible reason for the insignificant difference or change between pre and post ratios in teacher praises is that the social skill intervention provided minimal support to prevent or ameliorate antisocial behaviors in culturally and lin-guistically diverse at-risk students. Gresham (1998) noted that the meta-analyses of the efficacy of social skill intervention studies, conducted in the 1990s, produced a magnitude of treatment effects averaging (0.35), range = 0.20-0.47, this range of ef-fect sizes generally defines weak to moderate treatment outcomes in the professional literature (Bullis, Walker, & Sprague, 2001; Gresham, 1998). More recently, Losel and Beelmann (2003) conducted a meta-analysis of social skills training programs as a measure of preventing antisocial behaviors in children and youth. The results of this meta-analysis showed that (a) the best estimated mean effects were d = .38 (post-in-tervention) and .28 (follow-up); (b) effects were smaller on antisocial behavior than on related social and cognitive measures; (c) empirical studies with large samples produced lower effect sizes than those with smaller samples; and (d) programs target-ing at-risk groups had better effects than universal programs.
A fourth plausible reason for the small change in teacher praise versus rep-rimand ratios is that of cultural discontinuities in a host of variables: the school culture, teachers’ perceptions, and teacher’s level of cultural competence in teaching social skills. Cartledge and Loe (1991) noted that “the culture of the school often aggravates rather than remedies the social skill problems of students from cultural-ly diverse backgrounds…competitive, non-affirming, unattractive, and inadequate school environments do little to promote students‘ self-regard and undoubtedly con-tribute to disruptive, antisocial behaviors” (p. 34). These authors further stated that teachers’ perceptions influence expectations and judgments about students‘ abilities, effort, and progress in school, thus leading to child-deficit assumptions. Lastly, these researchers expressed the need for educators to make a conscious effort to become cross-culturally competent in order to (a) understand and respect the cultural back-grounds of their students; (b) become skilled in their perceptions of culturally specific
Learning Disabilities: A Contemporary Journal 13(1), 43-57, 2015
54
behaviors of their students; and (c) distinguish culturally specific characteristics that reflect learning and problem behaviors from categories of exceptionality (e.g., learning disabilities, behavior disorders). Further research is needed in order to examine cul-turally responsive teaching in relation to the implementation of social skills strategies.
Of the few published studies using direct observation procedures, a positive outcome of the implementation of social skill strategies in this study was that stu-dents’ levels of on-task behavior increased, thus, reducing their disruptive behavior (e.g., Ferguson & Houghton, 1992; Lane et al., 2003; Miller, Lane, & Wehby, 2005). Implications of this study are that the relatively direct observations and/or the analy-sis of students’ classroom behaviors are needed when evaluating social skill strategies and intervention programs. In addition, results of this study also imply that direct teaching, modeling, supportive feedback, and opportunities to practice new social skills are beneficial to culturally and linguistically diverse at-risk students.
Limitations and Recommendations for Future ResearchThe first limitation in this study was that the whole school was the unit of
analysis and we did not compare the effects of the PBIS intervention using a variety of measures in more than one treatment school and comparison schools. To measure whole school effects, it is recommended that the sample in future studies be ran-domly selected with a large number of relatively equally matched schools for the PBIS intervention and a control versus comparison group of schools. Second, significant effects of the PBIS intervention must be conducted over a multi-year period. Third, statistical analysis of the data did not examine individual students in the PBIS inter-vention. Fourth, because discipline referrals in the school were low, the study did not include this variable as an outcome measure. Additional collateral measures should include students’ opinions using rating scales to measure school safety and fairness of the PBIS program, to mention a few.
Based upon this study, we propose the following recommendations: (1) a professional development program focused on attributes of effective urban teachers, one that is culturally responsive in nature; (2) the examination of critical teacher behaviors, assessment, and teaching practices in a culturally responsive framework in relation to student outcomes (i.e., academic, discipline and classroom management); (3) continued direct observation and classroom-based research focused on teacher-student interactions as measured by teacher praise vs. reprimands; (4) support for teachers in the training and implementation of PBIS strategies at the individual stu-dent level; and (5) reconceptualization of the social skills intervention training pro-gram and strategies in terms of length and intensity with delivery within key target settings; and embedded within the traditional academic program.
references
Alber, S. R., Craft, M. A., & Heard, W. L. (1998). Teaching elementary students with develop-mental disabilities to recruit teacher attention in a general education classroom: Effects of teacher praise and academic productivity. Journal of Applied Behavior Analysis, 31, 399-415.
Artiles, A.A., Rueda, R., Salazar, J. & Higareda, I. (2005). Within-group diversity in minori-ty disproportionate representation: English Language Learners in urban school districts. Exceptional Children, 71, 283-300.
Learning Disabilities: A Contemporary Journal 13(1), 43-57, 2015
55
Bullis, M., Walker, H., & Sprague, J. (2001). A promise unfulfilled: Social skills training with at-risk and antisocial children and youth. Exceptionality, 9, 67-90.
Cartledge, G., & Kourea, L. (2008). Culturally responsive classrooms for culturally diverse students and at risk for disabilities. Exceptional Children, 74, 351-371.
Cartledge, G., & Loe, S. (2001). Cultural diversity and social skill instruction. Exceptionality, 9, 33-46.
Duda, M.A., & Utley, C.A. (2006). Positive behavioral support for at-risk students: Promoting social competence in at-risk culturally diverse learners in urban schools. Multiple Voices, 8, 128-143.
Ferguson, E., & Houghton, S. (1992). The effects of contingent teacher praise, as specified by Canter’s assertive discipline programme, on children’s on-task behavior. Educational Studies, 18, 1-8.
Gresham, F. (1998). Social skills training: Should we raze, remodel, or rebuild? Behavioral Dis-orders, 24, 19-25.
Horner, R. H., Crone, D.A., & Stiller, B. (2001). The role of school psychologists in establishing positive behavior support: Collaborating in systems change at the school-wide level. NASP Communique, 29, 10-12.
Horner, R. H., Sugai, G., & Lewis, P. T. (2005). School-wide PBS evaluation template. Eugene, OR: University of Oregon.
Irvin, L. K., Horner, R. A., Ingram, K., Todd, A. W., Sugai, G., Sampson, N. K., & Phillips, D. (2007). Is school-wide PBS an evidence-based practice: A research summary. Eugene, OR: University of Oregon.
Jones, C., Caravaca, L., Cizek, S., Horner, R. H., & Vincent, C. G. (2006). Culturally responsive school-wide positive behavior support: A case study in one school with a high pro-portion of Native American students. Multiple Voices, 9, 108-119.
Lane, K., Wehby, J., Menzies, H., Gregg, R. Doukas, G. & Munton, S. (2003). Social skills inst-ruction for students at risk for antisocial behavior: The effects of small group inst-ruction. Behavioral Disorders, 28, 229-248.
Langland, S., Lewis-Palmer, T., & Sugai, G. (1998). Teaching respect in the classroom: An in-structional approach. Journal of Behavioral Education, 8, 245-262.
Lewis, T. J., & Sugai, G. (1999). Effective behavior support: A systems approach to proactive school-wide management. Focus on Exceptional Children, 31, 1-24.
Losel, F., & Beelman, A. (2003). Effects of child skills training in preventing antisocial behavior: A systematic review of randomized evaluations. Annals of the American Academy of Political and Social Science, 587, 84-109.
Luiselli, J. K, Putnam, R. F, Handler, M. W, & Feinberg, A. B. (2005). Whole-school positive be-havior support: Effects on student discipline problems and academic performance. Educational Psychology, 25, 183-198.
Luiselli, J. Putnam, R., & Sutherland, M. (2002). Longitudinal evaluation of behavior support interventions in public middle school. Journal of Positive Behavior Interventions, 4, 182-188.
Miller, M., Lane, K., & Wehby, J. (2005). Social skills instruction for students with high-inci-dence disabilities: A school-based intervention to address acquisition deficits. Pre-venting School Failure, 49, 27-40.
National Association of School Psychologists. (2009). Appropriate academic supports to meet the needs of all students. Bethesda, MD: Author.
Obiakor, F. E. (2001). It even happens in “good” schools: Responding to cultural diversity in to-day’s classroom. Thousand Oaks, CA: Corwin Press.
Obiakor, F. E. (2006). Multicultural special education: Effective intervention for today’s school.Intervention in School and Clinic, 42, 148-155.
Obiakor, F. E. (2007). Multicultural special education: Culturally responsive teaching. Upper-Saddle River, NJ: Prentice-Hall.
Learning Disabilities: A Contemporary Journal 13(1), 43-57, 2015
56
Obiakor, F. E., Enwefa, S., Utley, C., Obi, S. O., Gwalla-Ogisi, M., & Enwefa, R. (2004). Serving culturally and linguistically diverse students with emotional and behavioral disorders. Arlington, VA: The Council for Children with Behavioral Disorders.
Oswald, D. P., Coutinho, M. J., Best, A. M., & Singh, N. N. (1999). Ethnic representation in spe-cial education: The influence of school related economic and demographic variables. The Journal of Special Education, 32, 194-206.
Partin, T.C. M. (2010). An analysis of teachers’ use of praise and reprimands in relation to stu-dent behavior. Unpublished Dissertation. Vanderbilt University, Nashville, TN.
Shifrer, D., Muller, C., & Callahan, R. (2011). Disproportionality and learning disabilities: Pars-ing apart race, socioeconomic status, and language. Journal of Learning Disabilities, 44, 246-257.
Skiba, R. J., Simmons, A. B., Ritter, S., Gibbs, A. C., Rausch, M. K., Cuadrado, J., & Chung, C. (2008). Achieving equity in special education: History, status, and current challenges. Exceptional Children, 74, 264-288.
Skiba, R. J., Shure, L., Williams, N. (2012). Racial and ethnic disproportionality in suspensi-on and expulsion. In A. L. Noltemeyer & C. S. McLoughlin, Disproportionality in Education and Special Education (pp. 89-118). Springfield, IL: Charles C. Thomas Publisher, Ltd.
Sugai, G., & Horner, R.H. (2009). Responsiveness-to-intervention and school-wide positive behavior supports: Integration of multi-tiered systems of support. Exceptionality: A Special Education Journal, 17, 223-247.
Sugai, G. S., Horner, R. H., Dunlap, G., Hieneman, M, Lewis-Palmer, T.J., Nelson, C. M., Scott, T., Liaupsin, C., Sailor, W., Turnbull, A. P., Turnbull III, H.R., Wickham, D., Wilcox, B., & Ruef, M. (2000). Applying positive behavior support and functional behavioral assessment in schools. Journal of Positive Behavior Interventions, 2,131-143.
Sutherland, K. S., Wehby, J. H., & Yoder, P. J. (2002). Examination of the relationship between teacher praise and opportunities for students with EBD to respond to academic re-quests. Journal of Emotional and Behavioral Disorders, 10, 5-13.
Taylor-Greene, S., Brown, D., Nelson, L., Longton, J., Gassman, Cohen, J., Swartz, J., Horner, R. H., Sugai, G., & Hall, S. (1997). School-wide behavioral support: Starting the year off right. Journal of Behavioral Education, 7, 99-112.
Todd, A., Campbell, A.L., Meyer, G.G., & Horner, R.H. (2008). The effects of a targeted inter-vention to reduce problem behaviors: Elementary school implementation of check in-check out. Journal of Positive Behavior Interventions, 10, 46-55.
U.S. Department of Education. (2010). 29th annual report to congress on the implementation of the Individuals with Disabilities Education Act, 2007. Washington, DC: Office of Special Education Programs.
Utley, C.A. (2012). Measuring cultural responsiveness in the classroom component of a school-wide model of positive behavior support at the elementary level. Multicul-tural Learning and Teaching, 7, 2161-2412.
Utley, C., Kozleski, E., Smith, A., & Draper, I. (2002). Positive behavior support: A proactive strategy for minimizing behavior problems in urban multicultural youth. Journal of Positive Behavior Interventions, 4, 196-207.
Utley, C.A., Greenwood, C.R., & Douglas, K, (2007). The effects of a social skills strategy on dis-ruptive and problem behavior in African American students in an urban elementary school: A pilot study. Multiple Voices, 10, 173-191.
Utley, C. A., Obiakor, F.E., & Bakken, J.P. (2011). Culturally responsive practices for culturally and linguistically diverse students with learning disabilities. Learning Disabilities: A Contemporary Journal, 9, 5-18.
Learning Disabilities: A Contemporary Journal 13(1), 43-57, 2015
57
Witzel, B. S., & Mercer, C. D. (2003). Using rewards to teach students with disabilities. Implica-tions for Motivation Remedial and Special Education, 24, 88-96.
AcknowledgeMent
The work was supported by a field-initiated grant (No. H324C020013) from the Office of Special Education Programs (OSEP), U.S., Department of Education, awarded to the University of Kansas. Opinions expressed herein are those of the authors and do not represent the position of the U.S. Department of Education.add U.S. Department of Education, awarded to the University of Kansas.
Authors’ note
Cheryl A. Utley, Ph.D., is an Adjunct Assistant Professor, Department of Special Education, University of Illinois-Chicago. Prior to this time, she was an As-sociate Research Professor, Juniper Gardens Children’s Project, University of Kan-sas. Her research interests include multicultural education, intervention research in general and special education classrooms, culturally responsive teaching and positive behavior supports. She is the former co-editor of Multiple Voices for Ethnically Di-verse Exceptional Learners. She has authored books and numerous articles on infus-ing multicultural education into special education. Correspondence concerning this article should be addressed to [email protected].
Festus E. Obiakor, Ph.D., is Department Head and Professor, Early Child-hood and Special Education, Dewar College of Education and Human Services, Val-dosta State University, Valdosta, Georgia. A teacher, scholar, and consultant, he has served as Distinguished Visiting Professor at a variety of universities. He is the author of more than 150 publications, including books, articles, and commentaries; and he has presented papers at many national and international conferences. He serves on the editorial boards of reputable nationally and internationally refereed journals, in-cluding Multicultural Learning and Teaching (MLT) in which he serves as Executive Editor. Dr. Obiakor is a leader who has been involved in many landmark scholarly works in the fields of general and special education, with particular focus on Af-rican American and other culturally and linguistically diverse (CLD) learners and he continues to prescribe multidimensional methods of assessment, teaching, and intervention for these individuals. Based on this premise, Dr. Obiakor created the Comprehensive Support Model (CSM), an intervention model that values the collab-orative, consultative, and cooperative energies of students, families, teachers/service providers, communities, and government agencies.

58
Learning Disabilities: A Contemporary Journal 13(1), 59-72, 2015 Copyright @ by LDW 2015
*Please send correspondence to: Rachel Freeman, Ph.D., University of Minnesota, Institute on Community Integration, 150 Pillsbury Dr. SE, 110 Pattee Hall, Minneapolis, MN 55455 USA, Email: [email protected].
Integration of Academic and Behavioral MTSS at the District Level using Implementation Science
Rachel FreemanUniversity of Minnesota, Minneapolis, MN (USA)
Dawn MillerShawnee Mission School District, Shawnee Mission, KS (USA)
Lori NewcomerUniversity of Missouri, Columbia, MO (USA)
The evolution of multi-tier systems of support (MTSS) for both aca-demics and behavior has reflected the diverse interests of those leading implementation efforts, the influence of various state and local regulatory requirements, and differing funding methods and priorities. These varia-tions have naturally led to many different pathways for implementing MTSS. Although the role of the district in MTSS has varied, many lead-ers in the field of education consider district leadership and involvement an essential component for successful MTSS implementation. District leadership in MTSS is used to provide schools with political and admin-istrative support, training and technical assistance, layered in-service curricula, data-based decision making systems for ongoing evaluation, and access to interagency relationships for supporting student health and wellbeing. This article addresses the key district mechanisms that are used to integrate academic and behavioral interventions as school personnel learn new strategies for improving outcomes for students.
Keywords: Multi-Tier Systems of Support, Academic Challenges, Behavioral Difficulties, Evaluation of School Programs.
IntroductIon
Two approaches for improving social and academic outcomes for students have gained national attention and are now implemented on a socially significant level: response to intervention and school-wide positive behavior support (Lane, Oakes, & Menzies, 2010; McIntosh & Goodman, in press; Stewart, Benner, Martella, & Marchand-Martella, 2007). Response to Intervention (RtI) is a tiered approach addressing all students within a school by providing the appropriate intensity of aca-demic support necessary for educational progress (Batsche et al., 2005). School-wide positive behavior support (SWPBS) uses three prevention tiers to organize effective social skills instruction and behavioral interventions along a continuum of increas-ing intensity (Sugai & Horner, 2009). A number of professionals are advocating for an integration of RtI and SWPBS (Hawken, Vincent, & Schumann, 2008; Lane et al., 2010; Utley & Obiaker, 2012; Walker, Ramsey, & Gresham, 2004), while some have indicated concern that these models tend to be implemented in isolation from one another (Stewart et al., 2007).
Both RtI and SWPBS are based on a public health model for prevention (WHO, 2004) and are tailored to meet the needs of each student to ensure academic
Learning Disabilities: A Contemporary Journal 13(1), 59-72, 2015
60
and social success (McIntosh, Horner, Chard, Boland, & Good, 2006). The imple-mentation tiers for both RtI and SWPBS include universal screening and supports for all students, tier two strategies for early intervention when students are not respond-ing to tier one, and intensive and individualized planning processes at tier three for students who are experiencing academic or behavioral challenges (Sugai et al., 2010). Additional practices that academic and behavioral multi-tier systems of support share include: (1) evidence-based curricular and instructional practices for all stu-dents, (2) a data-based framework for decision making, (3) use of a problem-solving process across all levels of the system, and (4) a team-based approach for leading, planning, and evaluating implementation efforts (Hawken et al., 2008).
In this article, we refer to the use of both RtI and SWPBS as multi-tier sys-tems of support (MTSS), the integration of several tiered implementation models into one coherent, combined system meant to address the layered domains of educa-tion including literacy and social competence (Lane, Menzies, Ennis, & Bezdek, 2013; McIntosh & Goodman, in press). We will describe the essential role of district-level leadership in addressing the effective and sustainable implementation of MTSS. The key features describing systems change mechanisms that can be used by district teams to integrate academic and behavioral interventions will be discussed with examples of how district and school leaders applied these strategies in order to improve out-comes for their students.
Challenges Encountered in Integrating MTSSThe National Association of State Directors of Special Education developed
a set of RtI blueprints that can be used by state, district, and building teams (Elliott & Morrison, 2008; Kurns & Tilly, 2008). These blueprints were designed to guide dis-trict and school teams throughout RtI implementation. The National Technical Assis-tance Center on Positive Behavioral Interventions and Supports (PBIS) (Sugai et al., 2010) also designed a tool for guiding state, district, and school teams implementing school-wide positive behavior support (SWPBS). Both the RtI and PBIS blueprints emphasize the use of consensus building among all stakeholders throughout the de-sign and coordination of MTSS. Topics the PBIS blueprint address include funding issues, visibility of efforts, political support, training systems, coaching capacity, and evaluation (George & Kincaid, 2008).
Differences in implementation stages. The manner in which RtI and SW-PBS implementation efforts are launched can create challenges for districts seeking to integrate academic and behavioral interventions. The evolution of a tiered system of support like SWPBS often reflects diverse funding methods, regulatory issues, and district priorities (Freeman, Perrin et al., 2009) leading to different pathways as MTSS has expanded across districts and schools. SWPBS may begin with a district train-ing for a small number of schools with a long-term plan to increase the number of buildings participating over time. Once SWPBS training systems are established, the district may initiate a tiered RtI model for reading starting with the involvement of el-ementary schools and later extending these interventions to middle and high schools and across math and other academic areas. Other school districts begin MTSS im-plementation with academic tiered reading and math interventions with a plan to initiate SWPBS later once school buildings have more experience implementing RtI.
Learning Disabilities: A Contemporary Journal 13(1), 59-72, 2015
61
In yet other cases, technical assistance efforts have introduced the two models in a concurrent manner with training systems that address academic and behavior tiered implementation.
District leadership and support. Schools implementing MTSS may ex-perience challenges related to district leadership and involvement. This can occur when state or district administrators make a public announcement that all schools will implement MTSS within the next several years without considering the planning and support systems that are necessary for proceeding forward (George & Kincaid, 2008). A newly hired superintendent introduces new initiatives within a district al-ready implementing MTSS, reallocating funding and creating tension as priorities at a district level suddenly shift. District-level involvement and commitment to MTSS can facilitate a school’s implementation efforts and improve outcomes when districts provide financial support, engage in joint problem solving, and support long-term systems change (Handler et al., 2007).
Communication across tiered implementation efforts. The importance of communication and collaboration across district support personnel is essential for integrated MTSS implementation. Challenges arise when implementation efforts taking place at the district level include academic and behavioral MTSS trainers who are not communicating and collaborating on a regular basis. An integrated approach for implementing MTSS is easier to accomplish with the direct involvement of dis-trict leaders who meet regularly to discuss implementation efforts, share data, design professional development, and establish integrated policies and practices for academ-ic and social competence. The next section of this article will describe the role of the district leadership team in the successful integration of MTSS planning.
The Role of the District in MTSSForming a district leadership team is an important step in MTSS. Individu-
als who participate in the district leadership team represent key stakeholders includ-ing district and school administrators, district support personnel, general and spe-cial education teachers, and other identified stakeholders (e.g. union representative, community liaison). It is important for district professionals representing instruction and curriculum, special education, title programs and other federal/state initiatives, student health, safe and drug free schools, school psychology and counseling, drop out prevention, character education, alternative programming, data and information management, evaluation, and multi-cultural and affirmative action to participate in the district planning process. Bus drivers, students, family members, mental health professionals, children and family services, and other community members are in-volved in the team process although the structures for communicating to larger stake-holder groups vary across districts. For instance, some district teams choose to hold larger forums once or twice a year to share and gather feedback from larger numbers of stakeholders while maintaining a smaller district leadership team that meets on a more frequent basis. Communication with the education board is coordinated by the district team with regular school presentations, data summaries, and information shared with board members throughout the year. In other districts, individual board members are invited to attend leadership meetings.
Learning Disabilities: A Contemporary Journal 13(1), 59-72, 2015
62
District leadership teams work together to create a comprehensive plan for confirming annual readiness and commitment of participating schools, coordinating academic and behavioral training, aligning district policies with MTSS, and evaluat-ing the effectiveness of these implementation efforts (George & Kincaid, 2008). A district coordinator guides MTSS, supports school teams, and gathers and summa-rizes evaluation data. The district coordinator role ensures that district leadership meetings occur regularly, agendas are prepared and meeting minutes recorded, data are collected and summarized across MTSS efforts, and training and technical assis-tance systems are organized (Sugai et al., 2010). The coordination of academic and behavioral training is based on roles that are established within the district. In some cases, the training for academic and behavioral MTSS are led by different district leaders with an overall MTSS coordinator whose role is to assist in integrating plan-ning efforts.
Layered MTSS trainings. Team-based trainings are organized to introduce SWPBS and academic RtI to schools with follow-up events used to support ongoing implementation over two or more years. Team members are selected to represent all of the stakeholders associated with the school. In SWPBS, building level teams participate in the training with representation that includes teachers from each grade level, special and general education staff members, school psychologists, counselors, paraprofessionals, cafeteria and janitorial staff members, mental health profession-als, students, family members, mental health and other community representation (Sugai et al., 2010). School teams preparing to implement academic RtI are similar in composition to its district counterpart; these teams include individuals responsible for launching new academic systems change and professionals with expertise in aca-demic areas targeted for intervention.
In some cases, schools establish a unified academic and behavior MTSS team while sending different individual school faculty to participate in SWPBS team training and RtI academic instructional events. These school teams may meet to-gether as a unified MTSS team throughout the year with the goal of integrating both RtI and SWPBS under the umbrella of school improvement. Other schools establish separate academic and behavioral team meetings with individual leaders assigned to each of the meetings as a communication link to share progress occurring within the different tiered models of implementation. In either scenario, the goal of MTSS is to gather information and bring it to all faculty to ensure consensus-driven action plan-ning occurs for academic and behavioral implementation.
SWPBS teams include an internal school coach who assists in facilitating meetings, prompting data collection, reaching out to family members and commu-nity, and meeting regularly with the district coordinator and coaches from other schools (Sugai et al., 2010). This coaching network provides an important framework for ensuring data are collected, communicating with the district coordinator, and providing school teams with a way in which to access support when problems arise. SWPBS coaches receive joint trainings and attend meetings with each other throughout the year (Freeman, Lohrmann et al., 2009). An overall goal for the district is to align all professional development systems with MTSS using a layered approach that re-flects the need for different types and intensity levels of training.
Learning Disabilities: A Contemporary Journal 13(1), 59-72, 2015
63
Awareness-level training information is used to introduce elements of MTSS to new school staff, administrators, family members, and the community. Introduc-tory presentations can be videotaped and posted on a district website and Power Point presentations shared using websites to post information for widespread use. Districts can support school teams by offering general introductory information for all new staff transitioning into the district. In-service curriculum should include skill-building opportunities reflecting different areas of expertise in order to build internal capacity for MTSS and address natural attrition that occurs within schools. Individ-ual school professionals in need of continuing education credits and other ongoing professional development can learn the skills necessary for interventions supporting students at secondary and tertiary prevention levels. The skills for facilitating intensive and individualized academic and behavioral interventions for students may require a smaller number of school staff members develop a high level of expertise to imple-ment interventions in reading, math, or other academic areas, or to facilitate positive behavior support planning. Academic and behavioral trainers are needed within the district to lead professional development efforts occurring at each of the layers of training. Districts can support schools by establishing curriculum for preparing school staff for key MTSS roles including coach training, introductory information for new school staff joining academic and/or behavioral teams, and for participation in tiers two and three team processes. Technology support at the district level provides access to key data collection systems. The types of technology used will also require ongoing systems for training and technical assistance in order to support school teams and the larger school faculty in learning how to utilize academic and behavioral data systems effectively over time.
District technology resources. Districts establish MTSS data collection systems in different ways. In some districts, the Dynamic Indicators of Basic Early Literacy Skills (DIBELS) serve as a universal screening in reading and math, as well as to monitor student progress over time (Dynamic Measurement Group, 2015). Train-ing and technical assistance is needed to first establish certified trainers available to expand DIBELS across schools and to support ongoing data-based decision making of school staff on an ongoing basis. Another type of evaluation data includes visual summaries of office discipline referrals (ODRs)- written documentation that occurs when a student misbehaves. An external software program can be used to gather, and summarize school-wide ODR patterns and to provide school teams with con-tinual access to visual summaries that are used for data-based decisions during meet-ings. One example of a software program that provides data for team-based decision making at all prevention tiers is referred to as the School-wide Information System (SWIS, 2015). The SWIS system provides schools with a way in which to organize and review ODRs, monitor a common tier two intervention referred to as Check in/Check out (Filter et al., 2007), and evaluate individual student problem behavior and positive social behavior at tier three (SWIS, 2015). Districts with technology person-nel and resources may decide to design an internal data collection system that will be used within the district for data-based decision making. Data from different types of process and outcome evaluation tools discussed later in this article can be included in district systems to make school improvement information easier for teams to access and use during MTSS self-assessment and action-planning meetings.
Learning Disabilities: A Contemporary Journal 13(1), 59-72, 2015
64
A number of districts use websites to organize, promote, and share informa-tion about MTSS. A district-level website provides school teams with examples of school-wide expectations and other universal interventions, tools and resources for implementation, and strategies for integrating academic and behavioral MTSS used by exemplary school teams. District websites provide access to detailed MTSS poli-cies and procedures defining fidelity of implementation at each tier and clearly ar-ticulating the district’s vision and mission. Easy access to technology programs, tools and training materials, newsletters for family and community members, examples of implementation efforts, awareness materials, and a calendar of events are available from the main district website. The degree to which website and technology-based supports are used as tools for MTSS implementation will vary based on the strengths of each district (e.g. access to technology expertise, funding available for develop-ment and posting content online, etc.). In summary, the role of the district in systems change is to create an infrastructure for training and technical assistance. The next section of this article describes how implementation science is used to design and maintain a district training and technical assistance infrastructure.
Integrating MTSS Efforts Using Implementation ScienceFixsen, Naoom, Blasé, Friedman, and Wallace (2005) describe the stages of
implementation that are commonly experienced by implementers of new practices such as MTSS. The exploration stage occurs when a district team has not yet started training and technical assistance and is still assessing the readiness of schools to move forward with an implementation effort. The installation stage involves the active se-lection of a new program, development of performance assessment processes, initial training efforts and securing of resources. The initial implementation stage reflects the early steps taken to introduce a new effort and often involves a learning curve as districts adjust and integrate new changes into daily work. Full implementation is achieved when over half of the school personnel targeted to change their practices do so with a high level of performance fidelity. Districts implementing MTSS may be experiencing different stages of implementation while implementing academic and behavioral interventions depending upon how the different tiered models were introduced.
Competency, Organizational, and Leadership Drivers Fixsen, Blasé, Naoom, and Wallace (2009) identified core components that
are commonly associated with successful implementation efforts irrespective of whether a project is implemented in education, mental health, juvenile justice, or any other human service setting. These core components are referred to as implementa-tion drivers (Metz & Bartley, 2012). The three major drivers: competency, organiza-tion, and leadership, are used to outline the essential components as they relate to academic and behavioral MTSS.
Competency DriversCompetency drivers are the activities, mechanisms, and resources that are
needed to improve the necessary knowledge and skills of teachers and administrators implementing MTSS (Fixsen, Blasé, Naoom, & Van Dyke, 2010). The four competency drivers include selection, training, coaching, and performance assessment (see Table 1).
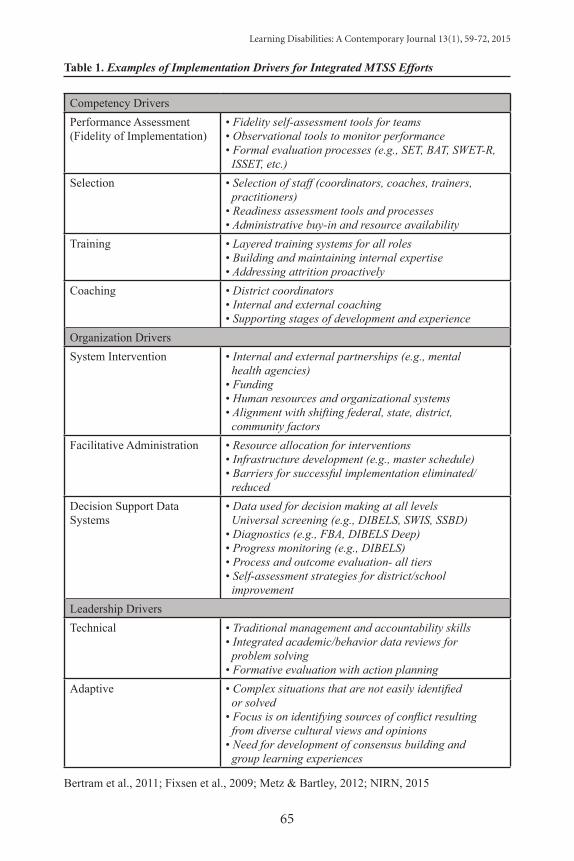
Learning Disabilities: A Contemporary Journal 13(1), 59-72, 2015
65
Table 1. Examples of Implementation Drivers for Integrated MTSS Efforts
Competency DriversPerformance Assessment(Fidelity of Implementation)
• Fidelity self-assessment tools for teams• Observational tools to monitor performance• Formal evaluation processes (e.g., SET, BAT, SWET-R, ISSET, etc.)
Selection • Selection of staff (coordinators, coaches, trainers, practitioners)• Readiness assessment tools and processes• Administrative buy-in and resource availability
Training • Layered training systems for all roles• Building and maintaining internal expertise• Addressing attrition proactively
Coaching • District coordinators• Internal and external coaching• Supporting stages of development and experience
Organization DriversSystem Intervention • Internal and external partnerships (e.g., mental
health agencies)• Funding• Human resources and organizational systems• Alignment with shifting federal, state, district, community factors
Facilitative Administration • Resource allocation for interventions• Infrastructure development (e.g., master schedule)• Barriers for successful implementation eliminated/ reduced
Decision Support Data Systems
• Data used for decision making at all levels Universal screening (e.g., DIBELS, SWIS, SSBD)• Diagnostics (e.g., FBA, DIBELS Deep)• Progress monitoring (e.g., DIBELS)• Process and outcome evaluation- all tiers• Self-assessment strategies for district/school improvement
Leadership DriversTechnical • Traditional management and accountability skills
• Integrated academic/behavior data reviews for problem solving• Formative evaluation with action planning
Adaptive • Complex situations that are not easily identified or solved• Focus is on identifying sources of conflict resulting from diverse cultural views and opinions • Need for development of consensus building and group learning experiences
Bertram et al., 2011; Fixsen et al., 2009; Metz & Bartley, 2012; NIRN, 2015
Learning Disabilities: A Contemporary Journal 13(1), 59-72, 2015
66
Selection. The different MTSS roles (district coordinator, coach, academ-ic specialist) require a variety of skills and experiences. While some of these skills are taught as part of inservice training or provided in preservice preparation, other strengths may be inherent within a person’s characteristics (problem solving, sensi-tivity to others, empathy, confidence speaking with peers). Some individuals will be well suited to become coaches while others may feel uncomfortable in this type of role. Larger systems issues related to selection include the extent to which funding is available to address the need for intensive and advanced academic and behavioral expertise (Fixsen et al., 2009). It is not uncommon to hear school professionals indi-cate that there is a need for behavioral expertise, reading specialists, etc. Districts will invest in a significant amount of training for professionals making selection issues such as willingness, commitment, and the possibility of attrition key considerations.
In fact, staff selection involves assessment of different levels and types of commitment to MTSS. District readiness assessments are used by trainers before beginning MTSS to evaluate administrator commitment and assess whether a core group of leaders within the district understand that systems change will require a long-term commitment of time and resources (Handler et al., 2007). When schools apply to participate in MTSS, tools are also used to evaluate school administrator buy-in, school faculty interest in implementation, and resources that are available for implementation (George & Kincaid, 2008). The commitment to MTSS implementa-tion by the school administrator is believed to be a key success factor for systems change (Fullan, 2005; Sindelar, Shearer, Yendol-Hoppey, & Liebert, 2006).
Training. Training opportunities are designed to promote the knowledge and skills aligned with MTSS. Successful implementation of MTSS requires behavior change of school faculty, staff, administrators, coaches, and other individuals involved in implementation efforts (Bertram, Blasé, Shern, Shea, & Fixsen, 2011). The differ-ent layers of MTSS training described earlier address each person’s role within MTSS and ensure internal capacity building occurs. Introductory and team-based training, coaching and mentoring provided to school staff members who support team-based action planning, and higher level training and capacity building to establish academic and behavioral expertise at tiers two and three are included in the overall training plans. A central theme in training is the use of data as part of an ongoing cycle of improvement and the development of increasingly intense levels of support.
Coaching. New information can be shared in workshops and training events to improve conceptual knowledge and understanding. School faculty need coaching systems to take the next step in applying conceptual knowledge by actively employ-ing new skills, engaging in reflective dialogue with someone with experience using new strategies, and embedding these skills into everyday practice (Joyce & Showers, 2002). Coaching is used to support a number of roles in MTSS including: individuals selected as coaches working with school teams, district coordinators, team members implementing MTSS, professionals learning to facilitate specific academic expertise in reading math, and other areas at tiers two and three, and individuals facilitating and coordinating targeted and individualized positive behavior support.
Performance assessment. Performance assessment is used to evaluate the fidelity of implementation practices that occur in MTSS. These fidelity of implemen-tation assessments evaluate the degree to which school buildings are able to imple-
Learning Disabilities: A Contemporary Journal 13(1), 59-72, 2015
67
ment academic RtI, SWPBS, or an integrated combination of MTSS. Trainers use an array of tools to assess fidelity of implementation. These tools range from team self-assessments, walk-through observation tools, and performance evaluations that are conducted by teams internal and external to each school. The Schoolwide Evalua-tion Tool (Horner et al., 2004), the Benchmarks of Quality (BoQ) (Kincaid, Childs, & George, 2005), the Benchmarks of Advanced Tiers (BAT) (Anderson et al., 2009) and the Independent Student Systems Evaluation Tool (ISSET) (Anderson et al., 2009) are used to evaluate the performance of schools at different tiers. A new tool, the System-wide Evaluation Tool for Reading (SWET-R), was developed by trainers in one state to evaluate the strength of Tier I implementation related to literacy practices (Martin, Huth, & Harms, 2013). Feedback from these evaluation methods helps to inform future action plans and intervention efforts.
Organization DriversOrganization drivers are the core building blocks that assist district teams
in establishing an infrastructure that is needed to support practice and implement systems change (Metz & Bartley, 2012). These building blocks are used to provide consistent monitoring and feedback communication loops for the sharing informa-tion in a transparent manner (Bertram et al., 2011). There are three organization drivers including decision-support data systems, facilitative administration, and sys-tems interventions.
Decision-support data systems. The MTSS problem-solving process is based on the availability of reliable, current data that are accessible at the classroom, building, and district level. Schools rely on data management systems to collect and summarize data for decision making purposes. Examples mentioned earlier in this article include DIBELS for academics and the School-wide Information System, or SWIS, for behavior (SWIS, 2015). Data are reviewed by school teams at least monthly for all students using a standardized problem-solving process in conjunction with cut points and/or benchmarks to determine responsiveness to tier one supports and to identify students in need of targeted or individual support. Similarly, the data are reviewed on a more frequent cycle to determine responsiveness to interventions at tier two and three.
SWPBS, data including ODRs, suspensions, and other data sources (e.g. Schoolwide Information System; SWIS, 2015), the Systematic Screening of Behav-ior Disorders (SSBD) (Walker, Severson &, Feil, 2012), and the Classroom Check-up (CCU) (Reinke, Herman, & Sprick, 2011) are used to assess the effectiveness of the existing behavior systems and instruction as well as to identify student needs. At the tier two level, data are collected for targeted interventions, such as Check-In and Check-Out (Filter, et al., 2007), Check and Connect (Christenson et al., 2008) and social skill instruction. At tier three, individual student data gathered as a baseline during functional behavioral assessment and intervention outcome data are used for decision making (for more information about tier 3 behavioral interventions, please refer to Brown, Anderson, & De Pry, 2015).
Facilitative administration. Facilitative administration drives the imple-mentation process keeping staff organized and focused on targeted outcomes (Fixsen et al., 2009). The school principal can be instrumental in allowing systems changes
Learning Disabilities: A Contemporary Journal 13(1), 59-72, 2015
68
such as altering existing procedures and providing time for grade level or student intervention teams to meet and review data and engage in problem solving. The principal, the internal coach, and other individuals providing intensive facilitation of academic and behavioral strategies at tiers two and three create part of the infra-structure necessary to support the work of the leadership team and school personnel. Resources are directed to coaching or training systems when issues arise in order to maintain effective implementation. In summary, facilitative administration refers to the actions taken by implementers to ensure MTSS systems are working effectively and feedback communication loops are used to identify problems and improve the training infrastructure.
Systems interventions. Changes and shifts within federal, state, districts, and community agencies can impact culture, policies and political environments in which MTSS is implemented (NIRN, 2015). Systems interventions involve estab-lishing partnerships within the immediate and broader systems in order to acquire the external funds, human resources, and organizational systems needed to support MTSS (Metz, Blasé, & Bowie, 2007). For instance implementation efforts may include the active involvement of local mental health professionals at all three tiers. A district team may learn that state funding cutbacks have occurred making it more difficult for the local mental health center to participate in MTSS. Systems interventions will be needed to adjust to these changes in funding and to address the constantly shifting political and cultural environment within the state.
In some cases, systems interventions are used to continue expanding MTSS implementation. The absence of district level leadership in MTSS can be problem-atic when schools are independently implementing tiered models for reading and/or behavior. Specific policies, procedures and regulations may exist within the district that serve as barriers to effective implementation at the building level. In this situa-tion, school teams within the district may engage in a systems intervention by work-ing together to create plans for meeting with district personnel to share related data, describe progress being made, and encourage adoption of district-wide MTSS. Once these meetings are completed, the teams may present to the education board in order to start increasing awareness and political support for MTSS.
Leadership DriversHeifetz and Laurie (1997) refer to technical challenges and adaptive challeng-
es that emerge when transforming systems and creating change. These two types of drivers address different types of problem solving that leaders use in systems change. It is important to distinguish between the two in order to provide the right type of leadership strategy when problem solving at the district level.
Technical challenges. Technical challenges are more easily identified and can be ameliorated with active facilitation of the essential elements of MTSS. For example, when performance assessments indicate deficits that are apparent within MTSS implementation efforts, the leadership team can develop and execute an ac-tion plan to address these challenges. When technical challenges are encountered, the problem can be defined without ambiguity and there is a clear path to the solution.
Adaptive challenges. Adaptive challenges may be more difficult to rec-ognize and are typically not resolved through traditional approaches. An issue re-
Learning Disabilities: A Contemporary Journal 13(1), 59-72, 2015
69
quiring adaptive leadership strategies occurs when a district encounters resistance to implement MTSS from individuals within a school. Resistance can emerge when staff members are asked to change the way they are doing things or to take on new responsibilities. Adaptive leadership involves reaching out to these faculty members, acknowledging the discomfort brought on by change, and working through the is-sues together to resolve problems. Once a leader has improved the climate and faculty are ready to take on new changes, technical solutions are employed in order to move forward.
One of the goals within systems change is to establish a culture that supports MTSS implementation where technical leadership challenges are more common be-cause individuals within a system share a common vision and culture of change. Ef-fective leaders must be able to identify whether challenges that arise require technical or adaptive leadership strategies. One of the more common mistakes made by leaders facilitating systems change is to apply technical leadership skills under conditions that require adaptive leadership (Heifetz & Laurie, 1997).
Integrating MTSS EffortsThere are two important types of integration that must be considered as
districts implement MTSS. The first type of integration involves the implementation of organization, competency, and leadership drivers (Fixsen et al., 2009). The second type of integration was mentioned earlier as part of the discussion related to aligning RtI academic interventions and SWPBS.
Integrating drivers. The core implementation drivers described by Fixsen and his colleagues must be considered within the context of complex and ever-chang-ing variables common in districts and schools. Challenges arise when district and school teams allow implementation drivers to occur in isolation (NIRN, 201). Two important communication systems, or feedback loops, include staff performance evaluation and decision-support data systems. Attention to feedback communication loops help district teams evaluate important information that, when used to make modifications and adjustments, help to keep MTSS efforts integrated (Fixsen et al., 2009). For instance, a team may become aware from performance assessments that school personnel are struggling to master certain elements of a new reading interven-tion. This information is used to improve the team-based training curriculum related to reading. However, the change made to the curriculum may require modifications be made to a performance assessment tool in order to evaluate new skills added to the training. Disagreements occurring among implementers about altering the perfor-mance assessment tool may require adaptive leadership strategies be used in order to reach consensus and resolution. District leaders will engage in further dialogue and group learning processes to assist those involved in implementation efforts to better understand why changes in data systems are needed.
Integrating MTSS models. The same type of isolation and fragmentation that occurs when drivers are not integrated is apparent when RtI academic models and SWPBS are implemented without careful attention to alignment and integra-tion. Implementation can become fragmented when academic and behavioral MTSS teams or trainers are not communicating. Over time, the benefits of both tiered mod-els will be diminished. Allocation of training and staff time may be used for redun-
Learning Disabilities: A Contemporary Journal 13(1), 59-72, 2015
70
dant purposes when a more integrated approach could be used to teach key MTSS skills. Conflict among implementers can arise requiring adaptive leadership due to perceived competition over limited MTSS resources.
District teams that start integrating academic and behavioral efforts can do so at any phase of implementation. Teams that do begin integrating MTSS efforts early have more time and opportunity to try new strategies and build on implemen-tation efforts. Fixsen, Blasé, Naoom, and Duda (2013) have recently shared an imple-mentation drivers assessment tool that includes a case study example of data collect-ed from three school districts implementing MTSS. The assessment was completed by individuals who were directly involved in managing the implementation efforts within each district. The information was gathered using the drivers assessment tool. This assessment provides a way for district teams to assess the perceptions of differ-ent individuals involved in MTSS. Teams can utilize these data by integrating review processes within communication feedback loops that have been established as part of organization and competency drivers (e.g. meetings to review data for decision mak-ing and performance assessments at different levels in the district and in schools). This type of tool can be helpful as a part of the district leadership evaluation process and when shared with implementers to facilitate further integration of MTSS.
conclusIon
School teams implementing MTSS independently without district-level sup-port may encounter barriers that make it more difficult to achieve significant and lasting change (Handler et al., 2007). District leadership can contribute to the sus-tained MTSS practices of its schools by establishing a training and technical assistance infrastructure, providing schools with access to data-based decision making systems, creating communication feedback systems for sharing information, and articulating a consensus-based vision and mission for MTSS. The implementation science frame-work described by Fixsen and his colleagues (2009) provides district teams with guide-lines for integrating tiered implementation models and a problem-solving system that can be used to expand MTSS as other evidence-based practices are adopted.
references
Anderson, C., Childs, K., Kincaid, D., Horner, R. H., George, H. P., Todd, A. W., & Spaulding, S. (2009). Benchmarks for advanced tiers. Eugene, OR: Educational and Community Supports, University of Oregon.
Batsche, G. M., Elliot, J., Garden, J., Grimes, J., Kovaleski, J. F., Prasse, D., & Tilly III, W. D. (2005). Response to intervention: Policy considerations and implementation. Alexan-dria, VA: National Association of State Directors of Special Education, Inc.
Bertram, R., Blasé, K., Shern, D., Shea, P., & Fixsen, D. (2011). Policy research brief: Implementa-tion opportunities and challenges for prevention and promotion initiatives. Alexandria, VA: National Association of State Mental Health Program Directors.
Brown, F., Anderson, J. L., & De Pry, R. L. (2015). Individual positive behavior supports: A stan-dards-based guide to practices in school and community settings. MD: Brookes.
Christenson, S. L., Thurlow, M. L., Sinclair, M. F., Lehr, C. A., Kaibel, C. M., Reschly, A. L., Mavis, A., & Pohl, A. (2008). Check & Connect: A comprehensive student engage-ment intervention manual. Minneapolis, MN: University of Minnesota, Institute on Community Integration.
Learning Disabilities: A Contemporary Journal 13(1), 59-72, 2015
71
Dynamic Measurement Group (2015). Dynamic Indicators of Basic Early Literacy Skills (DI-BELS) and DIBELS Math. Retrieved December 8, 2014: https://dibels.org/.
Elliott, J. & Morrison, D. (2008). Response to intervention blueprints: District level edition. Alex-andria, VA: National Association for State Directors of Special Education.
Filter, K. J., McKenna, M. K., Benedict, E. A., Horner, R. H., Todd, A., & Watson, J. (2007). Check in/check out: A post-hoc evaluation of an efficient, secondary-level targeted intervention for reducing problem behaviors in schools. Education and Treatment of Children, 30, 69-84.
Fixsen, D. L., Blase, K. A., Naoom, S. F., & Duda, M. (2013). Implementation drivers: Assessing best practices. National Implementation Science Network (NIRN). Chapel Hill, NC: Frank Porter Graham Child Development Institute. University of North Carolina Chapel Hill.
Fixsen, D., Blase, K., Naoom, S., & Van Dyke, M. (2010). Stage-based measures of implementation components. Retrieved from http://www2.oregonrti.org/files/u9/2%2 0NIRN%202010_Stage-Based%20Measures% 20of%20Implementation.pdf
Fixsen, D. L., Blase, K. A., Naoom, S. F., & Wallace, F. (2009). Core implementation compo-nents. Research on Social Work Practice, 19, 531-540.
Fixsen, D. L., Naoom, S. F., Blasé, K. A., Friedman, R. M., & Wallace, F. (2005). Implementation research: A synthesis of the literature. University of South Florida. Tampa, Florida.
Freeman, R., Lohrmann, S., Irvin, L. K., Kincaid, D., Vossler, V., & Ferro, J. (2009). Systems change and the complementary roles of inservice and preservice training in school-wide positive behavior support. In G. Sugai, R. Horner, G. Dunlap, & W. Sailor (Eds.), Handbook of positive behavior support (pp. 599-626). Secaucus, NJ: Springer.
Freeman, R., Perrin, N., Irvin, L., Vincent, C., Newcomer, L., & Farr Bond, K. (2009). Positive behavior support across the lifespan: Expanding the concept of statewide planning for large-scale organizational cultural change (PBS-Kansas Monograph No. 1). Lawrence, KS: University of Kansas, Schiefelbusch Institute for Lifespan Studies.
Fullan, M. (2005). Leadership and sustainability: System thinkers in action. Thousand Oaks, CA: Corwin Press.
George, J. P., & Kincaid, D. K. (2008). Building district-level capacity for positive be-havior support. Journal of Positive Behavioral Interventions, 10, 20-32. DOI: 10.1177/1098300707311367
Handler, M. W., Rey, J., Connell, J., Thier, K., Feinberg, A., & Putnam, R. (2007). Practical considerations in creating school-wide positive behavior support in public schools. Psychology in Schools, 44, 29-39.
Hawken, L. S., Vincent, C. G., & Schumann, J. (2008). Response to intervention for social be-havior: Challenges and opportunities. Journal of Emotional and Behavioral Disorders, 16, 213-225.
Heifetz, R.A., & Laurie, D.L., (1997). The work of leadership. Harvard Business Review, 75, 124-134.
Horner, R. H., Todd, A. W., Lewis-Palmer, T., Irvin, L. K., Sugai, G., & Boland, J. B. (2004). The school-wide evaluation tool (SET): A research instrument for assessing school-wide positive behavior support. Journal of Positive Behavior Interventions, 6, 3-12. doi:10.1177/10983007040060010201
Joyce, B., & Showers, B. (2002). Student achievement through staff development (3rd ed.). Alex-andria, VA: Association for Supervision and Curriculum Development.
Kincaid, D., Childs, K., & George, H. (2005). School-wide benchmarks of quality. Unpublished instrument, University of South Florida.
Kurns, S. & Tilly, W.D. (2008). Response to intervention blueprints: School building level edition. Alexandria, VA: National Association for State Directors of Special Education.
Learning Disabilities: A Contemporary Journal 13(1), 59-72, 2015
72
Lane, K. L., Menzies, H. M., Ennis, R. P., & Bezdek, J. (2013). School-wide systems to promote positive behaviors and facilitate instruction. Journal of Curriculum and Instruction, 7, 6-31.
Lane, K. L., Oakes, W. P., & Menzies, H. M. (2010). Systematic screenings to prevent the de-velopment of learning and behavior problems: Considerations for practitioners, re-searchers, and policy makers. Journal of Disabilities Policy Studies, 21, 160-172
Martin, S., Huth, E., & Harms, A. (2013). School-wide evaluation tool for reading (SWET-R). Michigan Department of Education.
McIntosh, K. & Goodman, S. (in press). Multi-tiered systems of support: Integrating academic RTI and school-wide PBIS. New York: Guilford Press.
McIntosh, K., Horner, R. H., Chard, D. J., Boland, J. B., & Good, R. H. (2006). The use of read-ing and behavior screening measures to predict nonresponse to school-wide positive behavior support: A longitudinal analysis. School Psychology Review, 35, 275-291.
Metz, A., & Bartley, L. (2012). Active implementation frameworks for program success: How to use implementation science to improve outcomes for children. Zero to Three, 32, 11-18.
Metz, A.J.R., Blase, K., & Bowie, L. (2007). Implementing evidence-based practices: Six drivers of success. Washington, DC: Child Trends.
National Implementation Research Network (2015). Systems intervention. Retrieved January 2, 2015: http://nirn.fpg.unc.edu
Reinke, W. M., Herman, K. C., & Sprick, R. S. (2011). Motivational interviewing for effective classroom management: The classroom check-up. Guilford Press.
Sindelar, P., Shearer, D., Yendol-Hoppey, D., & Liebert, T. (2006). The sustainability of inclusive school reform. Exceptional Children, 72, 317-331.
Stewart, R. M., Benner, G. J., Martella, R. C., & Marchand-Martella, N. E. (2007). Three-tier models of reading and behavior: A research review, Journal of Positive Behavior Inter-ventions, 9, 239-253. DOI: 10.1177/10983007070090040601
Sugai, G., & Horner, R. H. (2009). Responsiveness-to-intervention and School-Wide Positive Behavior Supports: Integration of multi-tiered system approaches. Exceptionality, 17, 223-237.
Sugai, G., Horner, R. H., Algozzine, R., Barrett, S., Lewis, T., Anderson, C., . . . Simonsen, B. (2010). School-wide positive behavior support: Implementers’ blueprint and self-assess-ment. Eugene, OR: University of Oregon.
SWIS (2015). School-wide Information System. Retrieved January 4, 2015, 2014: www.pbisapps.orgUtley, C. A., & Obiaker, F. E. (2012). Response to intervention and positive behavior inter-
ventions and supports: Merging models to improve academic and behavioral out-comes of culturally linguistically diverse children with learning disabilities. Insights on Learning Disabilities, 9, 37-67.
Walker, H. M., Ramsey, E., & Gresham, F. M. (2004). Antisocial behavior in school: Evidence-based practices (2nd ed.). Belmont, CA: Wadsworth.
Walker, H., Severson, H., & Feil, E. (2012) Systematic Screening of Behavior Disorders (2nd Edi-tion). Eugene, OR: Pacific Northwest Publishing.
World Health Organization (2004). Prevention of mental disorders: Effective interventions and policy options. Geneva: WHO.
Authors’ note
Development of this article was supported, in part, by Grant #H133B130006 to the Research and Training Center for Community Living from the National In-stitute on Disabilities and Rehabilitation Research, U.S. Department of Education. Grantees undertaking projects under government sponsorship are encouraged to ex-press freely their findings and conclusions. Points of view or opinions do not neces-sarily represent official NIDRR policy.
Learning Disabilities: A Contemporary Journal 13(1), 73-93, 2015 Copyright @ by LDW 2015
*Please send correspondence to: Kat D. Alves, M.T., University of Virginia, Curry School of Education, P.O. Box 400273, Charlottesville, VA, 22904 USA, Email: [email protected].
Story Grammar Instruction with Third and Fifth Grade Students with Learning Disabilities and
Other Struggling ReadersKat D. Alves
Michael J. Kennedy Tiara S. Brown Michael Solis
University of Virginia, Charlottesville, VA (USA)
Reading comprehension is difficult for many students with disabilities, including those with specific learning disabilities. However these students can be explicitly taught strategies to improve their comprehension abili-ties. One such strategy is teaching students story grammar in order to provide them with a framework for understanding narrative text. In this article, we present the results of a multiple-baseline across groups study conducted with third and fifth grade students. All students improved from baseline to posttest and maintenance scores remained above base-line. Nonoverlap of All Points (NAP) data demonstrates very low overlap between baseline points and intervention points for all students. Results indicated that story grammar interventions might improve reading out-comes for students with disabilities in grades 3-5.
Keywords: Learning Disabilities, Reading Comprehension, Story Grammar
IntroductIon
Students identified with specific learning disabilities (LD) often experience difficulties in reading, particularly in reading comprehension (Gersten, Fuchs, Wil-liams, & Baker, 2001; Solis et al., 2012). This leads to poor performance on high and low stakes tests, such as the National Assessment of Educational Progress (NAEP) and typical classroom assessments. To illustrate, NAEP results from the 2013 reading test show that 69% of all students with disabilities were at the Below Basic level in fourth grade (U.S. Department of Education, 2013). Twenty percent of students with disabilities were at the Basic level, while only 9% were Proficient and a mere 2% were Advanced (ebd.). Many students with learning disabilities typically do not monitor their own comprehension or use comprehension strategies while reading (Gersten et al., 2001). Further, students with learning disabilities may process information ineffi-ciently, often not engaging in strategic reading or metacognition. In addition, students with LD also display difficulties with text structure and how text is organized (ebd.).
Although many students with LD struggle with reading (Solis et al., 2012), it is possible to explicitly teach them comprehension strategies in order to improve their ability to comprehend text (Edmonds et al., 2009; Gersten et al., 2001; Scam-macca, Roberts, Vaughn, & Stuebing, 2013). Gersten and colleagues (2001) con-ducted a review and found that successful strategies for reading narrative text in-
Learning Disabilities: A Contemporary Journal 13(1), 73-93, 2015
74
clude comprehension monitoring, story grammar, and peer-mediated instruction. In a synthesis, Edmonds et al. (2009) found that questioning, summarizing, graphic organizers, finding the main idea, and story maps can all improve reading compre-hension. Explicitly teaching story grammar is another way to improve reading com-prehension for students with learning disabilities (Edmonds et al., 2009; Gersten et al., 2001; Mahdari & Tensfeldt, 2013; Stetter & Hughes, 2010). Stetter and Hughes (2010) conducted a review of studies examining story grammar interventions and found this to be an effective technique for students with learning disabilities and other struggling readers. In addition, in a recent review of interventions for students with reading difficulties, Scammacca and colleagues (2013) found an overall effect size of 0.74 for reading comprehension interventions, indicating that comprehension can be improved for all struggling readers.
Story Grammar Research Instruction in story grammar is an effective way to improve reading com-
prehension for students with LD (Boulineau, Fore, Hagan-Burke, & Burke, 2004; Idol, 1987; Idol & Croll, 1987; Stagliano & Boon, 2009). This literature review will examine research conducted with both elementary and secondary students, although the current study addresses the needs of students at an upper elementary level. To illustrate, Idol (1987) and Idol and Croll (1987) conducted early research that exam-ined story mapping and its effectiveness in improving comprehension in struggling readers. Story mapping is simply filling out story elements on a graphic organizer and has been found to be effective across many studies (Mahdari & Tensfeldt, 2013; Stetter & Hughes, 2010). In these studies (Idol, 1987; Idol & Croll, 1987), students were given a story map that had blanks for setting (characters, time, place), problem, goal, action, and outcomes. Teachers taught the story map using a three-step process of modeling, guided practice, and independent practice. Teachers began by modeling filling out the story map on an overhead while students copied down the answers on their own story maps. During the guided practice phase, students filled out the story map with teacher support and during independent practice, students read the story and completed the story map on their own. Story maps were filled out while reading and then taken away before answering questions. In both studies, researchers report significant gains on researcher-made comprehension tests for general educa-tion students, as well as students with LD at the elementary school level. While the majority of students improved during the intervention phase, mixed results were re-ported during the maintenance phase and on transfer tasks (Idol, 1987; Idol & Croll, 1987). The mixed results during maintenance may be due to the fact that students did not have time to learn enough about story grammar. In addition, these studies con-ducted maintenance measures immediately after intervention, so there is no evidence of any long-terms effects of the story grammar strategy. Although these early studies provide a foundation for subsequent work on instruction in story grammar, further work is needed to demonstrate the impact of this instruction.
Boulineau and colleagues (2004) replicated the work of Idol with six elemen-tary school students with LD. Students showed significant improvement when identi-fying story elements from a four-day baseline period to a six-day intervention period. Although all students increased the number of correct story elements that they were
Learning Disabilities: A Contemporary Journal 13(1), 73-93, 2015
75
able to identify during the intervention period, only three students maintained gains during a maintenance phase that immediately followed the intervention. Stagliano and Boon (2009) followed a similar procedure using expository text. Students were taught how to use a story map using a modeling, guided practice, independent prac-tice model. In this study, three students improved from baseline to intervention, with two maintaining gains when measured two weeks later. These studies demonstrate the effectiveness of explicitly teaching a story grammar strategy to students with LD and other struggling readers. However, difficulties with skill maintenance may in-dicate a longer intervention period is needed for students to learn to effectively use story grammar.
Instruction in story grammar is not only effective for students at the el-ementary level, but it is also effective as an intervention for at improving reading comprehension for students with disabilities and struggling readers at the secondary level (Dimino, Gersten, Carnine, & Blake, 1990; Gardil and Jitendra, 1999; Gurney, Gersten, Dimino, & Carnine, 1990; Onachukwu, Boon, Fore III, & Bender, 2007). Gurney et al. (1990) modified the story grammar techniques used by Idol and Croll (1987) and utilized them with seven high school students with LD. Similar story el-ements were taught, but with more depth, following a modeling-guided practice-independent practice model. Although students who received the story grammar instruction showed improvements on the story grammar questions, this study did not include maintenance measures, so it is unclear if gains were maintained. Dimino and colleagues (1990) also implemented story grammar instruction with a group of high school students consisting of those with disabilities and others in two Basic English classes. Students in the story grammar group performed significantly better on both story grammar and basal literature questions (explicit questions pulled from the basal reader) than those in a basal instruction group. Their scores were strong at posttest, but they decreased slightly during a two-week maintenance probe.
Gardil and Jitendra (1999) extended this work to the study of six middle school students with learning disabilities. Students were taught during a 14 to 20 week intervention period and maintenance was conducted two weeks after comple-tion of the study. All students showed improvements on story grammar questions from baseline to intervention, but there were mixed results on the basal questions. Students’ scores decreased slightly at maintenance, but they were still an increase above baseline scores. Onachukwu, Boon, Fore III, and Bender (2007) conducted a 23-day study with three eighth grade students where students were taught to identify story elements and complete a story map. Results show that all three of the students increased during intervention and then decreased slightly at a two-week maintenance probe for both overall comprehension and identification of story elements. These studies both included an extended intervention period, as well as a maintenance measure two weeks after the conclusion of the intervention. In each of the reviewed studies at both the elementary and secondary level, instruction in story grammar improved the comprehension skills of students with learning disabilities and other struggling readers. Stetter and Hughes (2010) also found in a review that story gram-mar interventions improve comprehension outcomes across ages and grades and that modeling the strategy and using a story map both result in improved comprehension outcomes for students with learning disabilities and struggling readers.
Learning Disabilities: A Contemporary Journal 13(1), 73-93, 2015
76
Rationale for StudyAlthough research has demonstrated the effectiveness of a story grammar
strategy, more research is needed. While previous studies of story grammar inter-ventions have reported gains in reading comprehension outcomes (Boulineau et al., 2004; Idol, 1987; Idol & Croll, 1987; Stagliano & Boon, 2009), more information is needed about longer time periods of implementation and the potential for transfer of effects over time. Of the four studies conducted at an elementary school level, three included maintenance measures immediately after the conclusion of the study (Boulineau et al., 2004; Idol, 1987; Idol & Croll, 1987), and only one conducted main-tenance two weeks after the intervention period (Stagliano & Boon, 2009). This study will examine maintenance two weeks after the conclusion of the study in order to determine if gains are maintained.
Much of the research in story grammar addressed the needs of students with learning disabilities, but several of these studies also included students with other dis-abilities and struggling readers (Dimino et al., 1990; Idol, 1987; Idol & Croll, 1987). Struggling readers were typically defined as students who had difficulty answering comprehension questions (Idol, 1987) or those who scored poorly on standardized reading comprehension measures (Dimino et al., 1990). NAEP scores indicate poor reading performance for all students with disabilities, not just those with learning disabilities. Therefore, this study did not limit inclusion to only students with learn-ing disabilities, but instead allowed the inclusion of students with other disability categories or those who were found to be struggling readers according to standard-ized comprehension measures. The purpose of this study is to examine effects of a story grammar comprehension strategy for students identified with LD or as strug-gling readers in grades 3 and 5. In addition, the aim of the study is to replicate previ-ous research conducted on story grammar interventions for longer durations of time and with maintenance measures to further investigate the potential efficacy of the story grammar intervention by answering the following research question(s): 1.) To what extent does a story grammar intervention with students in grades 3-5 with LD impact reading comprehension outcomes? 2.) To what extent are these gains main-tained over time?
Method
SettingThis study was conducted at a Title 1 elementary school in a mid-Atlantic
state that goes from pre-kindergarten to fifth grade. The percentages of racial/eth-nic groups at this school are 54.9% White, 24.8% Black, 17.6% Hispanic, and 2.7% Other. In this school, 12.7% of students are considered English Language Learner (ELL), 48.4% receive free or reduced lunch, and 14.1% are students with disabilities. All sessions took place in a special education resource room near the participants’ general education classrooms. This classroom was chosen because seven of the eight students worked in this resource room during other periods of the day, so they were comfortable in it. The sessions took place in the morning when there were minimal distractions in the classroom. Typically there were one to three adults and one other student in the classroom, so the room was quiet for the sessions.
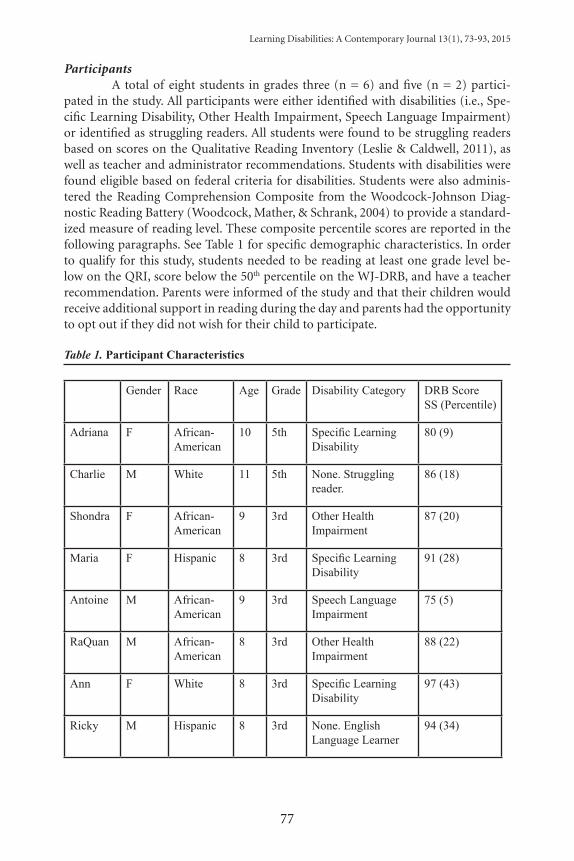
Learning Disabilities: A Contemporary Journal 13(1), 73-93, 2015
77
ParticipantsA total of eight students in grades three (n = 6) and five (n = 2) partici-
pated in the study. All participants were either identified with disabilities (i.e., Spe-cific Learning Disability, Other Health Impairment, Speech Language Impairment) or identified as struggling readers. All students were found to be struggling readers based on scores on the Qualitative Reading Inventory (Leslie & Caldwell, 2011), as well as teacher and administrator recommendations. Students with disabilities were found eligible based on federal criteria for disabilities. Students were also adminis-tered the Reading Comprehension Composite from the Woodcock-Johnson Diag-nostic Reading Battery (Woodcock, Mather, & Schrank, 2004) to provide a standard-ized measure of reading level. These composite percentile scores are reported in the following paragraphs. See Table 1 for specific demographic characteristics. In order to qualify for this study, students needed to be reading at least one grade level be-low on the QRI, score below the 50th percentile on the WJ-DRB, and have a teacher recommendation. Parents were informed of the study and that their children would receive additional support in reading during the day and parents had the opportunity to opt out if they did not wish for their child to participate.
Table 1. Participant Characteristics
Gender Race Age Grade Disability Category DRB ScoreSS (Percentile)
Adriana F African-American
10 5th Specific Learning Disability
80 (9)
Charlie M White 11 5th None. Struggling reader.
86 (18)
Shondra F African-American
9 3rd Other Health Impairment
87 (20)
Maria F Hispanic 8 3rd Specific Learning Disability
91 (28)
Antoine M African-American
9 3rd Speech Language Impairment
75 (5)
RaQuan M African-American
8 3rd Other Health Impairment
88 (22)
Ann F White 8 3rd Specific Learning Disability
97 (43)
Ricky M Hispanic 8 3rd None. English Language Learner
94 (34)
Learning Disabilities: A Contemporary Journal 13(1), 73-93, 2015
78
Demographics for the third grade groups were 50% female and 50% male. Three of the students were African American, two of the students were Hispanic, and one was White. Five of the students were identified with a disability (Specific Learn-ing Disability, Other Health Impairment, or Speech-Language Impairment) and one received English as a Second Language (ESOL) services (Table 1). The third grade students were all reading at a second grade instructional level according to the QRI and teacher reports. The third grade students were split into two groups of three students each (names reported with WJ-DRB percentile scores) in order to keep the groups small and they became groups 2 (Shondra, 20th percentile; Maria, 28th percen-tile; and Antoine, 5th percentile) and 3 (RaQuan, 22nd percentile; Ann, 43rd percentile; and Ricky, 34th percentile) in the study.
The fifth grade group included one African American female and one White male student. The female student was identified as a student with a specific learn-ing disability (SLD), while the classroom teacher nominated the male, based on low reading performance during class assignments. The students in the fifth grade group both demonstrated adequate decoding and fluency, but significant deficits in reading comprehension according to the QRI (two grade levels below) and teacher reports. Both Adriana (9th percentile) and Charlie (18th percentile) were reading at a third grade instructional level due to poor comprehension scores.
Research DesignThis study utilized a multiple-baseline across groups design. Group 1 had
two fifth grade students, group 2 had three third grade students, and group 3 had three third grade students.
MaterialsStory maps. Story maps were modeled after the ones used by Idol (1987) and
Idol and Croll (1987). Students were asked to fill in blanks for character, setting (time, place), problem, solution, and main events. Figure 1 shows a story map template.
Passages. Reading passages were selected from the popular website, www.readinga-z.com, which has leveled stories. Based on QRI and DRB scores, the third grade groups were given M and N level passages (corresponding to second grade) and the fifth grade groups were given P and Q passages (corresponding to third grade). These passages were selected because all students were reading at the chapter book level, but complete stories were needed for the intervention. If chapters of a longer book were used, individual chapters may not include new characters and settings and do not necessarily have a problem and a solution. Readinga-z has complete stories that are leveled and are short enough to be completed during one session, which al-lowed for a new story to be used in every session. A variety of narrative stories were used, including typical fiction stories, as well as some fairy tales and folktales. Stories were screened to ensure that they contained all of the necessary narrative compo-nents prior to selecting them for inclusion. An example of a story can be seen at http://www.readinga-z.com/books/leveled-books/book/?id=1793.
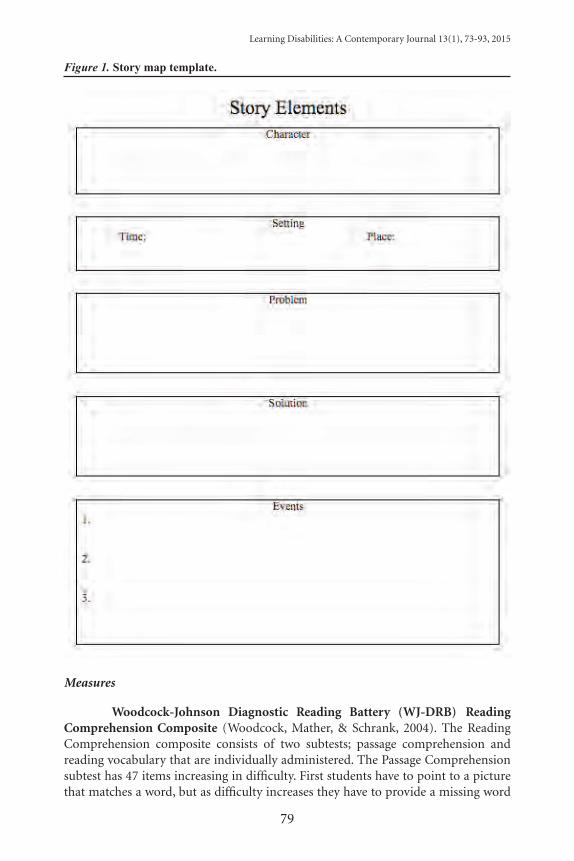
Learning Disabilities: A Contemporary Journal 13(1), 73-93, 2015
79
Figure 1. Story map template.
Measures
Woodcock-Johnson Diagnostic Reading Battery (WJ-DRB) Reading Comprehension Composite (Woodcock, Mather, & Schrank, 2004). The Reading Comprehension composite consists of two subtests; passage comprehension and reading vocabulary that are individually administered. The Passage Comprehension subtest has 47 items increasing in difficulty. First students have to point to a picture that matches a word, but as difficulty increases they have to provide a missing word
Learning Disabilities: A Contemporary Journal 13(1), 73-93, 2015
80
in a sentence or passage (cloze procedure). The Reading Vocabulary subtest is broken into three sections; synonyms (26 items), antonyms (26 items), and analogies (21 items). In the synonym section, students read words aloud and had to provide a word that meant the same thing. In the antonym section, students read words aloud and had to provide a word that meant the opposite thing. In the analogy section, students read three words and had to provide a fourth word that fit the relationship. In each of these, items are arranged in increasing difficulty. Reliability as reported by the test developers is 0.88 for Passage Comprehension and 0.90 for Reading Vocabulary, with a reliability score of 0.92 for the Reading Comprehension composite.
Researcher-developed comprehension measure. This measure included 10 open-ended comprehension questions assessing knowledge of story elements (see Figure 2). The first two questions addressed the setting and asked students to iden-tify where and when the story took place. The third and fourth questions addressed characters and asked students to identify major and minor characters. The next four questions examined problem and solution and asked students to identify the prob-lem, to discuss how the character tried to solve the problem, to explain if the problem was hard to solve, and finally to state whether it was solved. The final two questions examined important events by asking students to identify an important event and to explain why it was important. Students completed measures independently. All ten items were given 1 point if they were correct and 0 points if they were incorrect. No partial credit was given. This measure was based on work from Idol (1987) and Idol and Croll (1987) and included the same eight initial questions about the characters, setting, problem, and solution. Questions 9 and 10 were changed to assess student’s ability to look at important events in the story. A reliability analysis was conducted on the 10 questions using data from each session and Cronbach’s alpha was found to be .84 for the measure.
Intervention In the intervention phase, students received instruction from the first author
on story grammar elements (character, setting, problem, solution, main events). They were taught how to identify and name these elements, as well as how to use under-standing of narrative structure to approach and comprehend a variety of narrative texts. Each group met with the researcher twice a week for thirty-minute sessions. During these sessions, they practiced identifying each of the elements in the story using a new story for each session. The intervention began with a teacher-model-ing phase, progressed to guided practice, and moved towards independent practice on identifying these elements. Students received four 30-minute modeling sessions, four 30-minute guided practice sessions, and two 30-minute independent practice sessions. Each session included two to three minutes of introduction to let students know the plan for that day’s session and answer any initial questions, 15 to 20 min-utes of story reading and discussion of the story grammar elements while filling out the story map (approximately five minutes on character and setting, ten minutes on problem and solution, and five minutes on important events), and five to ten minutes spent answering comprehension questions. During the sessions, students were given the story and story map to complete. After instruction, the stories and completed

Learning Disabilities: A Contemporary Journal 13(1), 73-93, 2015
81
story maps were taken away and the probes (10 question, paper and pencil, compre-hension quizzes) were given to each student to complete independently. Students had as much time as they needed and typically took between five and ten minutes.
Figure 2. Sample comprehension questions.
Learning Disabilities: A Contemporary Journal 13(1), 73-93, 2015
82
The ten intervention sessions began with four modeling sessions. During these sessions, the researcher read the story aloud to the group of students and filled out the story map as she read. The researcher paused throughout the story and mod-eled a think aloud process to identify story elements (Dimino et al., 1990). While reading each page, as story elements arose in story, such as new characters being in-troduced or the setting being discussed, the researcher stopped and discussed the element. This included defining the story element, identifying the story element, and writing it down on the story map. Students followed along and filled out their own story map with the same information and phrasing as the researcher. Students were taught to look for information about character and setting at the beginning of the story, as well as recording new characters as they appeared in the story. Setting was defined as time (past, present, future) and place and the students were shown how to determine the setting early in the story. Problem and solution were taught together. Problem was defined as the “big” problem in the story. It was explained that the prob-lem did not occur over one page, but instead was a larger issue that needed to be solved and typically was introduced over several pages. The problem and solution also were required to tie together and the solution needed to solve the problem. After the story was complete, the final step was to identify several important events, defined as major things that happened in the story.
The guided practice phase consisted of the students taking turns reading the story out loud and discussing the story elements with support from the researcher. Students took turns reading and as they read, they stopped and discussed story ele-ments as they came across them, writing them down as they had learned during the modeling phase. Students worked together to prompt each other and point out when story elements arose that should be written down. Students worked in small groups with researcher support over four sessions.
Students then completed two sessions of independent practice. During these sessions, they read the story to themselves and completed the story map. However, the researcher walked around and supported the students when filling out the story map by answering questions and prompting responses. In addition, students were stopped every two to three pages to orally compare story maps and share answers.
Posttest and maintenance. After the ten intervention sessions, the research-er came in two days after the final session to give a posttest. For the posttest, students were given the story and story map to complete independently. After they turned these in, they were given the comprehension measure. Maintenance was conducted two weeks after the conclusion of the intervention for all groups and followed the same procedure as the posttest. Group 2 also received the maintenance measure four weeks after intervention, but due to snow days and the end-of-year benchmark tests, the other groups were not able to complete this measure.
Data CollectionOn the first day of the baseline phase, the researcher started by read-
ing through each of the 10 questions with students and explaining them, as well as answering any questions that the students had. Students were then given a short, narrative story to read independently at their instructional level. After they com-
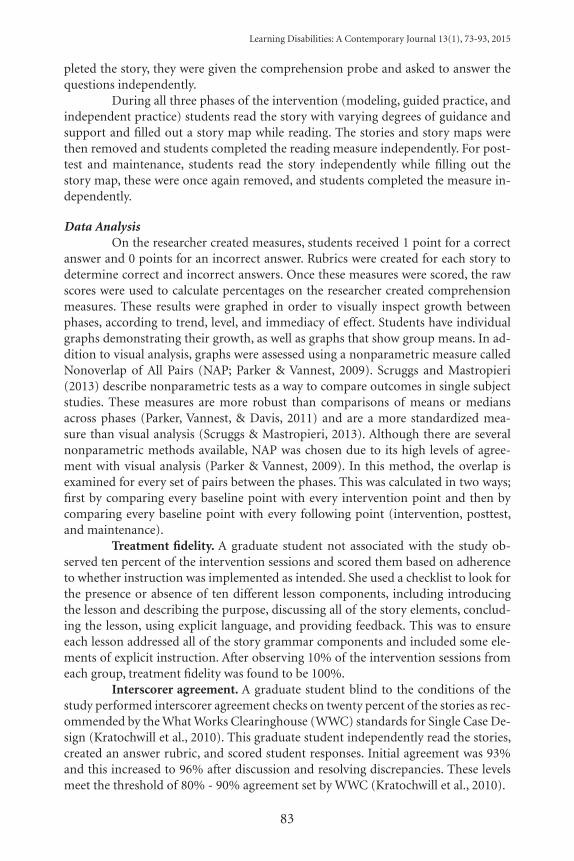
Learning Disabilities: A Contemporary Journal 13(1), 73-93, 2015
83
pleted the story, they were given the comprehension probe and asked to answer the questions independently.
During all three phases of the intervention (modeling, guided practice, and independent practice) students read the story with varying degrees of guidance and support and filled out a story map while reading. The stories and story maps were then removed and students completed the reading measure independently. For post-test and maintenance, students read the story independently while filling out the story map, these were once again removed, and students completed the measure in-dependently.
Data AnalysisOn the researcher created measures, students received 1 point for a correct
answer and 0 points for an incorrect answer. Rubrics were created for each story to determine correct and incorrect answers. Once these measures were scored, the raw scores were used to calculate percentages on the researcher created comprehension measures. These results were graphed in order to visually inspect growth between phases, according to trend, level, and immediacy of effect. Students have individual graphs demonstrating their growth, as well as graphs that show group means. In ad-dition to visual analysis, graphs were assessed using a nonparametric measure called Nonoverlap of All Pairs (NAP; Parker & Vannest, 2009). Scruggs and Mastropieri (2013) describe nonparametric tests as a way to compare outcomes in single subject studies. These measures are more robust than comparisons of means or medians across phases (Parker, Vannest, & Davis, 2011) and are a more standardized mea-sure than visual analysis (Scruggs & Mastropieri, 2013). Although there are several nonparametric methods available, NAP was chosen due to its high levels of agree-ment with visual analysis (Parker & Vannest, 2009). In this method, the overlap is examined for every set of pairs between the phases. This was calculated in two ways; first by comparing every baseline point with every intervention point and then by comparing every baseline point with every following point (intervention, posttest, and maintenance).
Treatment fidelity. A graduate student not associated with the study ob-served ten percent of the intervention sessions and scored them based on adherence to whether instruction was implemented as intended. She used a checklist to look for the presence or absence of ten different lesson components, including introducing the lesson and describing the purpose, discussing all of the story elements, conclud-ing the lesson, using explicit language, and providing feedback. This was to ensure each lesson addressed all of the story grammar components and included some ele-ments of explicit instruction. After observing 10% of the intervention sessions from each group, treatment fidelity was found to be 100%.
Interscorer agreement. A graduate student blind to the conditions of the study performed interscorer agreement checks on twenty percent of the stories as rec-ommended by the What Works Clearinghouse (WWC) standards for Single Case De-sign (Kratochwill et al., 2010). This graduate student independently read the stories, created an answer rubric, and scored student responses. Initial agreement was 93% and this increased to 96% after discussion and resolving discrepancies. These levels meet the threshold of 80% - 90% agreement set by WWC (Kratochwill et al., 2010).
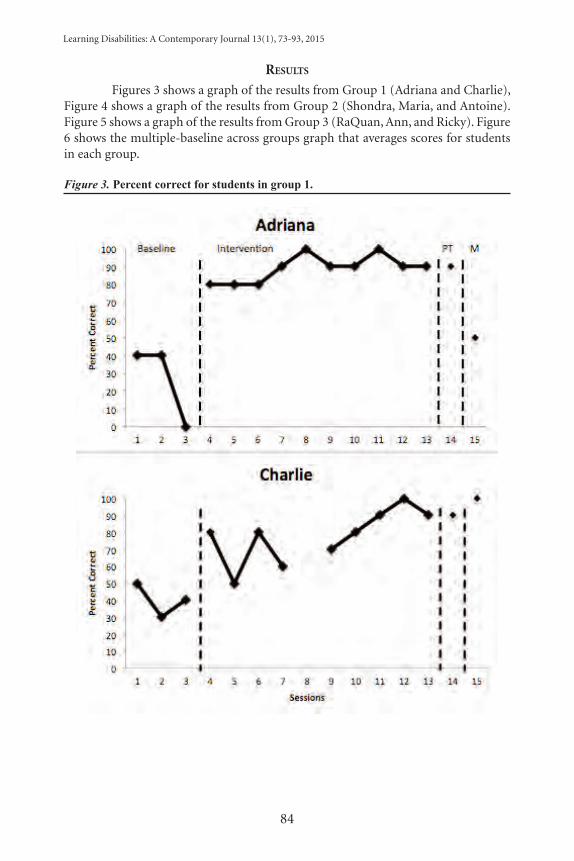
Learning Disabilities: A Contemporary Journal 13(1), 73-93, 2015
84
results
Figures 3 shows a graph of the results from Group 1 (Adriana and Charlie), Figure 4 shows a graph of the results from Group 2 (Shondra, Maria, and Antoine). Figure 5 shows a graph of the results from Group 3 (RaQuan, Ann, and Ricky). Figure 6 shows the multiple-baseline across groups graph that averages scores for students in each group.
Figure 3. Percent correct for students in group 1.
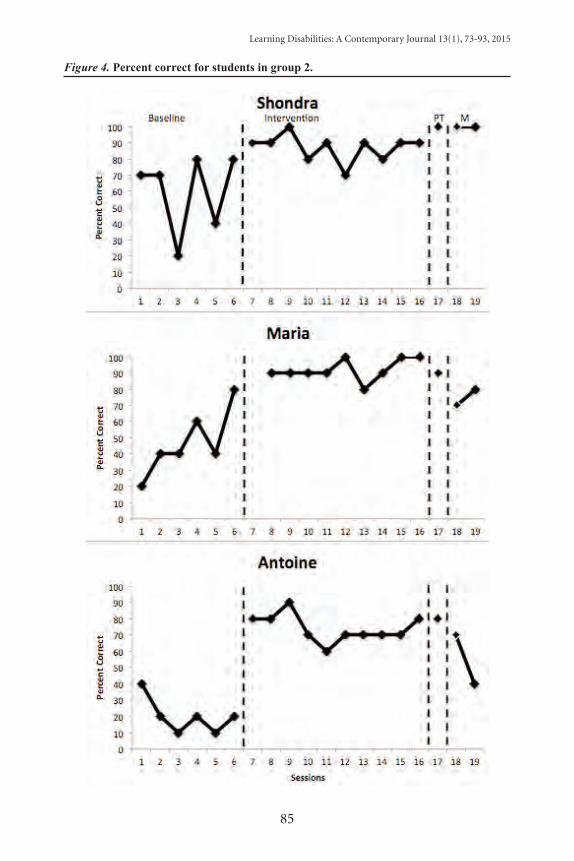
Learning Disabilities: A Contemporary Journal 13(1), 73-93, 2015
85
Figure 4. Percent correct for students in group 2.
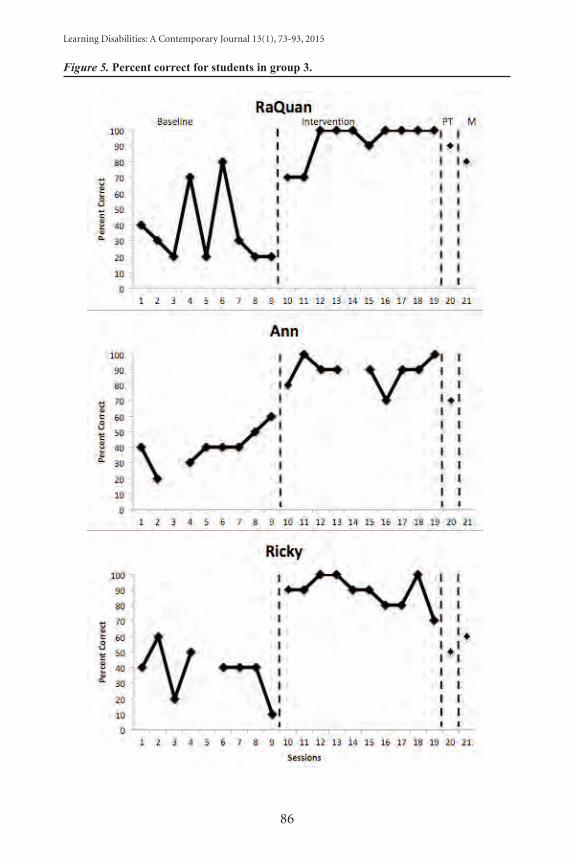
Learning Disabilities: A Contemporary Journal 13(1), 73-93, 2015
86
Figure 5. Percent correct for students in group 3.
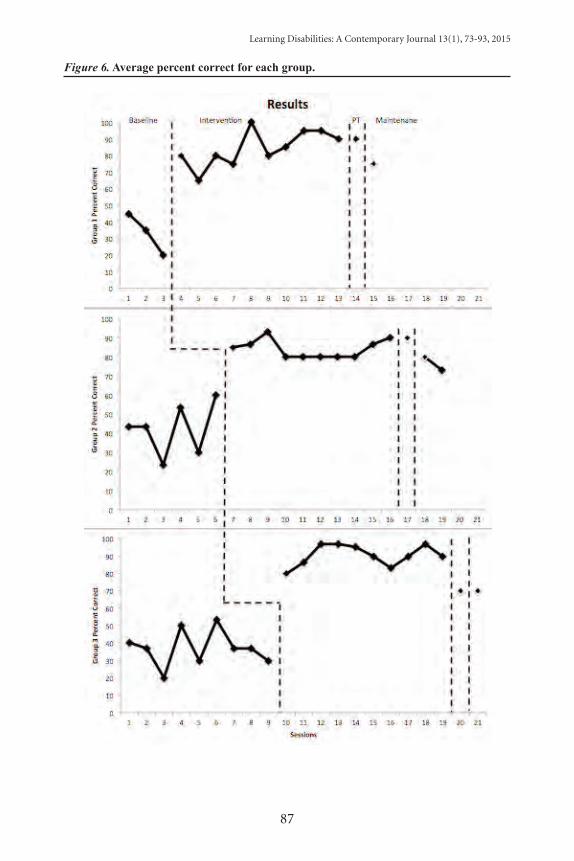
Learning Disabilities: A Contemporary Journal 13(1), 73-93, 2015
87
Figure 6. Average percent correct for each group.
Learning Disabilities: A Contemporary Journal 13(1), 73-93, 2015
88
Group One ResultsIn group 1, Adriana had a mean baseline score of 26.7% and showed a de-
creasing trend. Charlie had a mean baseline score of 40% and showed a decreasing trend as well (Figure 3). The average for this group showed low level and decreasing trend, with some variability (Figure 6). According to visual analysis, both Adriana and Charlie demonstrated immediate improvement when the intervention was in-troduced (Figure 3). Their trend lines during intervention were at a high level and either consistently high (Adriana) or steadily increasing (Charlie). Both Adriana and Charlie demonstrated high scores at posttest that were on the same level as the fi-nal intervention point. Charlie continued to increase at maintenance, and although Adriana showed a decrease, her maintenance point was still above baseline levels. The averages for this group (Figure 6) demonstrated an immediate effect when the intervention was introduced and an average positive trend, with posttest scores level with the final intervention point.
When comparing overlap of data points (NAP) between the baseline phase and the intervention phase for Adriana, 100% of points were found to be nonover-lapping (Parker & Vannest, 2009). When the posttest and maintenance points were added to this analysis for Adriana, 100% of data points were nonoverlapping. For Charlie, 98% of data points were nonoverlapping when comparing baseline to inter-vention and 98.5% of points were nonoverlapping when comparing baseline to all following points. The NAP averages for Group 1 were 100% for both analyses. This indicated that the treatment demonstrated strong positive effects for both Adriana and Charlie with no average overlap between any of the baseline points and any of the points from the intervention, posttest, or maintenance.
Group Two ResultsAll of the students in this group showed some degree of variability during
baseline, although levels were low for all students. The trend for Shondra was flat, for Maria was increasing slightly, and it was decreasing for Antoine (Figure 4). The over-all baseline trend for this group was relatively flat, with a slight upward trend (Figure 6). When the intervention was introduced, Antoine showed a large immediate im-provement, while the effect was not as pronounced for Shondra and Maria. Overall, the average for the group showed a steady trend for the intervention phase. Posttest scores were all close to scores for the final intervention point without much degree of difference. Maintenance scores for Shondra remained high, while they dropped somewhat for Maria and Antoine. The overall average for this group showed a post-test score level with the final intervention point and a slight dropoff for maintenance.
When comparing overlap of data points (NAP) between the baseline phase and the intervention phase for Shondra, 92% of points were found to be nonover-lapping (Parker & Vannest, 2009). When the posttest and maintenance points were added to this analysis for Shondra, 93% of data points were also nonoverlapping. Al-though Shondra did not demonstrate immediacy of effect during visual analysis, the high NAP scores do indicate improvement across the intervention. For Maria, 99% of data points were nonoverlapping when comparing baseline to intervention and 97% of points were nonoverlapping when comparing baseline to all following points. According to visual analysis, Maria had an increasing baseline and did not demon-
Learning Disabilities: A Contemporary Journal 13(1), 73-93, 2015
89
strate immediacy of effect, but the strong scores for NAP indicate improvements. For Antoine, 100% of data points were nonoverlapping when comparing baseline to intervention and 99% of points were nonoverlapping when comparing baseline to all following points. NAP averages for Group 2 were 100% for both analyses. This indicated that the treatment demonstrated strong positive effects for all students in this group, with no average overlap between baseline points and any points after the introduction of the intervention.
Group Three ResultsRaQuan and Ricky demonstrated a steady trend in their baseline, although
this was decreasing slightly for Ricky, while Ann displayed a slight increasing trend (Figure 5). Although Ann showed an increasing trend, the decision to begin the inter-vention was based on group average scores, which showed a decreasing trend the last four points before intervention (Figure 6). When the intervention was introduced, both RaQuan and Ricky demonstrated strong immediate growth, although Ann’s growth was more marginal. However, the average for this group (Figure 6) demon-strated an immediate effect when the intervention was introduced and a consistently high level during the intervention. Although all students in this group decreased slightly at posttest and maintenance, these scores were still above baseline levels.
When comparing overlap of data points (NAP) between the baseline phase and the intervention phase for RaQuan, 97% of points were found to be nonover-lapping (Parker & Vannest, 2009). When the posttest and maintenance points were added to this analysis for Antoine, 97% of data points were also nonoverlapping. For Ann, 100% of data points were nonoverlapping when comparing baseline to inter-vention and 100% of points were nonoverlapping when comparing baseline to all following points. For Ricky, 100% of data points were nonoverlapping when compar-ing baseline to intervention and 99% of points were nonoverlapping when compar-ing baseline to all following points. NAP averages for Group 3 were100% for both analyses. This indicated that the treatment demonstrated strong positive effects for all students in this group because there was no overlap between any of the average baseline points and any points after the intervention was introduced.
Overall TrendsAt baseline, the majority of students scored a mean score below 50%, with
only one student at 60%. Baseline scores were low overall and the average graphs for each group (Figure 6) show steady or decreasing trends. Visual analysis also demon-strated that average scores for each group increased substantially when the interven-tion was implemented and continued to increase or remain high for the duration of the intervention. Since the intervention was implemented at different periods for each group, this increase demonstrates the effect of the intervention with each of the three groups.
dIscussIon
Students with learning disabilities often struggle with their ability to com-prehend text, specifically in their abilities to monitor their own comprehension and in their knowledge of text structure (Gersten et al., 2001). In addition, students with LD
Learning Disabilities: A Contemporary Journal 13(1), 73-93, 2015
90
have trouble identifying story elements in text (Griffith, 1986; Montague, Maddux, & Dereshiwsky, 1990). Griffith (1986) and Montague and colleagues (1990) both found that students with learning disabilities who retold stories based on story grammar did not include as much information in their retells as students without disabilities. Research demonstrates that students with LD can benefit from specific instruction in comprehension strategies (Edmonds et al., 2009; Gersten et al., 2001; Scammacca et al., 2013; Swanson, 1999), and that one effective strategy is story grammar (Stetter & Hughes, 2010). In addition to students with learning disabilities, the current study also included students with other disabilities and struggling readers. All students were able to improve their reading comprehension scores, as measured by story grammar probes, indicating the effectiveness of this strategy for all struggling readers.
Results of this study confirm prior research that explicit instruction in a story grammar intervention can improve reading comprehension skills for students at the elementary school level (Boulineau et al., 2004; Idol, 1987; Idol & Croll, 1987; Stagliano & Boon, 2009). While some of the previous studies had long intervention periods (Stagliano & Boon, 2009), some of the students in previous studies received as little as six (Boulineau et al., 2004) or eight days of intervention (Idol & Croll, 1987). In addition, some of these studies provided only two days of teacher modeling (Idol & Croll, 1987). The current study not only extended the intervention period, but also increased the amount of modeling provided to students. Results indicate strong growth during the intervention phase, which may be due to the additional modeling and practice provided to students.
Previous research using narrative text has also indicated that although stu-dents did improve their comprehension skills during the intervention, these results were inconsistently maintained, resulting in mixed evidence of success (Boulineau et al., 2004; Idol, 1987; Idol & Croll, 1987). In all of these studies, students were given a measure immediately following the intervention (within days of the last session) and while some students were able to maintain their comprehension skills, many declined significantly. Maintenance measures in the cited studies (Boulineau et al., 2004; Idol, 1987; Idol & Croll, 1987) were equivalent to the posttest in the current study because they were all given immediately following the completion of the intervention phase. In contrast to the other studies, six of the eight students in the current study received posttest scores comparable to their final intervention point (within ten points). Only two students demonstrated more significant drops at posttest. However, seven of the eight students had posttest scores that did not overlap with any baseline points. Ricky was the exception and had a posttest score that overlapped with two of nine baseline points. Overall, strong posttest scores indicate the results of this intervention contin-ued past the conclusion of instruction.
Another way that the current study improved on previous research is that it included a maintenance measure conducted two weeks after the intervention ended. Although the majority of students did decrease somewhat at maintenance, they all remained above baseline levels, and most were able to maintain their scores within ten points of posttest scores. Six of eight students had maintenance scores that did not overlap with any baseline points, while the other two students had scores that overlapped with only one baseline point. This is another strong piece of evidence in support of this intervention. Finally, group two also received maintenance at four
Learning Disabilities: A Contemporary Journal 13(1), 73-93, 2015
91
weeks and two of the three students in this group were able to maintain their scores at high levels. The maintenance results indicate that the results of a story grammar intervention may continue even after the instruction ceases.
Implications for PracticeSince students with learning disabilities often lack knowledge of text struc-
tures (Gersten et al., 2001), it follows that explicit instruction in these text structures can be one way to help students improve their comprehension. Teachers can use story grammar and story maps in classroom instruction in order to provide students with a framework for approaching novel text (Idol, 1987; Idol & Croll, 1987). Use of story maps or other graphic organizers can help students with learning disabilities make sense of the text and allow them to record the most important information as they read (Edmonds et al., 2009). Explicit strategy instruction seems to be an effective way to improve reading comprehension for students with LD (Swanson, 1999).
Future Directions for ResearchResults indicate that story grammar continues to be a way to improve read-
ing comprehension for students with learning disabilities. Further research could expand on this work by continuing to provide students with longer intervention pe-riods in order to allow students more time to internalize the story grammar frame-work. The current study provided ten intervention sessions, which was on improve-ment on previous work, but even longer intervention periods would likely benefit students with learning disabilities. The more instruction and practice that students receive, the more likely they will be to improve their independent use of this strategy. It is possible that longer intervention sessions will allow students to more successfully maintain their skills over time. In addition, research could examine student attitudes towards this intervention in order to assess social validity. Finally, future research should examine if students can transfer these skills to other texts and generalize their gains in reading comprehension to other contexts.
LimitationsThere were several limitations to this study, the major one being that only
eight students were included, which limits the generalizability of the results. These students were at the same school, which also limits generalizability. Students were in different grades and receiving reading instruction in several different groups, so this intervention was the only consistent instruction received by all of the students. The multiple-baseline across groups design provides evidence that the intervention was causing the changes in the reading comprehension scores. This evidence is tempered somewhat by rising baselines for several students. However, NAP demonstrates that intervention, posttest, and maintenance scores for these students were above baseline scores. The combination of these two sources of data lends support to the success of this intervention, however, additional classroom or standardized posttest measures could have also been included to further examine gains in reading comprehension.
This was a study to test the effectiveness of a story grammar intervention. All of the intervention sessions in this study were provided by the researcher. Although this was reasonable for this study, in the future, it would be beneficial to train teachers
Learning Disabilities: A Contemporary Journal 13(1), 73-93, 2015
92
in the story grammar intervention. That way, students could get this intervention as part of their regular reading instruction. The instruction could also be more consis-tent, instead of only being provided two days per week. If teachers were trained to implement this intervention, all students could receive it as part of their daily reading instruction.
Time also became a factor in this study, which was conducted during the winter and spring of a school year. There were many snow days that interfered with the implementation of this study, as well as school events (e.g., assemblies, field trips) that also interfered. This spread the study out over a longer time period than ex-pected, which meant that the end of the study ran into end-of-the-year benchmark testing. Therefore, only one group was able to receive a second maintenance measure.
conclusIon
In summary, a story grammar strategy appears to improve reading com-prehension for students with disabilities and those who are struggling readers. All students received ten intervention sessions and were able to make and maintain gains in their ability to answer comprehension questions about a story. Intervention scores all demonstrated strong improvements from baseline with very little overlap between baseline and intervention points. Posttest and maintenance scores also demonstrated no overlap with baseline points. However, more research should be conducted to de-termine if gains continue to be maintained at later dates, as well as if general and spe-cial education teachers can successfully implement this intervention in the classroom.
references
Boulineau, T., Fore III, C., Hagan-Burke, S., & Burke, M. D. (2004). Use of story mapping to increase the story grammar text comprehension of elementary students with learn-ing disabilities. Learning Disability Quarterly, 27, 105-121.
Dimino, J., Gersten, R., Carnine, D., & Blake, G. (1990). Story grammar: An approach for pro-moting at-risk secondary students’ comprehension of literature. The Elementary School Journal, 91, 19-32.
Edmonds, M. S., Vaughn, S., Wexler, J., Reutebuch, C., Cable, A., Tackett, K. K., & Schnaken-berg, J. W. (2009). A synthesis of reading intervention and effects on reading com-prehension outcomes for older struggling readers. Review of Educational Research, 79, 262-300.
Gardill, M. C., & Jitendra, A. K. (1999). Advanced story map instruction: Effects on the reading comprehension of students with learning disabilities. The Journal of Special Educa-tion, 33, 2-17.
Gersten, R., Fuchs, L.S., Williams, J.P., & Baker, S. (2001). Teaching reading comprehension strategies to students with learning disabilities: A review of research. Review of Edu-cational Research, 71, 279-320.
Griffith, P. L. (1986). Story structure, cohesion, and propositions in story recalls by learning-disabled and nondisabled children. Journal of Psycholinguistic Research, 15, 539-555.
Gurney, D., Gersten, R., Dimino, J., & Carnine, D. (1990). Story grammar: Effective literature instruction for high school students with learning disabilities. Journal of Learning Disabilities, 23, 335-348.
Idol, L. (1987). Group story mapping: A comprehension strategy for both skilled and unskilled readers. Journal of Learning Disabilities, 20, 196-205.
Idol, L., & Croll, V. J. (1987). Story-mapping training as a means of improving reading compre-hension. Learning Disability Quarterly, 10, 214-229.
Learning Disabilities: A Contemporary Journal 13(1), 73-93, 2015
93
Kratochwill, T. R., Hitchcock, J., Horner, R. H., Levin, J. R., Odom, S. L., Rindskopf, D. M. & Shadish, W. R. (2010). Single-case designs technical documentation. Retrieved from What Works Clearinghouse website: http://ies.ed.gov/ncee/wwc/pdf/wwc_scd.pdf.
Leslie, L., & Caldwell, J. S. (2011). Qualitative Reading Inventory – 5. Upper Saddle River, NJ: Pearson Education.
Mahdavi, J. N., & Tensfeldt, L. (2013). Untangling reading comprehension strategy instruction: Assisting struggling readers in the primary grades. Preventing School Failure, 57, 77-92. doi: 10.1080/1045988X.2012.668576.
Montague, M., Maddux, C. D., & Dereshiwsky, M. I. (1990). Story grammar and comprehen-sion and production of narrative prose by students with learning disabilities. Journal of Learning Disabilities, 23, 190-197.
Onachukwu, I., Boon, R. T., Fore III, C., & Bender, W. N. (2007). Use of a story-mapping pro-cedure in middle school language arts instruction to improve the comprehension skills of students with learning disabilities. Insights on Learning Disabilities, 4, 27-47.
Parker, R. I., & Vannest, K. (2009). An improved effect size for single-case research: Nonoverlap of all pairs. Behavior Therapy, 40, 357-367.
Parker, R. I., Vannest, K. J., & Davis, J. L. (2011). Effect size in single-case research: A review of nine nonoverlap techniques. Behavior Modification, 35, 303-322.
Scammacca, N. K., Roberts, G., Vaughn, S., & Stuebing, K. K. (2013). A meta-analysis of inter-ventions for struggling readers in grades 4-12: 1980-2011. Journal of Learning Dis-abilities. Advance online publication.
Scruggs, T. E., & Mastropieri, M. A. (2013). PND at 25: Past, present, and future trends in sum-marizing single-subject research. Remedial and Special Education, 34, 9-19
Solis, M. M., Ciullo, S., Vaughn, S., Pyle, N., Hassaram, B., & Leroux, A. (2012). Reading com-prehension interventions for middle school students with learning disabilities: A synthesis of 30 years of research. Journal of Learning Disabilities, 45, 327-340.
Stagliano, C., & Boon, R. T. (2009). The effects of story mapping procedures to improve the comprehension skills of expository text passages for elementary students with learn-ing disabilities. Learning Disabilities: A Contemporary Journal, 7, 35-58.
Stetter, M. E., & Hughes, M. T. (2010). Using story grammar to assist students with learning disabilities and reading difficulties to improve their comprehension. Education and Treatment of Children, 33, 115-151.
U.S. Department of Education (2013). 2013 Reading Assessment. Washington, DC: National Center for Education Statistics, National Assessment of Educational Progress (NAEP).
Woodcock, R. W., Mather, N., & Schrank, F. A. (2004). Woodcock- Johnson III Diagnostic Read-ing Battery. Itasca, IL: Riverside.

94
LDW® Cars for KidsVehicle Donation Program
Your donation will make a difference in the life of a child with learn-ing disabilities and at the same time help you avoid the costs, responsi-bility, and time of trying to sell the car yourself. In addition, you maybe able to receive a tax deduction for your donation. Please consultyour tax advisor for more details. Rte. 128 Used Auto Parts & Salesprocesses all donated vehicles on behalf of LDW. LDW receives thehighest percentage of the proceeds of a liquidated vehicle.
LDW® Cars for Kids offers nationwide, year-round pick-up service.Simply call LDW® at 781-890-5399 and give us information aboutyour vehicle (please have your title available if possible) to arrange forfree pick up or visit our website at www.ldworldwide.org to print outa vehicle donation form.
100% of the proceeds from LDW® Cars for Kids is used to help LDW®
initiatives that support children with learning disabilities and theirfamilies.
HOW DO I DONATE?
HOW DOES MY DONATION HELP LDW?
WHY SHOULD I DONATE?
781-890-5399 www.ldworldwide.org
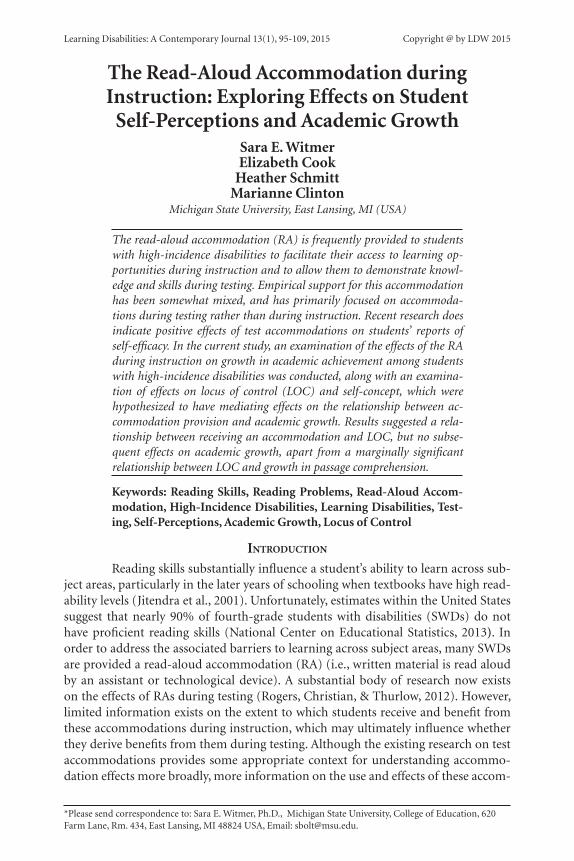
Learning Disabilities: A Contemporary Journal 13(1), 95-109, 2015 Copyright @ by LDW 2015
*Please send correspondence to: Sara E. Witmer, Ph.D., Michigan State University, College of Education, 620 Farm Lane, Rm. 434, East Lansing, MI 48824 USA, Email: [email protected].
The Read-Aloud Accommodation during Instruction: Exploring Effects on Student
Self-Perceptions and Academic GrowthSara E. Witmer Elizabeth Cook
Heather Schmitt Marianne Clinton
Michigan State University, East Lansing, MI (USA)
The read-aloud accommodation (RA) is frequently provided to students with high-incidence disabilities to facilitate their access to learning op-portunities during instruction and to allow them to demonstrate knowl-edge and skills during testing. Empirical support for this accommodation has been somewhat mixed, and has primarily focused on accommoda-tions during testing rather than during instruction. Recent research does indicate positive effects of test accommodations on students’ reports of self-efficacy. In the current study, an examination of the effects of the RA during instruction on growth in academic achievement among students with high-incidence disabilities was conducted, along with an examina-tion of effects on locus of control (LOC) and self-concept, which were hypothesized to have mediating effects on the relationship between ac-commodation provision and academic growth. Results suggested a rela-tionship between receiving an accommodation and LOC, but no subse-quent effects on academic growth, apart from a marginally significant relationship between LOC and growth in passage comprehension.
Keywords: Reading Skills, Reading Problems, Read-Aloud Accom-modation, High-Incidence Disabilities, Learning Disabilities, Test-ing, Self-Perceptions, Academic Growth, Locus of Control
IntroductIon
Reading skills substantially influence a student’s ability to learn across sub-ject areas, particularly in the later years of schooling when textbooks have high read-ability levels (Jitendra et al., 2001). Unfortunately, estimates within the United States suggest that nearly 90% of fourth-grade students with disabilities (SWDs) do not have proficient reading skills (National Center on Educational Statistics, 2013). In order to address the associated barriers to learning across subject areas, many SWDs are provided a read-aloud accommodation (RA) (i.e., written material is read aloud by an assistant or technological device). A substantial body of research now exists on the effects of RAs during testing (Rogers, Christian, & Thurlow, 2012). However, limited information exists on the extent to which students receive and benefit from these accommodations during instruction, which may ultimately influence whether they derive benefits from them during testing. Although the existing research on test accommodations provides some appropriate context for understanding accommo-dation effects more broadly, more information on the use and effects of these accom-
Learning Disabilities: A Contemporary Journal 13(1), 95-109, 2015
96
modations during instruction is needed to understand the extent to which they are truly helpful to students’ academic development.
Effects of the RA on Test ScoresThus far, the effects of RAs have been primarily studied when provided dur-
ing tests. Test accommodation studies often aim to determine the extent to which the accommodation results in greater performance improvements for SWD compared to improvements evident for students without disabilities. These studies have had mixed results. In the area of reading tests, one study found a positive effect of the accommodation on a reading test for third grade SWD, and no positive effect for the respective students without disabilities (Fletcher et al., 2006). However, another study of the effects of the RA on reading tests suggests that both groups benefit from the accommodation, with no differential boost evident (Fletcher et al., 2009). An ad-ditional study indicated no significant benefit of the accommodation for either group (McKevitt & Elliott, 2003), and others have suggested that both groups benefit, with SWD benefiting more than those without disabilities (Crawford & Tindal, 2004; Lai-tusis, 2010). Another study indicated that although both groups benefited, the extent of differential boost differed by grade level (Randall & Engelhard, 2010). In terms of RA effects on math tests, results have similarly been mixed, although slightly greater support for RA has been identified on these tests. One study did find a positive ef-fect of the RA for SWD and a lack of effect for students without disabilities (Tindal, Heath, Hollenbeck, Almond, & Harniss, 1998), and others have identified a benefit among both groups, with SWD benefiting significantly more on the entire math test (Elbaum, 2007) or specifically on multiple choice items on the math test (Schulte, Elliott, & Kratochwill, 2001).
There are a variety of potential explanations for the different findings across studies, including the disability and age characteristics of the participants, the meth-od by which the accommodation was provided, and the type of test. It is likely that accommodation effects will be more pronounced among those with specific reading disabilities, and particularly for those students with reading decoding challenges. Us-ing certain methods, the RA may allow easy repetition of item content and reading aloud of material at a rate ideally suited to the user. These methods of providing the RA may facilitate better access for the student and correspond to greater score increases in those research studies that have used the given methods. Finally, the tests under investigation in the given research studies may ultimately measure different reading constructs (e.g., comprehension vs. reading decoding vs. math problem-solv-ing), which may influence the extent to which the RA alters test scores.
The growing body of research on effects of the RA during testing has corre-sponded to the development of more specific accommodation policies that highlight the conditions under which such an accommodation should be provided, such as only on test sections designed to measure non-reading skills (Christensen, Braam, Scullin, & Thurlow, 2011). At the same time, policy guidelines continue to provide evidence of controversy. In the United States, accommodation guidelines recently put forth by the two major common core assessment consortia (Smarter Balanced and P.A.R.C.C.) represent two different approaches to addressing concerns with the RA on the literacy portions of these assessment programs for SWD (see Heiten, 2014);
Learning Disabilities: A Contemporary Journal 13(1), 95-109, 2015
97
however, these different policies both convey a general concern that highly liberal provision of the RA may undermine efforts to ensure that schools are held account-able for teaching students foundational skills in reading decoding.
Provision of RAs During InstructionInclusive accountability experts have argued that an accommodation that is
deemed appropriate for an individual student on a particular test should also be pro-
vided during instruction (Bolt & Thurlow, 2007; Ysseldyke et al.,1999). Instructional accommodation is argued to be necessary in order to (a) ensure that students have the opportunity to learn the material on which they are being tested, and (b) ensure that students know how to make effective use of an accommodation during testing (Bolt & Thurlow, 2007; Ysseldyke et al., 1999). Although studies have indicated that the RA is frequently provided during testing (Bielinski, Ysseldyke, Bolt, Friedebach, & Friedebach, 2001), there is less information on the extent to which it is provided dur-ing instruction, and on the effects of accommodations provided during instruction.
Only two studies were identified that investigated RAs provided during in-struction, and both were of students at advanced grade levels. One examined the ef-fects of a computer-based RA provided during instruction on middle school students diagnosed with dyslexia (Elkind, Cohen, & Murray, 1993). Results suggested that the accommodation improved comprehension scores for the majority of students who received it, although some students did not improve or actually had lower compre-hension scores when accommodated. The second study indicated that the RA pro-duced some academic benefits to adults with disabilities (Elkind, Black, & Murray, 1996). The participants who received the read-aloud instructional accommodation reported that the accommodation allowed them to pay better attention to the text, in-creased their focus, made reading easier, decreased stress, and improved reading rate and comprehension. However, more objective measures of these variables suggested that only reading rate improved.
Technology is making it increasingly possible for accommodations, such as the RA, to be more easily provided to students during instruction. There are several unique benefits of providing an RA using computer technology, including access to a wider range of content, the ability to select desired rate and volume, and the potential to facilitate reading skills while providing the accommodation, given that text can be highlighted on the computer screen as it is being read aloud. However, it is important to note that although such technology is becoming increasingly available, ongoing concerns exist with the extent to which teachers effectively incorporate such technol-ogies in practice (Shapley, Sheehan, Maloney, & Caranikas-Walker, 2010), and wheth-er students therefore have the opportunity to learn how to use and benefit from them. Currently, with the beginning implementation of the Smarter Balance and P.A.R.C.C. tests in the United States, options for having a proctor read aloud a paper-based test remain in place given that many schools do not have the technologies fully integrated into their instructional programming. Therefore, it is still important to gain a better understanding of the read-aloud accommodation as provided by an assistant.
Learning Disabilities: A Contemporary Journal 13(1), 95-109, 2015
98
Effects of Accommodations on Social Psychological FactorsAlthough a substantial body of literature has accumulated on the impact
of the RA on academic achievement tests, there is a small but growing foundation of literature of effects on other variables, such as self-efficacy and self-concept (Elbaum, 2002; Feldman, Kim, & Elliott, 2011; Lang, Elliott, Bolt, & Kratochwill, 2008). It may be the case that accommodations, when provided over long periods of time during instruction, have an impact on these social psychological variables, which in turn may help foster higher achievement. Such effects could not be investigated using a simple point-in-time examination of differential boost on a test. When examining research on the RA specifically, its relationship with students’ reports of self-efficacy, self-con-cept, locus of control (LOC), and similar psychological variables is very limited.
Over the past few decades, research has consistently found that students with learning disabilities demonstrate lower academic self-concept (ASC) than aver-age- and low-achieving students without disabilities (Chapman, 1988; Zeleke, 2004). A more recent study suggests that over time, students with learning disabilities accu-mulate frustration from school failure, which may in turn further decrease their ASC (Wei & Marder, 2012). Based on the notion that accommodations help SWD access learning opportunities in regular education classrooms, it follows that students with learning disabilities in regular education classrooms who receive more support may develop a more positive ASC than students who receive limited support (Elbaum, 2002). Such an effect, in turn, may further enhance the academic growth of these students. Feldman and colleagues (2011) found that testing accommodations had a differential boost on self-efficacy and motivation for students with learning dis-abilities - positively affecting test performance; however, they did not study the effects such boosts might have on learning.
A construct related to self-efficacy and self-concept – locus of control (LOC) – has been largely neglected in the literature for the past few decades. LOC refers to the extent to which one thinks he or she is in control of events that influence them; an internal LOC suggests that the individual senses greater control, whereas an external LOC suggests that the individual senses limited control (Rotter, 1954). LOC has been found to be a significant predictor of the extent to which children with learning dis-abilities were successful in their academic programs (Rogers & Saklofski, 1985). Swan-son (1981) found that those students with learning disabilities who reported a more internalized LOC experienced higher academic achievement. In a study that examined both ASC and LOC among SWDs, Hagborg (1996) found that students with higher ASC showed a more internalized LOC than those with lower ASC; moreover, students with a more internalized LOC and therefore higher ASC demonstrated a more favor-able outlook - regardless of differences in SES, intelligence, and academic skill.
The Current StudyAltogether, limited research has examined longitudinal gains of SWD result-
ing from the provision of instructional accommodations. Recent research suggests that although accommodations may not always result in a substantial performance boost for student during testing situations, they may have an important effect on stu-dents’ feelings of self-efficacy. It arguably follows that students who regularly receive support through accommodations during instruction, rather than solely during test-
Learning Disabilities: A Contemporary Journal 13(1), 95-109, 2015
99
ing, may develop a more internalized LOC - which in turn may accelerate their aca-demic growth. However, it could be the case that those receiving the RA experience a more externalized LOC, given that their access to written material is based on the presence of additional supports (e.g., an external reader or computer program). Giv-en these notions, it is important for research to more carefully explore the long-term effects of instructional accommodations on LOC, self-concept, and student learning. The corresponding research questions of the current study are:1. To what extent does provision of an RA during instruction (as provided through
a human assistant) correspond to greater growth in math and reading achieve-ment among students with high-incidence disabilities?
2. To what extent does provision of an RA during instruction (as provided through a human assistant) correspond to differences in LOC and ASC among students with high-incidence disabilities?
3. Do LOC and ASC mediate the relationship between the provision of an RA dur-ing instruction (as provided through a human assistant) and growth in achieve-ment among students with high-incidence disabilities?
Method
ParticipantsData were selected for analysis from the Special Education Elementary Lon-
gitudinal Study (SEELS). SEELS was funded by the Office of Special Education Pro-grams of the United States Department of Education in order to explore program-ming and outcomes for SWD at a national level. Several published studies indicate the purpose, sampling design, and measurement methods of SEELS (Wagner, Kutash, Duchnowski, & Epstein, 2005). We selected information on students from the SEELS sample who met the following criteria: (a) fourth grade or a higher grade level during the 2000-01 school year, corresponding to Wave 1, (b) identified as having a primary disability of one of the following during Wave 1: learning disability, cognitive impair-ment, emotional disability, or other health impaired, (c) reported to have a reading goal of improving reading skills or grade-level proficiency in reading (as opposed to a goal focused on development of pre-reading or functional literacy skills), (d) par-ticipated in the SEELS direct assessment across all three waves, and (e) had a teacher who participated in the teacher interview and a representative from their school who completed the school program interview during Wave 1. Analysis was limited to those in fourth grade and beyond given that this is the point at which students are likely expected to know how to read in order to complete many class activities. We also fo-cused on students with mild disabilities who were at beginning reading stages (as op-posed to those with more severe reading difficulties), given that they are more likely to receive instruction in general education environments in which accommodations may be particularly important for their success. 378 students met these criteria.
MeasuresItems from the Teacher and School Program Surveys. As part of the SEELS
project, the teacher who provided the majority of language arts instruction to the student included in the sample was asked to complete a survey (i.e., Teacher Survey)
Learning Disabilities: A Contemporary Journal 13(1), 95-109, 2015
100
during each wave of data collection. For the purposes of the current study, only a few items from this survey were selected for analysis. First, information about the stu-dent’s goal in reading was obtained. In addition, teachers responded to several items about the supports that they provided to the given student, including whether the stu-dent received a “reader/interpreter” during instruction. A second similar survey was administered to a school representative who was deemed knowledgeable about the target student’s overall program. The corresponding response to the “reader/interpret-er” item from this survey was also used. If either the teacher or school representative indicated that the student received the “reader/interpreter” accommodation during instruction at Wave 1, the student was considered part of the accommodated group.
Scores from the Direct Assessment. A subset of students within the SEELS dataset participated in a direct assessment during all three waves of data collection (i.e., 2000-01, 2001-02, 2003-2004). The following variables from the direct assess-ment were included in the analysis:
Background characteristics. Information on student gender, ethnicity, grade, income level, and urbanicity was obtained from Wave 1. Also, the scores (in words correct per minute) from two oral reading fluency passages were averaged as the “oral reading fluency” score.
LOC. A composite of five items from the School Attitude Measure (Wick, 1990) administered during Wave 1 was used as an indicator of LOC. Each item re-quired students to rate on a 4-point scale their level of agreement with several state-ments (e.g., “When I get bad grades it is because of bad luck,” “I don’t seem to have any control over the grades teachers give me”). For the composite score, item re-sponses are coded and summed such that higher scores reflect a more internalized LOC.
Academic self-concept. A composite of 10 items from the Student Self-Con-cept Scale (Gresham, Elliott, & Evans-Fernandez, 1993) administered during Wave 1 was used as an indicator of ASC. Each item required students to rate on a 3-point scale their level of agreement with statements about their academic experiences (e.g., “I can do my homework on time,” “I can finish my schoolwork easily”). Higher scores reflect a more positive ASC.
Calculation, Applied Problems, and Passage Comprehension. Scores from administrations of two math subtests (Calculation and Applied Problems) and one reading subtest (Passage Comprehension) included in the research edition of the Woodcock-Johnson Tests of Achievement-3 (WJ-Ach-3) from all three waves of data collection were included. It is important to note that the applied problems subtest items is read aloud to students; the passage comprehension subtest is not read aloud to students (apart from the subtest directions). Cronbach alpha reliabilities for these subtests are in the .80s across age and grade levels.
Data AnalysisAn application of structural equation modeling, namely latent growth curve
analysis, was used to examine the extent to which provision of the accommodation, LOC, and ASC during Wave 1 were associated with growth in math and reading achievement according to the model presented in Figure 1. The slope and intercept associated with growth models that were estimated separately for each subtest served
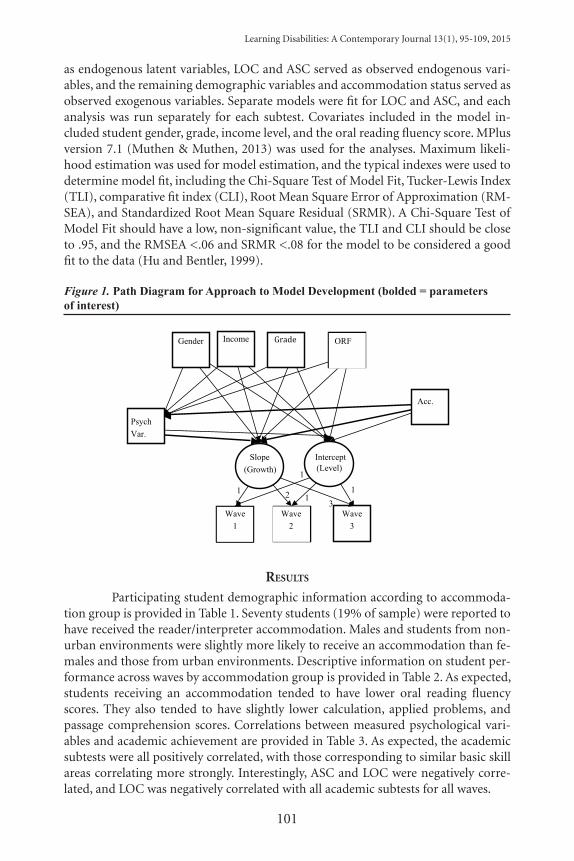
Learning Disabilities: A Contemporary Journal 13(1), 95-109, 2015
101
as endogenous latent variables, LOC and ASC served as observed endogenous vari-ables, and the remaining demographic variables and accommodation status served as observed exogenous variables. Separate models were fit for LOC and ASC, and each analysis was run separately for each subtest. Covariates included in the model in-cluded student gender, grade, income level, and the oral reading fluency score. MPlus version 7.1 (Muthen & Muthen, 2013) was used for the analyses. Maximum likeli-hood estimation was used for model estimation, and the typical indexes were used to determine model fit, including the Chi-Square Test of Model Fit, Tucker-Lewis Index (TLI), comparative fit index (CLI), Root Mean Square Error of Approximation (RM-SEA), and Standardized Root Mean Square Residual (SRMR). A Chi-Square Test of Model Fit should have a low, non-significant value, the TLI and CLI should be close to .95, and the RMSEA <.06 and SRMR <.08 for the model to be considered a good fit to the data (Hu and Bentler, 1999).
Figure 1. Path Diagram for Approach to Model Development (bolded = parameters of interest)
GradeIncome
Psych Var.
Gender
Acc.
ORF
Wave 1
Wave 2
Wave 3
Slope (Growth)
Intercept(Level)
1
11
1
3 2
results
Participating student demographic information according to accommoda-tion group is provided in Table 1. Seventy students (19% of sample) were reported to have received the reader/interpreter accommodation. Males and students from non-urban environments were slightly more likely to receive an accommodation than fe-males and those from urban environments. Descriptive information on student per-formance across waves by accommodation group is provided in Table 2. As expected, students receiving an accommodation tended to have lower oral reading fluency scores. They also tended to have slightly lower calculation, applied problems, and passage comprehension scores. Correlations between measured psychological vari-ables and academic achievement are provided in Table 3. As expected, the academic subtests were all positively correlated, with those corresponding to similar basic skill areas correlating more strongly. Interestingly, ASC and LOC were negatively corre-lated, and LOC was negatively correlated with all academic subtests for all waves.
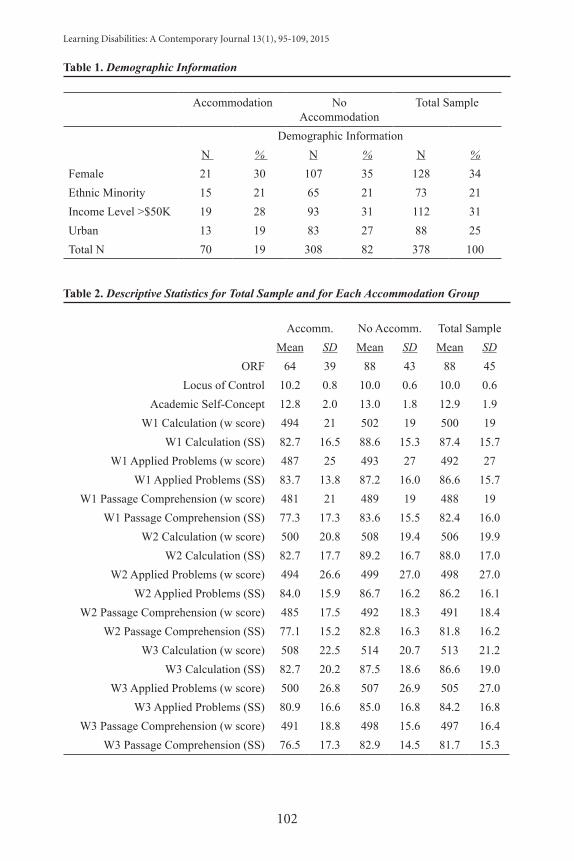
Learning Disabilities: A Contemporary Journal 13(1), 95-109, 2015
102
Table 1. Demographic Information
Accommodation No Accommodation
Total Sample
Demographic Information N % N % N %
Female 21 30 107 35 128 34Ethnic Minority 15 21 65 21 73 21Income Level >$50K 19 28 93 31 112 31Urban 13 19 83 27 88 25Total N 70 19 308 82 378 100
Table 2. Descriptive Statistics for Total Sample and for Each Accommodation Group
Accomm. No Accomm. Total SampleMean SD Mean SD Mean SD
ORF 64 39 88 43 88 45Locus of Control 10.2 0.8 10.0 0.6 10.0 0.6
Academic Self-Concept 12.8 2.0 13.0 1.8 12.9 1.9W1 Calculation (w score) 494 21 502 19 500 19
W1 Calculation (SS) 82.7 16.5 88.6 15.3 87.4 15.7W1 Applied Problems (w score) 487 25 493 27 492 27
W1 Applied Problems (SS) 83.7 13.8 87.2 16.0 86.6 15.7W1 Passage Comprehension (w score) 481 21 489 19 488 19
W1 Passage Comprehension (SS) 77.3 17.3 83.6 15.5 82.4 16.0W2 Calculation (w score) 500 20.8 508 19.4 506 19.9
W2 Calculation (SS) 82.7 17.7 89.2 16.7 88.0 17.0W2 Applied Problems (w score) 494 26.6 499 27.0 498 27.0
W2 Applied Problems (SS) 84.0 15.9 86.7 16.2 86.2 16.1W2 Passage Comprehension (w score) 485 17.5 492 18.3 491 18.4
W2 Passage Comprehension (SS) 77.1 15.2 82.8 16.3 81.8 16.2W3 Calculation (w score) 508 22.5 514 20.7 513 21.2
W3 Calculation (SS) 82.7 20.2 87.5 18.6 86.6 19.0W3 Applied Problems (w score) 500 26.8 507 26.9 505 27.0
W3 Applied Problems (SS) 80.9 16.6 85.0 16.8 84.2 16.8W3 Passage Comprehension (w score) 491 18.8 498 15.6 497 16.4
W3 Passage Comprehension (SS) 76.5 17.3 82.9 14.5 81.7 15.3
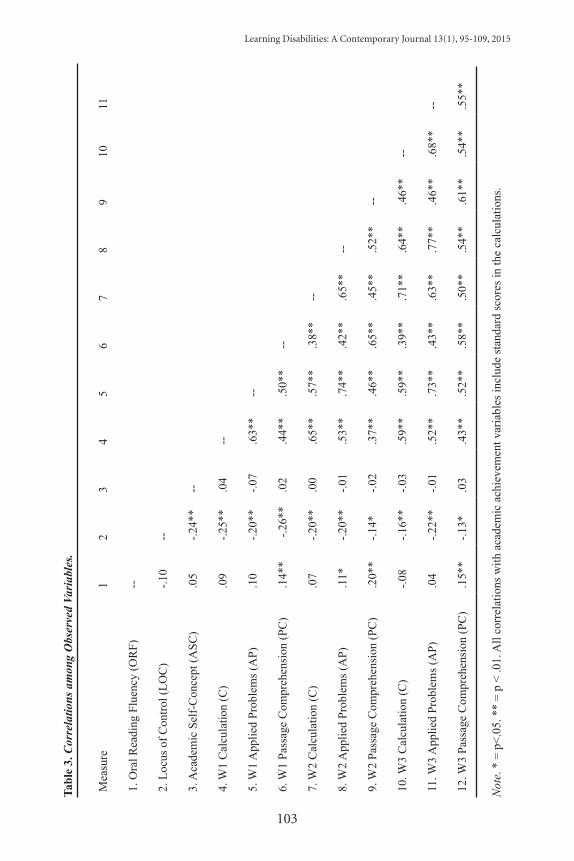
Learning Disabilities: A Contemporary Journal 13(1), 95-109, 2015
103
Tabl
e 3.
Cor
rela
tions
am
ong
Obs
erve
d Va
riab
les.
Mea
sure
12
34
56
78
910
11
1. O
ral R
eadi
ng F
luen
cy (O
RF)
--
2. L
ocus
of C
ontro
l (LO
C)
-.10
--
3. A
cade
mic
Sel
f-C
once
pt (A
SC)
.05
-.24*
*--
4. W
1 C
alcu
latio
n (C
).0
9-.2
5**
.04
--
5. W
1 A
pplie
d Pr
oble
ms (
AP)
.10
-.20*
*-.0
7.6
3**
--
6. W
1 Pa
ssag
e C
ompr
ehen
sion
(PC
).1
4**
-.26
**.0
2.4
4**
.50*
*--
7. W
2 C
alcu
latio
n (C
).0
7-.2
0**
.00
.65*
*.5
7**
.38*
*--
8. W
2 A
pplie
d Pr
oble
ms (
AP)
.11*
-.20*
*-.0
1.5
3**
.74*
*.4
2**
.65*
*--
9. W
2 Pa
ssag
e C
ompr
ehen
sion
(PC
).2
0**
-.14*
-.02
.37*
*.4
6**
.65*
*.4
5**
.52*
*--
10. W
3 C
alcu
latio
n (C
)-.0
8-.1
6**
-.03
.59*
*.5
9**
.39*
*.7
1**
.64*
*.4
6**
--
11. W
3 A
pplie
d Pr
oble
ms (
AP)
.04
-.22*
*-.0
1.5
2**
.73*
*.4
3**
.63*
*.7
7**
.46*
*.6
8**
--
12. W
3 Pa
ssag
e C
ompr
ehen
sion
(PC
).1
5**
-.13*
.03
.43*
*.5
2**
.58*
*.5
0**
.54*
*.6
1**
.54*
*.5
5**
Not
e. *
= p
<.05
. **
= p
< .0
1. A
ll co
rrel
atio
ns w
ith a
cade
mic
ach
ieve
men
t var
iabl
es in
clud
e st
anda
rd sc
ores
in th
e ca
lcul
atio
ns.
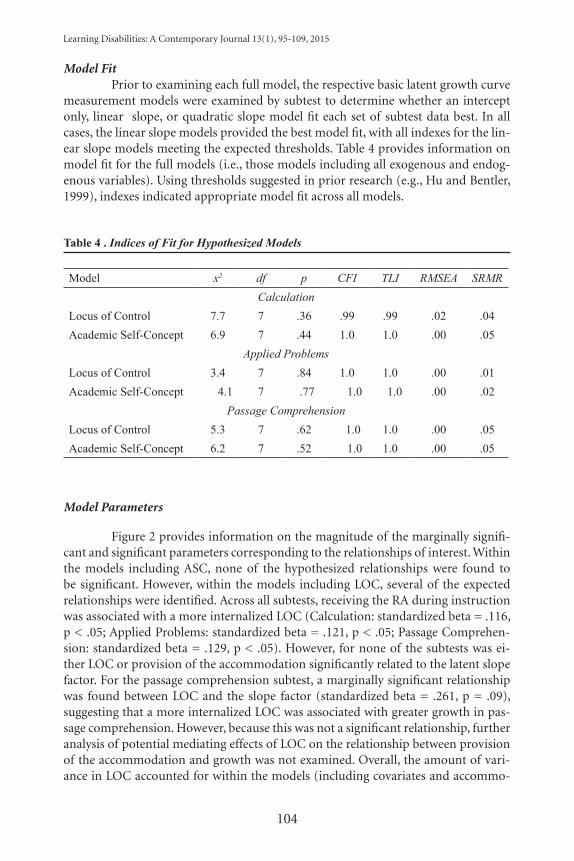
Learning Disabilities: A Contemporary Journal 13(1), 95-109, 2015
104
Model FitPrior to examining each full model, the respective basic latent growth curve
measurement models were examined by subtest to determine whether an intercept only, linear slope, or quadratic slope model fit each set of subtest data best. In all cases, the linear slope models provided the best model fit, with all indexes for the lin-ear slope models meeting the expected thresholds. Table 4 provides information on model fit for the full models (i.e., those models including all exogenous and endog-enous variables). Using thresholds suggested in prior research (e.g., Hu and Bentler, 1999), indexes indicated appropriate model fit across all models.
Table 4 . Indices of Fit for Hypothesized Models
Model x2 df p CFI TLI RMSEA SRMRCalculation
Locus of Control 7.7 7 .36 .99 .99 .02 .04Academic Self-Concept 6.9 7 .44 1.0 1.0 .00 .05
Applied ProblemsLocus of Control 3.4 7 .84 1.0 1.0 .00 .01Academic Self-Concept 4.1 7 .77 1.0 1.0 .00 .02
Passage ComprehensionLocus of Control 5.3 7 .62 1.0 1.0 .00 .05Academic Self-Concept 6.2 7 .52 1.0 1.0 .00 .05
Model Parameters
Figure 2 provides information on the magnitude of the marginally signifi-cant and significant parameters corresponding to the relationships of interest. Within the models including ASC, none of the hypothesized relationships were found to be significant. However, within the models including LOC, several of the expected relationships were identified. Across all subtests, receiving the RA during instruction was associated with a more internalized LOC (Calculation: standardized beta = .116, p < .05; Applied Problems: standardized beta = .121, p < .05; Passage Comprehen-sion: standardized beta = .129, p < .05). However, for none of the subtests was ei-ther LOC or provision of the accommodation significantly related to the latent slope factor. For the passage comprehension subtest, a marginally significant relationship was found between LOC and the slope factor (standardized beta = .261, p = .09), suggesting that a more internalized LOC was associated with greater growth in pas-sage comprehension. However, because this was not a significant relationship, further analysis of potential mediating effects of LOC on the relationship between provision of the accommodation and growth was not examined. Overall, the amount of vari-ance in LOC accounted for within the models (including covariates and accommo-
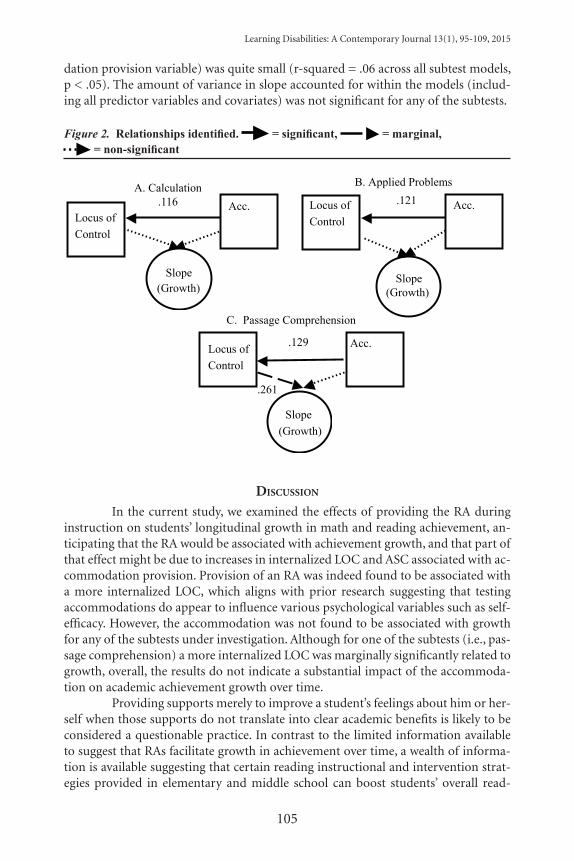
Learning Disabilities: A Contemporary Journal 13(1), 95-109, 2015
105
dation provision variable) was quite small (r-squared = .06 across all subtest models, p < .05). The amount of variance in slope accounted for within the models (includ-ing all predictor variables and covariates) was not significant for any of the subtests.
Figure 2. Relationships identified. = significant, = marginal, = non-significant
Acc.
Slope(Growth)
Locus of Control
B. Applied Problems
Locus of Control
Locus of Control
C. Passage Comprehension
Slope
(Growth)
Acc.
Acc.
Slope (Growth)
.121
.129
.261
A. Calculation.116
dIscussIon
In the current study, we examined the effects of providing the RA during instruction on students’ longitudinal growth in math and reading achievement, an-ticipating that the RA would be associated with achievement growth, and that part of that effect might be due to increases in internalized LOC and ASC associated with ac-commodation provision. Provision of an RA was indeed found to be associated with a more internalized LOC, which aligns with prior research suggesting that testing accommodations do appear to influence various psychological variables such as self-efficacy. However, the accommodation was not found to be associated with growth for any of the subtests under investigation. Although for one of the subtests (i.e., pas-sage comprehension) a more internalized LOC was marginally significantly related to growth, overall, the results do not indicate a substantial impact of the accommoda-tion on academic achievement growth over time.
Providing supports merely to improve a student’s feelings about him or her-self when those supports do not translate into clear academic benefits is likely to be considered a questionable practice. In contrast to the limited information available to suggest that RAs facilitate growth in achievement over time, a wealth of informa-tion is available suggesting that certain reading instructional and intervention strat-egies provided in elementary and middle school can boost students’ overall read-
Learning Disabilities: A Contemporary Journal 13(1), 95-109, 2015
106
ing competence, many of which are not fully implemented in schools at the current time (Duke & Block, 2013). Many students who are in need of an RA, particularly in elementary and middle school, will likely benefit from continued targeted reading interventions. Although ensuring access to instruction through effective accommo-dation is certainly a desirable feature of a student’s educational program, the limited information to suggest that the accommodation directly corresponds to achievement growth may point to a more urgent need to promote their academic achievement in more direct ways through targeted intervention.
Although not central to the aims of the present study, which was focused on academic growth as opposed overall academic performance, a particularly un-expected finding was the negative relationship between LOC and overall academic performance. Based on the findings of prior work (Swanson, 1981), we anticipated that a more internalized LOC would be associated with higher achievement among SWD. However, in contrast to the Swanson (1981) study which included only boys who had been receiving segregated special education services since first grade, the current sample represented both boys and girls, and likely included students who re-ceived services in more integrated settings. Furthermore, the students in the current sample responded in ways that represented a range of levels of LOC; although all were SWD, they did not respond in ways suggesting that they had a particularly external-ized LOC, as one might expect given that they all have experienced school challenges. It may be the case that changes in special education service delivery approaches over the past few decades have prevented students from developing a particularly external-ized locus of control. Another unanticipated finding was that although the RA cor-responded to a more internalized LOC, it did not correspond to a higher ASC. In fact, a negative correlation was identified between LOC and ASC (i.e., a more internalized LOC was associated with a lower self-concept), suggesting that those who feel in con-trol of their academic success do not necessarily have a particularly positive view of their own academic competence. It is possible that this is again related to the varying degrees of integration within general education settings in the sample; perhaps those who are more integrated do feel like they have some control over their academic suc-cess, but feel less academically competent given that they are likely to compare them-selves to others in their integrated classrooms who do not have disabilities.
LimitationsIt is important to mention several limitations in the design and analysis of
the current study. First, although teachers indicated providing students with the RA, it may not have been provided particularly frequently or with appropriate integrity, which may have influenced the failure to identify effects on academic growth. Next, it is important to point out that the predictor variables (apart from the measure of oral reading fluency) were based on student and teacher self-reports, which may not represent accurate measures of the given constructs. Accurate responses to items on the LOC scale used in this study may require a certain level of meta-cognitive skills that are beyond the level of many of the students, given that many students with dis-abilities struggle in this area (Sideridis, Morgan, Botsas, Padeliadu, & Fuchs, 2006). Additionally, it is important to note that there was somewhat limited variation in
Learning Disabilities: A Contemporary Journal 13(1), 95-109, 2015
107
the slope factor across participants. This may have limited our ability to detect the extent to which the predictor variables accounted for variation in growth. Finally, it is important to note that although we intentionally limited the analysis to students who had reading goals that suggested they were relatively high-functioning, students from multiple disability categories were included. Results may therefore have varied if there was a focus on one disability type; unfortunately, the sample sizes within the dataset were too small to run the respective analyses separately by disability type.
Implications for Research and PracticeResearch on the effects of accommodations for SWDs continues to provide
mixed evidence on their effectiveness. Although data from prior test accommoda-tion studies indicate that RAs are effective for at least a portion of the population of SWDs, and for certain areas of academic achievement, there does not appear to be universal support across studies for their use among SWDs broadly. Although ac-commodations have demonstrated indirect benefits for students, such as improving student’s self-efficacy, and in this study, were found to be associated with a more internalized LOC, questions remain about whether these effects go on to contribute to substantial student learning gains for most students.
As the methods by which RAs are provided to students advance with greater use of new technologies, it will be particularly important for research to investigate the impact that use of these supports have on both growth in reading achievement and growth in achievement across academic areas. Computerized RAs have certain potential advantages that may facilitate both access and learning of basic reading skills among students who are struggling, given that they can be programmed to al-low for both visual and auditory support with written material. Furthermore, many programs include additional features that can support development of additional broad reading skills, such as hyperlinks to word definitions to support vocabulary development, and embedded comprehension supports. Research on aspects that fa-cilitate student use of these supports, and that promote student achievement growth, will certainly be of great practical relevance to schools, teachers, and students.
There are a number of implications of this study for individuals who serve on school teams serving student with disabilities. As noted in prior research, it is im-portant for school teams to engage in careful analysis and monitoring to determine whether a particular student needs and benefits from an accommodation (Fuchs et al., 2000). Given that limited research currently exists to support the effectiveness of RAs for promoting growth in academic achievement, schools should not rely solely on RAs to address the academic needs of struggling readers. Substantial research does exist to support the effectiveness of various reading interventions at the advanced elementary levels and beyond; therefore, it is important for schools to ensure that such interventions are incorporated in educational programs for SWD. The RA has been shown to be effective for certain students under certain circumstances. How-ever, critical analysis among teachers regarding the conditions under which it may be helpful and appropriate is warranted, along with appropriate monitoring of its use and effectiveness for individual students, to ensure that it does indeed have the intended benefits.
Learning Disabilities: A Contemporary Journal 13(1), 95-109, 2015
108
references
Bolt, S. E., & Thurlow, M. L. (2007). Item-level effects of the read-aloud accommodation for students with reading disabilities. Assessment for Effective Intervention, 33, 15-28.
Chapman, J. W. (1988). Learning disabled children’s self-concepts. Review of Educational Re-search, 58, 347-371.
Christensen, L. L., Braam, M., Scullin, S., & Thurlow, M. L. (2011). 2009 state policies on as-sessment participation and accommodations for students with disabilities (Synthesis Report 83). Minneapolis, MN: University of Minnesota, NCEO.
Crawford, L., & Tindal, G. (2004). Effects of a read-aloud modification on a standardized read-ing test. Exceptionality: A Special Education Journal, 12, 89-106.
Duke, N. K., & Block, M. (2013). Improving reading in the primary grades. The Future of Chil-dren, 23, 55-72.
Elbaum, B. (2002). The self-concept of students with learning disabilities: A meta-analysis of comparisons across different placements. Learning Disabilities Research & Practice, 17, 216-226.
Elbaum, B. (2007). Effects of an oral testing accommodation on the mathematics performance of secondary students with and without learning disabilities. The Journal of Special Education, 40, 218-229.
Elkind, J., Black, M. S., & Murray, C. (1996). Computer-based compensation of adult reading disabilities. Annals of Dyslexia, 46, 159-186.
Elkind, J., Cohen, K., & Murray, C. (1993). Using computer-based readers to improve reading comprehension of students with dyslexia. Annals of Dyslexia, 43, 238-259.
Feldman, E., Kim, J. S., & Elliott, S. N. (2011). The effects of accommodations on adolescents’ self-efficacy and test performance. The Journal of Special Education, 45, 77-88.
Fletcher, J. M., Francis, D. J., Boudousquie, A., Copeland, K., Young, V., Kalinowski, S., & Vaughn, S. (2006). Effects of accommodations on high-stakes testing for students with reading disabilities. Exceptional Children, 72, 136-150.
Fletcher, J. M., Francis, D. J., O’Malley, K., Copeland, K., Mehta, P., Caldwell, C., Kalinowski, S., Young, V., & Vaughn, S. R. (2009). Effects of a bundled accommodations package on high stakes testing for middle school students with reading disabilities. Exceptional Children, 75, 412-428.
Fuchs, L. S., Fuchs, D., Eaton, S. B., Hamlett, C., Binkley, E., & Crouch, R. (2000). Using objec-tive data sources to enhance teacher judgments about test accommodations. Excep-tional Children, 67, 67-81.
Gresham, F., Elliott, S., & Evans-Fernandez, S.E. (1993). Student self-concept scale. Circle Pines, MN: American Guidance Service.
Hagborg, W. J. (1996). Self-concept and middle school students with learning disabilities: A comparison of scholastic competence subgroups. Learning Disability Quarterly, 19, 117-126.
Heiten, L. (2014). Testing plans differ on accommodations. Education Week, 29, 30-33. Hu, L., & Bentler, P. (1999). Cutoff criteria for fit indexes in covariance structure analysis: Con-
ventional criteria versus new alternatives. Structural Equation Modeling, 6, 1-55.Jitendra, A. K., Nolet, V., Xin, Y., Gomez, O., Renouf, K., Iskold, L., & DaCosta, J. (2001). An
analysis of middle school geography textbooks: Implications for students with learn-ing problems. Reading and Writing Quarterly, 17, 151-173.
Laitusis, C. C. (2010). Examining the Impact of Audio Presentation on Tests of Reading Com-prehension. Applied Measurement in Education, 23, 153-167.
Lang, S. C., Elliott, S. N., Bolt, D. M., & Kratochwill, T. R. (2008). The effects of testing ac-commodations on students’ performances and reactions to testing. School Psychology Quarterly, 23, 107.
Learning Disabilities: A Contemporary Journal 13(1), 95-109, 2015
109
McKevitt, B. C., & Elliott, S. N. (2003). Effects and perceived consequences of using read-aloud and teacher-recommended testing accommodations on a reading achievement test. School Psychology Review, 32, 583-600.
Randall, J., & Engelhard, G. (2010). Performance of students with and without disabilities un-der modified conditions: Using resource guides and read-aloud test modifications on a high stakes reading test. Journal of Special Education, 44, 79-93.
Rogers, C. M., Christian, E. M., & Thurlow, M. L. (2012). A summary of the research on the ef-fects of test accommodations : 2009-2010 (Technical Report 65). Minneapolis, MN: National Center on Educational Outcomes.
Rogers, H., & Saklofske, D. H. (1985). Self-concepts, LOC and performance expectations of learning disabled children. Journal of Learning Disabilities, 18, 273-278.
Rotter, J. B. (1954). Social learning and clinical psychology. New York: Prentice-Hall.Schulte, A. G., Elliott, S. N., & Kratochwill, T. R. (2001). Effects of testing accommodations on
standardized mathematics test scores: An experimental analysis of the performances of students with and without disabilities. School Psychology Review, 30, 527-547.
Shapley, K. S., Sheehan, D., Maloney, C., & Caranikas-Walker, F. (2010). Evaluating the im-plementation fidelity of technology immersion and its relationship with student achievement. Journal of Technology, Learning, and Assessment, 9, 6-10.
Sideridis, G. D., Morgan, P. L., Botsas, G., Padeliadu, S., & Fuchs, D. (2006). Predicting LD on the basis of motivation, metacognition, and psychopathology: An ROC analysis. Journal of Learning Disabilities, 39, 215-229.
Swanson, L. (1981). LOC and academic achievement in learning disabled children. The Journal of Social Psychology, 113, 141-142.
Tindal, G., Heath, B., Hollenbeck, K., Almond, P., & Harniss, M. (1998). Accommodating stu-dents with disabilities on large-scale tests: An experimental study. Exceptional Chil-dren, 64, 439-450.
Wagner, M., Kutash, K., Duchnowski, A. J., Epstein, M.H. (2005). The Special Education El-ementary Longitudinal Study (SEELS) and the National Longitudinal Transition Study-2 (NLTS2): Study designs and implications for students with emotional dis-turbance. Journal of Emotional and Behavioral Disorders, 13, 25-41.
Wei, X., & Marder, C. (2012). Self-concept development of students with disabilities: Disability category, gender, and racial differences from early elementary to high school. Reme-dial and Special Education, 33, 247-257.
Wick, P. (1990). School attitude measure. Chicago, ILL: American Testronics.Ysseldyke, J., Thurlow, M., Seyfarth, A., Bielinski, J., Moody, M., & Haigh, J. (1999). Instruc-
tional and assessment accommodations in Maryland (Maryland/Kentucky Report 6). Minneapolis, MN: University of Minnesota, National Center on Educational Out-comes. Retrieved from http://education.umn.edu/NCEO/OnlinePubs/MdKy6.htm.

110
Edited by: Nicholas D. Young, Ph.D., Ed.D. Christine N. Michael, Ph.D.
Powerful Partners In Student Success: Schools, Fam
ilies and Comm
unitiesYoung/M
ichael
www.ldworldwide.org
Powerful Partners In Student Success: Schools, Families and Communities
Anyone involved in the workings of a school in a community setting will find the chapters in this book to be useful in strengthening the existing relationships among schools, families, and community members and building powerful new ones. The authors cover a variety of important topics related to forging networks that support positive student development and school success.
Co-editors Young and Michael have invited experienced educators to share their success stories in case studies that illustrate school-family-community partnerships that work together to solve the challenges of contemporary education in this country. Their creative approaches represent best prac-tice in thinking about how to maximize scarce resources, how to engage families in our increasingly diverse society, how to leverage the strengths of community agencies and businesses, and how to involve students in leadership initiatives to better their schools.
Anyone involved in the workings of a school in a community setting will find the chapters in this book to be useful in strengthening the existing relation-ships among schools, families, and community members and building power-ful new ones. The authors cover a variety of important topics related to forging networks that support positive student development and school success.
Co-editors Young and Michael have invited experienced educators to share their success stories in case studies that illustrate school-family-community partnerships that work together to solve the challenges of contemporary edu-cation in this country. Their creative approaches represent best practice in thinking about how to maximize scarce resources, how to engage families in our increasingly diverse society, how to leverage the strengths of community agencies and businesses, and how to involve students in leadership initiatives to better their schools.
For more information, call LDW at 781-890-5399 or visit www.ldworldwide.org
Order your copy now!
Order Our Newest PublicationPowerful Partners in Student Success:Schools, Families and Communities
MARCH 2015 | VOLUME 13 | NO. 1
Learning Disabilities:A Contemporary Journal
AN INTERNATIONAL JOURNALPublished byLearning Disabilities Worldwidewww.ldworldwide.org
ISBN: 1930877153 ISSN: 1937-6928
EditorsTeresa Allissa CitroMatthias Grünke
Associate EditorsMarco G.P. Hessels Bruce Saddler
Guest EditorsCheryl A. Utley Festus E. Obiakor
179 Bear Hill Road | Waltham, MA 02451781-890-5399 | Fax 781-466-8887www.ldworldwide.org
Non Profit OrganizationSTANDARD
U. S. POSTAGEPAID
BOSTON, MAPERMIT NO. 54146
MARCH 2015 LEARNING DISABILITIES: A CO
NTEMPO
RARY JOURNAL 13 (1) 1-110
ISBN 1-930877-15-3
9
781930 877153
90000