Embed Size (px)
Citation preview
Manikya Lal Verma Shramjeevi College
ArthavatiAn International Journal
Volume-3 I Issue-2 I July - December, 2016
A Constituent Unit of JRN Rajasthan Vidyapeeth (Deemed) University
ARTHAVATIDepartment Of Economics,
Manikya Lal Verma Shramjeevi CollegeNear Town Hall, UdaipurWeb : www.jrnrvu.edu.in
1937
ISSN : 2348-2060
EditorialGrim countenance of world economy has warning fot India
The world economy today has a grim countenance as the change of power in US has ushered in a new era ofprotectionist policy which goes against the very core of Globalization. The idea of a world with borderlesseconomies is giving way to more nationalistic conservative economic order in which the national interests loomheavily on the interests of economic growth globally. America's new foreign policy initiatives forewarn of morestrategic changes in world order with increasing investments in the sectors of internal as '''ell as externalsecurity measures. Thus the humanitarian aid and assistance which India and other developing nations wereexpecting from the US might not materialize to the extent it was foreseen. Indian economy itself is gettingjerks and jams. The second week of May, 2017 has seen the biggest ever stride in Sensex and Nifry. RichardRekhy, CEO of KPMG in India has recently said, "The Economic Survey shows that although the economy ison the upswing, it faces downside risks from a muted global economy, impacting exports and inflow ofinvestments, leading to challenges in job creation." It is more than clear now that the growth in Indianeconomy has been over the last few years a jobless growth. Jobs have decreased in traditional sectors and insectors where there was a steep rise, the shift in the policy of US has threatened that it would nose - crash anyday. The economic survey of 2015-16 has revealed an interesting finding in the field of employmentgeneration. It shows a negative growth of -17 percent in leather and handloom industry, -6 percent in gems andjewellery and -12 percent in transport industry. Interestingly the transport industry has marked tremendousgrowth in the said period but employment generation in this industry has a negative growth. The largestgrowth in employment generarion has been in IT/BPO which is 178 percent followed by textile indusrry whichis 135 percent. These two sectors are now not in safe zone. The Trump Government has shown definite signsthat the IT/BPO employment opportunities in US companies will be now for Americans. FDI in retail hasopened new opportunities for MNCs and the craze for branded textiles among the youth in India might as wellaffect the prospects of Textile industry. The biggest sector of employment is agriculture. But in recent yearsthis sector has been neglected. The economic survey projects a growth rare of 4.1 percent in agriculture ascompared to 7.1 percent growth in GDP.
The uncertainties in agriculture have forced people engaged in agriculture to shift to other more stable sectorsof economy. The peasants committing suicides are reported more even the affluent states like Punjab andHaryana. Recently peasants from Tamilnadu staged a month long Dharna at JantarMantar demanding relieffrom drought. Crises of Indian Economy are many and their needs to be a more responsive state at the centreto resolve the issues of peasants' actoss the country. The Government has succeeded with its majoriry inLokSabha, passing of GST Bill and will soon be able to implement new economic reforms. But they should notignore the wriring on the wall.The editorial team does not own responsibility for the data presented in the individual research articles nor forthe interference made. The responsibiliry of the entire information and thought in the articles rests with theauthors. However, new ideas are always welcome to improve the qualiry, content and authenticiry. Vie wouldwelcome opinions, suggestions and cOtrections, if any by the readers.
Prof. Suman Pamecha

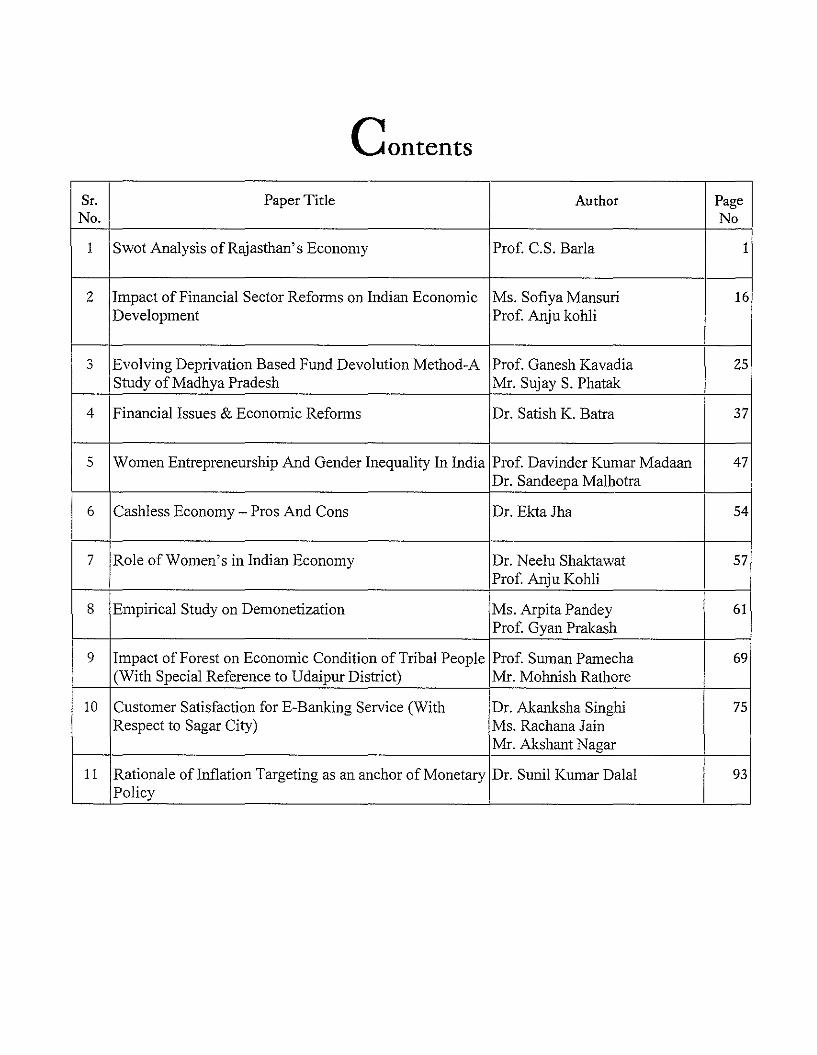
Contents
Sr. Paper Title Author PageNo. No
1 Swot Analysis of Rajasthan's Economy Prof. C.S. Barla 1
2 Impact of Financial Sector Reforms on Indian Economic Ms. Sofiya Mansuri 16Development Prof. Anju kohli
3 Evolving Deprivation Based Fund Devolution Method-A Prof. Ganesh Kavadia 25Study of Madhya Pradesh Mr. Sujay S. Phatak
4 Financial Issues & Economic Reforms Dr. Satish K. Batra 37
5 Women Entrepreneurship And Gender Inequality In India Prof. Davinder Kumar Madaan 47Dr. Sandeepa Malhotra
6 Cashless Economy - Pros And Cons Dr. EktaJha 54
7 Role of Women's in Indian Economy Dr. Neelu Shaktawat 57Prof. Anju Kohli
8 Empirical Study on Demonetization Ms. Arpita Pandey 61Prof. Gyan Prakash
9 Impact of Forest on Economic Condition of Tribal People Prof. Suman Pamecha 69(With Special Reference to Udaipur District) Mr. Mohnish Rathore
10 Customer Satisfaction for E-Banking Service (With Dr. Akanksha Singhi 75Respect to Sagar City) Ms. Rachana Jain
Mr. Akshant Nagar
11 Rationale ofInflation Targeting as an anchor of Monetary Dr. Sunil Kumar Dalal 93Policy

Swot Analysis of Rajasthan's EconomyProf. C.S. Barla'
Preamble
\\lith a total geographical area of 3.42 lakh km', Rajasthan is the largest state in India. The state has 10.4percent of total geographical area of India, while it has 5.67 percent of the country's total population.
It is interesting to note that only 1.1 percent of the total surface water is available in Rajasthan, while theproportion of ground water is JUSt 1.2 percent. Further, around 61 percent to total geographical area is droughtprone, and is frequently faces drought like conditions.
Yet, Rajasthan is rich in mineral deposits and claims monopoly in the production of several minerals. Stateddifferently, the State has good potential for development of minerals-based industries.
The objective of this note is to highlight the strengths of Rajasthan's economy while, at the same time, presentsome social, administrative and economic constraints that inhibit the optimum use of available physical andnatural stock of resources.
Yet, there is some ray of hope which provides an opportuniry for fastening the growth rate of State economy.In short, the present paper purports to analyse the strengths, weaknesses, opportunities and threats to theeconomy of Rajasthan.
Strengths of Rajasthan's Economy
As stated earlier, strengths of a given region lie in availability of physical/natural resources (such as minerals,soils, water, forests etc.) and administrative/political environment, and various policies formulared by thegovernment to improve the status of agriculture, industry and infrastructure. Such strengths of our economyhave been described below.
a) Vast Area
In 2011, the average density of population in Rajasthan was only 201 per km'albeit the range of such densiryvaried from 17 in Jaisalmer to 598 in Jaipur. Vast area, especially in western districts awaits availability of water,which would help develop these areas. Actually, soils in western districts pertain to sandy loam category aredevoid of adequate moisture, with warrant an improved access to irrigation facility. Thete is a great potential ofincreasing agricultural ptoduction in this tegion, as has been demonstrated aftet the onslaught ofIndita Gandhicanal water in the western districts such as Sri Ganganagar, Hanumangarh and partly in Barmer and Jaisalmerdistricts.
In short, thete lies a good potential of agricultural development in western districts, albeit this would warrantaccess to irrigation facility.
* Retd. Prof Rajasthan Uni"ersity, Jaipur, Raj.
2 Arthavati : An International Journal I Volume-3 Ilssue-2 I July-December, 2016
b) Museum of Minerals
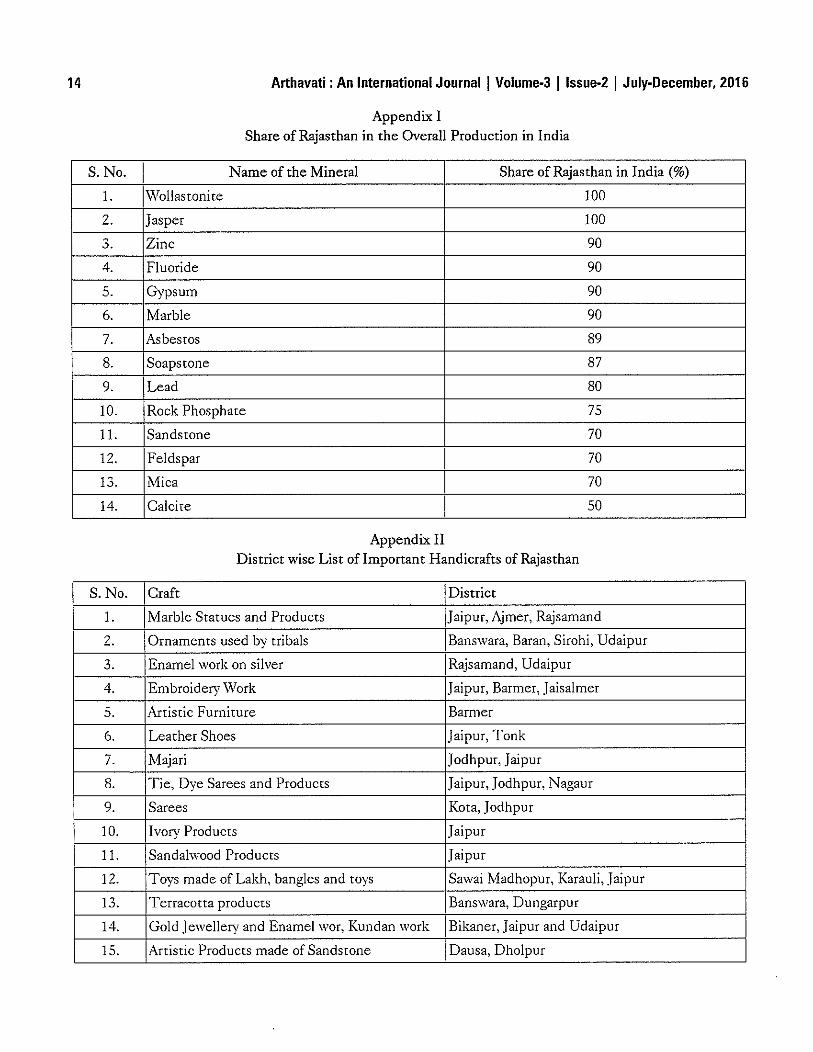
Rajasrhan is rich in several mineral deposits. In some minerals, the State's shate ranges from 70 to 100 percentof the total production in India (Appendix-I). It needs to be made clear that Mineral policy of 2016 has beenframed bur not yet cleared by various departments.
Further, the State has dominant share in the production of stone used in flooring houses and construction ofhouse roofs, and is available in Kota, Karauli, Jodhpur and Bundi districts.
Besides, the State has recently discovered crude oil in Barmer district, while Jalore has huge deposits ofgranite. These minerals have capacity of developing several industries across Rajasthan.
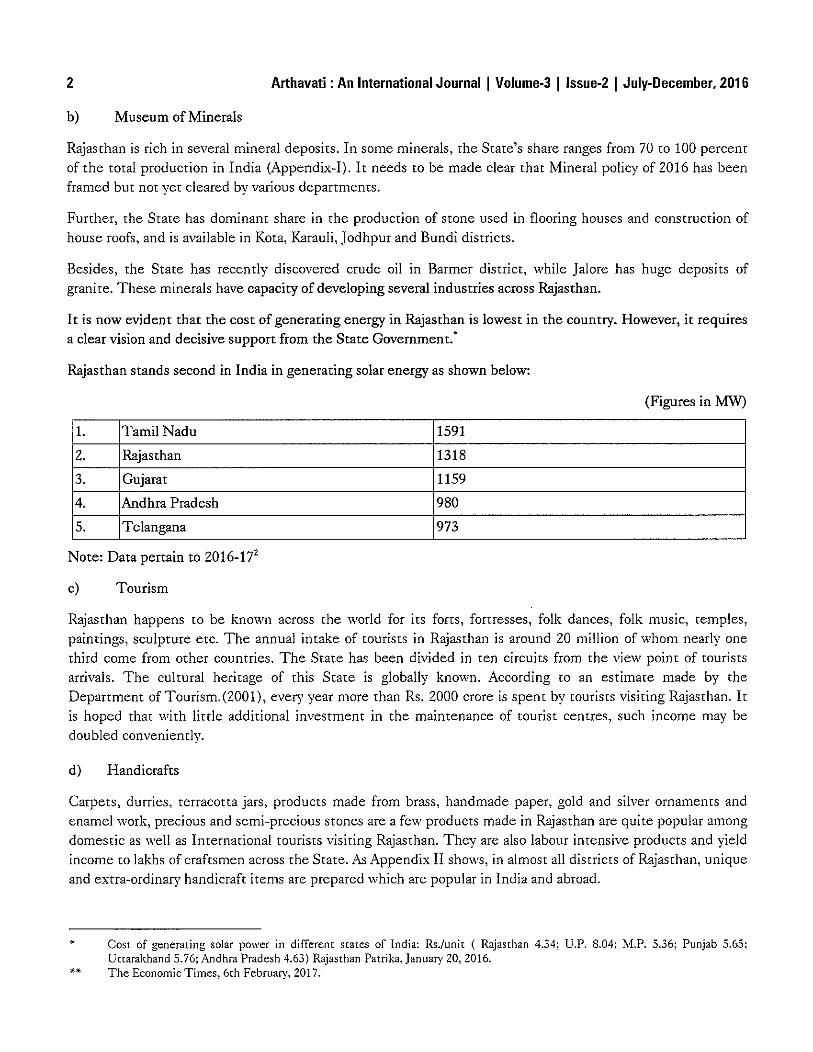
It is now evident that the cost of generating energy in Rajasthan is lowest in the country. However, it requiresa clear vision and decisive support from the State Government:
Rajasthan stands second in India in generating solar energy as shown below:
(Figures in MW)
l. Tamil Nadu 1591
2. Rajasthan 1318
3. Gujarat 1159
4. Andhra Pradesh 980
5. Telangana 973
Note: Data pertain to 2016-172
c) Tourism
Rajasthan happens to be known across the world for its forts, fortresses, folk dances, folk music, temples,paintings, sculpture etc. The annual intake of tourists in Rajasthan is around 20 million of whom nearly onethird come from other countries. The State has been divided in ten circuits from the view point of tourisrsarrivals. The cultural heritage of this State is globally known. According to an estimate made by theDepartment of Tourism.(200l), every year more than Rs. 2000 crore is spent by tourists visiting Rajasthan. Itis hoped that with little additional investment in the maintenance of tourist centres, such income may bedoubled conveniently.
d) Handicrafts
Carpets, durries, terracotta jars, products made from brass, handmade paper, gold and silver ornaments andenamel work, precious and semi-precious stones are a few products made in Rajasthan are quite popular amongdomestic as well as International tourists visiting Rajasthan. They are also labour intensive products and yieldincome to lakhs of craftsmen across the Srate. As Appendix II shows, in almost all districts of Rajasthan, uniqueand extra-ordinary handicraft items are prepared which are popular in India and abroad.
•
••
COSt of generating solar power in differem scates of India: Rs./unit ( Rajasthan 4.34; D.P. 8.04; M.P. 5.36; Punjab 5.65;Uuarakhand 5.76; Andhra Pradesh 4.63) Rajasthan Patrika, January 20, 2016.The Economic Times, 6th February, 2017.
Arthavati : An International Journal I Volurne-3 I Issue·2 I July-December, 2016
e) Entrepreneurial spirit
3
Rajasthan entrepreneurs are widely acclaimed rhroughout India and abroad. Marwaris initiared industries inwestern parts of rhe country in rhe last quarter of 19'h century. Scores of Marwaris migrated from Shekhawatiarea and set up industries, albeit some of rhem also became prominent traders in the Southern parts ofIndia.
f) Working even in adverse conditions
People of Rajasthan are well accustomed ro subsist even under hard conditions such as drought, when neitherwater nor food is available to them. Whenever they come across drought situation, large number of sheepbreeders migrates to other parts of the country together wirh their herds, or cattle, and generally return withthe onslaugh t of rains.
g) Comparative Advantage in producrion of herbal products
Herbal products such as aonla, ashwagandha, safed musli etc. have plenty of potential in Rajasthan. Theseproducts are widely used in preparation of Ayurvedic medicines.
h) Prominent Place in some agriculture crops
Crops like coriander, cumin seeds, (seed spices) chillies etc. are produced in almost all districts of Rajasthan.For coriander and cumin seed 45 percent of area and production are contributed by Rajasthan. Recent datashow that in recent month's export of processed seed spices from India have increased. This may eventuallybenefit our farmers too.
i) Breeds of Cattle
Rathi and Tharparkar breeds are known as the best breeds of cows across the cOUntry, while Nagori bulls arewidely acclaimed for their sturdy characteristics.
In brief, Rajasthan has a great potential for developing dairy industry. Already the State is a surplus region formilk, and contributes immensely to Mother Dairy in supply of milk.
Yet, there are numerous constraints to the oprimum use of available strengths on account of which rhe pace ofdevelopment in industry as well as agriculture in the Srate has been extremely low.
Weaknesses
The State of Rajasthan, notwithstanding the strengths endowed on it by nature, has some inherent weaknesseswhich do not allow the State ro smoothly develop its economy
1. Drought Prone Areas
As stated above, almost 61 percent of the geographical area in Rajasthan is arid or semi-arid, where rainfall isscanty and irregular. Every year the State Exchequer is required to spend huge amount in the western districtson famine relief. It seems, efforts of the Government and the money spent so far on drought-proofing have notbeen effective.
4 Arthavati : An International Journal I Volume-3 Ilssue-2 I July-December, 2016
2. Lack of Important Policies
Even though agriculture, animal husbandry and non-form rural businesses provide employment ro about 62percent of people in the State villages and contribute abour 40 percent to the State NSDP, the Government ofRajasthan has not formulated any policy for addressing the problems of these sectors, not to mention anyeffective measure for their redressed.
There are policies relating to water as also minerals, but the same are not effective, because mineral wealthand ground water are extracted recklessly in different regions of Rajasthan. Likewise, in the Industrial Policy(latest in 2010) not much has been prescribed to redress the problem of Industrial sickness.
3. Unbalanced Industrial Growth
Strangely enough, out of 33 districts, there is no industrial unit in 13 districts. It seems the State Governmentdoes 1I0t have all.1' agendafor developillg illdustries ill the backward regiolls of Rajasthan, even though adequate back-upin the form of minerals is available in such regions. Virtually no industries exist in districts like Karauli,Dholpur, Tonk, Sawai Madhopur, Sirohi, Baran, Nagaur, Bundi, Jalore, Barmer and Jaisalmer.
4. Lack if Investor Friendly Approach
Prospective investors in Rajasthan face numerous hurdles in getting the following linkages from StateGovernment: (a) land (b) power (c) water (d) no objection certificates from departments like (i) commercialtaxation (ii) State Pollution Control Board, etc.
Accordillg to Ecollomic Survey (GO!) 20JO-1J, the millimum time taken ill startillg a busilless ill Rojasthall is 6 mOllths.
Even in the document released by the State Government entitled "Approach Paper for Twelfth Five YearPlan" no mention was made for the meaSutes which the State Government proposed to take during 2012-17 toaccelerate the pace of industrial growth in Rajasthan over the five year ofXII Plan.
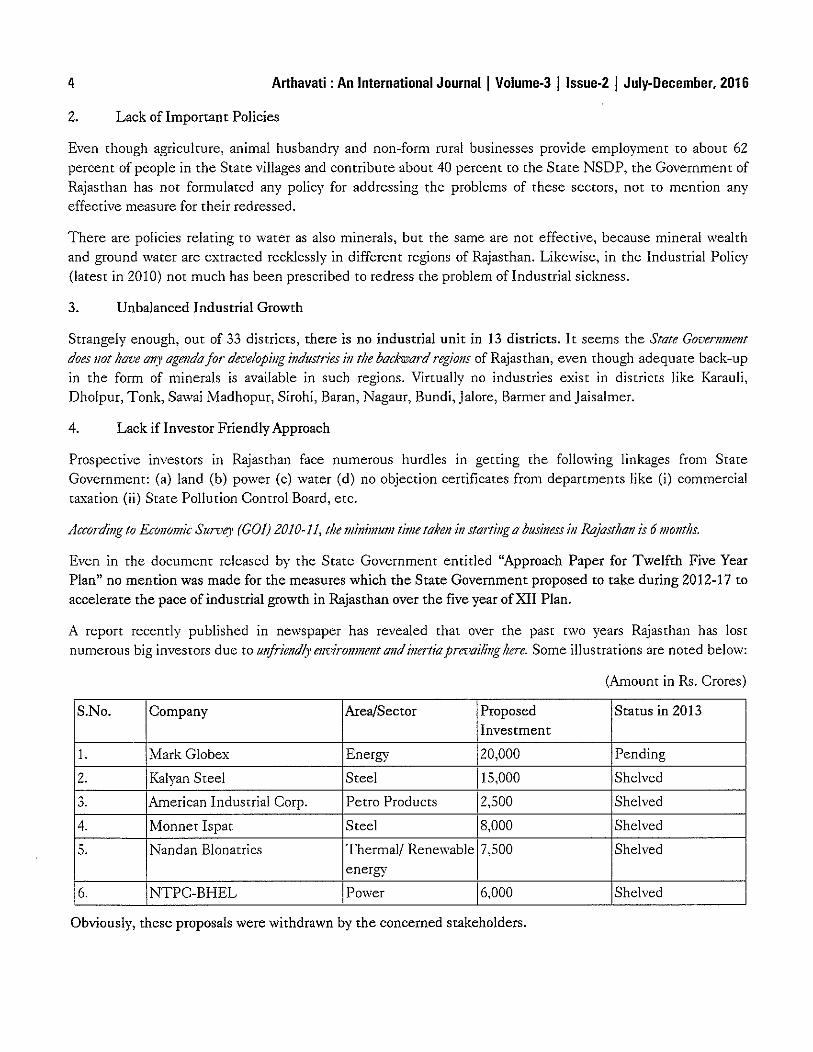
A report recently published in newspaper has revealed that over the past two years Rajasthan has lostnumerous big investors due to ulljriendl.l' envirollment alld illertiaprevailillghere. Some illustrations are noted below:
(Amount in Rs. Crores)
S.No. Company Area/Sector Proposed Status in 2013Investment
1. Mark Globex Energy 20,000 Pending
2. Kalyan Steel Steel 15,000 Shelved0 American Industrial Corp. Petro Products 2,500 Shelved~.
4. Monnet Ispat Steel 8,000 Shelved
J. Nandan Blonatrics 1Thermal! Renewable 17,500 Shelvedenergy
6. NTPC-BHEL Power 6,000 Shelved
Obviously, these proposals were withdrawn by the concerned stakeholders.
Arthavati : An International Journal I Volume·3 I Issue·2 I July-December, 2016 5
Thus, due to lack of interest among the decision makers of the State has failed to receive investment of Rs.59,000 crores from Indian as also alien entrepreneurs, including NTPC and BHEL combine, because noclearance could be given to them for several months.
A study by Montek Singh Anluwalia revealed that during 2000-06 period, about Rs. 7,00,000 crores wereinvested in Indian industries, of which Rajasthan could receive only 2.5 percent while 13.5 percent went toGujarat. The State Government must introspect as to why there is lack of expediency in giving approval forIndustrial units.
Ironically, the contribution of Industrial sector to State's NSDP has remained around 22 percent for the parttwo and half decades. In a report released by the former Planning Commission the rank of Rajasthan In
'Industrial climate has been consistently static at 13'" in the country.Source- Government of Rajasthan, "Approach Paper for Twelfth Five Year Plan" (2012) pp 47-49.
5. T&D Losses in Power Sector
On the one hand, Rajasthan suffers from irregular and inadequate availability of power bur at the same time,the State suffers from the problem of very high level of pilferage or T & D loss. In 1999, the proportion ofpilferage was abour 38 percent of power transmitted to different categories of power consumers, albeit itdeclined to 30 percent in December, 2016.
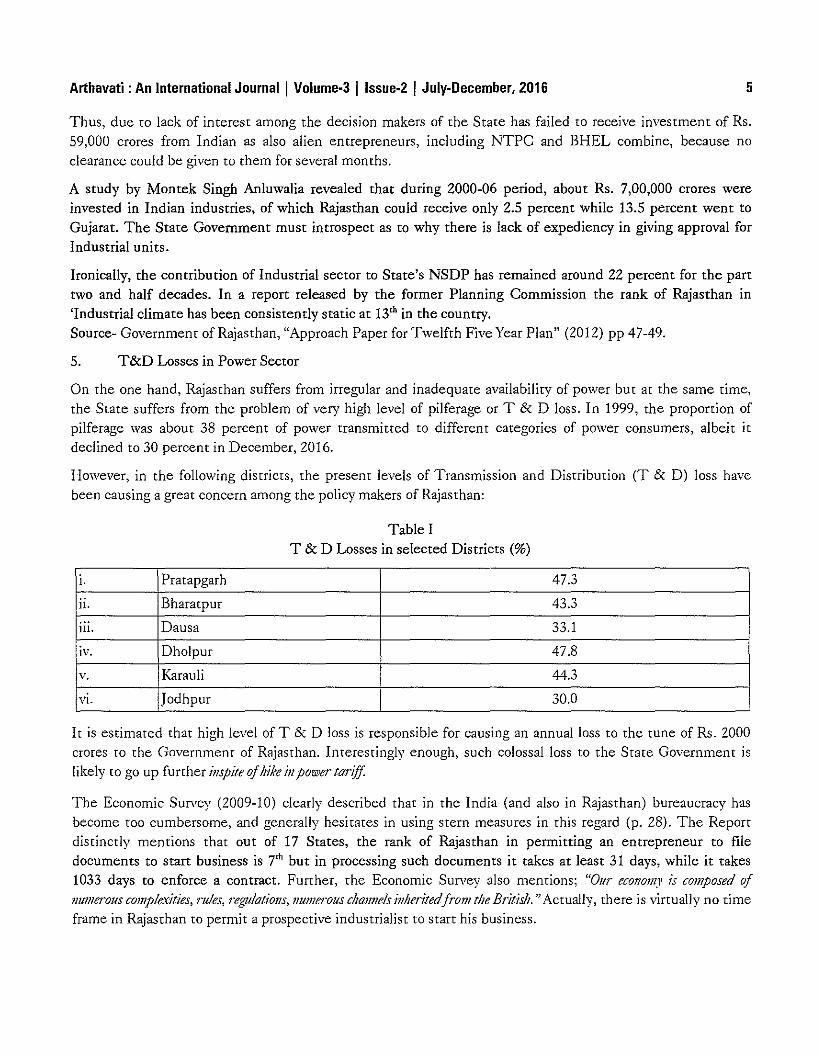
However, in the following districts, the present levels of Transmission and Distribution (T & D) loss havebeen causing a great concern among the policy makers of Rajasthan:
Table IT & D Losses in selected Districts (%)
I. Pratapgarh 47.3
II. Bharatpur 43.3
iii. Dausa 33.1
iv. Dholpur 47.8
v. Karauli 44.3
VI. Jodhpur 30.0
It is estimated that high level of T & D loss is responsible for causing an annual loss ro the tune of Rs. 2000crores to the Government of Rajasthan. Interestingly enough, such colossal loss to the State Government islikely to go up further illspite ofhike ill power tariff.
The Economic Survey (2009-10) clearly described that in the India (and also in Rajasthan) bureaucracy hasbecome too cumbersome, and generally hesitates in using stern measures in this regard (p. 28). The Reportdistinctly mentions that out of 17 States, the rank of Rajasthan in permitting an entrepreneur to filedocuments to start business is 7'" but in processing such documents it takes at least 31 days, while it takes1033 days to enforce a contract. Further, the Economic Survey also mentions; "Our ecollom)' is composed ofIlumerous complexities, 1"U!es, regulotiolls, Ilumerous chalilleis illheritedfrom the Britis/;."Actually, there is virtually no timeframe in Rajasthan ro permit a prospective industrialist ro statt his business.
6 Arthavati : An International Journal I Volume-3 I Issue-2 I July-December, 2016
6. Neglect ofAgro-Processing
Dominance of Rajasthan in the production of seed species notwithstanding, about 80 percent of coriander and75 percent of cumin seed produced in the state is exported to Gujarat. Thus, the entire value addition in thereproducts is appropriated by Gujarati entrepreneurs. Likewise, the state has virtually no facility ro processherbal products.
7. Environmental hazards
Flooring and roofing srones extracted in Dholpur, Kota, Rajsamand, Chittorgarh and Nagaur are responsible foraccumulation of huge srocks of waste/slurry. Similarly the problem of fly ash around thermal power stations hasassumed serious dimensions. Marble slurry accumulated around Dausa, Kishangarh, Rajsamand, Makrana andother areas is also causing environmental hazards. Further, the incidence of bronchial diseases around the srone
mines is also increasing.
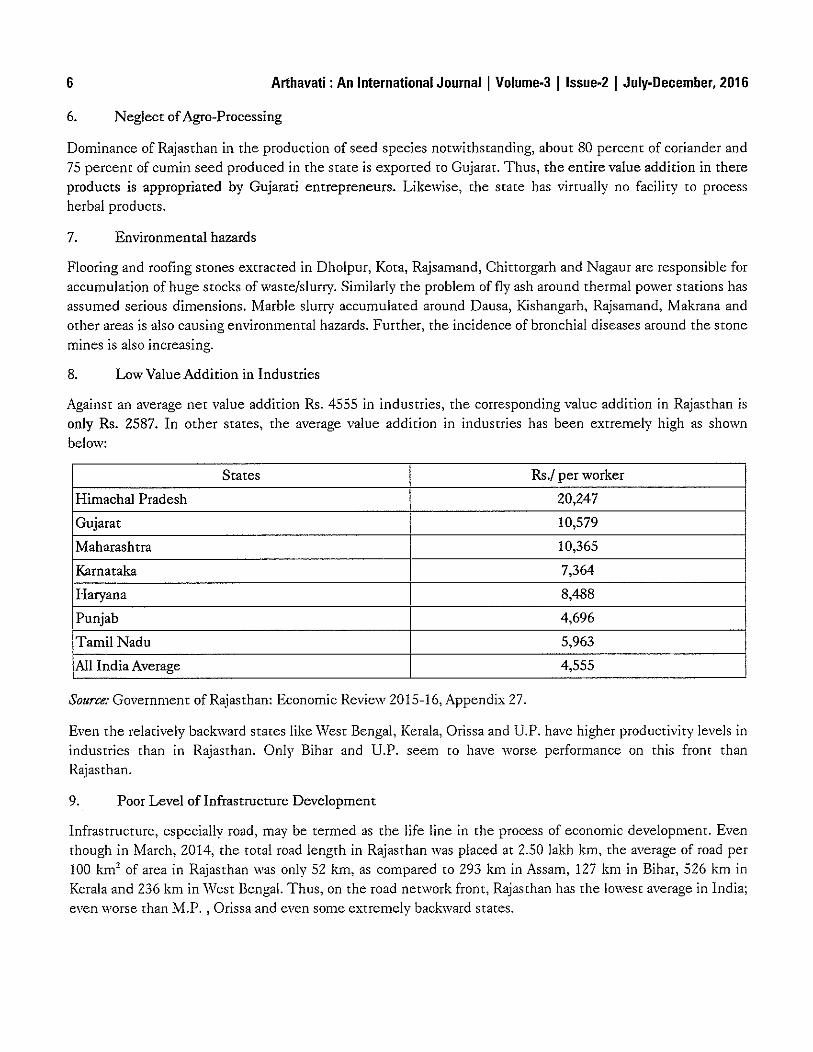
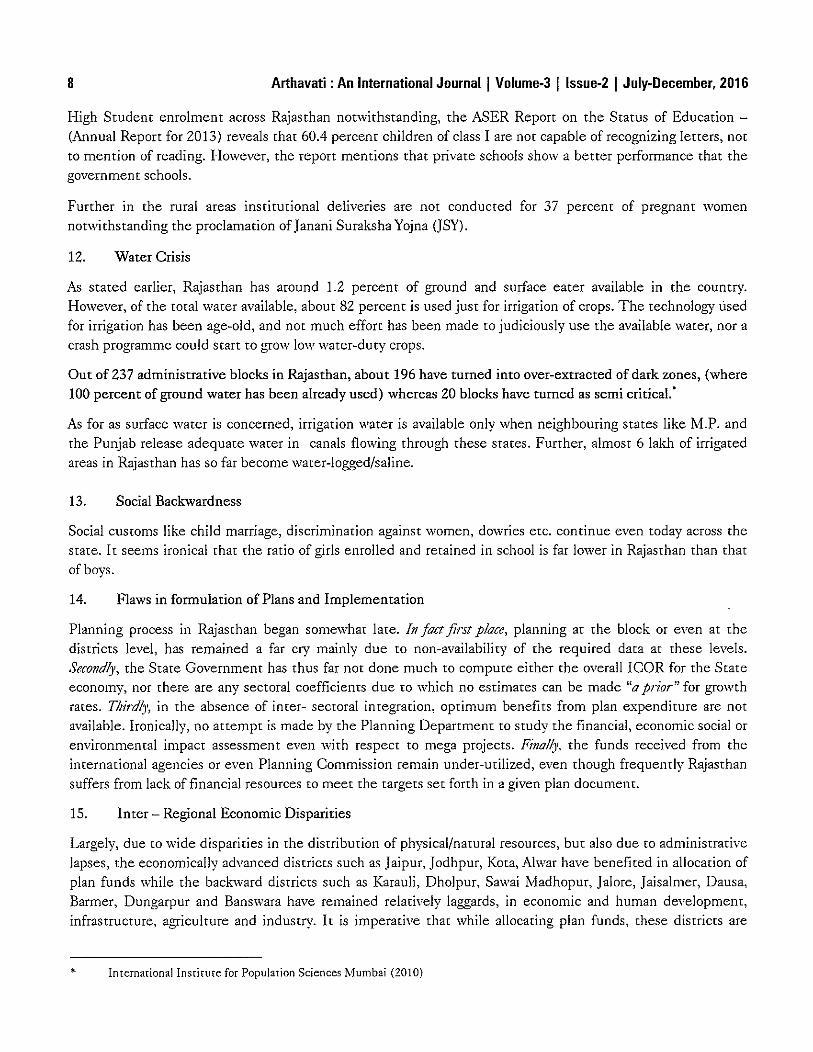
8. Low Value Addition in Industries
Against an average net value addition Rs. 4555 in industries, the corresponding value addition in Rajasthan isonly Rs. 2587. In other states, the average value addition in industries has been extremely high as shownbelow:
States Rs./ per worker
Himachal Pradesh 20,247
Gujarat 10,579
Maharashtra 10,365
Karnataka 7,364
Haryana 8,488
Punjab 4,696
Tamil Nadu 5,963
All India Average 4,555
Source: Government of Rajasthan: Economic Review 2015-16, Appendix 27.
Even the relatively backward states like West Bengal, Kerala, Orissa and D.P. have higher productivity levels inindustrics than in Rajasthan. Only Bihar and D.P. seem to have worse performance on this front thanRajasthan.
9. Poor Level of Infrastructure Development
Infrastructure, especially road, may be termed as the life line in the process of economic development. Eventhough in March, 2014, the rotal road length in Rajasthan was placed at 2.50 lakh km, the average of road per100 km' of area in Rajasthan was only 52 km, as compared ro 293 km in Assam, 127 km in Bihar, 526 km inKerala and 236 km in 'Vest Bengal. Thus, on the road network front, Rajasthan has the lowest average in India;even worse than M.P. , Orissa and even some extremely backward states.
Arthavati : An International Journal I Volume-3 I Issue·2 I July-December, 2016 7
Second, 75 percent of roads are fair-wearher roads while rhe average road lengrh has wide inter-disrricrvariarions. Taking infrasrructure index of rhe country as 100, the corresponding level in Rajasthan is less than76:10. Low Performance in the Demographic and Health Sectots
The decadal growth of population in India (2001-2011) had been 17.64 percent as against thecorresponding increase of 21.64 percent for Rajasthan. However, the decadal increase of population in theborder disrricts like Sri Ganganagar, Iaisalmer, Barmer and tribal districts like Dungarpur and Banswara hasbeen significantly higher than the State average. Incidentally, these disrricts have also registered lower percapita increase. Thus, higher increase in population has been tecorded in the tegions having high incidence ofeconomic inequalities.
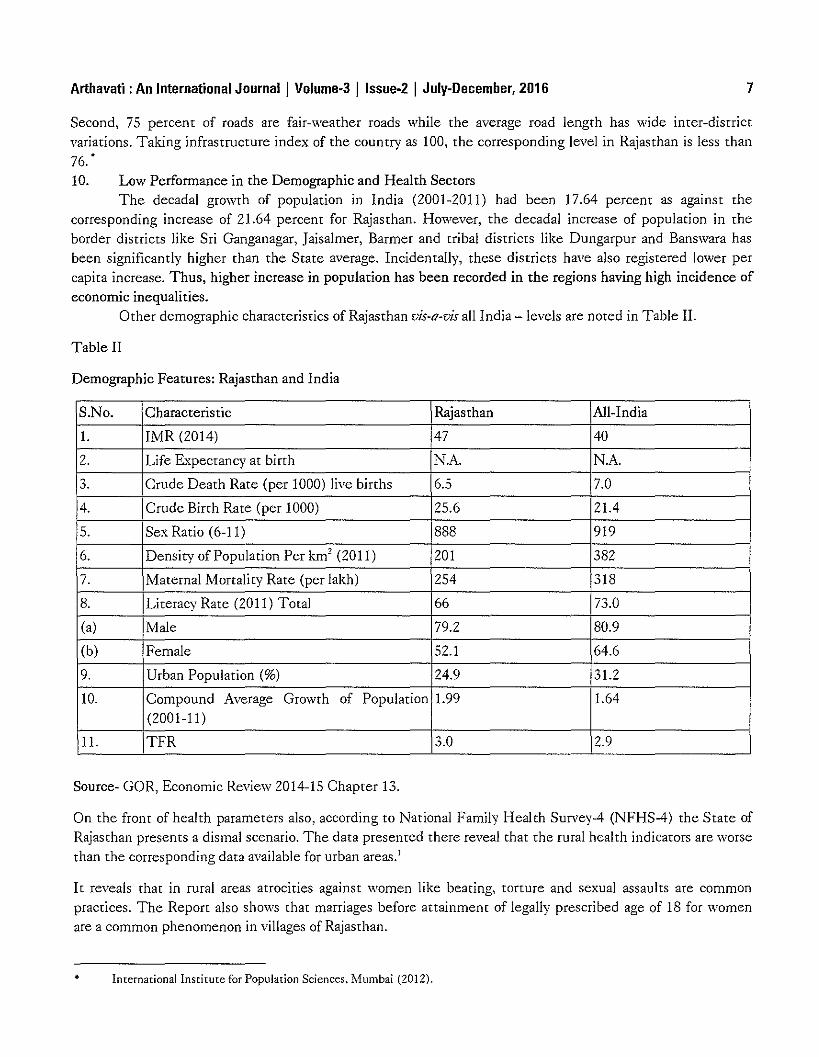
Other demographic characteristics of Rajasthan vis-a-vis all India -levels are noted in Table II.
Table II
Demographic Featutes: Rajasthan and India
S.No. Characteristic Rajasthan All-India
I. IMR (2014) 47 40
2. Life Expectancy at birth N.A. N.A.
3. Crude Death Rate (per 1000) live births 6.5 7.0
4. Crude Birth Rate (per 1000) 25.6 21.4
5. Sex Ratio (6-11) 888 919
6. Density of Population Per km' (2011) 201 382
7. Maternal Mortaliry Rate (per lakh) 254 318
8. Literacy Rate (2011) Total 66 73.0
(a) Male 79.2 80.9
(b) Female 52.1 64.6
9. Urban Population (%) 24.9 31.2
10. Compound Average Growth of Population 1.99 1.64(2001-11)
II. TFR 3.0 2.9
Source- GaR, Economic Review 2014-15 Chapter 13.
On the front of health parameters also, according to National Family Health Survey-4 (NFHS-4) the State ofRajasthan presents a dismal scenario. The data presented there reveal that the rural health indicators are worsethan the corresponding data available for urban areas. J
It reveals that in rural areas atrocities against ,vamen like beating, torture and sexual assaults are commonpractices. The Report also shows that marriages before attainment of legally prescribed age of 18 for womenare a common phenomenon in villages of Rajasthan.
• International Institute for Population Sciences, Murnbai (2012) .
8 Arthavati : An International Journal I Volume-3 I Issue-2 I July-December, 2016
High Student enrolment across Rajasthan notwithstanding, the ASER Report on the Status of Education (Annual Report fot 2013) teveals that 60.4 percent children of class I are not capable of recognizing letters, notto mention of reading. However, the report mentions that private schools show a better performance that thegovernment schools.
Further in the rural areas institutional deliveries are not conducted for 37 percent of pregnant womennotwithstanding the proclamation ofJanani Suraksha Yojna Gsy).
12. Water Crisis
As stated earlier, Rajasthan has around 1.2 percent of ground and surface eater available in the country.However, of the total water available, about 82 percent is used just for irrigation of crops. The technology usedfor irrigation has been age-old, and not much effort has been made to judiciously use the available water, nor acrash programme could start to grow low ,vater-dury crops.
Out of 237 administrative blocks in Rajasthan, about 196 have turned into ovet-extracted of dark zones, (whete100 percent of ground water has been already used) whereas 20 blocks have turned as semi critical:
As for as surface water is concerned, irrigation water is available only when neighbouring states like M.P. andthe Punjab release adequate water in canals flowing through these states. Further, almost 6 lakh of irrigatedateas in Rajasthan has so far become watet-logged/saline.
13. Social Backwardness
Social customs like child martiage, discrimination against women, dowries etc. continue even today across thestate. It seems ironical that the tatio of girls enrolled and retained in school is far lower in Rajasthan than thatof boys.
14. Flaws in formulation of Plans and Implementation
Planning process in Rajasthan began somewhat late. In fact first place, planning at the block or even at thedistricts level, has remained a far cry mainly due to non-availability of the required data at these levels.Second!.l', the State Government has thus fat not done much to compute either the overall ICOR for the Stateeconomy, nor there ate any sectotal coefficients due to which no estimates can be made "a prior" for growthrates. Third!.1', in the absence of intet- sectoral integration, optimum benefits from plan expenditure are notavailable. Ironically, no attempt is made by the Planning Department to study the financial, economic social orenvironmental impact assessment even with respect to mega projects. Final!.1'.. the funds received from theinternational agencies or even Planning Commission temain undet-utilized, even though frequently Rajasthansuffers from lack of financial resources to meet the targets set forth in a given plan document.
15. Inter - Regional Economic Disparities
Largely, due to wide disparities in the distribution of physical/natural resources, but also due to administrativelapses, the economically advanced districts such as Jaipur, Jodhpur, Kota, Alwar have benefited in allocation ofplan funds while the backward districts such as Katauli, Dholpur, Sawai Madhopur, Jalore, Jaisalmet, Dausa,Barmer, Dungarpur and Banswara have remained telatively laggatds, in economic and human development,infrastructute, agriculture and industry. It is imperative that while allocating plan funds, these districts are
• International Institute for Population Sciences Mumbai (2010)
Arthavati : An International Journal I Volume·3 I Issue·2 I July-December, 2016 9
given priority so that inter-district disparities can be minimized. Such inter-state disparities in the State haveperpetuated since 1951. It is interesting ro note that backward districts are not only lag behind in industries,but also suffer from low yielding farming system.
16. Poor Forest Resources
Rajasthan has only 8 percent of the rotal area under forests. Only in districts like Karauli, Baran and Sirohi thisproportion is over 30 percent, while the corresponding ratio in Udaipur is 28 percent. However, area underforests in Jodhpur and Churu is only 0.3 and 0.5 percent of rhe geographical area whereas in Jaisalmer, Nagaurand Barmer such ratio is around 1.0 percent.
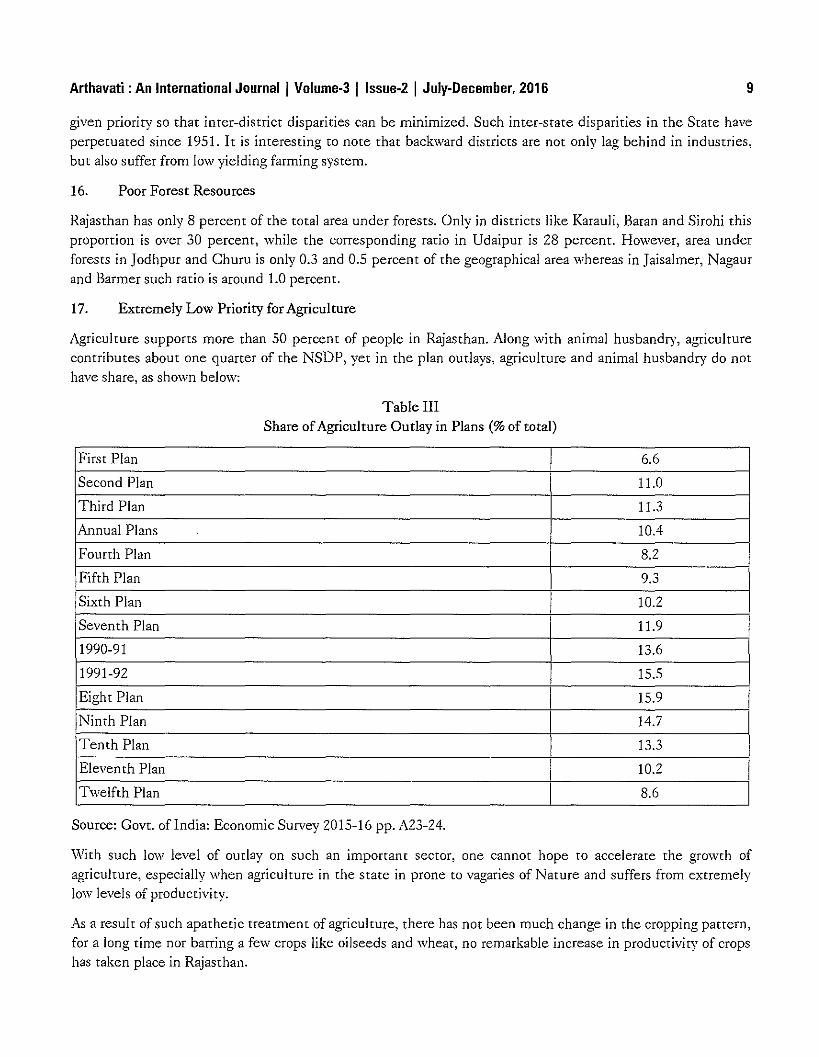
17. Extremely Low Priority for Agriculture
Agriculture supports more than 50 percent of people in Rajasthan. Along with animal husbandty, agriculturecontributes about one quarter of the NSDP, yet in the plan outlays, agriculture and animal husbandry do nothave share, as shown below:
Table IIIShare ofAgriculture Outlay in Plans (% of total)
First Plan 6.6
Second Plan 11.0
Third Plan 11.3
Annual Plans lOA
Fourth Plan 8.2
Fifth Plan 9.3
Sixth Plan 10.2
Seventh Plan 11.9
1990-91 13.6
1991-92 15.5
Eight Plan 15.9
Ninth Plan 14.7
Tenth Plan 13.31--Eleven th Plan 10.2
Twelfth Plan 8.6
Source: Govt. oflndia: Economic Survey 2015-16 pp. A23-24.
With such low level of outlay on such an important sector, one cannot hope ro accelerate the growth ofagriculture, especially when agriculture in the state in prone ro vagaries of Nature and suffers from extremelylow levels of productivity.
As a result of such apathetic treatment of agriculture, there has not been much change in the cropping partern,for a long time nor barring a few crops like oilseeds and wheat, no remarkable increase in productivity of cropshas taken place in Rajasthan.
10 Arthavati : An International Journal I Volume-3 I Issue-2 I July-December, 2016
It is thus evident that economic development of Rajasthan is inhibited largely due to numerous social, economic and politicalconstraints. Actually, thepotentialofhigh growth createdbyphysicalandnatural resourcesprouidedby Nature can be optimal/j'used ifonly these cotlStraints are remoued, anda strategy to that iffect is embeddedin ourplatlS.
Yet, one has a reason to ask: How would the State formulate its next Five Year Plan (2017-22) in the absenceof any formal body like Planning Board? It really appears ironical to observe that notwithstanding the strengthsof Rajasthan noted above, in terms of per capita NSDP at current prices, rhe State lags behind most otherstates ofIndia.'
18. Sanitation
Lack of integrated planning is evident from the fact rhat usually there are announcements to open new schoolsor upgrade the existing ones, yet schools remain devoid of proper buildings, toilets, teaching aids etc. Evenwhere toilets are available there is no water same is true for hospitals. Cities in Rajasthan present a scene ofcumulative garbage, lack of saniration/ sever lines, and poorly built streets.
However, in recent years, some new opporrunities have emerged that may lead to an improvement in the stateof Rajasthan's economy.
New Opportunities
The State of Rajasthan, notwithstanding the strengths endowed on it by narure, has some inherent weaknesseswhich do not allow the State to smoothly develop its economy
1. Tourism Development
Government of Rajasthan has lately recognized that there exists great opportunity for promoting cultural andmedical tourism across the State. The government has short listed about a dozen fairs and festivals which havebeen popular in different parts of Rajasthan where domestic as well as international tourists participate fromtime to time. It is also ensured that havelis of Shekhawati and districts like Jaisalmer, as also in other parts ofRajasthan.
It is expected that these measures would gradually restore the interests of domestic as well as internarionaltourists in Rajasthan. Further, tax exemptions and concessions are also ptovided to stake holders engaged intourism sector.
2. Lignite Deposits
As was mentioned earlier, the large deposits of lignite in Barmer and Jaisalmer districts are supposed to be amajor strength of Rajasthan. The total deposits of 100 crore tons, which have a capacity to generate between20000 to 25000 MVv of power annually which, in tum, could not only meet the demand originating in varioussectors of the State economy (presently about 11,000 MW), but may also leave enough surplus to be sharedwith neighbouring states.
Yet, the facr remains; the State of Rajasthan has not so far formulated any meaningful policy to utilize thelignite deposits available here.
Government of India, Economic Survey 2015-16 Vol. II PP. A 23-24
Arthavati : An International Journal I Volume-3 I Issue·2 I July-December, 2016 11
The deposits near Ginal in Barmer have been assigned to Rajasthan State. Mineral Development Corporation(RSMDC), while the remaining deposits have been assigned to Rajasthan State Mines and Minerals (RSMM).These two corporations are undertaking techno-feasibility studies, and may soon come out with positive resultsfor the optimum use of lignite deposits actoss the western regions of Rajasthan.
3. Petroleum and Natural Gas
Reserves of oil and natural gas have been explored in Barmer district and crude oil extracted is being sent rorefinery located in Gujarat. Prospects for setting up a refinery within Rajasthan are now quite bright, and adecision by the Central and State Governments to this effect needs to be taken shortly.
It is reo/loT surprising that the State Government has not been able to take anJ' decision so far to start the long awaited rtifinerJ'for oil reserves available here.
4. Gearing-up Policy for other Minerals
Policies related to granite, gypsum and other minerals are being prevamped by the State Government. Suchattempts will give a new direction to the mineral based industries of the State.
However, the opportunities outlined above do not seem to be in conformiry with the graviry of problems beingfaced by the State in various sectors. It actually requires a well thought out strategy to analyse the real issuesand diagnose the aliment and reformulate our policies. At the same time, policy makers of state are supposedto carefully study the internal and external threats confronting the state.
Threats
There are numerous factors which appear to be threarening the growth process of Srate economy. Such threatsare being outlined below:-
1. Depleting Water Table
Growth of agriculture warrants that the area under irrigation increases to facilitate adoption of cash and highyielding crops. However, the absence of any change in irrigation technology in Rajasthan implies a virtual wasteof water. It is feared that in large areas of Rajasthan, ground water may get exhausted, unless either farmersswitch out to low water duty crops, and or economic use of water becomes their mainstay. In fact, the state needsto adopt a judicious water use technologJ' via a low water-dutJ' cropping pattern. According to a report published byCentral Ground \Vater Board in 2015, except in 20 percent of the administrative blocks across the state, in restof Rajasthan against recharge of ground water, the use of water is more than 11 0 percent. In laipur district suchlevel is more than 200 percent. (Patrika, March 22, 2016).
2. Lack of competitive strength of producing units
Cost of production in export oriented products is significantly high, especially in apparels, gems & jewellery,carpets and such items largelcT on account of their extremelcT smo/I scale as compared to rival producers like China,Hong Kong and such Asian countries. It may be noted that large number of gem and jewellery producers ofRajasthan have shifted their units to China, and the number is increasing. Indian and the U.S. markets of gemstones are flooded with synthetic gem stones made in China. At the same time, the edible oil industry of
12 Arthavati : An International Journal I Volume-3 I Issue-2 I July-December, 2016
Rajasthan is being threatened by extremely cheap palm oil being imported from Malaysia. In the field ofhandicrafts also, cheap synthetic carpets made in China are posing a major threat to carpet exporters ofRajasthan.
All this warrants that immediate steps must be taken to improve the efficiency of our export units, lest ourexports would soon dwindle. Already, marble units of Rajasthan are being threatened by cheap marble beingimported from European countries. They include Wonder Marble, Turkish Marble and Italian Marble whichhave better lustre and whiteness than our marble. Likewise cement units of Rajasthan are also facing a threatdue to cheap cement coming from aboard.
3. Power Shortage
Shortage of power poses a major threat to agriculture as well as industry. Generally these units suffer not onlyfrom demand - supply mis-match, but also from irregular availability. Further, the State Government alreadyover burdened with T & D losses in power, as also heavy subsidy on power generation is likely to raise powertariff, which would give a big jolt to farmers and industrialists of the State. It is, however, satisfy no note thatin recent months, the State Government has taken a decision to provide subsidy on generation of solar poweracross the state. It is however, important to note that for ameliorating the power scenario, especially thecondition of discoms, has launched UDAY.
4. Poor State of Exports
Total exports of Rajasthan were around Rs. 32,597 crores in 2014-15 of which 32.9 percent were attributed to
agro and food products, 10.4 percent by textiles and 9.0 percent by gems and jewellery. Other exports includedengineering products (8.2 percent), metals (9.8 percent) and marble (5.5 percent). It needs to be made clearthat, as of now, exportsfrom Rajasthan seem to be a coneen! oftrading communit), onl)' and no incentives are offered tonative exporters by any official agency.
However, until few years ago, gems and jewellery, ready-made garments, handicrafts used to share a significantpart of our exports. It is a matter of concerns that the share ofthese product groups has fallen.
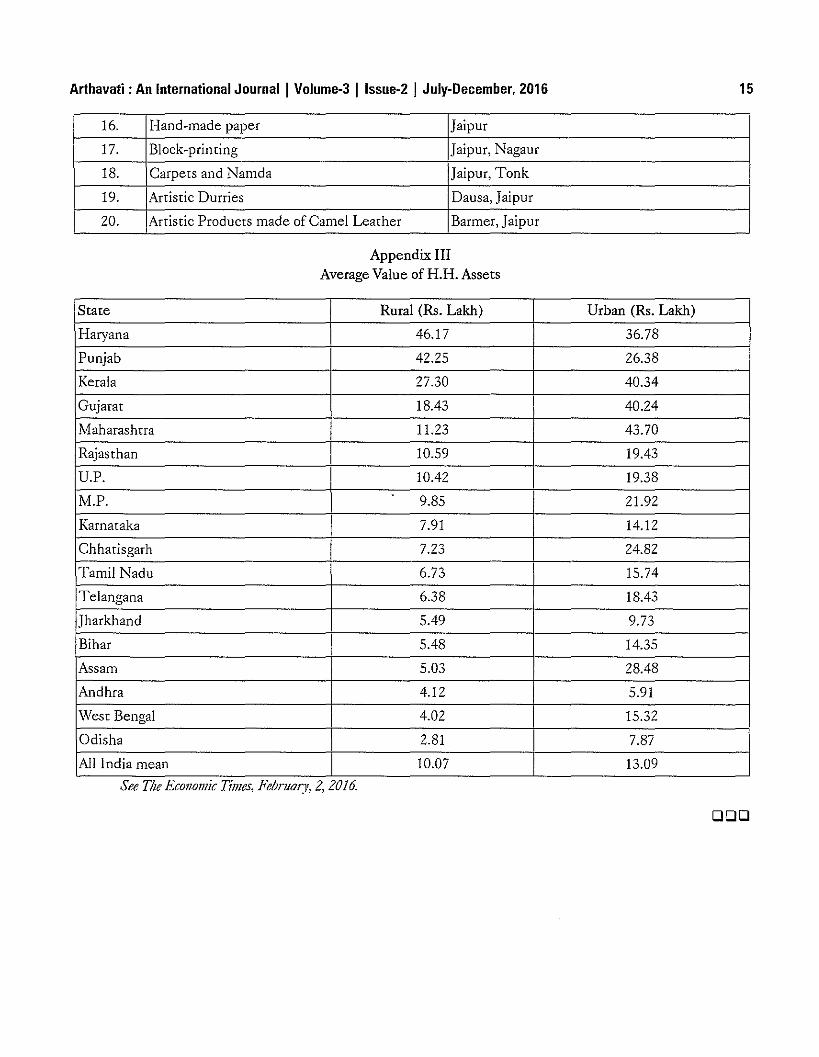
NSSO Survey, 70th Round
Appendix III reveals that the average value of assets in Rajasthan is far lower than the average correspondingvalue in other states. The reference period for such 70th Round of NSSO Survey was 2012-13.
NSSO Survey, 7lst Round
While the focus of NSSO 70th Round was on computations of asset value in urban and rural areas, the NSSOSurvey 71st Round attempted to highlight the burden of debt on the two strata of households. It was pointedout that on the whole, rural households were sceptical in borrowingforproductivepurposes in Rajasthan. The averageoutstanding loan was Rs. 72,000 in rural areas while for urban areas the corresponding average was Rs. 82,000 atthe time of such Survey.
Yet, the 71st Round of NSSO interestingly revealed that rural households in Rajasthan did not hesitate to takeloans for social ceremonies like weddings. Obviously, this dichotomy warrants a comprehensive study of RuralUrban Divide in Rajasrhan.
Arthavati : An International Journal I Volume·3 I Issue·2 I July-December, 2016 13
Areas which Warrant Immediate Attention of the Government for a Balanced and Steady Growth of StateEconomy
In its recent report, the World Bank had assigned Sixth rank to Rajasthan for ease of doing business. It seemsvery unlikely to observe that entrepreneurs of the State face numerous problems in starting business withinRajasthan, especially when more than one hundred years ago, entrepreneurs from this State were successful ininitiating business in the eastern and southern parts of India. If non-resident Rajasthanis (NRRs) could bepersuaded to invest their capital within the State, their contribution to the industrial development may boostthe economy of our State.
However, it would require a reversal in the approach of policy makers, bureaucrats and political leaders alike.Further, it also seems imperative to make our "Single W'indow Clearance Scheme" more meaningful andobjective to the tune of prospective NRRs and other investors.
Secondly, probably the State has not successfully utilized optimally the potential that exists in tourism sector.What we really need is a clean, lapka-free and hospitable environment which is pre-requisites for attractingdomestic as well as international tourists.
Third requisite for rapid economic development of State's economy is prevention of environmentaldegradation, especially in the areas which are being used for exploring and developing minerals, such as marble,stone, gypsum etc.
Agriculture supports nearly 50 percent of population and one quarter of our GSDP. It is, therefore, importantto evolve a cropping pattern which fulfils the following conditions:-
(a) High value addition(b) Judicious use of water resources(c) Amicable marketing channels for the benefit offarmers.
It is also important to evolve an effective policy for agricultural processing in the State. Thus, the StateGovernment must ensure that resources available to farmers (land, manpower and capital) are optimally usedto provide higher income to farmers.
Fifth, a pro-active and effective policy needs to formulated in Rajasthan for development of industries acrossall the districts for achieving a balanced development.
Finally, handicrafts and associated exports need a pro-a~live and positive approach. It is important that aproperly designed non-farm sector policy is promulgated in Rajasthan to help lakhs of craftsman working acrossall the districts of Rajasthan.
14 Arthavati : An International Journal I Volume-3 I Issue-2 I July-December, 2016
Appendix IShare of Rajasthan in the Overall Production in India
S.No. Name of the Mineral Share of Rajasthan in India (%)
1. Wollastonite 100
2. Jasper 100,
Zinc 90.).
4. Fluoride 90
5. Gypsum 90
6. Marble 90
7. Asbestos 89
8. Soapstone 87
9. Lead 80
10. Rock Phosphate 75
11. Sandstone 70
12. Feldspar 70
13. Mica 70
14. Calcite 50
Appendix IIDistrict wise List of Important Handicrafts of Rajasthan
S.No. Craft District
1. Marble Statues and Products Jaipur, Ajmer, Rajsamand
2. Ornaments used by tribals Banswara, Baran, Sirohi, Udaipur,
Enamel work on silver Rajsamand, Udaipur.).
4. Embroidery Work Jaipur, Barmer, Jaisalmer
5. Artistic Furniture Barmer
6. Leather Shoes Jaipur, Tonk
7. Majari Jodhpur, Jaipur
8. Tie, Dye Sarees and Products Jaipur, Jodhpur, Nagaur
9. Sarees Kota, Jodhpur
10. Ivory Producrs Jaipur
11. Sandalwood Products Jaipur
12. Toys made of Lakh, bangles and toys Sawai Madhopur, Karauli, Jaipur
13. Terracorra products Bans\vara, Dungarpur
14. Gold Jewellery and Enamel wor, Kundan work Bikaner, Jaipur and Udaipur
15. Artistic Products made of Sandstone Dausa, Dholpur
Arthavati : An International Journal I Volume·3 I Issue·2 I July-December, 2016 15
16. Hand-made paper Jaipur
17. Block-printing Jaipur, Nagaur
18. Carpets and Namda Jaipur, Tonk
19. Artistic Durries Dausa, Jaipur
20. Artistic Products made of Camel Leather Barmer, Jaipur
Appendix IIIAverage Value of H.H. Assets
State Rural (Rs. Lakh) Urban (Rs. Lakh)
Haryana 46.17 36.78
Punjab 42.25 26.38
Kerala 27.30 40.34
Gujarat 18.43 40.24
Maharashtra 11.23 43.70
Rajasthan 10.59 19.43
U.P. 10.42 19.38
M.P. 9.85 21.92
Karnataka 7.91 14.12
Chhatisgarh 7.23 24.82
Tamil Nadu 6.73 15.74
Telangana 6.38 18.43
]harkhand 5.49 9.73
Bihar 5.48 14.35
Assam 5.03 28.48
Andhra 4.12 5.91
West Bengal 4.02 15.32
Odisha 2.81 I 7.87
All India mean 10.07 13.09
See The Ecollomlc TUlles, Februol:J', 2, 2016.
DOD
Impact of Financial Sector Reforms on Indian EconomicDevelopment
Sofiya Mansuri'Prof. Anju Kohlit
Introduction
Financial sector is the part of an overall economy that is primarily made up of money markers, bankinginstitution and brokers. Financial sector reform means removing state regulation from the financial system and,usually in a subsequent phase of policy implementarion, creating the legal framework and institution that willpermit the sector to develop in the various dimensions.
This research paper summarizes the steps taken towards financial sector development and help to know abourthe reality of India's financial sector reforms.
The Indian financial system has changed considerably since 1990s, interesr rates have been deregulated andnew entrants are allowed in the banks and the securities business. The Indian equity market has become worldclass, new private banks have emerged that are more customer oriented than the other state owned banks.Meanwhile, the scale of saving within the economy has expanded considerably, much as East Asian economiesduring their high growth period. This adds to the need for further financial sector reforms. In particular, banksneed much greater freedom in asset allocation, while public sector banks did appear sounder to the publicduring 2007-08 crisis due to implicit government banking. They ought to be privatized to improve theirgovernance and minimize the recurrent need for recapitalization.
Financial Sector Reforms in India
The role of the financial system in India, until the early 1990s, was primarily restricted to the function ofchannelling resources from the surplus to deficit sectors. Whereas the financial system performed this rolereasonably well, its operations came to be marked by some serious deficiencies over the years. The bankingsector suffered from lack of competition, low capital base, low producrivity and high intermediation cost. Mterthe nationalization of large banks in 1969 and 1980, public ownership dominated the banking sector. The roleof technology was minimal and the quality of service was not given adequate importance. Banks also did notfollow proper risk management system and the prudential standards were weak. All these resulted in poor assetquality and low profitability
Among non-banking financial intermediaries, development finance institutions (DFIs) operated in an overprotected environment with most of the funding coming from assured sources at concessional terms. In theinsurance sector, there was little competition.
Research Scholar, Unir'ersit)' College ofSocia! ScieJlces and Humanities, lvlLSU, Udaipur.Emeritus Prof, UCSSH, MLSU, Udaipur.
Arthavati : An International Journal I Volume-3 I Issue-2 I Julv-December, 2016 17
The mutual fund industry also suffered from lack of competition and was dominated for long by oneinstitution, viz., the Unit Trust of India. Non-banking Financial Companies (NBFCs) grew rapidly, but therewas no regulation of their asset side. Financial markets were characterized by control over pricing of financialassets, barriers to entry, high transaction COSts and restrictions on movement of funds/participants between themarket segments. Apart from inhibiting the development of the markets, this also affected their efficiency.
Against this backdrop, wide-ranging financial sector reforms in India were introduced as an integral part of theeconomic reforms initiated in the early 1990s. Financial sector reforms in India were gtounded in the beliefthat competitive efficiency in the real sectors of the economy will not be realized to its full potential unlessthe financial sector was reformed as well.
Thus, the principal objective of financial sector reforms was to improve the allocative efficiency of resourcesand accelerate the growth process of the real sector by removing structural deficiencies affecting theperformance of financial institutions and financial markets.
Financial sector is a backbone of any economy and it plays a critical role in the mobilization and allocation ofresources. The constituents of the financial sector are banks, financial institutions, instruments and marketswhich mobilize the resources from the surplus sector and channelize the same to the different needy sectors inthe economy. Consumer interacts direcrly with the financial sector every time. They apply for a credit card,deposit a pay check in a bank, or take out a home loan, take benefits of insurance schemes from insurancecompanies, invest their money to gain extra profit in investment firms and these actions occur on a much largerscale between institutions and companies.
So the study of financial sector reforms and its impact on Indian economy is required and it will be a big stepin the India's economy. This paper is focused on financial sector reforms and its effects on Indian economy andpresents an overview of financial sector reforms and its impacts on Indian economy.
First part of this paper clears the meaning of financial sector and second describes the financial sector reformsin India. Especially this paper will analyze the impact of reforms on Real GOP and Sector wise growth rates ofGOP in India, Gross Domestic Saving and Capital Formation.
Period ofthe Study
The period of the study commences from 1971-72 to 2016-17. A study offorty six years is taken to analyze theimpact of financial sector reforms on Indian Economy. All the data have been based on the base year 2004-05.
Scope of the Study
The study is based at India level and includes major sectors of Indian Economy. For analytical purpose the GOPgrowth rates has been divided into three sectors; (a) agricultural (b) industrial and (c) service sector. Some otheraspects of economy like domestic sector saving and capital formation are also included in the study.
Objectives of the study
The major objective of the study is to assess the comparative analytical impact of reforms on the sector wisegrowth rate of GOP in the pre and POSt reform period. The specific objectives of the study are:
18 Arthavati: An International Journalj Volume-3 Ilssue-2 I July-December, 2016
• To study the major reforms in the financial sector and analyze their implications on Indian Economy.
• To evaluate the relative changes in real GDP growth rates in the pre and post reform period.
• To make a comparative analysis of sector wise GDP growth rates in the wake of financial sector reforms.
• To analyze the GtoSS Domestic Saving as percentage to GDP.
• To examine the implication of financial sector reforms on economic development.
Hypothesis of the study
Following hypotheses are formulated:-
• The financial reforms have increased the Real GDP growth rate.
• Sector ,vise growth rate is improved.
• Saving and capital formation rate is positively increased due to financial reforms.
• There is positive impacr of financial sector reforms in the economy.
Research Methodology
The study relies on rhe secondary dara published by institutions and organizations concerned with differentsectors. The publications of Reserve Bank of India- sector wise domestic saving and capital formation, RBIBulletins, Handbook of statisrics on Indian Economy, Annual Survey of govr. of India and other reportsprovided the data. Dara published on websites of Government of India; data.gov.in andplanningcommission.gov.in have also been adopted for the study.
For analysis of data mean (average), Standard Deviation etc statistical tools have been used.
Data Analysis and discussions
The impact of reforms on the Indian Economic Development has been examined on the basis of followingparameters:
(a) Real GDP Growth Rates.
(b) Agriculture, Industry and services sector growth of India.
(c) Gross Domestic Savings and Capital Formation.
(a) Real GDP Growth Rates ofIndia
Real Gross Domestic Product (GDP) an inflation-adjusted measure that reflects the value of all goods andservices produced in a given year, expressed in base-year prices.
Real GDP growth rates are shown in table-1 and they are classified into two sections; Pre Reform Period andPost Reform Period Real GDP growth Rates. The base year is 2004-05.
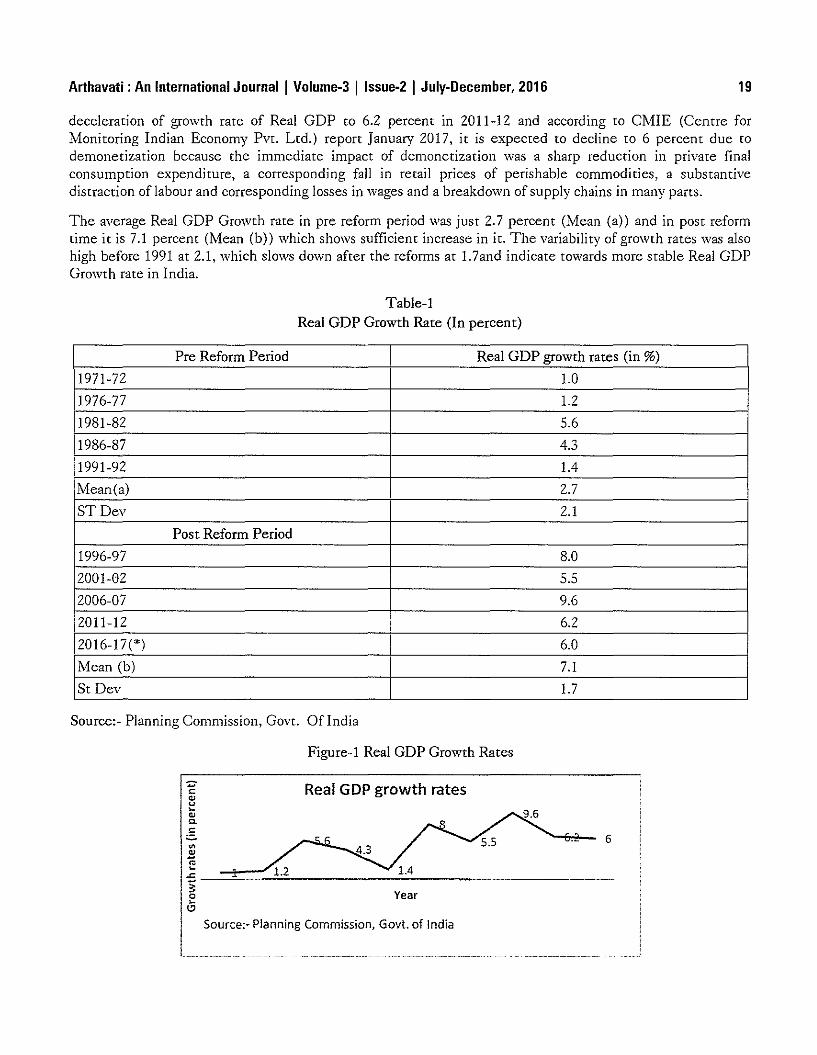
Before 1991 the growth was rarely gone above 6 percent rate, but since rhe financial initiatives have beentaken, the growth rates of Real GDP of India are always remaining more than 6 percent. As clarified by figure1 rhat in 2006-07 it reaches up to irs highest level at 9.6 percent, however the growrh decelerared in 2008-09following the global financial crisis. The economy recovered substantially ro register higher growrh rate in2009-10 and 2010-11. However the second bout of global slowdown in 2011 due to sovereign debt in Europecoupled with domestic facrors such as tight monetary policy and supply side bottlenecks resulred in
Arthavati : An International Journal I Volume-3 I Issue-2 I Julv-December, 2016 19
deceleration of growth rate of Real GOP to 6.2 percent in 2011-12 and according to CMIE (Centre forMonitoring Indian Economy Pvt. Ltd.) report January 2017, it is expected to decline to 6 percent due todemonetization because the immediate impact of demonetization was a sharp reduction in private finalconsumption expenditure, a corresponding fall in retail prices of perishable commodities, a substantivedistraction of labour and corresponding losses in wages and a breakdown of supply chains in many parts.
The average Real GOP Growth rate in pre reform period was just 2.7 percent (Mean (a)) and in post reformtime it is 7.1 percent (Mean (b)) which shows sufficient increase in it. The variability of growth rates was alsohigh before 1991 at 2.1, which slows down after the reforms at 1.7and indicate towards more stable Real GOPGrowth rate in India.
Table-1Real GDP Growth Rate (In percent)
Pre Reform Period Real GDP growth rates (in %)
1971-72 1.0
1976-77 1.2
1981-82 5.6
1986-87 4.3
1991-92 1.4
Mean(a) 2.7
STDev 2.1
Post Reform Period
1996-97 8.0
2001-02 5.5
2006-07 9.6
2011-12 6.2
2016-17(*) 6.0
Mean (b) 7.1
St Dev I 1.7
Source:- Planning Commission, Govt. OfIndia
IIFigure-1 Real GDP Growth Rates
Real GDP growth rates
Year
C.2 6
Source:- Planning Commission, Govt. of India
20 Arthavati : An International Journal I Volume-3 I Issue-2 I July-December, 2016
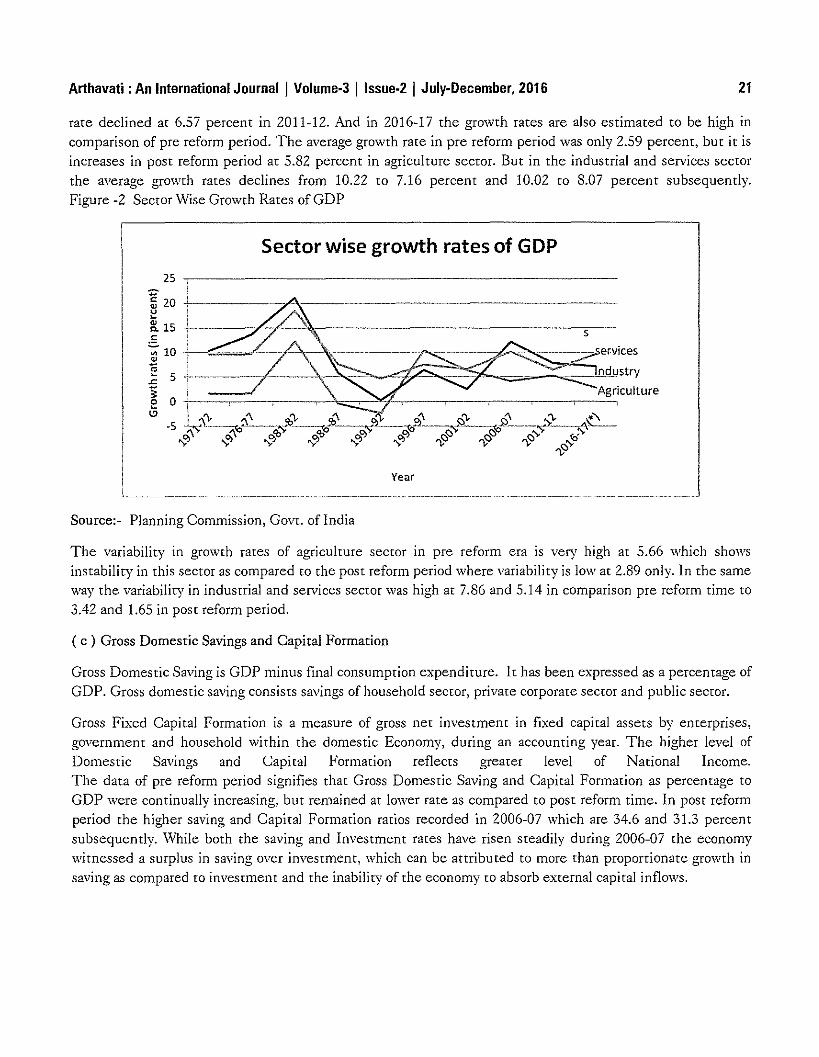
(b) Sector Wise Growth Rates of GOP
In India overall GOP is divided into three sectors, namely, Agriculture, Industry and Services sector GOP.
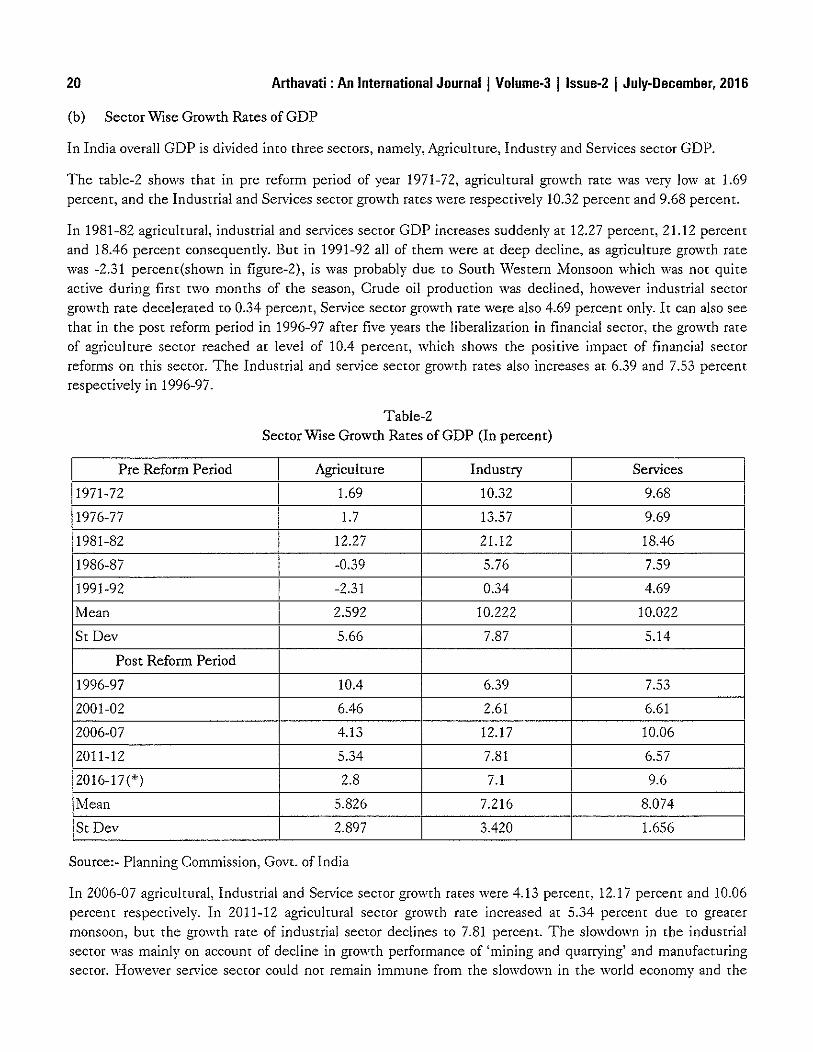
The table-2 shows that in pre reform period of year 1971-72, agricultural growth rate was very low at 1.69percent, and the Industrial and Services sector growth rates were respectively 10.32 percent and 9.68 percent.
In 1981-82 agricultural, industrial and services sector GOP increases suddenly at 12.27 percent, 21.12 percentand 18.46 percent consequently. But in 1991-92 all of them were at deep decline, as agriculture growth ratewas -2.31 percent(shown in figure-2), is was probably due to South Western Monsoon which was not quiteactive during first two months of the season, Crude oil production was declined, however industrial sectorgrowth rate decelerated to 0.34 percent, Service sector growth rate were also 4.69 percent only. It can also seethat in the post reform period in 1996-97 after five years the liberalization in financial sector, the growth rateof agriculture sector reached at level of 10.4 percent, which shows the positive impact of financial sectorreforms on this sector. The Industrial and service sector growth rates also increases at 6.39 and 7.53 percentrespectively in 1996-97.
Table-2Sector Wise Growth Rates of GOP (In percent)
Pre Reform Period Agriculture Industry Services
1971-72 1.69 10.32 9.68
1976-77 1.7 13.57 9.69
1981-82 12.27 21.12 18.46
1986-87 -0.39 5.76 7.59
1991-92 -2.31 0.34 4.69
Mean 2.592 10.222 10.022
St Dev 5.66 7.87 5.14
Post Reform Period
1996-97 10.4 6.39 7.53
2001-02 6.46 2.61 I 6.61
2006-07 4.13 12.17 10.06
2011-12 5.34 7.81 6.57
2016-17(*) 2.8 7.1 9.6
Mean 5.826 7.216 8.074
St Dev 2.897 3.420 1.656
Source:- Planning Commission, GOVL of India
In 2006-07 agricultural, Industrial and Service sector growth rates were 4.13 percent, 12.17 percent and 10.06percent respectively. In 2011-12 agricultural sector gtowth rate increased at 5.34 percent due to grearermonsoon, but the growth rate of industrial sector declines to 7.81 percent. The slowdown in the industrialsector was mainly on account of decline in growth performance of 'mining and quarrying' and manufacturingsector. However service sector could not remain immune from the slowdown in the world economy and the
Arthavati : An International Journal I Volume-3 I Issue-2 I July-December, 2016 21
rate declined at 6.57 percent in 2011-12. And in 2016-17 the growth rates are also estimated ro be high incomparison of pre reform period. The average growth rate in pre reform period was only 2.59 percent, but it isincreases in post reform period at 5.82 percent in agriculture sector. But in the industrial and services secrorthe average growth rates declines from 10.22 to 7.16 percent and 10.02 to 8.07 percent subsequently.Figure -2 Sector \Vise Growth Rates of GDP
Sector wise growth rates of GOP
25 -,-----------------------
Year
Source:- Planning Commission, Govr. of India
The variability in growth rates of agriculture sector in pre reform era is very high at 5.66 which showsinstability in this sector as compared to the post reform period where variability is low at 2.89 only. In the sameway the variability in industrial and services sector was high at 7.86 and 5.14 in comparison pre reform time to3.42 and 1.65 in post reform period.
( c ) Gross Domestic Savings and Capital Formation
Gross Domestic Saving is GDP minus final consumption expenditure. It has been expressed as a percentage ofGDP. Gross domestic saving consists savings of household sector, private corporate sector and public sector.
Gross Fixed Capital Formation is a measure of gross net investment in fixed capital assets by enterprises,government and household within the domestic Economy, during an accounting year. The higher level ofDomestic Savings and Capital Formation reflects greater level of National Income.The data of pre reform period signifies that Gross Domestic Saving and Capital Formation as percentage toGDP were continually increasing, but remained at lower rate as compared ro post reform time. In POSt reformperiod the higher saving and Capital Formation ratios recorded in 2006-07 which are 34.6 and 31.3 percentsubsequently. While both the saving and Investment rates have risen steadily during 2006-07 the economy,vitnessed a surplus in saving over investment, '\vhich can be attributed to more than proportionate growth insaving as compared ro investment and the inability of the economy ro absorb external capital inflows.
22 Arthavati : An International Journal I Volume-3 I Issue-2 I July-December, 2016
Table-3Gross Domestic Saving and Capital Formation (as percent to GDP)
Pre Reform Period Gross Domestic saving Gross Domestic fIxed Capital Formation
1971-72 15.1 14.7
1976-77 18.8 16.6
1981-82 17.5 18.6
1986-87 18.1 21.4
1991-92 21.3 22.6
Mean 18.2 18.8
St dev 7 0 3.3_.J
Post Reform period
1996-97 22.4 23.1
2001-02 24.9 25.1
2006-07 34.6 31.3
2011-12 30.8 30.6
2016-17(*) 32.0 31.0
Mean 29.0 28.2
St dev 5.08 3.82
Source:- RBI
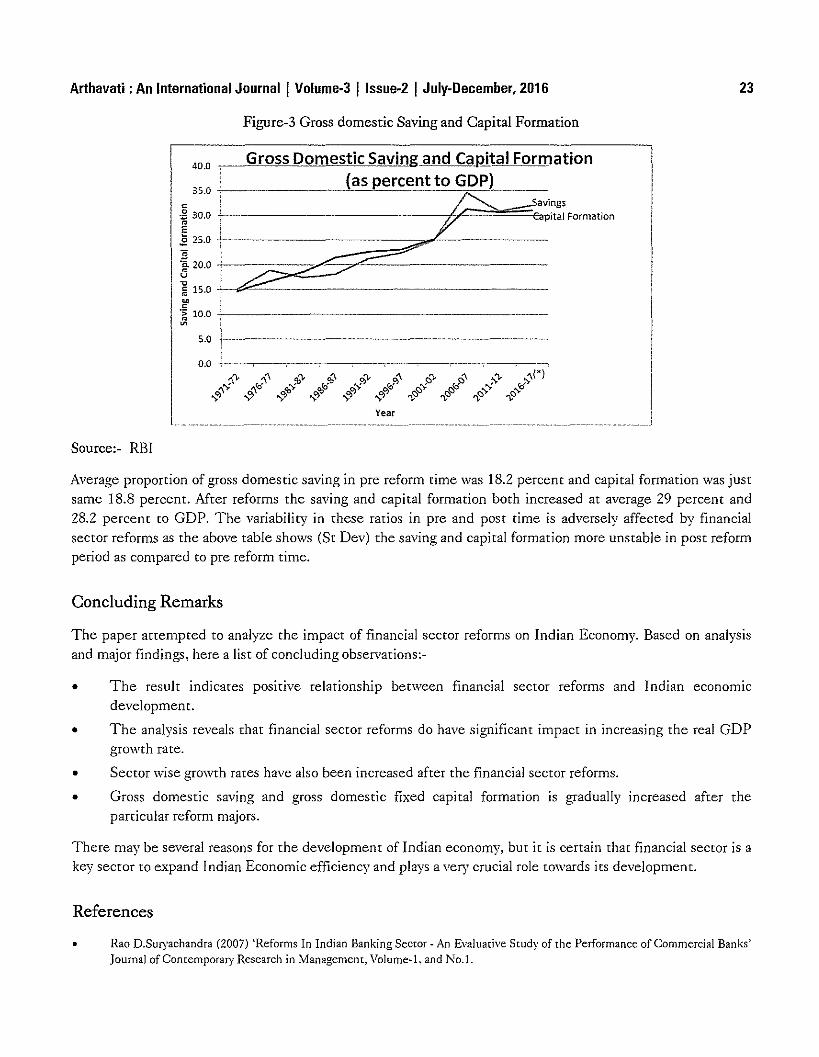
However during 2006-07, owing to the prevalence of positive growth sentiment in the economy, accompaniedby gradual increment in lending rates, capital formation rate rose moderately to 31.3 percent ftom 25.1 percentfive years ago in 2001-02, whereas the saving rate increased substantially to 34.6 percent to 24.9 percent duringrhe same period (Figure-3).
The household sector continued to be major contributor to gross domestic saving. The increase in publicsaving has occurred mainly due to an increase in saving of non-departmental enterprises, small increase insaving of departll1ental enterprises and a significant reduction in dis-saving of government administration. The
composition of Gross fIxed capital formation between public and private sector shifted in favour of privatecapital formation, and particularly private corporate sector capital formation.
This is primarily a reflection of the impact of the reforms initiated in 1990s, which reduced restrictions onprivate investment and created a more favourable investment climate.
Arthavati : An International Journal I Volume·3 I Issue·2 I July-December, 2016 23
Figure-3 Gross domestic Saving and Capital Formation
40.0 Gross Domestic Saving and Ca-Rital Formation(as percent to GOP)35.0 +- -'-'=.'=-=::..:..:==..0..::'-..:::;;:..:...<'- _
avings--------....J;.c::::,,;:,"""O::::"{CapitaJ Formation
c~ 30.0oEi 25.0 +--------~_=-=-=-=;;.;;;;i'.,.,£
'g. 20.0 t,--:/::;;:2::::~7~-------------U I" IE 15.0 'i
~.~ 10.0 +---~
5.0 +----------------------
0.0 L.,--.-~-,....-----.._--.-----,-...;'\'), reI"" ..,.;q,'), roii' .;.p"'" [.of»" .:f.....
OJ" ~'\ C>JCO 0)Q3 0)0) 0)05 ~<:::J~ ~ ~ ~ ~ ~ ~
Year
Source:- RBI
Average proportion of gross domestic saving in pte tefotm time was 18.2 petcent and capital formation was justsame 18.8 petcent. Mter reforms the saving and capital fotmation both incteased at average 29 percent and28.2 percent to GDP. The variability in these ratios in pre and post time is adversely affected by financialsector reforms as the above table shows (Sr Dev) the saving and capital formation more unstable in post reformperiod as compared to pre reform time.
Concluding Remarks
The paper arrempted to analyze the impact of financial sector teforms on Indian Economy. Based on analysisand major findings, here a list of concluding observations:·
o The result indicates positive relationship between financial sector reforms and Indian economIcdevelopment.
o The analysis reveals that financial sector reforms do have significant impact in increasing the real GDPgrmvth rate.
o Sector wise growth rates have also been increased after the financial sector reforms.
o Gross domestic saving and gross domestic fixed capital formation is gradually increased after theparticular reform majors.
There may be several reasons for the development of Indian economy, but it is certain that financial sector is akey sector to expand Indian Economic efficiency and plays a very crucial role towards irs development.
References
• Rao D.Suryachandra (2007) 'Reforms In Indian Banking Secw[ w An Evaluative Study of the Performance of Commercial Banks'Journal ofConremporary Research in Managemenr, Volume-l, and No.1.
24 Arthavati : An International Journal I Volume-3 Ilssue-2 I July-December, 2016
• Bhanawat Shurveer S, Kothari ShiJpi (2013), 'Impact of Banking SectOr Reforms on Profitability of Banking Industry in India'Pacific Business Review Imernarional, volume 6, Issue 6.
• Gav(. of India, (2014) 'Annual Report 203-14' Planning Commission, Gave. of India, New Delhi.
• www.planningcommission.gov.in.
• Ministry of Finance (1993a), Economic Reforms: Two Years After and the Tasks Ahead, New Delhi, Government: of India.
• Ministry of Finance (l993b), Public SectOr Commercial Banks and Financial Secw[ Reforms: Rebuilding for a Better Furure,New Delhi, and 60vernmem of India.
• Reserve Bank of India, Annual Report for the years 1971-2016.
• Reserve Bank of India, Annual Statements on Monetary and Credit Policy and J\llid-term Reviews of Monetary and CreditPolicy for the years 1971-2016.
• www.rbi.org.in.
• www.ernie.eom.
DOD
Evolving Deprivation Based Fund Devolution Method:A Study of Madhya Pradesh
Dr. Ganesh Kawadia'Sujay S Phatakt
Abstract
This paper tries to develop an index of funds devolution based on the level of deptivation and concentration ofpopulation in the region using secondary data for 39 districts of Madhya Pradesh. In order to analyse rhedistricts based on socio-demographic, economic and infrastfuctural dimensions, a composite index of overalldevelopment is also constructed, the inverse of which is used as measure of deprivation level among thedistricts. In conclusion, the study suggests thar rhe index can be of great use to any State Government whileallocating funds to different districts.
Keywords: Devolution, Deprivation, Development, Fund Allocation, Financial Decentralization.
Introduction
The Republic of India is one of the largest and most unique democracies atound the world, accommodatingaround 16.9 percent of a very complex composition of world population in only 2.4 percent of the world surfacearea. On the top of it, great geographical, cuI tural and social diversi ties tend to worsen the si tuation ofmanagement of the economy with equiry. Yet, the country is performing quite well on the path of economicgrowth since its independence, being the seventh latgest economy (measured by nominal GDP) and the thirdlargest by Purchasing Power Patity (PPP). The decadal average growth rate of the economy has been over 7percent for the last two decades. But, this path has not been equal for all. It can be seen that spectaculargtowth attained by some regions and in some sectors in India, after independence, is in contrast to low levelsof development still prevailing in many parts of the country. This unbalanced development creates much havocand many serious problems in the country and also reflects the failure of planning mechanism adopted bydifferent Governments. Government, most of the time tried to move on the concept of "eqllOl treatmeJlt for all"leading to more inequaliry among different regions of the economy. Less developed regions should have beenallotted more funds according to their need. Rationality in distribution of funds was interpreted politically in amuch different way during this period. Madhya Pradesh in this case, is no exception.
Only a few districts in the state portray the status of development while the others aten't much developed intetms of socio-demographic, economic and inftastructural end. Thus, proper allocation of funds among variousregions is needed to catalyse the development ptocess with equity. This can only be achieved with propergovernment intervention in terms of fund allocation which can lead to balanced development across differentregions of the economy. Following this scenario, the study intends to develop an index of funds devolutionbased on the level of deprivation and concentration of population in the region. This method of fundsallocation is logical to create better opportunities among the districts by the State Government [of MadhyaPtadesh].
Head,Dept. OfEco1lomics, DA J~I11dore, M.P.Research Scholat~ DA J~I11dore, M.P.
26
Theoretical Background
Arthavati : An International Journal I Volume-3 I Issue-2 I July-December, 2016
Mter independence, India chose to be a planned economy wirh healthy Cenrre-Srare quasi federal relarions.Bur rhe first three quinquennial plans were criticized on the basis of the transfers being more or less adhoc innature, as described by Ramalingom and Kurup (1991) who further explain that the Forth Plan brought a we!!!aid out method, named as the famous 'Gadgil Formula' which formed the base for Central assistance to Statesas approved by the National Development Council (NDC). The formula was then modified in the Sixth Planand further revised as 'Gadgil-Mukherjee Formula' in 1990. This was reviewed once more in 2000 and finallyafrer dismanrling Planning Commission, rhe formula was discontinued. The Planning Commission during irsrenure had only a partial success in dealing with the problem of regional disparity, thus continuing ir seemedhighly unnecessaty by rhe newly formed Government of India (2014) and was rhen replaced by rhe NITIAayog. Mter NITI Aayog took over, devolurion has been increased from rhe divisible pool. Still, the problemseems to persisr among different regions in India. Other arremprs towards devolurion were made in 2004 whenrhe Minisrty of Panchayar Raj (MoPR) appointed rhe National Council of Applied Economic Research(NCAER) to develop a Devolurion Index (01) to set an accountability framework for the States(Unnikrishnan, 2016). Meanwhile, a Committeefor Evolving a Composite Development Index ofStates was constitutedby rhe Government of India, chaired by Dr. Raghuram G Rajan (the then Chief Economic Advisor, Ministry ofFinance) to develop a Development Index in order to address the issue of regional disparities and to arrain amore balanced and inclusive growth(Rajan, Pandey, ]ayal, Ramaswami, & Gupta, 2013). A loosely similararrempt was made by Bhanumurthy er.al. (2016) for examining the link between quality of governance, publicexpenditure and human development outcomes in the State of Madhya Pradesh. The team constructed aGovernance Index (GI) using 22 indicators in five dimensions. This shows that over the years, Government hastried various methods for proper financial devolurion to the States. However despite all such efforts, regionaldisparity is still a major problem that the Government has to deal with. This study arrempts to contribure amethod of funds allocation which can aid the government to properly deal with the problem of imbalancedregional growth.
Objectives
1. To develop the index of economic, socio-demographic and infrastructural development for MadhyaPradesh at district level
2. To study rhe association of various indicators of economIC, socio-demographic and infrastructuraldevelopment in the State
3. To develop a Funds Devolution Index of Madhya Pradesh
Methodology
Development in true sense should reflect overall economic, socio-demographic and infrastrucrural progress.Thus, it is important to develop a criteria based on which the State could allocate funds to its districts for theirberrerment. Grounded on such thoughts, the devolution index presented in this study is established on aconcept that the allocation of funds should be associated with two factors viz. the level of deprivation andconcentration of population in each disrrict as major differences among the districts are present not only in thelevel of development bur also in the density of popularion. Some districts have a high density of populationalong with higher rate of development (e.g. Indore, Bhopal) while there are many with lower population
Arthavati : An International Journal I Volume-3 I Issue-2 I July-December, 2016 27
density with lower rate of development (e.g. Mandla, Sheopur). The COSt of delivery of social secror on onehand depends on population while need of the fund depends on the degree of deprivation. We therefore havetried ro assign appropriate weights ro both deprivation and population in the devolution index.
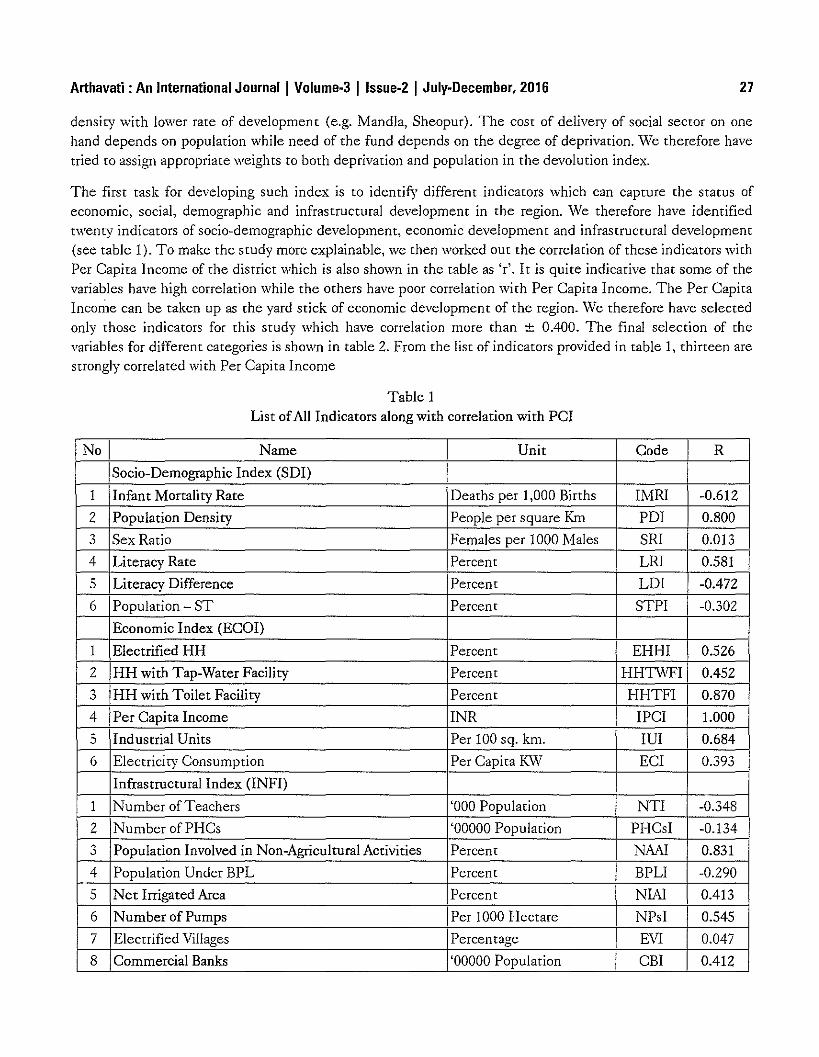
The first task for developing such index is ro identify different indicarors which can capture the status ofeconomic, social, demographic and infrastructural development in the region. \\le therefore have identifiedtwenty indicarors of socio-demographic development, economic development and infrastructural development(see table 1). To make the study more explainable, we then worked out the correlation of these indicarors withPer Capita Income of the district which is also shown in the table as 'r'. It is quite indicative that some of thevariables have high correlation while the others have poor correlation with Per Capita Income. The Per CapitaInconle can be taken up as the yard stick of economic development of the region. We therefore have selectedonly thosc indicarors for this study which have correlation more than ± 00400. The final selection of thevariables for different categories is shown in table 2. From the list of indicarors provided in table 1, thirteen arestrongly correlated with Per Capita Income
Table 1List ofAll Indicators along with correlation with PCI
No Name Unit Code R
Socio-Demographic Index (SOI)
1 Infant Mortality Rate Deaths per 1,000 Births IMRI -0.612
2 Population Density People per square Km POI 0.800
3 Sex Ratio Females per 1000 Males SRI 0.013
4 Literacy Rate Percent LRI 0.581
5 Literacy Difference Percent LOI -0.472
6 Population - ST Percent STPI -0.302
Economic Index (ECOI)
1 Electrified HH Percent EHHI 0.526
2 HH with Tap-Water Facility Percent HHTWFI 0.4520 HH with Toilet Facility Percent HHTFI 0.870~
4 Per Capita Income INR IPCI 1.000
5 Industrial Units Per 100 sq. km. lUI 0.684
6 Electricity Consumption Per Capita KW ECI 0.393
Infrastructural Index (INFI)
1 Number of Teachers '000 Population NTI -0.348
2 Number ofPHCs '00000 Population PHCsI -0.1340 Population Involved in Non-Agricultural Activities Percent NAAl 0.831~
4 Population Under BPL Percent BPLI -0.290
5 Net Irrigated Area Percent NIAl 0.413
6 Number of Pumps Per 1000 Hectare NPsI 0.545
7 Electrified Villages Percentage EVI 0.047
8 Commercial Banks '00000 Population CBI 0.412
28 Arthavati : An International Journal I Volume-3 I Issue-2 I July-December, 2016
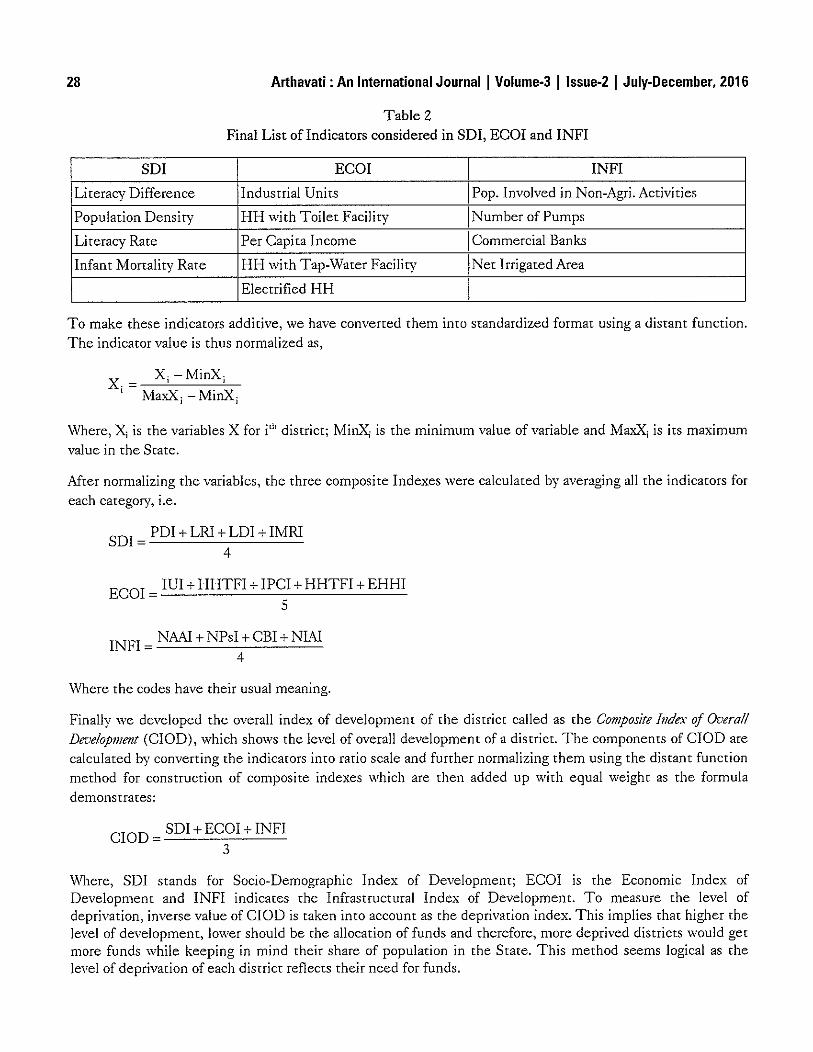
Table 2Final List of Indicators considered in SOl, ECOI and INFI
sm ECOI INFI
Lireracy Difference Industrial Units Pop. Involved in Non-Agri. Acrivities
Population Density HH with Toilet Facility Number of Pumps
Literacy Rate Per Capita Income Commercial Banks
Infant Mortality Rate HH with Tap-Water Facility Net Irrigated Area
Electrified HH
To make these indicators additive, we have converted them into standardized format using a distant function.The indicator value is thus normalized as,
x = X; -MinX;, MaxX; - MinX;
Where, X; is the variables X for i'h district; MinX; is the minimum value of variable and MaxX; is its maximumvalue in the State.
Mter normalizing the variables, the three composite Indexes were calculated by averaging all the indicators for
each category, i.e.
sm = POI + LRI + LOI + IMRI4
ECOI = lUI + HHTFI + IPCI +HHTFI +EHHI5
INFI = NAAI + NPsI +CEl + NIAI4
Where the codes have their usual meaning.
Finally we developed the overall index of development of the district called as the Composite Index of Overa!!Deve!opmel1t (ClOD), which shows the level of overall development of a district. The components of ClOD arecalculated by converting the indicators into ratio scale and further normalizing them using the distant functionmethod for construction of composite indexes which are then added up with equal weight as the formulademonstrates:
ClOD = SOl + ECOI + INFI3
\\~lere, SOl stands for Socio-Demographic Index of Development; ECOI is the Economic Index ofDevelopment and INFI indicates the Infrastrucrural Index of Development. To measure the level ofdeprivation, inverse value of ClOD is taken into account as the deprivation index. This implies that higher thelevel of development, lower should be the allocation of funds and therefore, more deprived districts would getmore funds while keeping in mind their share of population in the State. This method seems logical as thelevel of deprivation of each district reflects their need for funds.
Arthavati : An International Journal I Volume-3 Ilssue-2 I July.December, 2016
Mathematically,
Deprivation Index = 1 - Composite Index of Overall Development
29
Based on the level of deprivation (with 70 percent weight) and share of population (30 percent weight), theformula to calculate the devolution index forms to be:
Devolution Index = (0.7 * Deprivation Index) + (0.3 * Share of Population)
As can be seen, devolution Index is the weighted sum of the ratios of level of deprivation and share ofpopulation.
Out of 51, only 39 districts were included in this study due to limitation of data which is secondary in nature,collected from various government portals including Census of India (2011); Economic Survey of MadhyaPradesh (2014-15, 2015-16, and 2016-17); Compendium for Agricultural Statistics MP (2009-10); "MadhyaPmdeshki Vividh Sallkhyiki (2014)" by Directorate of Economics and Sratistics, Government of Madhya Pradesh.
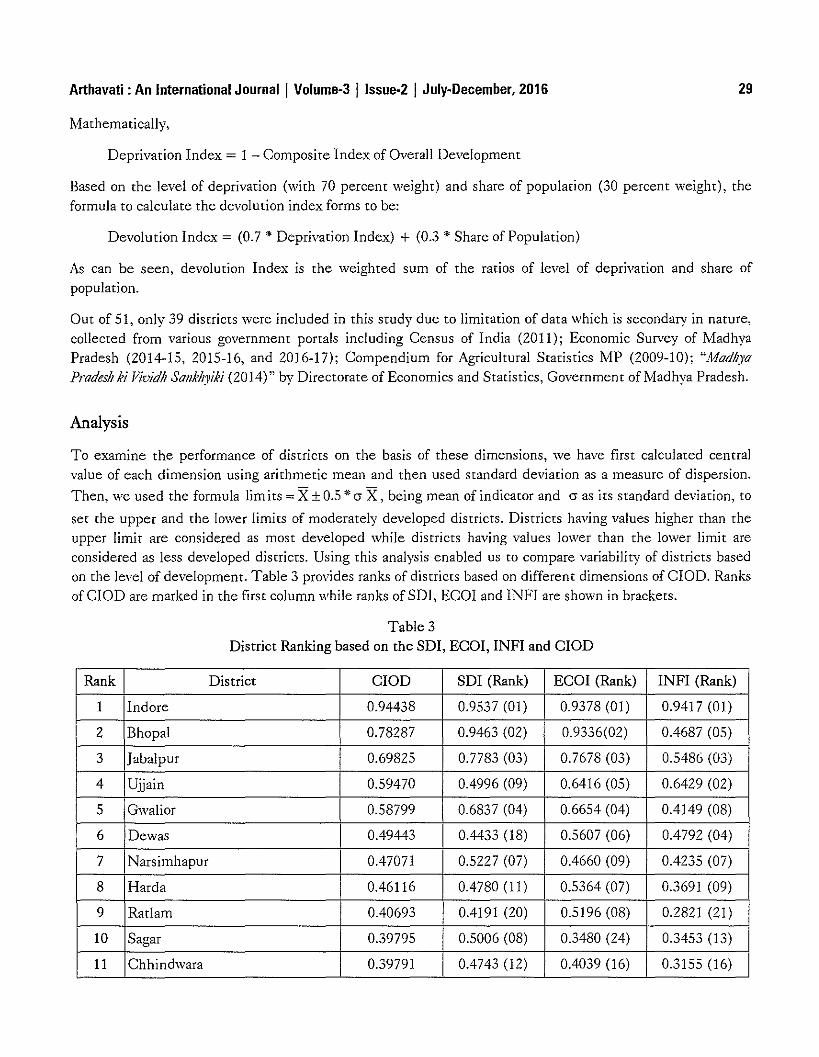
Analysis
To examine the performance of districts on the basis of these dimensions, we have first calculated centralvalue of each dimension using arithmetic mean and then used standard deviation as a measure of dispersion.
Then, we used the formula lim its; X± 0.5 * (j X, being mean of indicator and (j as its standard deviation, to
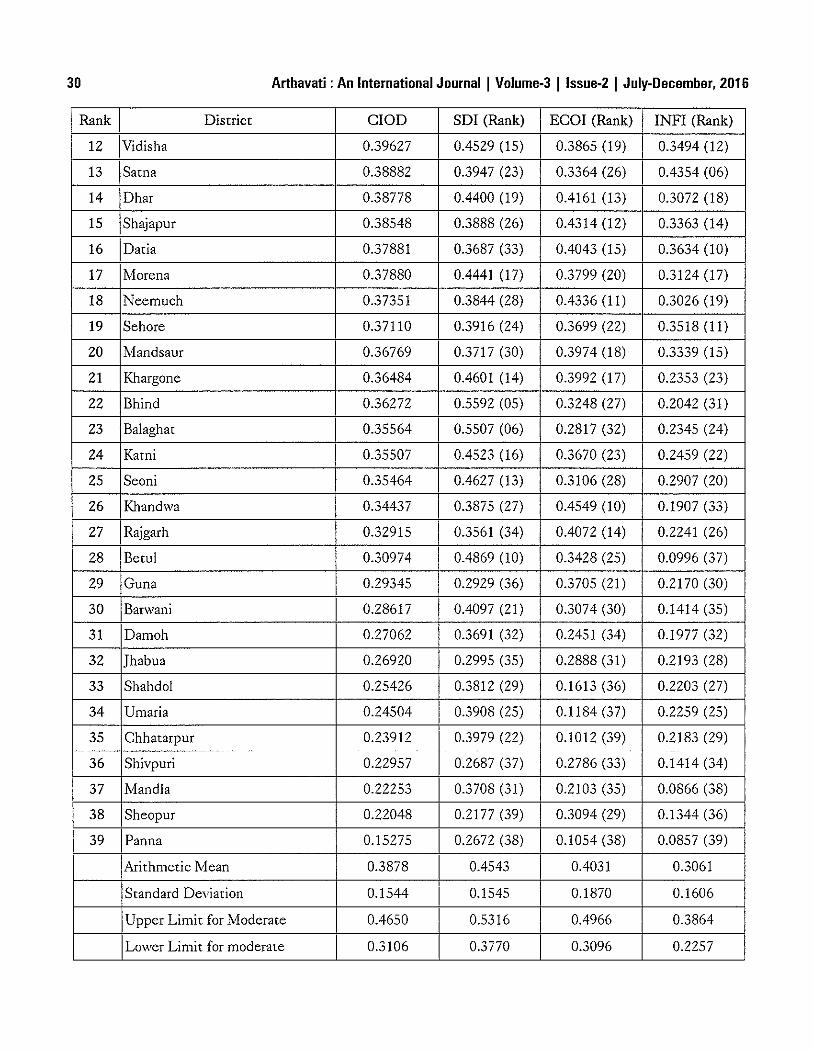
set the upper and the lower limits of moderately developed districts. Districts having values higher than theupper limit are considered as most developed while districts having values lower than the lower limit areconsidered as less developed districts. Using this analysis enabled us to compare variability of districts basedon the level of development. Table 3 provides ranks of districts based on different dimensions of CIaO. Ranksof CIaO are marked in the first column while ranks of SOl, ECOI and INFI are shown in brackers.
Table 3District Ranking based on the SOl, ECO!, INFI and CIaO
Rank District CIaO SOl (Rank) ECO! (Rank) INFI (Rank)
1 Indore 0.94438 0.9537 (01) 0.9378 (01) 0.9417 (01)
2 Bhopal 0.78287 0.9463 (02) 0.9336(02) 0.4687 (05)
3 Jabalpur 0.69825 0.7783 (03) 0.7678 (03) 0.5486 (03)
4 Ujjain 0.59470 0.4996 (09) 0.6416 (05) 0.6429 (02)
5 Gwalior 0.58799 0.6837 (04) 0.6654 (04) 0.4149 (08)
6 Dewas 0.49443 0.4433 (18) 0.5607 (06) 0.4792 (04)
7 Narsimhapur 0.47071 0.5227 (07) 0.4660 (09) 0.4235 (07)
8 Harda 0.46116 0.4780 (11) 0.5364 (07) 0.3691 (09)
9 Ratlam 0.40693 0.4191 (20) 0.5196 (08) 0.2821 (21)
10 Sagar 0.39795 0.5006 (08) 0.3480 (24) 0.3453 (13)
11 Chhindwara 0.39791 0.4743 (12) 0.4039 (16) 0.3155 (16)
30 Arthavati : An International Journal I Volume-3 I Issue-2 I July-December, 2016
Rank District ClOD sm (Rank) ECm (Rank) INFI (Rank)
12 Vidisha 0.39627 0.4529 (15) 0.3865 (19) 0.3494 (12)
13 Satna 0.38882 0.3947 (23) 0.3364 (26) 0.4354 (06)
14 Dhar 0.38778 0.4400 (19) 0.4161 (13) 0.3072 (18)
15 Shajapur 0.38548 0.3888 (26) 0.4314 (12) 0.3363 (14)
16 Datia 0.37881 0.3687 (33) 0.4043 (15) 0.3634 (10)
17 Morena 0.37880 0.4441 (17) 0.3799 (20) 0.3124 (17)
18 Neemuch 0.37351 0.3844 (28) 0.4336 (11) 0.3026 (19)
19 Sehore 0.37110 0.3916 (24) 0.3699 (22) 0.3518 (11)
20 Mandsaur 0.36769 0.3717 (30) 0.3974 (18) 0.3339 (15)
21 Khargone 0.36484 0.4601 (14) 0.3992 (17) 0.2353 (23)
22 Bhind 0.36272 0.5592 (05) 0.3248 (27) 0.2042 (31)
23 Balaghat 0.35564 0.5507 (06) 0.2817 (32) 0.2345 (24)
24 Katni 0.35507 0.4523 (16) 0.3670 (23) 0.2459 (22)
25 Seoni 0.35464 0.4627 (13) 0.3106 (28) 0.2907 (20)
26 Khandwa 0.34437 0.3875 (27) 0.4549 (10) 0.1907 (33)
27 Rajgarh 0.32915 0.3561 (34) 0.4072 (14) 0.2241 (26)
28 Betul 0.30974 0.4869 (10) 0.3428 (25) 0.0996 (37)
29 Guna 0.29345 0.2929 (36) 0.3705 (21) 0.2170 (30)
30 Baf'vani 0.28617 0.4097 (21) 0.3074 (30) 0.1414 (35)
31 Damoh 0.27062 0.3691 (32) 0.2451 (34) 0.1977 (32)
32 Jhabua 0.26920 0.2995 (35) 0.2888 (31) 0.2193 (28)
33 Shahdol 0.25426 0.3812 (29) 0.1613 (36) 0.2203 (27)
34 Umaria 0.24504 0.3908 (25) 0.1184 (37) 0.2259 (25)
35 Chhatarpur 0.23912 0.3979 (22) 0.1012 (39) 0.2183 (29)--- --_ .._- -
36 Shivpuri 0.22957 0.2687 (37) 0.2786 (33) 0.1414 (34)
37 Mandla 0.22253 0.3708 (31) 0.2103 (35) 0.0866 (38)
38 Sheopur 0.22048 0.2177 (39) 0.3094 (29) 0.1344 (36)
39 Panna 0.15275 0.2672 (38) 0.1054 (38) 0.0857 (39)
Arithmetic Mean 0.3878 0.4543 0.4031 0.3061
Srandard Deviation 0.1544 I 0.1545 0.1870 0.1606
Upper Limit for Moderate 0.4650 0.5316 0.4966 0.3864
Lower Limit for moderate 0.3106 0.3770 0.3096 0.2257
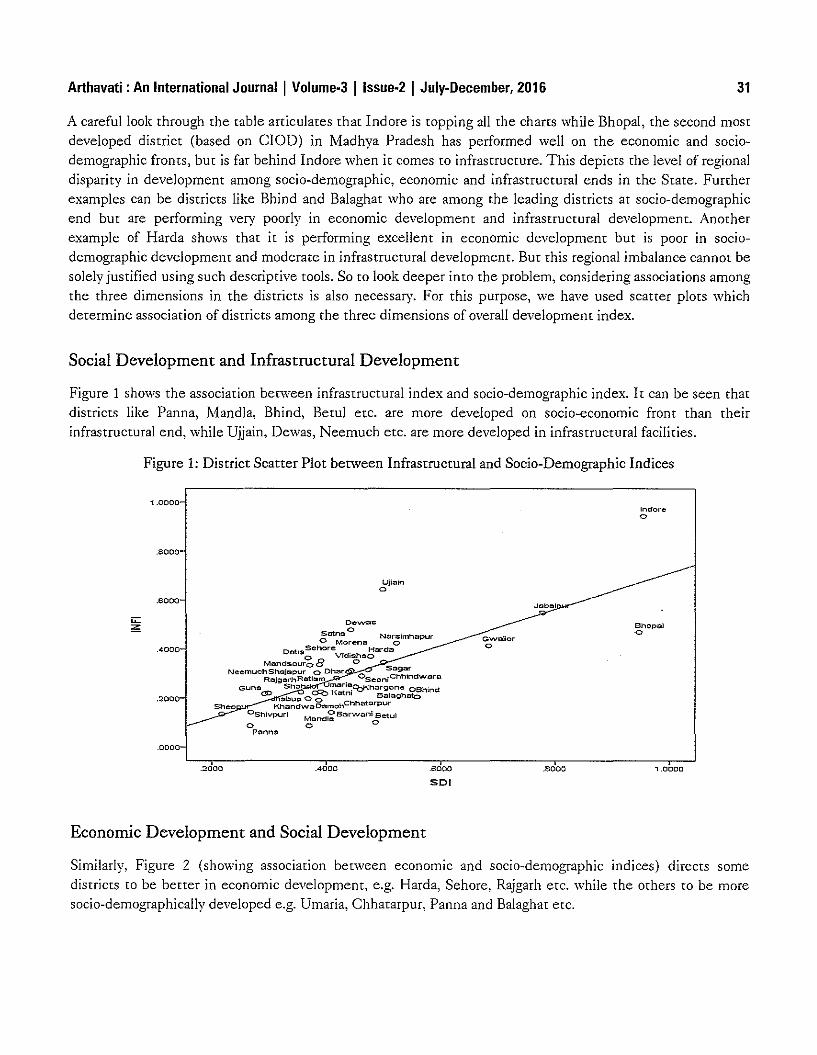
Arthavati : An International Journal I Volume-3 I Issue-2 I July-December, 2016 31
A careful look through the table articulates that Indore is topping all the charts while Bhopal, the second mostdeveloped district (based on ClOD) in Madhya Pradesh has performed well on the economic and sociodemographic fronts, but is far behind Indore when it comes to infrastructure. This depicts the level of regionaldisparity in development among socio-demographic, economic and infrastrucrural ends in the State. Furtherexamples can be districts like Bhind and Balaghat who are among the leading districts at socio-demographicend but are performing very poorly in economic development and infrastrucrural development. Anotherexample of Harda shows that it is performing excellent in economic development but is poor in sociodemographic development and moderate in infrastrucrural development. But this regional imbalance cannot besolely justified using such descriptive rools. So to look deeper into the problem, considering associations amongthe three dimensions in the districts is also necessary. For this purpose, we have used scatter plots whichdetermine association of districts among the three dimensions of overall development index.
Social Development and Infrastructural Development
Figure 1 shows the association between infrastrucrural index and socio-demographic index. It can be seen thatdistricts like Panna, Mandla, Bhind, Berul etc. are more developed on socio-economic front than theirinfrastructural end, while Ujjain, Dewas, Neemuch etc. are more developed in infrastructural facilities.
Figure 1: District Scatter Plot between Infrastructural and Socio-Demographic Indices
1.0000Indoreo
.6000
Uiilllino
Dovvoa:r;;
Satna 0 Narzlmhapuro Morena 0
Dati Sehore Hard:;!lao Vidi=hoO
Mand$ouro 8 0NeemuchShajgpur 0 Dhar Sagar
RajglllrhRatltlm . °seoniChhlndVlloraGuna 511::' 0::::0mllln~h:argone 06hind
aD obul:l 0 0 I~;:rtnl BalaghatoSheo Kh;:mdvvaDamohChhotarpur
°Shivpurl Mand~SOfvvonl6'etUlo 0
Panna
.6000
.4000
.2000 .4000 .6000
SDI
G'llVolioro
.6000
Bhopalo
, .0000
Economic Development and Social Development
Similarly, Figure 2 (showing association between economic and socio-demographic indices) directs somedistricts to be better in economic development, e.g. Harda, Sehore, Rajgarh etc. while the others to be moresocio-demographically developed e.g. Umaria, Chhatarpur, Panna and Balaghat etc.
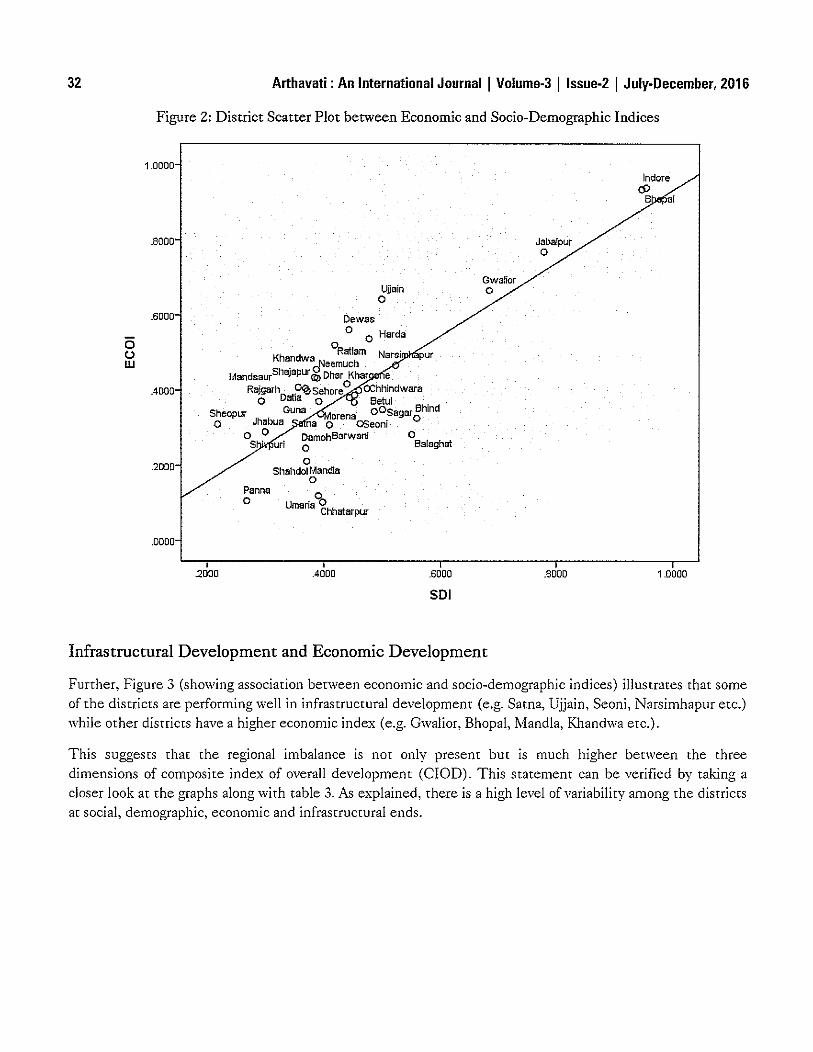
32 Arthavati : An International Journal I Volume-3 I Issue-2 I July-December, 2016
Figure 2: District Scatter Plot between Economic and Socio-Demographic Indices
, .0000Indore
<SJS a!
(5()w
.8000
.800
.4000
2000
Unaino
Dewas
o 0 Harda
Kh d CRatlam Narsian wa~eemUCh
MandsaurShajapurCO> Dhar Khar eRajgarh pteSehoreO OChhindwara
o Datia 0 Setu!Sheopuf Guns v10rena OOSagar Bhindo Jhabua na 0 OSeoni 0
o 0 DamohBarwanl 0S· uri 0 Balaghat
oShahdol Mandie:
°
Gwalioro
JabaJpuro
.000
.2000
Pannao °0
Umaria Chhatarpur
.4000 .6000
SOl
.8000 , .0000
Infrastructural Development and Economic Development
Further, Figure 3 (showing association between economic and socio-demographic indices) illustrates that someof the districts are performing well in infrastructural developmenr (e.g. Sarna, Ujjain, Seoni, Narsimhapur etc.)while other districts have a higher economic index (e.g. Gwalior, Bhopal, Mandla, Khandwa etc.).
This suggests that the regional imbalance is not only presenr bur is much higher between the threedimensions of composite index of overall developmenr (ClOD). This statemenr can be verified by taking acloser look at the graphs along with table 3. As explained, there is a high level of variability among the districrsar social, demographic, economic and infrastructural ends.
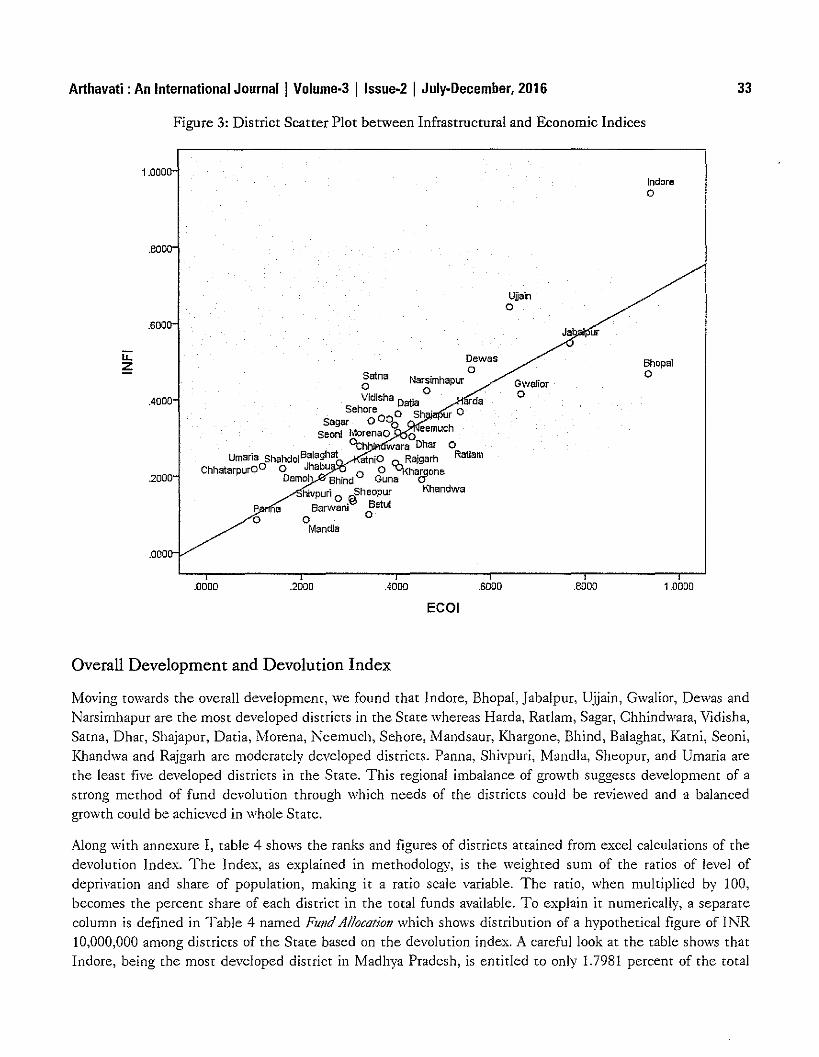
Arthavati : An International Journal I Volume-3 I Issue-2 I July-December. 2016
Figure 3: District Scatter Plot between Infrastructural and Economic Indices
1.0000Indoreo
.800
Ujjaino
33
ii:z
.6000
.4000
.2000
.0000
Dewaso
gatna Narsimhapur Gwalior
Vidisha Datia 0 fda 0Sehore 0 Sh· ur 0
sagar 0 0Seoni Morenao 0 eemuch
Oeh· wars Dhar 0Umaria ShahdolBalaghat mol0 Rajgarh Ratlam
ChhatarpurOO 0 Jhabu 0 0 ~harQOneDame Bhind Guna Cf
hivpuri Sheopur Khandwap a Barw~ni@J Betulo 0 0
Mandla
Ja ur
Bhopalo
.0000 .2000 .4000
ECOI
.6000 .8000 1.0000
Overall Development and Devolution Index
Moving towards the overall development, we found that Indore, Bhopal, Jabalpur, Ujjain, Gwalior, Dewas andNarsimhapur ate the most developed districts in the State whereas Harda, Ratlam, Sagar, Chhindwara, Vidisha,Sarna, Dhat, Shajapur, Datia, Morena, Neemuch, Sehore, Mandsaur, Khargone, Bhind, Balaghat, Karni, Seoni,Khandwa and Rajgarh arc moderately developed districts. Panna, Shivpuri, Mandla, Sheopur, and Umaria arethe least five developed districts in the State. This regional imbalance of growth suggests development of astrong method of fund devolution through which needs of the districts could be reviewed and a balancedgrowth could be achieved in whole State.
Along with annexure I, table 4 shows the ranks and figures of districts attained from excel calculations of thedevolution Index. The Index, as explained in methodology, is the weighted sum of the ratios of level ofdeprivation and share of population, making it a ratio scale variable. The ratio, when multiplied by 100,becomes the percent share of each district in the total funds available. To explain it numerically, a separatecolumn is defined in Table 4 named Fund Allocation which shows distribution of a hypothetical figure of INR10,000,000 among districts of the State based on the devolution index. A careful look at the table shows thatIndore, being the most developed district in Madhya Pradesh, is entitled to only 1.7981 percent of the total
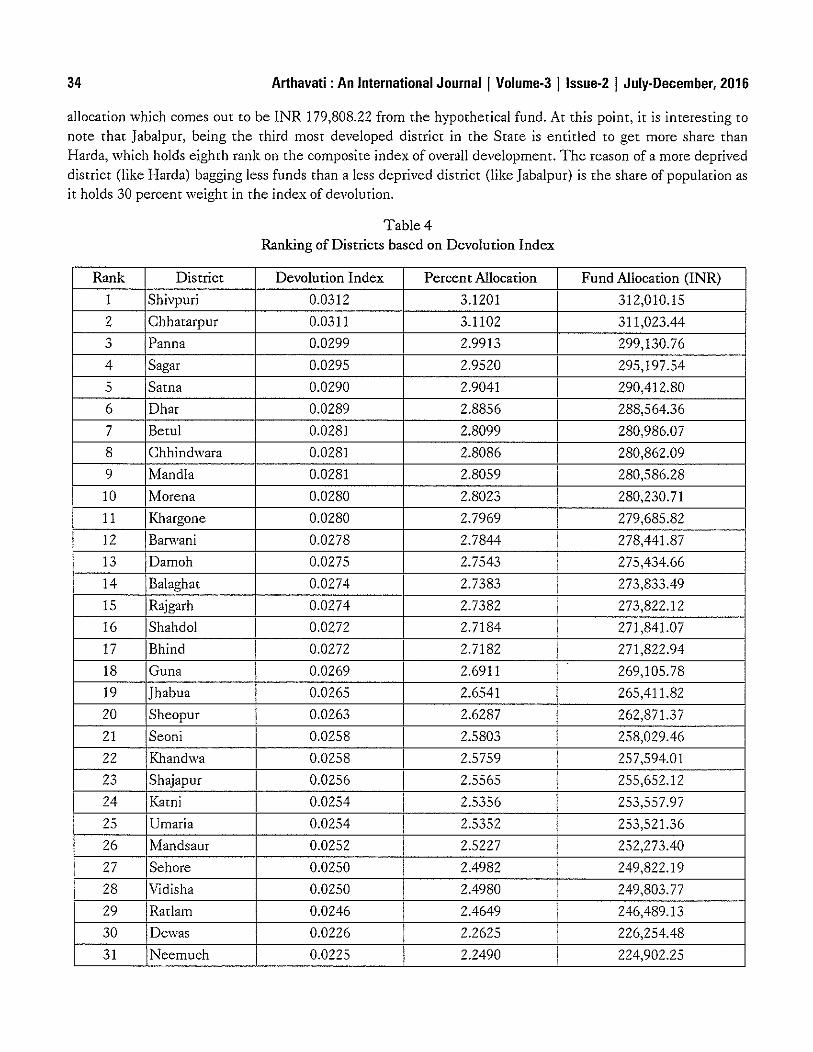
34 Arthavati : An International Journal I Volume·3 I Issue-2 I July-December, 2016
allocation which comes out to be INR 179,808.22 from the hypothetical fund. At this point, it is interesting to
note that Jabalpur, being the third most developed district in the State is entitled to get more share thanHarda, which holds eighth rank on the composite index of overall development. The reason of a more depriveddistrict (like Harda) bagging less funds than a less deprived district (like Jabalpur) is the share of population asit holds 30 percent weighr in rhe index of devolution.
Table 4Ranking of Districts based on Devolution Index
Rank District Devolution Index Percent Allocation Fund Allocation (INR)
1 Shivpuri 0.0312 3.1201 312,010.15
2 Chhatarpur 0.0311 3.1102 311,023.44,
Panna 0.0299 2.9913 299,130.76J
4 Sagar 0.0295 2.9520 295,197.54
5 Sarna 0.0290 2.9041 290,412.80
6 Dhar 0.0289 2.8856 288,564.36
7 Berul 0.0281 2.8099 280,986.07
8 Chhindwara 0.0281 2.8086 280,862.09
9 Mandla 0.0281 2.8059 280,586.28
10 Morena 0.0280 2.8023 280,230.71
11 Khargone 0.0280 2.7969 279,685.82
12 Banvani 0.0278 2.7844 278,441.87
13 Damoh 0.0275 2.7543 275,434.66
14 Balaghat 0.0274 2.7383 273,833.49
15 Rajgarh 0.0274 2.7382 273,822.12
16 Shahdol 0.0272 2.7184 271,841.07
17 Bhind 0.0272 2.7182 271,822.94
18 Guna 0.0269 2.6911 269,105.78
19 Jhabua 0.0265 2.6541 265,411.82
20 Sheopur 0.0263 2.6287 262,871.37
21 Seoni 0.0258 2.5803 258,029.46
22 Khandwa 0.0258 2.5759 257,594.01?' Shajapur 0.0256 2.5565 255,652.12_J
24 Kami 0.0254 2.5356 253,557.97r Umaria 0.0254 2.5352 253,521.36_J
26 Mandsaur 0.0252 2.5227 252,273.40
27 Sehore 0.0250 2.4982 249,822.19
28 Vidisha 0.0250 2.4980 249,803.77
29 Ratlam 0.0246 2.4649 246,489.13
30 Dev.las 0.0226 2.2625 226,254.48
31 Neemuch 0.0225 2.2490 224,902.25
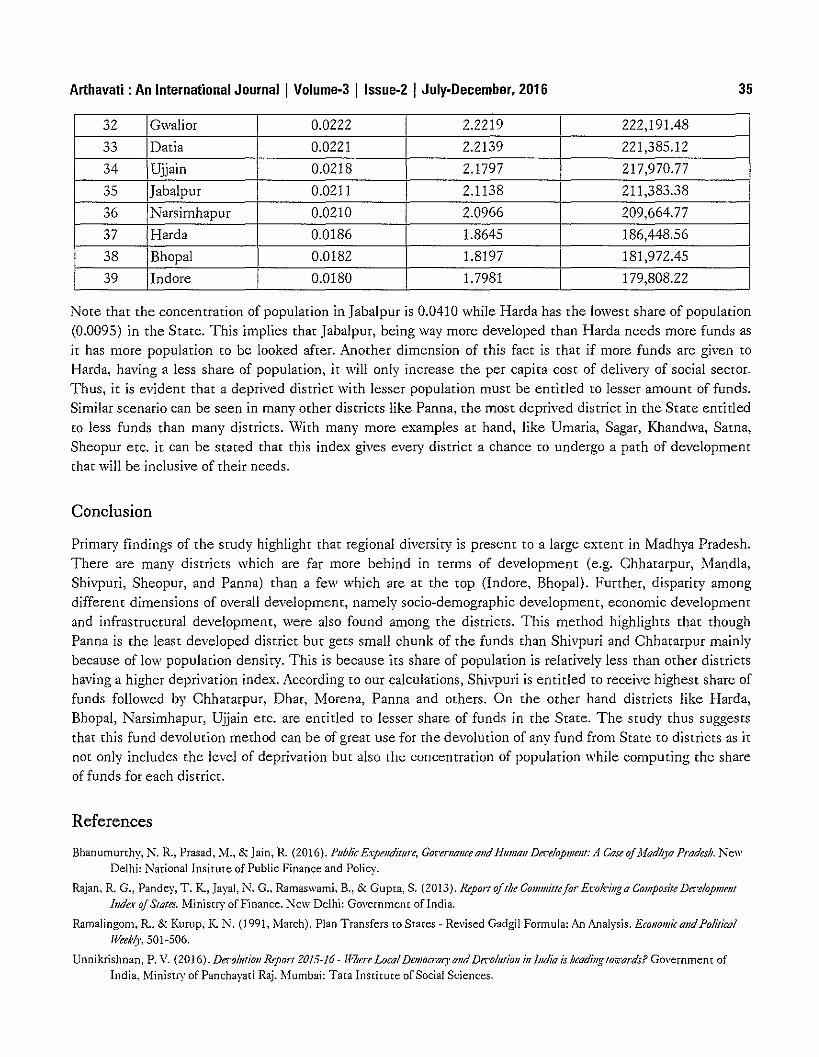
Arthavati : An International Journal I Volume-3 I Issue-2 I July-December, 2016 35
32 Gwalior 0.0222 2.2219 222,191.48
33 Datia 0.0221 2.2139 221,385.12
34 Ujjain 0.0218 2.1797 217,970.77
35 Jabalpur 0.0211 2.1138 211,383.38
36 Narsimhapur 0.0210 2.0966 209,664.77
37 Harda 0.0186 1.8645 186,448.56
38 Bhopal 0.0182 1.8197 181,972.45
39 Indore 0.0180 1.7981 179,808.22
Note that the concentration of population in Jabalpur is 0.0410 while Harda has the lowest share of population(0.0095) in the State. This implies that Jabalpur, being way more developed than Harda needs more funds asit has more population to be looked after. Another dimension of this fact is that if more funds are given to
Harda, having a less share of population, it will only increase the per capita cost of delivery of social sector.Thus, it is evident rhar a deprived district with lesser population must be entitled to lesser amount of funds.Similar scenario can be seen in many other districts like Panna, rhe most deprived district in the Srate entitledto less funds than many districts. Wirh many more examples ar hand, like Umaria, Sagar, Khandwa, Sarna,Sheopur etc. it can be stated that this index gives every district a chance to undergo a path of developmentthat will be inclusive of rheit needs.
Conclusion
Primary findings of the srudy highlight that regional diversity is present to a large extent in Madhya Pradesh.There are many districts which are far more behind in terms of developmenr (e.g. Ghhararpur, Mandla,Shivpuri, Sheopur, and Panna) than a few which are at the top (Indore, Bhopal). Further, dispariry amongdifferent dimensions of overall development, namely socio-demographic development, economic developmentand infrastrucrural development, were also found among the districrs. This merhod highlights that thoughPanna is the least developed district bur gets small chunk of the funds than Shivpuri and Ghhatarpur mainlybecause of low population density. This is because its share of population is relatively less than other districtshaving a higher deprivation index. According to our calculations, Shivpuri is entitled to receive highest share offunds followed by Ghhararpur, Dhar, Morena, Panna and others. On the other hand districts like Harda,Bhopal, Narsimhapur, Ujjain etc. are entitled ro lesser share of funds in the State. The srudy thus suggeststhat this fund devolution method can be of great use for the devolution of any fund from State to districts as itnot only includes the level of deprivation but also the concentration of population while computing the shareoffunds for each district.
References
Bhanumurthy, N. R., Prasad, ,M., & Jain, R. (2016). Public E:lpellditure, GOFerllOllCeOlld HUJIlol1 De'ce!opmcJl!: A Cose ofAlodh)'o Pradesh. New
Delhi: National Insirure of Public Finance and Policy.
Rajan, R. G., Pandey, T. K, ]ayal, N. G., Ramaswami, R, & Gupta, S. (2013). &pOI1 ofthe Commit/elor Eeok-ingo Composite Decelop1l/eJllJ1lde.'II ofStates. .Ministry of Finance. New Delhi: Government of India.
Ramalingom, R., & Kurup, K N. (1991, March). Plan Transfers to States - Revised Gadgil Formula: An Analysis. Ecol!OlIli'colld PoliticolWcek~l', 501-506.
Unnikrishnan, P. V. (2016). Deco/urioN Rrpo11 2015-16 - IVI/cre LocalDemocrocy aNd Dreo/urioll ill II/dio;s headillg tOfXClrdsP Government of
India, MiniSH)' ofPanchayati Raj. Mumbai: Tara Institute of Social Sciences.
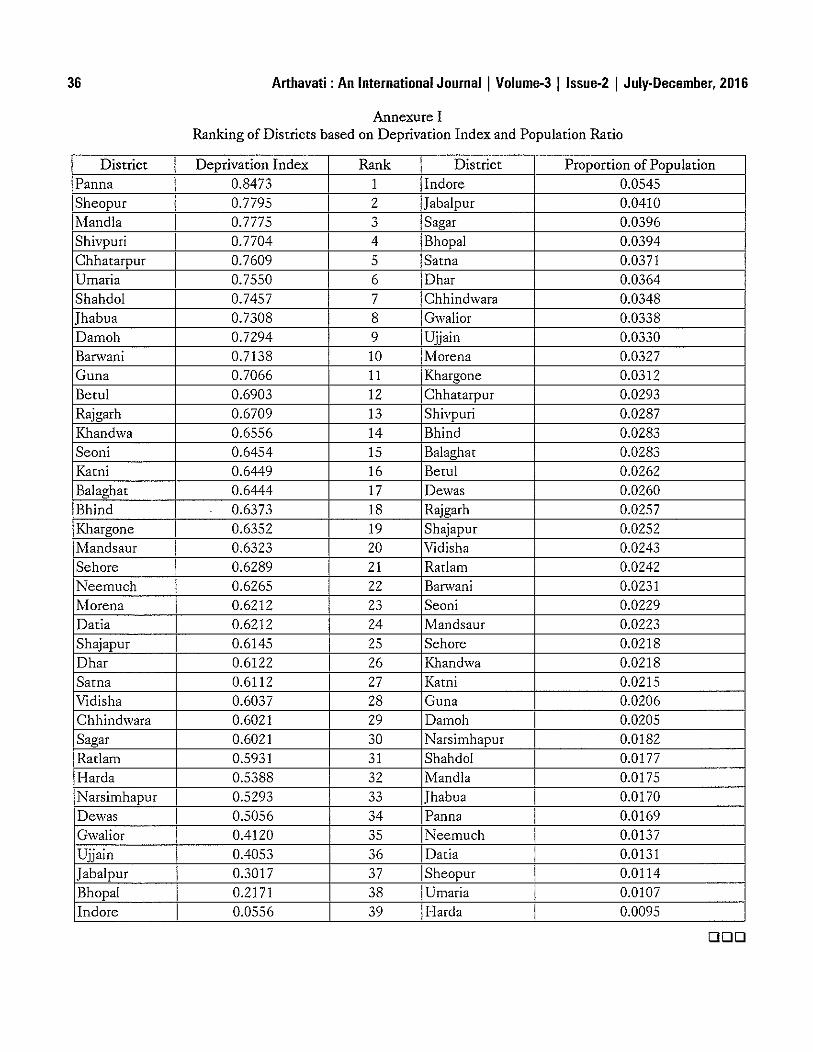
36 Arthavati : An International Journal I Volume-3 Ilssue-2 I July-December, 2016
Annexure IRanking of Districts based on Deprivation Index and Population Ratio
District Deprivation Index Rank District Proportion of PopulationPanna 0.8473 1 Indore 0.0545Sheopur 0.7795 2 Jabalpur 0.0410Mandla 0.7775 0 Sagar 0.0396"Shivpuri 0.7704 4 Bhopal 0.0394Chhararpur 0.7609 5 Sarna 0.0371Umaria 0.7550 6 Dhar 0.0364Shahdol 0.7457 7 Chhindwara 0.0348Jhabua 0.7308 8 Gwalior 0.0338Damoh 0.7294 9 Ujjain 0.0330Banvani 0.7138 10 Morena 0.0327Guna 0.7066 11 Khargone 0.0312Bewl 0.6903 12 Chhararpur 0.0293Rajgarh 0.6709 13 Shivpuri 0.0287Khandwa 0.6556 14 Bhind 0.0283Seoni 0.6454 15 Balaghar 0.0283Karni 0.6449 16 Bewl 0.0262Balaghar 0.6444 17 Dewas 0.0260Bhind 0.6373 18 Rajgarh 0.0257Khargone 0.6352 19 Shajapur 0.0252Mandsaur 0.6323 20 Vidisha 0.0243Sehore 0.6289 21 Ratlam 0.0242Neemuch 0.6265 22 Banvani 0.0231Morena 0.6212 23 Seoni 0.0229Daria 0.6212 24 Mandsaur 0.0223Shajapur 0.6145 25 Sehore 0.0218Dhar 0.6122 26 Khandwa 0.0218Sarna 0.6112 27 Karni 0.0215Vidisha 0.6037 28 Guna 0.0206Chhindwara 0.6021 29 Damoh 0.0205Sagar 0.6021 30 Narsimhapur 0.0182Ratlam 0.5931 31 Shahdol I 0.Q177
Harda 0.5388 32 Mandla I 0.0175Narsimhapur I 0.5293 33 Jhabua 0.0170De,vas 0.5056 34 Panna 0.0169Gwalior 0.4120 35 Neemuch 0.0137Ujjain 0.4053 36 Daria 0.0131Jabalpur 0.3017 37 Sheopur 0.0114Bhopal 0.2171 38 Umaria 0.0107Indore 0.0556 39 Harda 0.0095
DOD
Financial Issues &Economic ReformsDr. Satish K Batra'
Considering the fact that the economic reforms initiated in July 1991 marked a radical departure from theearlier economic philosophy it seems appropriate to elucidate the reforms first, followed by a discussion onfinancial issues in the second part of the address. The concluding part focuses on the rejuvenation andreorientation of economic reforms. I begin with the background so as to appreciate the historical context of thetheme.
The year 1991 is rightly regarded as a watershed year in the economic history of India. Because although somebaby and/or hesitant steps were taken towards unshackling of the economy in the beginning of the 1980's, it isthe economic reforms initiated in July 1991 that marked a real paradigm shift in the sense that thepredominantly socialistic-oriented licence-permit-quota (LPQ) strategy was gradually, sequentially andincrementally teplaced by conspicuous market-otiented liberalization, privatization and globalization strategy(LPG).
The main reasons behind this shift was the acute financial-fiscal ctisis for one thing and "thrust upon" lO-pointWashington Consensus' (encapsulated by John Williamson and sponsoted by World Bank and IMF etc.) foranother. In fine, the 1991 economic refotms were at best crisis-led and imposed-on.
The following preface of the budget presented on 24 July 1991 makes it more than clear that the economicreforms undertook in 1991 wete essentially financial in nature. This preface was reproduced in the EconomicSurvey, 1991-92, published for the fitst (and so fat last) time in twO parts: Part I, Genetal Review and Part IISectoral Developments. The tegular budget for 1991-92,
"Initiated a major effort towards correcting the fiscal imbalance. It envisaged a reduction in the fiscal deficit. ...aimed at containing the government expenditure and augmenting revenues; reversing the dO'wn\vard trend inthe share of direct taxes in total tax revenue; curbing conspicuous consumption, encouraging indigenousindustry and improving competitiveness of the industrial secror particularly export industries.'"
In defence of LPQ strategy
Understandably, every policy usually tries to respond to the exigencies and needs of the then situations.Therefore, it would be too naive to condemn and castigate the LPQ policy as In
Fact, under the circumstances, on the eve of independence and prevailing environment, the options wereextremely limi ted.
The \Vashington Consensus was later refined as Santiago Consensus in 1998.
Government of India, Economic Survey, 1991-92, Part II, p2.
* DlIpt)' Director-cIIJIl-AdviseJ; Bhoroti.1'o Vid.1'o BhoVOJl, Joipur
38 Arthavati : An International Journal I Volume-3 I Issue-2 I Julv-December, 2016
The main elements of LPQ strategy
The five broad features of the LPQ strategy were:
• Public monopoly over heavy industry in preference to the light and labour-intensive industry as well asagriculture;
• Provision of strict investment licensing for private industries;
• Enforcement of reservation for small sector enterprises;
• Espousing growth-led export policy for self-sufficiency; and
• A policy regime marked by difficult entry, more difficult exists and most difficult punitive action againstthe sinecures, in government sector in particular.
All in all, the 'welfarian' state was assigned fivefold stupendous tasks as a protector, ptoducer, controller,provider and facilitator.'
The implications of LPQ strategy
The five main implications resulting from almost four decades of the LPQ strategy can be briefly enumeratedas follows:
• Imbalanced and stunted economic growth derisively termed as the Hindu growth rate (HGR) by lateProf Raj Krishna, leading to fiscal woes;
• Shortages and prevalence of sellers' market at the cost of consumers sovereignry;
• Proliferation of monopolistic and oligopolistic regime and bloated government sector at the cost ofcompetitive efficiency;
• Politicisation and bureaucratisation of business environment at the COSt of professionalism;
• Aggravation of the three core evils, viz. absolute poverry, serious inequality and widespreadunemployment in sharp contrast to the famous, Tryst with Destiny dream of the prime ministerJawaharlal Nehru (15 Aug. 1947).
To reiterate, all was not wrong with the LPQ strategy considering the context and the circumstances in whichit was adopted. But, unfortunately, it was catried toO far and for toO long despite bereft of its logic andrelevance as also its detrimental consequences. As a result production, productiviry and, therefore, growthplummeted, socio-economic scourges exacerbated and socialist dreams shattered.
Arvind Virmani, using a comparator has drawn a conclusion that the welfare per capita GDP of the averageIndian as a percent of the average world citizen decreased from 29 to 20 during this era of LPQ, i.e. 1950-79.He also adds that average per capita GDP growth per annum of the world increased at 2.7 percent whereas thatoflndia inched at 1.1% only (less than 1.6% of the world average) during the above period.'
1. Arvind Panagariya, "Freeing the old economy," The Ecollomic Times, 31 Jan 2001.2. Arvind Virmani, "The God That Failed", The Times oflndia, 21 Nov 2013
Arthavati : An International Journal I Volume-3 I Issue·2 I July-December, 2016
I Eeconomic Reforms
39
According to Economic Surve)', 1991-92, economic reforms, "included short-term measures aimed at cnSISmanagement as well as longer-term measures of structural reform aimed at improving efficiency andproductivity and putting the economy back on the path of sustainable growth with equity and social justice.'"
Same objectives were echoed by Montek Singh Ahluwalia during the first Raj Krishna Memorial Lectureorganized by the Department of Economics, University of Rajasthan in 1995. He pointed our, "There was animmediate objective of managing BOP crisis and restoring viability in external payments and there was also amedium-term objective of setting the economy on the path of rapid and sustainable growth.'
The rationale behind economic reforms
As already said, financial crisis was the core reason behind initiating economic reforms programme spanningLPG strategy. The raison d'tre of reforms revolved around five main points, viz. fiscal consolidation, unleashingof competitive strength, prominence to market forces, rightsizing and right working of government and publicprivate-partnership.
Sectoral reforms
The reforms policy initiatives were announced for seven sectors as follows:
1. Fiscal policy
It was emphasized that the fiscal policy would aim at improving fiscal balance for eliminating inflationarypressure. This required controlling public debt, reduction in subsidies and redirecting governmentexpenditure from less productive and non-developmental activities to strategic investment in infrastructureand human development.
2. Trade policy
The trade policy envisaged gradual relaxation of import controls, opening up the economy to foreigncompetition to permit the full exploitation of the country's dynamic competitive advantage.
3. Industrial policy
Crearing sre~dy and continuous competitive pressure by dismantling restraints on internal competition alongwith stable and moderately protective tariff structure was to be the focus of industrial policy. At the sametime, it was resolved to protect the interests of workers through a proper safety net.
4. Financial policy
The Economic Survey admitted, "The financial sector is at the centre of economic activity; its health affectsthe entire economy." Over-controls, therefore, would be replaced by judicious regulation to srrengthen banksand other financial institutions, including financial instruments to finance faster as well as equitabledevelopment.
2. Government oflndia, op.at. Part I, pI.3. Department of Economics, University of Rajasthan, First Raj Krishna Memorial Lecrure, "Economic Reforms for the Nineties,"
1995.
40 Arthavati : An International Journal I Volume-3 I Issue-2 I July-December. 2016
5. Agricultural policy
The ingredients of agricultural policy reforms included constant improvement in the technology of production,storage, marketing, extension, dry land farming, R&D and a credible system of food security, etc. In fact, thereforms took note of the fact that with the emergence of green revolution, the nature of agricultural problemhad changed drastically.
6. Poverty alleviation policy
The government vowed to "target the poverty alleviarion programmes towards the worsr affected sections ofthe people to make them more responsive to felt needs and to improve their efficiency".' After all, meetingthe peoples' basic needs and preventing distress has been the top priority of the government since the Trystwith Destiny,' espoused in 1947.
7. Human resource policy
The Survey maintained that the, "People must be helped to enhance their own capabilities through "betteraccess to education & training ....Social and economic uplift of women must be given special emphasis to taptheir potential as well as to moderate population growth."
The Repercussions .
If all was not well with the LPQ strategy, all has gone well with the economic reforms straregy of LPG also,n1ainly because it lacked indigenous rooting, right sequencing, vigorous continuity, requisite rigour, etc. It issometimes feared that we may be back to square one, i.e. 1991. Utterly untenable of course. In shoft, thecherished dream of rapid growth with stability, equity and sustainability has remained a chimera.
Repercussions have been vety many as well as variegated. But as per the theme of the conference, let meconfine to only financial issues.
II Financial Issues
I begin with the trinity of financial issues forming a vicious loop, viz. inflation, fiscal deficit and foreignexchange devaluation; rhe main concerns of monetaty, fiscal and commercial policies respectively.
1. Inflation
However defined or measured - WPI or CPI, headline, food or core, whatever the cause and the kind-demandpull or cost-push, structural or political, expectational or international, moderare or hyper, a high stubborninflation continues to constitute a major financial problem for quite long.
Ruchir Sharma of Breakout Nations (2012) fame believes that consumer inflation has stuck a high of near 5%over the last five years, while Gurcharan Das estimates it at 10% '. In a recent press conference on 3 Jan 2014,Prime Minister Manmohan Singh candidly admitted about the government's failure to contain inflation.Meanwhile, an RBI panel headed by Urjit Patel has suggested that CPI inflation should be brought down to8% in 12 months and to 6% over 24 months before adopting a target of 4%4
1. Government of India, op.cit. Part I, p.26.2. Ibid.3. The Times ofIndia, 19 Jan 2014.4. Ibid, 23 Jan 2014.
Arthavati : An International Journal I Volume-3 I Issue-2 I Julv-December, 2016
2. Fiscal deficit
41
The fiscal deficit number remains worrisome despite FRBM Acr, 2003 and adoption of Kelkar Committee roadmap for fiscal consolidation as also government's resolve to observe frugality. In 2012-13 fiscal deficit at 4.9% ofGOP did beat the target of 5.3%; the targer for the present fiscal is 4.8%. Notably, in absolute amount thefiscal deficit has increased from Rs.8299 crorer in 1980-81 to Rs.5, 20,925 crores in 2012-13 (RE) and isprojected at Rs.5, 42,499 crores in current fiscal.'
There is a genuine apprehension that to realize this cherished rarget the FM may prune the developmentaland/or welfarian expenditure. Obviously, such measures do more harm than good to economy.
Apart from other reasons, time- and cost overruns pertaining to investment proposals and projects due togovernment's indefensible dithering aggravate fiscal fragility. Agrecably, howcvcr, fiscal deficit is not largelystructural and, therefore, fixable through appropriare and timely policy measures.
3. Devaluation, current-account deficit and balance of payments perplexities
Fiscal deficit and inflation precipitate devaluarion of currency which we suffered some time back. In turn,foreign exchange devaluation via expensive inelastic imports and budget deficits feed inflation.
It may be emphasized that despite devaluation if imports are sticky and exports sluggish, as in our case, itwould create and aggravate current account deficit fuelling balance of payments crisis. Thus devaluation, CADand BOP problems are intertwined. Mainly due to these triangular troubles, capital account convertibility hasbeen forced to hold fire.
In our COUntty, gold and oil imports together accounting for roughly (35% + 11%) 46% of total imports arealleged to be the main culprits behind CAD.' The CAD was 4.5% of GOP in 2012-13 quite high, though notvexatious. The target of CAD for fiscal 2014 is 3.7%, a bit optimistic.
In the opinion of Raghuram Rajan, as of now, our financial fundamentals are quite balanced. For example,public debt-GDP ratio is down from 73.7% in 2006-07 to 66% in 2012-13, central government's debt-GOP ratiowas 46%, short-term external debt was 5.2% of GOP and FOREX reserves at $ 278 b was 15% of GDP, enoughto finance the entire CAD for several years.'
4. Subsidies
Subsidies are usually advocated and resorted to as a welfarian measures for financial inclusion and inclusivegrowth. As a result, subsidies in the form of input, Output, hidden and cross, etc. have been proliferating.
Lately, therefore, they are being increasingly targeted as a drain on the exchequer at a high ratio of 14% ofGDP - 10% direct and 4% indirect.' Amartya Sen, however, in his keynote address in the recent JaipurLiterature Festival has strongly defended the current food subsidy at 1.4% of GDP.'
The main arguments of opposition to huge amount of subsidies are: they are largely misconceived, poorlytargeted, and ill-administered and there are leakages. Moreover, a big chunk comprises non-merit subsidy (Senalso implicitly hinted at it). The Kelkar Committee (2012) recommended for a drastic Cut in subsidies so thatresultant savings could be channelized towards social development and employment generation. Therefore, itis the right time to curtail them judiciously.
1. Rajasthall Patriko, 20 Jan 14.2. Chandrajir Bannerjee, CII, The TimtsojII/dio, 03 Jan 2014.3. Harvard Business School, 15 Oct 2013.
42 Arthavati : An International Journal I Volume·3 Ilssue.2 I July-December, 2016
5. Low investment
Over the last few years both the foreign investment in the form of FDI as well as FII and domestic investmenthave remained quite low, thanks mainly to the so-called PPP (perpetual policy paralysis) syndrome asevidently reflected by Ease of Doing Business (134/185), Corruption Perception Index (94/117) and Starting aBusiness (179/185) findings.
It is due to this depressive environment that India's GDP growth plummeted to 5% during fiscal 2013, lowestin the decade (incidentally, China at 7.7% may register lowest growth in 14 years); the World Bank's forecastlowers our GDP further to 4.8% in the present fiscal, 2014 before it revives to 6.2% in the fiscal 20153
• Moody'sAnalytics however paint an optimistic picture for 2014.'
Advisably, the newly constituted Cabinet Committee on Investment and the Project Monitoring Group mustbecome truly proactive as also responsive.
6. Disinvestment
One of the messages of economic reforms has been that it is no business of government to be in business.Hence, along with less of government what is, imperative is disinvestment of government stake in publicsector enterprises. Additionally, disinvestment is not only a handy potential source of revenue generation, butalso superior to the other available modes of finance such as debt and deficit financing.
In fact, NDA set up a Disinvestment Commission in 1998 to undertake a massive disinvestment programmein the non- core areas of central public undertakings (CPU) in particular (later it was dismantled and, instead,Investment Commission of India was instituted in 2004 ). Success, however, has remained limited mainly dueto lukewarm efforts and poor market response. Nevertheless, lackadaisical approach has continued.
It may be noted that the target of disinvestment of rupees 30,000 crores for 2012-13 was not realized.Moreover there is hardly any possibility of achieving the present fiscal's (2014) ambitious target of rupees40,000 crores. So far the government has'not inched towards it.
7. Pathetic penetration of banking
Despite two doses of nationalization in 1969 and 1980 and several other peace meal measures such as leadbank scheme, regional rural banks, new private sector banks, business correspondents/business facilitators,hybrid banking, Bharatiya Mahila Bank (2013), no-frills accounts as also the "last mile approach," the latestavatar micro finance and its main purveyor, SHG-bank linkage and what have you, majority of population is stillunbanked as well as under-banked.
According to one estimate 41 % of adult population in general and 61% of population in rural areas do not havebank accounts. Resultantly, indigenous banking rules the roost and financial inclusion remains an illusion.
Historically, the Indian financial system has been a bank dominated phenomenon and the gradual process ofdisintermediation through 'public markets' has been of relatively recent origin. For example, bankinginstitutions account for nearly 70% of the toral assets of all the financial institutions. Obviously, the challengeis to increase penetration of banking system and to ensure access of financial services to the large numbersexcluded from the system.
1. Da;/Jil, Bhaskar,S Jan 2014.2. ]aipur Literature Festival, 17 Jan 2014.3. The Eco1lomic Times, 16 Jan 2014.4. The Times of Indio, 23 Jan 2014.
Arthavati : An International Journal I Volume-3 I Issue-2 I July-December, 2016 43
Fortunately, we could escape the 1997 Asian banking crisis and taper American as well as PUGS catastrophe of2008-09 due ro well-carved-out navigational effort of RBI. Bur RBI is also largely criticized for throttlingcompetition and stagnant banking for one thing' and for preponderant inflation- targeting approach foranother.'
It is also felt that India's monetary policy remains hawkish as the RBI fights the lone battle ro get the economyback on the track whereas the government fails ro walk the talk (the twin fiscal and CAD deficits). Otherchallenges include, growing bad loans, NPAs, shadow banking, stringent regularory framework, changes incustomer loyalty, etc.
8. Inadequate insurance coverage
Research reveals that there is a high positive correlation between insurance sector development and economicgrowth. Importantly, the \¥orld Economic Forum has praised India as one of the rop-ranked countries in regardto life insurance density. Yet, let us not ignore the reality that according ro a survey only 0.2% of totalpopulation is covered by health insurance and only 2.5% have general insurance cover. Actually, only 35% ofcars and 70% of two-wheelers on the road are covered by insurance.'
Insurance penetration in urban areas is reported to be 65%, while in the banked segment of rural areas it isabour 40% only. Misselling, over-and under-insurance are some of the other ailments besetting the insurancesector.
Since a healthy insurance sector is a critical element in a well-functioning financial market and sincepopulation in India is vast in size and has been growing fast in numbers, it is urgent as well as important thatthis sector gets its timely due. Of course, IRDA (1998) has an ardours task to perform.
9. Below-optimal contribution of money and capital markets
Indeed, money and capital markets both primary and secondary can playa crucial role in mobilizing andallocating financial resources since as already remarked, our system is so far bank predominant. There IS,
therefore, a lot of scope for capital market to contribute.
The recent fiasco of National Stock Exchange Ltd (NSEL) has a big lesson for SEBI to be more vigitant aswell as active in promoting financial literacy, investor awareness and broker education on the one hand andeffectively checking financial frauds, insider trading, ponzi scheme, low participation in the capital market etc,on the other.
10. Under-regulated non-banking segment
The ongoing Sahara episode and the approximate Rs. 5600 crore fraud concerning NSEL are a clear pointer tothe existing dismal financial scene in the non-banking sector as also on the kind of corrective and proactiveaction thar is immediately called for. Imperatively, multilevel marketing companies, chit fund organizations,housing finance entities, stock broking companies, merchant banking institutions etc. must be subjected toregular and appropriate supervision to not only to safeguard the interests of savers and invesrors bur also roinstil confidence in them for parking their saving in such entities.
1. Ajay Shah, NIPFP, The Ecollomic Times, 9 Jan 2014.2. Bimal Jalan and YV Reddy, The EC01l01ll;C Times, 15 Jan 2014.3. G.Srinivasan, New India Insurance.
44 Arthavati : An International Journal I Volume·3 I Issue·2 I July-December. 2016
11. Low Tax/GDP Ratio
The tax-revenue GDP ratio has been quite low in India constraining financial resources of the governmentwhich in turn adversely impact government expenditure and investment. Presently, gross tax revenue is 10.7%(direct tax 5.6% and indirect tax 5.0%) of GDP. 1
There was a time when a very high marginal rate of income tax was considered responsible for tax evasion andits low contribution ro government revenue. But, following Laffer principle, in spite of moderate rates sincelong the situation has not improved as expected and desired.
In fact, the tax-base is inadequate, the laws are archaic, the administration is lousy and rhe conscience does notprick. In brief, the celebrated canons of taxation, viz, simpliciry, justice, efficiency and sufficiency (of revenue)are largely flouted. Desirable, therefore, is that long due reforms concerning GST and DTC must take shape,the earlier the better.
12. Financial exclusion
In the present circumstances inclusive growth or its subset financial inclusion looks to be a distant dream. Thehigh incidence of absolute poverty at 21.2% in 2011-12 (planning commission) growing inequalities during lasttwo decades (OECD) and jobless growth in the present regime (NSSO), are enough evidence of the fact thatthe objective of the inclusive growth of the 11th plan and more inclusive growth of the 12th plan would end upas fairy stories.
The committee on financial inclusion headed by C Rangarajan (2008) has suggested comprehensive steps forfinancial inclusion. Imporrant is their timely implementation.
13. Corruption
Corruption and, in a sense, its close accomplice black income (estimated at rupees 55 lakh crores or 50% ofGOP by Arun Kumar, Professor, JNU)' are the most talked about but the least acted upon subjects. Reallyspeaking charity fails to begin from home, for it has become "homeless." Precisely, it is because of this one bigand many other reasons that despite Prevention of Money Laundering Act, 1992, several stringent measures,well-meaning warnings, score of voluntaty disclosure schemes, the solution is not in sight. The recent politicaldevelopment in Delhi has kindled some hope. But it will be toO early to be highly optimistic and that toO soearly.
Sometime back someone came out with a simple equation for public sector corruption, VIZ C=M+D-Ameaning monopoly windfall, discretionaty decision making and accountability. Simply, power minusaccountability is the root cause of corruption.
Nobel laureate, Amarrya Sen, in the above-mentioned keynote address at JLF remarked that rooting outcorruption would "require many administrative reforms." A question is: should we draw solace from the otherNobel laureate viz. Joseph Stiglitz for the observation that "the US financial system was rife with corruption"and that the "US (is a) good competitor to India in corruption"'.
1. Government oflndia, op.cit., 2012-13, p.61.2. Arun Kumar, "Look within than Abroad," TIle Eco1lomic Times, 26 Jan - 01 Feb 2014, p.83. TIle Times of Indio, 11 Jan 2014
Arthavati : An International Journal I Volume-3 I Issue·2 I July-December. 2016
III. Relevance, Rejuvenation and Reorientation of Economic Reforms
45
The economic reforms of 1991 despite some defects and errors in design and despite certain follies and failuresin implementation did generate spectaculat economic growth tate at the macro level. Factually speaking theso-called derisive Hindu growth rate was transformed into higher (new Hindu) growth rate. At the same timeof course the reforms did fail to answer many questions pertaining to inequality, unemployment, stability,sustainability, inclusiveness housing and sanitation, hunger and nutrition, etc. Yet, all credit to LPQ strategyfor freeing the economy from arrested economic growth.
It is due to this achievement as well as euphoria that 0' Neill of Goldman Sachs in 2001 coined the acronymBRIC (later BRICS), i.e. Brazil, Russia, India and China (South Mrica) - the economies which were projectedto grow faster and become wealthicr than the most of traditional economies. It was also mooted that E7(emerging 7) BRICs plus Indonesia, Malaysia and Thailand would dethrone the traditional developedcountries G7, i.e. USA, UK, Germany, France, Japan, Italy and Canada by 2050 (later projection, 2035).
In a recent survey, 83% of acknowledge respondents opined that the economic reforms have been derailedcausing the growth to slide.' In fact the Indian economy grew at an impressive rate of 8-10% during 2003-08.The prime minister, Manmohan Singh in the press conference on 3 January 2014, referred to earlier also,claimed that the growth rate of 9% during 9-year from 2004 to 2013 was highest for any 9-year period.
But it seems that heady days of growth have been taken over by gloomy rate of 4.5-5.5% growth. There is agrowing apprehension that 'I' of BRICS that is India would be replaced by another 'I' that is Indonesia. In viewof the ongoing bloom and gloom facing the economy in general and financial woes in particular, the relevanteconomic reforms must be implemented urgently as well as effectively. The reforms of 1991 were sometimescalled as the first genetation reforms concentrating on goods market to be followed by the second generationreforms to focus on factor market. But whereas the promised second generation reforms did not take off, theongoing reforms gOt degenerated.
It is also important to take note of the fact tbat while, as already mentioned, economic reforms of 1991 werecrises-oriented and thrust upon about which, therefore, we had a very little choice, now we have anopportunity to implement well-thought-out home-spun reforms, with well-conceived action plan and welltimed schedule. Though we are already late yet let us not become toO late.
Hence, rigbt now, more than anything else what we need is, in the words of Nobel laureate Joseph Stiglitz,"globalization of politics and mindsets",' hard decisions and tougb actions.
Conclusion
In a seminar on financial issues let me not be toO taxing on you and, therefore, quickly end by rephrasing thewisdom of Regburam Rajan imparted at tbe Harvard Business School, already mentioned earlier, on 15 Oct2013.
\Ve are committed to developing our financial system. Carefully expanding access to finance as also carryingout judicious economic reforms can be source of not only tremendous but also stable, equitable and sustainablegrO\vth.
1. The Eco1lomic Tillles, 27 OC[-Z Nov. 2013.2. Joseph Stiglitz, The Economic Times, 29 September 2006).
46 Arthavati : An International Journal I Volume·3 I Issue·2 I July-December, 2016
India can do better much better by internalizing rhe fact that there are no short Cuts and we have miles to go.Financial Stability and Development Council (2010) Financial Action Task Force, Financial Reforms LawCommittee, Financial Sector Legislative Reforms Commission (2011) etc have done a lot of homework for asound agenda of action. Let their efforts, as it were, not go waste. Equally important is to break five majormyths: (i) financial markets are self-equilibrating and hence self-correcting (ii) all financial innovations areuseful and desirable (iii) key parameters for market efficiency are turnover and liquidity (iv) financial risk canbe accurately measured and managed, and finally (v) India will remain a sleeping elephant and caged tiger or aroaring lion with a speed of tortoise.
DOD
Women Entrepreneurship and Gender Inequality in IndiaDr. Davinder Kumar Madaan'
Sandeepa Malhotrat
Introduction
Gender Inequality measures inequaliry in achievement between women and men in reproductive healrh,empowerment and the labour marker. There is no country with perfect gender equaliry. An equitableallocation of resources between men and women increases the involvement of all people including women intothe growrh process of the country. India's average annual GDP growth rate was 6.75 per cent during postreforms period from 1991-92 to 2015-16. However, the country witnessed the adverse effecrs of economicreforms on gender inequality, as a large section of the popularion was excluded from the benefits ofdevelopment. The Global Wealth Report 2016 pointed our that the top 10 per cent Indians own 80.7 per centof country's wealth, while the remaining 90 per cent shares only 19.3 per cent wealth. Further, the share of thetop 1 per cent has increased in the total India's wealth to 58.4 per cent in 2016 -- higher than the global figureof about 50 per cent (Credit Suisse.2016). In fact, more money in the hands of poor women promotedevelopment at higher rate than if it is put at the disposal ofrich men,
Women entrepreneurship has been recognized as an important source of economic growth. \¥omenentrepreneurs create new jobs for themselves. They enter the business world later on in life, around 40-60years old. Most women-owned businesses are in wholesale, retail trade, and manufacturing. \¥omen'sentrepreneurship can make a particularly strong contribution to the economic well-being of the family andcommunities. Governments across the \vorld as \'~,1ell as various developn1ental organizations are activelyundertaking promotion of '~lOmen entrepreneurs through various schemes, incentives and promotionalmeasures. Federation of Indian \¥omen Entrepreneurs, a National-level organization, founded in 1993 is one ofIndia's Premier Institution for \¥omen thoroughly devoted towards Entrepreneurship Development in thecountry (FlEW, 2015). Its main objective is to promote Entrepreneurship among Women and therebyempower them to join the economic mainstream. This paper is an attempt to discuss women entrepreneurshipand inclusive growth in India with focus on its current position. It also deliberates on the problem of genderdiscrimination and thereby suggest measures for strengthening women entrepreneurship in India.
Women Entrepreneurship in India
\¥omen entrepreneurs consisted of 7.36 per cent of the total number of entrepreneurs in India as per the latestFourth All India Census of Micro, Small, and Medium Enterprises (MSMEs) conducted with reference year2006-07, wherein the data were collected till 2009 and results published in 2011-12. However, this share in theunregistered entrepreneurs was 9.09 per cent. \¥omen employment accounted for 15 per cent in MSMEs.Leading States in women employment were Tamil Nadu (7.77 Lacs), West Bengal (7.72 lacs), Kerala (6.24lacs), and Odisha (4.58 lacs).
Prof, Dept. ofEcollomics, Plllljabi Uiliversity PatZl'ala, PllIyabResearch Scholar, Dept. ofEcollomics, Plllljabi UlliversilJ' Patij'a/a, PllIyab
48 Arthavati : An International Journal I Volume-3 I Issue-2 I July-December, 2016
The Office of Development Commissioner (MSME) is an apex body for formulating and supervisingimplementation of the policies fot the development of MSMEs in India. The Ministry has set up threenational level Entrepreneurship Development Institutes viz;
1. The National Institute for Enttepreneurship and Small Business Development (NIESBUD) (1983) atNoida (Uttar Pradesh),
2. National Institute for Micro, Small and Medium Enterprises (NI-MSME) (1960) at Hyderabad, and
3. Indian Institure of Entrepreneurship (lIE) (1993) at Guwahati,
as autonomous societies. These institutes are involved in developing training modules; undertaking research &training; and providing consulrancy services for entrepreneurship development. The primary responsibility ofpromotion and development of MSMEs is of the State Governments. Howevet, the Government of India helpthe State Governments through various initiatives. The entire non-agticultural sector of economy was broughtundet the coverage of MSME Sector. The policies of the Government have emphasized on promotion ofwomen entrepreneurship particularly among first generation women through vatious training and supportservices. NIESBUD, Noida provided various trainings to 25% women of the total participants till December2014. NSIC and lIE, Guwahati also provided training to women from rural areas and covered all kinds ofentrepreneurial development programmes. There are several schemes, wherein women are provided extrabenefits. However, the Ministry ofMSME is executing tWO specific schemes for women:
1. Trade Related Entrepreneurship Assistance and Development (TREAD) Scheme, a
2. Mahila Coir Yojana.
The TREAD scheme visualizes economiC empowerment of women through the development of theirentrepreneurial skills in non-agricultural activities. Government grants upto 30% of the Loan/credit sanctionedby banks to the Non-Government Organisations (NGOs) for promoting entrepreneurship among women.Government also grant upto Rs.l lakh per programme to training institutions/NGOs for imparting training tothe women entrepteneuts subject to such institutions/NGOs contribute their share to extent of minimum 25% of the GoI grant and 10 % in case of NER. Need-based Government's grants Upto Rs.5 lakh to NationalEntrepreneutship Development Institutions and any other institutions of repute for undertaking field surveys,research studies, evaluation studies, designing of training modules etc.
The Mahila Coir Yojana executed by the Coir Board is a woman oriented self-employment ptogtammelaunched in 1994. Under this programme women are provided training fot catrying out spinning activiry andincreasing their earnings. Under Prime Minister's Employment Generation Programme (PMEGP) launched in2008-09, relaxation is provided to women by giving subsidy on margin money at the rate of 25% of the projectCOSt in urban areas and 35% for the women in rural areas. Furthet, bank finance in the form of loan is 95 percent of the project cost in case of women.
Female Entrepreneurship Index
India ranks a low 70 among 77 countries covered in the 2015- Female Entrepreneurship Index - measures thedevelopment of high potential female entrepreneurship worldwide - brought out by the 'Nashington-basedGlobal Entrepreneurship and Development Institute (GEDI). The index is based on innovative, marketexpanding, and export oriented. The reasons for poor score are lack of labour force equality and access tofinance. The USA, Australia and the UK have been named the top three countries for high-potential female
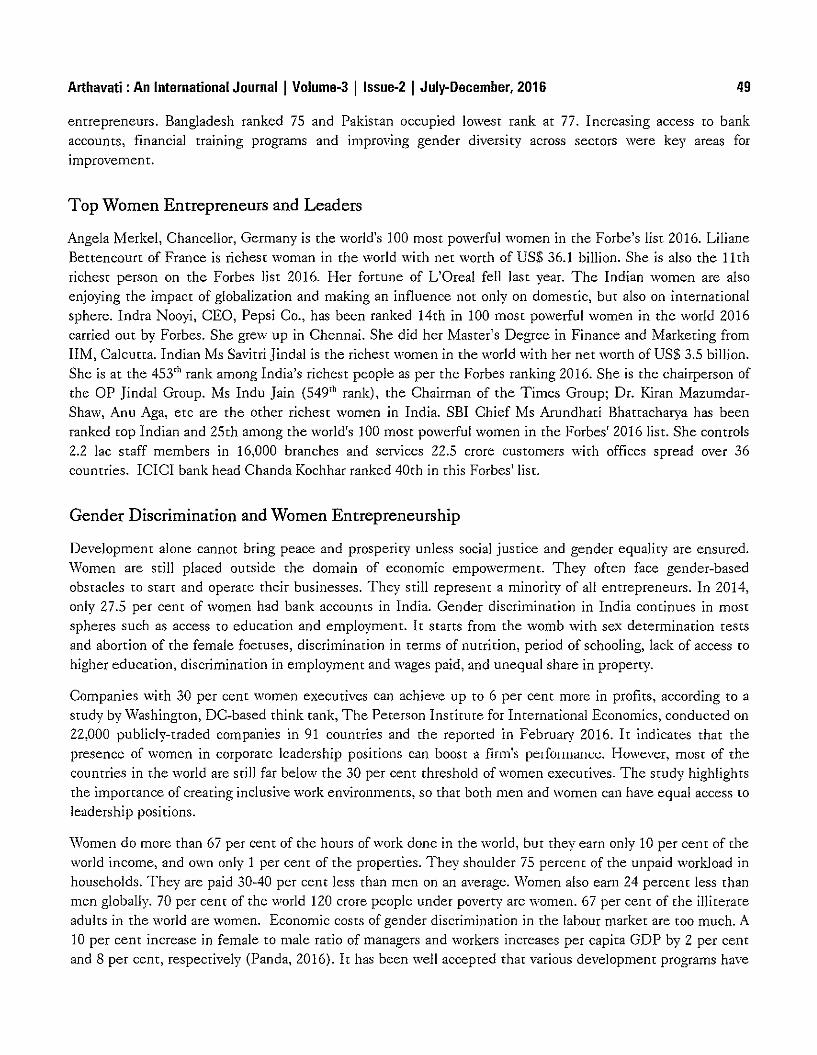
Arthavati : An International Journal I Volume-3 I Issue-2 I July-December, 2016 49
entrepreneurs. Bangladesh ranked 75 and Pakistan occupied lowest rank at 77. Increasing access to bankaccounts, financial training programs and improving gender diversity across sectors were key areas forimprovement.
Top Women Entrepreneurs and Leaders
Angela Merkel, Chancellor, Germany is the world's 100 most powerful women in the Forbe's list 2016. LilianeBettencourt of France is richest woman in the world with net worth of US$ 36.1 billion. She is also the 11thrichest person on the Forbes list 2016. Her fortune of L'Oreal fell last year. The Indian women are alsoenjoying the impact of globalization and making an influence not only on domestic, but also on internationalsphere. Indra Nooyi, CEO, Pepsi Co., has been ranked 14th in 100 most powerful women in the world 2016carried out by Forbes. She grew up in Chennai. She did her Master's Degree in Finance and Marketing fromIIM, Caleutta. Indian Ms Savitri Jindal is the richest women in the world with her net worth of US$ 3.5 billion.She is at the 453'h rank among India's richest people as per the Forbes ranking 2016. She is the chairperson ofthe OP Jindal Group. Ms Indu Jain (549'h rank), the Chairman of the Times Group; Dr. Kiran MazumdarShaw, Anu Aga, etc are the other richest women in India. SBI Chief Ms Arundhati Bhattachatya has beenranked tOP Indian and 25th among the world's 100 most powerful women in the Forbes' 2016 list. She controls2.2 lac staff members in 16,000 branches and services 22.5 crore customers with offices spread over 36countries. ICICI bank head Chanda Kochhar ranked 40th in this Forbes' list.
Gender Discrimination and Women Entrepreneurship
Development alone cannot bring peace and prosperity unless social justice and gender equality are ensured.Women are still placed outside the domain of economic empowerment. They often face gender-basedobstacles to start and operate their businesses. They still represent a minority of all entrepreneurs. In 2014,only 27.5 per cent of women had bank accounts in India. Gender discrimination in India continues in mostspheres such as access to education and employment. It starts from the womb with sex determination testsand abortion of the female foetuses, discrimination in terms of nutrition, period of schooling, lack of access tohigher education, discrimination in employment and wages paid, and unequal share in property.
Companies with 30 per cent women executives can achieve up to 6 per cent more in profits, according to astudy by \Vashington, DC-based think tank, The Peterson Institute for International Economics, conducted on22,000 publicly-traded companies in 91 countries and the reported in February 2016. Ir indicates that thepresence of women in corporare leadership positions can boost a firm's per [ollllullce. However, most of thecountries in the world are still far below the 30 per cent threshold of women executives. The study highlightsthe importance of creating inclusive work environments, so thar both men and women can have equal access toleadership positions.
\Vomen do more than 67 per cent of the hours of work done in the world, but they earn only 10 per cent of theworld income, and own only 1 per cent of the properties. They shoulder 75 percent of the unpaid workload inhouseholds. They are paid 30-40 per cent less than men on an average. \\romen also earn 24 percent less thanmen globally. 70 per cent of the world 120 crore people under poverty are women. 67 per cent of the illiterateadults in the world are women. Economic costs of gender discrimination in the labour market are too much. A10 per cent increase in female to male ratio of managers and workers increases per capita GDP by 2 per centand 8 per cent, respectively (Panda, 2016). It has been well accepted that various development programs have
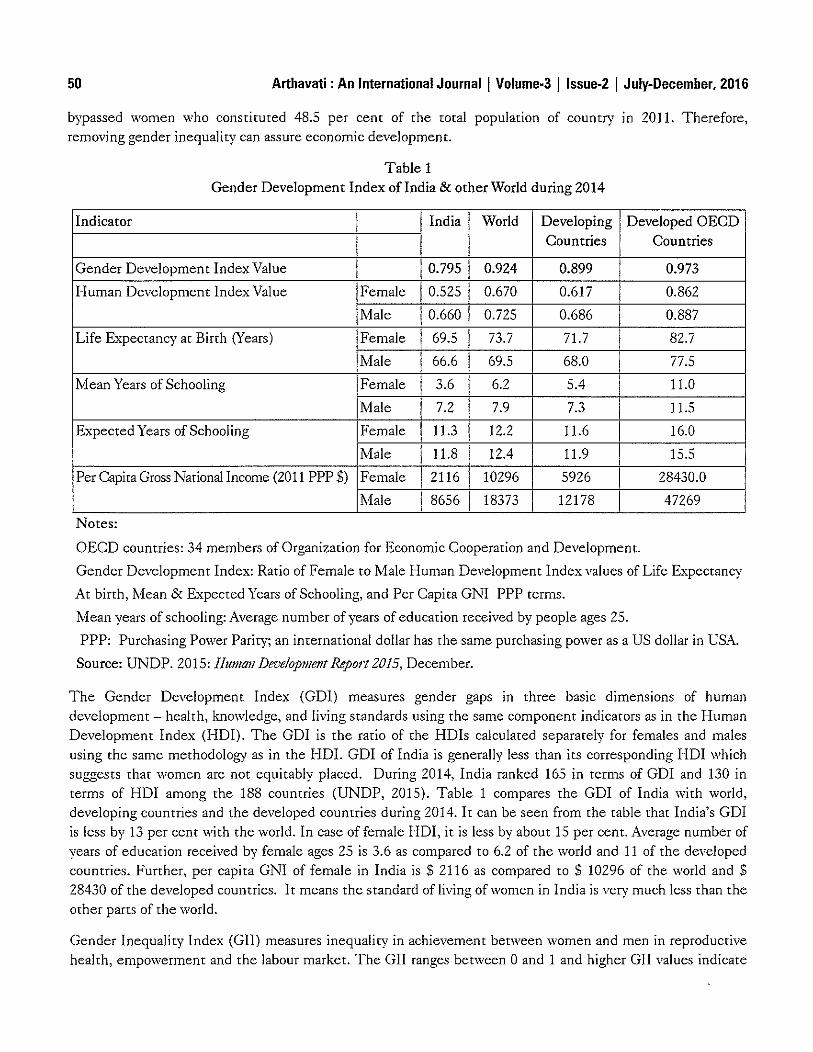
50 Arthavati : An International Journal I Volume-3 jlssue-2 I July-December, 2016
bypassed women who constituted 48.5 per cent of the toral population of country in 2011. Therefore,removing gender inequality can assure economic development.
Table 1Gender Development Index of India & other World during 2014
Indicator India World Developing Developed OECDCountries Countries
Gender Development Index Value 0.795 0.924 0.899 0.973
Human Development Index Value Female 0.525 0.670 0.617 0.862
Male 0.660 0.725 0.686 0.887
Life Expectancy ar Birrh (Years) Female 69.5 73.7 71.7 82.7
Male 66.6 69.5 68.0 77.5
Mean Years of Schooling Female 3.6 6.2 5.4 11.0
Male 7.2 7.9 7.3 11.5
Expected Years of Schooling Female 11.3 12.2 11.6 16.0
Male 11.8 12.4 11.9 15.5
Per Capita Gross National Income (2011 PPP $) Female 2116 10296 5926 28430.0
Male 8656 18373 12178 47269
Notes:
OECD countries: 34 members of Organization for Economic Cooperation and Development.
Gender Development Index: Ratio of Female to Male Human Development Index values of Life Expectancy
At birrh, Mean & Expected Years of Schooling, and Per Capita GNI PPP terms.
Mean years of schooling: Average number of years of education received by people ages 25.
PPP: Purchasing Power Pariry; an international dollar has the same purchasing power as a US dollar in USA.
Source: UNDP. 2015: Humatl Developmetlt Report 2015, December.
The Gender Development Index (GDI) measures gender gaps in three basic dimensions of humandevelopment - health, knowledge, and living standards using the same component indicators as in the HumanDevelopment Index (HDI). The GDI is the ratio of the HDIs calculared separarely for females and malesusing rhe same methodology as in the HDI. GDI of India is generally less than its corresponding HDI whichsuggests that women are not equitably placed. During 2014, India ranked 165 in terms of GDI and 130 interms of HDI among the 188 countries (UNDP, 2015). Table 1 compares the GDI of India with world,developing countries and the developed countries during 2014. It can be seen from the table that India's GDIis less by 13 per cent with the world. In case of female HDI, it is less by abour 15 per cent. Average number ofyears of education received by female ages 25 is 3.6 as compared to 6.2 of the world and 11 of the developedcountries. Further, per capita GNI of female in India is $ 2116 as compared to $ 10296 of the world and $28430 of the developed countries. It means the standard ofliving of women in India is very much less than theother parrs of the world.
Gender Inequality Index (GIl) measures inequaliry in achievement between women and men in reproductivehealth, empowerment and the labour market. The GIl ranges between 0 and 1 and higher GIl values indicate
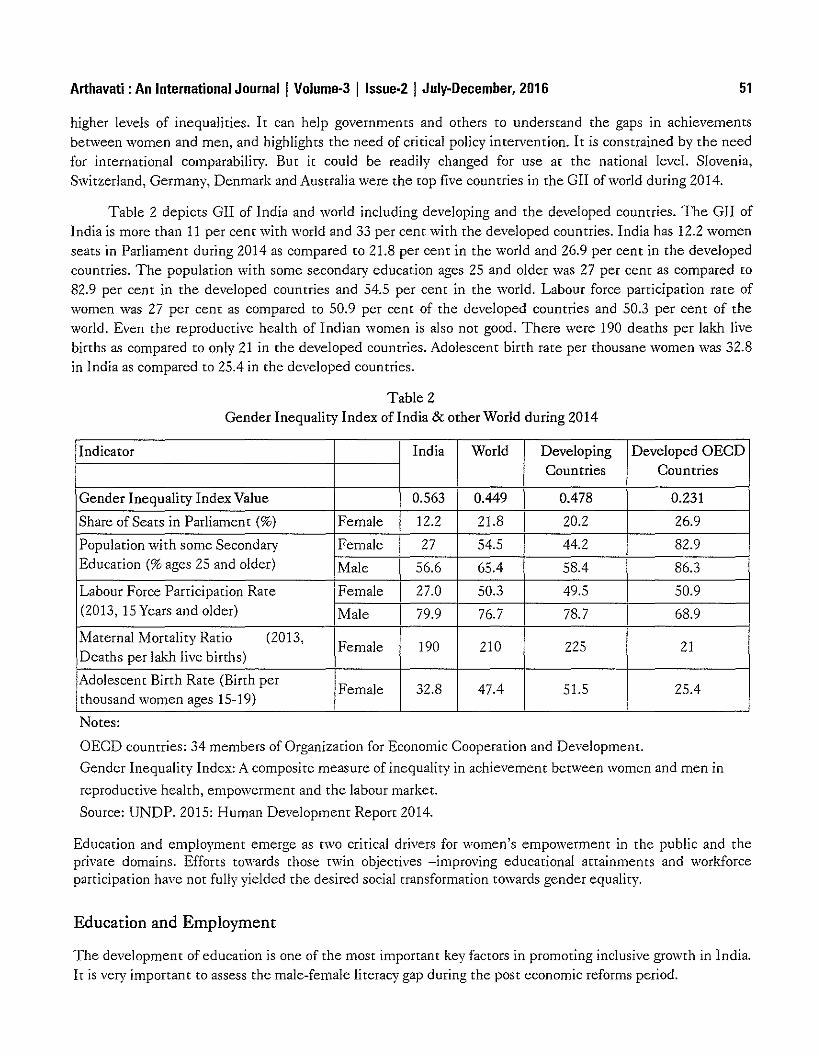
Arthavati : An International Journal I Volume-3 I Issue-2 I Julv-December, 2016 51
higher levels of inequalities. It can help governments and others to understand the gaps in achievementsbetween women and men, and highlights the need of critical policy intervention. It is constrained by the needfor international comparability. Bur it could be readily changed for use at the national level. Slovenia,Switzerland, Germany, Denmark and Australia were the top five countries in the GIl of world during 2014.
Table 2 depicts GIl of India and world including developing and the developed countries. The GIl ofIndia is more than 11 per cent with world and 33 per cent with the developed countries. India has 12.2 womenseats in Parliament during 2014 as compared to 21.8 per cent in the world and 26.9 per cent in the developedcountries. The population with some secondary education ages 25 and older was 27 per cent as compared ro82.9 per cent in the developed countries and 54.5 per cent in the world. Labour force participation rate ofwomen was 27 per cent as compared ro 50.9 per cent of the developed countries and 50.3 per cent of theworld. Even the reproductive health of Indian women is also not good. There were 190 deaths per lakh livebirths as compared ro only 21 in the developed countries. Adolescent birth rate per thousane women was 32.8in India as compared ro 25.4 in the developed countries.
Table 2Gender Inequality Index of India & other World during 2014
Indicator India World Developing Developed GECDCountries Countries
Gender Inequality Index Value 0.563 0.449 0.478 0.231
Share of Seats in Parliament (%) Female 12.2 21.8 20.2 26.9
Population with some Secondary Female 27 54.5 44.2 82.9Education (% ages 25 and older) Male 56.6 65.4 58.4 86.3
Labour Force Participation Rate Female 27.0 50.3 49.5 50.9(2013, 15 Years and older) Male 79.9 76.7 78.7 68.9
Maternal Mortaliry Ratio (2013,Female 190 210 225 21
Deaths per lakh live births)
Adolescent Birth Rate (Birth perFemale 32.8 47.4 51.5 25.4
thousand women ages 15-19)
Notes:
OECD countries: 34 members of Organization for Economic Cooperation and Development.
Gender Inequality Index: A composite measure of inequaliry in achievement between women and men in
reproductive health, empowerment and the labour marker.
Source: UNDP. 2015: Human Development Report 2014.
Education and employment emerge as tWO critical drivers for women's empowerment in the public and theprivate domains. Efforts rowards those twin objectives -improving educational attainments and workforceparticipation have not fully yielded the desired social transformation towards gender equality.
Education and Employment
The development of education is one of the most important key facrors in promoting inclusive growth in India.It is very important ro assess the male-female literacy gap during the POSt economic reforms period.
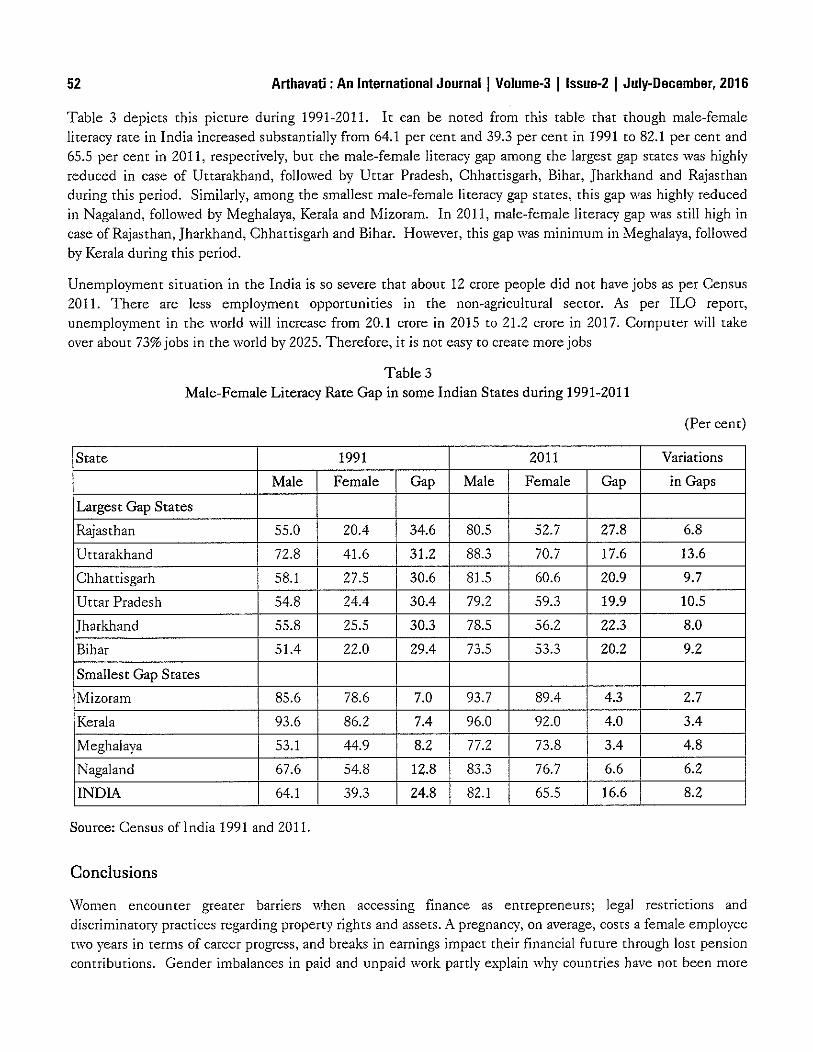
52 Arthavati : An International Journal I Volume-3 I Issue-2 I July-December, 2016
Table 3 depicts this picture during 1991-2011. It can be noted from this table that though male-femaleliteracy rate in India increased substantially from 64.1 per cent and 39.3 per cent in 1991 ro 82.1 per cent and65.5 per cent in 2011, respectively, but the male-female literacy gap among the largest gap states was highlyreduced in case of Uttarakhand, followed by Uttar Pradesh, Chhattisgarh, Bihar, Jharkhand and Rajasthanduring this period. Similarly, among the smallest male-female literacy gap states, this gap was highly reducedin Nagaland, followed by Meghalaya, Kerala and Mizoram. In 2011, male-female literacy gap was still high incase of Rajasthan, Jharkhand, Chhattisgarh and Bihar. However, this gap was minimum in Meghalaya, followedby Kerala during this period.
Unemployment situation in the India is so severe that about 12 crore people did not have jobs as per Census2011. There are less employment opportunities in the non-agricultural secror. AB per ILO report,unemployment in the world will increase from 20.1 crore in 2015 to 21.2 crore in 2017. Computer will takeover about 73% jobs in the world by 2025. Therefore, it is not easy to create more jobs
Table 3Male-Female Literacy Rate Gap in some Indian States during 1991-2011
(Per cent)
State 1991 2011 Variations
Male Female Gap Male Female Gap in Gaps
Largest Gap States
Rajasthan 55.0 20.4 34.6 80.5 52.7 27.8 6.8
Uttarakhand 72.8 41.6 31.2 88.3 70.7 17.6 13.6
Chhattisgarh 58.1 27.5 30.6 81.5 60.6 20.9 9.7
Uttar Pradesh 54.8 24.4 30.4 79.2 59.3 19.9 10.5
Jharkhand 55.8 25.5 30.3 78.5 56.2 22.3 8.0
Bihar 51.4 22.0 29.4 73.5 53.3 20.2 9.2
Smallest Gap States
Mizoram 85.6 78.6 7.0 93.7 89.4 4.3 2.7
Kerala 93.6 86.2 7.4 96.0 92.0 4.0 3.4
Meghalaya 53.1 44.9 8.2 77.2 73.8 3.4 4.8
Nagaland 67.6 54.8 12.8 83.3 76.7 6.6 6.2
INDIA 64.1 39.3 24.8 82.1 65.5 16.6 8.2
Source: Census ofIndia 1991 and 2011.
Conclusions
\"\laDlen encounter greater barriers when accessing finance as entrepreneurs; legal restnctIOns anddiscrin1inatory practices regarding property rights and assets. A pregnancy, on average, COStS a female employeerwo years in rerms of career progress, and breaks in earnings impact their financial future through lost pensioncontributions. Gender imbalances in paid and unpaid work partly explain why countries have not been more
Arthavati : An International Journal I Volume·3 I Issue·2 I July-December, 2016 53
successful in achieving gender equality. Preparing women with relevant education and training is serious forthe transition to a reasonable world of work. Globalization, digital technologies and new ways of working arealso ushering in new notions of work, and puts a high quality on workers with skills knowledge. \\Tomen remainmuch underrepresented in these technical subjects. Thus, addressing this gap with education and employmentto women could bring high economic growth in the economy. Empowerment of women has emerged as animportant issue in recent times. It is of paramount importance to political thinkers, social scientists andreformers. In the meantime, it is necessary for the government to start such programs which will address to
attitudinal changes, training, supportive services, etc. for the development of women entrepreneurship.However, there is a long 'way to go for the empO\verment of women in India.
References
Credit Suisse Research Institute. 2016: The Global \Vealth Report 2016, 22 November.
Desai, Vasanr. 2011: 8mallScale Illdustries andEmreprelleJJrship, New Delhi, Himalaya Publishing house.
FJ'iNE. 2015. http://fiwe.orglorganisation.hrrnJ#sthash.SauSgkhG.dpuf
Gordon E. & Nararajan K 2007: Elltreprelleurship DecelopllJeIlT, New Delhi, Himalaya Publication House.
Gupta, Sanjay. 2011: Fill/dOli/emu! ofElllreprmc"rs!Jip, Agra, SBPD Publications.
Gupta, Ruehi. 2013: B'lSJi,css EIJ'Cirolllllclll alld EJltreprelletirship, New Delhi, Bharar Law House Pvt. Ltd.
Kanka, S.S. 1999: ENtrepreNeurialDf'ce!op1lJeNt, New Delhi, S. Chand Publishing Pvc. Ltd.
Kumbhar, Vijay. 2013: Some Critical Issues of\Vomen Entrepreneurship in Rural India, EuropeaN Academic Research, Vol.1, Issue 2, May.
Mahajan, Shikha. 2013: \Vomen Entrepreneurship in India, Global JONf"Ilal of .11aNagellJellf aNd BusiNess Stlldies, Volume 3, Number 10, pp.1143-1148.Mathur, Abha. 2013: Busilless EntrepreJleurship aJld .11allagellJent, New Delhi, Taxmann Publication Ltd.
www.microfinancegatewaY',org
Panda, Pardeep Kumar. 2016. From Mite [Q Might, Orissa POSt, Bhubaneswar, March 5,
Ramachandren, K 2008: Emrepreneurship Df'ce!opmem, New Delhi, Mcgraw Hill Education.
Setty, E.D. 2004: ClinicalApproach to PromotioJl ofElltrepreneurslllp amoJlg rFomeJJ, Lucknow, Eastren Book Company.
Sharma, Ruchi., Mathur, Sapna. & Tripathi, Nitin. 2014: EmrepreJJeurslllp Dt"celopmellt, New Delhi, Vikas Publishing.
www.saccindia.org
Tomar, Ajay Kumar, Pandey, Pardeep Kuman & Jain, Shobha.2016: 'Vomen Entrepreneurship in India: Potential and Prospects, New
Delhi, Kunal Books.
UNDP. 2015: Human Development Repon 2015, December.
DOD
Cashless Economy - Pros and ConsDr. Ekta]ha"
ABSTRACT
In the present scenario of changing economy digital i.e. cashless transactions plays an important role indeveloping a society which is empowered with tools helping in stopping frauds, usage of black money anddevelopment of parallel economy. This piece of work gives an overview of benefits and limitations of an idea ofcashless economy.
Introduction
Central Government has announced on 8'h November, 2016 that notes of Rs. 500 and Rs. 1000 will no longerbe a legal tender i.e. demonetized them. The basic aim of this step was to restrict black money, corruption andcounterfeit notes. Before this demonetization has also taken place in 1948 and 1978 but its effect on that timewas not much on economy because the notes which were demonetized at that time are of high value andavailable with vety few peoples. But in present scenario it has affected our economy to the major extentbecause rhe note which were demonetized were available to evety financial class of person and are also of morethan 85% part of total currency. Due to demonetization currency availability was decreased and as a resulr itforced peoples for electronic payments.
Benefits of Cashless Economy
1. Easy way of payment: \¥e can easily make payments in business, retail purchasing and also for materialsof daily household usage.
2. Restriction on Black money and corruption: Mostly business persons not shows their real income, butdue to demonerization now they were not be able to do that as there will be many records of thepayments.
3.
4.
5.
•
Helpful in Banking Sector: A digital economy will help banking sector in starting and once peoples getsused to of electronic payments than the risk of payment and keeping large amount of cash will getreduced..
Transparency and Monitoring: Government can easily monitor all payments and receiving of any personat any time and chances of any kind of fraud gets reduced.
Reduction in expenditure on printing of currency: Government has spent large amount of money inreplacing and reprinting of old and rempered notes e.g. in year 2015 RBI has spent 27 billion rupees to
print new currency.lfwe move forward to cashless society then we reduce this kind of expenditures.
H.o.D. Econolllics-S.PU (PG.) Co/lege, Fa/no, Pa/i, Rajasthan
Arthavati : An International Journal I Volume-3 I Issue-2 I July-December, 2016
Government Plans to Promote Cashless Economy
55
1. Rebate in transaction service tax: Credit/debit card transactIons up to Rs 2,000 will be exempt fromservIce tax.
2. Rupay Kisan Cards: Government will suppOrt RRBs and Cooperative Banks through NABARD to
issue "Rupay Kisan Cards" to 4.32 crore Kisan Credit Card holders.
3. Accident insurance: Online booking of railway tickets will get Rs 10-lakh accident insurance.
4. Swipe machines: 1 lakh villages with population less than 10,000 will get 2 PoS machines (swipemachines) each, free of cost supported through financial inclusion fund.
5. Lucky Grahak Yojna: The main aim of this Yojna is to promote digital transactions. Only thosetransactions were included in these yojnas which were made through Rupay Card, USSD, UPI or Aadharenabled system.
6. BHIM (Bharat Interface for Money): This application works when the bank account is connected withthe Aadhar gateway, then the payment can be made by the payee by just their thumb scanning. Thisapplication also enables financial week persons and small businessmen to make even small paymentseasily.
7. Aadhar Bhugran App: This application was starter by the government on 25'h December, 2016. This appconnects bank account of any person with Aadhar Card. Important feature of this app is that it can beused without mobile phone.
Disadvantages of Cashless Money
1. Cyber Fraud: If there will be any breach in the cyber security in our country the money can be theft bythe cyber hackers and this risk will always exist.
2. Lack of Technology: Presently India is at 114'h position in world as the internet speed is considered.The lowest internet speed in India is 2.8 Mbps whereas in Japan it is 17.0 Mbps so, in the presentscenario of lack of technology the possibility of digital India is low.
3. Poor and illiterate citizens: Approximately less than one fourth of the Indian population has smartphones and also how the illiterate person will be able to use these apps, so, these also are basic hurdlesin the path of cashless economy in India.
4. No Bank account: Many poor people do not even have bank accounts. Although the Jan Dhan Schemelaunched by the government succeeded in bringing million into the banking system, the process is notcomplete and many of the accounts are non-functional. The government has to rectify this problem andbring the entire poor and the marginalized section into the banking system.
5. Small Retailers: The small retailers in India deal only in cash and have not been able to invest in thedigital infrastructure.
56
Conclusion
Arthavati : An International Journal I Volume-3 I Issue-2 I July-December, 2016
To achieve complete cashless economy is next to impossible but we can start a society in which less amount ofcash is used and cashless transactions are promoted. By this transactions in cash decreases and maximumtransactions becomes digital. This approach decteases the rate of theft and use of black money also comes to
an end which develops a balance economy.
References
1. Gangopadhyay S. (2009) "How can Technology Facilir3te Financial Inclusion in India? A Discussion Paper", Rev Mark Imegr1(2):223-256
2. Das A, Agarwal R. (2010) "Cashless Payment System in India- A Roadmap", Technical repoft, lIT Bombay.
3. Hasan I, De Renzis T, Schmiedel H. (2013) "Retail Payments and the Real Economy" ECB 'Working Paper Series: 1572.
4. Shah N. (2016) "The Demonetization Effect", Bussiness India: 37.
5. Mukhopadhyay B. (2016) "Understanding cashless payments in India", Financial Innovation, 2:1-26.
6. Arora A (2017) "Cash Money to Cashless Money", Yojna: 13.
DDD
Role of Womens in Indian EconomyDr. Neelu Shaktawat'
Prof. Anju Kohlit
Abstract
Women playa dominant role in the Indian economy, undertaking a wide range of economic activities includingfarm operations and pO\vering a high savings rate. Hmvever, changes in the employment scenario, risinginflation, social condirions and neglect by policy-makers have impacted adversely on women. In the era ofglobalization, the role ofIndian women at home and work has taken a multifaceted dimension. India being oneof the fastest growing economies, the contribution of women is growing at a steady pace. Most Indian womenby and large undertake "productive work" only under the economic compulsion. Most of the women are foundto be employed in agricultural activities and in the unorganized sector, the employment of women is high incertain works such as part time helper in households, construction centres, tanneries, match box, beediindustries etc.
Key words- Indian economy, role of women
Introduction
Swami Vivekananda -One of the greatest sons of India quote that "There is no chance for the welfare of theworld unless the condition of women is improved. It is not possible for a bird to fly on only one wing ".\'fomenmake up little over half the world population but their contribution to measured economic activity growth andwell being is for below .I ts potential with serious macroeconomic conservancies.
As per Census 2011, workers constituted 39.79 per cent of total population whereas theEmployment of Women Workers in Public and Private Sectors: Employment of women workers in publicsector and private sector were reported to be 3170.64 thousand and 2783.47 thousand respectively during theyear 2011 Due to the changing scenario of the nation, the picture of the economy is changing. \;Yomen workershave tremendously increased not only in the rural sector but also in the urban sector. As per the report ofDirectorate General of Employment and Training the percentage of Educated \\Tomen Job-seekers to totalWomen on Live Register was 85.3. In spite of such a high contribution of female workers in Indian-economy,women are not being paid according to their contribution \;Yomen in India are struggling hard with manyconstraints in the employment.
Objectives of the Study
1.
2.
4.
t
To study to role of women in the economic development ofIndia.
To study the challenges faced by the women.
To height light the contribution of women's in Indian economy.
To dra'" conclusions and suggestions.
Assistantprofessor (DepartmeJlt ofeco1lomics)Madha" lI1li"ersity, Pi1ldwara (sirohi)Assista1ltprofessor (Department ofeco1lomics)Madhav lIniversity, Pindwara (sirohi)
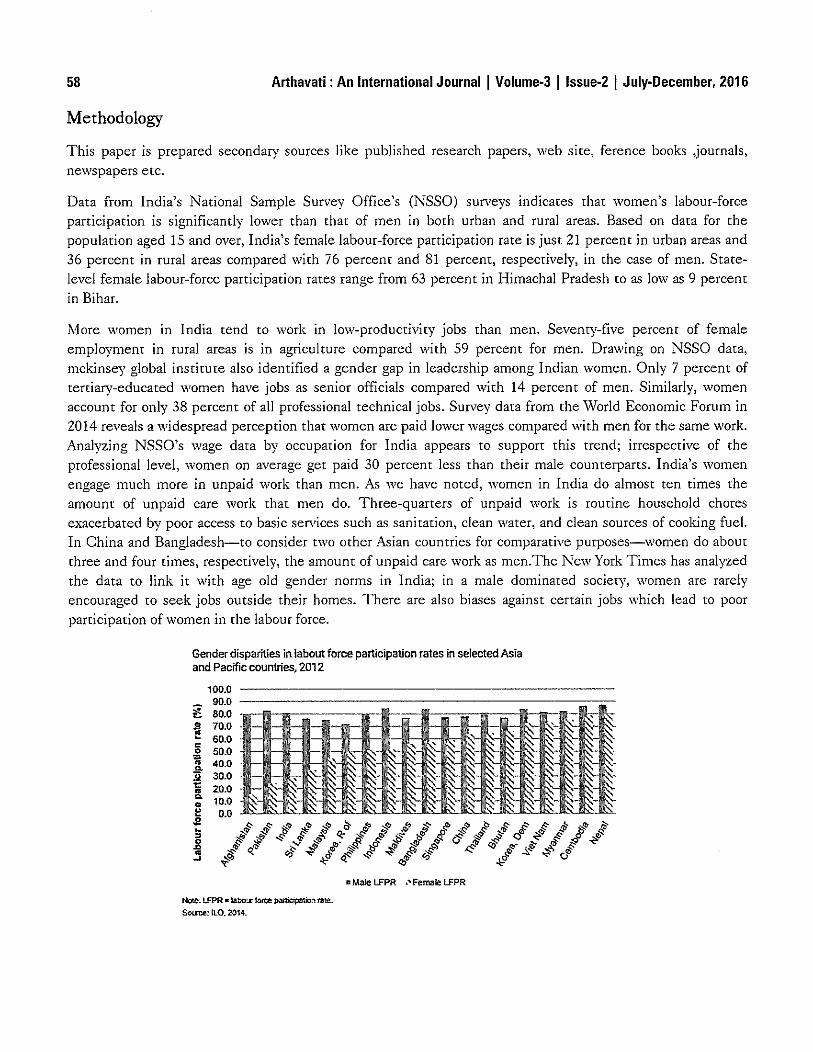
58
Methodology
Arthavati : An International Journal I Volume-3 I Issue-2 I July-December, 2016
This paper is prepared secondary sources like published research papers, web sire, ference books ,journals,newspapers etc.
Data from India's National Sample Survey Office's (NSSO) surveys indicates that women's labour-forceparticipation is significantly lower than that of men in both urban and rural areas. Based on data for thepopulation aged 15 and over, India's female labour-force participation rate is just 21 percent in urban areas and36 percent in rural areas compated with 76 percent and 81 percent, respectively, in the case of men. Statelevel female labour-force participation rates range from 63 percent in Himachal Pradesh to as low as 9 percentin Bihar.
More women In India tend to work in low-productivity jobs than men. Sevenry-five percent of femaleemployment in rural areas is in agriculture compared with 59 percent for men. Dtawing on NSSO data,mckinsey global institute also identified a gender gap in leadership among Indian women. Only 7 percent oftertiary-educated women have jobs as senior officials compared with 14 percent of men. Similarly, womenaccount for only 38 percent of all professional technical jobs. Survey data from the World Economic Forum in2014 reveals a widespread perception that women are paid lower wages compared with men for the same work.Analyzing NSSO's wage data by occupation for India appears to support this trend; irrespective of theprofessional level, women on average get paid 30 percent less than their male countetparts. India's womenengage much more in unpaid wotk than men. As we have noted, women in India do almost ten times theamount of unpaid care work that men do. Three-quarters of unpaid work is routine household choresexacerbated by poor access to basic services such as sanitation, clean water, and clean sources of cooking fuel.In China and Bangladesh-to consider two other Asian countries for comparative purposes-women do aboutthree and four times, respectively, the amount of unpaid care work as men.The New York Times has analyzedthe data to link it with age old gender norms in India; in a male dominated society, women are rarelyencouraged to seek jobs outside their homes. There are also biases against certain jobs which lead to poorparticipation of women in the labour force.
Gender disparities in labout force participation rates in selected Asiaand Pacific countries, 2012
D Male LFPR .... Female LFPR
Note: LfPR • IabO'.r foo;:e PMtidPation tale.
Sou'c6: IlO, 2014.
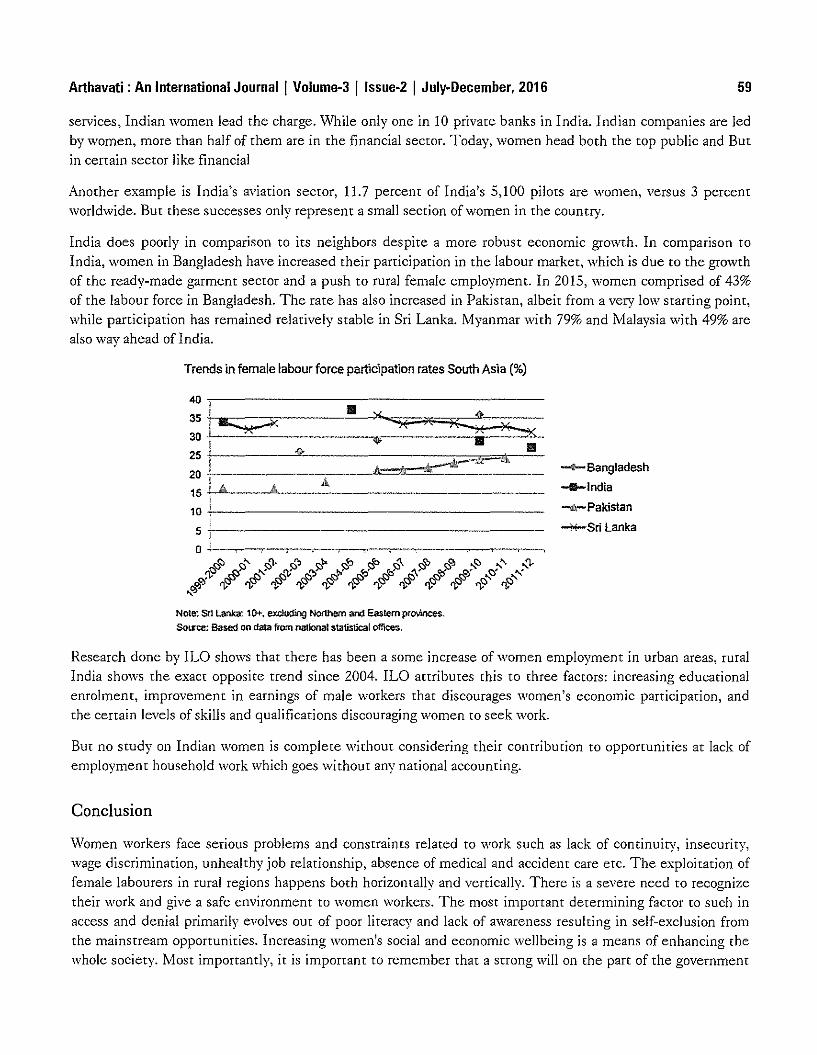
Arthavati : An International Journal I Volume-3 I Issue-2 I July-December, 2016 59
services, Indian women lead the chatge. While only one in 10 ptivate banks in India. Indian companies ate ledby women, mOte than half of them ate in the financial sectot. Today, women head both the top public and Butin certain sectot like financial
Anothet example is India's aviation sectot, 11.7 petcent of India's 5,100 pilots ate women, vetsus 3 petcentworldwide. But these successes only represent a small section of women in the country.
India does poorly in comparison to irs neighbors despite a more robust economic growth. In comparison toIndia, women in Bangladesh have increased their participation in the labour market, which is due to the growthof the ready-made garment sector and a push to rural female employment. In 2015, women comprised of 43%of the labour force in Bangladesh. The rare has also increased in Pakistan, albeit from a very low starting point,while participation has remained relatively stable in Sri Lanka. Myanmar with 79% and Malaysia with 49% arealso way ahead of India.
Trends in female labour force participation rates South Asia (%)
40 '1----------------III
330
5 ',II k-., ->C ><>...... '~"'.--• ~C~ x '+:':jjj }~
25 1 .. '" III
20_,I .-;-__Ii:==*:~h;::-=~·__ili__"'_4. 4; m.
15 I '" 4 • _!
10 +'----------------------!
--Bangladesh__India
......Pakistan
........SriLanka
Research done by ILO shows that there has been a some increase of women employment in urban areas, ruralIndia shows the exact opposite trend since 2004. ILO attributes this to three factors: increasing educationalenrolment, improvement in earnings of male workers that discourages woolen's economic participation, andthe cettain levels of skills and qualifications discouraging women to seek work.
But no study on Indian women is complete without considering theit contribution to opportunities at lack ofemployment household work which goes without any national accounting.
Conclusion
'Vomen workers face setious problems and constraints related to work such as lack of continuity, insecurity,wage discrimination, unhealthy job relationship, absence of medical and accident cate etc. The exploitation offemale labourers in rural regions happens both horizontally and vertican\'. There is a severe need to recognizetheir work and give a safe environment to women workers. The most important determining factor to such inaccess and denial primarily evolves out of poor literacy and lack of awareness resulting in self-exclusion fromthe o1ainstream opportunities. Increasing women's social and econoo1ic ,veIlbeing is a means of enhancing thewhole society. Most importantly, it is important to remember that a strong will on the part of the government
60 Arthavati : An International Journal I Volume·3 I Issue·2 I July-December, 2016
and the society as a whole to give proper place, respect, and rights to its women. \Vomen are the reflex ion ofsociety and its progress. If India needs to be a developed nation, it has to take care of the rights and provide anenvitonment to live life with dignity to its 'Nomen. Our women entrepreneurs, social welfare workers,scientists, politicians and economists are leading the way for a brighter future. 'Women in urban and rural areasshould be given access to good opportunities so that they can bring about positive social change and contributeto the growth of the countty.
References
• Renukarya C.K. \\Tomen's Comribmion to India's Economic and Social Deveiopmenr,(Edired by VS.Mahajan, Deep and Deeppublications, New Delhi 1991 )pp.391-392.
• Srarisrical Profile of\Vornen Labour 2012-13, Labour Bureau, Ministry of Labour & Employment, Government of India.
• E-book versions of selected MGI repons are available at MGI's website.
• The power of parity: how advance women's equality can add $12 trillion (0 global growrh,septembertZ015,mckinsey globalinstitute
• This is what justice looks like,swami Vivekananda quote on women .rajesh.p
• Repon on employment and unemployment survey(ocr 2010) ministry of labour and labour employment bureau.
DOD
Empirical Study on DemonetizationMs. Arpita Pandey'
Gyan Prakasht
Introduction
On 8'h November 2016, an astonishing decision came from the Government ofIndia. At 20:15 hours (1ST), rhePrime Minister Narendra Modi declared that our country is going to see demonetization of currency worthRs.500 and Rs.l 000. The government ccascd the usage of these bank.tlOtes of the Mahatma Gandhi series as aform of legal tender in India from 9,h November 2016. The Prime Minister announced the issuance of newRs.500 and Rs.2000 banknotes in the exchange of old currency.
Demonetization is the act of ceasing the specified currency from economy as legal tender of money. It is aprocess of eliminating currency from general usage and circulation in country. It is important in the case ofinjection of new currency in market.
Was Demonetization Necessary?
This step of government was aimed towards eliminating the black money from circulation of economy,reducing corruption, drug menace and smuggling. It is hypothetically accepted that excess currency is from theparallel economy and increasing the terrorist activities, corruption and hindering economic growth. In additionthere is a lot of fake currency in economy. This parallel currency is affecting the inflation rate adversely andperforce Reserve Bank of India to collateralized excess gold in reserve. Moreover, it was said that parallelcurrency harnessing people's faith in government and RBI for money they carry.
Impacts of Demonetization
Effect on demand:- This sudden announcement caused shortage of cash for the next 1 month which reducedthe demand as people were cash-less. It affected demand of consumer goods, gold and luxury goods, real estateand property and automobiles.
Effect on Prices:- It adversely affected the sales, as demand was reduced thus for short period price fall wasexperienced.
Effect on banking sector:- It increased the deposits in banks because money with people is exchanged ordeposited in accounts. It increases the liquidity in banks which is going to be channelled in economy throughmore lending. Thus, velocity of money creation might be greater in furure.
Effect on E-commerce:- Since people were cash-less until they got new currency, this decision made theblossoming situation for online market, and wallets. The frequency of online trading increased during themonth of November & December. E- wallets came as the handy option for payments.
M.A. Stude/lt ofSchool ofEco/lomics, De"i Ahi/.1'a U/lif}crsit)', I/ldore.Professor, School ofECOI101Ilics, DePi Ahilya U/li"ersip)', I11dore.
62 Arthavati : An International Journal I Volume-3 I Issue-2 I July-December, 2016
Effect on GDP:- It created unavoidable disruption throughout the economy, affected all economic activitiesand reduction in economic output. It is found that Gross Domestic Product for this year would be less thanprevious year. Since the money re-entered in market is not equivalent with previous level and caused demandreduction which eventually reduced the market size.
Effect on Economic Entities:- The share market (BSE & Nifty 50 indices) showed the 6 percent fall on thenext day of announcement. There were lengthy queues of people in front of bank offices till next month ofannouncement.
Effect on Black money:- Since the black money holders had not declared their income by the month ofSeptember 2016, this move forced them ro take out their cash holding as it would be invalid afterwards. Hencethat income got declared duting this time. Moreover, this move discouraged corruption motives of people.
Lacunae of Move
Initially this move was supported from several bankers and international speakers. But it was highly criticizedby the economists, members of opposition parties. The issuance of Rs. 2000 note might result in increment ofcorruption, it is always seen that economists believe that currency should flow in small denomination as itsimpact on inflation will be lesser compared ro high denomination currency. Several economists criticized thismove because it slowed down the GDP growth and discouraged the business motives. People's faith incurrency/ cash is reduced.
This move was poorly planned, badly executed and unfair for all. The incidence of prior leakage of informationro some corporate and few members of parry came in the news. It rriggered the protests, strikes, litigationagainst the government. Several deaths are linked with this incident due ro the rush ro exchange cash. The
. ATMs were not properly supportive for the new banknotes as they are small in size compared to old currency.
Demonetization Before 2016
This sort of event (demonetization) was not new concept for Indian economy. Such decisions were taken bydifferent government in different time period. In Jan. 1946, banknotes of worth Rs. 1000 and Rs. 10,000 werewithdrawn from circulation and new notes of Rs. 1000, Rs.5000 and Rs.10, 000 entered the market in 1954. In1946, the pre-independence government aim was to combat black money and penalize those Indian businessesthat were supplying allies in World War II.
Again in 1978, the Janata Parry coalition government had withdrawn 1000, 5000 and 10,000 rupee notes fromeconomy and aimed to curb counterfeit money and black money.
In 2012, the Central Board of Direct Taxes had suggested that demonetization would not be good measure totackle black money problem. According to data from income tax probes, only 6% or less of total wealth is incash form with black money holders. Thus, targeting that cash - at the cost of economy disturbance, would notbe successful strategy.
Demonetization in Other Countries
Demonetization of currency is global concept. Many countries had used this move for various purposes. Earlierthis concept was used as coinage act, in which countries' replaced usage of coins from paper currency (or from
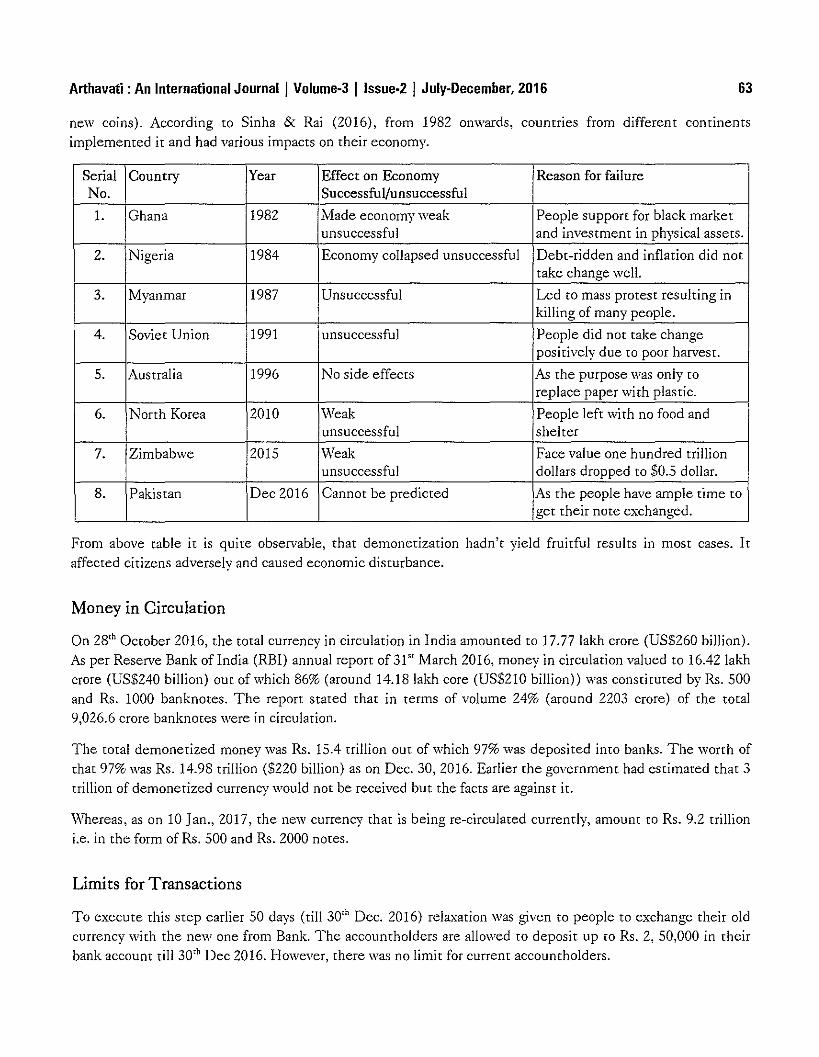
Arthavati : An International Journal I Volume-3 Ilssue·2 I July-December, 2016 63
new coins). According to Sinha & Rai (2016), from 1982 onwards, countries from different continentsimplemented it and had various impacts on their economy.
Serial Country Year Effect on Economy Reason for failureNo. SuccessfuVunsuccessful
l. Ghana 1982 Made economy weak People support for black marketunsuccessful and investment in physical assets.
2. Nigeria 1984 Economy collapsed unsuccessful Debt-ridden and inflation did nottake change well.
3. Myanmar 1987 Unsuccessful Led to mass protest resulting inkilling of many people.
4. Soviet Union 1991 unsuccessful People did not take changepositively due to poor harvest.
5. Australia 1996 No side effects As the purpose was only toreplace paper wi th plastic.
6. North Korea 2010 Weak People left wi th no food andunsuccessful shelter
7. Zimbabwe 2015 Weak Face value one hundred trillionunsuccessful dollars dropped to $0.5 dollar.
8. Pakistan Dec 2016 Cannot be predicted As the people have ample time toget their note exchanged.
From above table it is quite observable, that demonetization hadn't yield fruitful results in most cases. Itaffected citizens adversely and caused economic disturbance.
Money in Circulation
On 28'h October 2016, the total currency in circulation in India amounted to 17.77 lakh crore (US$260 billion).As per Reserve Bank oflndia (RBI) annual report of 31" March 2016, money in circulation valued to 16.42 lakhcrore (US$240 billion) out of which 86% (around 14.18 lakh core (US$210 billion» was constituted by Rs. 500and Rs. 1000 banknotes. The report stated that in terms of volume 24% (around 2203 crore) of the total9,026.6 crore banknotes were in circulation.
The total demonetized money was Rs. 15.4 trillion out of which 97% was deposited into banks. The worth ofthat 97% was Rs. 14.98 trillion ($220 billion) as on Dec. 30, 2016. Earlier the government had estimated that 3trillion of demonetized currency would not be received but the facts are against it.
Whereas, as on 10 Jan., 2017, the new currency that is being re-circulated currently, amount to Rs. 9.2 trillioni.e. in the form of Rs. 500 and Rs. 2000 notes.
Limits for Transactions
To execute this step earlier 50 days (till 30'h Dec. 2016) relaxation was given to people to exchange their oldcurrency with the new one from Bank. The accountholders are allowed to deposit up to Rs. 2, 50,000 in theirbank account ti1l30'h Dec 2016. However, there was no limit for current accountholders.
64 Arthavati : An International Journal I Volume-3 I Issue-2 I July-December, 2016
These limits changed several times over the days.
1. For exchange
• From 8'h to 13'h Nov., Rs. 2000 per person.
• From 14'h to 17'h Nov., Rs. 4500 per person.
• From 18'h Nov., limit reduced to Rs. 2000 per person.
• From 25'h Nov., all exchange was stopped (only deposit was allowed).
2. For withdraw
• Cash withdrawals from account restricted to Rs. 10,000 per day and Rs. 20, 000 per week from 10'h to13'h Nov.
• This limit increased to Rs. 24, 000 per week from 14 Nov.
• A daily limit fromATMs was Rs. 2000 per day tilll4'h Nov. and Rs. 2500 per day till 31 Dec.
• From I Jan., 2017, the limit increased to Rs. 4500 per day and again to Rs. 10,000 from Jan. 16, 2017.
This step of regulating cash usage was aimed to encourage people to use cashless transactions and promotebanking digitalization.
Current Limits
The banks are charging Rs.150+ service tax for every cash withdrawals from branches after three to fourtransactions (differ from bank to bank, such as HDFC- 3 transactions, Axis Bank- 4 transactions.) However,State Bank ofIndia is charging Rs. 50+ service tax after two cash withdrawals from branches.
Similarly, limits are defined for the cash deposits as well. The charges depend on the amount of deposit andno. of cash deposi t from saving or salary account. In general, three cash deposi tS are free from any charges.
The restrictions are pur on the internet banking! electronic payments as well. Such as, SBI allows only 40 freeinternet transaction using a debit card in a month.
These limits are hampering consumption capabilities of people and thus reducing effective demand In
economy.
Review of Literature
Prof. Kaur S. (2016) has concluded that, "This decision of govt. will definitely fetch results in the long rerm.From an equiry market perspective, this move would be positive for sectors like Banking and Infrastructure inthe medium to long term. This could be negative for sectors like Consumer Durables, Luxury items, Gems andJewellers, Real Estate and allied sectors."
Singh P. & Singh V. (2016) has concluded that, "experiences from different countries shows that the move wasone of the series that failed to fix a debt-burdened and inflation-ridden economy."
Arthavati : An International Journal I Volume-3 I Issue-2 I July-December, 2016 65
K. Veerakumar (2017) has concluded that, "Alternative payment methods, such as e-wallets, onlinetransactions using e-banking, debit and credit card usage have been increased and this will shift an efficientcashless infrastructure."
Mali V. (2016) concluded that, "Demonetization will have positive impact in controlling black money and fakemoney."
Sinha A. & Rai D. (2016), concluded that, "Without adequate and proper planning; the demonetization-drivencash crunch has rendered Indian economy paralyzed for short duration as the informal sector which comprisesof 40 percen t share in GDP has become unviable."
Jaitely A. (2016) said, "Demonetization would clean the complete economic system, increase the size ofeconomy and revenue base." He added with upcoming Goods and Services Tax (GST) "demonetization is anattempt to change the spending habit and lifestyle."
CARE Report (2016) commented that, "in spite of the initial hiccups and disruptions in the system,eventually this change will be well assimilated and will prove positive for the economy in the long run."
The Independent (2016) wrote, "Modi does a Lee Kuan Yew to stamp Out corruption in India. From makingup his mind to rolling it out, a new Lee Kuan Yew is born in India. It will be reflected in the legacy of thisPrime Minister."
Das S. (2016) said, "It is bold move. Counterfeit currencies are being used for financing terrorism. Our securirymeasures have not been breached. This is a powerful measure to combat terrorism. Fake currencies corrodeeconomy."
Kant A. (2016) said, "Bold, dynamic & brilliant move to end the black money menace. Beginning of thecashless, paperless economy in India."
Lekhi M. (2014) said, "The idea of demonetization is unexplainable as to why this has happened.... Themeasure is strongly anti-poor.
Jain N. (2016) said, "It is very powerful measure to curb black money. It will have deflationary impact In
general and more specifically on real estate prices and makes homes affordable and is indirectly a boon to
honesr tax payers."
Kochhar C. (2016) said, "It is perhaps the most significant move ever taken to curtail the parallel economy.This move will give a sharp boost to all formal channels of payment which will help formal economy to grow."
Parnaik Dr. P (2016), said, "the move as 'witless' and 'anti-people' , it would have little effect in eliminatingblack money, while causing much hardship to common people."
Objective
1. To ascertain the requisition of demonetization in India.
2. To study the effect of demonetizarion on consumable goods' sales.
3. To generalize what other problems faced by consumers, sellers.
4. To find suitabiliry of cashless mode in current scenario.
66
Research Methodology
Arthavati : An International Journal I Volume-3 Ilssue-2 I July-December, 2016
The srudy was conducted in Southern parts of Indore City. This srudy is based on primary informationcollected by survey from the southern part of the ci ty, 100 grocery shopkeeper and vegerables vendors wereselected by convenient sampling method. To assess the impact of demonetization of worth Rs. 500, Rs. 1000nores on people, and 200 people were selected by convenient sampling method. 10 Bankers' views were alsorecorded to understand their opinion on this monetary step and cashless convenience.
Empirics
As per reported facts, the following inferences have been derived:-
Shopkeepers and Vendors
1. 43% sellers reported their sales fall to half and more for next 1 month due to cash-less customers.
2. But 27% sellers benefitted by this policy as they were able to accept old currency and circulate it inmarket through cash payment channel.
3. 70% and above sellers are satisfied with savings and withdrawals limit and out of the total respondents40% of sellers started immediately to accept payments through cards, online wallets.
4. But out of them 20% stopped using cashless payment because of increment in surcharge, 10% sellersbecause of customer's reluctance for cashless payment.
5. 60% sellers find Rs.2000 notes inconvenient for daily business and cause for loss of 20-40% daily sales.
6. Only 28% sellers find cashless convenient and easy to use whereas, 43% do not.
7. 43% of them support cashless system and hope from government and bankers guidance for use of it.
8. Only 28% of them were satisfied with this step and its execution.
9. 95% sellers do employees' payment through cash as it is easy mode and their employees are not aware ofcashless.
Consumers
1. 45% respondents opted for using government agencies and hospitals for currency exchange.
2. 30% people need to borrow money from others as they were cash-less for next 3 days to fulfil their basicneeds.
3. Only 40% respondents were satisfied with savings limits.
4. 72% respondents found withdrawal limit was not enough, as it made them money- less after saving foremergency.
5. Most of the respondents find Rs.2000 currency inconvenient for daily transactions.
6. It is observed that there is no change in behaviour of 15% consumers cashless usage, their monthlycashless transactions is similar to previous.
7. 10% respondents are still not using cashless method for payment as they are unaware of usage and don'tfind it secure.
8. 5% people reduced their cashless transactions after decision because of higher charges.
Arthavati : An International Journal I Volume·3 I Issue·2 I July-December, 2016 67
9. 5% people started using cashless payment opinion after this decision but their monthly transactionranges from 2-5.
10. 40% respondents' cashless transactions increased by twice.
11. 77% respondents find cashless to be secure method for payment as it enables them to have proof ofpayment.
12. Only 55% people find cashless convenient.
13. 66% people are unaware of surcharge amoun t imposed on every bill.
14. Only 54% household are in support of cashless economy in current scenario.
15. Only 28% household, were happy with demonetization.
16. Overall, 66% consumers were not satisfied with its sudden cxccution.
17. It is observed that 18% respondents who don't find cashless secure and convenient and are unaware ofsurcharge or virtual money concept but still support cashless system. It might be because of politicalparty influence and people expectations that government efforts are for country's betterment.
Bankers
1. 67% bankers find demonetization policy as a good step.
2. 50% bankers are not satisfied with its execution
3. This policy increased on floor customers three times within couple of days for next 1 month.
4. 50% banks were not ready to entertain such crowd and didn't have enough work-force.
5. Moreover, 50% banks were suffered from insufficient cash supply and technological inefficiency delayedthe procedure.
6. 83% banks do not agree with government approach to adopt such frequent decisions which createdconfusion.
7. 90% bankers support cashless system for India and have provision to train customers regarding it, butonly half of them provide timely guidance when asked by customers.
8. On average, 30% deposit increment is observed.
9. It caused 20% increment of demand for cashless payment modes by customers on average.
10. It is observed that bankers are not ready to share information related to percentage of surcharge.
11. Conclusion and Policy Implications
o Seller's expectations are to make them aware of technology and reduce charges, as this would onlyencourage cashless business motive in market.
• It could be possible that government made some effort to provide training during holidays orthrough campaigns of using electronic cards, internet banking. It would make people tech-savvyand bring awareness about positivity and security related issues of cashless system.
o Since Rs. 2000 note is not appreciated by most of respondents, either smaller denominationcurrency should be issued in market or share of existing smaller denomination should be increasedovertime. Thus, general and informal market would be less affected in long run.
o Increased charges on electronic/cash transactions are discouraging to reducing demand ineconomy. It is also not accompanying with government other schemes, such as Digitalizatiol1. Thecharges should be reduced, so more effective demand would lead to better economic growth.
68 Arthavati : An International Journal I Volume-3 I Issue-2 I July-December, 2016
The sudden announcement of demonetization led to cash-crunched siruation which majorly affected theinformal sector. Even the motives behind the move were good, but inadequate planning and mismanagedexecution created the chaos within people and made loopholes for culprits. The siruation got worse because offrequent decision change regarding limits and usage of online payments mode. It is obvious that GDP wiIl beaffected by this move and growth rate would face speed breaker because of demonetization. The experiencesof other countries are making us cold feet to speculate success of policy.
In spite of all it is highly expected that this rigid decision would yield better results in long run and reducecorruption from country which is the major reason.. The country is looking forward of utilizing accumulatedexcess funds in social welfare schemes and bringing equality among the people.
References
• Prof. Kaur S. (2016), Demonetization and It:s Impacts in India, International Journal of Research, Vol. 3, Issue 17 November.
• Sinha Dr. Ambalika & Divya Rai (2016), Aftermath of Demonetization on Rural Popularion, International Journal of Research inEconomics and Social Sciences, Vo1.6, Issue 11 November. Pp- 223-228.
• Vedashree Mali (2016), Demonetization: A step towards modified India, International Journal of Commerce and ManagementResearch, Vo1.2, Issue 12, December, pp-35-36.
• K. Veerakumar (2017), "A Study on People Impact on Demonerizarion", Imernarional Journal of Imerdisciplinary Research inArtS and Humanities, Volume 2, Issue 1, pp- 9-12.
• CARE Ratings RepoH (2016), Economic consequences of demonetization of 500 and 1000 Rupee Notes, 9 November.
• Singh Dr. P & Virendra Singh (2016), International Journal of Science Technology and Management, Vol. 5, Issue 12,December.
• The Hindusran Times, Jan.2014
• The Hindu, 9th Nov. 2014
• Daily News and Analysis, 10th Nov. 2016
• The Independent, Singapore-based paper 10th Nov. 2016
DDD
Impact of Forest on Economic Condition of Tribal People(With Special Reference to Udaipur District)
Prof. Suman Pamecha'Mr. Mohnish Rathoret
Abstract
It is a well known fact that tribal people lives in hilly rural areas where employment opportunIties are inscanty. People are doing agriculture on the hills without the use of modern agricultural inputs. They have noalternate livelihood besides agriculture. But due to decreasing returns in agriculture, it cannot ptovidesufficient income to the people to sustain a good living standard.
In these hilly areas, literacy is not well spread which caused low awareness about the governments schemes ofsocio-economic development. People cannot take full benefits of the schemes therefore, their economiccondition remains bad. Due to the lack of agricultural diversification, people migrate in other areas in search oflivelihood. \Vomen do all the works of household so the health of women and children's are very poor.
Present study is an attempt to find Out the impact of forest on economic condition of tribal people.
Introduction
It is a well known fact that tribal people lives in hilly rural areas where employment opportunItIes are inscanty. People are doing agriculture on the hills without the use of modern agricultural inputs. They have noalternate livelihood besides agriculture. But due to decreasing returns in agriculture, it cannot providesufficient income to the people to sustain a good living standard.
In these hilly areas, literacy is not well spread which caused low awareness about the governments schemes ofsocio-economic development. People cannot take full benefits of the schemes therefore, their economiccondition remains bad. Due to the lack of agricultural diversification, people migrate in other areas in search oflivelihood. \Vomen do all the works of household so the health of women and children's are very poor.
It is a well known fact that tribal people lives in the hilly areas which is endowed with the forests. Theseforests have different kinds of trees, flowers, fruits, medicines and many wild birds and animals. Tribal peoplelive in these forests and their economy depends on the forests. Forest provides different forest products likehoney, wood, medicines, flowers, etc. Tribal people collect these forest products and earn revenue. If thegovernment efforts diverted towards the strengthening of these tribal people then their income can be raised.
Present study is an attempt to find out the impact of forest on economic condition of tribal people.
, Principal, MY Sh1Ylmjeevi College, JRfllRVU, UdaipurResearch Scholar, Dept. ofEconomics, JRNRVU, Udaipur
70
Review of Literature
Arthavati : An International Journal I Volume-3 I Issue-2 I July-December, 2016
Present research has been supported by various studies conducted by Prem ChoudharyW, Fernadis(2}, Bairagi"l,Gayakwad{4l and many more. Findings of these studies shows that tribal society solely depends on the forestsas there is no alternate SOurce of livelihood in the hilly areas where agriculture is the only source ofemployment. There is a need to defend the ownership on the forest resources. If we preserve the forest andtribal then their culture can also be preserved as forest and tribal are the two sides of a coin. There is a need topreserve the forests as if the forests are destroyed in the same speed than the existence of tribal also affected.Forests save the soil and conserve it. The sentiments of tribal are related with the forests therefore, there is anurgent need to preserve the forests.
Objectives of the Study
Main objective of the study is as follows:
1. To find out the impact offorest on the economic condition of tribal people.
2. To find out the determinants of economic condition of tribal people.
Research Methodology
Following research methodology has been adopted in the study:
(i) Selection ofthe study area
Rajasthan is a state of unequal physiographic and weather. About 2/3 part of the state is desert where rain isscanty. There is a great problem of livelihood among the people and they migrate in search of employment.State is divided into seven divisions namely Udaipur, Jaipur, Bhatatpur, Kota, Ajmet, Jodhpur and Bikaner.Present study considers Udaipur division into account. There are six districts in Udaipur division, namelyUdaipur, Dungarpur, Banswara, Ptatapgarh, Chittorgarh and Rajsamand. We have taken Udaipur purposivelyfor the study. A large part of the population of Udaipur is tribal and it accounts for the highest forest area inthe state therefore, we have selected Udaipur District for the study.
(ii) Sample design
There are 11 Panchayat Samiti in Udaipur district, out of these we have selected 2 Panchayat Samiti randomly.These are Gogunda and Sarada. Out of these twO Panchayat Samiti's, we have selected five villages from eachPanchayat Samiti and from each selected village ten respondents were selected randomly. Thus the samplesize consists of 100 beneficiaries who were taking benefit from forests.
(iii) Use of statistical tools in the study
Present study is based on the primary data collected through a pre- structured schedule which is filled by theresearcher himself. Various statistical tools have been used in the study like average, percentage, correlation,regressIOn, etc.
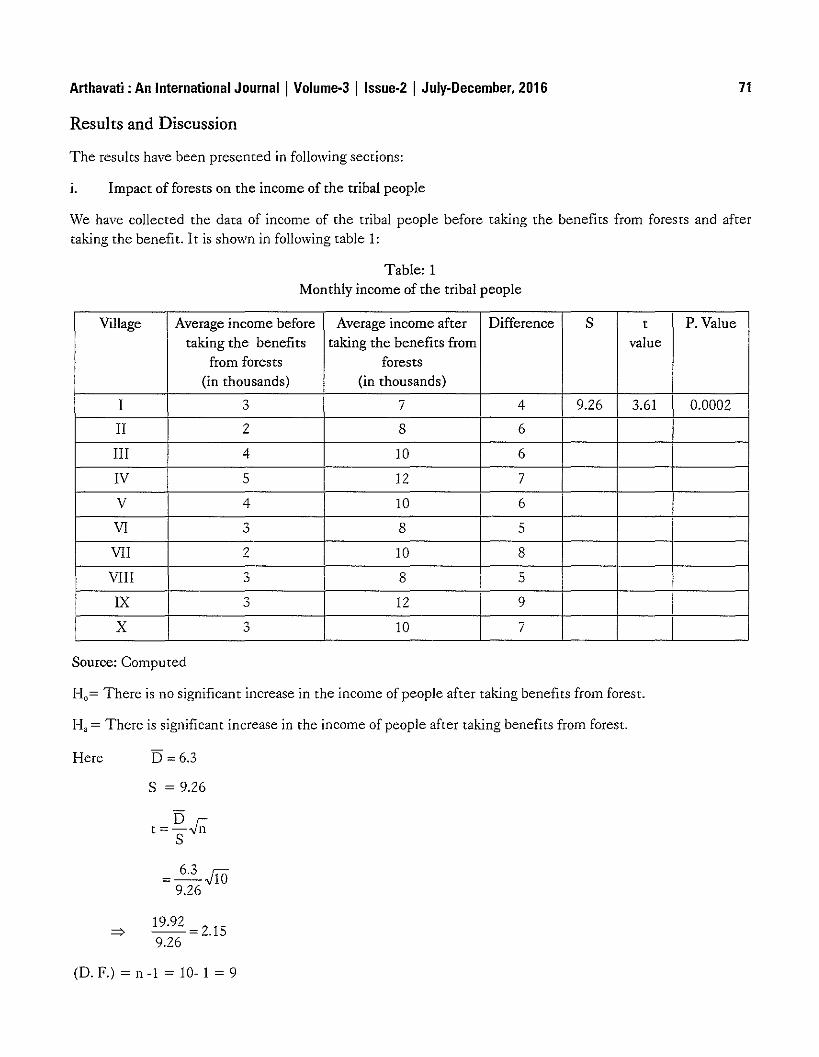
Arthavati : An International Journal I Volume-3 I Issue-2 I July-December, 2016
Results and Discussion
The results have been presented in following sections:
1. Impact of forests on the income of the tribal people
71
\¥e have collected the data of income of the tribal people before taking the benefits from forests and aftertaking the benefi t. It is shown in following table 1:
Table: 1Monthly income of the tribal people
Village Average income before Average income after Difference S t P. Valuetaking the benefits taking the benefits from value
from forests forests(in thousands) (in thousands)
I 3 7 4 9.26 3.61 0.0002
II 2 8 6
III 4 10 6
IV 5 12 7
V 4 10 6
VI " 8 5.)
VII I 2 10 8
VIII 3 8 ::>
IX 3 12 9
X " 10 7.)
Source: Computed
Ho= There is no significant increase in the income of people after taking benefits from forest.
H, = There is significant increase in the income of people after taking benefits from forest.
Here D = 6.3
S = 9.26
t=D.,JrrS
= 6.3 .flO9.26
(D. F.) = n -I = 10- 1 = 9
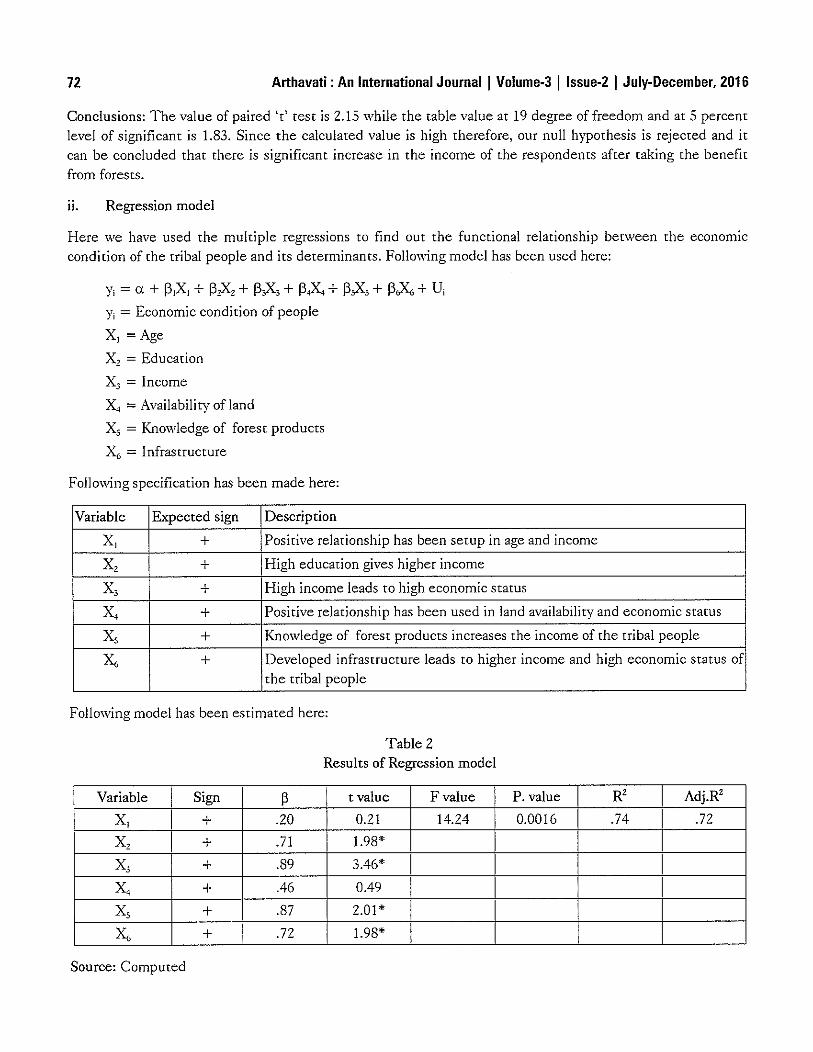
72 Arthavati : An International Journal I Volume-3 Ilssue-2 I Julv-December, 2016
Conclusions: The value of paired 't' test is 2.15 while the table value at 19 degree of freedom and at 5 percentlevel of significant is 1.83. Since the calculated value is high therefore, our null hypothesis is rejected and itcan be concluded that there is significant increase in the income of the respondents after taking the benefitfrom forests.
n. Regression model
Here we have used the multiple regressions to find Out the functional relationship between the economiccondition of the tribal people and its determinants. Following model has been used here:
y, = a + I3,X, + I3,X, + 13,x, + 134x' + I3,X, + l3oX. + U,y, = Economic condition of people
X, = Age
X, = Education
X3 = Income
X, = Availability of land
X, = Knowledge of forest products
x" = Infrastructure
Following specification has been made here:
Variable Expected sign Description
X, + Positive relationship has been setup in age and income
X, + High education gives higher income
X, + High income leads to high economic status
X, + Positive relationship has been used in land availability and economic status
X, + Knowledge of forest products increases the income of the tribal people
x" + Developed infrastructure leads to higher income and high economic status ofthe tribal people
Following model has been estimated hete:
Table 2Results of Regression model
Variable Sign I 13 t value Fvalue P. value RZ Adj.R'
X, + .20 0.21 14.24 0.0016 .74 .72
X, + .71 1.98*
X, + .89 3.46* IX, + .46 0.49 I IX· I + .87 2.01 * I,
x" + .72 1.98*
Source: Computed
Arthavati : An International Journal I Volume-3 I Issue-2 I July-December, 2016 73
Our regression model is found to be best fitted as the value of R' and adj. R' IS quite high. 74 percentvariations of economic conditions of the tribal people can be explained by the explanatory variables. F(variance ratio) is also quite high which shows that model is best fitted. Same results can be obtained by P.value which is less than the level of significance (0.05). It shows that explanatory variables are significantlyaffecting the economic conditions of tribal people.
Suggestions
1. The people should be aware about the government policies and schemes which will ultimately enhancetheir socio-economic condition.
2. There is a need to acquainr the people about the forest and its products which yield a high income. Ifpeople engaged in these activities than their quality of life will enrich.
3. Government should provide the collection centers for the forest products; it ensures the fair prices tothem.
4. There is a lack of infrastructural facilities in the rural tribal areas. So there is a need of spreading thesefacilities in these areas which will ultimately upgrade the economic condition of tribal people.
References
1. Prem choudhary, "Forest dependem male females right and gender approach in India" Journals of arts, commerce and science,
2012
2. Fernandis, "Development plans for tribals" School of Geography University ofNorringham. 2013
3. Bairagi, "Inequalities between tribes" TRIBE,Vol. 33 2009.
4. pandey,BahuJ, "Right oftribals on forest" Journals of Bihar research society, Vol. 39 N. 2 2011
5. Gakayad,Ansh"Role pfrribes in forest products" Print wall publisher, Jaipur 2011.
6. Abrudan I. 2007, Cross-sectOrial Linkages between Forestry and other sectors in Romania, in:Crosssecroral PolicyDevelopments in Forestry, CAB! Publ.ISBN :978-1-84593-250-3, pp.183-190.
7. Albu, A.N. et al. 2010, Influence of Forest Curtains on Crops in South Dobrogea, Research Journal of Agricultural Science, 42(3),5p.
8. Bouriaud L., Schmithusen F. 2005, i\lIocation of Property Rights on Forests through Ownership Reform and Forest Policies inCentral and Eastern European Countries, Schweiz. Z. Forstwes. 156.8.,10 p.
9. Bouriaud Laura 2007, Property rights Characteristics Relevant for Innovation and Enterprise Development in Small-scaleForestry, Small-scale Forestry 6, pp. 359- 372.
10. Dorondel fl. 2008 ,They should be killed": Forest restitution, ethnic groups and patronage in postsocialist Romania, in: Therights and wrongs of land restitution, New York, Routledge-Cavandish ISBN 0- 203-89549-5, pp.43-67.(www.books.google.com) .
II. Dragoi M. et al. 2011, Improving communication among stakeholders through ex POSt transactional analysis-case study onRomanian forestry, Forest Policy and Economics 13, pp. 16-23.
12. Elands Brigit, \Viersum KF. Z003, Forestry and rural development in Europe:research results and policy implications of aComparative European StudY,Forest and Nature Conservation Policy Group, \Vageningen University, \Vageningen, theNetherlands, ISSN 1569-1314, 179 p.
13. Elands Brigit, Praestholm S. Z008, Landowners" perspective on the rural future and role of the forests across Europe, Journal ofRural Studies 24, pp72-85.
14. European Council 2006, Council Decision on Community strategic guidelines for rural development (programming period 20072013) (2006/144/EC), 13p.
74 Arthavati : An International Journal I Volume-3 I Issue-2 I July-December, 2016
15. F.C.H.A.S. Z005, ForeS'[ Secro[ Entrepreneurship in Europe: Country Swdies (Romania), Vol 2, Acta Silvarica & LignariaHungarica - An International Journal in Forest, Vlood and Environmental Sciences, Special Edition, COSt £30- EconomicIntegration of Urban Consumer"s Demand and rural Forestry Production, HU ISSN 17 691X, pp. 643-695.
16. Gomez-Zammalloa G. et aJ. 2011, 15 years of Forest Ccnification in the European Union. Are we doing things right? ForestSystems 20 (1), 81-94, eISSN: 2171-9845. (www.inia.es\foresrsystems)
17. Harrison S. er.al. 2002, Non-indusuial, Smallholder, Small-scale and Family Forestry: \X,'har"s in a Name?, Small-scale ForestEconomics, Management and Policy, 1(1) pp. 1-11.
18. Htur Yin M. 2008, An analysis of collective action in forest plamation establishmem by Forest User Groups, TechnischeUniversitiit Dresden, Fakuliit fUr Forst, Geo und Hydrowissenschaften, Dissertation submitted for the degree of Doctor rerumSilvaticarum. 160 p.
19. Irimie D.L. 2006, Property Rights in Romanian Forest Policy- An imititional analysis in the comext of societal transformationPhD Thesis, Freiburg im Breisgau, ISBN 3-935638-92-2, ppssssssssssssssss.273-304.
DOD
Customer Satisfaction for E-Banking Service(With respect to Sagar City)
Dr. Akanksha Singhi'Ms. Rachana]ainf
Mr. Akshant Nagari'
Abstract
Financial liberalization and technology tevolution have allowed the developments of new and mote efficientdelivery and processing channels as well as mote innovative products and services in banking industry. Bankinginstitutions are facing competition not only from each other but also from non-bank financial intetmediaries aswell as from alternative sources of financing. Another strategic challenge facing banking insritutions tOday isthe growing and changing needs and expectations of consumers in tandem with incteased education levels andgrowing wealth. Consumets are becoming incteasingly discerning and have become mOte involved in theirfinancial decisions. For many consumets, electronic banking means 24-hour access to cash through anautomated teller machine (ATM) or Direct Deposit of pay cheques into savings accounts. But electronicbanking involves many different types of transactions. The custOmer is clear on one thing that he wants ebanking to be simple and the banking sectOr is matching its steps to the march of technology. Slowly butsteadily, the Indian customer is moving tOwards the internet banking.
Introduction
E-banking (Internet banking) means any user with a personal computer and a browser can get connected to hisbank's website to perform any of the virtual banking functions. The term electronic banking covers bothcomputer and telephone banking. In other words it is said that it is updated 'on-line, real time'. The system isupdated immediately after every transaction automatically. Today we are in the era of globalization.Multinational organizations worldwide have adopted localization as their first strategic choice. Advancement intechnology has facilitated globalization tOo. There has been a marked imptOvement particularly in the area ofmaintenance, storage, availability and transfer of data. The world has literally shrunk to become a "globalvillage". Banks have transformed themselves and are offering services through internet. From computerizationto networking to ATMs and now E-Banking, banks have moved up the value chain. Internet banking refers to
the use of internet as a remote delivery channel for banking services. The number of visits to the bank can beminimized effectively by operating from the internet account. Thus the number of contacts required to
perform a transaction and solve a problem has been reduced through online banking. The usual branches ofbanks have culminated into PC networks, whereby the consumer can draw all the benefits and services of thebank at a single click of the mouse. Once the branch offices of bank are interconnected through terrestrial orsatellite links, there would be nO physical identity for any branch. It would a borderless entitypermitting anytime, anywhere and anyhow banking. A cusromer can log on banks websire and access hisaccount.
Se1lior Lecturer, School ofEconomics, Devi Ahilya Uviversit)" hdore, MPResearch Scholar School ofEconomics, Devi Ahilya Uviversit)" Indore, MPResearch Scholar School ofEconomics, Devi Ahilya UviversifJ', Indore, MP
76 Arthavati : An International Journal I Volume-3 I Issue-2 I July-December, 2016
Technology is the key to move towards providing integrated banking services to respondents. Indian bankshave been late starter in the adoption of technology for auromation of processes and the integrated bankingservices. But with the global adoption of technology, Indian banking is also at the threshold of paradigm shiftdue to the latest changes. There are various factors which have played vital role in the Indian banking sectorfor adoption of this technology.
Firstly, the economic reforms introduced by the government almost fifteen years back which resulted inopening up of new vistas for banks ourside the world. Government relaxed rules and regulations, and simplifiedthe processes for the FII to make investment in the banking and various sectors. This resulted in inflow oflarge funds in the economy thereby improving the economy as a whole and banking sector in particular. Due tothis reason, banks need to provide such services, which satisfy the urge of foreign investors.
Secondly, as a part of reforms Indian banking was opened for private sector by which old and new private sectorcame into limelight. They gave a big boost to technology and created a platform to use it for backside andfront-side operations. VI'hen they started adopting it, this pur a tremendous pressure on the Nationalized andpublic sector banks. \¥jth the result of such healthy and competitive environment, overall banking systembecame more work prone, efficient and technological.
Thirdly, for the economic development of a country, infrastructure plays a vital role. In the last few years, withthe development of telecom sector, communication infrastructure, BPOs, the entire country became a singlehub of transmitting the information and the major cities got connected with one another, which helped in thereduction of total cost. This had directly helped banks.
Fourthly, Indian software industry has also impacted the Indian banking sector. To provide excellent servicesto the respondents, banks need to have web based portals, wide area network (\\TAN), local area network,internet, etc. and all these services are provided by the software industry to Indian banking at reasonableprices and at the right time.
Fifthly, most of the banks in public as well as private sector have technology thrust from RBI to adopt thechanges in order to improve the operational efficiencies, securiry measures, risk reduction and qualiry upgradation. Mter lib~ralizationRBI made several changes in the basic structure of banking sector and laid downnumerous guidelines on electronic banking, fund transfer, core banking solution, payment system, clearingservices, and internet banking. So, it becomes necessary for the banks to adapt sweeping changes intechnology.
Further, Indian Banking Association (IBA) has helped banks to create a forum to discuss various issues oncompurerization and automation of processes which further resolve the problem of adaptation.
Now banks can reach their respondents anywhere, anytime; and respondents are able to get instant access totheir accounts from any corner of the globe anytime. \\~th increasing competition the respondents are alsobecoming more demanding. To meet respondents' expectations banks will have to offer wide range of serviceslike ATM's, telephone banking, mobile banking etc. by upgrading their branches. The key to attract and retainthe respondents lies in efficient customer service including customized and value added products to meetvarious needs of individual respondents as well as to meet the diverse needs of respondents
Arthavati : An International Journal I Volume-3 I Issue-2 I July-December, 2016
Evolution of Technology in Indian Banking
The technological development in banking can be traced as follows:-
1960 - Mechanized banking introduced.1970 - Introduction of computer based banking industry.1980 - Introducrion of computer-linked communication based banking.
77
Advent of computer rechnology has created a major impact on working of banks. The computerization andsubsequent development in history of Indian banks can be traced back to 1966 when Indian BankersAssociation (IBA) along with exchange banks association signed first wage settlement with the unions, whichaccounted for the use of IBM or ICT accounting machines for inter-branch reconciliation etc. A committee oncomputerization and mechanization was appointed by RBI in 1983 under chairmanship of Dr. C. Rangrajanrecommended that computerization and installation of Advanced Ledger Posting Machines (ALPM) at branch,regional and head offices of banks will bring around a new era in banking. Narsimhan Committee in 1991 pavedway for reform phase in banking. Saraf Committee was constituted by RBI in 1994 that recommended the useof Electronic Fund Transfer System (EFT), introduction of electronic clearing services and extension ofMagnetic Ink Character Recognition (MICR) beyond metropolitan cities and branches.
The rate of adoption of IT by foreign and private sector bank in the country has been significant over the lastfive years, which can be attributed to fierce competition and the internet phenomena worldwide. The arrival ofprivate and multinational banks with their superior state of the art technology based services pushed theIndian banks to follow the suit by going in for the latest technologies to meet the threat of competitors andretain their customer base. "The last four years have seen dramatic changes, making respondents' conveniencecritical aspect of banking". Indian metros are surging ahead in online banking usage. Today the deliverychannel of banks include direct dial up connections, private networks, public networks etc. and the devicesinclude telephone, Personal Computers including Automated Teller Machines, etc.
Electronic Banking Products and Services
E-banking has provided immense opportunities in offering goods and servIces to the respondents. Theseproducts are torally changing the outlook of banking sector. Now the industry is shifting towards cashlesssociery, where physical cash, notes and coins have become a thing of the past, and digiral cash and electronicpurse have taken their place. There are many non-cash payment methods which are in use. These are asfollows:
• Automated Teller Machine
ATM is a cash rending teller machine. This is a machine which is frequently seen at banks and other locations,such as shopping centres and building socieries. Respondents can withdraw any sum up to a limited amount,can view the status of his account and order a new cheque book. There is a number called PersonalIdentification Number (PIN), which is a key for carrying the desired transactions. On the other hand, we cansay that it's a machine which replaces the human aspect of providing the cash and standing in a long queue.ATMs can be installed on the bank's premises (onsite ATMs) for which no license is required from RBI.However, for ATMs to be installed at public places (offsite ATMs), banks have to obtain a license. Theseoffsite ATMs are mainly installed at airports, railway stations, market places, petrol pumps, etc.
78 Arthavati : An International Journal I Volume-3 I Issue-2 I July-December, 2016
• Mobile Banking
The tradi tional brick and mortar is done from fixed branch premises, where the customer has to go personallyfor carrying out business transactions. Through mobile banking the customer can conduct a host of bankingtransactions and inquiries through the mobile. Mobile banking can also be carried rhrough a mobile van with orwithout computerized banking system. The mobile van moves from place to place on designated routes atdesignated hours and the respondents can transact their banking business, such as deposit, withdrawal, chequecollection draft issuance, pass book updates, etc. Mobile banking helps the customer to do his accountmanagement, electronically which was earlier possible through internet banking. Mobile banking service isdivided into twO categories:
(i) SMS Based: This service can be availed from any mobile having SMS based service. The customertypes the required keywords and PIN number and send the message to the predefined number.
(ii) Menu Based: The customer downloads and installs the application on the mobile. Whenever thecustomer wants any sorr of information, he selects the application, selects the request from menuand sends the request to the designated number. This request is internally sent as SMS text. Thecentral computer at bank sends back the result to him.
• Phone Banking
Phone banking or tele-banking refers to the authorized respondents to use special telephone number of thebank. This facility is available with the help of a voice response system (VRS). This system basically acceptsonly TONE dialled input and suitable voice response message/ information to the caller. Tele-banking is oftwo kinds:
(i) Public Enquiry: General information about banking services can be obtained by respondents andnon-respondents like dialling a special enquiry number of the bank (call centre) and desiredinformation can be obtained.
(ii) Private Enquiry: This relates to account specific information and can be accessed only byaccountholder by disclosing personal identification number (PIN) and customer 10.
• E-commerce's
Ccommerce refers as the transaction between the buyer and seller wi thout exchanging any papers or anymeeting between two persons and largely using the internet. Electronic commerce allows efficient transactionsamong respondents, suppliers and parrners for cutting the transaction time and reducing the costs of doingbusiness. The Ministry of Commerce is supporting "Electronic Commerce (EC) / Electronic Data Interchange(EDI) for Trade" project for facilitating international trade. The community partners of this project are varioustrade regulatory and facilitating agencies like the Cusroms Department, the Directorate General of ForeignTrade (DGFT), Airports, the Reserve Bank of India (RBI), Export Promotion Organizations (EPOs),Exporters, Importers, Agents, Container Corporation of India (CONCOR) and banks.
• Electronic Data Interchange (EDI)
EDI is the exchange of documents in the standardized electronic form, between organizations, in automatedmanners, directly from a computer application in one organization to an application in another. EDI can becompared and contrasred wirh electronic mail. Email enables free-format textual messages to be electronically
Arthavati : An International Journal I Volume·3 I Issue·2 I July-December, 2016 79
transmitted from one person to another. EDI, on the other hand, suppOrts strucrured business messages (thosewhich are expressed in hard copy, pre-printed forms or business documents) and transmits them electronicallybetween computet applications rathet than between people
• Internet Banking
As the banking industry has been constantly innovating and with the advent of technological developmentparticulatly in the area of telecommunication and information technology, one such innovation is internetbanking. Internet banking is defined as an internet porral through which the respondents can use differentkinds of banking services from bill payments to making investment. All rhe banks using internet as anadditional channel or banks using interner only as delivery channel are now on the equal footing to offet theirbanking services on the internet and to compete for respondents around the world Internet banking is usefulfor both the bankers and the respondents. The presenr age of integrated technology consisting of computersand communication faciliry, distances need no longer be constraint in providing customer service. EFT systemhosted and operated by the RBI, permits transfer of funds, from any account to any other account at anybranch of any member bank in any other city (Jain, 2006). In other words, electronic fund transfer facilitatesthe quick movement of deposit money from one bank account of one customer ro the bank account of anothercustomer. In this system, the sender and the receivet may be located at different cities.
• E-Purse
E-commerce has been marked as a steady trend towards growth of electronic mode of payments against paperbased instruments. European Central Bank (ECB) defined, "E-Money as electronic store of monetary value ona technical device and used to making payments other than rhe issuer without the involvement of bankaccounts in the transaction but acting as a prepaid bearing inSrrUl11ent"
Services through E-banking
• Bill payment service
It facilitates payment of electriciry and telephone bills, mobile phone, credit card and insurance premium billsas each bank has tie-ups with various utility companies, service providers and insurance companies, across thecountry. To pay our bills, all we need to do is complete a simple one-time registration for each biller. We canalso set up standing instructions online to pay our recurring bills, automatically. The bank does not chargerespondents for online bill payment.
• Fund transfer
''Ie can transfer any amount from one account to another of the same or any another bank. Once we login toyour account, we need to mention the payees' account number, his bank and the branch. The transfer will takeplace in a day or so, whereas in a traditional method, it takes about three working days. ICICI Bank says tharonline bill payment service and fund transfer faciliry have been their most popular online services.
• Credit catd respondents
''lith Internet banking, respondents can not only pay their credit card bills online but also get a loan on theircards. Ifwe lose our credit card, we can report losr card online.
80 Arthavati : An International Journal I Volume-3 I Issue-2 I Julv-December, 2016
• Railway pass
Indian Railways has tied up with ICICI bank and we can now make our railway pass for local trains online. Thepass will be delivered to us at our doorstep. But the facility is limited to Mumbai, Thane, Nasik, Surat andPune.
• Investing through Internet banking
We can now open an FD online through funds transfer. Now investors with interlinked demat account andbank account can easily trade in the stock market and the amount will be automatically debi ted from theirrespective bank accounts and the shares will be credited in their demat account. Moreover, some banks evengive us the facility to purchase mutual funds directly from the online banking system.
• Recharging prepaid phone
Now we juSt top-up our prepaid mobile cards by logging in to Internet banking. By just selecting our operator'sname, entering our mobile number and the amount for recharge, our phone is again back in action within fewmmutes.
• Shopping
With a range of all kind of products, we can shop online and the payment is also made conveniently throughour account. \\le can also buy railway and air tickets through Internet banking.
Rational ofthe Study
E-BANKING is vety popular in this global world. Now generally all banks provide e-banking services in allcities. But the utility of the e-banking is dependent on the awareness of e-banking services and informationabout the e-banking services. Sagar is a city of Madhya Pradesh where many respondents know about ebanking services and they are also using e-banking services and some respondents are aware about e-bankingservices but they avoid for using e-banking services. Generally respondents has theoretical knowledge of ebanking services, but all respondents are not using that theoretical knowledge in practical way, so this paperhas done for analysing whether respondents are aware about e-banking services or not and why they are notusing e-banking services,
Review of Literature
Dannenberg and Kellner (1998), in their study, overviewed the opportunities for effective utilization of theInternet with regard to the banking indus tty. The authors evaluated that appropriate application of today'scutting edge technology could ensure the success of banks in the competitive marker.
Daniel (1999), in his research paper, described e-banking as the newest delivety Channel offered by the retailbanks in many developing countries. The objective of the study was to analyze the current provision ofelectronic sen'ices of major retail banking organizations in the UK.
Yakhlef (2001) evaluated the services provided through internet and website. The researcher explored themajor services of Swedish banks provided via internet. The objective of the study was to see whether internetbanking services were compliment or competitive to brick and mortar bank branches.
Arthavati : An International Journal I Volume-3 I Issue-2 I July-December, 2016 81
Harris and Spence (2002), in their paper, explored the ethics of business ro business electronic commerce withfocus on banking secror. The researchers had chosen a case study of online foreign exchange developments atan investment bank.
Durkin and Howcroft (2003) evaluated that the banker-cusromer relationship was improved through mobile,phone and internet banking. The authors found that new technology has made the banks very competitive andprofitable and internet has played a key role in it
Lee, Jihyun (2003), examined that ro identify whether cusromer intention affecting ro use online financialservices. The effects of attitude roward behaviour, subjective norm were examined. Demographic variableswere included as control variables. Banking organisations. Many banks experienced consolidation throughmerger acquisitions (M&A).
Mishra (2005), in his paper explained the advantages and the security concerns about internet banking.According to him, improved customer access, offering of more services, increased customer loyalty, attractingnew respondents are the primary drivers of internet banking. But in a survey conducted by the online bankingassociation, member institutions rated security as the most importanr concern of online banking.
Abou-Robich, Moutaz (2005), studied how ro analyse comfort levels and attitude of users rowards onlinebanking facilities. The findings resulted that there is a correlation between attitude rowards e-banking andfeeling of security with regard ro their demographic variables.
Huang, Haibo (2005), reveals that the successful introduction electronic money and e-banking servIcesdepends mainly on people acceptance. The major finding is that although e-banking respondents more or lesshave some common characteristics, rhey differ across different types of e-banking services.
Heng Michael et al. (2006) analysed the impact of e-banking on brick and mortar banks through innovationmodel. The researchers' analysed 8 core capabilities ro assisr rhe banks migrated to e-banking environment.
Reynolds, John (2007), said that 2006 e-banking technology services industry cusromer loyalty survey dataresults in order ro improve marketing resource allocation for corporate e banking products and services.
Taft, Jeanette (2007), pointed our rhar Technology Acceptance Model (TAM) as applied ro a specific rype oftechnology: e-banking. They suggested that e-banking prior training, perceived ease of use of e-bankingrechnology.
Isern, Jennifer (2008), pointed OUt that a positive relationship between the level of financial infrastructure andthe level of competition and a negative relationship between the degrees of state ownership in banking secrorand the level of competition.
Kautish (2008)described the paradigm shift of banking secror from traditional Banking ro online banking. Theobjective of the paper was ro discuss the derivation of value added rool of online banking system which wasused to attract new respondents and retain the existing ones.
Nyangosietal.(2009), collecred respondents' opinions regarding the importance of e-banking and the adoptionlevels of different e banking technologies in India and Kenya.
Jeon, Kiyong (2014), have said that consumer prefer larger banks in U.S.Because they has ro reduce theirtransportation cost by way of larger banks have multiple ATM centre's across the country.
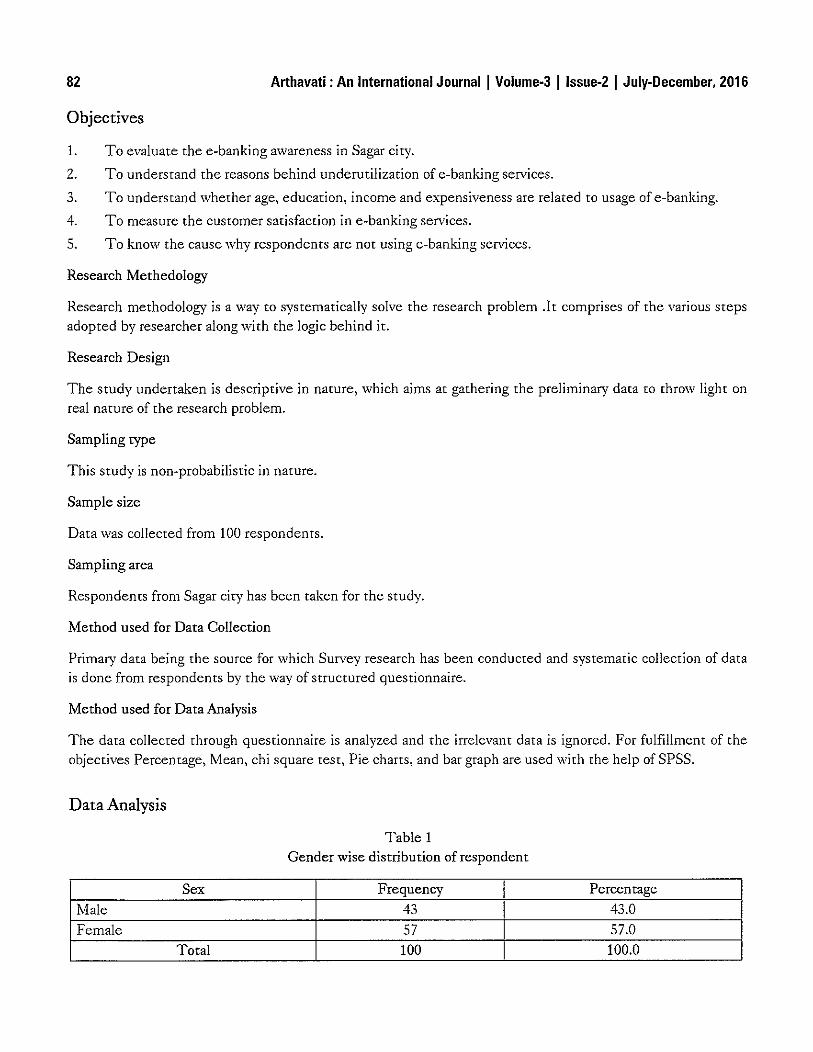
82
Objectives
Arthavati : An International Journal I Volume-3 I Issue-2 I July-December, 2016
1. To evaluate the e-banking awareness in Sagar city.
Z. To understand the reasons behind underutilization of e-banking services.
3. To understand whether age, education, income and expensiveness are related to usage of e-banking.
4. To measure the customer satisfaction in e-banking services.
5. To kno\v the cause \vhy respondents are not using e-banking services.
Research Methedology
Research methodology is a way to systematically solve the research ptoblem .It comprises of the various stepsadopted by researcher along with the logic behind it.
Research Design
The srudy undertaken is descriptive in nature, which aims at gathering the preliminary data to throw light onreal nature of the research problem.
Sampling rype
This srudy is non-probabilistic in nature.
Sample size
Data was collected from 100 respondents.
Sampling area
Respondents from Sagar city has been taken for the srudy.
Method used for Data Collection
Primary data being the source for which Survey research has been conducted and systematic collection of datais done from respondents by the way of strucrured questionnaire.
Method used for Data Analysis
The data collected through questionnaire is analyzed and the irrelevant data is ignored. For fulfillment of theobjectives Percentage, Mean, chi square test, Pie charts, and bar graph are used with the help of SPSS.
Data Analysis
Table 1Gender wise distribution of respondent
Sex Frequency Percentage
Male 43 43.0
Female 57 57.0
Total 100 100.0
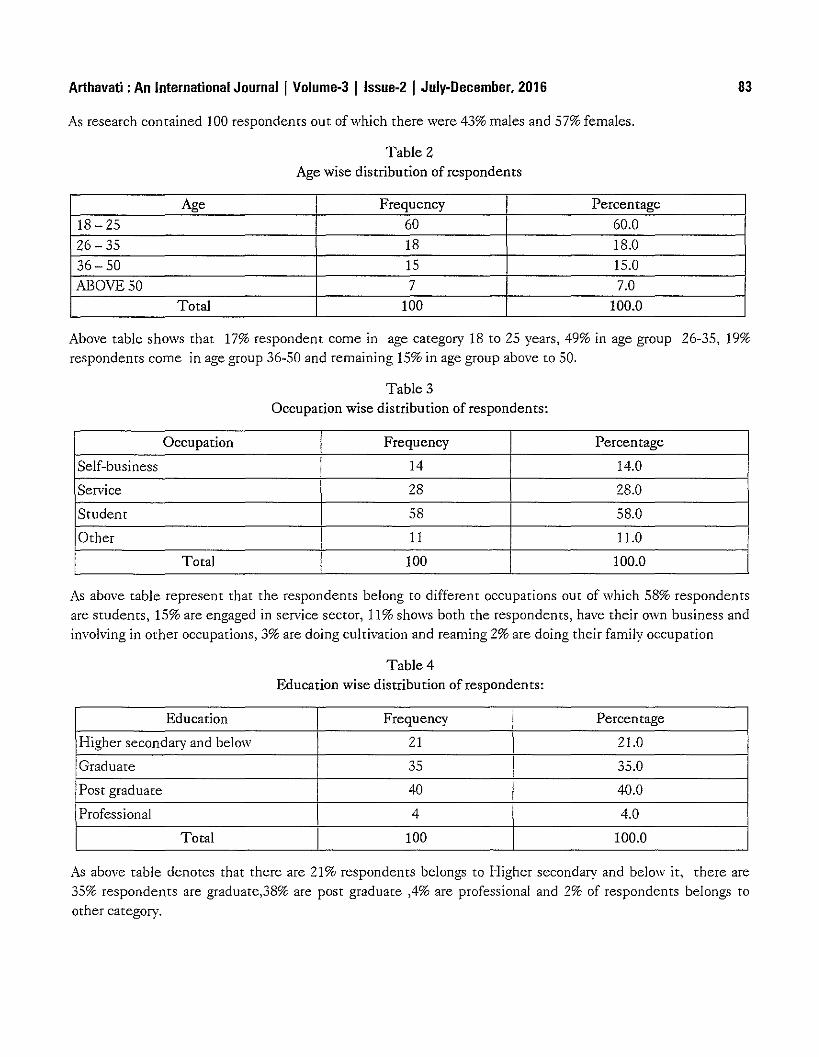
Arthavati : An International Journal I Volume-3 I Issue-2 I July-December, 2016
As research contained 100 respondents out of which there were 43% males and 57% females.
Table 2Age wise distribution of respondents
83
Age Frequency Percentage
18-25 60 60.0
26- 35 18 18.0
36-50 15 15.0
ABOVE 50 7 7.0Total 100 100.0
Above table shows that 17% respondent come in age category 18 to 25 years, 49% in age group 26-35, 19%respondents come in age group 36-50 and remaining 15% in age group above to 50.
Table 3Occuparion wise distribution of respondents:
Occupation Frequency Percentage
Self-business 14 14.0
Service 28 28.0
Student 58 58.0
Other 11 11.0
Total 100 100.0
As above table represent that the respondents belong to different occupations out of which 58% respondentsare students, 15% are engaged in service sector, 11% shows both the respondents, have their own business andinvolving in orher occupations, 3% are doing culrivarion and reaming 2% are doing their family occupation
Table 4Education wise distribution of respondents:
Education Frequency Percentage
Higher secondary and below 21 21.0
Graduate 35 35.0
Post graduate 40 40.0
Professional 4 4.0
Total 100 100.0
As above table denotes that rhere are 21% respondents belongs to Higher secondary and below it, there are35% respondents are graduate,38% are post graduate ,4% are professional and 2% of respondents belongs toother category.
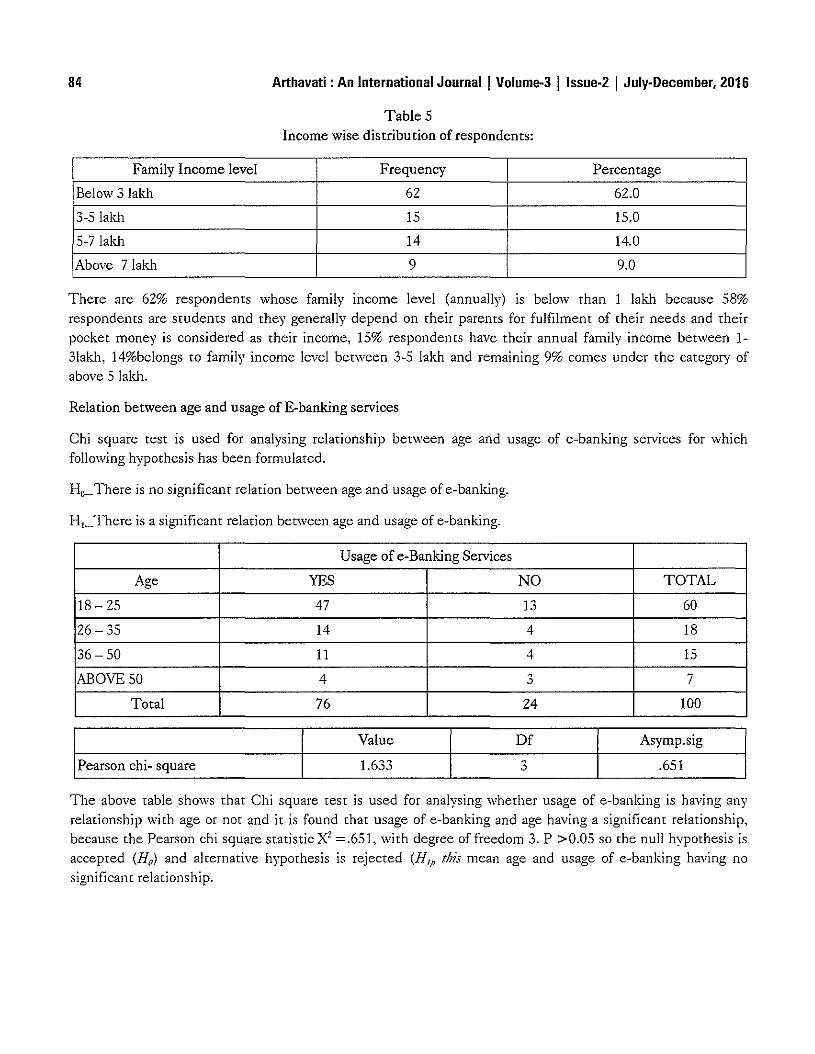
84 Arthavati : An International Journal I Volume-3 Ilssue-2 I July-December, 2016
Table 5Income wise distribution of respondents:
Family Income level Frequency Percentage
Below 31akh 62 62.0
3-51akh 15 15.0
5-71akh 14 14.0
Above 7lakh 9 9.0
There are 62% respondents whose family income level (annually) is below rhan 1 lakh because 58%respondents are students and they generally depend on their parents for fulfilment of theit needs and theitpocket money is considered as theit income, 15% tespondents have their annual family income between 13lakh, 14%belongs to family income level between 3-5 lakh and remaining 9% comes under the category ofabove 5 lakh.
Relation between age and usage of E-banking services
Chi square test is used fot analysing telationship between age and usage of e-banking services for whichfollowing hypothesis has been formulated.
HO-There is no significant relation between age and usage of e-banking.
H1_ There is a significant relation between age and usage of e-banking.
Usage of e-Banking Services
Age YES NO TOTAL
18- 25 47 13 60
26-35 14 4 18
36-50 11 4 IS
ABOVE 50 4 3 7
Total 76 24 100
Value Df Asymp.sig
Pearson chi- square 1.633 0 .651~
The above table shows that Chi square test is used for analysing whethet usage of e-banking is having anytelationship with age or not and it is found that usage of e-banking and age having a significant relationship,because the Peatson chi square statistic X2 =.651, with degtee of freedom 3. P >0.05 so the null hypothesis isaccepted (Ho) and alternative hypothesis is rejected (Hjj, this mean age and usage of e-banking having nosignificant relationship.
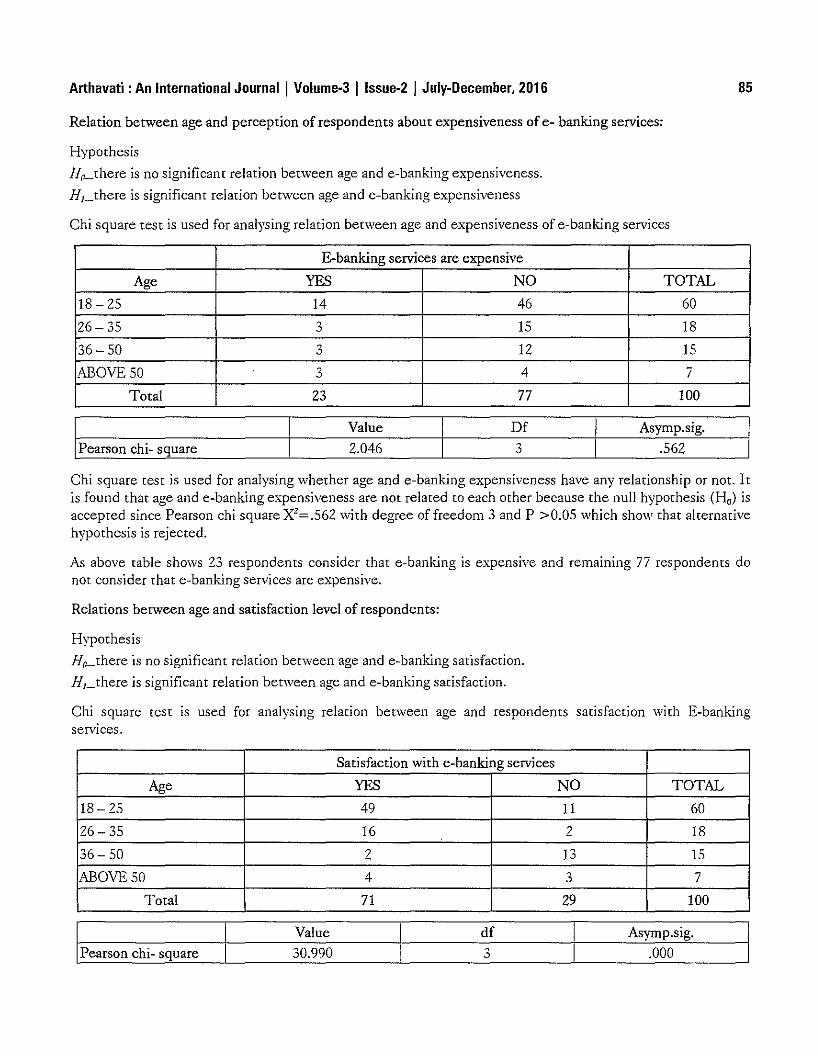
Arthavati : An International Journal I Volume-3 I Issue-2 I July-December, 2016
Relation between age and perception of respondents about expensiveness of e- banking services:
Hyporhesis
Ho--rhere is no significanr relarion between age and e-banking expensiveness.
H,_there is significanr relation between age and e-banking expensiveness
Chi square test is used for analysing relation between age and expensiveness of e-banking services
85
E-banking services are expensive
Age YES NO TOTAL
18- 25 14 46 60
26-35 3 15 18
36-50 3 12 15
ABOVE 50 3 4 7
Total 23 77 100
Value Df Asymp.sig.
Pearson chi- square 2.046 3 .562
Chi square test is used for analysing whether age and e-banking expensiveness have any telationship or nor. Itis found that age and e-banking expensiveness are nor related to each orher because the null hypothesis (Hal isaccepted since Pearson chi square X'=.562 with degree offreedom 3 and P >0.05 which show thar alternativehyporhesis is rejecred.
As above table shows 23 respondenrs consider that e-banking is expensive and remaining 77 respondenrs donot consider rhat e-banking services are expensive.
Relations between age and satisfaction level of respondents:
Hypothesis
Ho--there is no significanr relation between age and e-banking satisfaction.
H,_rhere is significanr relation between age and e-banking sarisfaction.
Chi square test is used for analysing relarion between age and respondenrs satisfaction with E-bankingserVIces.
Sarisfaction with e-banking services
Age YES NO TOTAL
18- 25 49 11 60
26- 35 16 2 18
36-50 2 13 15
ABOVE 50 4 3 7
Total 71 29 100
I Value df Asymp.sig.
Pearson chi- square I 30.990 3 .000
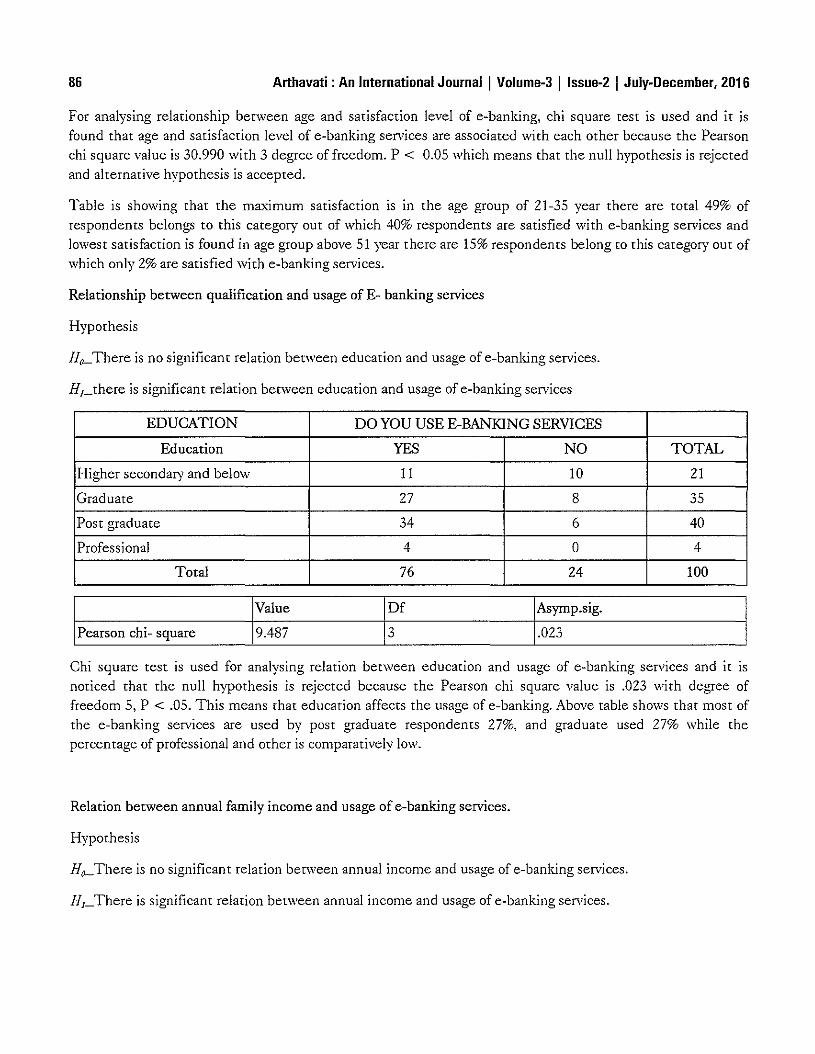
86 Arthavati : An International Journal I Volume-3 I Issue-2 I Julv-December, 2016
For analysing relationship between age and satisfaction level of e-banking, chi square test is used and it isfound thar age and satisfaction level of e-banking services are associated wirh each other because the Pearsonchi square value is 30.990 with 3 degree of freedom. P < 0.05 which means that the null hypothesis is rejectedand alternative hypothesis is accepted.
Table is showing that the maximum satisfaction IS In the age group of 21-35 year there are total 49% ofrespondents belongs to this category out of which 40% respondents are satisfied with e-banking services andlowest satisfaction is found in age group above 51 year there are 15% respondents belong to rhis caregory out ofwhich only 2% are satisfied with e-banking services.
Relationship between qualification and usage of E- banking services
Hypothesis
He-There is no significant relation between education and usage of e-banking services.
HI_there is significant relation between education and usage of e-banking services
EDUCATION DO YOU USE E-BANKING SERVICES
Education YES NO TOTAL
Higher secondary and below 11 10 21
Graduate 27 8 35
Post graduate 34 6 40
Professional 4 0 4
Total 76 24 100
Value Df Asymp.sig.
Peatson chi- square 9.487 3 .023
Chi square test is used for analysing relation between education and usage of e-banking services and it isnoticed that the null hypothesis is rejected because the Pearson chi square value is .023 with degree offreedom 5, P < .05. This means that education affects the usage of e-banking. Above table shows that most ofthe e-banking services are used by post graduate respondents 27%, and graduate used 27% while thepercentage of professional and other is comparatively low.
Relation between annual family income and usage of e-banking services.
Hypothesis
He-There is no significant relation between annual income and usage of e-banking services.
HI_There is significant relation between annual income and usage of e-banking services.
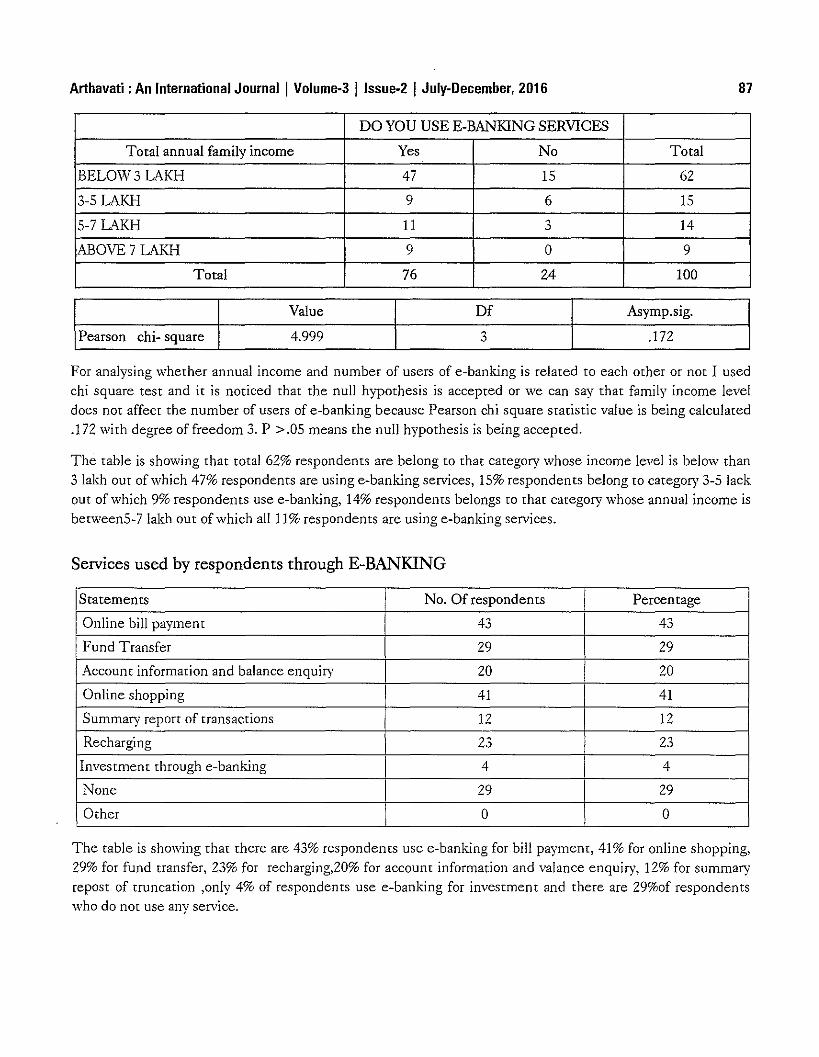
Arthavati : An International Journal I Volume-3 I Issue-2 I July-December, 2016 87
DO YOU USE E-BANKING SERVICES
Total annual family income Yes No Total
BELOW3LAKH 47 15 62
3-5 LAKH 9 6 15
5-7 LAKH 11,
14"ABOVE7LAKH 9 0 9
Total 76 24 100
Value Df Asymp.sig.
Pearson chi- square 4.999 3 .172
For analysing whether annual income and number of usets of e-banking is related to each othet or not I usedchi squate test and it is noticed that the null hypothesis is accepted Ot we can say that family income leveldoes not affect the number of users of e-banking because Pearson chi square statistic value is being calculated.172 with degree offreedom 3. P >.05 means the null hypothesis is being accepted.
The table is showing that total 62% respondents are belong to that category whose income level is below than3 lakh Out of which 47% respondents are using e-banking services, 15% respondents belong to category 3-5 lackout of which 9% respondents use e-banking, 14% respondents belongs to that category whose annual income isbetween5-7 lakh out of which all 11% respondents are using e-banking services.
Services used by respondents through E-BANKING
Statements No. Of respondents Percentage
Online bill payment 43 43
Fund Transfer 29 29
Account information and balance enquiry 20 20
Online shopping 41 41
Summary report of transactions 12 12
Recharging 23 ?'-"Investment through e-banking 4 4
None 29 29
Other 0 0
The table is showing that there are 43% respondents use e-banking for bill payment, 41 % for online shopping,29% for fund transfer, 23% for recharging,20% for account information and valance enquiry, 12% for summaryrepost of truncation ,only 4% of respondents use e-banking for investment and there are 29%of respondentswho do not use any service.
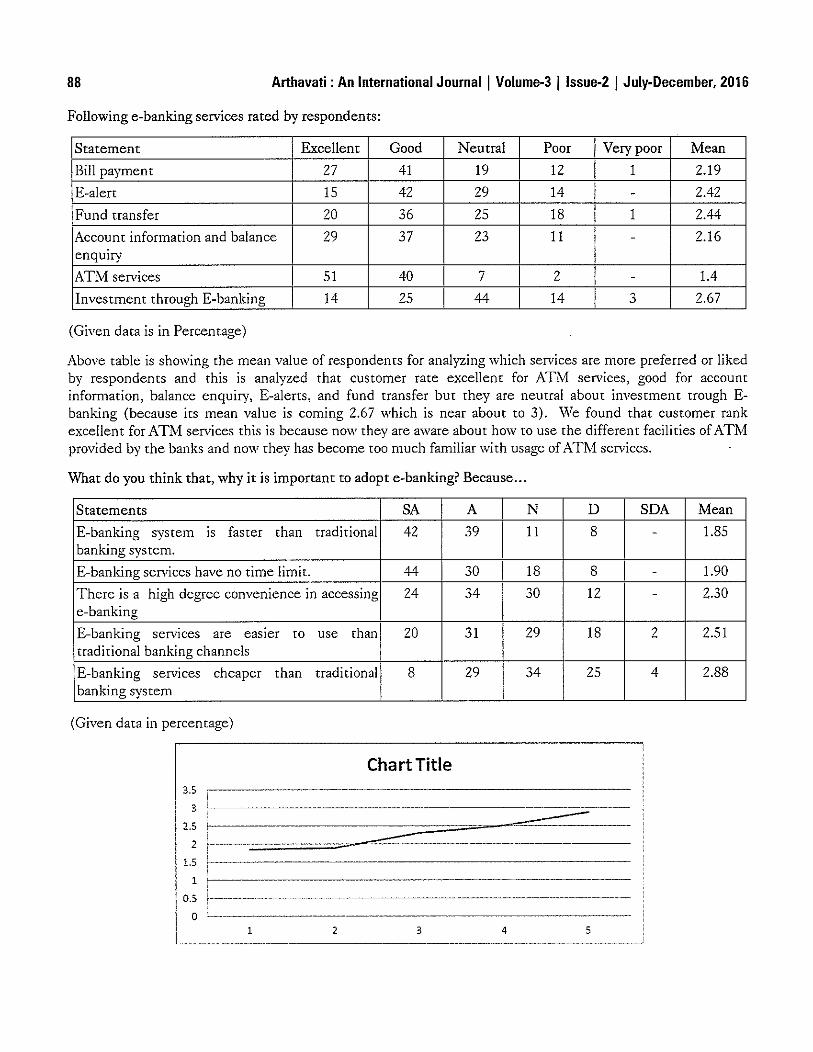
88 Arthavati : An International Journal I Volume-3 Ilssue-2 I July-December, 2016
Following e-banking services rated by respondents:
Statement Excellent Good Neutral Poor Very poor Mean
Bill payment 27 41 19 12 1 2.19
E-alerr 15 42 29 14 - 2.42
Fund transfer 20 36 25 18 1 2.44
Account information and balance 29 37 l' 11 - 2.16_J
enqulf'y
ATM sen'ices 51 40 7 2 - 1.4
Investment through E-banking 14 25 44 14 0 2.67J
(Given data is in Percentage)
Above table is showing the mean value of respondents for analyzing which services are more preferred or likedby respondents and this is analyzed that cusromer rate excellent for ATM services, good for accountinformation, balance enquiry, E-alerrs, and fund transfer but they are neutral about investment trough Ebanking (because its mean value is coming 2.67 which is near about to 3). We found that customer rankexcellent for ATM services this is because now they are aware about how to use the different facilities ofATMprovided by the banks and now they has become too much familiar with usage of ATM services.
What do you think that, why it is important to adopt e-banking? Because...
Statements SA A N D SDA Mean
E-banking system IS faster than traditional 42 39 11 8 - 1.85banking systen1.
E-banking services have no time limit. 44 30 18 8 - 1.90
There is a high degree convenience in accessing 24 34 30 12 - 2.30e-banking
E-banking serVIces are eaSIer to use than 20 31 29 18 2 2.51traditional banking channels
E-banking servIces cheaper than traditional 8 29 34 25 4 2.88banking system
(Given data in percentage)
2
1.5
1
0.5
o
Chart Title
--------------------1 2 3 4 5
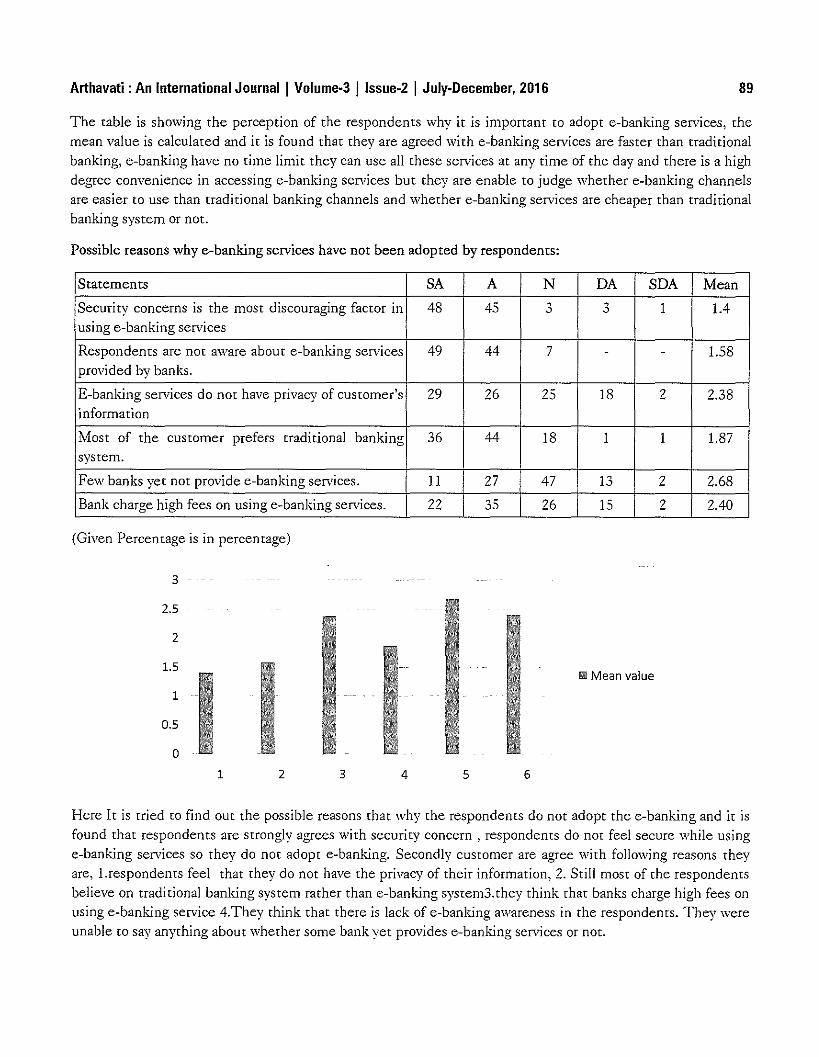
Arthavati : An International Journal I Volume-3 !lssue-2 I July-December, 2016 89
The table is showing the perception of the respondents why it is important to adopt e-banking services, themean value is calculated and it is found that they are agreed with e-banking services are faster than traditionalbanking, e-banking have no time limit they can use all these services at any time of the day and there is a highdegree convenience in accessing e-banking services but they are enable to judge whether e-banking channelsare easier to use than traditional banking channels and whether e-banking services are cheaper than traditionalbanking system or nor.
Possible reasons why e-banking services have not been adopted by respondents:
Statements SA A N DA SDA Mean
Security concerns is the most discouraging factor in 48 45 ,3 1 1.4.)
using e-banking services
Respondents are not aware abour e-banking services 49 44 7 - - 1.58provided by banks.
E-banking services do not have privacy of customer's 29 26 25 18 2 2.38information
Most of the customer prefers tradi tional banking 36 44 18 1 1 1.87system.
Few banks yet not provide e-banking services. 11 27 47 13 2 2.68
Bank charge high fees on using e-banking services. 22 35 26 15 2 2.40
(Given Percentage is in percentage)
3
2.5
2
1.5
1
0.5
o1 2 3 4 5 6
II! Mean value
Here It is tried to find our the possible reasons that why the respondents do not adopt the e-banking and it isfound that respondents are strongly agrees with security concern, respondents do not feel secure while usinge-banking services so they do not adopt e-banking. Secondly customer are agree with following reasons theyare, l.respondents feel that they do not have the privacy of their information, 2. Still most of the respondentsbelieve on traditional banking system rather than e-banking system3.they think that banks charge high fees onusing e-banking service 4.They think that there is lack of e-banking awareness in the respondents. They wereunable to say anything abour whether some bank yet provides e-banking services or nor.
90 Arthavati : An International Journal I Volume-3 Ilssue-2 I Julv-December, 2016
What should banks do for encouraging respondents to use E-BANKING SERVICES?
Statements Frequency Percentage
Reducing charges and fees(additional charge) 50 50
Incentives to e-banking users 32 "?~-
Advertisement 23 23
giving them guarantee of security and privacy 77 77
Giving them technological knowledge through seminar 27 27
The table show that according to the 77% respondents banks should give the guarantee of privacy and securiryto their respondents for encouraging the tespondents to use e-banking services, 50% respondents said thatbanks should reduce their additional charges on using e-banking services,32%respondent consider that banksshould give incentive to e-banking users, 27%respondents think that banks should ptovide technologicalknowledge through seminar for their respondents and 23% respondents think that bank should advertise aboutthe e-banking to encourage the respondents to use e-banking services.
Limitation
1. The sample size is limited to 100 e-banking users hence the result of the study cannot be taken asuniversal.
2. Findings of the survey are based on the assumption that the respondents have glven the correctinformation.
3. Since the respondents had to fill the questionnaire while busy with their hectic schedule, many peoplewere reluctant to answer.
4. The project relied mainly on the primary data.
Findings
Following are the facts that are found during project work
• This project is based on the 100 respondent out of which 76% respondents use e-banking service and24% respondents do not use e-banking services, it is also found that younger generation were usingbanking services more as compared to older generation because of innovation in information ,technologyand their adopting level is high in e-banking. There were 66% respondents belongs to age group 10to 35year OUt of which 58% use e-banking services and only 8% do not use e-banking on the other hand above51 age category \vere using e-banking sen'ices are lesser to others.
• 40% respondents came to know about e-banking services through their relative, 31 % through theirfriends, 21%through and 12%through bankers and onlyl4%coustomers came to know about e-bankingservices through their colleagues and neighbours.
• 51% of the respondents use e-banking services for the purpose of time saving and 24% for theirconvenience ,this reflect that respondents consider that e-banking services are faster than traditional
Arthavati : An International Journal I Volume-3 I Issue·2 I July-December, 2016 91
banking system and are available easily. 17%responenteds used e-banking survives because rhey canaccess rheir account 24 hours and there were only 2% respondents who have other reasons for using ebanking.
• 43% respondents use e-banking services for online bill payment,41% for online shopping, 29% for fundtransfer, 23% use for recharging their prepaid phone,20% for account information and balance enquiry,4% of respondents use e-banking for investmenr through e-banking and 29%of respondent use noneservIces.
• In research this is found that 73% respondents consider that e-banking services help in doing banktransaction easily and 27% do not consider it. It is observed that rhose respondent who agreed with thate-banking is helpful in doing e-banking transaction easily belong to younger generation and oldergeneration respondents consider that e-banking do not do so.
• 14% of Category 10-20 year respondents thinks that e-banking services are not expensive, In 21-35age36%, In 36 to 50 yeat age group 14% and 3% tespondents belong to category above 51 year do not thinkthat e-banking services are expensive. It is also found that age and e-banking expensiveness has asignificant relationship.
• It is being noticed that age impact the e-banking satisfaction level, the maximum satisfaction is in theage group of 21-35 year there are toral 49% of respondents belongs to this category out of which 40%respondents ate satisfied with e-banking services and lowest satisfaction is found in age group above 51year there ate 15% respondents belong to this category out of which only 2% are satisfied with e-bankingserVIces.
• Most of the e-banking services are used by post graduate 32%, and graduate 26% while the percentage ofprofessional and other is comparatively low. For analyzing whether different level of education is relatedto users of e-banking or not, I used chi square test and rhis is concluded that users of e-banking anddifferent level of education is nor related to each other or we can say that diffetent level of educationdoes not make any impact on number of uses of e-banking.
• It is found that income level of respondents does not make any impact on the number of e-bankingusers. There are toral 62% respondents belong to that category whose income level is below than 1 lakhout of which 47% respondents are using e-banking services, 15% respondents belong to category 1-3 lackout of which 9% respondents use e-banking, 14% respondents belongs to that category whose annualincome is above to 5 lakh out of which all 9% respondents are using e-banking services.
• There are 76% respondents who use c-banking services and there are 64% respondents who are satisfiedwith e-banking services this shows that (76%-64%) 12% of respondent are using e-banking but they arenot satisfied with the services of e-banking. There are total 36% respondents who are not satisfied withe-banking services.
• Respondents consider ATM services as excellent and consider good for account information, balanceenquiry, E-alerrs, and fund transfer but they are neutral about investment trough e-banking.it is alsofound that respondents was not in condition to say anything about investment through e-banking.
• Respondent think that e-banking is not adopted by the costumers because they do not feel secure withe-banking, there is lack of privacy and some think that there is lack of e-banking awareness.
92 Arthavati : An International Journal I Volume-3 I Issue-2 I July-December, 2016
• According to respondents they think that banks must focus on 'guarantee of security and privacy ofcustoms and they should reduce the addition charges on using of e-banking services.' For encouragingrespondents to use e-banking services
Conclusion
It is found from this study that younger generation were using e- banking services more as compared to oldergeneration because of new innovation in information technology and their adopting level is high in e-banking.Above 51 age category were using e-banking service are lesser than others. The main two reasons why thecustomer do not adopt e-banking services are, securiry concern they do not feel secure while using e-bankingand customer think that e-banking services do not have privacy of respondents information and there are someother reason, some of them are also consider that e-banking services are expensive and traditional bankingsystem is better than e- banking system.
E-banking has become a powerful tool for improving customer's satisfaction regarding to banks but all banksshould keep in mind that still the satisfaction level is not found too much high there is need of improvementin e-banking system. The e-banking system must be as easy as any age category's customer can adopt it easilyand if he gets any problem related to e-banking, the bankers must give them appropriate solution for theirproblems.
References
Abou-Robieh, Momaz "A study of e-banking security perceptions and customer satisfaction issues.C20DS)
Huang, Haibo"Essays in e1ecuonic money and banking (2005)
Reynolds, }ohn" A retrospective data examination of custOmer loyalry in the e-banking l:echnology services industry: Strategies fornew successes (2007)
Taft, Jeanene" An examination of the antecedents of electronic banking technology acceptance and use(Z007)
Isern,Jennifer" A cross-country analysis of the effects of e-banking and financial infrastructure on financial secro[ competition: ASchumpeterian shifr?(2008)
Jeon, Kiyong"Essayson banking indusrry: ATM (AutOmatic Teller IVlachine)(2014)
Lee, Jihyun" FactOrs affecting intention to use online financial services (2003).
Mishra A K (2005), "Internet Banking in India Parr-I", http://www.banknetindia.com/bankinglibkg.htmJ (15 Sept. 2010)
Nyangosi et al. (2009), "The evolution of e-banking: a study of Indian and Kenyan technology awareness", International Journal ofElectronic Finance, Vo1.3, No.2, pp.149-165.
M. Y. Khan (2004) "Indian Financial System" Publication-Tata McGraw hill 6th edition
HerpreetKaur and J.S.Pasricha (July-Dec 2008) "Journal of banking: Information Technology Management"
C. R. Kothari (2004) "Research Methodology" New Age International" nnd edition.
DeYoung, R, Lang, \\T. \\T. and Nolle, D. E. (2006), "How the Internet Affects OUtput and Perfonnance at Community Banks"
DOD
Rationale of Inflation Targeting as anAnchor of Monetary Policy
Dr. Sunil Kumar Dalal'
Abstract
The multi indicator approach of monetary policy framework in India came under attack as it failed to controlinflation and sustain the growth of the economy. This necessitated suitable changes in the policy. Onrecommendation of the Urjit Patel committee, RBI in consultation with Government of India decided infavour of inflation targeting to be nominal anchor of the monetary policy. Inflation targeting approach isadvocated on the ground that it would bring in transparency and predictabiliry in monetary policy. A low andstable inflation will ultimately result into higher growth prospects. This approach is based on existence andshape of the Phillips curve, i.e. relation between inflation and unemployment and how effectively policy ratechanges are transmitted ro interest rare. In this paper efforts have been made to look into the theoretical basisof the approach and suitability of this policy in Indian context as in India causes of inflation are different fromadvanced countries.
Introduction
The existence of high inflation and sluggish growth generated a considerable debate around the monetarypolicy framework in India. There has been a constant tussle between the finance ministry and the RBI overhow high interest rates or how tight monetary environment should be. An expert committee, headed by thethen Deputy Governor of the RBI, was constitured by the Reserve bank of India in September,2013 torecommend what needs to be done to revise and strengthen the (current) monetary policy framework wirh aview to make ir more transparent and predicrable .The committee, in response to the challenges andopportunities thrown by the structural changes brought Out and fmancialliberalizarion realized through a seriesof measures under economic reforms since 1991, felt that conduct of monetary policy had undergonefundamental changes. Therefore, the committee recommended 'Flexible Inflation Targering' as an anchor ofthe monetary policy framework in India. The new monetary policy framework, as suggested by the committee,is justified on the ground that previous framework failed to control inflation for some years. It is further saidthat inflation targeting as a macroeconomic tool would give central bank an explicit mandate to pursue pricestability as the primary monetary objective and a high degree of operational autonomy. Accordingly, necessaryamendments were made In the Reserve Bank of India Act, 1935, to implement the same.
Inflation targeting approach of the monetary policy was first adopted by New Zealand in march,1990 and lateron adopted by many countries of the world, namely, Canada, Australia, U.K., Sweden,
Brazil, Mexico and many more from Asia and Mrica. This paper aims to look into the theoretical arguments formaking flexible inflation targeting as a sole objective of the monetary policy in Indian context and try to findan answer for the question: whether inflation targeting is a suitable policy option for the emerging economylike India?
* 8mior Lecturer, Departmellt ofEcollomics SM.B. GODt. P. G. College, J.lathdwara
94 Arthavati : An International Journal I Volume-3 Ilssue-2 I July-December, 2016
Conceptual Framework of Inflation Targeting
The inflation targeting framework of monerary policy is based on the assumprion of a srable link berweeninflarion rare and policy rares. It considers Friedman's view rhar rhere is no long rerm trade-off betweeninflation and growth, i.e., rhe rwo are independent in rhe long run and therefore, central bank should focus oncontrolling inflation. Inflarion rargering binds central bank to commir to a low and srable inflarion rargeracceprable to the public. The new framework recognizes the inconsisrency in rhe pursuir of the multiple goalsof inflarion and unemployment wirh rhe single tool of interest rate. Growrh and inflarion are imporrant only torhe extent rhar medium term inflation targering remains a credirable commirment.
New Keynesians argue rhar rhe Phillips curve, in the plane of inflation and output, is upward slopping in rheshorr run. This happens due to increasing cost as output grows. The shorr rerm trade-off between inflation andoutput was justified on the ground that with a decrease in unemployment, bargaining power of workersincreases. Since prices can be assumed as a mark up over COSt, they n10ve in tandem with the \:vage cost.Therefore, inflarion varies inversely with unemployment and hence posirively with output. This understandingremained central to Keynesian demand management through the devices of monerary and fiscal policy.Moreover, ir was argued that there is a permanent trade-off between the two and therefore policy does notonly matter in the shorr run but also in the long run.
Friedman criticized Keynesian framework by arguing rhat wirh inflation, the expecrarion of workers cannorremain stagnant. Insread, they follow the movements of rhe rare of inflation. Any attempr to decreaseunemployment would lead accelerating inflation and opposire would happen if ir stays above that level.
Lucas and Sargent (1978, 1981) argued thar Friedman's expectation function was unreasonable. According torhem, economic agents do nor extrapolare the pasr into future, ins read they have rationale expectarions. Thischange in rhe expecrarion funcrion ensures that there is no trade-off in rhe absence of exrernal shocks even inrhe shorr run. This was a major shifr in rhe economic discourse in favour of pre Keynesian ideas against activepolicy intervention.
New Keynesian quesrioned rhe assumption on which rhese conclusions were reached. The new Keynesianargument is that in the presence of imperfect competirion, asymmetric informarion, labour market rigidiries,rhe exrernalities, rhe economy might nor serrle ar non accelerating inflation rate of unemployment (NAIRU)level of outpur in rhe shorr run even agents' expecration remain rarionale. Hence, there is a need for activepolicies in the shorr run to propel the economy towards its porential growth path.
Assumption of a trade-off between inflation and output in shorr run implies rhat to bring down inflarion oneneeds to reduce the level of output and rhereby level of employment too gets affected. Hike in interest rate tocontrol inflation would affecr private investment and consumption financed by credit. Chandrashekhar (2014)mentions a serious flaw in rhe above policy prescriprion, parricularly in a situation where underlyingassumprion of a trade-off between inflarion and Output rum out to be incotrect. For a developing country likeIndia where large force of labour remain unemployed, assumprion of rise in the bargaining power of theworkers with rise in employment is not real. Therefore, any policy to control inflation by targering loweroutput will be counterproducrive and may creares fears of recession which could furrher fuel pessimisricexpectations.
On the contrary, Freedman and Laxton (2009 a) argued that inflarion rargering would help to maintaininflation wirhin a reasonable range and hence reduce the cost of inflation. According to rhem, cost of high and
Arthavati : An International Journal I Volume·3 Ilssue·2 I July-December, 2016 95
volatile inflation is very high as it affects long term decisions of savers and investors, leads to distortions inrelative prices of commodities and taxation and also contributes to output and unemployment variability.
Coecherti and Kim (2004) emphasized that inflarion targeting would create an environment to get rid of avicious cycle of higher prices to higher wages and yet to higher prices since anchoring long term inflationexpectations would contain increase in wages.
Isard et.aI. (2001) argued that transparency resulting from inflation targeting accounts for the effectiveness ofmonetary policy by facilirating behaviour of participants in financial market. When financial marketsunderstand and anticipate the action of the central bank, the transmission mechanism berween policy actionsand inflation and economic activity work more smoothly.
It is clear from the above discussion that inflation targeting approach is based on existence of relation betweeninflation and unemploymenr and expectarions of people about inflation and policy rates. The predictabiliryand transparency in monetary policy will spur confidence in savers and investors.
Historical Perspective of India's Monetary Policy
The monetary policy framework in India has greatly been influenced by financial development and opennessand shift in underlying transmission mechanism. Mohanty (2013) identified following distinctive phases inevolution of monetary policy in India-Formative Years (1935-1950) - In this phase monerary policy aimed toregulate the supply of and demand for credit in the economy through quantitative measures like bank rare,reserve requirements and open market operations.
Developmental phase (1951-1970) - During this period monetary policy was used as a tool to support planfinancing. This objective was realized through several quantitative measures to contain consequent inflationarypressures. Care has been raken to ensure credi t to preferred sectors. Bank rate was often used as a monetarypolicy instrument.
Phase of Credit planning (1971-1990) - In this phase, the focus of monetary policy was on credit planning.Both statutory liquidity ratio and cash reserve ratio were used to strike a balance between governmentfinancing and the artendant inflationary pressure.
Post reform period (1990 onwards)- Implementarion of rhe srructural reforms and financial liberalization policyin the 1990s witnessed a paradigm shift in government and commercial financing with increasingly markerdetermined interest rates and exchange rates. The RBI was able to move away from direct instruments ofcredit control to indirect market based instruments, rermed as liquidity adjustment facility and operatedthrough overnight fixed rates, namely, repo and reverse repo rares. This process helped to develop interesr asan instfumen t of monetary transmission.
Urjit Patel committee report also mentioned some important changes brought Out in monetary policyframework since independence. In the initial years of independence, exchange rate was the nominal anchor ofthe monetary policy ser by the proportional reserve system where at leasr 40% of the total note issue was to bebacked by gold bullion and Sterling reserves. This system was replaced by minimum reserve system in 1957where only Rs. 2 billion reserves in terms of gold and foreign exchange were required to maintain against noteissue. Credit aggregates were made as a nominal anchor of the monetary policy. Chakraverty committee (1985)to revie'w the working of n10netary system recomn1ended a monetary fran1ework based on monetary targeting.
96 Arthavati : An International Journal I Volume-3 I Issue-2 I July-December, 2016
Accordingly, broad money became rhe intermediate target and reserve money became the main operatinginstrument for achieving cOntrol on broad money growth. This framework could not yield desired resultsbecause of the lack of control over RBI's credit to central government which accounted for the bulk of reservemoney creation. Even with CRR and SLR raised, close to their statutory ceilings, money supply growthremained high and fuelled inflation. In April 1998, RBI adopred a multiple indicator approach that used to takeinto account a number of quantity and rate variables, such as, credit, output, inflation rate, exchange rate,interest rate etc., for monetary policy decisions. It could be summarized that RBI, keeping in view thedevelopments experienced and challenges faced by the Indian economy, has been continuously revlSlngmonetary policy to achieve target set for the economy.
Inflation Targeting in Indian context
As stated in the beginning that on the recommendation of rhe Urjit Patel committee report multi indicatorapproach of the monetary policy has recently been replaced with the Inflation targeting as a sole objective ofthe policy. The co existence of high inflation with weakening growth attracted censure of the public as regardto efficacy of the multi indicator approach. This approach has also been criticized on the ground thar it failedto cleatly define nominal anchor of the monetary policy. The policy of flexible inflation targeting is designedaround giving critical importance to price stability for sustainable growth in medium term. Government ofIndia in consultation with RBI has set nominal inflation target of 4%, measured in terms of CPI, for monerarypolicy. The head line inflation, measured in terms of CPI, is favoured over core inflation because holding downinflation requires dampening inflation expectation that contribute to the inflationary trend. As regard to policyrates, Urjit patel committee recommended a simple rule of thumb which states that when the inflation rate isabove the nominal anchor, the repo rate should be posirive and the degree to which it is in positive territoryshall be determined by taking into account the output gap or the level of output growth as compared to trendor potential. Under this new monetary framework, it has been hypothesized that adjustments in rhe policyrates would affect short term market rates which than transmit to rhe fuller specrrum of interesr in financialsysrem, including deposir and lending rates, rhar in turn affect consumprion, saving and investment decisionsof economic agents and eventually aggregate demand, ourput and inflation.
Earlier to rhis, Narsimham (2000) and Rajan (2007) committees recommended the implementarion ofinflation targeting assuming rhar low and srable inflation would resulr into a stable GOP growth. Rajan (2007)argued that inflation targeting would provide more room for policy makers to respond to large shocks becausethe market would better understand the objective of monetary policy. He further suggested carrying Outfinancial reforms to improve transmission mechanism for the successful implementation of monetary policy.This view was supported by Mohan (2007a) who said thar efficient market operations and absence ofdistortions in interest rates could make monetary transmission mechanism efficient.
The sanctity of inflation rargeting in emerging economies has always been a matter of debate because thesource of inflarion is usually different from that in mature advanced economies .In the emerging economy likeIndia, inflarion is mostly driven by cyclical shift in demand. Indian economy, since 1991, has experiencedstructural transformation and has been facing periodic supply shocks. In such a case, raising question onbroader inflarion objective of the RBI, Shetry (2013) argued that it is impossible to achieve a low level ofinflation with the help of monetary measures. Supply factors have a dominant role to play in inflarion control.When strong monetary measures are deployed to achieve such a low level of inflation, growth gets adverselyaffected and that has its adverse consequences on employment generation and orher aspecrs of inclusive
Arthavati: An International Journal I Volume-3 Ilssue-2 I July-December, 2016 97
growth. In a vast developing sociery, with a vast scope for structural changes, some degree of higher pricesserves as an incentive for some sectors of the economy. .Tha (2008), Mohan (2007a) and Subbarao (2011) alsoreached to same conclusion rhat monetary policy can stabilize inflation caused due to demand shocks and ir isineffective againsr supply shocks. Subbarao(2011) argued that inflarion targeting in not feasible in India andtherefore is not advisable. The most imporrant reason for not targeting inflation is that nature of inflation inIndia is structural with sources of inflationary pressure being food and fuel prices and targeting inflationthrough monetary policy will achieve very little.
The persistence of high inflation in India for the past few years can be understood on the basis of explanationgiven by Kalecki. Kalecki had proposed that while prices of industrial commodities are cost determined, thoseof primary commodities are demand determined. So it is obvious that inflation which has entered the systemwith rise in prices of agriculture commodities cannot be controlled by bringing down the production ofindustrial commodities. Moreover, inflation because of a rise in prices of critical inputs like oil cannot becontrolled by reducing production and employment. Prices of primary commodities rise mainly because ofinadequate and volatile production, speculative hoarding and commodiry future. In such a case governmentneeds to attack on these real sources of inflation rather than resorring to monetary policy instruments. Thesemeasures include counter cyclical taxation of oil and related items, improvement and investment in storagecapacities across the COUntry, controlling future markets and cracking down on commodity hoarders.
Azad and Das (2013) were of the view that inflation targeting in a developing economy, where the Phillipscurve is more likely to be horizontal than upward slopping, is not only ineffective but also imposes hardship onworking people of the country. Since the source of inflation is generally cost push caused by supply shocks ineither external market or the primary goods in the domestic economy, it would signal the central bank toincrease interest rate till inflation gap narrows down. But if the demand curve is horizontal for the entire rangeof Output ahead of full capacity, this process can never come to stop through policy. That is, despite steepdemand deflation, inflation would not come under control till the supply shocks themselves ease out.
Conclusion
Persistently high inflation has always been a major cause of concern for the policy makers because it depressessavings as real interest rates turns negative, ,veakens external value of the currency, underminescompetitiveness, adversely affects balance sheet of firms that have borrowed in foreign currency, adverselyaffects investment climate and growth and also worsen income distribution. It is a very tough and challengingtask for policy makers to design a policy that can achieve high growth with price stabiliry. High inflation withthe sluggish growth of the Indian economy for a few years has raised serious doubts about the effectiveness ofthe multi indicator approach of the monetary policy in achieving the stated objectives. In this context, UrjitPatel con1mittee ,vas constituted to review the prevailing monetary framework and to suggest n1easures tostrengthen the monetary policy framework that can take care of challenges posed by structural changes broughtout and financial liberalization made in the Indian economy.
The committee recommended Inflation targeting as an anchor of the monetary policy. Mter accepting therecommendation, government of India made necessary amendments in the RBI Act to give RBI statutorypowers to make inflation targeting as a nominal anchor for the monetary policy arguing that a low and stableinflation over the medium term will rein in inflation expectation and will bring in transparency andpredictabiliry in RBI's monetary policy moves. This in turn will improve business environment and help inachieving high grmvth target.
98 Arthavati : An International Journal I Volume·3 Ilssue-2 I July-December, 2016
The conceptual framework of inflation targeting rests upon the assumptions about the trade of betweeninflation and growth in short as well as long tun, rational expectations of the people about inflation and itsrrend and rransmission mechanism of the policy. These very assumptions provide the ground for raising doubtsas regard to efficacy of this policy in emerging economies like India. Further opponents of this approach arguethat causes of inflation in emerging economies are different from that of advanced economies. In India,Inflation is mostly caused by supply shocks and containing inflation through interest rate would not yielddesired results rather it would adversely affect growth. Maintaining low and stable inflation and attaining areasonably fair growth in medium term shall determine the success of this approach. Moreover, Success of thepolicy requires institutional autonomy to the central bank, a healthy and well developed financial market foreffective transmission mechanism, a fully deregulated price mechanism, absence of fiscal dominance and a welldeveloped technical infrastructure for forecasting, modelling and data availabiliry.
References
Azad, Rohit and Anupam Das (2013):"Inflarion Targering in developing countries", Economic & Political weekly", VoI.XLVIII, No. 41,pg.39-45.
Chandrashekhar, C.P. (2014): "Off-target on Monetary Policy", Economics& political \'Veekly, vol. XLIX,No. 9 Pg. 27-30.
Ceccheni, S., (2006): "\\7har is Inflation targeting", Financial Times, U.K
Cecchetti, S. and Kim (2004): Inflation targeting, price-path Targeting, and output Variability", NBER working paper Series, No.9672.
Ediwrial (2014): "Inflation Targeting: A Controversial Shift", Economic & Political \Veekly, Vol. XLIX, No.6.
Freedman, C. and D. Laxton (2009 a): "V\lhy Inflation targering?" IMF\Vorking paper.\VP/09/86.
Friedman, M. (1968) : "The Role Of Monetary Policy", American Economic Review, March.
Friedman, M.(1977) : "Noble Lecture: Inflation And Unemployment", Journal of Political Economy, June.
Isard, P., D. Laxton and A. Eliasson (2001): "Inflation Targeting with NA1RU Uncertainty and endogenous Policy credibility", Journalof Economic Dynamics and Control, Vol. 25.
Jha, R. (2008): "Inflation targeting in India: Issues and Prospects", International Review of Applied Economics, Vo1.22, No.2, pp. 259-270.
Kalecki, Michal (1969) : TheoI)' of Economic Dynamics (New York: Augustus M. Kelley)
Kohli, Renu (2015): "Inflation Targeting as policy Option for India", Economic & Political Vleekly, Vol. L, No.3, pg. 10-14.
Lucas, R. E. and T.J. Sargent (1978): "After Keynesian Macroeconomics", in After the Phillips Curve: Persistence of High Inflation andHigh Unemployment (Boston: fedral Reserve Bank of Boston.
Lucas, R. E. and T.J. Sargent (1981): "Rationale Expectation and Econometric Practices (Minneapolis: University of Minnesota Press.
Mahajan Saakshi, Souvik Kumar Saha and Charan Singh (2014): "Inflation Targeting In India", working paper No. 449, lIM, Bangalore.
Mohan, R. (2007a): "India's financial scctor Reforms- fostering growth while containing risk", RBI Deputy Governor address at YaleUniversity.
Mohamy, Deepak (2013): "Efficacy of Monetary policy Rules In India", Speech delivered at Dehli School of Economics, Dehli,25.03.2013.
Rajan, R. (2013), "Statement on taking Office on September, 4, 2013, Reserve Bank of India.
Rohit (2014): "Rajan's target: Inflation or the Poor", Economic & political \Veekly, VoL .. XLIX, No. 13, Pg.9
Reserve Bank Of India (2000): "Report of The Advisor Group Of transparency In Monetary and Financial Policies (Chairman:Narasimham, M )"
Reserve bank Of India(2014): " Report of the Expert Committee to Revise and Strengthen the Monetary Policy Framework"(Chairman: Dr. Urjit patel)
Sheel, AJok (2016): "Monetary Policy Dilemmas at The Current Juncture", Economic & political \Veekly, Vol. LI, No.12 pg. 46-55.
Sherry, S.L.(2013): Rajan's monetary policy foray: Pursuit of Low inflation" Economic & political \Veekly, voI.XLVIII, No. 43,pg. 18-22.
DOD
Aim & ScopeArthavati is a peer-reviewed, bi-annually and fully refereed journal focusing on rheories, merhods andapplications in Economics. It is an International research journal that aims to contribute to the constantresearch and training, so as to promote research in rhe field of Economics. The journal covers all areas ofEconomics and relared fields in India and abroad.
Call for PapersThe Journal welcomes rhe submission of manuscriprs rhat meet the general criteria of significance andscientific excellence. For this purpose we would like to ask you to contribute your excellent papers inEconomics and its related fields. You can submit your manuscript to, [email protected],[email protected]. I hope you find rhis journal informative and useful. It is a new initiative. Yourcomments will help us to improve the quality and content of the journal. Last Date for Submission ofManuscript for next Issue: 25th March, 2017.
Review Process
We publish original research papers, review articles and technical notes based on Economics and itsapplications. The journal reviews papers within four weeks of submission and publishes accepted articles uponreceiving the final versions. Our fast reviewing process is our strength. \Ve accept only those manuscriptswhich are recommended by at least two reviewers. All submitted papers have to go through at least two blindpeer reviews.
Send your article/ feedback! subscription request to:
Prof. Suman PamechaEditor-in-chief-Arthavati
Manikya Lal Verma Shramjeevi College, UdaipurE-mail: [email protected]@gmail.com
Subscription Details
A bi-annual, Refereed Journal of Department of Economics, J.R.N. Rajasthan Vidyapeeth (Deemed)University, Udaipur (Raj.) India. Universities, Educational Institutions & Corporates may subscribe theJournal by sending the duly filled subscription form with required charges, given at the end of the Journal.Universities/ Institutions desiring to exchange their Journal with Arthavati an International Journal arerequired to send a copy of their Journal to the Department of Economics, J.R.N. Rajasthan Vidyapeeth(Deemed) University, Udaipur - 313001. We will be sending a copy of our Journal to such institutions inexchange without any subscription charges.
Subscription Rates
Subscription India Abroad
Annual Rs.500 US $60
Three Year Rs.1000 US $120
Five Year Rs.2000 US $240
Guidelines For Author(s)
Given below are some guidelines for Authors who wish ro contribute ro Arrhavari an International Journal.
Articles submitted for consideration for publication should be original and nor published anywhere earlier along
with the required fee which will be non-refundable. All papers submitted ro 'Arthavati' go through a
preliminary review at the edirorial desk and those considered appropriate are sent to reviewers. On the
recommendation of the reviewers, the papers/research articles may be accepted, modified or rejected.
1. The paper should be about 10-15 pages in Times New Roman font, size 12, single line-spacing with one
inch margin on all sides A-4 size paper.
2. One hard copy of the article duly signed by all the authors should be submitted followed by a soft copy
of MS word of the same through e-mail [email protected];[email protected].
3. The covet page of the article should contain: (i) Title of the article (in bold), (ii) Name of the author(s),
(iii) Professional affiliation, (vi) Addtess of correspondence (both official and residential) Email and
landline & mobile numbers of all the authors. Kindly note the authors name should not be mentioned in
any other page.
4. The second page should contain (i) title of the article (Time New Romans 16, in bold, (ii) an abstract of
the paper in about 150 words (Times Roman 12 - point rype, single line spacing, in italics) that clearly
includes the Purpose, Research Design/Methodology/Approach, Findings, Research
limitations/Implications, Practical Implications, OriginalityNalue. (iii) Keywords should be provided
which encapsulate the principal ropics of the paper. (3-5 key words).
5. A separate list of references should be provided at the end of the article and arranged alphabetically.
6. Footnotes may be provided on the same page, if any technical term needs to be explained.
7. All the figures/tables/graphs should be provided on separate pages with reference no., as mentioned in
the article.
8. The author(s) should give declaration separately along with the manuscript.
9. Acceptance and publication of articles is subject to the guidelines. Once article is sent for review, it will
not be returned to the author, even if not accepted for publication.
10. The author(s) will receive complimentary copy of the issue in which the article is published.
11. All the authors will have to pay Rs. 1000/- (Rupees One Thousand Only) by cash or cheque/D.D. payable
to the Chief Editor, Arthavati, Department of Economics, Udaipur towards processing & reviewed fees.
12. All the editorial correspondence including manuscript & declaration to be sent at the following address.
Prof. Suman Pamecha
Editor in Chief, i\rthavati an International Journal
Manikya Lal Verma Shramjeevi College, Udaipur (Raj.) India
E-mail:[email protected]@gmail.com
Signature with Date
Subscription Order Form
Please accept the cash or enclosed cheque/demand draft No Dated .Drawn on Bank favoring Arthavati, Department of Economics, Udaipur (Raj.) India forRs US$ towards subscription of Arthavati : An International Journal, Payable atUdaipur, for annualrrhree Years/Five Years
Name .Organization .Mailing Address .City Pin/zip Country .EmaiL Phone .Mobile Fax .
Mail to
The Editorial BoardArthavati an International JournalDepartment of EconomicsJ.R.N. Rajasthan Vidyapeeth (Deemed) University, Udaipur- 313001, IndiaEmail: [email protected]@gmail.com; Phone :-(0) 0294-2413029, (M) 9829160606
Declaration
\\Te submit the following paper for consideration in a forthcoming issue of Anhavati An International Journal ofEconomics.
Title of the paper: _
\\'e agree and declare that:
a)I
b)
c)
g)
The paper is original, unpublished, not presented in a conference ending with a printed publication of proceeding;papers and the same is not simultaneously submitted to any journal or publisher.
It will not be submitted anyvvhere else during the pendency of the publication of issue.
There is proper acknowledgement of sources wherever tables, graphs, figures, sketches and printed material used inthe text of the paper.
The paper shall be revised/ modified on the basis of the referral comments within four weeks of the communicationfrom the Edi tOrial Board ofthe journal.
'\7e alone are responsible for the correctness of events, information and data cited in the paper.
'Ve authorize the EditOrial Board, Anhavati : An International Journal of Economics to carryout formatting, copy,editing and minor grammatical corrections.
\,Ve agree to abide with the decision of the EditOrial Board in acceptance or non-acceptance of the paper.
(l" Author) (2" Author) (3" Author)
Address: Dated: _
(Please send the completed Declaration as a hard copy and e-mail a scanned soft copy, to the Editorial Board, Arthavati anInternational Journal of Economics. Only on receipt of the Declaration, your paper will be taken up for pUblication/referralprocess.)

Janardan Rai Nagar RajasthanJanardan Rai Nagar RajasthanVidyapeeth (Deemed) UniversityVidyapeeth (Deemed) University
Udaipur (Raj.)Udaipur (Raj.)
Janardan Rai Nagar RajasthanVidyapeeth (Deemed) University
Udaipur (Raj.)