Embed Size (px)
Citation preview
JNCC Report No: 441
A Conservation Framework for Hen Harriers in the United Kingdom
Alan Fielding, Paul Haworth, Phil Whitfield, David McLeod and Helen Riley
February 2011
© JNCC, Peterborough 2011
ISSN 0963 8901
For further information please contact: Joint Nature Conservation Committee Monkstone House City Road Peterborough PE1 1JY This report should be cited as: Fielding, A., Haworth, P., Whitfield, P., McLeod, D. & Riley, H. 2011. A Conservation Framework for Hen Harriers in the United Kingdom. JNCC Report 441. Joint Nature Conservation Committee, Peterborough.
Summary Background 1. The hen harrier Circus cyaneus is listed on Annex 1 of the EC Birds Directive
(2009/147/EC) because it is considered vulnerable within Europe, and is included on the red-list of birds of conservation concern in the UK. The UK Government has identified it as a high priority species in terms of combating wildlife crime.
2. Concerns about the plight of hen harriers and the hen harrier conservation-grouse
moor management conflict have led to strenuous efforts to protect harriers more effectively and to resolve the conflict. Current activities include the Langholm Moor Demonstration Project, the Natural England-led Environment Council dispute resolution process, various collaborative research projects (e.g. Redpath et al. 2010) and some Partnership for Action Against Wildlife Crime (PAW) initiatives (at the UK and country levels). All of these activities benefit from an underlying evidence base on the constraints acting on hen harriers, as well as the interactions between harriers, grouse and their habitats.
3. An effective conservation strategy for uncommon and widely distributed species, such
as the hen harrier, needs to have four components: • species protection; • site protection; • conservation and management practices at a site level; and • conservation and management in the wider countryside (i.e. outside protected
sites).
4. The hen harrier conservation framework has two elements: • Modelling targets for favourable status based on criteria of abundance,
demography and distribution, and an assessment of whether these targets are being met; and
• Consideration of constraints identified to be acting on hen harrier populations, regionally and nationally, and an assessment of policies influencing these.
This approach builds on that adopted in the golden eagle conservation framework report (SNH Commissioned Report No. 193 – Whitfield et al. 2008a).
5. Models were developed to predict a range of potential distributions of hen harriers; these incorporated habitat, topography, climate and golden eagle presence, but not persecution, fox presence or harrier food supply. These were then compared against the known distribution so that regions which remain unoccupied despite the availability of suitable habitat could be identified. Population growth models were developed to better understand when, in the harriers’ life-cycle, constraints are possibly having the most impact; these did not include the effects of dispersal between areas. The population models were used to identify regions in which population growth appears restricted by either survival rates or reproductive output. Finally, three tests were developed to determine if the hen harrier populations in particular regions are in a favourable status.
6. Scotland is the UK stronghold for hen harriers and is the area for which most data are
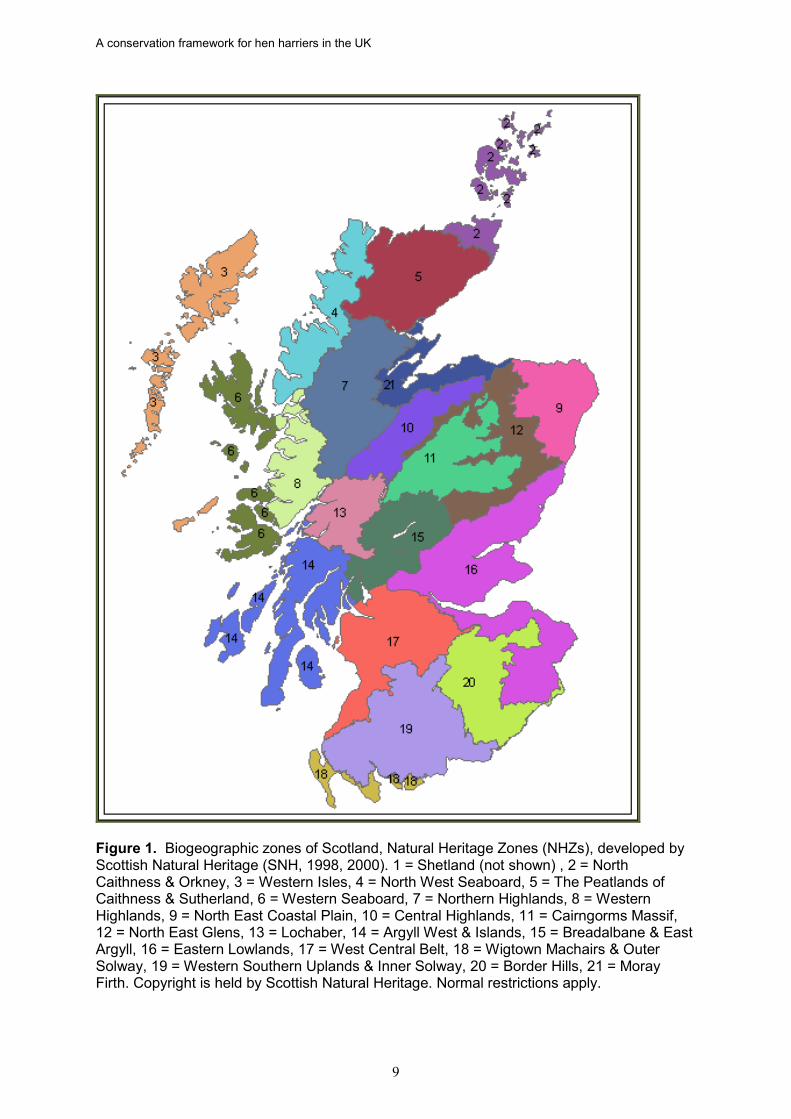
available; the analyses in this report focus on Scotland’s population. Regional analyses are based on Natural Heritage Zones (NHZs): 21 biogeographical regions (based on the distribution of landform, plants and animals) of Scotland as identified by
A conservation framework for hen harriers in the UK
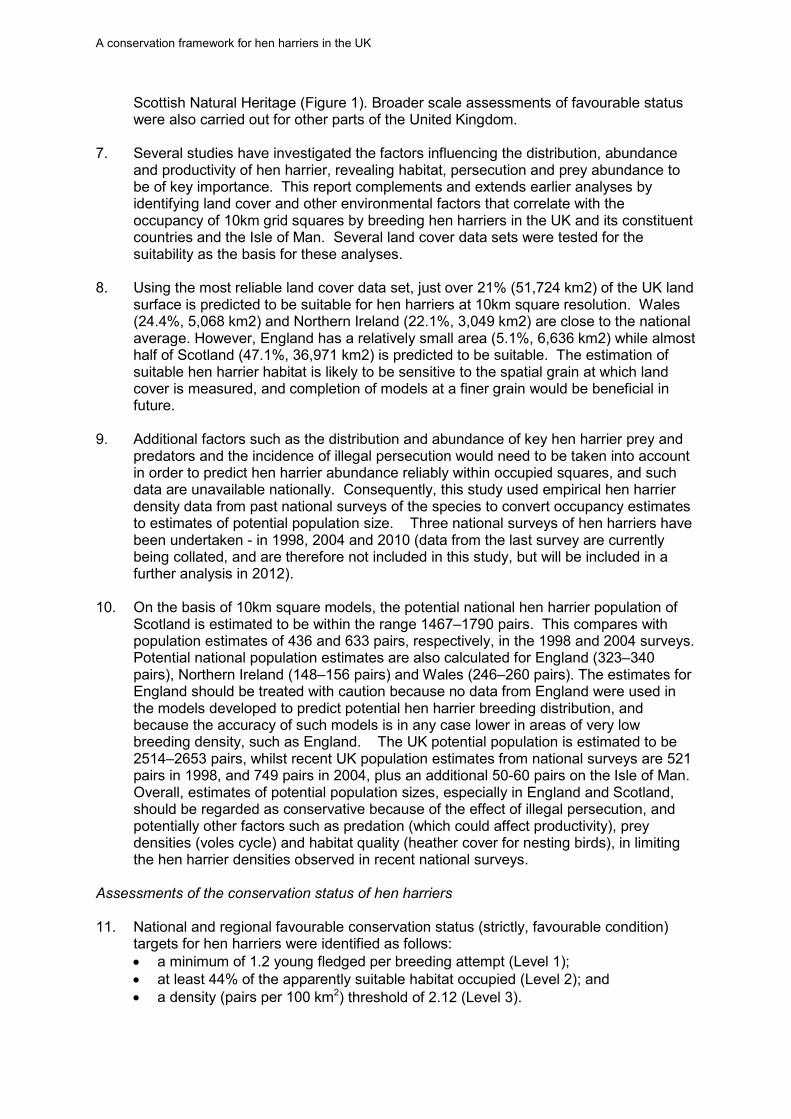
Scottish Natural Heritage (Figure 1). Broader scale assessments of favourable status were also carried out for other parts of the United Kingdom.
7. Several studies have investigated the factors influencing the distribution, abundance
and productivity of hen harrier, revealing habitat, persecution and prey abundance to be of key importance. This report complements and extends earlier analyses by identifying land cover and other environmental factors that correlate with the occupancy of 10km grid squares by breeding hen harriers in the UK and its constituent countries and the Isle of Man. Several land cover data sets were tested for the suitability as the basis for these analyses.
8. Using the most reliable land cover data set, just over 21% (51,724 km2) of the UK land
surface is predicted to be suitable for hen harriers at 10km square resolution. Wales (24.4%, 5,068 km2) and Northern Ireland (22.1%, 3,049 km2) are close to the national average. However, England has a relatively small area (5.1%, 6,636 km2) while almost half of Scotland (47.1%, 36,971 km2) is predicted to be suitable. The estimation of suitable hen harrier habitat is likely to be sensitive to the spatial grain at which land cover is measured, and completion of models at a finer grain would be beneficial in future.
9. Additional factors such as the distribution and abundance of key hen harrier prey and
predators and the incidence of illegal persecution would need to be taken into account in order to predict hen harrier abundance reliably within occupied squares, and such data are unavailable nationally. Consequently, this study used empirical hen harrier density data from past national surveys of the species to convert occupancy estimates to estimates of potential population size. Three national surveys of hen harriers have been undertaken - in 1998, 2004 and 2010 (data from the last survey are currently being collated, and are therefore not included in this study, but will be included in a further analysis in 2012).
10. On the basis of 10km square models, the potential national hen harrier population of
Scotland is estimated to be within the range 1467–1790 pairs. This compares with population estimates of 436 and 633 pairs, respectively, in the 1998 and 2004 surveys. Potential national population estimates are also calculated for England (323–340 pairs), Northern Ireland (148–156 pairs) and Wales (246–260 pairs). The estimates for England should be treated with caution because no data from England were used in the models developed to predict potential hen harrier breeding distribution, and because the accuracy of such models is in any case lower in areas of very low breeding density, such as England. The UK potential population is estimated to be 2514–2653 pairs, whilst recent UK population estimates from national surveys are 521 pairs in 1998, and 749 pairs in 2004, plus an additional 50-60 pairs on the Isle of Man. Overall, estimates of potential population sizes, especially in England and Scotland, should be regarded as conservative because of the effect of illegal persecution, and potentially other factors such as predation (which could affect productivity), prey densities (voles cycle) and habitat quality (heather cover for nesting birds), in limiting the hen harrier densities observed in recent national surveys.
Assessments of the conservation status of hen harriers 11. National and regional favourable conservation status (strictly, favourable condition)
targets for hen harriers were identified as follows: • a minimum of 1.2 young fledged per breeding attempt (Level 1); • at least 44% of the apparently suitable habitat occupied (Level 2); and • a density (pairs per 100 km2) threshold of 2.12 (Level 3).

A conservation framework for hen harriers in the UK
The first target is based on the minimum criteria for population growth identified by population modelling, while the Level 2 and 3 targets are informed scientific judgements derived from empirical data. The density target replaces the population size criterion used for golden eagles in the conservation framework report. A concluding section provides a UK and country overview of these targets.
12. In Scotland, only five out of 20 NHZs passed all three tests: Argyll West and Islands, the West Central Belt, the Western Isles, the Western Seaboard, and Breadalbane and East Argyll. Three of the NHZs deemed to be at favourable status for hen harriers were also identified as at favourable status for golden eagles: Argyll West and Islands, Western Isles, and the Western Seaboard (Whitfield et al. 2008a).
13. England and Wales both failed to achieve favourable status. However, recent data
suggests that the Welsh population is currently recovering and may achieve a favourable status in the medium term. The overall productivity for the English population 2002–2008, 1.6 young per breeding attempt, is well above the threshold for population expansion as identified by the population modelling. It seems likely that the English population is being constrained by poor juvenile and/or adult survival.
14. The status for Northern Ireland is unclear but the rapid expansion reported in the 2004
national survey suggests that its population is, or will soon be, at a favourable status. 15. The favourable status of the population on the Isle of Man is testimony to the speed
with which a large harrier population can become established when conditions are suitable (absence of persecution and predation by foxes). There is no evidence of hen harriers breeding on the Isle of Man before 1977; by 2004 there were approximately 50 breeding pairs, despite the absence of voles, although in recent years the population has declined to about 30 pairs.
Assessing constraints acting on hen harriers at national and regional levels and their influences on conservation status 16. The final part of the report considers, in turn, a range of constraints acting on hen
harriers: agriculture, grazing, persecution, predation, the prey base, weather/climate change, wind farms, and woodland. Two main constraints were identified: persecution, and, in one Scottish region, prey shortages. Other constraints associated with the availability of nesting/ foraging habitat, and predation pressures may also be locally important.
17. Based on data from the RSPB wildlife crime investigations database, the density of
hen harrier persecution incidents (recorded as confirmed and/or probable persecution) in Scotland is directly proportional to the percentage of a NHZ classed as muirburn (a surrogate for the distribution of grouse moor). There was also a significant negative relationship between the density of hen harrier persecution incidents and the proportion of successful nests in an NHZ.
18. In Scotland, there is strong evidence in five NHZs that illegal persecution is causing
the failure of a majority of breeding attempts, leading to reduced occupancy and/or fewer successful nests. These are Central Highlands, Cairngorm Massif, Northeast Glens, Western Southern Uplands and Inner Solway, and Border Hills. If this persecution was halted or significantly reduced, more NHZs would achieve a favourable status, as would Scotland as a whole given the size of these populations.

A conservation framework for hen harriers in the UK
19. The failure of the North Caithness and Orkney NHZ to achieve a favourable status appears to be related to food limitation during the early breeding season. This has been well researched and appears to be related to differences in prey abundance and the high frequency of polygyny among hen harriers on Orkney (persecution is evidently absent, and there are no foxes). The existence of a relationship between grazing intensity and harrier breeding success suggests that it may be possible to use habitat management to improve harrier productivity. Management measures were instigated in 2002 to encourage farmers to reduce sheep numbers in areas where harriers can forage. It has been suggested that even a relatively small uptake of this scheme by farmers should benefit the harrier population and bring it into a favourable conservation status.
20. There was circumstantial evidence that a shortage of foraging and/or nesting habitat
may be a constraint in two NHZ: the Peatlands of Caithness and Sutherland, and the Northern Highlands. However, there is currently insufficient information to confirm the importance of this constraint or to recommend remedial actions.
21. Wales and Northern Ireland appear to be on track to achieve favourable status.
However, England is unlikely to achieve this unless illegal persecution is considerably reduced. The productivity estimates of successful pairs in England, and observed changes in the Isle of Man population, suggest that recovery could be rapid.
Further work 22. There is considerable scope to develop the work in this report. Once the 2010 national
survey is published the analyses underling this report will be developed. Further national datasets on habitat suitability, fox and other predator numbers, and confirmed persecution records will be examined, and where possible incorporated to strengthen further analytical work.
23. The results contained in this report are used to support casework advice given by
country agency staff. The report also helps the agencies in developing policy advice regarding conservation and management. Important activities are underway to address the hen harrier-grouse moor conflict, which should benefit from the evidence base given here.
Authors’ Acknowledgements We are very grateful for the support from Scottish Natural Heritage (SNH), the Scottish Raptor Study Groups and other members of the Scottish Raptor Monitoring Group. The RSPB, SNH and Brian Etheridge provided the hen harrier data, without which this framework could not have been produced. We thank all field workers who provided data to these organizations. Ian Thomson (RSPB) provided us with an excellent database of hen harrier persecution data. The CORINE for land cover 2000 (CLC2000) data was produced by the European Environment Agency (EEA) and its member countries in the European environment information and observation network (Eionet). The SRTM DEM data was obtained from the Global Land Cover Facility (GLCFhttp://www.landcover.org/). We particularly thank the following for detailed comments on drafts of this report: two members of the SNH Scientific Advisory Committee, Professor Bob Furness and Dr Malcolm Ogilvie, members of the Scottish Raptor Monitoring Group, in particular Dr Arjun Amar, Patrick Stirling-Aird, Professor Jeremy Wilson, Dr Chris Wernham, David Stroud and Professor Des Thompson, Dr Nicholas Aebischer, Dr Adam Smith and Teresa Dent of the GWCT, and Dr Colin Shedden of BASC. Alan Fielding1, Paul Haworth2, Phil Whitfield3, David McLeod4 and Helen Riley5 1 BCHS, Manchester Metropolitan University, Manchester M1 5GD 2 Haworth Conservation, Bendoran Cottage, Bunessan, Mull PA67 6DU 3 Natural Research Ltd, Banchory Business Centre, Burn O’Bennie Road, Banchory, Aberdeenshire AB31 5ZU 4 14 Crailinghall Cottages, Jedburgh TD8 6LU 5 15 2F2 Royal Park Terrace, Edinburgh EH8 8JB
A conservation framework for hen harriers in the UK
Contents 1 Introduction .................................................................................................................... 1 2 A conservation framework for the hen harrier: methods and analyses ............................ 3 3 Regional analyses of hen harrier populations in Scotland .............................................. 7 4 Population modelling: identifying minimum measures for productivity and survival ....... 13 5 Mapping the potential distribution of hen harriers ......................................................... 19 6 Estimating the potential abundance of hen harriers by extrapolation of density measures
to the extent of potentially suitable habitat .................................................................... 38 7 Assessing the national and regional conservation status of hen harriers against
favourable conservation status ..................................................................................... 41 8 Assessing constraints acting on hen harriers at national and regional levels and their
influence on conservation status .................................................................................. 49 9 Constraints on the favourable conservation status of hen harrier in Scotland ............... 64 10 References ................................................................................................................... 74
A conservation framework for hen harriers in the UK
1
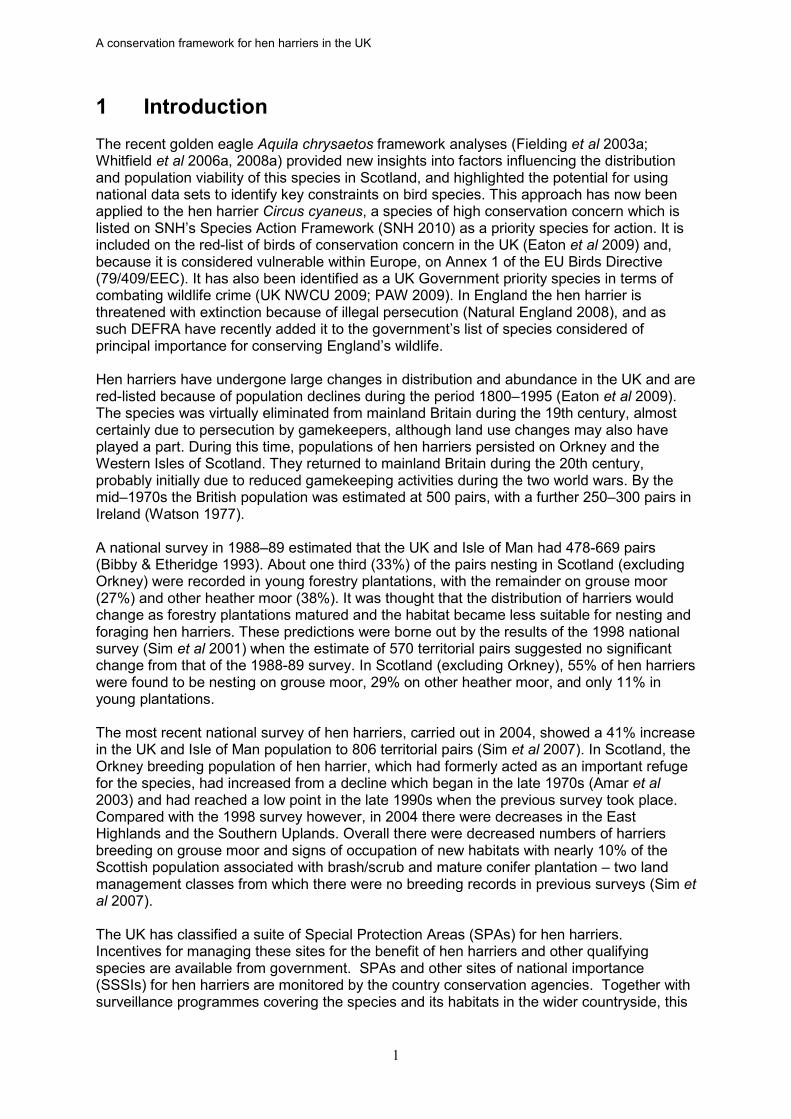
1 Introduction The recent golden eagle Aquila chrysaetos framework analyses (Fielding et al 2003a; Whitfield et al 2006a, 2008a) provided new insights into factors influencing the distribution and population viability of this species in Scotland, and highlighted the potential for using national data sets to identify key constraints on bird species. This approach has now been applied to the hen harrier Circus cyaneus, a species of high conservation concern which is listed on SNH’s Species Action Framework (SNH 2010) as a priority species for action. It is included on the red-list of birds of conservation concern in the UK (Eaton et al 2009) and, because it is considered vulnerable within Europe, on Annex 1 of the EU Birds Directive (79/409/EEC). It has also been identified as a UK Government priority species in terms of combating wildlife crime (UK NWCU 2009; PAW 2009). In England the hen harrier is threatened with extinction because of illegal persecution (Natural England 2008), and as such DEFRA have recently added it to the government’s list of species considered of principal importance for conserving England’s wildlife. Hen harriers have undergone large changes in distribution and abundance in the UK and are red-listed because of population declines during the period 1800–1995 (Eaton et al 2009). The species was virtually eliminated from mainland Britain during the 19th century, almost certainly due to persecution by gamekeepers, although land use changes may also have played a part. During this time, populations of hen harriers persisted on Orkney and the Western Isles of Scotland. They returned to mainland Britain during the 20th century, probably initially due to reduced gamekeeping activities during the two world wars. By the mid–1970s the British population was estimated at 500 pairs, with a further 250–300 pairs in Ireland (Watson 1977). A national survey in 1988–89 estimated that the UK and Isle of Man had 478-669 pairs (Bibby & Etheridge 1993). About one third (33%) of the pairs nesting in Scotland (excluding Orkney) were recorded in young forestry plantations, with the remainder on grouse moor (27%) and other heather moor (38%). It was thought that the distribution of harriers would change as forestry plantations matured and the habitat became less suitable for nesting and foraging hen harriers. These predictions were borne out by the results of the 1998 national survey (Sim et al 2001) when the estimate of 570 territorial pairs suggested no significant change from that of the 1988-89 survey. In Scotland (excluding Orkney), 55% of hen harriers were found to be nesting on grouse moor, 29% on other heather moor, and only 11% in young plantations. The most recent national survey of hen harriers, carried out in 2004, showed a 41% increase in the UK and Isle of Man population to 806 territorial pairs (Sim et al 2007). In Scotland, the Orkney breeding population of hen harrier, which had formerly acted as an important refuge for the species, had increased from a decline which began in the late 1970s (Amar et al 2003) and had reached a low point in the late 1990s when the previous survey took place. Compared with the 1998 survey however, in 2004 there were decreases in the East Highlands and the Southern Uplands. Overall there were decreased numbers of harriers breeding on grouse moor and signs of occupation of new habitats with nearly 10% of the Scottish population associated with brash/scrub and mature conifer plantation – two land management classes from which there were no breeding records in previous surveys (Sim et al 2007). The UK has classified a suite of Special Protection Areas (SPAs) for hen harriers. Incentives for managing these sites for the benefit of hen harriers and other qualifying species are available from government. SPAs and other sites of national importance (SSSIs) for hen harriers are monitored by the country conservation agencies. Together with surveillance programmes covering the species and its habitats in the wider countryside, this
A conservation framework for hen harriers in the UK
2
enables government to report to the EU on the fulfilment of its obligations under the Birds Directive “to ensure their survival and reproduction in their area of distribution”. Such national reporting enables the EU to assess the status of the species at European scale. In this report we will refer to favourable conservation and favourable condition targets, with Section 7 providing the context for this. Several studies have investigated the factors influencing the distribution, abundance and productivity of hen harrier. These studies have implicated a number of factors including principally: habitat change (Redpath et al 1998, Arroyo et al 2006, Amar et al 2008); persecution (Etheridge et al 1997; Summers et al 2003, Whitfield et al 2008b, Anderson et al 2009, Redpath et al 2010) and prey abundance (Redpath & Thirgood 1997, Amar et al 2003). The conflict between hen harrier conservation and grouse moor management has been highlighted by a number of key publications, with the UK Raptor Working Group (Anon 2000) providing a definitive overview on management and legal matters. Recently, some important reviews have quantified the magnitude of hen harrier persecution. For example, Redpath et al. (2010) found that there were records of only 5 successful hen harrier nests on the estimated 3,696 km2 of driven grouse moors in the UK in 2008; an area of habitat estimated to have the potential to support about 500 pairs. There are some important on-going activities to address the conflict. The Langholm Moor Demonstration Project in south Scotland is exploring whether economically viable driven grouse shooting and hen harriers can co-exist. The Project, run by SNH, Buccleuch Estates, Game and Wildlife Conservation Trust (GWCT), Royal Society for the Protection of Birds (RSPB) and Natural England, is trialling diversionary feeding of hen harriers (to divert them from grouse in the breeding season). It is putting in place significant improvements in land management practices (including muirburn, predator control and livestock reductions), and has a well defined programme of scientific monitoring (Langholm Moor Demonstration Project 2011). This Project was borne out of discussions within Scotland’s Moorland Forum, which is addressing wider issues concerning the sustainable management of the uplands in Scotland (Scotland’s Moorland Forum 2011). Natural England in conjunction with the Environment Council is leading a conflict resolution process to tackle persecution of hen harriers in England (but with a reach to Scotland). The Environment Council, an independent body with experience in conflict resolution, is mediating discussions between interested parties in this conflict, and many supporting papers have been produced as part of this (Environment Council 2011). Some scientific studies have been published recently on the conflict, with Redpath et al. (2010) providing an overview of the current evidence base and options for addressing the conflict. This framework presented here complements and extends earlier analyses of national hen harrier datasets by looking for environmental factors that correlate with or are otherwise associated with the distribution of breeding hen harriers in the UK, and at a regional scale within Scotland. A national survey of hen harriers was undertaken in 2010, and is likely to report towards the end of 2011 or early 2012; a further revision to the framework will be made on publication of that survey.
A conservation framework for hen harriers in the UK
3
2 A conservation framework for the hen harrier: methods and analyses
An effective conservation strategy for uncommon and widely distributed species, such as the hen harrier, needs to have four components:
• species protection; • site protection; • conservation and management practices at a site level; and • conservation and management in the wider countryside (i.e. outside protected
sites). Essentially, the proposed conservation framework has two elements: • Set targets for favourable conservation status based on criteria of abundance,
demography and distribution, and assess whether these targets are being met; and • Identify those constraints acting on the population(s), assess their regional influence
on favourable conservation status, and use these assessments to implement policies targeted at influential constraints.
In order to achieve these aims it was necessary to develop methods that could predict the potential distribution of hen harriers and then compare this against the actual distribution so that any unoccupied regions could be identified. It was also necessary to develop population growth models to better understand when, in the harriers’ life-cycle, constraints were likely to have most impact. The population models were also used to identify regions in which population growth appeared restricted by either survival rates or reproductive output. Finally, three tests were designed, based on those developed for the golden eagle (Whitfield et al 2008a), to determine if the hen harrier populations in particular regions were in a favourable conservation state. The analyses focus on the Scottish population of hen harrier, as this is the area for which most data were available. The regions used for this analysis were Natural Heritage Zones (NHZs): biogeographical regions (based on the distribution of land form, plants and animals) of Scotland as identified by Scottish Natural Heritage (Figure 1). Broader scale assessments of favourable conservation status were also carried out for other areas of the United Kingdom. This report provides an overview of the tests made to ascertain if the hen harrier population in Scotland and elsewhere in the UK is in favourable conservation status. More information is provided in the detailed technical report (Fielding et al 2009). 2.1 Analyses The analyses involved the following steps. • Identify available datasets
: the quality of any analyses depends to a large extent on the quantity and quality of data that are available for analyses. Identifying, evaluating and cleaning (removing obvious errors) suitable datasets was very time consuming but essential.
• Devise appropriate regions: For Scotland, we used biogeographic regions, the Natural Heritage Zones (NHZs; Usher & Balharry 1996; SNH 2002), because it enables comparability with other conservation frameworks for the golden eagle (Whitfield et al 2006, 2008a) and peregrine falcon Falco peregrinus (Humphreys et al
A conservation framework for hen harriers in the UK
4
2006). At this stage we have not evaluated any requirements for subdivision in some areas (e.g. separating the larger Hebridean and Northern islands from the mainland and each other) and combining of areas on the mainland. Elsewhere in the UK, we have not broken down the results beyond the country, largely because we did not have adequate regional data.
• Develop minimum population measures
: combinations of survival and productivity that together provide the required level of population stability. Key demographic parameters were identified using population modelling and existing studies, in particular the RSPB wing tagging project (Etheridge et al 2007), and wing tagging studies in England and Wales.
• Estimate the potential distribution of harriers based on potentially suitable habitat
: initial exploratory analyses suggested that this would be feasible and provide a basis for comparison with the results of a separate analysis (Anderson et al 2009).
• Estimate the potential abundance of harriers by extrapolation of density measures to the extent of potentially suitable habitat
: we used a range of methods to estimate local and national population sizes based on survey densities and estimates of the amount of potential hen harrier habitat.
• Assess current distribution and abundance of hen harriers in relation to their potential distribution and abundance
: this section uses data from all of the previous sections to identify, as far as possible, the occupancy levels of potential hen harrier habitat and then highlight regions where we think that the current populations are significantly lower than they could be.
• Assess the national and regional conservation status of hen harriers against favourable conservation status
: once we had the results from the previous analyses we were able to establish criteria that defined favourable status and then apply them to different regions and countries.
• Assess constraints acting on hen harriers at national and regional levels and their influence on conservation status
: using previous results, plus persecution data, we assessed the probable and possible constraints for each Scottish region.
2.1.1 Datasets (i) Hen harrier We used a very comprehensive, if regionally biased, data set that recorded actual or potential breeding attempts. We had data for Scottish hen harriers from the national surveys in 1988 (n = 722), 1989 (n = 510), 1998 (n = 514) and 2004 (n = 674 plus 46 records for 2005) plus data from surveys of hen harriers commissioned by SNH for the purposes of SPA selection (n = 2817). Information on the RSPB hen harrier ‘wing-tagging’ project 1988–1995 (n = 1554) was also made available, along with limited information from England (n = 12, year = 1998), Wales (n = 25 from 1998 and n= 21 from 2004) and other Scottish surveys funded by SNH in 2006. (ii) Environmental The quality of our models is dependent on the quality of the data used to build the models. Consequently, we spent a considerable amount of time assessing different data sets,
A conservation framework for hen harriers in the UK
5
particularly those providing information on habitat types. Inevitably this means that we had to make some pragmatic decisions and it is never possible to obtain data of the optimal quality. Our analyses require national habitat (landcover) data and three sources were investigated: the Land Cover of Scotland1988 (LCS88, Macaulay Land Use Research Institute 1998); the UK Land Cover Map 2000 (LCM2000, Fuller et al 2002) and a European database established as part of a programme to Co-ordinate Information on the Environment (CORINE 2006). The LCS88 data were created by manual interpretation of air photographs while LCM2000 was a semi-automated interpretation of satellite imagery. CORINE data for the UK is effectively a generalized version of LCM2000 data. When assessing data quality we needed to determine the 'fitness for use' and 'limitations of use'. This was a complex task, requiring a clear definition of the end use of the data and acceptable tolerance, coupled with an understanding of the quality of a dataset and other datasets being used. We considered factors such as attribute quality (descriptive information of data, e.g. the habitat class of a pixel in an image) and spatial resolution and accuracy (resolution is the minimum size feature that can be resolved and digitised while accuracy is the difference between mapped features, and their 'real' shape and position). Normally, data at a 1:25000 scale should have an error of 5m or less (often 10m or less), but might occasionally range up to 25m. This means that it is reasonable to expect a minimum polygon area (a discrete plot of land) of 1-2ha. Any land cover type which has features that are frequently smaller than the minimum resolution, for example ponds, might be under-represented by that dataset. We found LCS88 to be a robust dataset but its restriction to Scotland prevented its use for UK-wide modelling. We were unhappy with several features in the LCM2000 data and did not feel that we could use it without considerable user intervention and further processing. CORINE is a pan-European land cover dataset created by interpretation of satellite data. CORINE data have three nested levels of attribute coding, the most detailed (Level 3) using 44 classes, of which 35 are present in the UK. We were concerned that CORINE has no burnt area classification (a surrogate for muirburn). CORINE has a 1:100000 scale (and a target mapping accuracy of at least 100m) leading to a 25 ha minimum mapping unit. One consequence of this minimum resolution is the loss of some land covers with a bias to a polygon size below 25ha (e.g. examining LCS88 showed broadleaved woodland would be poorly represented by a 25ha minimum resolution). Despite these concerns we deemed CORINE to be most appropriate for our purpose. Although the data are relatively coarse, in both resolution and habitat descriptions, we considered that they are adequate to describe the areas of habitats within 10km x 10km squares. Altitude and slope data were obtained, for the UK and Ireland, from a 50 DEM (Digital Elevation Model) derived from a SRTM data set (Shuttle Radar Topography Mission, Global Land Cover Facility 2010). These data provide, after processing, an estimate of the mean area and slope within a parcel of land (a pixel) that is 50 x 50 m on the ground. We used the amount of variation (standard deviations) of these values within each 10 x 10 km square as measures of topographic complexity. The number of pixels was used as a measure of the land area in each sample square. This is particularly important around the coast where a 10 x 10 km grid square may contain very little land. Oceanicity (the degree to which climate is influenced by the sea) scores (mean, median, minimum, maximum and standard deviation) were obtained for each 10 x 10 km square by interpolating climate data from 64 British and Irish locations. The data were obtained from national meteorological data sets (Met Office 2010; Irish Meteorological Service Online 2010).
A conservation framework for hen harriers in the UK
6
There are several studies which demonstrate that larger species, such as the golden eagle, can restrict the distribution of some smaller raptors (Fielding et al 2003b, Sergio et al 2003, 2004). It is now also recognized that excluding such information from models that predict species distributions can produce misleading results. Given the proximity of many hen harrier sites to golden eagle ranges, and field evidence that hen harriers can be taken as prey by golden eagles, we considered that it was worth exploring the potential effect of golden eagle distribution on hen harrier distribution. Unlike foxes Vulpes vulpes (see below) we had access to relatively good data using a map produced from the 2003 golden eagle census as part of the work reported in the golden eagle framework analyses (Whitfield et al 2008a). In some regions foxes are thought to be an important predator of young harriers and could potentially be an important predictor of breeding success. It is less clear if they will have a sufficiently large effect that they prevent breeding attempts in a region. Also, apart from some of the islands there are insufficient reliable data on the distribution and abundance of foxes to make them a reliable predictor. Furthermore, nest success of hen harriers within a particular land management class was not found to be significantly different inside and outside the range of the fox in Scotland (Green & Etheridge 1999). Finally, it is unclear what impacts other ground predators may have on harrier breeding success, such as the polecat-ferret Mustela putorius furo, which is thought to be a significant predator on the Isle of Man (Cullen 1991). Consequently, given the unreliable nature of the ground predator distribution data and our intention to develop a model of potential distribution and not productivity, we decided against using any data on ground predators. The effects of foxes and other predators, and the limitations of data, are discussed further in Section 8 (Constraints).
A conservation framework for hen harriers in the UK
7
3 Regional analyses of hen harrier populations in Scotland
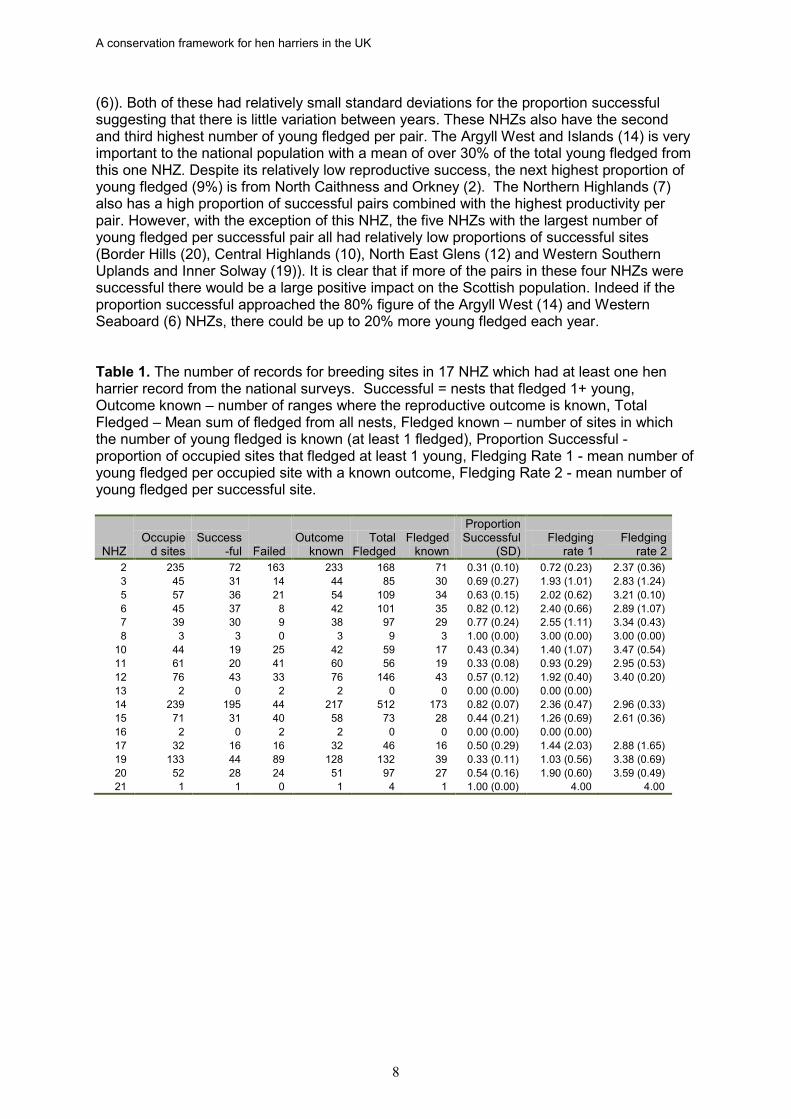
The aims of this section were to estimate simple population parameters for biogeographical regions and defined sites. Because almost 99% of the available hen harrier distribution data were from Scotland, this part of the analyses is restricted to Scottish regions and sites. 3.1 Natural Heritage Zones (NHZs) SNH has identified 21 NHZs (Figure 1) that reflect the variation in biological and landscape qualities across Scotland (Usher & Balharry 1996, SNH 2002). Hen harriers are not evenly dispersed across these zones; the majority are, as with the golden eagle, in the west. We assigned each harrier record to an NHZ based on the location provided in the data sets. Although some harriers are likely to cross NHZ boundaries whilst foraging this is not considered to be a problem for these analyses. Because we had no data for Shetland (NHZ 1) this NHZ is excluded from many, but not all, subsequent analyses. However there is little evidence that Shetland has ever supported many, if any, breeding hen harriers. The hen harrier data summarised in Table 1 were extracted from a detailed confidential appendix to Fielding et al (2009). These data are restricted to those obtained from National Surveys and exclude the more ad hoc records. There are several caveats about conclusions drawn from these summary data, particularly differences resulting from differences in the surveying effort. However, they do provide information that enables us to make qualitative comparisons. More than 50% of the 1,137 records of occupied sites are from just three NHZ (North Caithness and Orkney (NHZ 2), Argyll West and Islands (14) and the Western Southern Uplands and Inner Solway (19)). Four NHZ had less than 10 records: Western Highlands (8), Lochaber (13), Eastern Lowlands (16) and Moray Firth (21). Overall, 53.3% of the breeding attempts were successful (fledged young), although the range varied greatly across the NHZ. If the four NHZ with less than 10 records are excluded the range was from 31% (North Caithness and Orkney (2)) to 82% (Western Seaboard (6) and Argyll West and Islands (14)). Similarly there was considerable variation in the number of young fledged per pair (i.e. including those which failed to fledge any young) from 0.72 (North Caithness and Orkney (2)) to 2.55 (Northern Highlands (7)). If only successful nests are considered the fledging rate ranged from 2.37 (North Caithness and Orkney (2)) to 3.59 (Border Hills (20)). The means for Scotland as a whole were 1.49 (per breeding attempt) and 3.00 (per successful pair). The variability in the reproductive performances of the NHZs also had a wide range. For example, some NHZs, such as Argyll West and Islands (14), had little variation in the proportion of breeding attempts that were successful between years while others, such as the Central Highlands (10), showed much greater variability. Similarly, the fledging rate per breeding attempt was much less variable between years in the North Caithness and Orkney (2) than it was in the West Central Belt (17). The rank order for the variability in fledged per successful pair was similar with the Peatlands of Caithness and Sutherland (5) showing the least variation and the West Central Belt (17) again showing the greatest variability. There were no simple relationships between the population sizes (occupied, successful or failed) and the measures of reproductive success, i.e. larger populations were, on average, no more successful than smaller ones. The two NHZs with the highest proportion of successful breeding attempts are both in the west (Argyll West (14) and Western Seaboard
A conservation framework for hen harriers in the UK
8
(6)). Both of these had relatively small standard deviations for the proportion successful suggesting that there is little variation between years. These NHZs also have the second and third highest number of young fledged per pair. The Argyll West and Islands (14) is very important to the national population with a mean of over 30% of the total young fledged from this one NHZ. Despite its relatively low reproductive success, the next highest proportion of young fledged (9%) is from North Caithness and Orkney (2). The Northern Highlands (7) also has a high proportion of successful pairs combined with the highest productivity per pair. However, with the exception of this NHZ, the five NHZs with the largest number of young fledged per successful pair all had relatively low proportions of successful sites (Border Hills (20), Central Highlands (10), North East Glens (12) and Western Southern Uplands and Inner Solway (19)). It is clear that if more of the pairs in these four NHZs were successful there would be a large positive impact on the Scottish population. Indeed if the proportion successful approached the 80% figure of the Argyll West (14) and Western Seaboard (6) NHZs, there could be up to 20% more young fledged each year. Table 1. The number of records for breeding sites in 17 NHZ which had at least one hen harrier record from the national surveys. Successful = nests that fledged 1+ young, Outcome known – number of ranges where the reproductive outcome is known, Total Fledged – Mean sum of fledged from all nests, Fledged known – number of sites in which the number of young fledged is known (at least 1 fledged), Proportion Successful - proportion of occupied sites that fledged at least 1 young, Fledging Rate 1 - mean number of young fledged per occupied site with a known outcome, Fledging Rate 2 - mean number of young fledged per successful site.
NHZ Occupie
d sites Success
-ful Failed Outcome
known Total
Fledged Fledged
known
Proportion Successful
(SD) Fledging
rate 1 Fledging
rate 2 2 235 72 163 233 168 71 0.31 (0.10) 0.72 (0.23) 2.37 (0.36) 3 45 31 14 44 85 30 0.69 (0.27) 1.93 (1.01) 2.83 (1.24) 5 57 36 21 54 109 34 0.63 (0.15) 2.02 (0.62) 3.21 (0.10) 6 45 37 8 42 101 35 0.82 (0.12) 2.40 (0.66) 2.89 (1.07) 7 39 30 9 38 97 29 0.77 (0.24) 2.55 (1.11) 3.34 (0.43) 8 3 3 0 3 9 3 1.00 (0.00) 3.00 (0.00) 3.00 (0.00)
10 44 19 25 42 59 17 0.43 (0.34) 1.40 (1.07) 3.47 (0.54) 11 61 20 41 60 56 19 0.33 (0.08) 0.93 (0.29) 2.95 (0.53) 12 76 43 33 76 146 43 0.57 (0.12) 1.92 (0.40) 3.40 (0.20) 13 2 0 2 2 0 0 0.00 (0.00) 0.00 (0.00) 14 239 195 44 217 512 173 0.82 (0.07) 2.36 (0.47) 2.96 (0.33) 15 71 31 40 58 73 28 0.44 (0.21) 1.26 (0.69) 2.61 (0.36) 16 2 0 2 2 0 0 0.00 (0.00) 0.00 (0.00) 17 32 16 16 32 46 16 0.50 (0.29) 1.44 (2.03) 2.88 (1.65) 19 133 44 89 128 132 39 0.33 (0.11) 1.03 (0.56) 3.38 (0.69) 20 52 28 24 51 97 27 0.54 (0.16) 1.90 (0.60) 3.59 (0.49) 21 1 1 0 1 4 1 1.00 (0.00) 4.00 4.00
A conservation framework for hen harriers in the UK
9
Figure 1. Biogeographic zones of Scotland, Natural Heritage Zones (NHZs), developed by Scottish Natural Heritage (SNH, 1998, 2000). 1 = Shetland (not shown) , 2 = North Caithness & Orkney, 3 = Western Isles, 4 = North West Seaboard, 5 = The Peatlands of Caithness & Sutherland, 6 = Western Seaboard, 7 = Northern Highlands, 8 = Western Highlands, 9 = North East Coastal Plain, 10 = Central Highlands, 11 = Cairngorms Massif, 12 = North East Glens, 13 = Lochaber, 14 = Argyll West & Islands, 15 = Breadalbane & East Argyll, 16 = Eastern Lowlands, 17 = West Central Belt, 18 = Wigtown Machairs & Outer Solway, 19 = Western Southern Uplands & Inner Solway, 20 = Border Hills, 21 = Moray Firth. Copyright is held by Scottish Natural Heritage. Normal restrictions apply.
A conservation framework for hen harriers in the UK
10
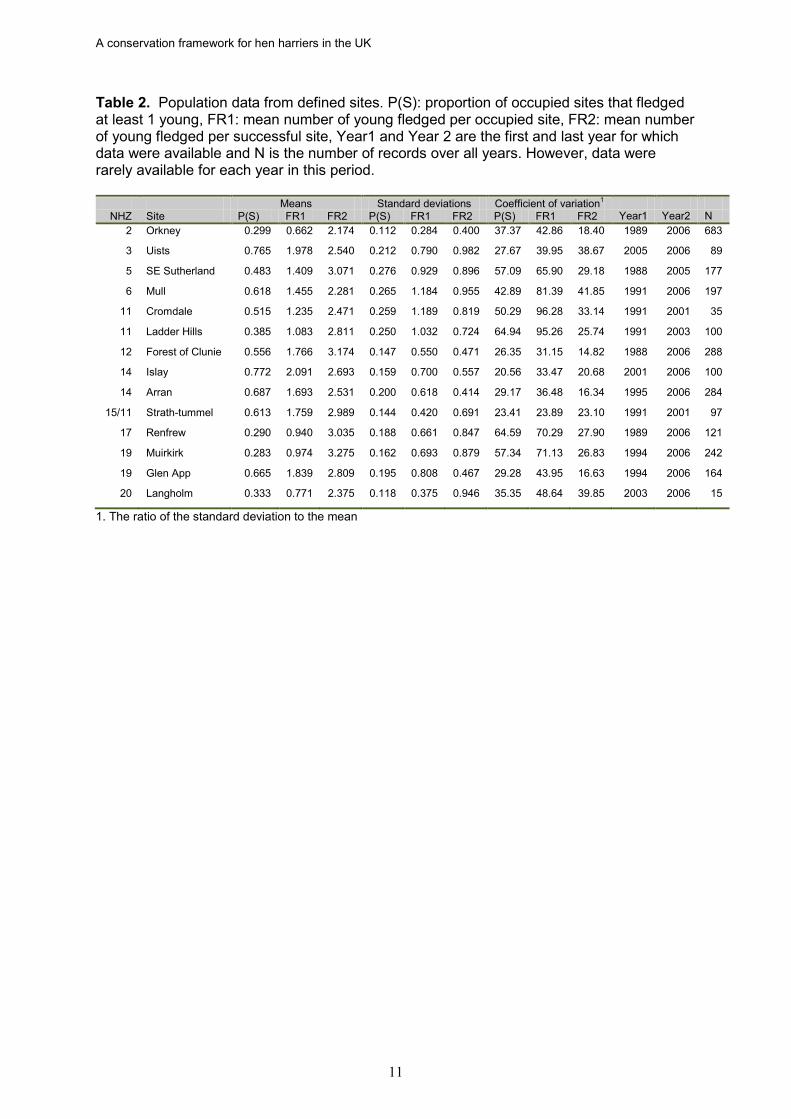
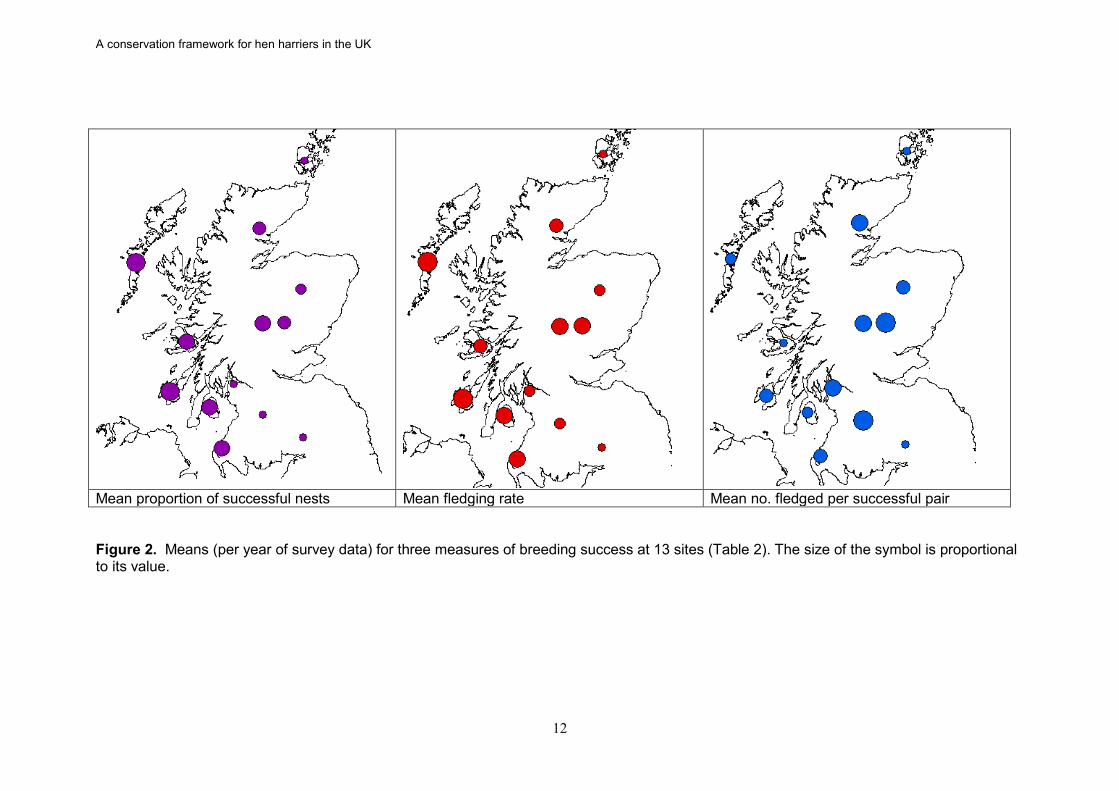
3.1.1 Defined sites A total of 2,592 records were available from fourteen sites covering 11 NHZs and varying periods between 1988 and 2006. These sites are mainly Special Protection Areas classified for breeding populations of hen harriers under the EU Birds Directive. The summary data in Table 2 were extracted from a detailed confidential appendix (2). The data include records obtained outside of the national surveys. Almost 50% of the records come from just three sites: Orkney, Forest of Clunie and Arran. As with the NHZs, there was considerable between-site variation in the reproductive parameters. In two sites, Uists and Islay, almost 77% of the recorded breeding attempts were successful, whilst at Orkney, Renfrew and Muirkirk fewer than 30% were successful. The overall proportion of successful breeding attempts (48%) was only slightly lower than that recorded for the NHZs. The Uists and Islay had the largest number of young fledged per breeding attempt at approximately 2, while five sites had fledging rates of approximately one or less (Ladder Hills, Muirkirk, Renfrew, Langholm and Orkney). Interestingly, Langholm had the largest number fledged per successful nest (3.28) whilst Orkney again had the lowest at 2.17. The national means from these data were slightly lower than those obtained at the NHZ level at 1.29 and 2.69 respectively. As with NHZs, there was variation in the consistency of the reproductive performance of the sites between years. For example, the proportion of successful sites for Ladder Hills, Renfrew, Muirkirk , SE Sutherland and Cromdale was much more variable than Islay (see coefficients of variation in Table 2). There were even greater differences in the variation for the number of young fledged per breeding attempt. Both Cromdale and Ladder Hills varied greatly between years while Strath-tummel was relatively consistent (as above). The average productivity measures are also presented in map form (Figure 2) to illustrate the geographical relationships of the different values. These show that the largest number of young fledged per breeding attempt tend to be in the west whilst the largest number fledged per successful attempt are generally in the east. This generally reflects a lower proportion of successful attempts in the east. There is also a greater variation in the number fledged per successful attempt in the west.
A conservation framework for hen harriers in the UK
11
Table 2. Population data from defined sites. P(S): proportion of occupied sites that fledged at least 1 young, FR1: mean number of young fledged per occupied site, FR2: mean number of young fledged per successful site, Year1 and Year 2 are the first and last year for which data were available and N is the number of records over all years. However, data were rarely available for each year in this period.
Means Standard deviations Coefficient of variation1 NHZ Site P(S) FR1 FR2 P(S) FR1 FR2 P(S) FR1 FR2 Year1 Year2 N
2 Orkney 0.299 0.662 2.174 0.112 0.284 0.400 37.37 42.86 18.40 1989 2006 683
3 Uists 0.765 1.978 2.540 0.212 0.790 0.982 27.67 39.95 38.67 2005 2006 89
5 SE Sutherland 0.483 1.409 3.071 0.276 0.929 0.896 57.09 65.90 29.18 1988 2005 177
6 Mull 0.618 1.455 2.281 0.265 1.184 0.955 42.89 81.39 41.85 1991 2006 197
11 Cromdale 0.515 1.235 2.471 0.259 1.189 0.819 50.29 96.28 33.14 1991 2001 35
11 Ladder Hills 0.385 1.083 2.811 0.250 1.032 0.724 64.94 95.26 25.74 1991 2003 100
12 Forest of Clunie 0.556 1.766 3.174 0.147 0.550 0.471 26.35 31.15 14.82 1988 2006 288
14 Islay 0.772 2.091 2.693 0.159 0.700 0.557 20.56 33.47 20.68 2001 2006 100
14 Arran 0.687 1.693 2.531 0.200 0.618 0.414 29.17 36.48 16.34 1995 2006 284
15/11 Strath-tummel 0.613 1.759 2.989 0.144 0.420 0.691 23.41 23.89 23.10 1991 2001 97
17 Renfrew 0.290 0.940 3.035 0.188 0.661 0.847 64.59 70.29 27.90 1989 2006 121
19 Muirkirk 0.283 0.974 3.275 0.162 0.693 0.879 57.34 71.13 26.83 1994 2006 242
19 Glen App 0.665 1.839 2.809 0.195 0.808 0.467 29.28 43.95 16.63 1994 2006 164
20 Langholm 0.333 0.771 2.375 0.118 0.375 0.946 35.35 48.64 39.85 2003 2006 15
1. The ratio of the standard deviation to the mean
A conservation framework for hen harriers in the UK
12
Mean proportion of successful nests Mean fledging rate Mean no. fledged per successful pair Figure 2. Means (per year of survey data) for three measures of breeding success at 13 sites (Table 2). The size of the symbol is proportional to its value.
A conservation framework for hen harriers in the UK
13
4 Population modelling: identifying minimum measures for productivity and survival
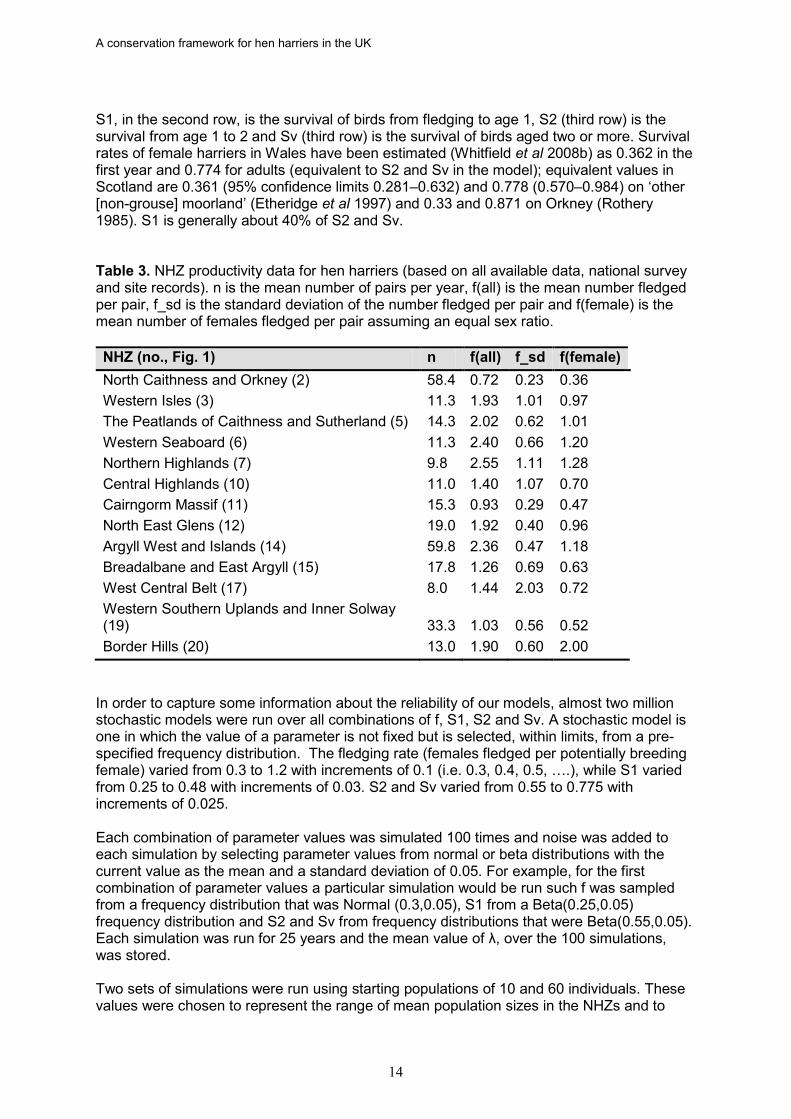
If a population is in at a favourable status it should be capable of maintaining itself, or expanding, without a requirement for recruitment from other populations. At its simplest this is achieved when reproduction and survival are greater than the combined effects of mortality and dispersal to other populations. We used software (Unified Life Models (ULM), version 4.5, May 2008; Legendre & Clobert 1995) to build models and population trajectories were assessed from the value of lambda (λ). Lambda is net birth rate per individual and in a stable population λ = 1, while a value > 1 indicates a population that should be growing and a negative value indicates that the population is declining and should, eventually, go extinct. The relative importance of the different demographic parameters was estimated through their elasticities (e.g. de Kroon et al 2000, Heppell et al 2000). Elasticity explores the effect of a proportional change in a demographic parameter, such as survival, on the magnitude of λ. Two approaches were used to investigate the likely fate of hen harrier populations in Scotland. In the first approach population trajectories were studied over a wide range of possible key population parameter values. The aim was to explore the combination of values which predicted a stable or expanding population. In the second approach, the population trajectories of specific populations were modelled using, as far as possible, empirical values for these populations. 4.1 Population modelling methods The range of population parameter values under which a hen harrier population is expected to be stable or increasing (λ >= 1) was investigated using a Leslie matrix simulation. It was decided to use a female-only model because, ultimately, a population’s trajectory is a function of the number of females fledged. Other work has previously been undertaken using male-based models (Amar 2001); this is because some hen harrier populations, particularly on Orkney, are polygynous (males mate with more than one female). One consequence of polygyny is that some sub-ordinate females fail to reproduce or are less productive. Away from Orkney, polygyny does not appear to be very frequent, and occurs on a cyclical or other temporary basis; wider ranging data on this phenomenon are not available. However, irrespective of the behavioural ecological mechanism, it is female productivity which ultimately drives the population’s trajectory and, because our models take account of the proportion of successful birds, the models will be robust. The population models used a three stage life cycle with pre-reproductive mortality. The basic Leslie matrix is: 0 fj f S1 0 0 0 S2 Sv The top row (0 fj f) are the number of females fledged per occupied site (0 for birds in their first year, fj is number fledged by one year old females and f the number fledged by females aged 2+). Although this model allows for different values of fj and f the field evidence suggests it is acceptable to use the same values for both. Our calculations, based on all available data, indicated that f varied from 0.36 to 2.00 across the thirteen NHZs, with an average of 0.838 (Table 3). Although there is evidence for a slight sex ratio bias (i.e. unequal numbers of males and females fledged, Etheridge et al 1997) our analyses assume, for simplicity, an equal sex ratio of fledged birds.
A conservation framework for hen harriers in the UK
14
S1, in the second row, is the survival of birds from fledging to age 1, S2 (third row) is the survival from age 1 to 2 and Sv (third row) is the survival of birds aged two or more. Survival rates of female harriers in Wales have been estimated (Whitfield et al 2008b) as 0.362 in the first year and 0.774 for adults (equivalent to S2 and Sv in the model); equivalent values in Scotland are 0.361 (95% confidence limits 0.281–0.632) and 0.778 (0.570–0.984) on ‘other [non-grouse] moorland’ (Etheridge et al 1997) and 0.33 and 0.871 on Orkney (Rothery 1985). S1 is generally about 40% of S2 and Sv. Table 3. NHZ productivity data for hen harriers (based on all available data, national survey and site records). n is the mean number of pairs per year, f(all) is the mean number fledged per pair, f_sd is the standard deviation of the number fledged per pair and f(female) is the mean number of females fledged per pair assuming an equal sex ratio. NHZ (no., Fig. 1) n f(all) f_sd f(female) North Caithness and Orkney (2) 58.4 0.72 0.23 0.36 Western Isles (3) 11.3 1.93 1.01 0.97 The Peatlands of Caithness and Sutherland (5) 14.3 2.02 0.62 1.01 Western Seaboard (6) 11.3 2.40 0.66 1.20 Northern Highlands (7) 9.8 2.55 1.11 1.28 Central Highlands (10) 11.0 1.40 1.07 0.70 Cairngorm Massif (11) 15.3 0.93 0.29 0.47 North East Glens (12) 19.0 1.92 0.40 0.96 Argyll West and Islands (14) 59.8 2.36 0.47 1.18 Breadalbane and East Argyll (15) 17.8 1.26 0.69 0.63 West Central Belt (17) 8.0 1.44 2.03 0.72 Western Southern Uplands and Inner Solway (19) 33.3 1.03 0.56 0.52 Border Hills (20) 13.0 1.90 0.60 2.00
In order to capture some information about the reliability of our models, almost two million stochastic models were run over all combinations of f, S1, S2 and Sv. A stochastic model is one in which the value of a parameter is not fixed but is selected, within limits, from a pre-specified frequency distribution. The fledging rate (females fledged per potentially breeding female) varied from 0.3 to 1.2 with increments of 0.1 (i.e. 0.3, 0.4, 0.5, ….), while S1 varied from 0.25 to 0.48 with increments of 0.03. S2 and Sv varied from 0.55 to 0.775 with increments of 0.025. Each combination of parameter values was simulated 100 times and noise was added to each simulation by selecting parameter values from normal or beta distributions with the current value as the mean and a standard deviation of 0.05. For example, for the first combination of parameter values a particular simulation would be run such f was sampled from a frequency distribution that was Normal (0.3,0.05), S1 from a Beta(0.25,0.05) frequency distribution and S2 and Sv from frequency distributions that were Beta(0.55,0.05). Each simulation was run for 25 years and the mean value of λ, over the 100 simulations, was stored. Two sets of simulations were run using starting populations of 10 and 60 individuals. These values were chosen to represent the range of mean population sizes in the NHZs and to
A conservation framework for hen harriers in the UK
15
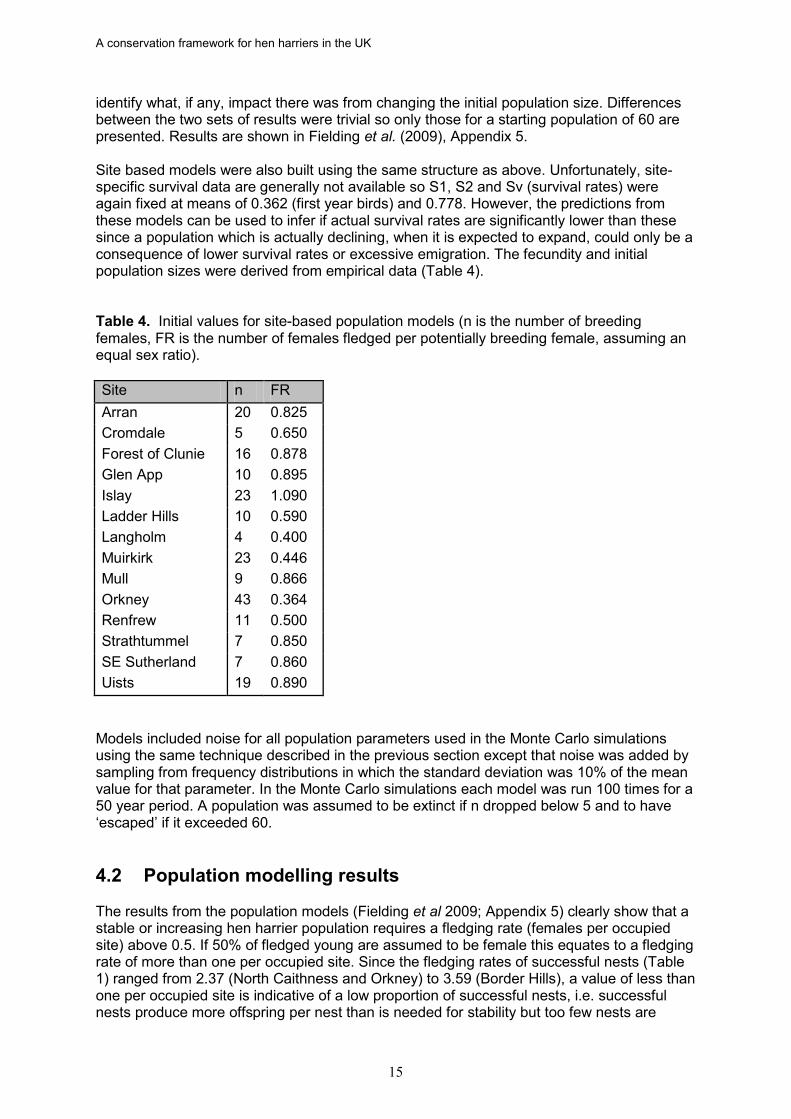
identify what, if any, impact there was from changing the initial population size. Differences between the two sets of results were trivial so only those for a starting population of 60 are presented. Results are shown in Fielding et al. (2009), Appendix 5. Site based models were also built using the same structure as above. Unfortunately, site-specific survival data are generally not available so S1, S2 and Sv (survival rates) were again fixed at means of 0.362 (first year birds) and 0.778. However, the predictions from these models can be used to infer if actual survival rates are significantly lower than these since a population which is actually declining, when it is expected to expand, could only be a consequence of lower survival rates or excessive emigration. The fecundity and initial population sizes were derived from empirical data (Table 4). Table 4. Initial values for site-based population models (n is the number of breeding females, FR is the number of females fledged per potentially breeding female, assuming an equal sex ratio). Site n FR Arran 20 0.825 Cromdale 5 0.650 Forest of Clunie 16 0.878 Glen App 10 0.895 Islay 23 1.090 Ladder Hills 10 0.590 Langholm 4 0.400 Muirkirk 23 0.446 Mull 9 0.866 Orkney 43 0.364 Renfrew 11 0.500 Strathtummel 7 0.850 SE Sutherland 7 0.860 Uists 19 0.890
Models included noise for all population parameters used in the Monte Carlo simulations using the same technique described in the previous section except that noise was added by sampling from frequency distributions in which the standard deviation was 10% of the mean value for that parameter. In the Monte Carlo simulations each model was run 100 times for a 50 year period. A population was assumed to be extinct if n dropped below 5 and to have ‘escaped’ if it exceeded 60. 4.2 Population modelling results The results from the population models (Fielding et al 2009; Appendix 5) clearly show that a stable or increasing hen harrier population requires a fledging rate (females per occupied site) above 0.5. If 50% of fledged young are assumed to be female this equates to a fledging rate of more than one per occupied site. Since the fledging rates of successful nests (Table 1) ranged from 2.37 (North Caithness and Orkney) to 3.59 (Border Hills), a value of less than one per occupied site is indicative of a low proportion of successful nests, i.e. successful nests produce more offspring per nest than is needed for stability but too few nests are
A conservation framework for hen harriers in the UK
16
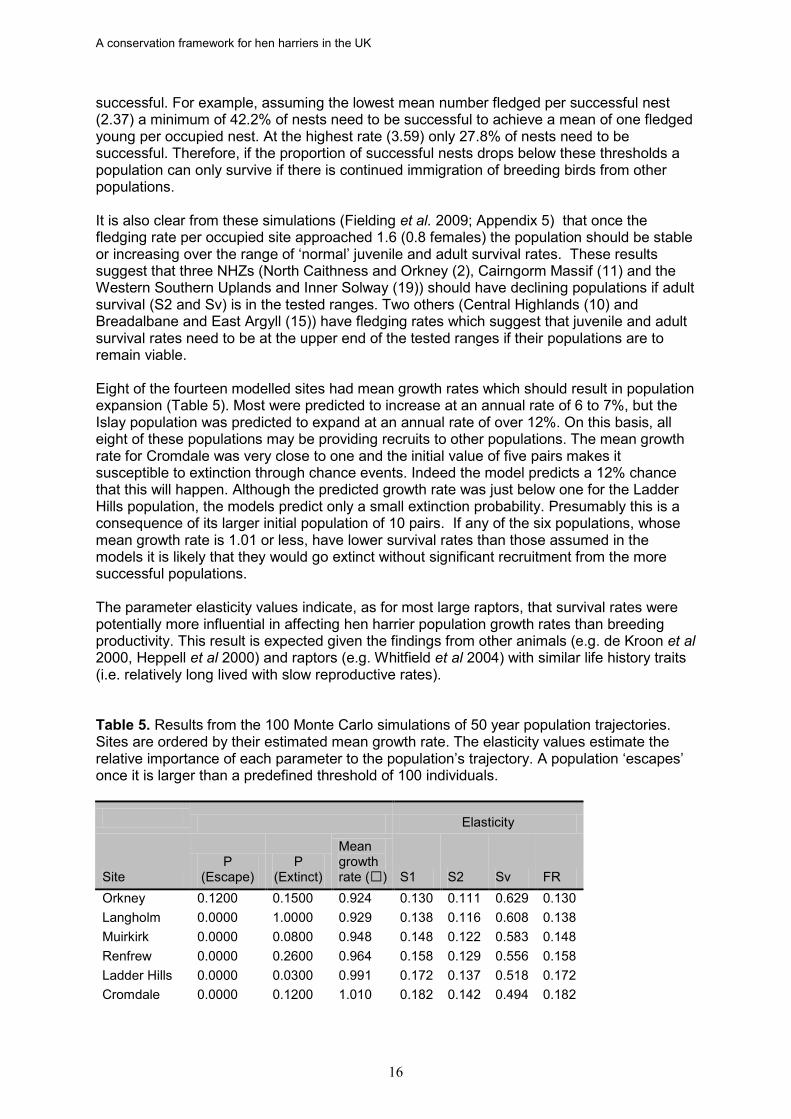
successful. For example, assuming the lowest mean number fledged per successful nest (2.37) a minimum of 42.2% of nests need to be successful to achieve a mean of one fledged young per occupied nest. At the highest rate (3.59) only 27.8% of nests need to be successful. Therefore, if the proportion of successful nests drops below these thresholds a population can only survive if there is continued immigration of breeding birds from other populations. It is also clear from these simulations (Fielding et al. 2009; Appendix 5) that once the fledging rate per occupied site approached 1.6 (0.8 females) the population should be stable or increasing over the range of ‘normal’ juvenile and adult survival rates. These results suggest that three NHZs (North Caithness and Orkney (2), Cairngorm Massif (11) and the Western Southern Uplands and Inner Solway (19)) should have declining populations if adult survival (S2 and Sv) is in the tested ranges. Two others (Central Highlands (10) and Breadalbane and East Argyll (15)) have fledging rates which suggest that juvenile and adult survival rates need to be at the upper end of the tested ranges if their populations are to remain viable. Eight of the fourteen modelled sites had mean growth rates which should result in population expansion (Table 5). Most were predicted to increase at an annual rate of 6 to 7%, but the Islay population was predicted to expand at an annual rate of over 12%. On this basis, all eight of these populations may be providing recruits to other populations. The mean growth rate for Cromdale was very close to one and the initial value of five pairs makes it susceptible to extinction through chance events. Indeed the model predicts a 12% chance that this will happen. Although the predicted growth rate was just below one for the Ladder Hills population, the models predict only a small extinction probability. Presumably this is a consequence of its larger initial population of 10 pairs. If any of the six populations, whose mean growth rate is 1.01 or less, have lower survival rates than those assumed in the models it is likely that they would go extinct without significant recruitment from the more successful populations. The parameter elasticity values indicate, as for most large raptors, that survival rates were potentially more influential in affecting hen harrier population growth rates than breeding productivity. This result is expected given the findings from other animals (e.g. de Kroon et al 2000, Heppell et al 2000) and raptors (e.g. Whitfield et al 2004) with similar life history traits (i.e. relatively long lived with slow reproductive rates). Table 5. Results from the 100 Monte Carlo simulations of 50 year population trajectories. Sites are ordered by their estimated mean growth rate. The elasticity values estimate the relative importance of each parameter to the population’s trajectory. A population ‘escapes’ once it is larger than a predefined threshold of 100 individuals. Elasticity
Site P
(Escape) P
(Extinct)
Mean growth rate () S1 S2 Sv FR
Orkney 0.1200 0.1500 0.924 0.130 0.111 0.629 0.130 Langholm 0.0000 1.0000 0.929 0.138 0.116 0.608 0.138 Muirkirk 0.0000 0.0800 0.948 0.148 0.122 0.583 0.148 Renfrew 0.0000 0.2600 0.964 0.158 0.129 0.556 0.158 Ladder Hills 0.0000 0.0300 0.991 0.172 0.137 0.518 0.172 Cromdale 0.0000 0.1200 1.010 0.182 0.142 0.494 0.182
A conservation framework for hen harriers in the UK
17
Elasticity
Site P
(Escape) P
(Extinct)
Mean growth rate () S1 S2 Sv FR
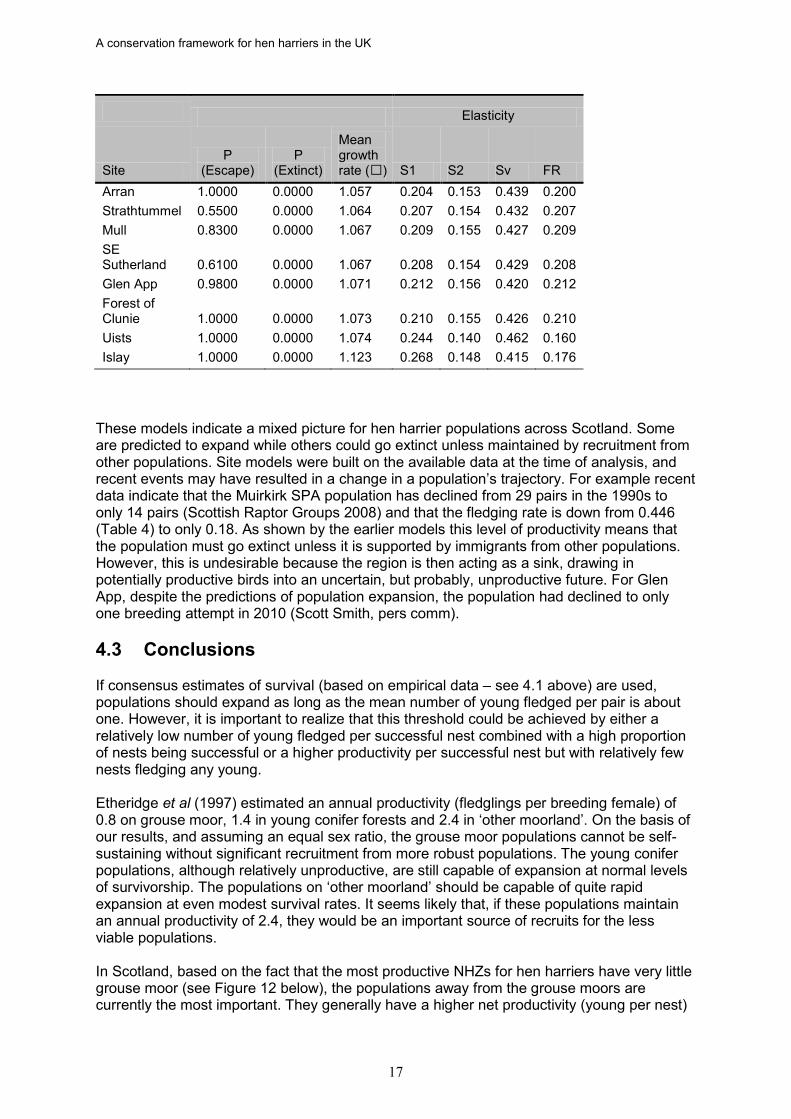
Arran 1.0000 0.0000 1.057 0.204 0.153 0.439 0.200 Strathtummel 0.5500 0.0000 1.064 0.207 0.154 0.432 0.207 Mull 0.8300 0.0000 1.067 0.209 0.155 0.427 0.209 SE Sutherland 0.6100 0.0000 1.067 0.208 0.154 0.429 0.208 Glen App 0.9800 0.0000 1.071 0.212 0.156 0.420 0.212 Forest of Clunie 1.0000 0.0000 1.073 0.210 0.155 0.426 0.210 Uists 1.0000 0.0000 1.074 0.244 0.140 0.462 0.160 Islay 1.0000 0.0000 1.123 0.268 0.148 0.415 0.176
These models indicate a mixed picture for hen harrier populations across Scotland. Some are predicted to expand while others could go extinct unless maintained by recruitment from other populations. Site models were built on the available data at the time of analysis, and recent events may have resulted in a change in a population’s trajectory. For example recent data indicate that the Muirkirk SPA population has declined from 29 pairs in the 1990s to only 14 pairs (Scottish Raptor Groups 2008) and that the fledging rate is down from 0.446 (Table 4) to only 0.18. As shown by the earlier models this level of productivity means that the population must go extinct unless it is supported by immigrants from other populations. However, this is undesirable because the region is then acting as a sink, drawing in potentially productive birds into an uncertain, but probably, unproductive future. For Glen App, despite the predictions of population expansion, the population had declined to only one breeding attempt in 2010 (Scott Smith, pers comm). 4.3 Conclusions If consensus estimates of survival (based on empirical data – see 4.1 above) are used, populations should expand as long as the mean number of young fledged per pair is about one. However, it is important to realize that this threshold could be achieved by either a relatively low number of young fledged per successful nest combined with a high proportion of nests being successful or a higher productivity per successful nest but with relatively few nests fledging any young. Etheridge et al (1997) estimated an annual productivity (fledglings per breeding female) of 0.8 on grouse moor, 1.4 in young conifer forests and 2.4 in ‘other moorland’. On the basis of our results, and assuming an equal sex ratio, the grouse moor populations cannot be self-sustaining without significant recruitment from more robust populations. The young conifer populations, although relatively unproductive, are still capable of expansion at normal levels of survivorship. The populations on ‘other moorland’ should be capable of quite rapid expansion at even modest survival rates. It seems likely that, if these populations maintain an annual productivity of 2.4, they would be an important source of recruits for the less viable populations. In Scotland, based on the fact that the most productive NHZs for hen harriers have very little grouse moor (see Figure 12 below), the populations away from the grouse moors are currently the most important. They generally have a higher net productivity (young per nest)

A conservation framework for hen harriers in the UK
18
and contribute most young each year. If survival rates are higher away from grouse moors their importance is further enhanced, and this is highly likely given that previous research has suggested that annual survival rates of female hen harriers which breed on grouse moors is about half that of females breeding on other moorland (Etheridge et al. 1997). Furthermore, initial findings from radio-tracking work by Natural England also suggest that over-winter survival of first year birds also appears to be very low in the uplands of northern England where grouse moor management predominates (Richard Saunders, pers comm).
A conservation framework for hen harriers in the UK
19
5 Mapping the potential distribution of hen harriers This section had three aims: 1. Develop distribution models which can inform targets for favourable status in
Scotland (note the term favourable conservation status applies at the European level rather than nationally);
2. Further develop the distribution models to produce habitat suitability maps to incorporate England, Wales and the Isle on Man;
3. Provide a baseline against which the potential hen harrier population size can be judged.
A species distribution model uses information about the known habitat of a species to predict the places where it might be expected to be found. When developing any species distribution model there are several important steps that can influence the nature of the predictions. These include the: • type of modelling approach; • grain size (aerial size of sample unit); • training data used to develop the model; • testing data used to validate the model; • variables used as predictors; • model parameters (e.g. number of degrees of freedom used to the determine the
complexity of the fitted curves in generalized additive models) and initial predictor selection; and
• an appropriate assessment of model accuracy. 5.1 Modelling Approach Recently, species distribution models (SDM) have received considerable interest (e.g. Guisan et al 2002, Robertson et al 2003) and there has been considerable debate about which is the best. Unfortunately much of this debate is misdirected since it can be shown that there is no single best classifier (a SDM may be considered to be a specific type of classifier). The “no-free-lunch” (NFL) theorem is a proof that there is no ‘best’ algorithm over all possible classification problems and that although one classifier may outperform another on problem A, it is possible that the ranking would be reversed for problem B (Wolpert & Macready 1995). Indeed the NFL theorem shows that it is impossible, in the absence of prior domain knowledge, to choose between two algorithms based on their previous behaviour. The existence of the NFL theorem means that other factors, such as size of the training set, missing values, probability distributions and, importantly, interpretability are likely to be more important guides to the choice of the appropriate SDM. SDMs are differentiated by their assumptions and data requirements. These differences are important because SDMs can yield very different predictions, even when predictions are derived from the same data (Araujo et al 2005, Pearson et al 2006). SDM approaches fall into two broad categories: presence-only modelling and those which require presence and absence data. Although the presence-only models appear superficially weaker they seem to perform well when there are strong ecological gradients. In general, this means that presence-only models are better suited to situations in which there is a relatively widescale change in habitat conditions, for example climate at a continental scale. Consequently, we selected two classes of presence-absence model that are based on different paradigms: decision trees and generalized additive models (see Fielding 2006 for more detailed explanations). In addition, because there is no best method, it has been suggested that it
A conservation framework for hen harriers in the UK
20
may be better to combine predictions from a suite of models as an ‘ensemble’ or meta-model (e.g. Fielding 2006, Araújo & New 2007). Consequently, our final predictions are based on consensus of model predictions. Generalized additive models (GAM) are extensions of the general linear model but, unlike generalized linear models, they are semi-parametric rather than fully parametric. This is because their link function is a non-parametric ‘smoothed’ function and the form of the smoothing function is determined by the data rather than some pre-defined theoretical relationship. Consequently, a GAM is a data-driven, rather than model-driven, algorithm. A link function is a mathematical transformation of a relationship between two variables to make that relationship linear, i.e. it can be represented by a straight line. GAMs are semi-parametric, because the probability distribution of the response variable (probability of hen harrier occupancy within a 10 x 10 km square in our models) must be pre-specified. In a GAM the simple coefficients (weights) of the GLM are replaced by non-parametric relationships that are typically modelled using smoothing functions. This produces models in which the relationships between the response variable and the predictors are made up of arbitrarily complex smoothed curves. Consequently, the main advantage of a GAM is its ability to deal with highly non-linear and non-monotonic relationships between, in our models, the probability that hen harriers will be present and the values of the habitat predictors. A combined, multi-stage approach was used with the GAM models to select the predictors and the level of smoothing, which could vary between predictors. This is described in the section on model parameterisation and predictor selection. Our second method was Random Forests, a recent extension of the more familiar decision tree. A decision tree creates decision points (nodes) where the path through a tree is decided by the value of a single variable, for example “is the slope less than 5 degrees?”. This value is known as a threshold criterion. Unless a node is ‘terminal’ the data are again split into two parts at each node. For example, one part of the data would have a slope less than 5 degrees while the rest have a slope of five or more degrees. Each part, or partition, of the data is then treated independently and separate decisions are made on the next splits. First is a split needed, secondly which variable should be used to perform the split and, finally, what threshold value of the variable should be used? This process continues until some end condition is reached and the partitioning ceases. The big advantage is that the threshold criteria are immune to the need to pre-specify or estimate the nature of the response curve between species-presence and the value of a predictor (as used in a GAM). They are also much more robust to outlying observations which do not distort the data. We used decision trees to predict the presence or absence of breeding hen harriers within a 10 x 10 km square. Recently, Massey et al (2008) used a classification tree to predict the distribution of northern harriers (the north American vernacular name for hen harrier) on Nantucket Island (USA). Interestingly, their results identified two types of nesting habitat that harriers preferred, marsh and shrublands, whilst avoiding low vegetation and forested habitats. Unfortunately, simple decision trees can have an unstable structure (Breiman 1996) which is often seen when small changes to the training data (the data used to derive the tree) produce significant changes to the tree. Breiman & Cutler (2004a), noted that if you “change the data a little you get a different picture. So the interpretation of what goes on is built on shifting sands”. Breiman (2001a, b) developed an algorithm, called Random Forests (a trademark of Salford Systems) that is said to overcome many of the shortcomings of decision trees, while retaining, and possibly enhancing, their interpretability. Three important features of Random Forests, listed by Breiman and Cutler (2004b), are: 1. An accuracy that equals or exceeds many current classifiers and they cannot overfit
(a common problem when models become too complex);
A conservation framework for hen harriers in the UK
21
2. Efficient processing of large datasets and they can handle thousands of predictors without the need for predictor selection routines;
3. An estimate of the importance of each predictor. The Random Forest algorithm generates many trees, called the forest or ensemble of individual trees. Each tree in the forest differs with respect to the makeup of its training cases and the predictors used at each node. Each of the 10,000 training sets used in our models is a bootstrapped sample. A bootstrapped sample is one which is the same size as the complete data set but each case may be represented more than once while others are excluded. The number of potential predictors for each node in a tree (m) is set to be much less than the total available. A set of m predictors is drawn, at random, from those available for each node in the tree. This means that the predictors considered for the splits are unlikely to be same for any node in the tree. Each tree is built from a bootstrapped sample that typically contains about two thirds of the cases. The remaining third, the so-called ‘out-of-bag sample’, is run through the finished tree. Some trees will correctly predict the class of these cases others will not. The proportion of times that an out-of-bag case is misclassified, averaged over all cases, is the out-of-bag error rate. At its simplest a Random Forest analysis will generate a binary prediction (presence/absence) for each sample square. However, it is also possible to extract a measure of uncertainty by recording the ‘votes’ for each square. A separate prediction is made for a square each time that it is included in the out-of-bag test sample. Summing the number of presence and absence votes for each square gives a measure of the certainty of the prediction. Random Forests have other advantages apart from increased prediction accuracy. A permutation procedure is used to estimate the importance of each variable. Unlike the GAM, and other GLMs, the Random Forest approach has only one parameter (m) that needs to be set and its optimal range is quite wide. Consequently the Random Forests do not suffer from the same dependence on predictor and parameter specifications that applies to GAMs. We used the Random Forest package (v.4.5-16) developed by Liaw and Wiener (2006). In addition, we used another statistical approach called hierarchical partitioning (Chevan & Sutherland 1991) to examine the independent contribution of each predictor to the probability of hen harrier breeding. Unlike the previous two methods hierarchical partitioning does not produce a predictive model, rather it evaluates the unique and joint contributions made by each variable to the prediction of hen harrier occupancy. This type of evaluation is difficult in most other statistical methods. All statistical modelling was completed using R (The R Foundation for Statistical Computing, Version 2.3.1 (2006-06-01), ISBN 3-900051-07-0). 5.1.1 Grain size It is clear from repeated surveys that the occupancy of some hen harrier nesting sites is inconsistent between surveys. Therefore, nest-centred modelling, as used in the golden eagle framework, is likely to produce considerable noise that will degrade the model. Also, because we intend to produce a national (UK-wide) model, a relatively coarse grain is likely to be more effective. Finally, the available predictor and hen harrier survey data had a range of spatial precision and grain sizes, so small sampling units may have introduced a false precision. Consequently we explored two grain sizes: 1 km2 (1 x 1 km) and 100 km2 (10 x 10 km). Following considerable exploratory modelling it became apparent that modelling the national distribution of hen harriers at the smaller scale was computationally too demanding for the time and resources that were available to us. Consequently, the statistical approaches to spatial distribution modelling used the larger 100 km2 grain size.
A conservation framework for hen harriers in the UK
22
5.1.2 Training data All SDMs need data to derive the predicted distribution. These data are known as the training data. It is therefore unsurprising that the quality of the predictions is influenced by the choice of training data. Consequently, we carefully considered several options. The first decision was that our predictive models would be built using the data from the 2004 national hen harrier survey (Sim et al 2007), the most recent national survey for which data were available. However, these data had a restricted geographical and habitat range. The national survey sampling protocol intentionally under-sampled areas where hen harriers were unlikely to breed and the data originally supplied to us were restricted to Scotland. We extended the geographical and habitat range of the training data by the inclusion of additional ‘sample’ squares. First, we randomly sampled 100 km2 squares from 10,000 km2 (100 x 100 km) English and Welsh squares that had no history of breeding hen harriers in the Atlas of breeding birds in Britain and Ireland (Gibbons et al 1993) and were, therefore, unlikely to support any breeding attempts in 2004. We also extended the geographical survey data by the inclusion of occupied and unoccupied 100 km2 squares from the 2005 Irish survey (Barton et al 2006). We also added three squares from Wales, which were known to contain breeding hen harriers, and five from north-west Scotland, including Lewis and Harris, which we know have no history of hen harrier breeding. As we investigated the data prior to building our models we became aware that there was another potential problem. One of the difficulties common to all SDMs is the uncertainty attached to unoccupied sites. Some of these are obviously unsuitable to hen harriers, for example large urban or rugged montane areas. However, there may be other empty sites that are perfectly suitable and are unoccupied either because there aren’t sufficient birds or there is some process which actively discourages occupation. The presence of suitable, but unoccupied, squares in the training data makes it difficult for the SDM to correctly identify features that separate suitable from unsuitable areas. The problem was that some of the ‘unoccupied’ 129 squares in the original 2004 training set had been included in earlier hen harrier surveys and were occupied at the time of those surveys. Initially it was unclear if this was due to changes in habitat or transient changes in hen harrier distribution. This type of noise generally makes it difficult to achieve very high levels of accuracy. Consequently, we removed 23 squares from the training data where there was no evidence of hen harrier occupancy in 2004 but which were occupied in one or more of the previous surveys. In total there were 452, 100 km2 squares in the training data comprising 255 with no history of breeding and 197 where at least one breeding attempt had been recorded. While it is reasonable to conclude that these sample units do not constitute a random sample there is evidence to suggest that random samples are not ideal for ecological niche modelling (e.g. Hirzel & Guissan, 2002). By extending the training data into regions outside of the original survey we hoped to include environmental conditions which limit the distribution of hen harriers. Our ultimate aim is to produce models that accurately predict the current and potential distributions of hen harriers. Ideally we want a hen harrier distribution model that is unbiased, statistically sound and accurate but, if necessary, we are willing to accept a model that is accurate. 5.1.3 Testing data It is now well known that the predictions from a SDM must be validated using independent test data (Fielding & Bell 1997, Fielding 1999, 2002). Test data are data which have played no role in the development of the predictions, i.e. they must be additional squares. We had nine, at least partially, independent data sets to choose from: the 1988–1989 and 1998 national surveys (Bibby & Etheridge 1993, Sim et al 2001) plus a large dataset provided by Brian Etheridge, a record of 2,819 hen harrier records at locations from 16 sites between 1988 and 2006, and 242 historic records dated between 1962 and 2003, with the majority
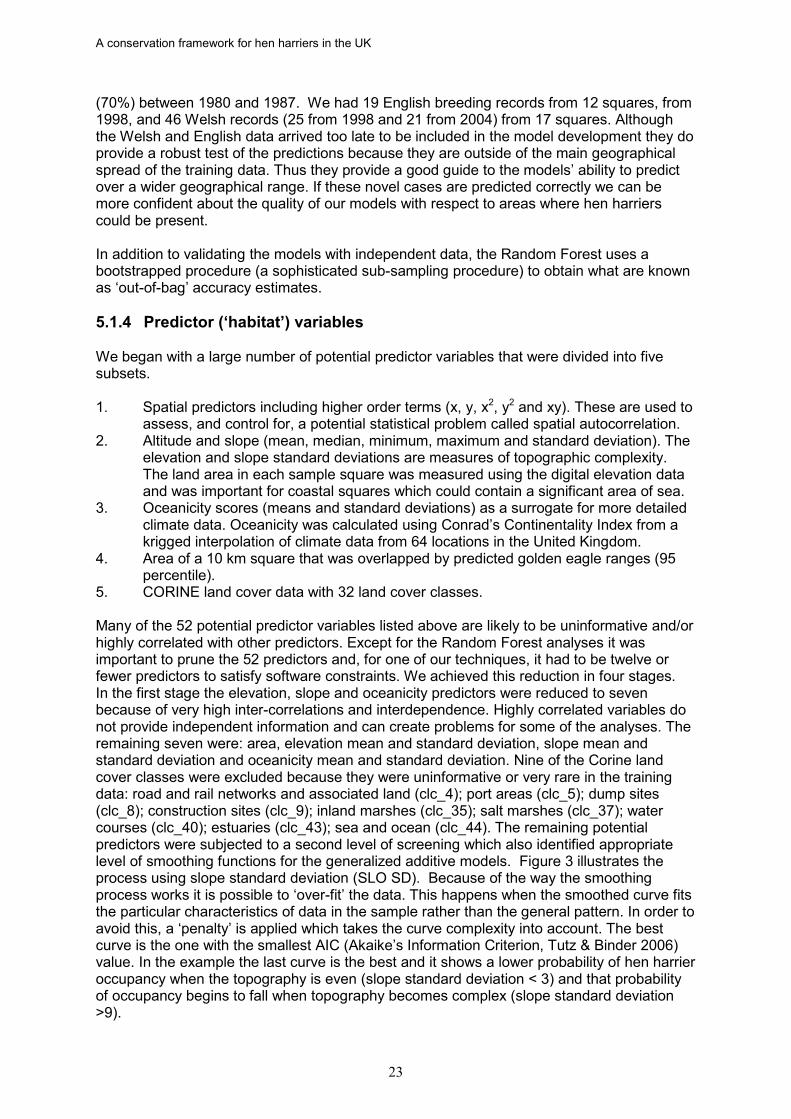
A conservation framework for hen harriers in the UK
23
(70%) between 1980 and 1987. We had 19 English breeding records from 12 squares, from 1998, and 46 Welsh records (25 from 1998 and 21 from 2004) from 17 squares. Although the Welsh and English data arrived too late to be included in the model development they do provide a robust test of the predictions because they are outside of the main geographical spread of the training data. Thus they provide a good guide to the models’ ability to predict over a wider geographical range. If these novel cases are predicted correctly we can be more confident about the quality of our models with respect to areas where hen harriers could be present. In addition to validating the models with independent data, the Random Forest uses a bootstrapped procedure (a sophisticated sub-sampling procedure) to obtain what are known as ‘out-of-bag’ accuracy estimates. 5.1.4 Predictor (‘habitat’) variables We began with a large number of potential predictor variables that were divided into five subsets. 1. Spatial predictors including higher order terms (x, y, x2, y2 and xy). These are used to
assess, and control for, a potential statistical problem called spatial autocorrelation. 2. Altitude and slope (mean, median, minimum, maximum and standard deviation). The
elevation and slope standard deviations are measures of topographic complexity. The land area in each sample square was measured using the digital elevation data and was important for coastal squares which could contain a significant area of sea.
3. Oceanicity scores (means and standard deviations) as a surrogate for more detailed climate data. Oceanicity was calculated using Conrad’s Continentality Index from a krigged interpolation of climate data from 64 locations in the United Kingdom.
4. Area of a 10 km square that was overlapped by predicted golden eagle ranges (95 percentile).
5. CORINE land cover data with 32 land cover classes. Many of the 52 potential predictor variables listed above are likely to be uninformative and/or highly correlated with other predictors. Except for the Random Forest analyses it was important to prune the 52 predictors and, for one of our techniques, it had to be twelve or fewer predictors to satisfy software constraints. We achieved this reduction in four stages. In the first stage the elevation, slope and oceanicity predictors were reduced to seven because of very high inter-correlations and interdependence. Highly correlated variables do not provide independent information and can create problems for some of the analyses. The remaining seven were: area, elevation mean and standard deviation, slope mean and standard deviation and oceanicity mean and standard deviation. Nine of the Corine land cover classes were excluded because they were uninformative or very rare in the training data: road and rail networks and associated land (clc_4); port areas (clc_5); dump sites (clc_8); construction sites (clc_9); inland marshes (clc_35); salt marshes (clc_37); water courses (clc_40); estuaries (clc_43); sea and ocean (clc_44). The remaining potential predictors were subjected to a second level of screening which also identified appropriate level of smoothing functions for the generalized additive models. Figure 3 illustrates the process using slope standard deviation (SLO SD). Because of the way the smoothing process works it is possible to ‘over-fit’ the data. This happens when the smoothed curve fits the particular characteristics of data in the sample rather than the general pattern. In order to avoid this, a ‘penalty’ is applied which takes the curve complexity into account. The best curve is the one with the smallest AIC (Akaike’s Information Criterion, Tutz & Binder 2006) value. In the example the last curve is the best and it shows a lower probability of hen harrier occupancy when the topography is even (slope standard deviation < 3) and that probability of occupancy begins to fall when topography becomes complex (slope standard deviation >9).
A conservation framework for hen harriers in the UK
24
1. Residual Deviance: 600.1 on 450.0 df. AIC: 605.0 2. Residual Deviance: 580.5 on 449.0 df. AIC: 586.5
3 Residual Deviance: 570.8 on 448.0 df. AIC: 578.8 4 Residual Deviance: 563.2 on 447.0 df. AIC: 573.2
5 Residual Deviance: 558.2 on 446.0 df. AIC: 570.2 6. Residual Deviance: 555.0 on 445.0 df. AIC: 568.9
Figure 3. An example of partial effect plots. The x (horizontal) axis is the slope standard deviation while y (vertical) axis is the “effect” of the slope standard deviation on the probability of finding a breeding attempt. Larger positive values are associated with a higher probability. The solid line is the estimated smoothed function and the dotted lines are the corresponding 95% confidence limits. For each smoothing level the residual deviance, residual df and AIC values are shown. The best fit is the model with a smoothing parameter of 6 (smallest AIC). In general, a function will be insignificant if y = 0 is fully included within the confidence limits. The rug plot along the x axis shows the spread of SLO_STD values used in the analysis.
A conservation framework for hen harriers in the UK
25
One potential outcome of this process is that the best fit is a horizontal line. When this happens the potential predictor has no utility because it makes the same prediction across all of its values. These preliminary stages (single, stepwise and Random Forest analyses) identified a core or consensus group of potential predictors that were used as the basis for our final models. In the final stage SDMs were developed using the consensus group of predictors with and without spatial coordinates. We also compared models that included and excluded our measure of golden eagle interference. The accuracy of the models was assessed using a variety of measures and test data sets. Including the AUC (Area Under a ROC Curve) statistic originally proposed for SDMs by Fielding & Bell (1997). 5.2 Results Details of the models discussed below are provided in Fielding et al (2009). Preliminary analyses, using stepwise, generalized additive models, were used to identify single predictor relationships with the probability of hen harrier breeding. These analyses retained twelve variables as potential predictors: y; y2; altitudinal variation (standard deviation); mean slope; slope variation (standard deviation); mean oceanicity; coniferous forest, natural grasslands; moors and heathland; sparsely vegetated areas, mainly montane; peat bogs and the predicted area of golden eagle activity. Four Random Forest models were built that differed with respect to the inclusion or exclusion of the spatial variables and the golden eagle range predictor. Each forest contained 10,000 trees. Because the accuracy of these models is based on the out-of-bag (OOB) estimates there is no need to look separately at training and testing cases. There was very little to choose between the models with respect to overall accuracy (73.7%–76.8% of squares predicted correctly) and there were only minor differences in the false-negative error rates (i.e. incorrectly predicting a nest square to be unsuitable). However, the error rates for unoccupied squares were consistently higher when spatial predictors were excluded. In addition, the error rates were consistently higher for unoccupied squares suggesting that there are squares which, although vacant in this survey, are capable of supporting hen harriers. A more detailed analysis of the predictions suggested that in all four models the rank order of the predictions (“suitability”) was similar for all squares. The importance of predictors in decision trees is determined by their effect on the mean decrease in accuracy, with larger values indicating greater importance. In other words, how well do they improve the predictions? Again, the four models were quite similar with non-irrigated arable land being the most important predictor in all four. Presence of this habitat reduced the probability of occupancy. All five spatial predictors were in the top ten for both models which included them. The x coordinates (x and x2) were more important than the y or interaction (xy) coordinates. This is unsurprising given the preponderance of occupied squares in the west. The top ranking, non-spatial, predictors are reasonably consistent across all four models. The order is non-irrigated arable land, mean oceanicity score, natural grasslands, moors and heathland, discontinuous urban fabric, slope standard deviation, peat bogs, altitude standard deviation, pastures, mean slope, golden eagle predicted range area, oceanicity standard deviation, mean altitude, sparsely vegetated areas – mainly montane, land area (which has a constant value away from the coast), industrial areas, complex cultivation patterns and coniferous forest.
A conservation framework for hen harriers in the UK
26
The next step, in the generalized modelling phase, was to build four stepwise generalized additive models using the consensus predictors. The amount of smoothing was that identified by the exploratory single variable GAM models. The four models differed only with respect to the inclusion of spatial predictors and golden eagle range extent. GAM models make a probability prediction, between 0 and 1, for each square and the accuracy of these models then depends on the correct allocation of a threshold to split the probability of occupancy into two classes (occupied and unoccupied) (Fielding & Bell 1997). The simplest approach is to use the 0.5 (50%) mid-point. However, for various reasons this is rarely justified. Instead the threshold was identified using a method that simultaneously maximised sensitivity (ability to correctly identify occupied squares) and specificity (reducing the number of unoccupied squares that are predicted to be occupied). There was very little to choose between these four models with respect to their accuracy and three of them had very similar thresholds for maximising both sensitivity and specificity. The best model was identified using a range of performance criteria. The best model had five significant predictors: y2; mean oceanicity, non-irrigated arable land, natural grasslands and golden eagle predicted range use. The final approach (hierarchical partitioning), which identifies the independent effect of each predictor on the probability of harrier occupancy, again identified non-irrigated arable land as the most important, followed by the x coordinate. There was a large gap between the effect of the x variable and that of the third most important predictor, moors and heathland. 5.2.1 Predictors of hen harrier distribution and comparisons between models Arable land was significant in all models that included it and the hierarchical partitioning and Random Forest analyses also identified it as one of the most important predictors. The presence of this habitat, largely restricted to the east and south of Britain (Figure 4), is associated with an absence of breeding hen harriers. This land cover class is made up of crops such as cereals and fodder and root crops. It also includes fallow land but excludes permanent pasture. Natural grassland was a significant predictor in all eight GAM models which included it. It also has a large score in the Random Forest analyses. Natural grassland is relatively free from human impact. Grassland that is significantly impacted by humans, for example, by using fertilizers to increase biomass production, is included in the pasture class. Although increasing areas of natural grassland are associated with an increased probability of occupancy there is a very marked peak in occupancy probability when approximately 25% of the square is natural grassland. It is unsurprising that the amount of moors and heathland was positively associated with breeding hen harriers, as this is the principal breeding habitat for hen harriers in Britain (e.g. Redpath et al 1998). Its importance is also recognised in the Random Forest and hierarchical partitioning analyses. The measure of golden eagle usage was significant in a majority of models and, although increased potential golden eagle activity appears to reduce the probability of harrier occupancy, it is not a simple relationship with three obvious peaks where this general relationship is reversed. Some of these are in the eastern highlands where both species tend to occur together in regions surrounded by an absence of either species, despite an abundance of apparently suitable habitat. The pattern with the topographic predictors was more variable but the slope standard deviation seems more important than the altitude standard deviation. As shown in Figure 3,
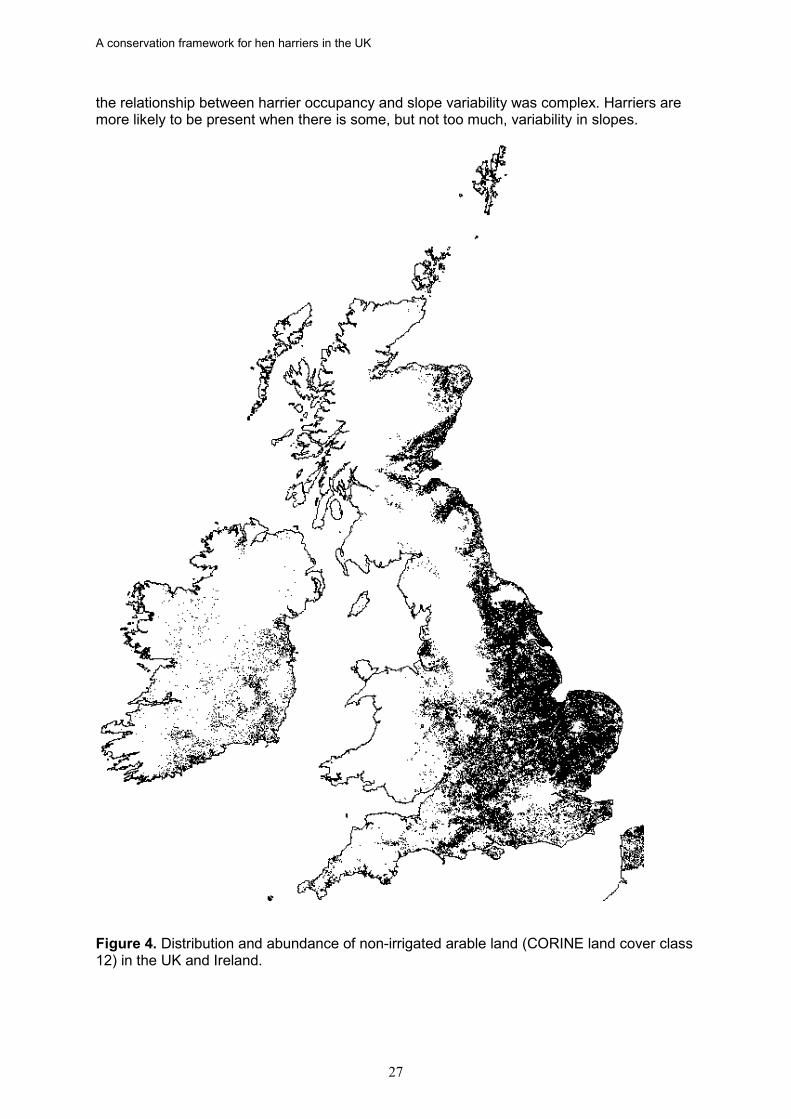
A conservation framework for hen harriers in the UK
27
the relationship between harrier occupancy and slope variability was complex. Harriers are more likely to be present when there is some, but not too much, variability in slopes.
Figure 4. Distribution and abundance of non-irrigated arable land (CORINE land cover class 12) in the UK and Ireland.
A conservation framework for hen harriers in the UK
28
Although conifer woodland was not selected by the statistical methods for inclusion in the final model, it did have an individual significant relationship with hen harrier occupancy. This was a highly non-linear relationship with a peak positive effect when approximately 25% of the square was covered by conifer forest. The effect declined quickly but then began to rise again once 50% of the square was covered. In western Scotland a significant proportion of hen harriers are now breeding in mature and second rotation conifer plantations, newly planted native woodland and regenerating woodland and scrub (Haworth & Fielding 2009) and pre-thicket coniferous forests are also a very important breeding habitat in Ireland (Wilson et al 2009). In summary, these models suggest that hen harriers are more likely to occupy breeding sites when land has a ‘rolling’ topography with little or no arable land. Moors and heathland are also beneficial, particularly in combination with about 25% cover of natural grassland. Increasing golden eagle activity is generally detrimental to breeding hen harriers. Figures 5, 6 and 7, which are based on averaged models, show the predicted distribution of breeding hen harriers in Britain and Ireland. The predictions in Figure 5 are based on an average vote across the four Random Forest analyses while Figure 6 does the same for the average probability of occupancy from the final four generalized additive models. Despite the very different assumptions and rule creation algorithms, there are only minor differences between the predictions from the two sets of models. Figure 7 uses an average from all eight models used to produce Figures 5 and 6. It is obvious from these models that there appears to be a considerable scope for population expansion, particularly in Northern England and Wales.
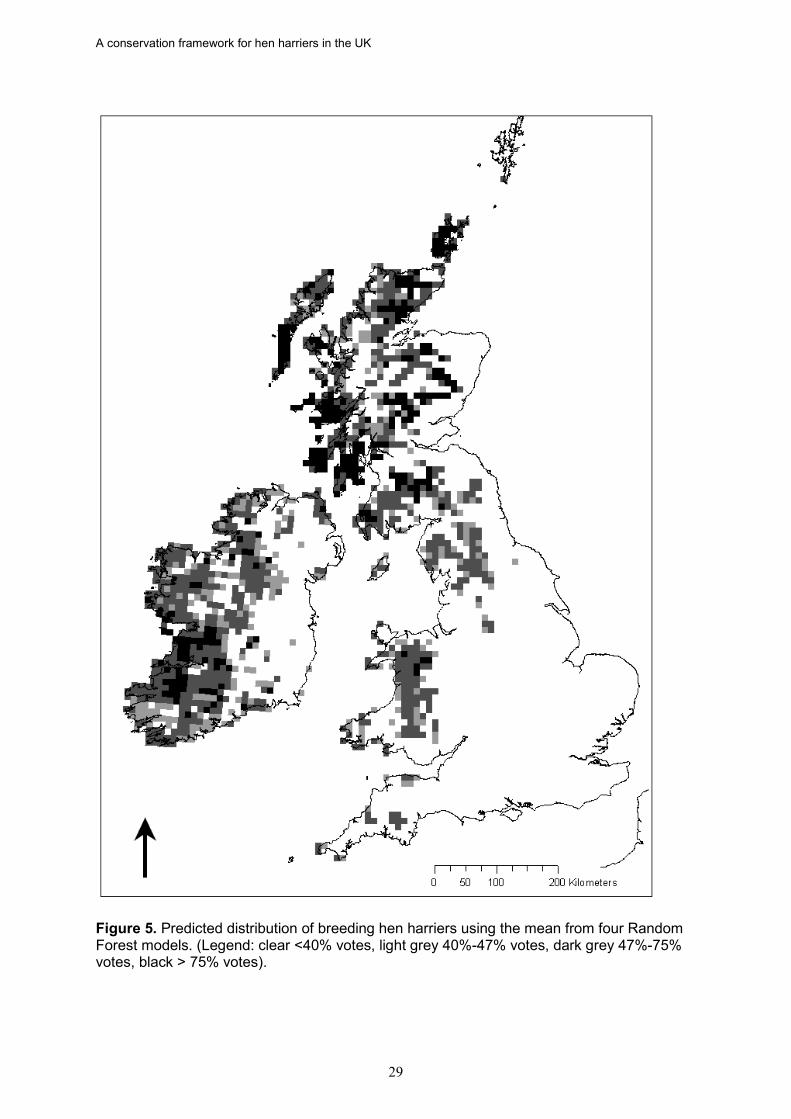
A conservation framework for hen harriers in the UK
29
Figure 5. Predicted distribution of breeding hen harriers using the mean from four Random Forest models. (Legend: clear <40% votes, light grey 40%-47% votes, dark grey 47%-75% votes, black > 75% votes).

A conservation framework for hen harriers in the UK
30
Figure 6. Predicted distribution of breeding hen harriers using the mean from four generalized additive models. (Legend: clear P<0.40, light grey 0.40<P<0.47, dark grey 0.47<P<0.75, black P>0.75).
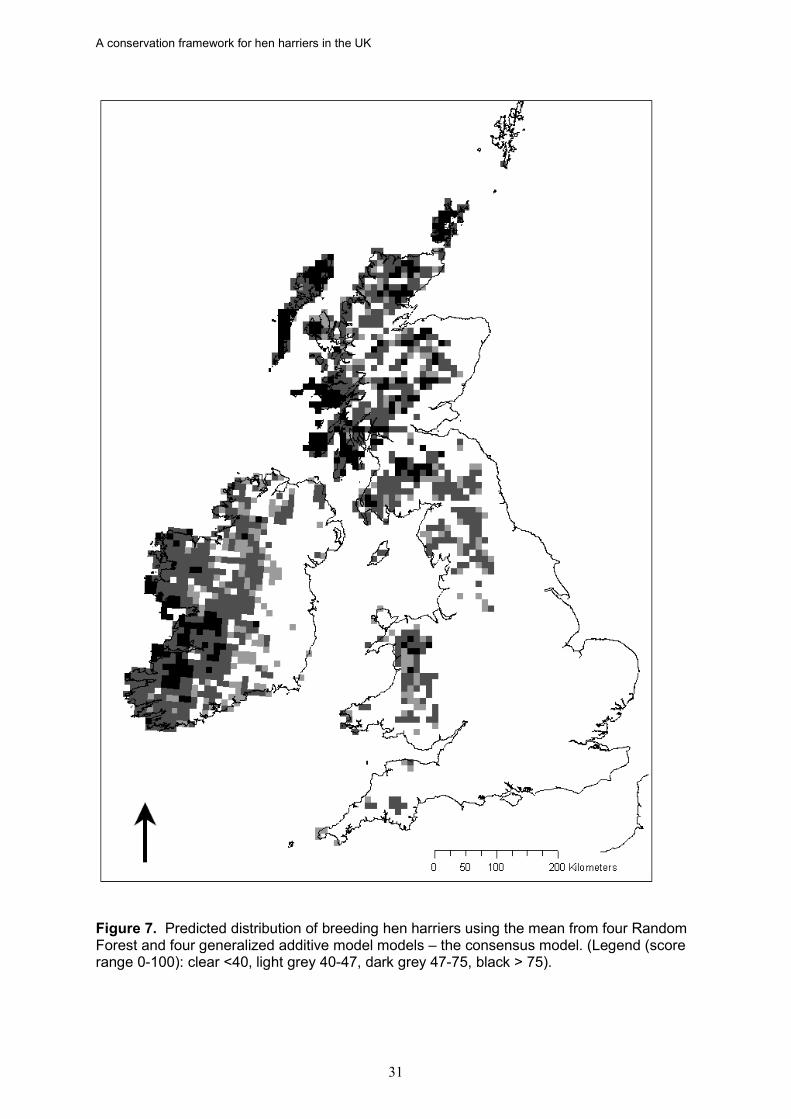
A conservation framework for hen harriers in the UK
31
Figure 7. Predicted distribution of breeding hen harriers using the mean from four Random Forest and four generalized additive model models – the consensus model. (Legend (score range 0-100): clear <40, light grey 40-47, dark grey 47-75, black > 75).
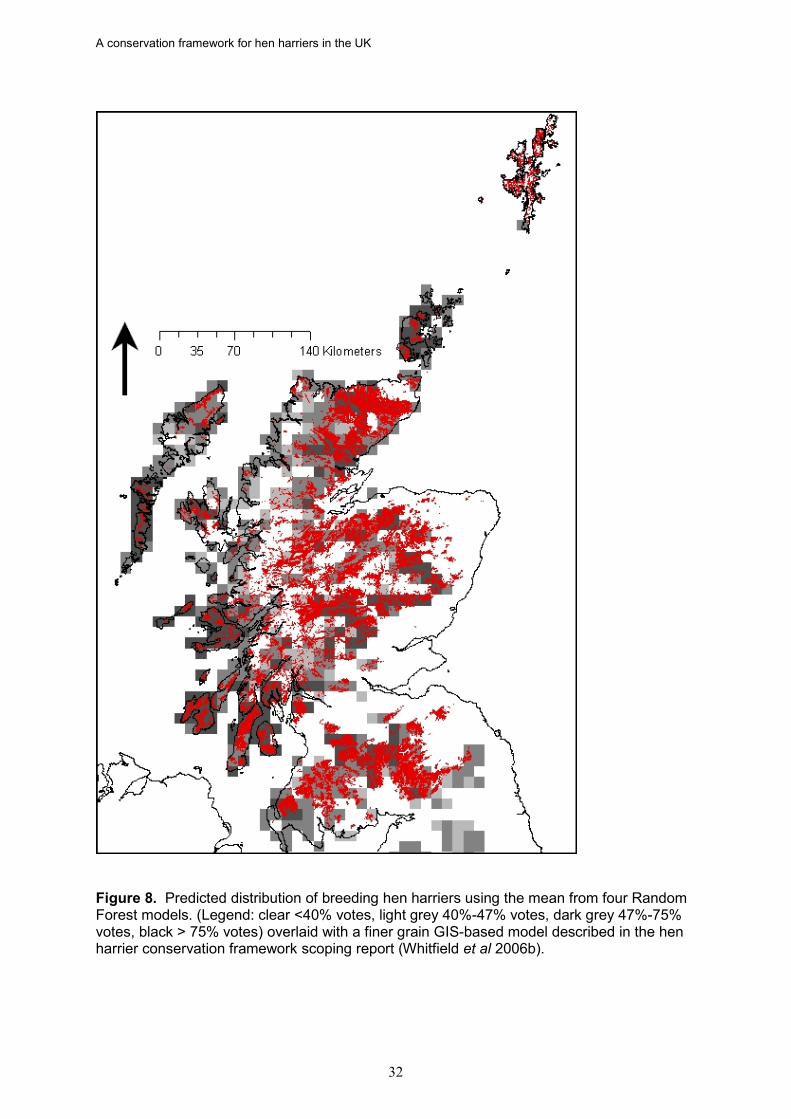
A conservation framework for hen harriers in the UK
32
Figure 8. Predicted distribution of breeding hen harriers using the mean from four Random Forest models. (Legend: clear <40% votes, light grey 40%-47% votes, dark grey 47%-75% votes, black > 75% votes) overlaid with a finer grain GIS-based model described in the hen harrier conservation framework scoping report (Whitfield et al 2006b).
A conservation framework for hen harriers in the UK
33
5.2.2 Model accuracy In general, and unsurprisingly, all of the models were more accurate when applied to the data used to develop them. We had eight data sets against which the model predictions could be validated. 1. 1988/89 national survey. 2. 1998 national survey. 3. Data provided by Brian Etheridge. 4. Historic data. 5. Site data (intensive studies of discrete sites). 6. Data from Welsh sites (1998 and 2004). 7. Miscellaneous data from English sites. 8. Irish data from the 2005 survey. However, most of these data sets include some squares that were covered in the 2004 national survey so, despite their different sources, they do not provide fully independent assessments of predictive accuracy. Consequently, results are presented separately for squares that formed part of the 2004 survey and those which did not. However, even then there are complications. None of the national survey squares (1998, 1989 and 1988), which were excluded from the 2004 survey, had more than four pairs of harriers. There is good evidence that our models do better as the number of pairs per square increases. This is summarised below. Even within the 2004 data there are marked differences in the correct prediction of occupied squares depending on the number of pairs present (split into three or less and four or more). In almost all cases the models perform worse when there are fewer than four pairs per square. We would normally expect reduced accuracy in test data sets but this will be magnified because the occupied test squares never held more than four pairs. The average Random Forest model was always the most accurate at predicting unoccupied squares in each survey. There is also a clear trend in the accuracy for squares, from earlier surveys, that were also in the training data. Accuracy improves as the time between the survey year and 2004 decreases. Although, apart from the 2004 training data, accuracy seems very poor, there are some important caveats. Twenty three unoccupied squares from 2004 were excluded from the training data because they were previously occupied. Almost all of these squares were predicted to be occupied by the models. Secondly, many of the squares that were unoccupied in a particular survey, were occupied in other data sets, including other national surveys. The accuracy is, therefore, much better than it appears and highlights the problem of predicting the distribution of hen harriers when the occupancy status of even 100 km2 squares can be variable. As with the unoccupied squares, there is a trend to increasing accuracy in predicting occupied squares as the time between a survey and the training data declines. Although the differences are small, the Random Forest models tend to be the most accurate. There is also an almost universal trend for accuracy to improve as the number of pairs per square increases. If, as seems reasonable, the number of pairs is related to the quality of the habitat then this relationship might be expected. Accuracy is, as expected, better for the training squares than for the test squares. However, because very few of the squares in the test data have four or more pairs, a decrease in accuracy is to be expected for these squares. Presumably, this observation is related to the design of the sampling protocol such that ‘marginal’ squares are less likely to be sampled. The 1998 and 2004 Welsh data are all correctly predicted by the averaged Random Forest and combined models. The averaged GAM model failed to correctly identify one square which had one breeding record from 1998.
A conservation framework for hen harriers in the UK
34
The models are less successful with the English data, all of which date from 1998. All three consensus models failed to predict a square in North Yorkshire which contained one breeding pair. The Random Forest model also failed to predict a square in North Lancashire which contained three breeding pairs while the GAM model failed to predict three squares in North Lancashire which contained two, three and three pairs respectively. The combined model also failed to predict two squares in North Lancashire. However, with the exception of the North Yorkshire square, all models predicted squares immediately adjacent to the failed predictions and these errors probably result from the imposition of a regular sampling grid which does not align with habitat boundaries. This is likely to be more of a problem when, as in areas such as North Lancashire, the areas of suitable habitat are relatively small compared to the size of the sampling grid. The model predicts breeding hen harriers in lowland areas of southwest England (Figs. 5–7) but not in lowland habitats elsewhere in England. Historical records suggest that this species once occupied lowland heathland and fenland in Britain (Anderson et al 2009; Brown & Grice 2005, Watson 1977). However, agricultural practices have undergone very significant changes and it is possible that agricultural intensification and associated isolation and fragmentation of areas of suitable habitat, has reduced the suitability of such areas for hen harriers (Anderson et al 2009). Anderson et al (2009) used a generalized additive model to model the distribution of hen harrier in the UK. They used two approaches. The first was based on a climate envelope approach using information from the species’ European distribution. The second used LCM2000 habitat data plus mean elevation from a DEM. The two models were built at different resolutions: 10 km square for the climate data and 1 km square for the habitat data. They evaluated their climate model predictions as poor with predictions that were “worse than random, with the number of false positives being greater than the true positives”. They found no support for their hypothesis that climate directly determines the current UK distribution and suggested that this implied that either hen harriers in the UK occupy a different climate space or that “confounding factors are more important”. Although their habitat model was more successful it failed to predict some of the more important Scottish populations (e.g. Islay, Arran and the Uists). 5.2.3 Persecution as an influence on the distribution of hen harriers and
model accuracy Persecution, associated principally with the management of heather Calluna vulgaris moorland for red grouse Lagopus lagopus, has been identified as a factor affecting the distribution, abundance and productivity of hen harriers (Anderson et al 2009, Natural England 2008, Summers et al 2003, Etheridge et al 1997). Therefore the likelihood of persecution-related absences from areas of suitable habitat was a potential problem in terms of developing the distribution models. For the golden eagle conservation framework analyses, carried out for Scotland only, the distribution of strip muirburn from the Land Cover Survey 1988, a type of habitat management associated with the management of heather moor for red grouse, was identified as a surrogate for persecution (Whitfield et al 2003). As there is no equivalent habitat class in CORINE, it was not possible to identify the distribution of muirburn at a UK scale using this data set. The modelling approach for hen harrier used a coarse definition of presence, based on at least one pair within a 10 x 10 km square. At this scale, it is not considered likely that the effect of persecution on the presence of hen harriers is a significant issue in terms of the accuracy of predictions. Evidence in support of this was provided by overlaying data on the distribution of persecution incidents involving hen harriers with the predicted distribution in Scotland. This showed that over 90% of incidents occurred in squares where the model predicted the presence of hen harriers (see Section 8 below).

A conservation framework for hen harriers in the UK
35
However, it is likely that the presence of persecution would have been a much more significant issue if we had attempted to model abundance or productivity. Anderson et al 2009 used a measure of the proportion of muirburn, derived from aerial photographs, to classify gamekeeper activity for Great Britain at a 10 x 10 km resolution. This burn index was found to explain a significant amount of the discrepancy between the recent distribution of hen harriers (from Gibbons et al 2003) and their models of hen harrier distribution based on climate suitability and habitat suitability. They also found that hen harrier fledging success was lower where the burn index was highest. 5.2.4 Estimates of available habitat Estimates of available hen harrier habitat were obtained using predictions from the three models (Figures 5, 6 and 7. Estimated land areas for each country and, in Scotland, the Natural Heritage Zones (NHZs) are shown in Tables 6 and 7. Nationally, using our consensus model, just over 21% (51,724 km2) of the United Kingdom’s land surface is predicted to be suitable for hen harriers (Table 6). Wales (24.4%, 5,068 km2) and Northern Ireland (22.1%, 3,049 km2) are close to the national average. However, England has a relatively small area (5.1%, 6,636 km2) while almost 50% of Scotland (47.1%, 36,971 km2) is predicted to be suitable. There are two confounding issues with respect to our predictions for England which mean that our estimate must be treated cautiously. First, because hen harrier data from England were provided to us after the models had been developed, no English data were used to build the models; secondly, breeding densities can be very low. As shown in our accuracy assessments our models are less successful for those squares with low breeding densities. Table 6. Estimated areas of suitable hen harrier habitat in the United Kingdom using areas predicted by the consensus model.
Country Area (km2)
Consensus Model predicted area (km2)
% National Area
Northern Ireland 13,798 3,049 22.1 Wales 20,753 5,068 24.4 Scotland 78,463 36,971 47.1 England 130,169 6,636 5.1 United Kingdom 243,183 51,724 21.3 In Scotland, depending on the model used, between 42% and 50% of the land area is predicted to be suitable hen harrier habitat. However, almost a third of the predicted area is equally spread within just three NHZs: Peatlands of Caithness and Sutherland; Western Southern Uplands and Inner Solway and Argyll West and Islands (Table 7). Five NHZs have large proportions of their land area predicted as suitable hen harrier habitat: (Breadalbane and East Argyll (71%), Western Seaboard (73%), Peatlands of Caithness and Sutherland (76%), Argyll West and Islands (82%) and the Western Isles (95%). The Western Isles estimate is probably too large because it includes much of Lewis and Harris where there are few records of harriers. This overestimate, for the Western Isles, is probably because the predictors did not include any prey distribution data, and it is well known that Lewis and Harris have a relatively poor and sparse small mammal population. However, this interpretation has to be treated with some caution since Hoy supports harriers and also has
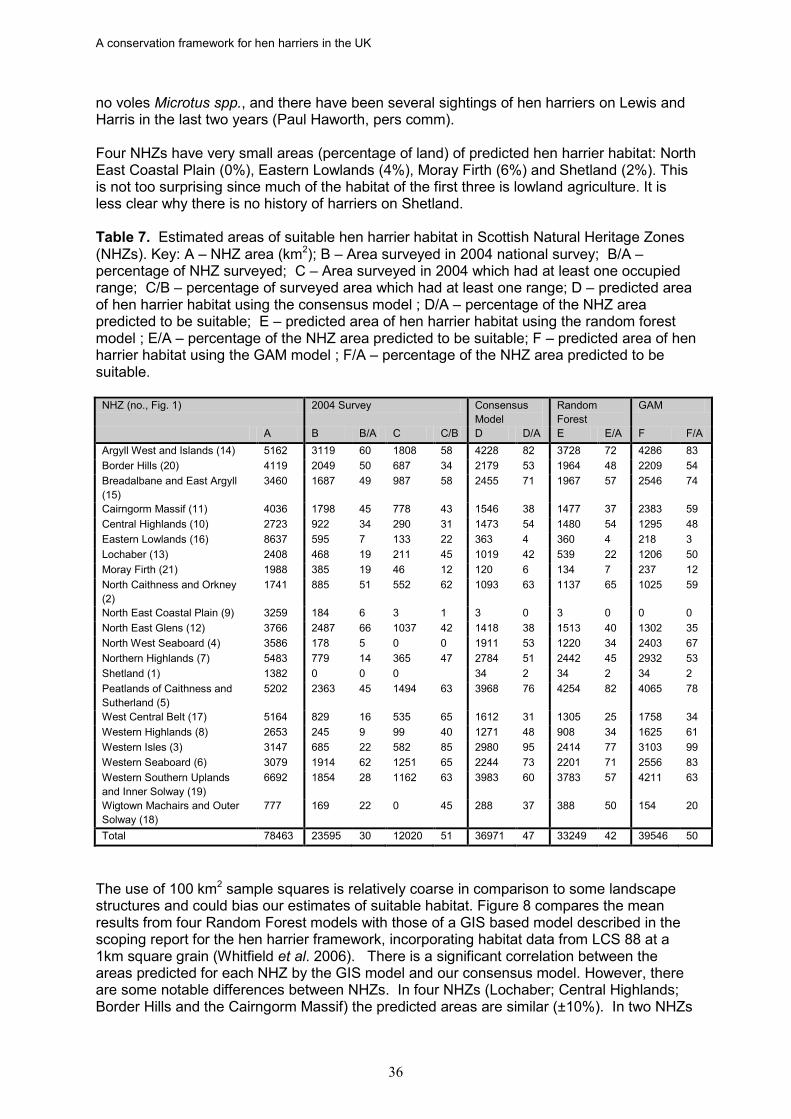
A conservation framework for hen harriers in the UK
36
no voles Microtus spp., and there have been several sightings of hen harriers on Lewis and Harris in the last two years (Paul Haworth, pers comm). Four NHZs have very small areas (percentage of land) of predicted hen harrier habitat: North East Coastal Plain (0%), Eastern Lowlands (4%), Moray Firth (6%) and Shetland (2%). This is not too surprising since much of the habitat of the first three is lowland agriculture. It is less clear why there is no history of harriers on Shetland. Table 7. Estimated areas of suitable hen harrier habitat in Scottish Natural Heritage Zones (NHZs). Key: A – NHZ area (km2); B – Area surveyed in 2004 national survey; B/A – percentage of NHZ surveyed; C – Area surveyed in 2004 which had at least one occupied range; C/B – percentage of surveyed area which had at least one range; D – predicted area of hen harrier habitat using the consensus model ; D/A – percentage of the NHZ area predicted to be suitable; E – predicted area of hen harrier habitat using the random forest model ; E/A – percentage of the NHZ area predicted to be suitable; F – predicted area of hen harrier habitat using the GAM model ; F/A – percentage of the NHZ area predicted to be suitable.
NHZ (no., Fig. 1) 2004 Survey Consensus Model
Random Forest
GAM
A B B/A C C/B D D/A E E/A F F/A Argyll West and Islands (14) 5162 3119 60 1808 58 4228 82 3728 72 4286 83 Border Hills (20) 4119 2049 50 687 34 2179 53 1964 48 2209 54 Breadalbane and East Argyll (15)
3460 1687 49 987 58 2455 71 1967 57 2546 74
Cairngorm Massif (11) 4036 1798 45 778 43 1546 38 1477 37 2383 59 Central Highlands (10) 2723 922 34 290 31 1473 54 1480 54 1295 48 Eastern Lowlands (16) 8637 595 7 133 22 363 4 360 4 218 3 Lochaber (13) 2408 468 19 211 45 1019 42 539 22 1206 50 Moray Firth (21) 1988 385 19 46 12 120 6 134 7 237 12 North Caithness and Orkney (2)
1741 885 51 552 62 1093 63 1137 65 1025 59
North East Coastal Plain (9) 3259 184 6 3 1 3 0 3 0 0 0 North East Glens (12) 3766 2487 66 1037 42 1418 38 1513 40 1302 35 North West Seaboard (4) 3586 178 5 0 0 1911 53 1220 34 2403 67 Northern Highlands (7) 5483 779 14 365 47 2784 51 2442 45 2932 53 Shetland (1) 1382 0 0 0 34 2 34 2 34 2 Peatlands of Caithness and Sutherland (5)
5202 2363 45 1494 63 3968 76 4254 82 4065 78
West Central Belt (17) 5164 829 16 535 65 1612 31 1305 25 1758 34 Western Highlands (8) 2653 245 9 99 40 1271 48 908 34 1625 61 Western Isles (3) 3147 685 22 582 85 2980 95 2414 77 3103 99 Western Seaboard (6) 3079 1914 62 1251 65 2244 73 2201 71 2556 83 Western Southern Uplands and Inner Solway (19)
6692 1854 28 1162 63 3983 60 3783 57 4211 63
Wigtown Machairs and Outer Solway (18)
777 169 22 0 45 288 37 388 50 154 20
Total 78463 23595 30 12020 51 36971 47 33249 42 39546 50
The use of 100 km2 sample squares is relatively coarse in comparison to some landscape structures and could bias our estimates of suitable habitat. Figure 8 compares the mean results from four Random Forest models with those of a GIS based model described in the scoping report for the hen harrier framework, incorporating habitat data from LCS 88 at a 1km square grain (Whitfield et al. 2006). There is a significant correlation between the areas predicted for each NHZ by the GIS model and our consensus model. However, there are some notable differences between NHZs. In four NHZs (Lochaber; Central Highlands; Border Hills and the Cairngorm Massif) the predicted areas are similar (±10%). In two NHZs
A conservation framework for hen harriers in the UK
37
(North East Coastal Plain and Shetland) the GIS Model predicts considerably larger suitable areas. There is a large discrepancy for the Wigtown Machairs and Outer Solway NHZ, with predicted areas of 288 km2 (consensus model) and 3 km2 (GIS Model). The other notable discrepancies are for the North West Seaboard and Western Isles NHZs, where the GIS model predicts considerably less suitable habitat, albeit largely geographically consistent with the consensus model predictions (details in Table 7.13 of Fielding et al. 2009). Overall, this suggests that the estimation of suitable hen harrier habitat is sensitive to the spatial grain at which land cover is measured, for example because when suitable hen harrier habitat is mapped at a finer scale, its distribution is potentially more heterogeneous than is suggested by the large sampling units. However, grain size is not systematically correlated with the direction of any bias. .Moreover, in this study, modelling probability of occupation of 100 km2 grid squares by hen harriers is more consistent with the availability and spatial resolution of the predictor variable data. Modelling abundance of hen harriers at the 100 km2 grid square resolution (or probability of occupation of smaller grid squares) would, of course, be desirable, but would need spatially comprehensive, fine resolution data on a range of additional variables, such as predator and prey abundance and incidences of illegal persecution, that are currently unavailable at country or UK scales. In terms of deriving potential population estimates for hen harrier from predictions of the extent of suitable habitat (see section 6 below), as long as any bias in our predictions is geographically consistent this shouldn’t have any large impacts. This is because our regional density estimates would be too low if we over-estimate available habitat and this would prevent an over-inflated national estimate. If the bias is not geographically consistent this could lead to a significant over- or underestimate depending on the direction of the bias in different NHZs. Unfortunately it is very difficult to assess the direction of any bias when persecution is prevalent in some NHZs. If it is assumed that the sampling effort during the 2004 survey was proportional to the availability of harrier habitat then we can have more confidence in our estimates since the NHZ predictions for all three models are significantly correlated with the actual area sampled. 5.3 Summary Hen harrier distribution across the United Kingdom and Ireland was modelled successfully using a 100 km2 sampling grid with Generalised Additive Model and Random Forest approaches. A consensus model that combined predictions from these models was selected as the most robust. A range of habitat factors, that have a sound positive or negative ecological basis, were identified by these models including topographic features (altitude standard deviation, slope mean and standard deviation), biological interactions (area of golden eagle ranges) and habitats (non-irrigated arable land, coniferous forest, natural grasslands, moors and heathland, sparsely vegetated areas and peat bogs). Interestingly these features echo Watson’s (1977) description of the harriers nineteenth century habitat “…it bred in all regions where moor, marsh and heathland and bog occupied sizeable tracts of the country”. Using the consensus models the areas of suitable habitat were estimated for a range of geographical regions. It is clear from these estimates that there is scope for a larger national population if the factors which currently restrict hen harriers are remedied. If an equal density is assumed for all regions the proportions of the national UK harrier population in each country (using data from Table 6) would be: Northern Ireland - 5.9%; Wales – 9.8%; England – 12.8% and Scotland – 71.5%. Based on the 2004 survey (Sim et al 2007), the proportions of the UK population in each Country were as follows: Northern Ireland – 8.4%; Wales 5.7%; England – 1.5% and Scotland 84.4 %
A conservation framework for hen harriers in the UK
38
6 Estimating the potential abundance of hen harriers by
extrapolation of density measures to the extent of potentially suitable habitat
Producing an appropriate estimate of the harrier’s potential population size, using density measures extrapolated from those found during surveys, is more challenging than deriving measures of potentially suitable habitat. One of the problems is that surveyed densities will be unnaturally low in some regions as a result of persecution. A range of other factors will affect numbers and productivity, of course, such as predation, habitat changes and disturbance. The persecution effects are likely to be a more significant problem in the Natural Heritage Zones (NHZs) that have significant areas of grouse moor and it was certainly an issue in England during the 2004 survey period. Similarly, the estimated areas of potentially suitable hen harrier habitat may be over- or underestimates and it is possible that any bias in these estimates is inconsistent between NHZs. Finally, it is unclear how representative the observed patterns of hen harrier occupancy during 2004 were of those over longer time scales, if only because of the potential effects of weather, prey availability and recent local persecution histories. 6.1 Methods The estimated density in each region (NHZ and country) during the 2004 survey (Sim et al 2007) was obtained, where possible, from the survey results (Table 8). Density was estimated using the number of pairs per surveyed, and occupied, 100 km2 square, corrected for the land area (i.e. removing any area of sea). Because we have restricted our density estimate to only those survey squares that were occupied, this should help to reduce the effects of illegal persecution. However, it is still possible that persecution will have depressed the local density and, therefore, our estimates of the national potential population should be considered conservative. In some NHZs no harriers were recorded during the 2004 survey but the models predicted that there was some suitable habitat. As a conservative measure we used the lowest recorded density (Western Highlands - 2.02 per 100 km2) as the potential density for such NHZs. Using these density estimates a regional total was obtained by multiplying the 2004 survey density by the predicted area of suitable habitat. It is important to note that the estimates of regional population sizes are a multiple of the amount of available habitat and the density of hen harriers in occupied habitat. In Table 10 the density is based on all surveyed habitat and includes unoccupied habitat. Consequently, density estimates differ between Tables 8 and 11. We are reasonably confident that the estimate of suitable habitat in the Western Isles is too large because much of Lewis and Harris was predicted to be suitable. One of our predicted squares on Lewis was surveyed in 2004 and there was evidence of use by a male and female harrier. Also, there have been several hen harrier sightings in the last two years (Haworth pers comm), albeit outside of the breeding season. Nonetheless, the establishment of a significant hen harrier population is unlikely given the poor small mammal fauna on these islands. However, it should be noted that the Isle of Man supports a very healthy harrier population despite the absence of voles. Similarly there are harriers on Hoy despite the absence of voles. However, on the Isle of Man, rabbits Oryctolagus cuniculus appear to be a significant part of the prey, and rabbits are not widespread on Lewis and Harris or Hoy. Consequently we produced two estimates, one using the whole of the predicted Western Isles habitats and a more conservative one excluding the Lewis and Harris habitat.
A conservation framework for hen harriers in the UK
39
We also produced, for each model, three national density estimates for Scotland. The first used the sum of all occupied habitat and the total number of pairs. The second was a mean of the NHZ densities, while the third was the sum of the estimated NHZ populations. The last method has the advantage of effectively weighting a NHZ’s contribution by its area but it could also depress the national estimate because it includes population sizes for some NHZs that are certainly depressed by local persecution. 6.2 Results In Scotland the potential national hen harrier population was estimated to be within the range 1467–2029 pairs over all models and methods, and 1467–1897 for the consensus model (Table 8). If, as seems reasonable, the estimate for the Western Isles is reduced by excluding Lewis and Harris, the revised ranges are 1361–1918 (all models) or 1467–1790 (consensus model). These ranges arise from differences in the method used. Using the two national Scottish harrier density estimates (4.86 and 5.13 pairs per 100 km2), and the consensus model habitat estimates (Table 6), it is possible to arrive at national estimates for England (323–340), Northern Ireland (148–156) and Wales (246–260). When combined with the Scottish estimates this gives a national estimate of 2514–2653 pairs, plus an additional 50–60 pairs on the Isle of Man (from the last national survey). If the third method is used to arrive at a national total for Scotland the overall estimates are reduced by approximately 100. Obviously, the accuracy of this national estimate depends on the accuracy of the density estimates and the distribution of predicted habitat. The density estimates are based on empirical data collected during the 2004 national survey and are the most comprehensive data available. The national survey is designed to ensure either sample coverage or complete coverage of all 10km squares occupied by hen harriers in the breeding seasons since 1968 (Sim et al. 2007). Consequently, it is highly unlikely that there has been any bias towards favoured areas of the hen harrier range, and consequent over-estimation of densities. In fact, it is more likely that hen harrier numbers were under-estimated through imperfect detection of harriers within occupied squares. This may occur in certain habitat types (e.g. forestry), or by predation and persecution causing abandonment of occupied territories before the birds were detected by field surveyors. The earlier hen framework scoping report (Whitfield et al. 2006b) commented on the approach that Potts (1988) used to estimate the potential size of the national population. Although we were critical of some of the methods, his prediction that the overall density in the UK should be equivalent to 1 nesting female per 25 km2 of ‘suitable’ habitat was only slightly lower than our estimates (1.21 and 1.28 per 25 km2 of ‘suitable’ habitat). Potts’ (1998) estimate that there is enough suitable habitat in England to support 232 pairs of hen harriers is lower than ours, even after adjusting for differences in the estimated average density.
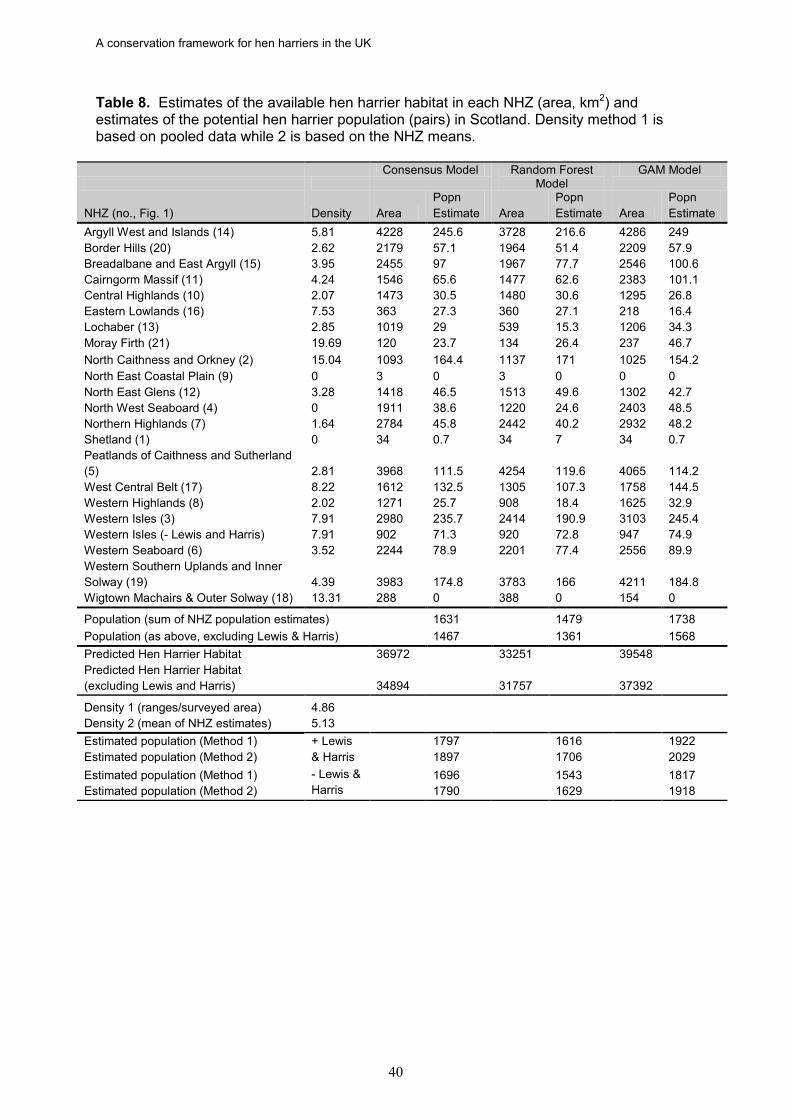
A conservation framework for hen harriers in the UK
40
Table 8. Estimates of the available hen harrier habitat in each NHZ (area, km2) and estimates of the potential hen harrier population (pairs) in Scotland. Density method 1 is based on pooled data while 2 is based on the NHZ means.
Consensus Model Random Forest
Model GAM Model
NHZ (no., Fig. 1) Density Area Popn Estimate Area
Popn Estimate Area
Popn Estimate
Argyll West and Islands (14) 5.81 4228 245.6 3728 216.6 4286 249 Border Hills (20) 2.62 2179 57.1 1964 51.4 2209 57.9 Breadalbane and East Argyll (15) 3.95 2455 97 1967 77.7 2546 100.6 Cairngorm Massif (11) 4.24 1546 65.6 1477 62.6 2383 101.1 Central Highlands (10) 2.07 1473 30.5 1480 30.6 1295 26.8 Eastern Lowlands (16) 7.53 363 27.3 360 27.1 218 16.4 Lochaber (13) 2.85 1019 29 539 15.3 1206 34.3 Moray Firth (21) 19.69 120 23.7 134 26.4 237 46.7 North Caithness and Orkney (2) 15.04 1093 164.4 1137 171 1025 154.2 North East Coastal Plain (9) 0 3 0 3 0 0 0 North East Glens (12) 3.28 1418 46.5 1513 49.6 1302 42.7 North West Seaboard (4) 0 1911 38.6 1220 24.6 2403 48.5 Northern Highlands (7) 1.64 2784 45.8 2442 40.2 2932 48.2 Shetland (1) 0 34 0.7 34 7 34 0.7 Peatlands of Caithness and Sutherland (5) 2.81 3968 111.5 4254 119.6 4065 114.2 West Central Belt (17) 8.22 1612 132.5 1305 107.3 1758 144.5 Western Highlands (8) 2.02 1271 25.7 908 18.4 1625 32.9 Western Isles (3) 7.91 2980 235.7 2414 190.9 3103 245.4 Western Isles (- Lewis and Harris) 7.91 902 71.3 920 72.8 947 74.9 Western Seaboard (6) 3.52 2244 78.9 2201 77.4 2556 89.9 Western Southern Uplands and Inner Solway (19) 4.39 3983 174.8 3783 166 4211 184.8 Wigtown Machairs & Outer Solway (18) 13.31 288 0 388 0 154 0
Population (sum of NHZ population estimates) 1631 1479 1738 Population (as above, excluding Lewis & Harris) 1467 1361 1568 Predicted Hen Harrier Habitat 36972 33251 39548 Predicted Hen Harrier Habitat (excluding Lewis and Harris) 34894 31757 37392
Density 1 (ranges/surveyed area) 4.86 Density 2 (mean of NHZ estimates) 5.13 Estimated population (Method 1) + Lewis
& Harris 1797 1616 1922
Estimated population (Method 2) 1897 1706 2029 Estimated population (Method 1) - Lewis &
Harris 1696 1543 1817
Estimated population (Method 2) 1790 1629 1918
A conservation framework for hen harriers in the UK
41
7 Assessing the national and regional conservation status of hen harriers against favourable conservation status
Watson and Whitfield (2002) introduced the overarching concept of ‘favourable conservation status’ to assess whether the elements of a conservation strategy are effective. The concept, using information from the EU Birds Directive (2009/147/EC) and Habitats and Species Directive (92/43/EEC), indicates that ‘‘conservation status of a species means the sum of the influences acting on the species concerned that may affect the long-term distribution and abundance of its populations’’ and that ‘‘the conservation status will be taken as ‘favourable’ when: • population dynamics data on the species indicate that it is maintaining itself on a
long-term basis as a viable component of its natural habitats; • the natural range of the species is neither being reduced nor is likely to be reduced
for the foreseeable future; and • there is, and will probably continue to be, a sufficiently large habitat to maintain its
populations on a long-term basis.’’ For the golden eagle, three criteria were proposed to assess favourable conservation status: the number of occupied territories, breeding performance, and proportion of suitable habitat which is occupied. Essentially these involve three ecological features of a population which are mutually inclusive: abundance, demography and distribution. Watson and Whitfield (2002) then identified thresholds for each criterion that had to be passed in order to achieve favourable status and were later applied to the golden eagle population in Scotland. 7.1 Favourable conservation status criteria for the hen harrier For the hen harrier, regional targets for favourable conservation status have been set as follows. The derivation of these criteria is explained below. • A minimum of 1.2 young fledged per breeding attempt (level 1, productivity); • at least 44% of the apparently suitable habitat occupied (level 2, habitat occupancy);
and • rather than using a population size criterion, we have adopted a density (number of
pairs per 100 km2) threshold of 2.12 pairs per 100 km2 of suitable habitat (Level 3, density).
7.1.1 Derivation of the criteria Level 1: Productivity criterion The population models (Section 4) demonstrated that, based on a range of empirical (from studies of hen harriers) estimates of survival, populations with a fledging rate below one per pair are unlikely to be self-sustaining in the medium term. Our threshold for favourable conservation status is, therefore, a fledging rate of at least 1.2 young per breeding attempt. Level 2: Habitat occupancy criterion The occupancy threshold was established from empirical data obtained for the Scottish population as part of the 2004 national survey. The proportion of surveyed habitat, within a NHZ, that was occupied by at least one pair in the 2004 survey had a mean of 0.441 (sd = 0.224, median = 0.448; data in Table 7). Because the empirical frequency distribution of occupied proportions, across the NHZs, was not significantly different from a normal distribution, we selected the mean of this empirical distribution as an occupancy threshold
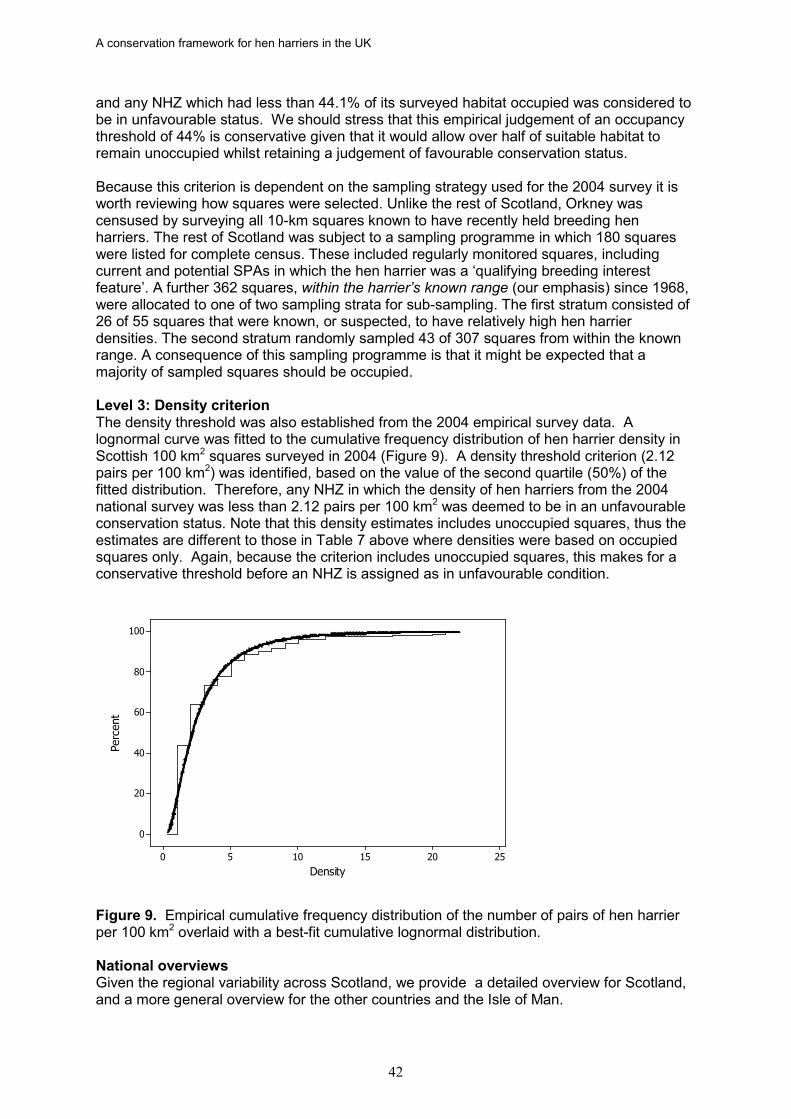
A conservation framework for hen harriers in the UK
42
and any NHZ which had less than 44.1% of its surveyed habitat occupied was considered to be in unfavourable status. We should stress that this empirical judgement of an occupancy threshold of 44% is conservative given that it would allow over half of suitable habitat to remain unoccupied whilst retaining a judgement of favourable conservation status. Because this criterion is dependent on the sampling strategy used for the 2004 survey it is worth reviewing how squares were selected. Unlike the rest of Scotland, Orkney was censused by surveying all 10-km squares known to have recently held breeding hen harriers. The rest of Scotland was subject to a sampling programme in which 180 squares were listed for complete census. These included regularly monitored squares, including current and potential SPAs in which the hen harrier was a ‘qualifying breeding interest feature’. A further 362 squares, within the harrier’s known range (our emphasis) since 1968, were allocated to one of two sampling strata for sub-sampling. The first stratum consisted of 26 of 55 squares that were known, or suspected, to have relatively high hen harrier densities. The second stratum randomly sampled 43 of 307 squares from within the known range. A consequence of this sampling programme is that it might be expected that a majority of sampled squares should be occupied. Level 3: Density criterion The density threshold was also established from the 2004 empirical survey data. A lognormal curve was fitted to the cumulative frequency distribution of hen harrier density in Scottish 100 km2 squares surveyed in 2004 (Figure 9). A density threshold criterion (2.12 pairs per 100 km2) was identified, based on the value of the second quartile (50%) of the fitted distribution. Therefore, any NHZ in which the density of hen harriers from the 2004 national survey was less than 2.12 pairs per 100 km2 was deemed to be in an unfavourable conservation status. Note that this density estimates includes unoccupied squares, thus the estimates are different to those in Table 7 above where densities were based on occupied squares only. Again, because the criterion includes unoccupied squares, this makes for a conservative threshold before an NHZ is assigned as in unfavourable condition.
2520151050
100
80
60
40
20
0
Density
Perc
ent
Figure 9. Empirical cumulative frequency distribution of the number of pairs of hen harrier per 100 km2 overlaid with a best-fit cumulative lognormal distribution. National overviews Given the regional variability across Scotland, we provide a detailed overview for Scotland, and a more general overview for the other countries and the Isle of Man.
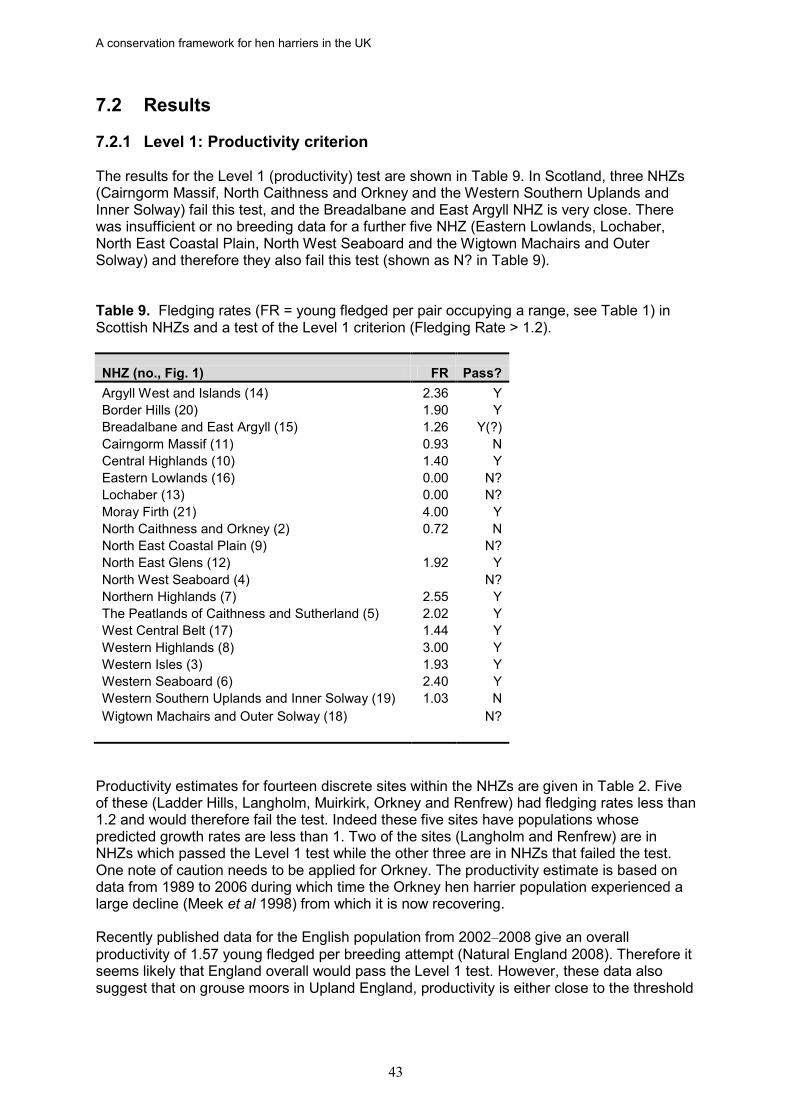
A conservation framework for hen harriers in the UK
43
7.2 Results 7.2.1 Level 1: Productivity criterion The results for the Level 1 (productivity) test are shown in Table 9. In Scotland, three NHZs (Cairngorm Massif, North Caithness and Orkney and the Western Southern Uplands and Inner Solway) fail this test, and the Breadalbane and East Argyll NHZ is very close. There was insufficient or no breeding data for a further five NHZ (Eastern Lowlands, Lochaber, North East Coastal Plain, North West Seaboard and the Wigtown Machairs and Outer Solway) and therefore they also fail this test (shown as N? in Table 9). Table 9. Fledging rates (FR = young fledged per pair occupying a range, see Table 1) in Scottish NHZs and a test of the Level 1 criterion (Fledging Rate > 1.2).
NHZ (no., Fig. 1) FR Pass? Argyll West and Islands (14) 2.36 Y Border Hills (20) 1.90 Y Breadalbane and East Argyll (15) 1.26 Y(?) Cairngorm Massif (11) 0.93 N Central Highlands (10) 1.40 Y Eastern Lowlands (16) 0.00 N? Lochaber (13) 0.00 N? Moray Firth (21) 4.00 Y North Caithness and Orkney (2) 0.72 N North East Coastal Plain (9) N? North East Glens (12) 1.92 Y North West Seaboard (4) N? Northern Highlands (7) 2.55 Y The Peatlands of Caithness and Sutherland (5) 2.02 Y West Central Belt (17) 1.44 Y Western Highlands (8) 3.00 Y Western Isles (3) 1.93 Y Western Seaboard (6) 2.40 Y Western Southern Uplands and Inner Solway (19) 1.03 N Wigtown Machairs and Outer Solway (18) N?
Productivity estimates for fourteen discrete sites within the NHZs are given in Table 2. Five of these (Ladder Hills, Langholm, Muirkirk, Orkney and Renfrew) had fledging rates less than 1.2 and would therefore fail the test. Indeed these five sites have populations whose predicted growth rates are less than 1. Two of the sites (Langholm and Renfrew) are in NHZs which passed the Level 1 test while the other three are in NHZs that failed the test. One note of caution needs to be applied for Orkney. The productivity estimate is based on data from 1989 to 2006 during which time the Orkney hen harrier population experienced a large decline (Meek et al 1998) from which it is now recovering. Recently published data for the English population from 2002–2008 give an overall productivity of 1.57 young fledged per breeding attempt (Natural England 2008). Therefore it seems likely that England overall would pass the Level 1 test. However, these data also suggest that on grouse moors in Upland England, productivity is either close to the threshold
A conservation framework for hen harriers in the UK
44
for pass or fails this level one test (Bowland Fells grouse moors =1.22, other English grouse moor areas = 1.05). Recent data from Wales (Whitfield & Fielding 2009) suggest a fledging rate of 1.45 young fledged per breeding attempt in 2004 and a long-term increase in fecundity (Whitfield et al 2008b). Therefore, it is also suggested that Wales passes the Level 1 test. This is further supported by the evidence from the last national survey, which suggests that the Welsh population was relatively stable between 1994 and 1998, but had shown a 54% increase to 43 pairs in 2004. Although we do not have productivity data for Northern Ireland, the 2004 survey recorded a large increase (66%) in the Northern Ireland population between 1998 and 2004, with 57 territorial pairs located in 2004. Such an increase is unlikely if the population was failing the Level 1 test (in the absence of evidence for substantial immigration). Therefore, using this indirect evidence, we assume that Northern Ireland also passes the Level 1 test. 7.2.2 Level 2: Habitat occupancy criterion The proportion of occupied surveyed habitat in 2004 for NHZs is shown in Table 10. A survey square was occupied if it contained at least one pair of hen harriers. In order to pass this Level 2 test, over 44% of the surveyed habitat must be occupied by hen harriers. Ten NHZs failed this test. Apart from the Western Highlands, Wigtown Machairs and the North West Seaboard, the others are in the east. Lochaber is very close to the threshold. However, it is worth noting that five of the ten failed NHZs (Eastern Lowlands, Moray Firth, North East Coastal Plain, North West Seaboard and the Western Highlands) had very little survey effort in 2004, reflecting the view that they probably contain little harrier habitat. The consensus habitat prediction model also predicts very little harrier for the first three but almost 53% of the North West Seaboard and 44% of the Western Highlands are predicted as suitable habitat. The four remaining NHZs which failed the Level 2 occupancy test are in the east and are characterized by the presence of significant areas of grouse moor (between 8% and 21% of their area, based on LCS 88). We did not have detailed information on the squares surveyed in England, Wales or Northern Ireland. Since the current distribution of hen harriers in England and Wales is very localized (e.g. Forest of Bowland in England) and there are significant areas of unoccupied, but suitable, habitat, it is clear from the 2004 national survey that neither England nor Wales would pass the Level 2 test. However, both Northern Ireland and the Isle of Man were likely to pass this test.
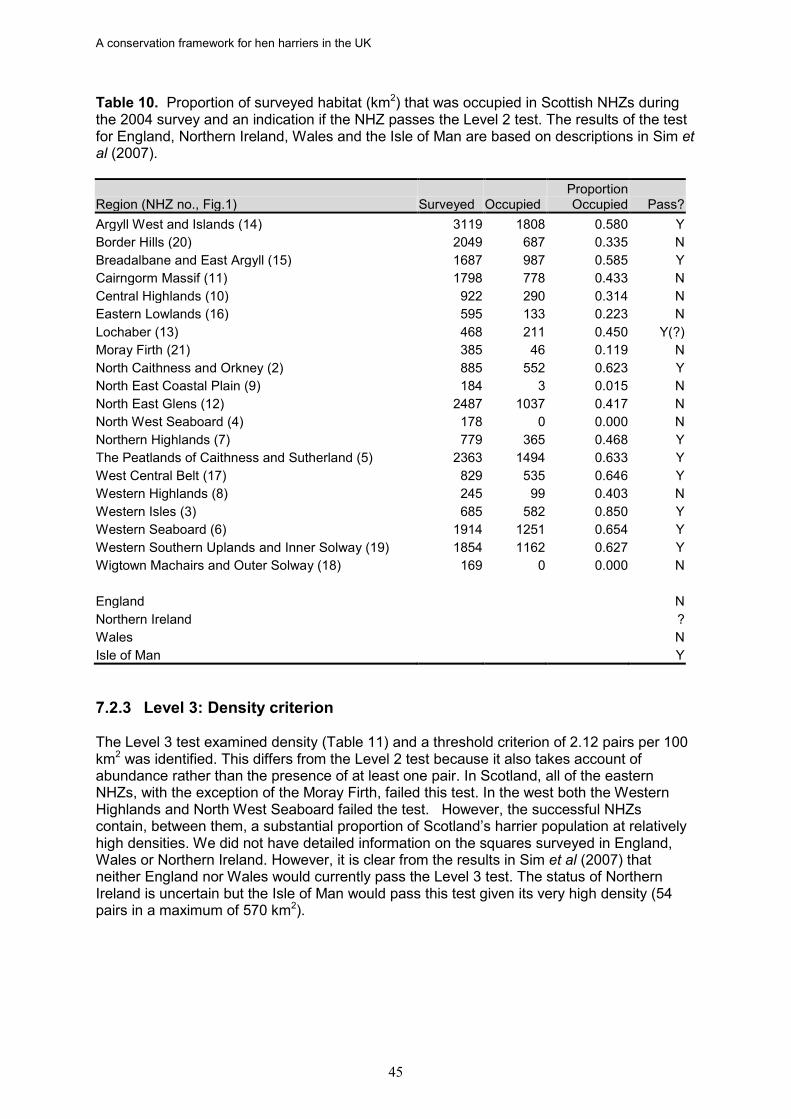
A conservation framework for hen harriers in the UK
45
Table 10. Proportion of surveyed habitat (km2) that was occupied in Scottish NHZs during the 2004 survey and an indication if the NHZ passes the Level 2 test. The results of the test for England, Northern Ireland, Wales and the Isle of Man are based on descriptions in Sim et al (2007).
Region (NHZ no., Fig.1) Surveyed Occupied Proportion Occupied Pass?
Argyll West and Islands (14) 3119 1808 0.580 Y Border Hills (20) 2049 687 0.335 N Breadalbane and East Argyll (15) 1687 987 0.585 Y Cairngorm Massif (11) 1798 778 0.433 N Central Highlands (10) 922 290 0.314 N Eastern Lowlands (16) 595 133 0.223 N Lochaber (13) 468 211 0.450 Y(?) Moray Firth (21) 385 46 0.119 N North Caithness and Orkney (2) 885 552 0.623 Y North East Coastal Plain (9) 184 3 0.015 N North East Glens (12) 2487 1037 0.417 N North West Seaboard (4) 178 0 0.000 N Northern Highlands (7) 779 365 0.468 Y The Peatlands of Caithness and Sutherland (5) 2363 1494 0.633 Y West Central Belt (17) 829 535 0.646 Y Western Highlands (8) 245 99 0.403 N Western Isles (3) 685 582 0.850 Y Western Seaboard (6) 1914 1251 0.654 Y Western Southern Uplands and Inner Solway (19) 1854 1162 0.627 Y Wigtown Machairs and Outer Solway (18) 169 0 0.000 N England N Northern Ireland ? Wales N Isle of Man Y 7.2.3 Level 3: Density criterion The Level 3 test examined density (Table 11) and a threshold criterion of 2.12 pairs per 100 km2 was identified. This differs from the Level 2 test because it also takes account of abundance rather than the presence of at least one pair. In Scotland, all of the eastern NHZs, with the exception of the Moray Firth, failed this test. In the west both the Western Highlands and North West Seaboard failed the test. However, the successful NHZs contain, between them, a substantial proportion of Scotland’s harrier population at relatively high densities. We did not have detailed information on the squares surveyed in England, Wales or Northern Ireland. However, it is clear from the results in Sim et al (2007) that neither England nor Wales would currently pass the Level 3 test. The status of Northern Ireland is uncertain but the Isle of Man would pass this test given its very high density (54 pairs in a maximum of 570 km2).
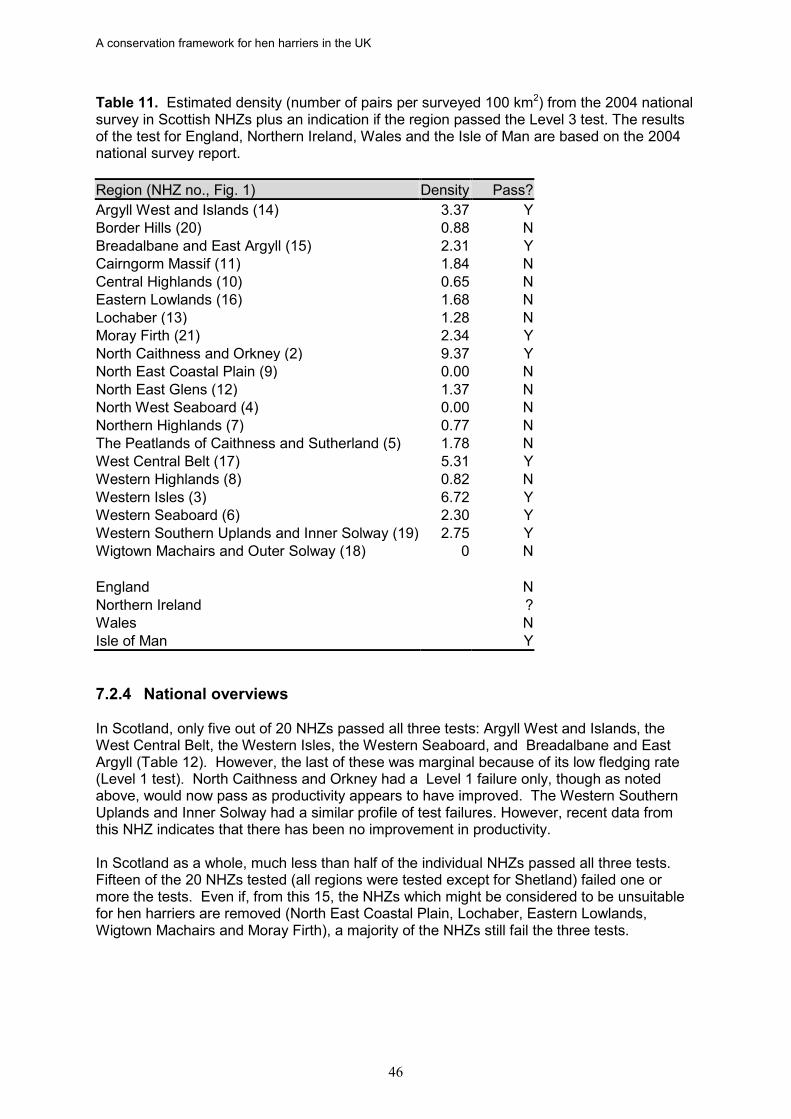
A conservation framework for hen harriers in the UK
46
Table 11. Estimated density (number of pairs per surveyed 100 km2) from the 2004 national survey in Scottish NHZs plus an indication if the region passed the Level 3 test. The results of the test for England, Northern Ireland, Wales and the Isle of Man are based on the 2004 national survey report. Region (NHZ no., Fig. 1) Density Pass? Argyll West and Islands (14) 3.37 Y Border Hills (20) 0.88 N Breadalbane and East Argyll (15) 2.31 Y Cairngorm Massif (11) 1.84 N Central Highlands (10) 0.65 N Eastern Lowlands (16) 1.68 N Lochaber (13) 1.28 N Moray Firth (21) 2.34 Y North Caithness and Orkney (2) 9.37 Y North East Coastal Plain (9) 0.00 N North East Glens (12) 1.37 N North West Seaboard (4) 0.00 N Northern Highlands (7) 0.77 N The Peatlands of Caithness and Sutherland (5) 1.78 N West Central Belt (17) 5.31 Y Western Highlands (8) 0.82 N Western Isles (3) 6.72 Y Western Seaboard (6) 2.30 Y Western Southern Uplands and Inner Solway (19) 2.75 Y Wigtown Machairs and Outer Solway (18) 0 N England N Northern Ireland ? Wales N Isle of Man Y 7.2.4 National overviews In Scotland, only five out of 20 NHZs passed all three tests: Argyll West and Islands, the West Central Belt, the Western Isles, the Western Seaboard, and Breadalbane and East Argyll (Table 12). However, the last of these was marginal because of its low fledging rate (Level 1 test). North Caithness and Orkney had a Level 1 failure only, though as noted above, would now pass as productivity appears to have improved. The Western Southern Uplands and Inner Solway had a similar profile of test failures. However, recent data from this NHZ indicates that there has been no improvement in productivity. In Scotland as a whole, much less than half of the individual NHZs passed all three tests. Fifteen of the 20 NHZs tested (all regions were tested except for Shetland) failed one or more the tests. Even if, from this 15, the NHZs which might be considered to be unsuitable for hen harriers are removed (North East Coastal Plain, Lochaber, Eastern Lowlands, Wigtown Machairs and Moray Firth), a majority of the NHZs still fail the three tests.
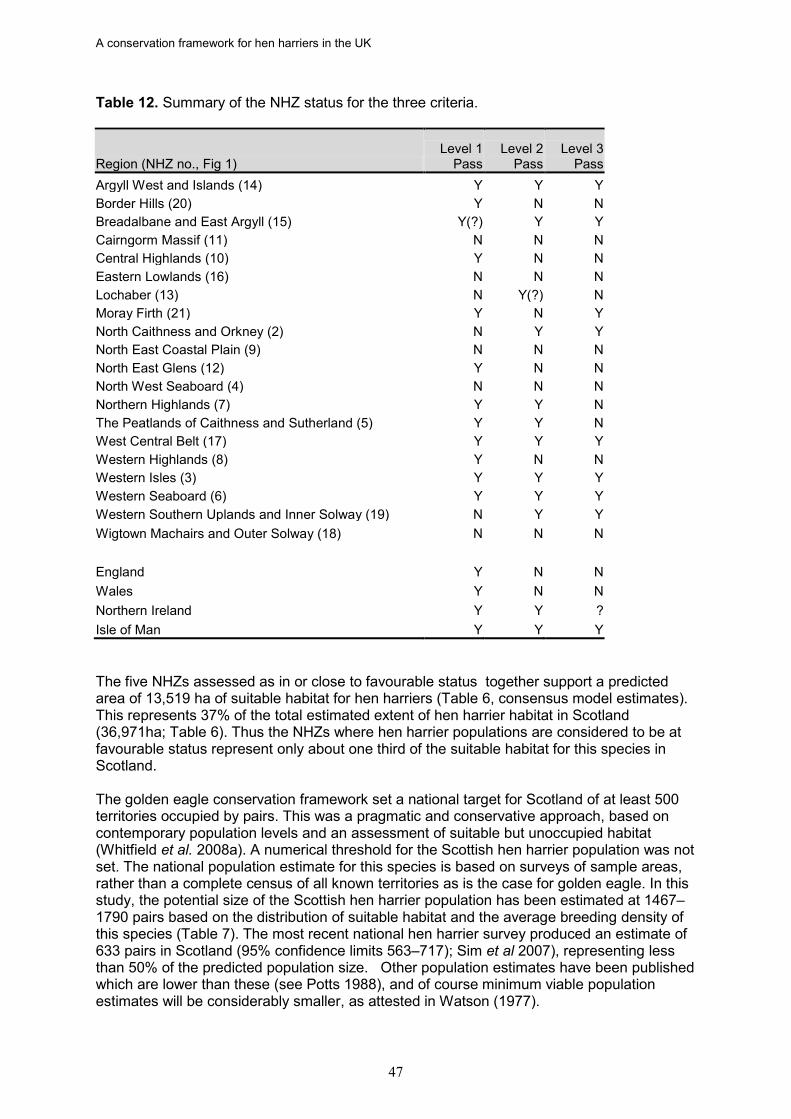
A conservation framework for hen harriers in the UK
47
Table 12. Summary of the NHZ status for the three criteria.
Region (NHZ no., Fig 1) Level 1
Pass Level 2
Pass Level 3
Pass Argyll West and Islands (14) Y Y Y Border Hills (20) Y N N Breadalbane and East Argyll (15) Y(?) Y Y Cairngorm Massif (11) N N N Central Highlands (10) Y N N Eastern Lowlands (16) N N N Lochaber (13) N Y(?) N Moray Firth (21) Y N Y North Caithness and Orkney (2) N Y Y North East Coastal Plain (9) N N N North East Glens (12) Y N N North West Seaboard (4) N N N Northern Highlands (7) Y Y N The Peatlands of Caithness and Sutherland (5) Y Y N West Central Belt (17) Y Y Y Western Highlands (8) Y N N Western Isles (3) Y Y Y Western Seaboard (6) Y Y Y Western Southern Uplands and Inner Solway (19) N Y Y Wigtown Machairs and Outer Solway (18) N N N England Y N N Wales Y N N Northern Ireland Y Y ? Isle of Man Y Y Y The five NHZs assessed as in or close to favourable status together support a predicted area of 13,519 ha of suitable habitat for hen harriers (Table 6, consensus model estimates). This represents 37% of the total estimated extent of hen harrier habitat in Scotland (36,971ha; Table 6). Thus the NHZs where hen harrier populations are considered to be at favourable status represent only about one third of the suitable habitat for this species in Scotland. The golden eagle conservation framework set a national target for Scotland of at least 500 territories occupied by pairs. This was a pragmatic and conservative approach, based on contemporary population levels and an assessment of suitable but unoccupied habitat (Whitfield et al. 2008a). A numerical threshold for the Scottish hen harrier population was not set. The national population estimate for this species is based on surveys of sample areas, rather than a complete census of all known territories as is the case for golden eagle. In this study, the potential size of the Scottish hen harrier population has been estimated at 1467–1790 pairs based on the distribution of suitable habitat and the average breeding density of this species (Table 7). The most recent national hen harrier survey produced an estimate of 633 pairs in Scotland (95% confidence limits 563–717); Sim et al 2007), representing less than 50% of the predicted population size. Other population estimates have been published which are lower than these (see Potts 1988), and of course minimum viable population estimates will be considerably smaller, as attested in Watson (1977).
A conservation framework for hen harriers in the UK
48
England and Wales both failed to achieve a favourable status. Recent data suggest that the Welsh population is currently recovering (Whitfield et al 2008b) and may achieve a favourable status in the medium term. When it is not persecuted, the English population has the potential to rapidly expand given its high fledging rates. The figure for young per breeding attempt (1.57 young per breeding attempt, 2002–2008; Natural England 2008) is well above the threshold for population expansion as identified by the population modelling, as long as survivorship is close to the normal expectation. Most breeding attempts were in the Forest of Bowland region but there was a marked difference in the performance on grouse moors and other areas (Natural England 2008). It seems likely that the English population is being constrained by poor juvenile and/or adult survival. The status for Northern Ireland is unclear but the rapid expansion reported from the 2004 national survey (Sim et al. 2007) suggests that its population is, or will soon be, in a favourable status. The very healthy status of the population on the Isle of Man is testimony to the speed with which a large harrier population can become established when conditions are suitable. It appears that there is no evidence of hen harriers breeding on the Isle of Man before 1977 (Cullen 1991. By 2004 there were approximately 50 breeding pairs, despite the absence of voles from the island, although in recent years the population has declined to about 30 pairs (Richard Selman, pers. comm.).. It is interesting that three of the Scottish NHZs deemed to be in a favourable conservation status for hen harriers (Argyll West and Islands, Western Isles and the Western Seaboard) were also identified as in favourable status for golden eagles (Whitfield et al. 2008a). Considering the other NHZs assessed as in or close to favourable conservation status for hen harrier, the West Central Belt has no recent history of occupation by golden eagles and was not tested under the golden eagle framework; Breadalbane and East Argyll failed to achieve favourable status for golden eagles because it failed the survivorship test. The westerly distribution of NHZs which are considered to be in favourable conservation status for both hen harrier and golden eagle may indicate that the status of the Scottish populations of both species could be adversely affected by climate change. Predictions for Scotland suggest that one consequence of climate change will be increased rainfall in the western Highlands and Islands, and rainfall has been shown to have adverse impacts on the productivity of both hen harriers (e.g. Amar et al 2010) and golden eagles (Haworth et al. 2009, Watson 2010). Thus actions to address constraints on the conservation status of both species in central and eastern areas of Scotland are required.
A conservation framework for hen harriers in the UK
49
8 Assessing constraints acting on hen harriers at national and regional levels and their influence on conservation status
8.1.1 Agriculture Distribution modelling found that arable land, largely restricted to the east and south of Britain (Figure 4), is associated with an absence of breeding hen harriers. This land cover class is made up of crops such as cereals and fodder and root crops. It also includes fallow land but excludes permanent pasture. In continental Europe, hen harriers have been recorded breeding in cereal fields (Garcia & Arroyo 2001, Millon et al 2002); although a notable difference between Britain and Continental Europe is the absence of the common vole Microtus arvalis which can occur in large numbers in agricultural areas in Europe (Anderson et al 2009; Koks et al 2007; Salamolard et al 2000). It is possible that lower food availability within areas of arable land in Britain, compared to equivalent areas of continental Europe, could prevent a self-sustaining population of harriers from becoming established. Two breeding attempts in 2003 and 2009, however, demonstrate that individual hen harrier pairs can, at least on occasion, successfully fledge young whilst nesting in arable areas of southern England (Richard Saunders, pers comm). Recent work investigating the feasibility of reintroducing hen harriers to southern England does suggest that passerine prey densities, based on field surveys and modelling, are within the range of abundances reported at occupied hen harrier sites elsewhere in Britain, albeit at the lower end (Saunders et al in prep). 8.1.2 Grazing The availability of nesting habitat and the abundance of hen harrier prey may be affected by the intensity of grazing. Over-grazing by red-deer Cervus elaphus and sheep Ovis aries can result in the loss of heather cover and its replacement by grass-dominated habitats. Reduction in heather cover will result in declines in the abundance of red grouse although there may increases in the numbers of small mammals and passerine birds in a given area. Management of moorland for sheep grazing may also be accompanied by extensive burning of heather and loss of stands of tall heather used by hen harriers for nesting. Trampling of hen harrier nests with eggs or small young may be a local problem in areas with high densities of deer. Distribution models found that increasing areas of natural grassland (excluding grasslands which are subject to fertilization or re-seeding) are associated with an increased probability of occupancy by hen harriers, although there is a very marked peak when approximately 25% of a square is natural grassland. This may reflect the fact that, although it is not a preferred nesting habitat, rough grassland may be positively associated with the abundance of voles and meadow pipits Anthis pratensis, important prey species for hen harriers (Arroyo et al 2009, 2006, Amar & Redpath 2005, Amar 2001). The decline of Orkney’s hen harriers has been related to the detrimental effects, on vole numbers, of overgrazing of rough grassland by sheep (Amar & Redpath 2005). Amar et al (2008) summarised much of the earlier work and confirmed the link between food limitation, preferred hunting habitat and breeding performance. Breeding attempts are more successful when nesting areas are surrounded by higher proportions of rough grass. Amar et al (2010) found that hen harrier productivity on Orkney over 33 years was negatively correlated with sheep abundance; declines in the hen harrier population were associated with a doubling in sheep numbers and the hen harrier population recovered as sheep numbers fell. On Mull, it has been shown that harriers avoided managed grassland with heavy sheep grazing and
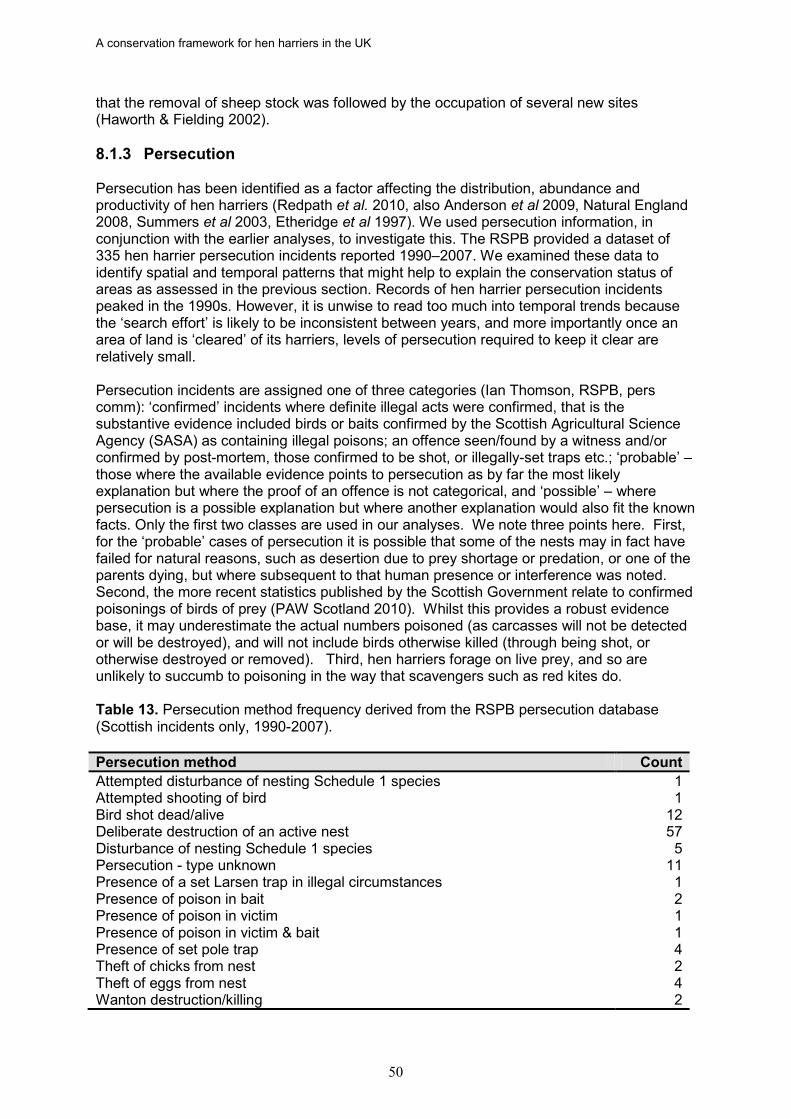
A conservation framework for hen harriers in the UK
50
that the removal of sheep stock was followed by the occupation of several new sites (Haworth & Fielding 2002). 8.1.3 Persecution Persecution has been identified as a factor affecting the distribution, abundance and productivity of hen harriers (Redpath et al. 2010, also Anderson et al 2009, Natural England 2008, Summers et al 2003, Etheridge et al 1997). We used persecution information, in conjunction with the earlier analyses, to investigate this. The RSPB provided a dataset of 335 hen harrier persecution incidents reported 1990–2007. We examined these data to identify spatial and temporal patterns that might help to explain the conservation status of areas as assessed in the previous section. Records of hen harrier persecution incidents peaked in the 1990s. However, it is unwise to read too much into temporal trends because the ‘search effort’ is likely to be inconsistent between years, and more importantly once an area of land is ‘cleared’ of its harriers, levels of persecution required to keep it clear are relatively small. Persecution incidents are assigned one of three categories (Ian Thomson, RSPB, pers comm): ‘confirmed’ incidents where definite illegal acts were confirmed, that is the substantive evidence included birds or baits confirmed by the Scottish Agricultural Science Agency (SASA) as containing illegal poisons; an offence seen/found by a witness and/or confirmed by post-mortem, those confirmed to be shot, or illegally-set traps etc.; ‘probable’ – those where the available evidence points to persecution as by far the most likely explanation but where the proof of an offence is not categorical, and ‘possible’ – where persecution is a possible explanation but where another explanation would also fit the known facts. Only the first two classes are used in our analyses. We note three points here. First, for the ‘probable’ cases of persecution it is possible that some of the nests may in fact have failed for natural reasons, such as desertion due to prey shortage or predation, or one of the parents dying, but where subsequent to that human presence or interference was noted. Second, the more recent statistics published by the Scottish Government relate to confirmed poisonings of birds of prey (PAW Scotland 2010). Whilst this provides a robust evidence base, it may underestimate the actual numbers poisoned (as carcasses will not be detected or will be destroyed), and will not include birds otherwise killed (through being shot, or otherwise destroyed or removed). Third, hen harriers forage on live prey, and so are unlikely to succumb to poisoning in the way that scavengers such as red kites do. Table 13. Persecution method frequency derived from the RSPB persecution database (Scottish incidents only, 1990-2007). Persecution method Count Attempted disturbance of nesting Schedule 1 species 1 Attempted shooting of bird 1 Bird shot dead/alive 12 Deliberate destruction of an active nest 57 Disturbance of nesting Schedule 1 species 5 Persecution - type unknown 11 Presence of a set Larsen trap in illegal circumstances 1 Presence of poison in bait 2 Presence of poison in victim 1 Presence of poison in victim & bait 1 Presence of set pole trap 4 Theft of chicks from nest 2 Theft of eggs from nest 4 Wanton destruction/killing 2
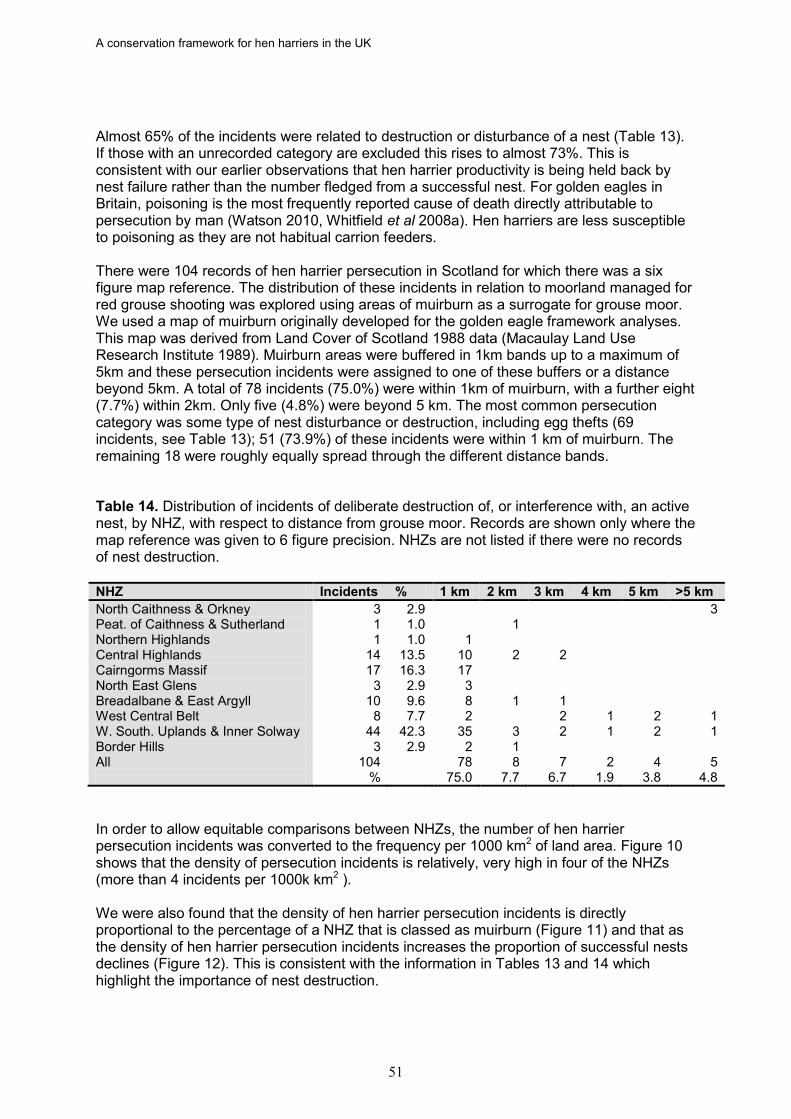
A conservation framework for hen harriers in the UK
51
Almost 65% of the incidents were related to destruction or disturbance of a nest (Table 13). If those with an unrecorded category are excluded this rises to almost 73%. This is consistent with our earlier observations that hen harrier productivity is being held back by nest failure rather than the number fledged from a successful nest. For golden eagles in Britain, poisoning is the most frequently reported cause of death directly attributable to persecution by man (Watson 2010, Whitfield et al 2008a). Hen harriers are less susceptible to poisoning as they are not habitual carrion feeders. There were 104 records of hen harrier persecution in Scotland for which there was a six figure map reference. The distribution of these incidents in relation to moorland managed for red grouse shooting was explored using areas of muirburn as a surrogate for grouse moor. We used a map of muirburn originally developed for the golden eagle framework analyses. This map was derived from Land Cover of Scotland 1988 data (Macaulay Land Use Research Institute 1989). Muirburn areas were buffered in 1km bands up to a maximum of 5km and these persecution incidents were assigned to one of these buffers or a distance beyond 5km. A total of 78 incidents (75.0%) were within 1km of muirburn, with a further eight (7.7%) within 2km. Only five (4.8%) were beyond 5 km. The most common persecution category was some type of nest disturbance or destruction, including egg thefts (69 incidents, see Table 13); 51 (73.9%) of these incidents were within 1 km of muirburn. The remaining 18 were roughly equally spread through the different distance bands. Table 14. Distribution of incidents of deliberate destruction of, or interference with, an active nest, by NHZ, with respect to distance from grouse moor. Records are shown only where the map reference was given to 6 figure precision. NHZs are not listed if there were no records of nest destruction. NHZ Incidents % 1 km 2 km 3 km 4 km 5 km >5 km North Caithness & Orkney 3 2.9 3 Peat. of Caithness & Sutherland 1 1.0 1 Northern Highlands 1 1.0 1 Central Highlands 14 13.5 10 2 2 Cairngorms Massif 17 16.3 17 North East Glens 3 2.9 3 Breadalbane & East Argyll 10 9.6 8 1 1 West Central Belt 8 7.7 2 2 1 2 1 W. South. Uplands & Inner Solway 44 42.3 35 3 2 1 2 1 Border Hills 3 2.9 2 1 All 104 78 8 7 2 4 5 % 75.0 7.7 6.7 1.9 3.8 4.8 In order to allow equitable comparisons between NHZs, the number of hen harrier persecution incidents was converted to the frequency per 1000 km2 of land area. Figure 10 shows that the density of persecution incidents is relatively, very high in four of the NHZs (more than 4 incidents per 1000k km2 ). We were also found that the density of hen harrier persecution incidents is directly proportional to the percentage of a NHZ that is classed as muirburn (Figure 11) and that as the density of hen harrier persecution incidents increases the proportion of successful nests declines (Figure 12). This is consistent with the information in Tables 13 and 14 which highlight the importance of nest destruction.
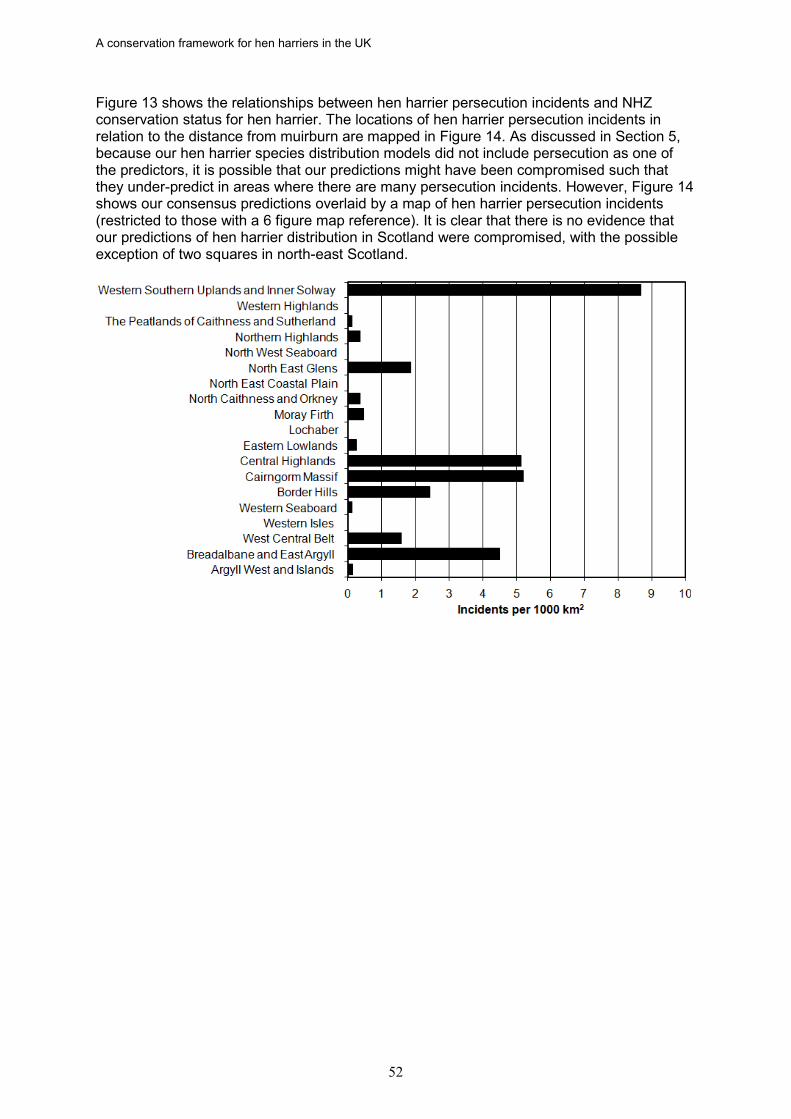
A conservation framework for hen harriers in the UK
52
Figure 13 shows the relationships between hen harrier persecution incidents and NHZ conservation status for hen harrier. The locations of hen harrier persecution incidents in relation to the distance from muirburn are mapped in Figure 14. As discussed in Section 5, because our hen harrier species distribution models did not include persecution as one of the predictors, it is possible that our predictions might have been compromised such that they under-predict in areas where there are many persecution incidents. However, Figure 14 shows our consensus predictions overlaid by a map of hen harrier persecution incidents (restricted to those with a 6 figure map reference). It is clear that there is no evidence that our predictions of hen harrier distribution in Scotland were compromised, with the possible exception of two squares in north-east Scotland.
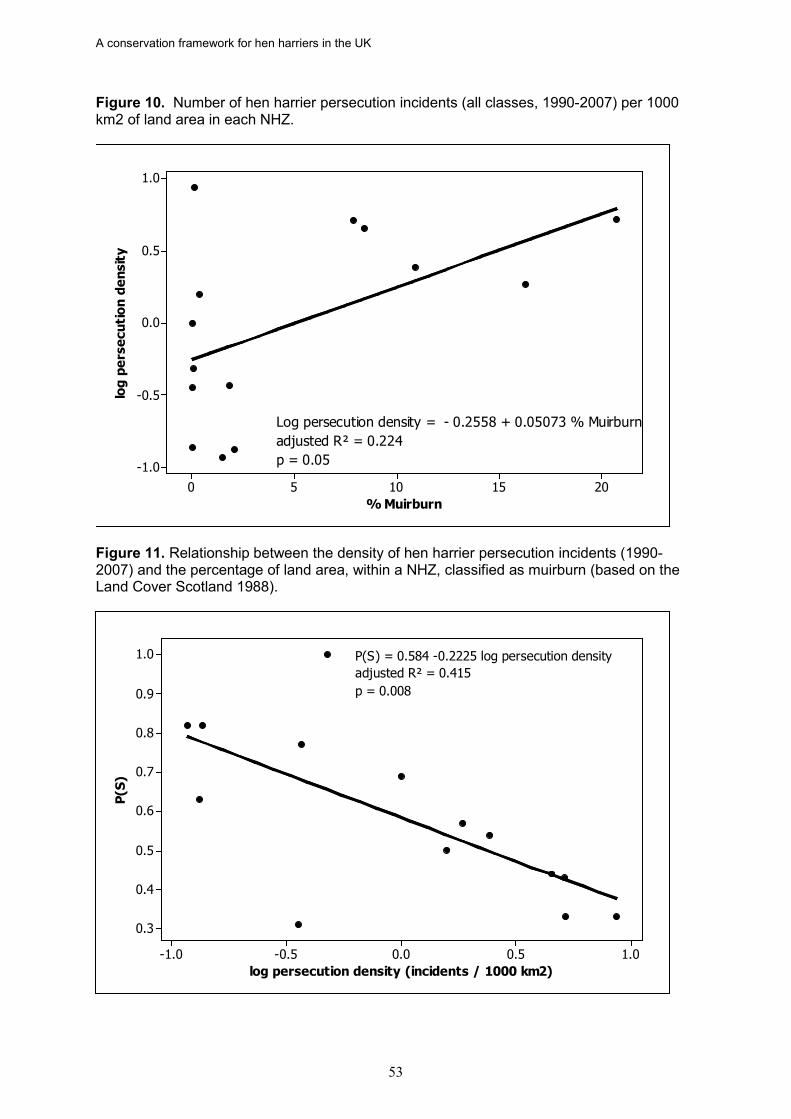
A conservation framework for hen harriers in the UK
53
Figure 10. Number of hen harrier persecution incidents (all classes, 1990-2007) per 1000 km2 of land area in each NHZ.
20151050
1.0
0.5
0.0
-0.5
-1.0
% Muirburn
log
pers
ecut
ion
dens
ity
p = 0.05adjusted R² = 0.224Log persecution density = - 0.2558 + 0.05073 % Muirburn
Figure 11. Relationship between the density of hen harrier persecution incidents (1990-2007) and the percentage of land area, within a NHZ, classified as muirburn (based on the Land Cover Scotland 1988).
1.00.50.0-0.5-1.0
1.0
0.9
0.8
0.7
0.6
0.5
0.4
0.3
log persecution density (incidents / 1000 km2)
P(S)
p = 0.008adjusted R² = 0.415P(S) = 0.584 -0.2225 log persecution density
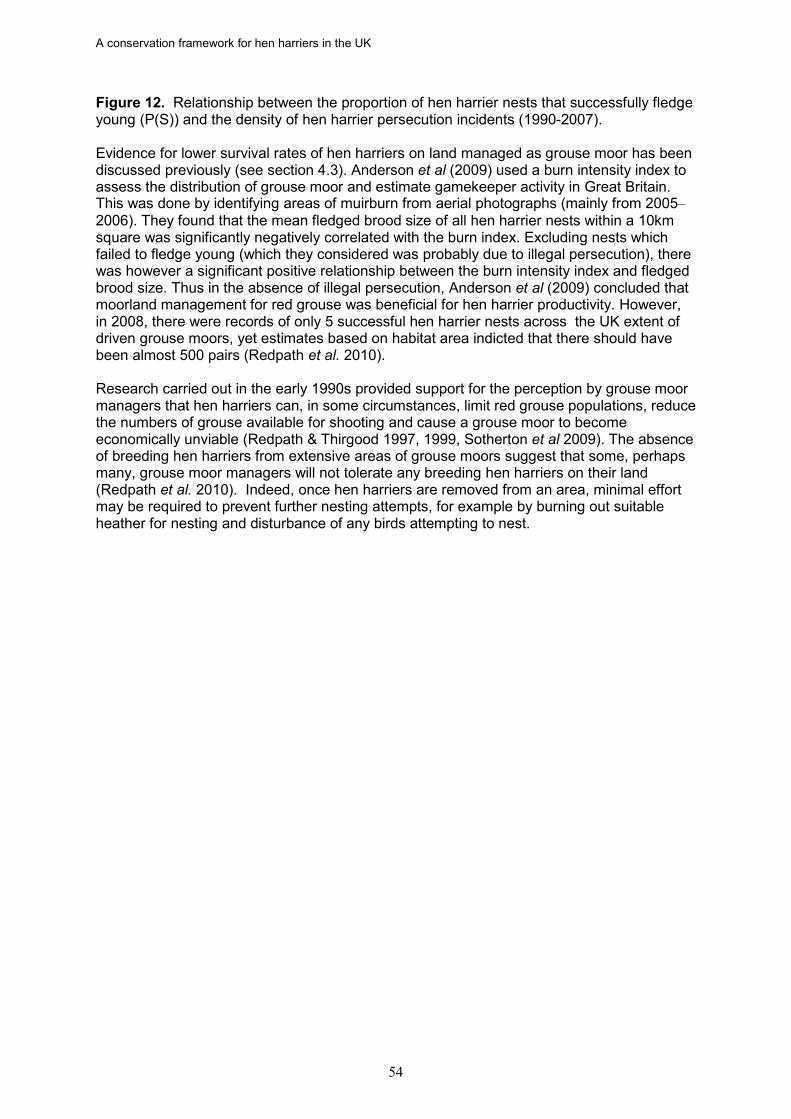
A conservation framework for hen harriers in the UK
54
Figure 12. Relationship between the proportion of hen harrier nests that successfully fledge young (P(S)) and the density of hen harrier persecution incidents (1990-2007). Evidence for lower survival rates of hen harriers on land managed as grouse moor has been discussed previously (see section 4.3). Anderson et al (2009) used a burn intensity index to assess the distribution of grouse moor and estimate gamekeeper activity in Great Britain. This was done by identifying areas of muirburn from aerial photographs (mainly from 2005–2006). They found that the mean fledged brood size of all hen harrier nests within a 10km square was significantly negatively correlated with the burn index. Excluding nests which failed to fledge young (which they considered was probably due to illegal persecution), there was however a significant positive relationship between the burn intensity index and fledged brood size. Thus in the absence of illegal persecution, Anderson et al (2009) concluded that moorland management for red grouse was beneficial for hen harrier productivity. However, in 2008, there were records of only 5 successful hen harrier nests across the UK extent of driven grouse moors, yet estimates based on habitat area indicted that there should have been almost 500 pairs (Redpath et al. 2010). Research carried out in the early 1990s provided support for the perception by grouse moor managers that hen harriers can, in some circumstances, limit red grouse populations, reduce the numbers of grouse available for shooting and cause a grouse moor to become economically unviable (Redpath & Thirgood 1997, 1999, Sotherton et al 2009). The absence of breeding hen harriers from extensive areas of grouse moors suggest that some, perhaps many, grouse moor managers will not tolerate any breeding hen harriers on their land (Redpath et al. 2010). Indeed, once hen harriers are removed from an area, minimal effort may be required to prevent further nesting attempts, for example by burning out suitable heather for nesting and disturbance of any birds attempting to nest.
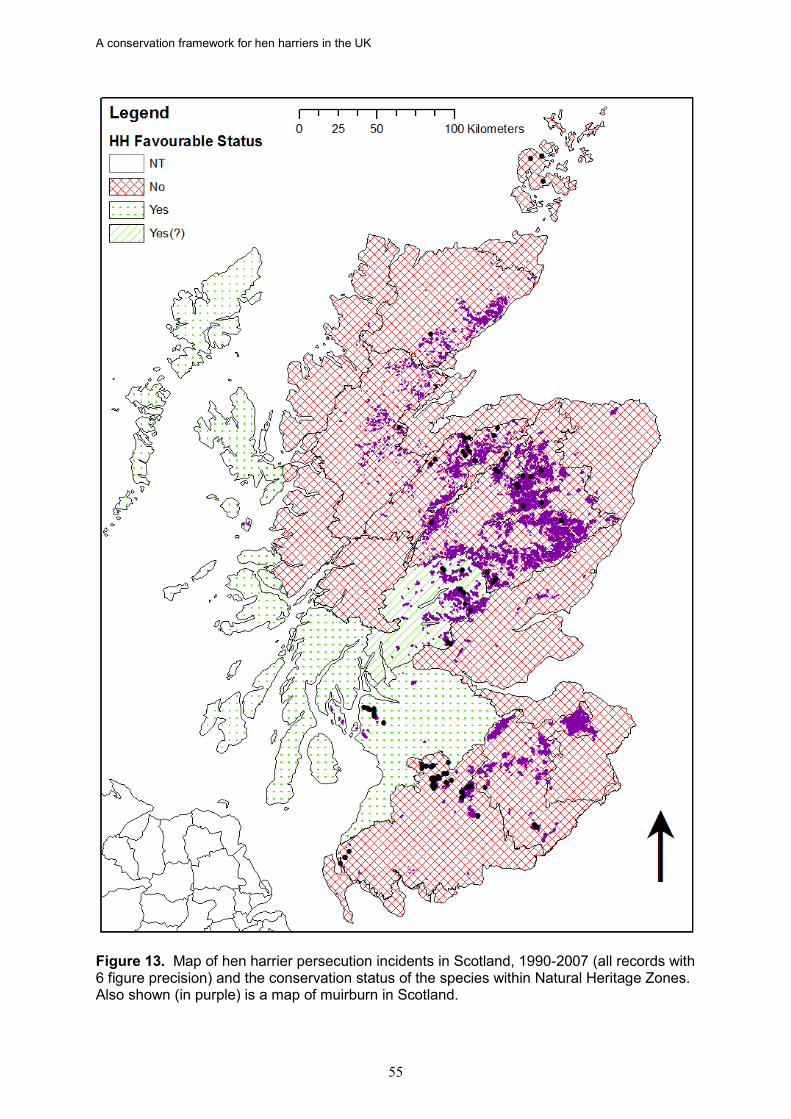
A conservation framework for hen harriers in the UK
55
Figure 13. Map of hen harrier persecution incidents in Scotland, 1990-2007 (all records with 6 figure precision) and the conservation status of the species within Natural Heritage Zones. Also shown (in purple) is a map of muirburn in Scotland.
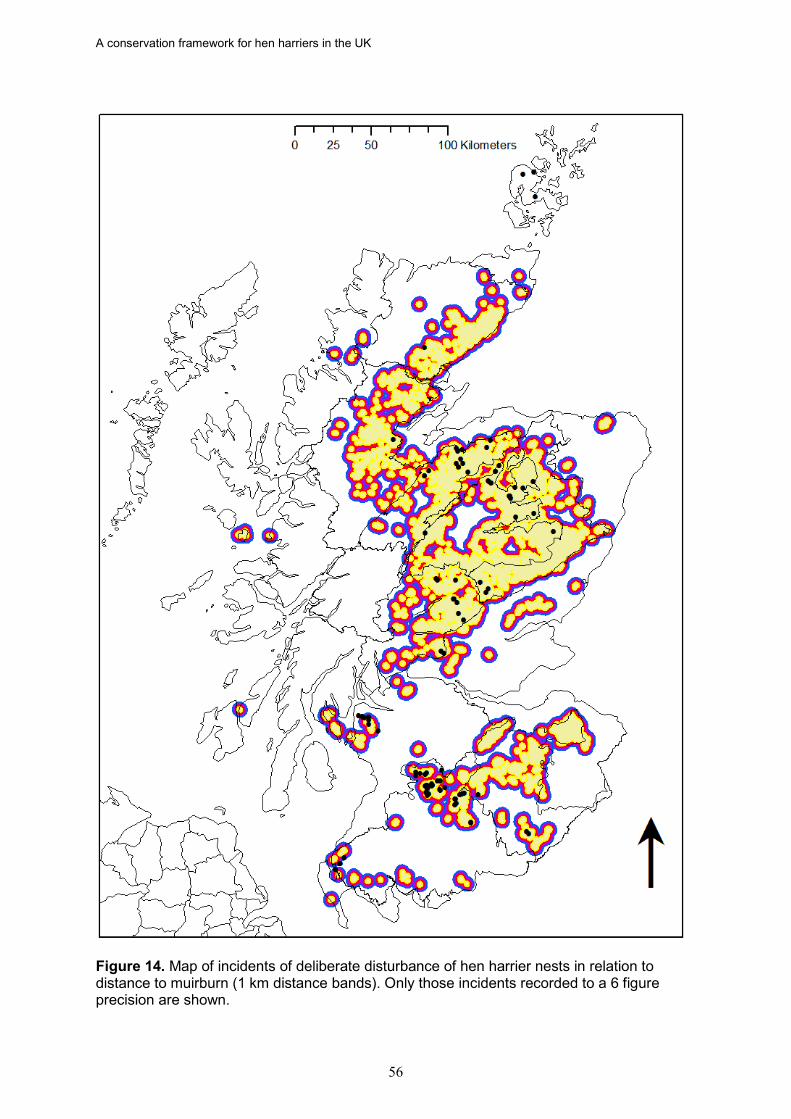
A conservation framework for hen harriers in the UK
56
Figure 14. Map of incidents of deliberate disturbance of hen harrier nests in relation to distance to muirburn (1 km distance bands). Only those incidents recorded to a 6 figure precision are shown.
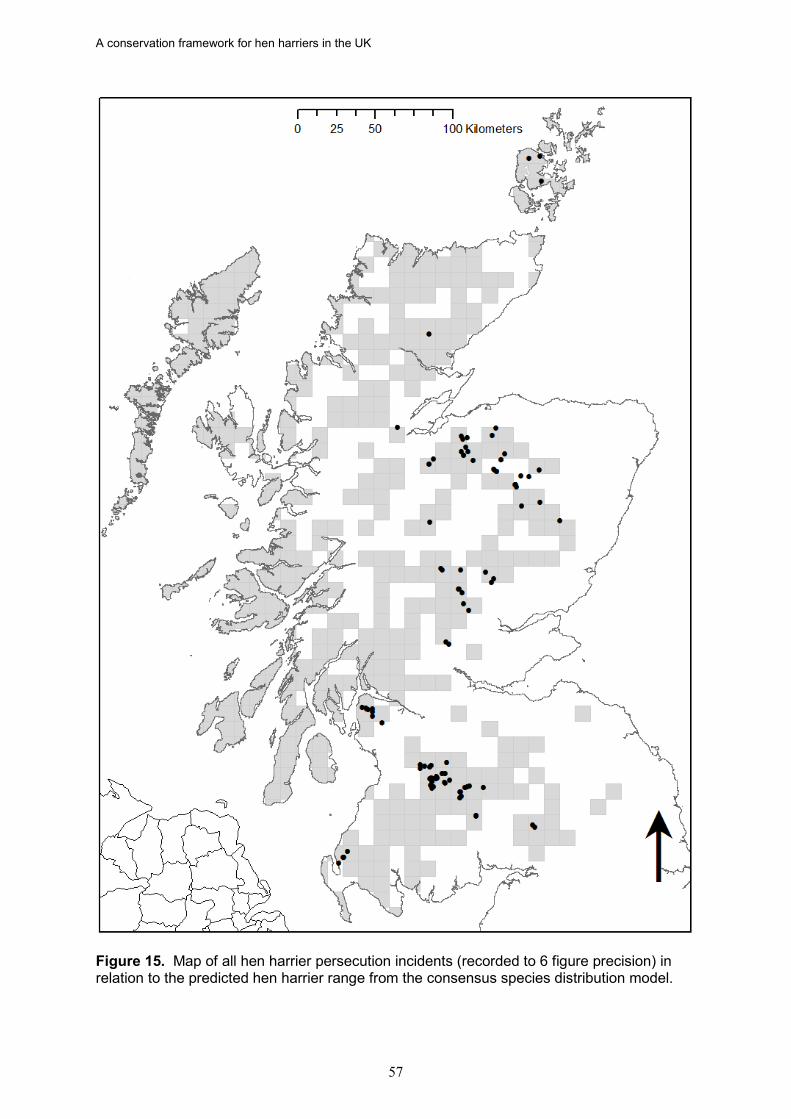
A conservation framework for hen harriers in the UK
57
Figure 15. Map of all hen harrier persecution incidents (recorded to 6 figure precision) in relation to the predicted hen harrier range from the consensus species distribution model.
A conservation framework for hen harriers in the UK
58
Strenuous efforts are being made to manage and seek solutions to the conflict between hen harrier conservation and grouse moor management. This includes actions to enforce the law and prevent the illegal killing of hen harriers, as well as partnership approaches between conservation organisations, grouse moor managers and representative bodies, with the aim of identifying ways to reduce the impact of hen harrier predation on grouse-shooting businesses (Redpath et al 2010). As mentioned in the introduction, the Langholm Moor Demonstration Project and the NE-led Environment Council dispute resolution process are important activities which are founded on a strong evidence base to underpin discussions and proposals. With respect to enforcement, the illegal persecution of birds of prey, with specific reference to hen harrier (as well as goshawk, golden eagle, red kite and white-tailed eagle) is identified as a national priority for tackling wildlife crime by the Police National Wildlife Crime Unit and the UK Partnership for Action against Wildlife Crime (PAW 2011). But illegal persecution of hen harriers is difficult to prove, for example because evidence (shot birds, trampled nests, broken eggs, dead chicks, cartridge shells) can be easily removed by perpetrators who may be increasingly aware of modern forensic techniques. Options for resolving the conflict between hen harrier conservation and red grouse shooting include management to reduce predation rates on red grouse. The most promising technique involves diversionary feeding, providing carrion to nesting hen harriers to reduce predation rates on red grouse (Redpath et al 2010); trials have indicated that supplementary feeding can substantially reduce the number of red grouse chicks delivered to nests by both male and female hen harriers (Redpath et al 2001). Other options include habitat management to reduce hen harrier nesting densities and / or create feeding areas away from areas managed for red grouse shooting (Arroyo et al 2009), and limitation of hen harrier densities through golden eagle predation (if eagles move into grouse moor areas in which they are currently absent as breeders) (Thompson et al 2009). Options for management of hen harrier numbers through non-lethal human intervention (e.g. by trapping and translocation of adults or chicks) are illegal under current legislation (Anon 2000). Sotherton et al. (2009) point out that much of the conflict between hen harriers and red grouse arises from the need, under the current culture of driven shooting, to produce high grouse densities to justify the large investment made by landowners in moorland management. They consider whether a less intensive management regime with lower harvest rates (‘walked up’ rather than driven grouse shooting) could be adopted as suggested by Thompson et al. (2009), but argue that management of grouse moors for walked-up shooting would not be profitable because the current culture of driven shooting generates about 10 times the revenue of walked-up shooting. They predict that a large decrease in grouse bags would lead to reduced investment in shooting estates with negative impacts on local communities, and also that reducing the intensity of grouse moor management would significantly reduce the conservation value of heather moorlands in the UK. They identify diversionary feeding of hen harriers as the most promising technique for managing the conflict, and they note that further trials are required and the potential for success may be limited in the absence of legal measures to maintain a ‘ceiling’ on hen harrier densities in given areas. 8.1.4 Predation A number of species have been recorded predating hen harriers or their eggs and young. Much of the information on predation of hen harriers is anecdotal, however, so it is not possible to quantify possible effects on demography and the extent to which predation may represent a constraint. Variation in the aggressiveness with which hen harriers defend their nests may affect the susceptibility of eggs and chicks to predation (Watson 1977), as may
A conservation framework for hen harriers in the UK
59
the attentiveness of the parent birds, which may be influenced by the availability of prey (Amar & Burthe 2002). In some regions foxes are thought to be an important predator of hen harrier nests and could potentially be a constraint on breeding success. An investigation of the impacts of foxes found that nest success of hen harriers within a particular land management class was not significantly different inside and outside the range of the fox in Scotland (Green & Etheridge 1999). On this basis it would seem unlikely that foxes will have a sufficiently large effect to prevent breeding attempts in a region. In Wales, fox predation was found to be one of two main causes of breeding failure in hen harriers (the other was persecution): of 86 failed attempts where the cause could be identified, 20 were due to fox predation (Whitfield & Fielding 2009). Concerns have recently been expressed about the impacts of fox predation on hen harriers on Skye although in Kintyre breeding hen harriers and foxes appear to be abundant (Paul Haworth, pers obs). Bob McMillan (pers comm) reports that three of the ten hen harrier breeding attempts in North Skye in 2010 failed due to fox predation, with a further two failures suspected of being caused by fox predation. At one nest, the sitting female and eggs were predated by a fox and four chicks raised by a replacement female were also predated by a fox. Undoubtedly, foxes can be important predators but, as noted previously, they were not included as a predictor in the hen harrier distribution model because, apart from some of the islands, there are insufficient data on their distribution and abundance to make them a reliable predictor. In addition, their impact seems to be largely on hen harrier productivity rather than distribution. The polecat-ferret is thought to be a significant predator on the Isle of Man (Cullen 1991). Stoats Mustela erminea, weasels Mustela nivalis, mink Neovison vison, otters Lutra lutra and pine martens Martes martes may also potentially predate hen harrier nests. Comprehensive mapped information on the distribution of one potential avian predator, the golden eagle, was available for incorporation in the distribution modelling for hen harrier. Golden eagles are known to take hen harriers and other smaller raptors; for example a golden eagle was observed predating a hen harrier nest on Jura in 2005, a hen harrier chick was seen in a golden eagle nest on Mull in 2008 (Paul Haworth, pers comm), and male hen harrier feathers were found in the prey remains of a golden eagle close to an eyrie in Perthshire in 2005 (Keith Brickie, pers comm). During monitoring of the Beinn an Tuirc wind farm an adult hen harrier was predated by the one of the resident golden eagles. Modelling indicated that increasing golden eagle activity is generally detrimental to hen harriers. On the Uists, hen harriers and other raptor species were found to show significant avoidance of areas within 2km of golden eagle nests, which may indicate they were excluded from areas of suitable habitat. Successful hen harrier nests within 2km of an eagle nest were found to produce fewer young than nests further away (Haworth et al 2010). Hooded crows Corvus cornix were considered to be the main potential predators of hen harrier eggs on Orkney (Picozzi 1984) and have been documented as killing relatively large hen harrier chicks (Amar & Burthe 2002). An increase in crow numbers was identified as a possible cause of the decline of Orkney hen harriers in the late 20th Century; however, the removal of crows from breeding territories of harriers had no detectable effect on breeding success (Amar & Redpath 2002). Perhaps surprisingly there may also be interactions between short-eared owls Asio flammeus and hen harriers. In the north of Skye a short-eared owl was observed to chase and dive at a female hen harrier; the two birds locked together and when the harrier was released or broke free it flew slowly as if possibly injured (Ken Crane, pers comm). There are also cases of short-eared owls predating harrier chicks on Islay (Ogilvie, pers comm). Buzzard Buteo buteo predation of hen harrier nests has been recorded on Islay in 2007 when two and possibly three hen harrier nests were predated by buzzards (Argyll Raptor
A conservation framework for hen harriers in the UK
60
Study Group report) and a case of probable predation by a buzzard on the tree-nest of a hen harrier has been recorded in Northern Ireland (Scott 2000). Feathers of recently fledged hen harriers were found in prey remains from a peregrine site in Perthshire in 1986 (Sandy Payne & Wendy Mattingley, pers comm) and radio-tagged juvenile hen harriers have been found in the nest of a peregrine in northern England (Richard Saunders pers comm). There is also some evidence that young harriers were predated from a nest on Mull by white-tailed eagle Haliaeetus albicilla (Paul Haworth, pers obs). Finally, in the Bowland Fells in Lancashire, eagle owls Bubo bubo have been linked to both intra-guild predation and nest failure. The remains of an adult female and feathers from at least one juvenile hen harrier were found amongst other eagle owl prey remains recovered near the owl’s nest, and in 2010 an eagle owl was filmed on CCTV attacking a nesting female hen harrier; the incubating harrier was not seen again and its nest subsequently failed (Natural England & RSPB 2010). It is clear from the above that hen harriers experience predation from a wide range of mammals and birds. It should be unsurprising that this happens in predator assemblages that are largely free from human interference. 8.1.5 Prey The principal prey of hen harriers are small mammals (microtine voles and lagomorphs), passerine birds and grouse. In many parts of their range, the density and clutch size of hen harriers appears to be determined by the abundance of voles (Redpath et al 2002). For six Scottish moorland areas, the mean breeding density of hen harriers appeared to be set by the abundance of meadow pipits, and between years numbers fluctuated around the mean density in accordance with the availability of small mammals. Breeding densities of harriers were not related to the density of red grouse, although later in the season, harriers appeared to switch their hunting patterns to search for red grouse chicks as grouse densities increased (Redpath & Thirgood 1999). In the absence of comprehensive data on the abundance of meadow pipits and small mammals, it was not possible to include prey abundance in the distribution models for hen harrier. Evidence for prey availability as a constraint on harriers is provided by studies on Orkney where reduced breeding success was linked to a reduction in food supply and experimental provision of food increased the number of breeding females per male (Amar & Redpath 2002). Overgrazing of rough grasslands or conversion of such areas to intensive pasture means that they support lower densities of important prey species such as Orkney voles Microtus arvalis, snipe Gallinago gallinago and meadow pipits. Orkney voles in particular may be more available to hunting harriers within rough grassland than the moorland nesting areas. Male hen harriers in Orkney showed a preference for hunting on rough grassland and there was a significant positive association between the proportion of rough grass surrounding a nesting area and the probability of hatching, breeding success and productivity (Amar et al 2008). The association between changes in sheep numbers on Orkney and productivity of hen harriers (Amar et al 2010) indicates that, in this region, sheep abundance can be used as a surrogate for prey abundance. 8.1.6 Weather and climate change A climate-based model, based on the distribution of hen harriers in Europe, was found to be a poor predictor of the distribution of hen harriers in Britain. Areas in the south and east of Britain were predicted to be the most suitable climatically, whereas hen harriers tend to be found in the cooler and wetter north and west, where the climate is predicted to be less suitable. This implies that either the climatic preferences of hen harriers in Britain differ from
A conservation framework for hen harriers in the UK
61
those in continental Europe, or that confounding factors such as persecution (historical or current), learned behaviour and/or ecosystem changes or differences in prey availability are more important in the distribution of hen harrier in Britain (Anderson et al 2008). Redpath et al 2002 found, in a Scottish population of hen harriers, that female brooding time increased in cold weather and male provisioning rate was negatively related to temperature and rainfall. Chick mortality increased in cold temperatures and was most likely to occur at nests where male prey delivery rates were low relative to temperature. Annual productivity of hen harriers across Scotland was positively related to summer temperature. In Wales, warmer temperatures have been identified as a factor in the recovery of the hen harrier population (Whitfield et al 2008). By contrast, in Spain, fledged brood size was negatively related to temperature (Redpath et al 2002). Spring rainfall was found to have a negative effect on the productivity of Orkney hen harriers, although accounting for less variation than sheep numbers. The effect seems to be a reduction in the time that harriers can spend hunting and the amount of food that male harriers can supply to females in the critical pre-laying period (Amar et al 2010, Amar et al 2003a & b, Amar & Redpath 2002, Amar 2001). On the Uists, hen harrier productivity was found to increase with rainfall in May and reduced rainfall in June (Haworth et al 2010). Unlike Orkney, no polygyny was recorded in this population so any effect of spring rainfall on the ability of the male to provision a single incubating female may not affect productivity, whereas on Orkney a male may be feeding more than one female. The prediction that climate change may increase rainfall in the north and west of Scotland suggests that there is potential for negative impacts on hen harriers in some of the most important areas of their British range. 8.1.7 Wind Farms The recent expansion of onshore wind farm developments in Scotland has attracted controversy with respect to potential impacts on birds. Wind farms may displace birds from the immediate area of the turbines through disturbance and killing birds which strike the moving turbine blades. For the purpose of environmental assessment, long-term observations of flight activity in the development area are used to calculate a collision risk for bird species using the proposed wind farm site (Band et al 2007). Post-construction monitoring is being carried out at a number of developments to assess the impacts on birds, including hen harriers, in terms of habitat loss, avoidance and / or collision mortality. Unfortunately, very few monitoring results are available in the public domain at the time of writing. Pearce-Higgins et al (2009) assessed bird distribution in the vicinity of 12 upland wind farms and found levels of avoidance suggesting that the breeding density of hen harriers may be reduced within 250m of turbines. For two wind farms on Skye, Edinbane and Ben Aketil (30 turbines in total), hen harrier activity was found to increase during three years of construction and post-construction monitoring. In 2007, 29% of hen harrier flights were within 500m of turbines), compared with 51% in 2008 and 40% in 2009. This pattern has continued up to September 2010 (Haworth pers comm.). In 2008 and 2009 a pair of hen harriers bred successfully within 500m of an operational turbine (Fielding & Haworth 2010). Harriers nested again at the same location in 2010 but the original and replacement attempts failed due to fox predation (McMillan 2010). Other displacement studies have also concluded that foraging hen harriers have a low sensitivity to disturbance at operational wind farms and that birds will nest within 200–300m of turbines (Whitfield & Madders 2005). For example, hen
A conservation framework for hen harriers in the UK
62
harriers have bred successfully close to turbines (250 m) at Cruach Mhor and “11 young have successfully fledged at Cruach Mhor” 2003-07 (http://www.scottishpower.com/p5.asp) Research into collision fatalities has been carried out for at least 10 wind farms, with deaths recorded at three sites (all in the United States). Mortality was not found to be related to hen harrier activity. This suggests that hen harriers do not appear to be very susceptible to colliding with turbine blades (Whitfield & Madders 2005). Nevertheless, a review of the spatial overlap of current and proposed wind farm developments in Scotland with peatland areas highlighted hen harrier as a species where the cumulative effects of wind farms required further assessment (Bright et al 2008). 8.1.8 Woodland The proliferation of conifer plantations in the Scottish uplands from the mid-20th Century onwards favoured hen harriers by providing, at least in the early years of tree growth, hunting and nesting grounds free from human disturbance (Bibby & Etheridge 1993). Together with reduced gamekeeping activities during the second world war, this contributed to the re-colonisation of the Scottish mainland by the hen harrier (Etheridge 2007). However, there were expectations that maturing plantations (from 7–15 years after planting) would not provide suitable habitat for hen harriers because of reduced access to open hunting grounds as the canopy closed, and that for similar reasons the species would not re-colonise areas of clear-felled timber (Sim et al 2001). Detailed studies of habitat and nest site selection in the 1990s predicted that with declines in first rotation forestry there would be a reduction in the numbers of hen harriers breeding in the west of Scotland and an increase in harriers attempting to breed elsewhere on grouse moor (Redpath et al 1998; Sim et al 2001, Madders 2000, 2003). More recent studies, however, indicate that utilisation of woodland habitats by breeding hen harriers may be much more extensive than previously realised. The most up to date surveys in Ireland have demonstrated the importance of forests to a large segment of the breeding hen harrier population (Barton et al 2006, Wilson et al 2009) and a study of habitat selection in France has concluded that hen harriers favour areas with more than 25% tree cover and heathland greater than 2m tall (Cormier et al 2008). Particularly in western Scotland, it is now clear that hen harriers are breeding successfully in a wide variety of habitats that can be broadly classified as woodland. These include mature conifer plantations, second rotation conifer plantations, newly planted native woodland, areas set aside for natural regeneration and open areas of naturally regenerating woodland and scrub (Haworth & Fielding 2009). Petty and Anderson (1986) recognized the importance of landscape configuration if hen harriers were to breed in restocked conifer forest, noting that access to suitable large areas of open ground could be critical. After planting peaked in the late 1970s, large areas of coniferous forest are undergoing restructuring. Changes in forestry practice to enhance biodiversity mean that many forests, even when re-planted, will contain larger areas of open ground than previously. These may be of some importance to hen harriers as hunting areas. Haworth & Fielding (2009) reviewed the use of forest habitats by hen harriers in Scotland and investigated the availability of woodland habitat potentially suitable for breeding hen harriers in selected areas of western Scotland. They reported forest-nesting harriers on the Uists, Skye, Mull, Kintyre, Islay, Arran, west mainland Scotland and the Forsinard area of Caithness. Woodland habitats used were characterized by an absence of grazing by sheep and cattle, and a reduction or cessation of burning. Low-intensity grazing and burning are likely to result in an increased in prey abundance (small mammals and passerine birds) both within and adjacent to woodland areas. At least in western Scotland, forests are very important for hen harriers and support a significant proportion of the breeding population. Given current changes in management of the forest estate, the importance of this habitat is likely to increase in Scotland in the medium term. The annual productivity of hen harriers in young conifer forests was estimated at 1.4
A conservation framework for hen harriers in the UK
63
fledglings per breeding female by Etheridge et al (1997). Although this is lower than the estimated productivity of 2.4 for ‘other’ (non-grouse) moorland from the same study, the estimate for coniferous forest exceeds the threshold for population expansion identified in Chapter 4 of this report. Consequently, hen harriers breeding in forests could provide an important source of young birds for other parts of the Scottish population (Haworth et al 2009).
A conservation framework for hen harriers in the UK
64
9 Constraints on the favourable conservation status of hen harrier in Scotland
The conservation status of each NHZ is assessed against possible constraints and the actions, if any, that may rectify the status, are outlined. (Numbers in brackets refer to the NHZ number in Figure 1). 9.1 Shetland (1) Because there is no history of breeding pairs in this NHZ no tests were applied. The GAM and Random Forest models predicted very little suitable habitat for hen harriers (Chapter 5). The isolation of these islands, combined with a lack of voles, may mean that this NHZ is never likely to support more than a very small number of pairs. 9.2 North Caithness and Orkney (2) Orkney was one of the strongholds where hen harriers survived while they were extirpated throughout most of Britain (Watson 1977). Its hen harrier population has been one of the most intensively studied and there is considerable knowledge and understanding of its dynamics. There is clear evidence that the population experienced a long term decline in productivity (e.g. Meek et al 1998; Amar et al 2005; Amar et al 2008) from which it appears to be recovering (Sim et al 2007; Amar et al 2010). Level 1 test (productivity > 1.2 per breeding attempt): Failed Level 2 test (proportion of occupied surveyed habitat > 0.44): Passed Level 3 test (density > than 2.12 pairs per 100 km2): Passed Favourable Conservation Status: No 9.2.1 Actions required to achieve favourable conservation status There is very little evidence of persecution in this NHZ (Meek et al 1998) with only three records of nest disturbance/destruction. The population passed the level 2 and 3 tests. The only failure was the Level 1 productivity test. Despite the long term persistence of a large population, it seems that number of young fledged was insufficient to enable this population to be self-sustaining. The failure to pass the productivity test appears to be related to food limitation during the early breeding period (Amar & Redpath 2002, Amar et al 2005). This issue is to do with prey abundance and the unusually large frequency of polygyny on Orkney (one male with two or more females). The decline of Orkney’s hen harriers has been demonstrated to be related to the detrimental effects, on vole numbers, of overgrazing of rough grassland by sheep (Amar & Redpath 2005). Amar et al (2008) summarised much of the earlier work and confirmed the link between food limitation, preferred hunting habitat and breeding performance. Breeding attempts are more successful when nesting areas are surrounded by higher proportions of rough grass. Similar results have been obtained for Mull, where it has been shown that harriers avoided managed grassland with heavy sheep grazing and that the removal of sheep stock was followed by the occupation of several new sites (Haworth &
A conservation framework for hen harriers in the UK
65
Fielding 2002). The existence of this relationship between grazing intensity and harrier breeding success suggested that it may be possible to use habitat management to improve harrier productivity. In 2002, SNH instigated a management scheme on Orkney which encourages farmers to reduce sheep numbers in areas where harriers can forage. This scheme has now been transferred to Rural Priorities. Amar et al (2008) suggested that even a relatively small uptake of the management prescriptions by farmers should benefit the harrier population. Over the last 10 years, the Orkney population has largely recovered, with productivity at, or around the level found during the 1980s. During this time sheep numbers have fallen by around 20%, a pattern seen in many other parts of Northern and Western Scotland (SAC 2008). Simultaneous monitoring has also revealed, as predicted, that areas of rough grassland have increased, and so too has the vole abundance (Amar et al 2010). In 2007 the proportion of successful nests had risen to 67% and the mean fledging rate per female was 1.2 (Etheridge et al 2010). Since this is above the threshold for population expansion we think that this NHZ will shortly achieve favourable status. 9.3 Western Isles (3) Level 1 test (productivity > 1.2 per breeding attempt): Passed Level 2 test (proportion of occupied surveyed habitat > 0.44): Passed Level 3 test (density > than 2.12 pairs per 100 km2): Passed Favourable Conservation Status: Yes 9.3.1 Actions required to maintain favourable conservation status No immediate action is required. This is a successful population with high proportion of successful nests. There are no recorded persecution incidences, although, as is the case with the Golden Eagle (Whitfield et al 2008) the population may be recovering from the effects of persecution which ceased in the early 1990s. All recently confirmed breeding attempts for the Western Isles hen harrier population are on the Uists and Benbecula. There is evidence that this population is still expanding and it would be wise to continue with monitoring. Nest examinations, between 2005-2008, demonstrated that, although voles and small passerines were taken regularly, other items such as rats, rabbits, waders and starlings formed important components of harrier diet in the breeding season (Paul Haworth & Robin Reid, pers comm). It is unclear if this broader diet has implications for potential expansion onto Lewis and Harris. 9.4 North West Seaboard (4) Level 1 test (productivity > 1.2 per breeding attempt): Failed Level 2 test (proportion of occupied surveyed habitat > 0.44): Failed Level 3 test (density > than 2.12 pairs per 100 km2): Failed Favourable Conservation Status: No
A conservation framework for hen harriers in the UK
66
9.4.1 Actions required to achieve favourable conservation status Only a relatively small area was surveyed in 2004 and we have no records of harriers breeding in this NHZ. The consensus distribution model predicts that there could be almost 35 pairs (2.5% of the predicted Scottish population). However, it seems unlikely that the habitat and terrain of this NHZ will ever support many breeding harriers and there is little scope for cost-effective management to improve the prospects for hen harriers in the North West Seaboard. 9.5 The Peatlands of Caithness and Sutherland (5) Level 1 Test (productivity > 1.2 per breeding attempt): Passed Level 2 test (proportion of occupied surveyed habitat > 0.44): Passed Level 3 test (density > than 2.12 pairs per 100 km2): Failed Favourable Conservation Status: No 9.5.1 Actions required to achieve favourable conservation status The Peatlands of Caithness and Sutherland passed the first two tests but failed the level 3 density test, due to the slightly low density (1.78) of pairs per 100 km2 of surveyed habitat. There is little recorded evidence of persecution in this NHZ with only one nest disturbance event. There are locations in this NHZ in which the density is high, particularly the south east corner. Unlike the North Caithness and Orkney NHZ, it seems unlikely that prey availability is constraining the density since, on Orkney, the density of harriers is high while productivity is low. Instead it appears that there are areas of apparently suitable habitat that are currently unoccupied. One possible explanation is a shortage of suitable nesting habitat, possibly arising from excessive burning and grazing of open areas leading to a shortage of tall vegetation. However, the broad scale land cover data used in this study do not allow us to assess this possibility fully, as more detailed information (e.g. relating to vegetation height and structure) would be required. It is also possible that the numbers of hen harriers nesting in forestry plantations are under-recorded. If this NHZ is to move into a favourable conservation status there needs to be a 20% increase in the pair density. Actions that enable this to be achieved require more information on the factors that currently constrain the density in this region. 9.6 Western Seaboard (6) Level 1 test (productivity > 1.2 per breeding attempt): Passed Level 2 test (proportion of occupied surveyed habitat > 0.44): Passed Level 3 test (density > than 2.12 pairs per 100 km2): Passed Favourable Conservation Status: Yes
A conservation framework for hen harriers in the UK
67
9.6.1 Actions required to maintain favourable conservation status The Western Seaboard is in a favourable condition, largely because of the large, successful and expanding population on Mull. There is only one recorded persecution incident involving nest disturbance/destruction. There would appear to be some scope for population expansion on Skye. The current population is largely confined to conifer forests but nesting and foraging habitat is likely to improve with a continuing decline in sheep numbers (SAC 2008) and a decrease in associated burning. Productivity on Skye, but not Mull, may be reduced by fox predation but further detailed monitoring is required to investigate this. 9.7 Northern Highlands (7) Level 1 test (productivity > 1.2 per breeding attempt): Passed Level 2 test (proportion of occupied surveyed habitat > 0.44): Passed Level 3 test (density > than 2.12 pairs per 100 km2): Failed Favourable Conservation Status: No 9.7.1 Actions required to achieve favourable conservation status Superficially the results for this NHZ are similar to those for the Peatlands of Caithness and Sutherland, in that it passed the first two tests but failed the level 3 density test. There is also some evidence of persecution in this NHZ but it seems unlikely that this is the main cause of the low density (0.77) of pairs per 100 km2 of surveyed habitat. There are two recorded incidences involving nest destruction/disturbance. However, unlike the Peatlands of Caithness and Sutherland, there are no locations where hen harrier density is high. One possible explanation is a shortage of suitable nesting habitat. However, the data used in this study do not allow us to assess this possibility. If this NHZ is to move into a favourable conservation status the density must increase by almost 300%. Identifying actions that enable this to be achieved requires more information on the factors that currently constrain the density. 9.8 Western Highlands (8) Level 1 test (productivity > 1.2 per breeding attempt): Passed Level 2 test (proportion of occupied surveyed habitat > 0.44): Failed Level 3 test (density > than 2.12 pairs per 100 km2): Failed Favourable Conservation Status: No 9.8.1 Actions required to achieve favourable conservation status The results for this NHZ must be treated with caution because they are based on very few records. There is little historical or current evidence that this NHZ has ever supported many hen harriers. There is no evidence of persecution in this NHZ and the main constraint is almost certainly a shortage of nesting habitat and prey. Golden eagle productivity is also
A conservation framework for hen harriers in the UK
68
very poor in this NHZ (Whitfield et al 2008a), suggesting that the habitat is generally in a poor condition. At present, no management can be identified that could result in a large increase in the hen harrier population and conservation actions are not considered a priority. 9.9 North East Coastal Plain (9) Level 1 test (productivity > 1.2 per breeding attempt): Failed Level 2 test (proportion of occupied surveyed habitat > 0.44): Failed Level 3 test (density > than 2.12 pairs per 100 km2): Failed Favourable Conservation Status: No 9.9.1 Actions required to achieve favourable conservation status Because there are very few records of hen harriers in this NHZ there is an argument that this NHZ should not be subjected to a test of favourable conservation status. There are two records from the early 1980s, including one carrying prey into a new forest plantation, but there is very little suitable nesting or foraging habitat in this NHZ and there are no realistic actions that could be taken to bring this region into a favourable conservation status. There are no records of persecution. 9.10 Central Highlands (10) Level 1 test (productivity > 1.2 per breeding attempt): Passed Level 2 test (proportion of occupied surveyed habitat > 0.44): Failed Level 3 test (density > than 2.12 pairs per 100 km2): Failed Favourable Conservation Status: No 9.10.1 Actions required to achieve favourable conservation status The Central Highlands has hen harriers that can be very productive (3.47 young fledged per successful nest). However, a relatively small proportion of pairs are successful and there appears to be relatively large areas of unoccupied, but suitable, habitat. Almost certainly the main constraint in this NHZ is persecution. There are 14 recorded incidents of hen harrier persecution in this NHZ (ten confirmed and four probable), seven of which were deliberate nest destruction or disturbance (others included two traps, two shooting, two poisoning and one unknown). The Central Highlands also has the third highest density of recorded persecution incidents. It is clear that this NHZ could be in a favourable status if this illegal persecution, particularly nest destruction, ceased. 9.11 Cairngorm Massif (11) Level 1 test (productivity > 1.2 per breeding attempt): Failed
A conservation framework for hen harriers in the UK
69
Level 2 test (proportion of occupied surveyed habitat > 0.44): Failed Level 3 test (density > than 2.12 pairs per 100 km2): Failed Favourable Conservation Status: No 9.11.1 Actions required to achieve favourable conservation status The Cairngorms Massif failed all three tests and the explanation and actions are similar to the Central Highlands. Although successful nests fledged almost 3 young per nest only one third of breeding attempts were successful. There are 21 recorded incidents of hen harrier persecution (ten confirmed and eleven probable), eleven of which were deliberate nest disturbance or destruction (others were one killing, five shooting, two trapping and two unknown). The Cairngorm Massif NHZ also has the second highest density of recorded persecution incidents. It is clear that this NHZ could be in a favourable status if this illegal persecution, particularly nest destruction, ceased. 9.12 North East Glens (12) Level 1 test (productivity > 1.2 per breeding attempt): Passed Level 2 test (proportion of occupied surveyed habitat > 0.44): Failed Level 3 test (density > than 2.12 pairs per 100 km2): Failed Favourable Conservation Status: No 9.12.1 Actions required to achieve favourable conservation status The North East Glens failed two of the three tests and the explanation and actions are similar to the Central Highlands. There are seven recorded incidents of hen harrier persecution (six confirmed and one probable), six of which were deliberate nest destruction or disturbance and the other was a shooting. It is clear that this NHZ could be in a favourable status is this illegal persecution, particularly nest destruction, ceased. 9.13 Lochaber (13) Level 1 test (productivity > 1.2 per breeding attempt): Failed Level 2 test (proportion of occupied surveyed habitat > 0.44): Passed (probably) Level 3 test (density > than 2.12 pairs per 100 km2): Failed Favourable Conservation Status: No 9.13.1 Actions required to achieve favourable conservation status
A conservation framework for hen harriers in the UK
70
Because there are very few records of hen harriers, there is an argument that this NHZ should not be subjected to a test of favourable conservation status. Golden eagle productivity is also very poor in this NHZ (Whitfield et al 2008a), suggesting that the habitat is generally in a poor condition. At present, no management can be identified that could result in a large increase in the harrier population and conservation actions are not considered a priority. 9.14 Argyll West and Islands (14) Level 1 Test (productivity > 1.2 per breeding attempt): Passed (marginal) Level 2 test (proportion of occupied surveyed habitat > 0.44): Passed Level 3 test (density > than 2.12 pairs per 100 km2): Passed Favourable Conservation Status: Yes 9.14.1 Actions required to maintain favourable conservation status No immediate action is required. This is a very successful population with high proportion of successful nests and several strongholds, particularly Islay and Arran. There is evidence that this population is still expanding with some previously unrecorded high pair densities in commercial forests (Haworth & Fielding 2009) and the Island of Jura, all of which were included in the predicted areas from our species distribution model. It would be wise to continue with monitoring of these populations, particularly as almost a third of the harriers fledged in Scotland come from this NHZ. There is some evidence of historic persecution with one poisoning and one egg theft. 9.15 Breadalbane and East Argyll (15) Level 1 test (productivity > 1.2 per breeding attempt): Passed (marginal) Level 2 test (proportion of occupied surveyed habitat > 0.44): Passed Level 3 test (density > than 2.12 pairs per 100 km2): Passed Favourable Conservation Status: Yes (marginal) 9.15.1 Actions required to maintain favourable conservation status Currently this NHZ has favourable conservation status. However, the productivity is very close to the threshold, so the level 1 pass is probable, rather than certain. This would be much higher if the proportion of successful pairs increased from the current rather low value (0.44). Despite its favourable status there are 16 recorded incidents of hen harrier persecution (12 confirmed and four probable), 11 of which were deliberate nest destruction (others were one poisoning, three shooting and one trapping). This NHZ also has the fourth highest density of recorded persecution incidents, most of which are in the north east of the zone and close to another cluster at the south west end of the North East Glens NHZ. It is clear that this NHZ could be in a more robust favourable status if this illegal persecution, particularly if both nest destruction and other deliberate killing ceased.
A conservation framework for hen harriers in the UK
71
9.16 Eastern Lowlands (16) Level 1 test (productivity > 1.2 per breeding attempt): Failed Level 2 test (proportion of occupied surveyed habitat > 0.44): Failed Level 3 test (density > than 2.12 pairs per 100 km2): Failed Favourable Conservation Status: No 9.16.1 Actions required to maintain favourable conservation status Because there are very few records of hen harriers in this NHZ, there is an argument that it should not be subjected to a test of favourable conservation status. The habitat appears to be largely unsuitable for hen harriers. However, there are four recorded incidents of hen harrier persecution (one confirmed and three probable), mainly from the early 1990s. The persecution incidents were made up of one nest destruction, one poisoning and two unknown). 9.17 West Central Belt (17) Level 1 test (productivity > 1.2 per breeding attempt): Passed Level 2 test (proportion of occupied surveyed habitat > 0.44): Passed Level 3 test (density > than 2.12 pairs per 100 km2): Passed Favourable Conservation Status: Yes 9.17.1 Actions required to maintain favourable conservation status Although this NHZ passed all three tests there are records of ten persecution incidents (one confirmed and seven probable) made up of eight nest destruction or disturbance, one shooting and two unknown, so there is some cause for concern. The impact of this disturbance may be reflected in the relatively low proportion of successful nests, combined with a relatively large standard deviation which means that year on year the proportion can vary considerably. 9.18 Wigtown Machairs and Outer Solway (18) Level 1 test (productivity > 1.2 per breeding attempt): Failed Level 2 test (proportion of occupied surveyed habitat > 0.44): Failed Level 3 test (density > than 2.12 pairs per 100 km2): Failed Favourable Conservation Status: No

A conservation framework for hen harriers in the UK
72
9.18.1 Actions required to achieve favourable conservation status There is an argument that this NHZ should not be subjected to a test of favourable conservation status. The habitat appears to be unsuitable for hen harriers. 9.19 Western Southern Uplands and Inner Solway (19) Level 1 test (productivity > 1.2 per breeding attempt): Failed Level 2 test (proportion of occupied surveyed habitat > 0.44): Passed Level 3 test (density > than 2.12 pairs per 100 km2): Passed Favourable Conservation Status: No 9.19.1 Actions required to achieve favourable conservation status Persecution is a severe problem in this NHZ, presumably this is at least partly responsible for the failure of the level 1 test. There are 61 recorded persecution incidents (21 confirmed and 40 probable) with over 50% involving nest destruction or disturbance (41 or 67% of all such incidents). There were also one recorded poisoning incident, four shootings, two trapping and 13 of unknown type. Muirkirk and North Lowther Uplands SPA, in this NHZ, has shown an average loss of one breeding attempt per year over the period 1994-2007. In 2007 only 13% of breeding attempts (2 from 15 known attempts) were successful fledging only six young. This productivity of 0.6 young per breeding attempt is incompatible with the long term survival of this population. 9.20 Border Hills (20) Level 1 test (productivity > 1.2 per breeding attempt): Passed Level 2 test (proportion of occupied surveyed habitat > 0.44): Failed Level 3 test (density > than 2.12 pairs per 100 km2): Failed Favourable Conservation Status: No 9.20.1 Actions required to achieve favourable conservation status The Border Hills failed because of a combination of low density and a large proportion of unoccupied habitat. Although the level 1 productivity test was passed there are ten recorded persecution incidents (six confirmed and four probable), including six deliberate nest destruction and disturbance (others were two shooting and two unknown). This NHZ might be in a favourable status if this illegal persecution, particularly nest destruction, ceased. It is possible, however, even in the absence of persecution, that a shortage of suitable nesting habitat might pose an obstacle to population recovery unless appropriate habitat management is implemented. The data used in this study do not allow us to assess this possibility fully.
A conservation framework for hen harriers in the UK
73
9.21 Moray Firth (21) Level 1 test (productivity > 1.2 per breeding attempt): Passed Level 2 test (proportion of occupied surveyed habitat > 0.44): Failed Level 3 test (density > than 2.12 pairs per 100 km2): Passed Favourable Conservation Status: No 9.21.1 Actions required to achieve favourable conservation status There are very few hen harrier records in this NHZ. Two confirmed persecution incidents are recorded (one poisoning and one shooting), none with a 6 figure precision. There seems to be very little suitable nesting or foraging habitat in this NHZ and there are no realistic actions that could be taken to bring this region into a favourable conservation status.
A conservation framework for hen harriers in the UK
74
10 References ALTMAN, D. G. & ROYSTON, P. 2000. What do we mean by validating a prognostic model? Statistics in Medicine 19: 453-473. AMAR, A., 2001. Determining the cause of the hen harrier decline on Orkney. Unpublished PhD thesis, University of Aberdeen. AMAR, A., ARROYO, B., MEEK, E., REDPATH, S. & RILEY, H. 2008. Influence of habitat on breeding performance of hen harriers Circus cyaneus in Orkney. Ibis 150: 400–404. AMAR, A. & BURTHE, S. 2001. Observations of predation of hen harrier (Circus cyaneus) nestlings by hooded crows (Corvus corone cornix) in Orkney, Scotland. Scottish Birds 22: 65–66. AMAR, A., DAVIES, J., MEEK, E., WILLIAMS, J., KNIGHT, A. & REDPATH, S. 2010. Long-term impact of changes in sheep densities Ovis aries on the breeding output of the Hen Harrier Circus cyaneus on the Orkney Islands, Scotland. Journal of Applied Ecology. DOI: 10.1111/j.1365-2664.2010.01896.x AMAR, A., PICOZZI, N., MEEK, E.R., LAMBIN, X. & REDPATH, S.M. 2005. Decline of the Orkney Hen Harrier Circus cyaneus population: do changes to demographic parameters and mating system fit a declining food hypothesis? Bird Study 52: 18–24. AMAR, A. & REDPATH, S. M. 2002. Determining the cause of the hen harrier decline on the Orkney Islands: an experimental test of two hypotheses. Animal Conservation 5: 21–28. AMAR, A. & REDPATH, S.M. 2005. Habitat use by Hen Harriers Circus cyaneus on Orkney: implications of land-use change for this declining population. Ibis 147: 37–47. AMAR, A., REDPATH, S. M., LAMBIN, X. & MEEK, E. 2003a. Could the hen harrier decline on Orkney be due to a shortage of food? In Thompson, D.B., Redpath, S.M., Fielding, A., Marquiss, M. & Galbraith, C.A. (eds) Birds of Prey in a Changing Environment: 377–391. The Stationery Office, London. AMAR, A., REDPATH, S.M. & THIRGOOD, S.J. 2003b. Evidence for food limitation in the declining hen harrier population on the Orkney Islands. Biological Conservation 111: 377–384. ANDERSON, B. J., ARROYO, B. E., COLLINGHAM, Y. C., ETHERIDGE, B., FERNANDEZ-DE-SIMON, J., GILLINGS, S., GREGORY, R. D., LECKIE, F. M., SIM, I. M. W., THOMAS, C. D., TRAVIS, J. & REDPATH, S. M. 2009. Using distribution models to test alternative hypotheses about a species’ environmental limits and recovery prospects. Biological Conservation 142: 488–499. ANON (2000). Report of the UK Raptor Working Group. DETR/JNCC Report. JNCC, Peterborough. ARAÚJO, M. B. & GUISAN, A. 2006. Five (or so) challenges for species distribution modelling. Journal of Biogeography 33: 1677–1688. ARAÚJO, M. B. & NEW, M. 2007. Ensemble forecasting of species distributions. Trends in Ecology and Evolution 22: 42–47.
A conservation framework for hen harriers in the UK
75
ARAÚJO, M. B., WHITTAKER, R.J., LADLE, R.J. & ERHARD, M. 2005. Reducing the uncertainty in projections of extinction risk from climate change. Global Ecology and Biogeography 14: 529–538. ARROYO, B., AMAR, A., LECKIE, F., BUCHANAN, G.M., WILSON, J.D. & REDPATH, S. 2009. Hunting habitat selection by hen harriers on moorland: implications for conservation management. Biological Conservation 142: 586–596. ARROYO, B., GARCIA, J.T. & BRETAGNOLLE, V. 2002. Conservation of the Montagu’s harrier (Circus pygargus) in agricultural areas. Animal Conservation 5: 283–290. ARROYO, B., LECKIE, F. & REDPATH, S. 2006. Habitat use and range management on priority areas for hen harriers: final report. Scottish Natural Heritage, contract no. F02AC307. BAND, W., MADDERS, M. & WHITFIELD, D.P. 2007. Developing field and analytical methods to assess avian collision risk at wind farms. In, de Lucas, M., Janss, G.F.E, & Ferrer, M. (ed.s) Birds and Wind Farms: Risk Assessment and Mitigation. Quercus, Madrid. BARTON, C., POLLOCK, C., NORRISS, D.W., NAGLE, T., OLIVER, G.A. & NEWTON, S. 2006. Hen Harriers Circus cyaneus in Ireland 2005. Irish Birds 8: 1–20. BIBBY, C. & ETHERIDGE, B. 1993. Status of the hen harrier Circus cyaneus in Scotland in 1988-89. Bird Study 40: 1-11. BREIMAN, L. 2001. Random Forests. Machine Learning 45: 5–32. BREIMAN, L. 2002. Manual on setting up, using, and understanding Random Forests V3.1. http://oz.berkeley.edu/users/breiman/Using_random_forests_V3.1.pdf Accessed 2nd February 2006. BREIMAN, L. & CUTLER, A. 2004a. Interface Workshop – April 2004. http://stat-www.berkeley.edu/users/breiman/RandomForest/interface04.pdf Accessed 1st February 2006. BREIMAN, L. & CUTLER, A. 2004b. Random Forests. http://stat-www.berkeley.edu/users/breiman/RandomForests/cc_home.htm Accessed 1st February 2006. BRIGHT, J.A., LANGSTON, R. H. W., PEARCE-HIGGINS, J. W., BULLMAN, R., EVANS R. & GARDNER, S. 2008. Spatial overlap of wind farms on peatland with sensitive areas for birds. Mires and Peat 4, Article 07, http://www.mires-and-peat.net/. CHEVAN, A. & SUTHERLAND, M. 1991. Hierarchical Partitioning. The American Statistician 45: 90–96. CORMIER, J.P., FUSTEC, J., PITHON, J. & CHOISY, P. 2007. Selection of nesting habitat by Montagu’s Harriers Circus pygargus and Hen Harriers Circus cyaneus in managed heaths. Bird Study 55, 86–93. CORINE (Co-ordination of Information on the Environment) 2006. Version 8/2006. Copyright EEA, Copenhagen, 2007. http://www.eea.europa.eu CULLEN, J.P. 1991. The hen harrier in the Isle of Man. In, Curtis, D.J., Bignal, E.M. and Curtis, M.A. (eds) Birds and pastoral agriculture in Europe. Proceedings of the Second
A conservation framework for hen harriers in the UK
76
European Forum on Birds and Pastoralism. Port Erin, Isle of Man, 26–30 October 1990: 53–55. EATON, M. A., BROWN, A. F., NOBLE, D. G., MUSGROVE, A. J., HEARN, R, AEBISCHER, N. J., GIBBONS, D. W., EVANS, A. & GREGORY, R. D. 2009. Birds of Conservation Concern 3: the population status of birds in the United Kingdom, Channel Islands and the Isle of Man. British Birds 102: 296–341. ENVIRONMENT COUNCIL 2011. Hen Harrier Dialogue. http://www.the-environment-council.org.uk/index.php?option=com_content&task=view&id=95&Itemid=137 ETHERIDGE, B. 2007. Hen harrier. In, The Birds of Scotland, ed. by R.W. Forrester, I.J. Andrews, C.J. McInerny, R.D. Murray, R.Y. McGowan, B. Zonfrillo, M.W. Betts, D.C. Jardine & D.S. Grundy. The Scottish Ornithologists’ Club, Aberlady: 460–464. ETHERIDGE, B., SUMMERS, R.W. & GREEN, R.E. 1997. The effects of illegal killing and destruction of nests by humans on the population dynamics of the hen harrier Circus cyaneus in Scotland. Journal of Applied Ecology 34: 1081–1105. ETHERIDGE, B., HOLLING, M., RILEY, H., WERNHAM, C. & THOMPSON, D. 2010. Scottish Raptor Monitoring Scheme Report 2007. www.scottishraptorgroups.org). FIELDING, A. H. 1999. How should accuracy be measured? In, A. Fielding (ed) Ecological Applications of Machine Learning Methods. Kluwer Academic, Boston, MA: 209–223. FIELDING, A. H. 2002. What are the appropriate characteristics of an accuracy measure? In, J. M. Scott, P. J. Heglund, M. Morrison, J. B. Haufler, M. G. Raphael, W. B. Wall, and F. Samson (eds) Predicting Plant and Animal Occurences: Issues of Scale and Accuracy. Island Press: 271–280. FIELDING, A. H. 2006. Cluster and classification techniques in the BioSciences. Cambridge University Press, Cambridge. FIELDING, A. H. & BELL, J. F. 1997. A review of methods for the assessment of prediction errors in conservation presence / absence models. Environmental Conservation 24: 38–49. FIELDING, A.H., MCLEOD, D.R.A. & HAWORTH, P.F. 2003b. Analytical foundation for a conservation framework for the golden eagle. Report under contract BAT/AC309/01/02/46. Scottish Natural Heritage, Edinburgh. FIELDING, A. H., MORGAN, D., HAWORTH, P. F., WHITFIELD, D. P. & THOMPSON, D. B. A. 2003b. The impact of golden eagles on other raptors. In, Thompson, D. B. A., Redpath, S., Fielding, A. H., Marquiss, M. and Galbraith, C. A. (eds). Birds Of Prey in a Changing Environment. The Stationery Office, Edinburgh: 221–244. FIELDING, A.H., WHITFIELD, D. P., MCLEOD, D. R. A., MCGRADY, M. & HAWORTH, P. F. 2003c. Modelling the impact of land use changes on golden eagles Aquila chrysaetos. In, Thompson, D. B. A., Redpath, S., Fielding, A. H., Marquiss, M. and Galbraith, C. A. (eds). Birds of Prey in a Changing Environment. The Stationery Office, Edinburgh: 323 – 340. FIELDING, A.H., HAWORTH, P., WHITFIELD, P. & MCLEOD, D. 2009. Raptor Species Conservation Frameworks: Hen Harrier Framework Project, Final Technical Report. Confidential Report from Haworth Conservation to Scottish Natural Heritage.
A conservation framework for hen harriers in the UK
77
FREEMAN, E. 2007. PresenceAbsence: Presence Absence Model Evaluation. V.1.1 Available for download from CRAN (http://www.r-project.org/) FRIEDMAN, J. H., HASTIE, T. & TIBSHIRANI, R. 2000. Additive logistic regression: a statistical view of boosting. Annals of Statistics 28: 337-374. FULLER R.M., SMITH, G.M. SANDERSON, J.M. HILL, R.A. THOMSON, A.G. COX, R. BROWN, N.J. CLARKE, R.T. ROTHERY P. & GERARD F.F. 2002. Countryside Survey 2000 Module 7 Land Cover Map 2000 Final Report. Centre for Ecology and Hydrology. GARCIA, J.T. & ARROYO, B.E. 2001. Effect of abiotic factors on reproduction in the centre and periphery of breeding ranges: a comparative analysis in sympatric harriers. Ecography, 24: 393–402. GIBBONS, D.W., REID, J.B. & CHAPMAN, R.A. 1993. The New Atlas of Breeding Birds in Britain and Ireland:1988–1991. Poyser, London. GLOBAL LAND COVER FACILITY 2010. http://www.landcover.org GREEN, R.E. & ETHERIDGE, B. 1999. Breeding success of the hen harrier Circus cyaneus in relation to the distribution of grouse moors and the red fox Vulpes vulpes. Journal of Applied Ecology 36: 472–483. GUISAN, A., EDWARDS, T. C. & HASTIE, T. 2002. Generalized linear and generalized additive models in studies of species distributions: setting the scene. Ecological Modelling 157: 89-100. HAWORTH CONSERVATION 2010. Edinbane Windfarm: Ornithological Monitoring. A review of the spatial use of the area by birds of prey. Haworth Conservation, Mull. HAWORTH, P.F. & FIELDING, A.H. 2002. Analysis of hen harrier habitat and range use on Mull. Report to Scottish Natural Heritage, contract BAT/PA08b/01/02/34. HAWORTH P.F. & FIELDING, A.H. 2009. An assessment of woodland habitat utilisation by breeding hen harriers. Report to SNH (Project no. 24069) by Haworth Conservation, Mull. HAWORTH, P., FIELDING, A., WHITFIELD, P. & REID, R. 2009. Diet and breeding success in golden eagles: implications for land management. Report to Scottish Natural Heritage, contract no. 23748. Haworth Conservation, Mull. HAWORTH, P. F., FIELDING, A. H. & REID, R. (2010). Numbers, distribution and productivity of key raptor species breeding in Benbecula, Barra and Uists. Report to Scottish Natural Heritage, contract no. 26711. Haworth Conservation, Mull. HIRZEL, A. & GUISAN, A. 2002. Which is the optimal sampling strategy for habitat suitability modelling? Ecological Modelling 157: 331-341. HUMPHREYS, E.M., WERNHAM, C.V., & CRICK, P.Q. 2006. Raptor Species Conservation Frameworks: Peregrine Interim Report: Datasets And Plans For Analysis. BTO Scotland, Stirling. IRISH METEOROLOGOCAL SERVICE ONLINE 2010. http://www.met.ie/climate/monthly-data.asp

A conservation framework for hen harriers in the UK
78
JNCC (2011). http://www.jncc.gov.uk/page-2217 KOKS, B.J., TRIERWEILER, C., VISSER, E.G., DIJKSTRA, C. & KOMDEUR, J. 2007. Do voles make agricultural habitat attractive to Montagu’s harrier Circus pygargus? Ibis 149: 575–586. LANGHOLM MOOR DEMONSTRATION PROJECT 2011. http://www.langholmproject.com/ LIAW, A. & WIENER, A. 2006. The Random Forest package. http://cran.r-project.org/doc/packages/Random Forest.pdf Accessed 3rd February 2006. MACAULAY LAND USE RESEARCH INSTITUTE 1989. The Land Cover of Scotland by Air Photo Interpretation. Macaulay Land Use Research Institute, Aberdeen. MCLEOD, D. R. A., FIELDING, A. H., HAWORTH, P. F., WHITFIELD, D. P. & MCGRADY, M. J. 2002. Predicting home range use by golden eagles Aquila chrysaetos in western Scotland. Journal of Avian Science 2:183–198. MCMILLAN, R. L. 2010. Hen harrier monitoring study Skye – 2010. www.skye-birds.com. MADDERS, M. 2000. Habitat selection and foraging success of hen harriers Circus cyaneus in west Scotland. Bird Study 47: 32–40. MASSEY, B., BOWEN, R., GRIFFIN, C. & MCGARIGAL, K. 2008. A classification-tree analysis of nesting habitat in an island population of northern harriers. The Condor 110: 177–183. MEEK, E.R., REBECCA, G.W., RIBBANDS, B. & FAIRCLOUGH, K. 1998. Orkney Hen Harriers: a major population decline in the absence of persecution. Scottish Birds 19: 290–298. Met Office 2010. http://www.metoffice.gov.uk/climate/uk/averages/19712000/index.html MILLON, A., BOURRIOUX, J.-L., RIOLS, C. & BETAGNOLLE, V. 2002. Comparative breeding biology of hen harrier and Montagu’s harrier: an eight-year study in northeastern Framce. Ibis 144: 94–105. Natural England 2008. A future for the hen harrier in England? Natural England, Sheffield. http://www.naturalengland.org.uk/Images/hen_harrier_report221208_tcm6-9451.pdf NATURAL ENGLAND & RSPB 2010. Caught on camera: Eagle Owl raids Hen Harrier nest. http://www.birdguides.com/webzine/article.asp?comments=y&a=2139 NUNES DE LIMA, M. F. (Editor). 2005. IMAGE2000 and CLC2000 Products and Methods. European Commission Joint Research Centre. PAW (Partnership for Action Against Wildlife Crime) 2011. http://www.defra.gov.uk/paw/ PAW Scotland (2010). http://www.scotland.gov.uk/Topics/Environment/Wildlife-Habitats/paw-scotland/types-of-crime/crimes-against-birds/Poisoninghotspotmaps2010/2010
A conservation framework for hen harriers in the UK
79
PEARSON, R.G., THULLIER, W., ARAUJO, M.B., MARTINEZ-MEYER, E., BROTTONS, L., MCCLEAN, C., MILES, L., SUGURADO, P., DAWSON, T.P. & LEES, D.C. 2006. Model-based uncertainty in species range prediction. Journal of Biogeography 33: 1704–1711. PETERSON, A. T. 2006. Uses and requirements of ecological niche models and related distribution models. Biodiversity Informatics 3: 59–72. PEARCE-HIGGINS, J.M., STEPHEN, L., LANGSTON, R.W., BAINBRIDGE, I.P. & BULLMAN, R. (2009). The distribution of breeding birds around upland wind farms. Journal of Applied Ecology 46: 1323–1331. PICOZZI, N. 1984. Breeding biology of polygynous hen harriers Circus c. cyaneus in Orkney. Ibis 126: 356–365. POTTS, G.R. 1998. Global dispersion of nesting hen harriers (Circus cyaneus): implications for grouse moors in the UK. Ibis 140, 76–88. REDPATH, S., AMAR, A., SMITH, A., THOMPSON, D. B. A. & THIRGOOD, S. 2010. People and nature in conflict: can we reconcile hen harrier conservation and game management. In, Baxter, J. M. & Galbraith, C. A. (eds), Species Management: Challenges and Solutions for the 21st Century. TSO, Edinburgh. REDPATH, S.M., ARROYO, B.E., ETHERIDGE, B, LECKIE, F.M., BOUWMAN, K. & THIRGOOD, S.J. 2002. Weather and harrier productivity: from local mechanisms to geographical patterns. Ecography 25: 533–540. REDPATH, S. M., MADDERS, M., DONNELLY, E., ANDERSON, B., THIRGOOD, S. J. & MCLEAD, D. 1998. Nest site selection by hen harriers in Scotland. Bird Study 45: 51–61. REDPATH, S. M. & THIRGOOD, S. 1997. Birds of prey and red grouse. HM Stationery Office, London. REDPATH, S. M., THIRGOOD, S. J., LECKIE, F. M., LOCK, K. A. & CAMPBELL, S. 2001. Management trial to reduce hen harrier predation on red grouse at Langholm in 1998 and 1999: the effects of providing hen harriers with supplementary food. Final report to SNH (contract BAT/AC419/99/00/69). Institute of Terrestrial Ecology, Banchory. ROBERTSON, M.P., PETER, C.I., VILLET, M.H. & RIPLEY, B.S. 2003. Comparing models for predicting species’ distributions: a case stud using correlative and mechanistic modelling techniques. Ecological Modelling 164: 153–167. RODRIGUEZ, J.P., BROTONS, L., BUSTAMANTE, J. & SEOANE, J. 2007. The application of predictive modelling of species distribution to biodiversity conservation. Diversity and Distributions 13: 243-251. RSPB 2008. The illegal killing of birds of prey in Scotland in 2008. RSPB Scotland, Edinburgh. http://www.rspb.org.uk/ourwork/policy/wildbirdslaw/legalpublications.aspx RSPB 2009. Birdcrime 2009: offences against wild bird legislation in 2009. RSPB, Sandy. http://www.rspb.org.uk/ourwork/policy/wildbirdslaw/legalpublications.aspx SAC. 2008. Farming's Retreat from the Hills. Scottish Agricultural College, Edinburgh.
A conservation framework for hen harriers in the UK
80
SALAMOLARD, M., BUTET, A., LEROUX, A. & BRETAGNOLLE, V. 2000. Responses of an avian predator to cycles in prey density at a temperate latitude. Ecology 81: 2428–2441. SCHAPIRE, R. E. 1990. The strength of weak learnability. Machine Learning 5: 197–227. SCOTLAND’S MOORLAND FORUM 2011. http://www.moorlandforum.org.uk/output/home.asp SCOTTISH RAPTOR GROUPS 2008. Hen harriers in terminal decline. News item, 28 November 2008. http://www.scottishraptorgroups.org/news.php?month=11&year=2008 SNH (SCOTTISH NATURAL HERITAGE) 2002. Natural Heritage Futures: An Overview. Scottish Natural Heritage, Perth. SNH (SCOTTISH NATURAL HERITAGE) 2010. Species Action Framework. http://www.snh.org.uk/speciesactionframework/default.asp SERGIO, F., MARCHESI, L. & PEDRINI, P. 2003. Spatial refugia and the coexistence of a diurnal raptor with its intraguild owl predator. Journal of Animal Ecology 72: 232–245. SERGIO, F., RIZZOLLI, F., MARCHESI, L. & PEDRINI, P. 2004. The importance of interspecific interactions for breeding-site selection: peregrine falcons seek proximity to raven nests. Ecography 27: 818–826. SIM, I.M.W., GIBBONS, D.W., BAINBRIDGE, I.P. & MATTINGLEY, W.A. 2001. Status of the hen harrier Circus cyaneus in the UK and the Isle of Man in 1998. Bird Study 48: 341-53. SIM, I.M.W., DILLON, I.A., EATON, M.A., ETHERIDGE, B., LINDLEY, P. RILEY, H., SAUNDERS, R., SHARPE, C. & TICKNER, M. 2007. Status of the hen harrier Circus cyaneus in the UK and the Isle of Man in 2004, and a comparison with the 1988/89 and 1998 surveys. Bird Study 54: 256–267. SOTHERTON, N., TAPPER, S. & SMITH, A. 2009. Hen harriers and red grouse: economic aspects of red grouse shooting and the implications for moorland conservation. Journal of Applied Ecology 46: 955–960. STROUD, D.A., CHAMBERS, D., COOK, S., BUXTON, N., FRASER, B., CLEMENT, P., LEWIS, P., MCLEAN, I., BAKER, H. & WHITEHEAD, S. 2001. The UK SPA network: its Scope and Content. Joint Nature Conservation Committee, Peterborough. SUMMERS, R.W., GREEN, R.E., ETHERIDGE, B. & SIM, I.M.W. (2003). Changes in hen harrier (Circus cyaneus) numbers in relation to grouse moor management. In, Birds of Prey in a Changing Environment, ed. by D.B.A. Thompson, S.M. Redpath, A.H. Fielding, M. Marquis & C.A. Galbraith. TSO Scotland, Edinburgh: 487–497. THOMAS, C.D., CAMERON, A., GREEN, R.E., BAKKENES, M., BEAUMONT, L.J., COLLINGHAM, Y.C, ERASMUS, B.F.N., SIQUEIRA, M.F., GRAINGER, A., HANNAH, L., HUGHES, L., HUNTLEY, B., VAN JAARSVELD, A.S., MIDGLEY, G.F., MILES, L., ORTEGA-HUERTA, M.A., PETERSON, A.T., PHILLIPS, O.L. & WILLIAMS, S.E. 2004. Extinction risk from climate change. Nature 427: 145–148. THOMPSON, D.B.A, REDPATH, S.M., FIELDING, A. H., MARQUIS, M. & GALBRAITH, C.A. 2003. Birds of Prey in a Changing Environment. Edinburgh: The Stationery Office.
A conservation framework for hen harriers in the UK
81
THOMPSON, P. S., AMAR, A., HOCCOM, D. G., KNOTT, J. & WILSON, J. D. 2009. Resolving the conflict between driven-grouse shooting and conservation of hen harriers. Journal of Applied Ecology 46: 950–954. TUTZ, G. & BINDER, H. 2006. Generalized additive modelling with implicit variable selection by likelihood based boosting. Biometrics 62: 961–971. USHER, M. B. & BALHARRY, D. 1996. A Biogeographical Zonation of Scotland. Scottish Natural Heritage, Perth. WATSON, D. 1977. The Hen Harrier. T. & A.D. Poyser, Berkhamsted. WATSON, J. 2010. The Golden Eagle. Second Edition. T & A D Poyser, London. WHITFIELD, D. P. & FIELDING, A. H. 2009. Hen harrier population studies in Wales. CCW Contract Science Report No: 879. Countryside Council for Wales, Bangor. WHITFIELD, D. P. & MADDERS, M. 2005. A review of the impacts of wind farms on hen harriers. Natural Research Information Note 1. Natural Research Ltd., Banchory. WHITFIELD, D.P., MCLEOD, D.R.A., WATSON, J., FIELDING, A.H. & HAWORTH, P.F. 2003. The association of grouse moor in Scotland with the illegal use of poisons to control predators. Biological Conservation 114: 157–163. WHITFIELD, D.P., FIELDING, A.H., MCLEOD, D.R.A. & HAWORTH, P.F. 2004a. The effects of persecution on age of breeding and territory occupation in golden eagles in Scotland. Biological Conservation 118: 249–259. WHITFIELD, D.P., FIELDING, A.H., MCLEOD, D.R.A. & HAWORTH, P.F. 2004b. Modelling the effects of persecution on the population dynamics of golden eagles in Scotland. Biological Conservation 119: 319–333. WHITFIELD, D.P., FIELDING, A.H., MCLEOD, D.R.A., HAWORTH, P.F. & WATSON, J. 2006a. A conservation framework for the golden eagle in Scotland: refining condition targets and assessment of constraint influences. Biological Conservation 130: 465–480. WHITFIELD, D.P., FIELDING, A.H., MCLEOD, D.R.A. & HAWORTH, P.F. 2008a. A conservation framework for the golden eagle: implications for the conservation and management of golden eagles in Scotland. Scottish Natural Heritage Commissioned Report No. 193, Perth. WHITFIELD, D.P., MCLEOD, D.R.A., HAWORTH, P.F. & FIELDING, A.H. 2006b. Scoping assessment for a conservation framework for the hen harrier. Report to SNH under contract no. 15367. WHITFIELD, D.P., FIELDING, A.H. & WHITEHEAD, S. 2008b. Long-term change in the fecundity of hen harriers Circus cyaneus in Wales: roles for human interference and weather. Animal Conservation 11: 144–152. Whitfield, D.P., Fielding, A.H., McLeod, D.R.A., Morton, K., Stirling-Aird, P., and Eaton, M.A., 2007. Factors constraining the distribution of Golden Eagles Aquila chrysaetos in Scotland. Bird Study, 54: 199-211. WILSON, M.W., IRWIN, S., NORRIS, D.W., NEWTON, S.F., COLLINS, K., KELLY, T.C. & O’HALLORAN, J. 2009. The importance of pre-thicket conifer plantations for nesting hen harriers Circus cyaneus in Ireland. Ibis 151: 332–342.
A conservation framework for hen harriers in the UK
82
WOLPERT, D. H. & MACREADY, W. G. 1995. No Free Lunch Theorems for Search. Technical Report SFI-TR-95-02-010 (Santa Fe Institute). http://www.no-free-lunch.org/WoMa95.pdf