Embed Size (px)
Citation preview

1
A configurable computer simulation model for reducing patient
waiting time in oncology departments
R. R. Corsinia, A. Costab, S. Ficherab and A. Pluchinoa,c
aDepartment of Physics and Astronomy ”E-Majorana”, University of Catania, Italy;
bDICAR Department, University of Catania, Italy;
cSezione INFN of Catania, Italy
Abstract: Nowadays, the increase in patient demand and the decline in resources
are lengthening patient waiting times in many chemotherapy oncology
departments. Therefore, enhancing healthcare services is necessary to reduce
patient complaints. Reducing the patient waiting times in the oncology
departments represents one of the main goals of healthcare manager. Simulation
models are considered an effective tool for identifying potential ways to improve
patient flow in oncology departments. This paper presents a new agent-based
simulation model designed to be configurable and adaptable to the needs of
oncology departments which have to interact with an external pharmacy. When
external pharmacies are utilized, a courier service is needed to deliver the
individual therapies from the pharmacy to the oncology department. An oncology
department located in southern Italy was studied through the simulation model and
different scenarios were compared with the aim of selecting the department
configuration capable of reducing the patient waiting times.
Keywords: Simulation; Healthcare; Oncology
1. Introduction
While tackling high healthcare costs and restricted budgets, oncology departments have
faced new managerial challenges stemming from the need to satisfy the ever increasing
patient demand. The worldwide ageing population has resulted in an increase in demand
for healthcare services. Healthcare systems are able to increase the population’s life
expectancy and, consequently, the mean age of the population. At the same time, ageing
involves a decrease in immune defences and an enlarged predisposition to illness
(Candore et al., 2006; Troen, 2003). In the opinion of Vasto et al. (2009), “the pro-

2
inflammatory status of ageing might be one of the both convergent and divergent
mechanisms which relate cancer to ageing”. Furthermore, epidemiological studies have
shown causal associations between cancers and several other factors, such as lifestyle or
diet (Katzke et al., 2015), tobacco exposure (Montesano & Hall, 2001) and air pollution
(Martoni, 2018). Siegel et al. (2021) estimated 1,898,160 cases of cancer in the year 2021
in the United States. Due to this, a steady growth in demand for healthcare services within
oncology departments has been seen. However, patient demand for care is not always met
by adequate levels of services within oncology departments. The outcomes of this
dichotomy are a higher workload for healthcare providers and a dramatic growth in
patient waiting time. Oncology facilities manage large volumes of patients with limited
resources (e.g., pharmacists, nurses or treatment chairs) (Alvarado et al., 2018). Goldstein
et al. (2008) stated that the balance between supply and demand of total annual oncology
visits in 2005 would become unbalanced in 2020. A few years later, their forecast was
confirmed by the estimation of an increase in overall patient demand of 40% over a
thirteen year period (from 2012 to 2025) (Yang et al., 2014).
Despite the mentioned outlooks and new challenges, the oncology departments
need to steadily maximize their service levels. To this end, the healthcare community
looks for an improvement in service levels, which in turn impacts the patient quality of
life. The reduction of the patient waiting time is considered one of the top priorities for
patients in cancer departments (Gesell & Gregory, 2004). The main goal of the healthcare
departments is to care for the highest number of patients in such a way as to reduce the
patient waiting time and, simultaneously, increase patient satisfaction (Ahmed &
Alkhamis, 2009). However, the oncology process involves diverse resources, both human
and non-human, along with cooperation from pharmacies, all of which increases the
complexity of the system. Therefore, simulation modelling was used to support decision-

3
making policies. Simulation modelling also represents a risk-free and low budget method
to assess the impact of potential changes on healthcare systems before implementing any
intervention (Cassidy et al., 2019). In healthcare environments, Discrete Event
Simulation (DES) is widely adopted for modelling and optimizing hospital workflows
and other processes. According to this approach, variables and states change after a set of
events occur at discrete time points and entities are simply data objects influencing the
system’s decision processes. In contrast, Agent-Based Simulation (ABS) modelling
allows users to reproduce the actions and interactions of autonomous agents in order to
handle the behaviour of a complex system. In healthcare contexts, people (e.g., patients,
doctors) can be represented by agents with an individual behaviour, but it is also possible
to model rescue service vehicles and other resources using agents (Djanatliev & German,
2013).
Inspired by the studies performed on a real-life oncology department located in
southern Italy, this paper presents a novel computer simulation model, which is
configurable and adaptable to the needs of oncology departments cooperating with a
detached pharmacy. The simulation model is based on a DES structure and was developed
using Netlogo® (Wilensky, 1999), a programmable agent-based open-source platform
that enables the realization of user-friendly intuitive interfaces. The presented model was
designed to allow healthcare managers to recreate their oncology department in a virtual
environment and easily test new configurations of the oncology process with the goal of
reducing patient waiting time. The effectiveness of the proposed simulation model was
verified through a case study based on an existing hospital oncology department. It is
worth noting that, unlike similar configurations described in the literature, our model also
considers the case in which the pharmacy department is detached from the oncology
department and, therefore, therapies are gathered in batches by pharmacists and delivered
4
through a courier. Once the proposed simulation model was validated, it was used to
compare several ‘what-if’ configurations to identify better department configurations
which minimize patient waiting times. The configurability and the free availability of the
Netlogo agent-based framework, as well as the validation based on a real-life case study,
represent the strengths of the proposed research. This paper provides several contributions
to the scientific community:
i) It represents the first attempt to use an agent-based simulation model to
investigate outpatient flow in a multi-stage oncology department where the
pharmacy is detached from the department itself;
ii) It provides a configurable and adaptable tool that can easily be used by
stakeholders to investigate alternative department configurations and also
optimize the service level;
iii) A real-life situation is presented with the aim of testing and validating the
effectiveness of the proposed approach;
iv) A series of findings arising from an ANOVA analysis allows the readers to
assess how some organizational aspects may affect the performance of oncology
departments.
The paper is organized as follows. After a comprehensive literature review, the
proposed simulation model is introduced and described in detail. Then, the application to
the case study is presented and the model is validated by comparing the behaviour of the
real oncology department to the simulated one. Finally, a Design Of Experiments (DOE)
is carried out with the aim of identifying more effective configurations of the oncology
department under investigation. The best configuration in terms of patient waiting time
reduction is identified and the managerial implications resulting from the present study
are further discussed. Finally, the conclusion and future research directions are

5
summarized.
2. Background and related work
Simulation tools are increasingly used in healthcare management, along with other
Operational Research/Management Science (OR/MS) methods (for example the dynamic
optimization in the work of Hahn-Goldberg et al., 2014 or the stochastic programming in
the work of Demir et al., 2021). Often, computer simulation is employed to virtually
evaluate ‘what-if’ configurations of health departments, so healthcare managers can
assess the impact of potential changes on health systems without implementing them
(Cassidy et al., 2019; Gunal, 2012; Salleh et al., 2017). In general, computer simulation
can be classified as: Discrete Event Simulation (DES), System Dynamics (SD) or Agent-
Based Simulation (ABS).
DES methodology deals with real systems which have a strong queue structure
that can be modelled in discrete periods, where the process can be described
stochastically. In this approach, patients are represented by ‘entities’ that go through
different processes of the system. DES has been widely used to support healthcare
decision-making. For example, Abo-Hamad and Arisha (2014) and Demir et al. (2017)
merged the DES model with typical decision support tools (e.g., balanced scorecard) in
an emergency department, while Luo et al. (2018) applied DES in a radiology department
to study how to reserve capacity for emergency and non-emergency patients.
On the other hand, SD is typically adopted to model health systems at an aggregate
level. Introduced by Forrester (1958), it is based on differential equations and is used to
capture the macro-level dynamics of a complex system under study. In this respect,
Rashwan et al. (2015) modelled the flow of elderly patients to study the impact of various
system parameters on the issue of acute bed blockage in the Irish healthcare system.

6
Edaibat et al. (2017) used SD simulations to assess the impact of health information
exchange (HIE) adoption policies in hospitals located in the State of Maryland.
Finally, a considerable attention has being focused on ABS modelling in the OR
context (Abar et al., 2017; Siebers et al., 2010) and for health systems as well (Cassidy et
al. 2019; Gunal, 2012; Sulis et al., 2020). ABS uses ‘agents’ to model the flow of people
(Metzner, 2019) as it allows writing specific instructions that control the behaviour and
the interaction between agents in the system (Gunal, 2012; Mustafee et al., 2010). Several
contributions reveal that ABS modelling is used to enhance the performance of healthcare
departments. Yousefi and Ferreira (2017) combined ABS with decision-making
techniques to re-allocate resources in an emergency department. Fragapane et al. (2019)
developed an ABS model to enhance internal hospital logistics by examining the status
of the goods’ delivery system and evaluating potential improvements. Saeedian et al.
(2019) and Ajmi et al. (2019) used the ABS approach to reduce indicators related to
patients’ pathways, such as total waiting time or length of stay, in surgery and emergency
departments, respectively.
Another in the field of simulation concerns an innovative paradigm denoted as
hybrid simulation. The hybrid simulation modelling consists of combining different types
of simulation techniques (Brailsford et al., 2019). Recently, Olave-Rojas and Nickel
(2021) developed a hybrid simulation framework combining ABS and DES to address
the complex problem arising from Emergency Medical Services. Another research stream
focuses on the integration between simulation and optimization related techniques. For
example, Vahdat et al. (2019) used a simulation-optimization approach to study a
paediatric orthopaedic outpatient clinic. Ordu et al. (2020) used a forecasting-simulation-
7
optimization (FSO) strategy as a means of coping with the resource capacity needs of an
entire hospital.
As far as oncology departments are concerned, Sepúlveda et al. (1999) and
Baesler and Sepúlveda (2001) can be considered the pioneers of decision-making through
simulation in oncology departments. Nowadays, these studies still represent a source of
inspiration for researchers that aim to investigate the patient flow in oncology
departments. Some research work implement simulations to examine the performance of
the department by focusing primarily on the administration of chemotherapy treatment.
Ahmed et al. (2011) employ simulation to propose new appointment scheduling rules
with the aim of increasing both throughput (i.e., number of patients per day) and treatment
chair utilization. Baril et al. (2016a) and Baril et al. (2017) studied the nurses’ tasks in an
oncology department with the goal of reducing their workload. Baril et al. (2020)
examined the workload of nursing staff in relation to the administration of patient
treatment, considering both physical and mental workload. Other studies also included
the activities of the pharmacy, which consists of preparing the therapies required by the
oncology department (Alvarado et al., 2018; Arafeh et al., 2018; Baril et al., 2016b; Liang
et al., 2015; Woodall et al., 2013) and delivering the therapies to the oncology department
by a courier (Arafeh et al., 2018). Woodall et al. (2013) assessed the impact of nurses’
unavailability on patient waiting times. Interestingly, Liang et al. (2015) proposed a
robust DOE to support healthcare managers in the decision-making process by
investigating the impact of various experimental factors on things such as the number of
patients per day, number of chairs, etc. Baril et al. (2016b) combined simulations with a
business game in a Kaizen event, i.e., a workshop whose goal is to encourage the
continuous improvement of a specific area or process (Farris et al., 2009). The authors
compared a series of alternative management configurations and pointed out the need to
8
include pharmacists in the Kaizen event. Alvarado et al. (2018) developed a simulation
model to analyse operational strategies related to the management of patients’
appointments in an oncology clinic.
In brief, this paper presents a computer simulation model to assess the patient flow
of an oncology department, with the aim of identifying a series of actions that are capable
of reducing the patient waiting time. To the best of our knowledge, this is the first time
an agent-based simulation model has been developed to investigate oncology
chemotherapy departments where agents reproduce patients, doctors, nurses and auxiliary
resources. Although several agent-based packages are available, we deployed Netlogo®
modelling software as it is considered a user-friendly tool that makes it possible for
anyone to simulate complex physical systems (Cabrera et al., 2012; Chiacchio et al.,
2014; Liu et al., 2017; Saeedian et al., 2019; Sulis et al. 2020; Taboada et al., 2011, 2012;
Yousefi & Ferreira, 2017).
3. Model description
To describe the proposed model, the STRESS-ABS scheme according to the guidelines
introduced by Monks et al. (2019), was used. This section is divided into two sub-
sections: the former describes in detail the patient flow and the patient classification
whilst the latter explains the dynamics of the proposed simulation model.
3.1 Problem formulation
In a generic day-hospital oncology department, the patients 𝑝𝑘 (𝑘 = 1, . . . , 𝑃) are treated
and discharged on the same day. The main resources involved in the care process are the
oncologists, 𝑜𝑗 (𝑗 = 1, . . . , 𝑂), the nurses, 𝑛𝑙 (𝑙 = 1, . . . , 𝑁), and the therapy chairs, 𝑐𝑖
(𝑖 = 1, . . . , 𝐶). Furthermore, each oncology department interacts with the pharmacy
department, which in turns employs a number of pharmacy technicians, 𝑑𝑧 (𝑧 =
9
1, . . . , 𝐷), for the therapy preparation process.
The oncology process can be regarded as a three-stage hybrid flow shop (Bouras et
al., 2017; Hahn-Goldberg et al., 2014) with limited human resources, denoted in literature
as HFS/HR problem (Costa et al., 2020). As depicted in Figure 1, the 𝑘-th patient, 𝑝𝑘,
receives oncology services through the following three stages:
1) Medical consultation: Each patient arrives at the department and meets the
nurse at reception for registration. Then, they are assigned to the 𝑗-th oncologist,
𝑜𝑗(𝑝𝑘), who defines the treatment protocol and assures the continuity of care of
the patient. The treatment protocol specifies all the necessary information for the
care path of the patient, such as therapies to be used for the treatment. Before
starting the chemotherapy treatment, every patient has to meet the provided
oncologist for a preliminary medical consultation. The duration of the medical
consultation, 𝑇𝑐(𝑝𝑘), depends on the health status of the patient. The oncologist
monitors the patient’s health and evaluates the blood exams taken from the
patient one or two days prior in the same hospital or in an external laboratory.
Therefore, it is assumed that the results from the blood exams are available when
the patient meets the oncologist. Finally, based on the patient’s health conditions,
the oncologist sends the type and dose of the therapy to the pharmacy;
2) Therapy preparation: When the pharmacy receives the request, the pharmacy
technicians start the therapy preparation process, whose preparation time,
𝑇𝑝(𝑝𝑘), depends on the type of therapy. This process occurs after the medical
consultation, rejecting any anticipatory therapy preparation policy, since, in case
of absence or of unsatisfactory health status of the patient, the risk of wasting
expensive therapies increases (Hesaraki et al., 2019). When the therapy is ready,
10
it is delivered to the oncology department with a therapy delivering time, 𝑇𝑑,
which strictly depends on the location of the pharmacy and its distance from the
oncology department. If the pharmacy is located far away from the oncology
department, a courier service is necessary and therapies will be carried in
batches, 𝑏𝑤 (𝑤 = 1, . . . , 𝐵);
3) Chemotherapy’s administration: Once the therapy arrives in the oncology
department, the chemotherapy treatment of patient 𝑝𝑘 may start if both a nurse
and a treatment chair are available. In this case, the setup task can be
accomplished by a nurse, who prepares the patient for the chemotherapy
treatment. Each nurse can prepare only one patient at a time, although during the
treatment time of patients, 𝑇𝑡(𝑝𝑘), any nurse may simultaneously monitor the
infusion process of 𝑁𝑚𝑎𝑥 patients, which in literature is usually set to four
(Baesler & Sepúlveda, 2001; Baril et al., 2020). In addition, conforming to
Demir et al. (2021), a nurse can monitor the infusion process of multiple patients
while performing the setup process of a patient. Finally, when the therapy
process is completed, the same nurse releases the patient who can leave the
oncology department and go back home.
It is worth specifying that some patients do not need to undergo all the aforementioned
processes. Patients can be classified into three categories depending on their daily
pathway (Liang et al., 2015):
• Standard patients, or ‘OC type’ patients, 𝑝𝑘1
𝑂𝐶 (with 𝑘1 = 1, . . . , 𝑃𝑂𝐶|𝑃𝑂𝐶 < 𝑃),
go through all the stage of the oncology department, as described above;
11
• Repetitive patients, or ‘C type’ patients, 𝑝𝑘2
𝐶 (with 𝑘2 = 1, . . . , 𝑃𝐶|𝑃𝐶 < 𝑃), are
allowed to skip the medical consultation, as they have already met the oncologist
and received treatment the day before;
• Control patients, or ‘O type’ patients, 𝑝𝑘3
𝑂 (with 𝑘3 = 1, . . . , 𝑃𝑂|𝑃𝑂 < 𝑃), do
not need any therapy since they have successfully completed the provided
chemotherapy protocol and they only require a periodical consultation with the
oncologist.
It has to be specified that, in the same day, the oncologists can meet both 𝑃𝑂𝐶 and 𝑃𝑂
patients. Since the continuity of care is usually assured for all patients, even 𝑃𝑂 patients
have to be assigned to a specific oncologist, 𝑜𝑗(𝑝𝑘3
𝑂 ). The sum of the three categories of
patients has to be equal to the total number of patients (i.e., 𝑃𝑂𝐶 + 𝑃𝐶 + 𝑃𝑂 = 𝑃)

12
Figure 1. Description of the three-stage daily oncology care process. For each stage, we
used different coloured arrows. The patient classification is also considered in the figure
(Patient C = repetitive patients; patient OC = standard patients; patient O = control
patients).
3.2 The simulation model
A healthcare setting can be seen as a complex system and the computer simulation
represents a valuable tool to support the decision-making process. It allows users to
identify the factors which influence the patient waiting time and possible bottlenecks in
13
the systems under investigation. Figure 2 represents the graphical visualization of the
proposed simulation model developed in the agent-based Netlogo® environment
(Wilensky, 1999), including a key depicting the model agents. The simulation model is
available from authors on reasonable request. The main features are described in the
following sub-sections.
3.2.1 Layout of the model
A general layout of the model was defined to emulate the patient flow in the oncology
departments. Considering that the patient waiting time does not depend on the location of
the rooms in the department, there is no need to import the exact layout of an oncology
department into the simulation model. To this end, two main assumptions can be
considered in the model: i) the layout of the model is qualitative; ii) the time needed for
each patient to relocate from one room to another is negligible. The layout of the model
includes the following main rooms:
• The welcome room, where the patient meets the nurse at reception for registration;
• The first waiting room, where the patient waits for the medical consultation;
• The oncologists’ room, where the patient meets their oncologist for the medical
examination;
• The nurse room, where the courier delivers the batches of therapies;
• The second waiting room, where the patient waits for the treatment;
• The treatment room, where the patient undergoes the treatment monitored by the
nurses.

14
Figure 2. Agent-based framework of the simulation model.
The object located in the top-right corner of the simulation framework is the pharmacy.
Finally, the simulation time clock (with a resolution of seconds) is visible on the top-right
side of the agent-based simulation model.
3.2.2 Modelling agents
Each simulation run represents a single day in the oncology department, which starts at
08:00 AM and ends when all the treatments are concluded, which matches what happens
in a real-life scenario. Patients and human resources are represented by two types of
agents: moving agents, which move freely within the system, or fixed agents that occupy
a specific location. Specifically, the patients and the courier act as moving agents, while
15
the other resources play as fixed agents. For each simulation run, every patient agent is
created in accordance with a vector of patients’ arrival times, defined as arrival_time_list.
The 𝑘-th patient, 𝑝𝑘, can move through the rooms previously described, following a path
that depends on their classification, indicated by the agent’s colour. Red agents are the
standard patients, 𝑃𝑂𝐶, the brown agents are the repetitive patients, 𝑃𝐶 , and the green
agents are the control patients, 𝑃𝑂. Each patient may interact with four types of resources:
a nurse at reception, the oncologist for the medical consultation, the chair and the nurse
for the treatment.
According to the problem formulation in Section 3.1, 𝑃𝑂𝐶 patients follow the whole
therapy pathway, 𝑃𝑂 patients are discharged after the medical consultation and 𝑃𝐶
patients are allowed to skip the medical consultation. All the patients start the medical
consultation or the treatment based on the status of the resources involved in the related
processes, which can be denoted as ‘busy’ or ‘available’. In the case of the medical
consultation, a patient 𝑝𝑘 is allowed to enter their oncologist’s room, 𝑜𝑗(𝑝𝑘), only if the
latter is available. The First In First Out (FIFO) policy is adopted to decide the order of
patients for the oncologist visit. Finally, a patient 𝑝𝑘1
𝑂𝐶 or 𝑝𝑘2
𝐶 goes to the treatment room
if at least one chair, 𝑐𝑖, and one nurse, 𝑛𝑙, are ‘available’ and the courier has also delivered
their therapy. As described in the model description (see Section 3.1), a nurse can setup
only one patient at a time and can simultaneously monitor up to 𝑁𝑚𝑎𝑥 persons. In this
regard, the nurses’ agents are characterized by a setup_status and a monitor_status that
can be ‘busy’ or ‘available’. In fact, a patient starts the treatment if both setup_status and
monitor_status of a nurse are simultaneously ‘available’. A vector called
monitoring_patient_list is created to record the patients monitored by the nurse. If the
length of monitoring_patient_list is lower than provided limit, 𝑁𝑚𝑎𝑥, then the

16
monitor_status is ‘available’.
With respect to pharmacy resources, each pharmacy technician, which is handled
as a fixed agent, can prepare only one therapy at a time and pre-emption is not allowed.
In Figure 2, pharmacists are represented by three boxes, whose colour indicates when
each of them is available/unavailable (i.e., green/red) to prepare therapies. The behaviour
of agents related to the pharmacy strictly depends on the specific list of therapy requests
coming from the oncologists, named request_list. If the list is empty, the agents are
‘available’ and the related box of the simulation framework becomes green. Otherwise,
the agents status returns to ‘busy’ and the box becomes red. In this case, the therapy being
prepared is registered in a vector called wip_list. When the preparation of a therapy is
completed, another vector named ready_list is updated with the information of the
therapies which need to be delivered. Once the length of the ready_list equals the
provided batch size, the courier picks up the ready batch and delivers it from the pharmacy
to the oncology department. At this point, a new vector denoted as delivery_list contains
the information of the therapies that are being transported by the courier. Simultaneously,
these therapies are removed from the ready_list and a new batch size is defined for the
next therapies to be prepared and delivered.
As mentioned earlier, the courier for delivering the therapies is configured as a
moving agent and is depicted in blue in Figure 2. It is assumed that the courier is
exclusively tasked with carrying the therapy batches to the oncology department. The
proposed simulation model also handles the round-trip of the courier from the oncology
department to the pharmacy. The courier delivery time, 𝑇𝑑, is an input variable which
must be set by the analyst. Interestingly, if 𝑇𝑑 is set to zero, it is assumed to model an in-
house pharmacy. When the courier arrives to the oncology department, a specific

17
therapy_flag becomes ‘true’ to indicate that the patient’s treatment may start.
3.2.3 Communication between agents
The simulation model is characterized by multiple interactions between agents. When
communication exists between agents, one agent sends an input to another agent, causing
an output, i.e., a certain behaviour of the latter agent. The model includes three types of
communication (Yousefi & Ferreira, 2017): i) one-to-one; ii) one-to-n; iii) one-to-
location. One-to-one communication happens when a single agent interacts with another
agent, as in the case of the interaction between a patient and an oncologist. In this case,
the arrival of the patient in the oncologist’s room (input) changes the status of the
oncologist to ‘busy’ (output). One-to-n communication occurs when a single agent
communicates with a group of agents (for example, the communication between the
courier arriving in the department and the group of nurses to notify that the batch of
therapies was delivered). Finally, one-to-location communication exists when an agent
communicates with agents in a different location, such as when an oncologist
communicates with the technicians at the pharmacy in order to request the preparation of
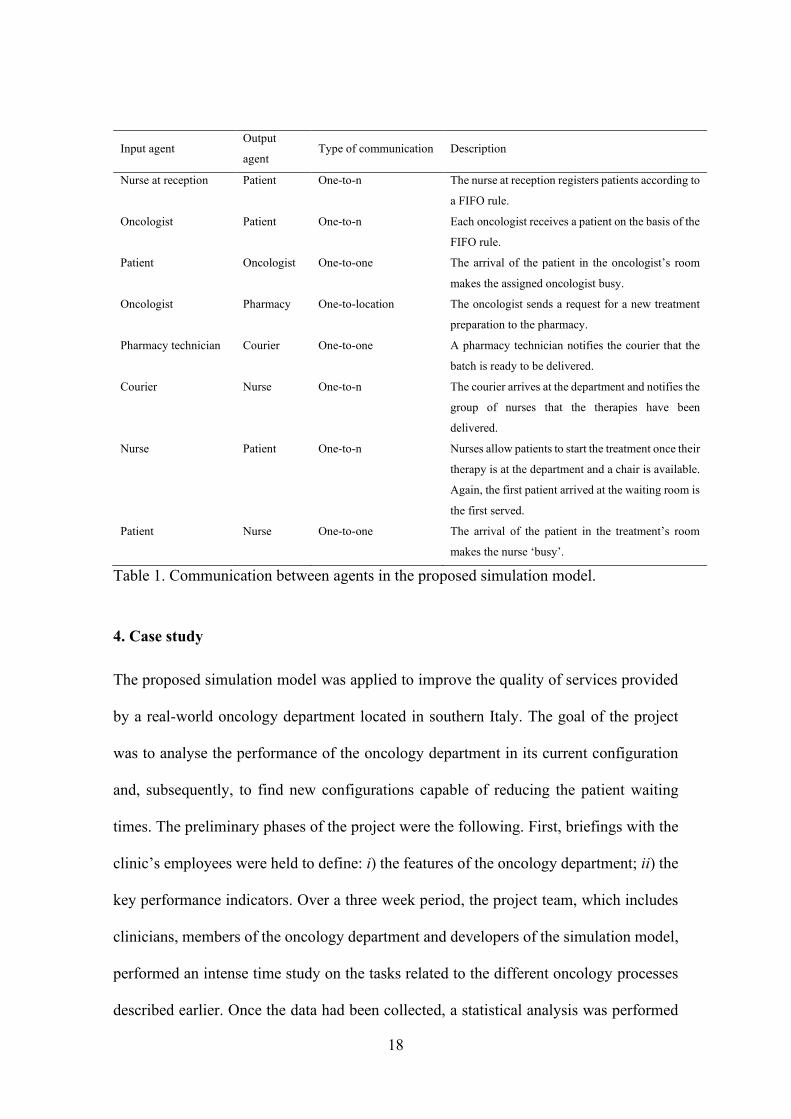
the patient’s treatment. Table 1 shows the kinds of communications involved in the
simulation model for oncology departments.
18
Input agent Output
agent Type of communication Description
Nurse at reception Patient One-to-n The nurse at reception registers patients according to
a FIFO rule.
Oncologist Patient One-to-n Each oncologist receives a patient on the basis of the
FIFO rule.
Patient Oncologist One-to-one The arrival of the patient in the oncologist’s room
makes the assigned oncologist busy.
Oncologist Pharmacy One-to-location The oncologist sends a request for a new treatment
preparation to the pharmacy.
Pharmacy technician Courier One-to-one A pharmacy technician notifies the courier that the
batch is ready to be delivered.
Courier Nurse One-to-n The courier arrives at the department and notifies the
group of nurses that the therapies have been
delivered.
Nurse Patient One-to-n Nurses allow patients to start the treatment once their
therapy is at the department and a chair is available.
Again, the first patient arrived at the waiting room is
the first served.
Patient Nurse One-to-one The arrival of the patient in the treatment’s room
makes the nurse ‘busy’.
Table 1. Communication between agents in the proposed simulation model.
4. Case study
The proposed simulation model was applied to improve the quality of services provided
by a real-world oncology department located in southern Italy. The goal of the project
was to analyse the performance of the oncology department in its current configuration
and, subsequently, to find new configurations capable of reducing the patient waiting
times. The preliminary phases of the project were the following. First, briefings with the
clinic’s employees were held to define: i) the features of the oncology department; ii) the
key performance indicators. Over a three week period, the project team, which includes
clinicians, members of the oncology department and developers of the simulation model,
performed an intense time study on the tasks related to the different oncology processes
described earlier. Once the data had been collected, a statistical analysis was performed

19
with the aim of finding the stochastic distributions of the main input variables of the
simulation model.
4.1 Key Performance Indicators (KPIs)
It is well known that cancer diseases dramatically affect the physical and emotional status
of suffering individuals. In this context, reducing the patient waiting time is the main
objective so as to enhance the quality of cancer treatment within facilities (Gesell &
Gregory, 2004), which is recognized as the primary source of patient dissatisfaction
(Aboumatar et al., 2008; Edwards et al., 2017; Gourdji et al., 2003). In light of the
previous considerations, in this paper the total flowtime, 𝐹 (i.e., the sum of the length of
stay of patients), was adopted as a key performance indicator (KPI). The length of stay
consists of the total time a patient spends in the oncology department, i.e., the time
interval ranging from the time he/she is registered at reception to the end of the
chemotherapy treatment. Particularly, the mean flow time, from now on denoted as �̅�,
was selected to measure the performance of any department configuration in the
successive analyses. Furthermore, two additional indicators were engaged to compare the
status-quo of the oncology department with the simulated configurations, namely the
mean patient waiting time, 𝑊𝑇̅̅ ̅̅ ̅, and the system efficiency, 𝐸𝑓𝑓, calculated as follows:
𝐸𝑓𝑓 =𝐹−𝑊𝑇̅̅ ̅̅ ̅
𝐹∙ 100 (1)
4.2 Data collection and statistical distributions
A time study covering three working weeks was carried out to collect the experimental
data related to the department status-quo. During that period, the healthcare department,
which consisted of 3 oncologists, 13 chairs, 1 nurse at reception and 3 nurses for the
treatment, received 28 patients on average per day. Four patients who are receiving

20
treatment can be simultaneously monitored by one nurse. A single pharmacy technician
working in an external pharmacy is dedicated to the preparation of the oncology therapies.
A single auxiliary courier is employed to deliver the therapy batches from the pharmacy
to the oncology department.
Table 2 reports model parameters and stochastic distributions obtained by analysing
the aforementioned status-quo related data. The number of patients per day is derived
from a normal distribution with mean 28.07 and standard deviation 3.94. As stated above,
usually these patients undergo two different processing stages: medical consultation and
chemotherapy administration, which starts after the therapy delivery. Among the patients,
22.32% need only the medical consultation (𝑃𝑂), while 6.18% attend only the
chemotherapy’s administration monitored by the nurse (𝑃𝐶), and the remaining 71.50%
are classified as standard patients (𝑃𝑂𝐶). The experimental analysis revealed that the
arrival times for each type of patient can be handled by considering five time windows,
each one related to a different occurrence probability. Therefore, once the time interval is
selected, every patient arrival time is drawn from an uniform distribution U[0, 59] in
minutes. For 𝑃𝑂 and 𝑃𝑂𝐶, the oncologist is assigned to the patient using a random
criterion as soon as the patient agent is created. The duration of the medical consultation
is derived from a uniform distribution U[5,35], in minutes. This uniform distribution is
adopted for both 𝑃𝑂𝐶 and 𝑃𝑂 patients. The order of patients for the medical consultation
is decided using the FIFO policy. Regarding the therapy’s preparation, they can be
classified into three typologies based on preparation time (short, medium and long.
Therapies are delivered in batch sizes, which may vary between 2 and 12, depending on
courier availability and pharmacy workload. A batch may contain any type of therapy,
while the batch size may vary at every courier pick up. The courier takes 10 minutes to
deliver the therapies to the department and another 10 minutes to return to the pharmacy.
21
However, there is a 26.53% probability of delay due to traffic congestion in each
direction. Finally, the experimental studies conducted on the department showed that the
treatments can be classified into five types, each one involving a different time duration.
Notably, each treatment can be executed according to a specific occurrence probability
and its duration implies the setup time. It is assumed that there is no relationship between
the treatment duration and the therapy’s preparation time. The time needed by a nurse to
release a patient after the treatment can be considered negligible (Hesaraki et al., 2019).

22
Descriptors of process Values or probability distribution
Patients
Number of patients (𝑃) N(28.07,3.94)
Classification of patient
Standard patient (𝑃𝑂𝐶) 71.50%
Repetitive patient (𝑃𝐶) 6.18%
Control patient (𝑃𝑂) 22.32%
Arrival time
08:30-09:30 56.58%
09:31-10:30 12.54%
10:31-11:30 5.81%
11:31-12:30 13.76%
12:31-13:30 11.31%
Registration
Number of nurses at reception (NR) 1
Duration (min) of registration 1
Medical consultation
Number of oncologists (𝑂) 3
Duration (min) of medical consultation (𝑇𝑐(𝑝𝑘)) U(5,35)
Assignment of patient-oncologist (𝑜𝑗(𝑝𝑘)) Random
Pharmacy
Number of pharmacy technician (𝐷) 1
Duration (min) of therapy’s preparation (𝑇𝑝(𝑝𝑘))
Short preparation U(1,5)
Medium preparation U(6,10)
Long preparation U(11,27)
Probability of typology of therapy’s preparation
Short preparation 71.38%
Medium preparation 20.34%
Long preparation 8.28%
Therapies’ delivery
Number of couriers (𝛼) 1
Batch size U(2,12)
Duration (min) of delivery (𝑇𝑑)
Delivery without delay 10
Delivery with delay 10 + U(2,10)
Probability of delay in delivery
Delivery without delay 73.47%
Delivery with delay 26.53%
Treatment administration
Number of chairs (𝐶) 13
Number of nurses (𝑁) 3
Treatment duration (min) (𝑇𝑡(𝑝𝑘))
Type 1 U(15,60)
Type 2 U(61,120)
Type 3 U(121,180)
Type 4 U(181,240)
Type 5 U(241,300)
Probability of treatment occurrence
Type 1 30.13%
Type 2 38.91%
Type 3 14.23%
Type 4 12.13%
Type 5 4.60%
Table 2. Model descriptors.
23
5. Experimental results
The verification and validation process were performed to verify if the simulation model
was consistent with the problem description and if the outcomes of the simulations
reproduced the status quo of a typical day in the oncology department. Then, a DOE was
arranged to use the validated simulation model to test different department configurations
and improve the performance of the department using the validated simulation model. In
light of the multitude of stochastic parameters, a stochastic simulation approach was
adopted for all the numerical investigations to assure the robustness of the proposed
analysis. Therefore, each KPI was evaluated in terms of its expected value:
𝐸(𝐾𝑃𝐼) =∑ 𝐾𝑃𝐼(𝜔)𝛺
𝜔=1
𝛺 (2)
where 𝜔 is the replicate of a certain department configuration and 𝛺 is the whole set of
replicates.
5.1 Verification and validation of the simulation model
A preliminary step of any simulation model consists in demonstrating that it provides
credible results (Balci, 2003; Roza et al., 2017). To this end, Verification and Validation
(V&V) techniques are generally carried out to assure the effectiveness of a simulation
model (Kleijnen, 1995). Specifically, the verification process assures that the conceptual
model of the problem was transformed into a computer simulation model with sufficient
accuracy (Robinson, 1997). The well-structured debug tool of NetLogo® and its model
visualization were used to perform a dynamic verification test of the simulation model,
which is widely used in literature (Sargent, 2013). Validation is necessary to demonstrate
the efficacy of the model in reproducing the actual performance of the system under
investigation with a satisfactory approximation. Sargent (2013) classified several
24
validation techniques that can be applied to a given simulation model. In this paper we
adopted the ‘Historical data validation’ technique, which compares the key performance
indicators obtained by the presented simulation model with one obtained by analysing the
status-quo related configuration, as shown in Table 3. Looking at the numerical
outcomes, the actual performance of the oncology department in terms of the
aforementioned KPIs are as follows:
- the mean flowtime, �̅�, is equal to 265.46 minutes, with a 95% confidence interval
(CI) equal to [243.00; 287.92] ;
- the mean patient waiting time, 𝑊𝑇̅̅ ̅̅ ̅, is equal to 138.28 minutes, with a 95% CI
equal to [123.14; 153.42];
- the efficiency, 𝐸𝑓𝑓, is equal to 47.97%, with a 95% CI equal to [45.41%;
50.53%];
For both the real and the simulation configurations, Table 3 reports the expected
KPIs, the confidence intervals at 95% and the percentage deviation (𝐷𝑒𝑣). 𝐷𝑒𝑣 is
calculated as follows:
𝐷𝑒𝑣 = |𝐸(𝐾𝑃𝐼𝑠𝑖𝑚)−𝐾𝑃𝐼𝑟𝑒𝑎𝑙
𝐾𝑃𝐼𝑟𝑒𝑎𝑙∙ 100| (3)
where 𝐸(𝐾𝑃𝐼𝑠𝑖𝑚) is the expected KPI resulting from the simulation model, while 𝐾𝑃𝐼𝑟𝑒𝑎𝑙
is the KPI’s value of the status-quo of the oncology department. Interestingly, the
percentage deviation values (𝐷𝑒𝑣) reported in Table 3 confirm the validity of the
developed simulative procedure. To further strengthen this outcome, the last column of
the table reports the p-values resulting from the paired t-tests carried out for each KPI.
The paired t-tests are used in order to assess if there exists any statistically significant
difference between the means of the real and simulated configurations; 𝑝-values greater
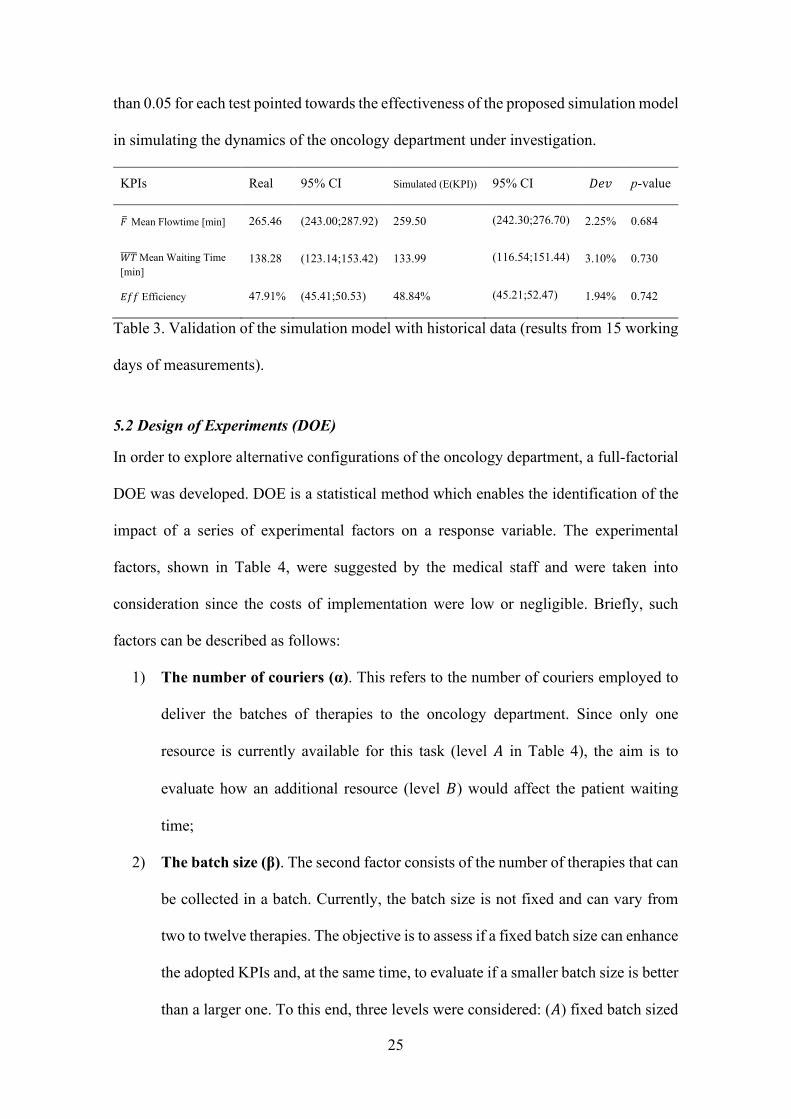
25
than 0.05 for each test pointed towards the effectiveness of the proposed simulation model
in simulating the dynamics of the oncology department under investigation.
KPIs Real 95% CI Simulated (E(KPI)) 95% CI 𝐷𝑒𝑣 p-value
�̅� Mean Flowtime [min] 265.46 (243.00;287.92) 259.50 (242.30;276.70)
2.25% 0.684
𝑊𝑇̅̅ ̅̅ ̅ Mean Waiting Time
[min]
138.28 (123.14;153.42) 133.99 (116.54;151.44)
3.10% 0.730
𝐸𝑓𝑓 Efficiency 47.91% (45.41;50.53) 48.84% (45.21;52.47)
1.94% 0.742
Table 3. Validation of the simulation model with historical data (results from 15 working
days of measurements).
5.2 Design of Experiments (DOE)
In order to explore alternative configurations of the oncology department, a full-factorial
DOE was developed. DOE is a statistical method which enables the identification of the
impact of a series of experimental factors on a response variable. The experimental
factors, shown in Table 4, were suggested by the medical staff and were taken into
consideration since the costs of implementation were low or negligible. Briefly, such
factors can be described as follows:
1) The number of couriers (α). This refers to the number of couriers employed to
deliver the batches of therapies to the oncology department. Since only one
resource is currently available for this task (level 𝐴 in Table 4), the aim is to
evaluate how an additional resource (level 𝐵) would affect the patient waiting
time;
2) The batch size (β). The second factor consists of the number of therapies that can
be collected in a batch. Currently, the batch size is not fixed and can vary from
two to twelve therapies. The objective is to assess if a fixed batch size can enhance
the adopted KPIs and, at the same time, to evaluate if a smaller batch size is better
than a larger one. To this end, three levels were considered: (𝐴) fixed batch sized
26
with three therapies; (𝐵) fixed batch size with six therapies; (𝐶) variable batch
size (i.e., corresponding to the current configuration);
3) The appointment distribution (γ). The first level (𝐴) provides three time-
windows of one hour and thirty minutes, each one with the same probability of
occurrence equal to 33%. Similarly, the second level (𝐵) consists of five time-
windows of one hour, each with a probability of 20%. Level C describes the
current case in which patients arrive at the oncology department conforming to
five time-windows characterized by different occurrence probability (see Table
2);
4) The daily number of patients (δ). The last factor represents the average number
of patients for each working day. Currently, every day the department takes care
of about 28 patients (level 𝐴). The goal is to analyse how the performance changes
when considering a higher number of patients. To this end, an additional level (𝐵)
with 31 individuals is considered, which corresponds to an increase of about 10%
of patients per day. It is worth specifying that both levels refer to the mean of the
normal distribution related to the number of patients per day (see Table 2) , while
the standard deviation is kept constant at 3.94.
Notably, the current configuration of the oncology department is {A-C-C-A}, considering
a one-to-one correspondence with the set of experimental factors {---}, respectively.
We defined a full-factorial DOE, which involves 32 ∙ 22 = 36 different configurations of
the oncology department, in order to study the influence of the experimental factors on
the performance of the department. In addition, to make the statistical analysis robust
enough, Ω = 5,000 different replicates at varying random seeds, each one simulating a
different working day, were executed, thus achieving a number of 5,000 ∙ 36 = 180,000
experiments. The DOE was performed on five virtual machines installed on a workstation
27
equipped with an INTEL i9-9900 3.6 GHz 10 core CPU, 32Gb DDR4 2,666MHz RAM
and Win 10 PRO OS. Since the computational time required to simulate each
configuration is equal to about 5 seconds, approximately two days were needed to
accomplish the whole DOE. Only the expected mean flowtime, 𝐸(�̅�), was used as a KPI,
since the expected mean waiting time, 𝐸(𝑊𝑇̅̅ ̅̅ ̅), and the expected efficiency, 𝐸(𝐸𝑓𝑓), are
strictly related to the former. However, all KPIs will be used in the next analysis to stress
the difference between the best configuration and the status quo.
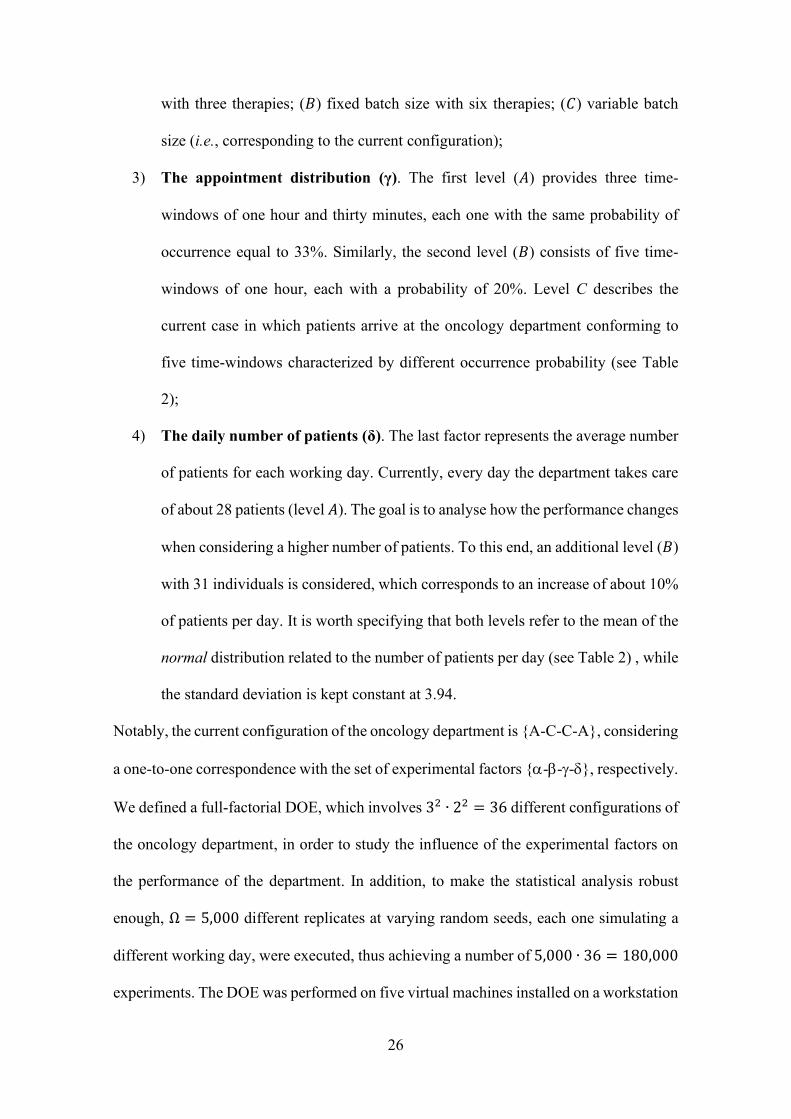
Factors Levels
Symbols Description A B C
𝛼 Number of couriers 1 2 -
𝛽 Batch size 3 6 U(2,12)
𝛾 Appointment distribution 3 5 5*
𝛿 Capacity of the department 28 31 -
(*) time intervals with different occurrence probabilities for the status quo configuration (see Table 2).
Table 4. Factors/levels involved in the design of experiments.
5.3 Analysis of results and managerial implications
The analysis of variance (ANOVA) determines whether the experimental factors
statistically influence the key performance indicators. To this end, an ANOVA analysis
at 95% level of confidence was carried out in the Minitab® 2017 commercial package to
evaluate the statistical significance of each factor. The numerical outputs from the
ANOVA (see Table 5) show the results concerning the main effects. The plots related to
the main effects are reported in Figure 3. The 2-way interactions are not reported in the
table (but are available upon request) since no relevant findings were detected. Looking
at the condensed ANOVA table, it is worth pointing out that the adjusted R-squared (i.e.,

28
the adjusted coefficient of determination) is larger than 95%. A higher value of the R-
squared demonstrates that the model fits the data of the analysis, thus confirming the
robustness and the consistency of the proposed approach.
29
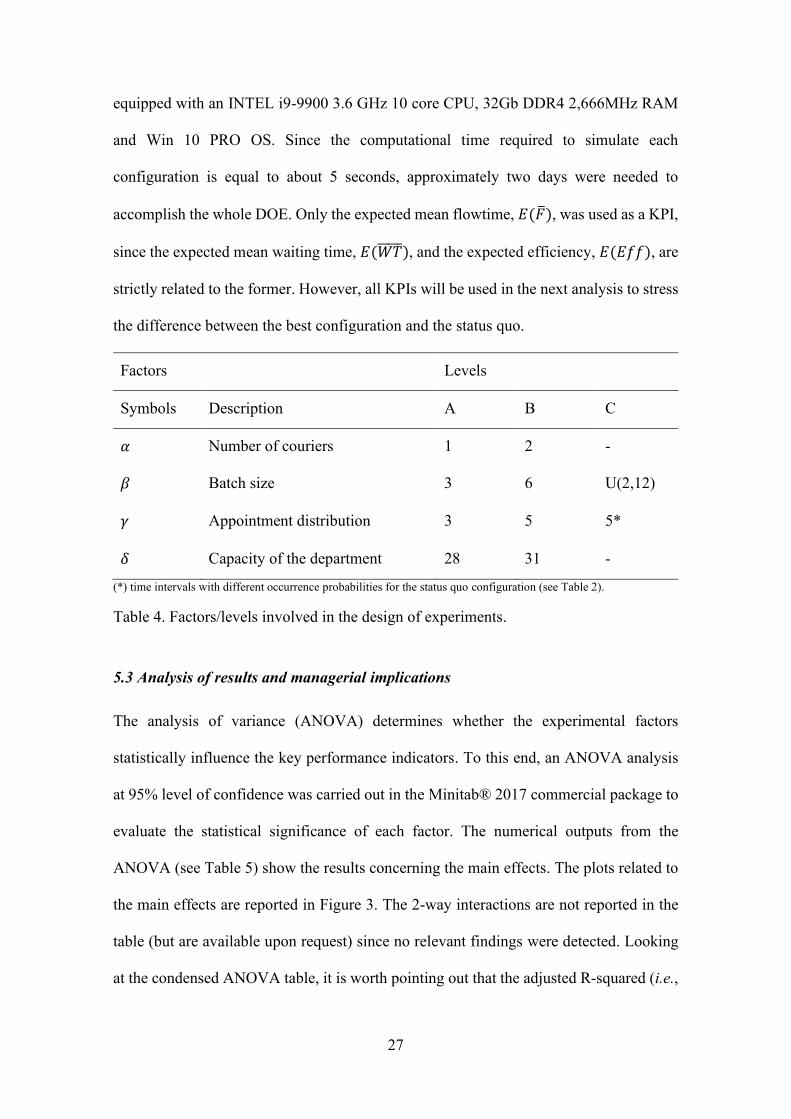
Source DF 𝐹-value 𝑝-value
Model 19 40299.03 0.000
𝛼 1 42.99 0.000
𝛽 2 292158.50 0.000
𝛾 2 52500.10 0.000
𝛿 1 73713.83 0.000
Adjusted R2 > 95%
Table 5. ANOVA Table.
With regards to the experimental factors, the 𝑝-value below 0.05 implies that they
are statistically significant for the expected mean flowtime, 𝐸(�̅�), at 95% confidence
level. The significance of the influencing factors on the mean flowtime is further
exacerbated by related 𝐹-values. Indeed, the most important factors are usually identified
by an F-value larger than 50 (Yu et al., 2018). The F-value associated with factor 𝛼
reveals that the number of couriers may have a weak effect on the performance of the
system, as confirmed by the related main effect plots in Figure 3. To this end, a paired t-
test at 95% confidence was performed and confirmed that the null hypothesis assumption
that the mean difference between the paired samples is zero (i.e., 𝐻0: 𝜇𝑑 = 0) can be
rejected. In conclusion, the mean flow time is statistically insensitive to factor .
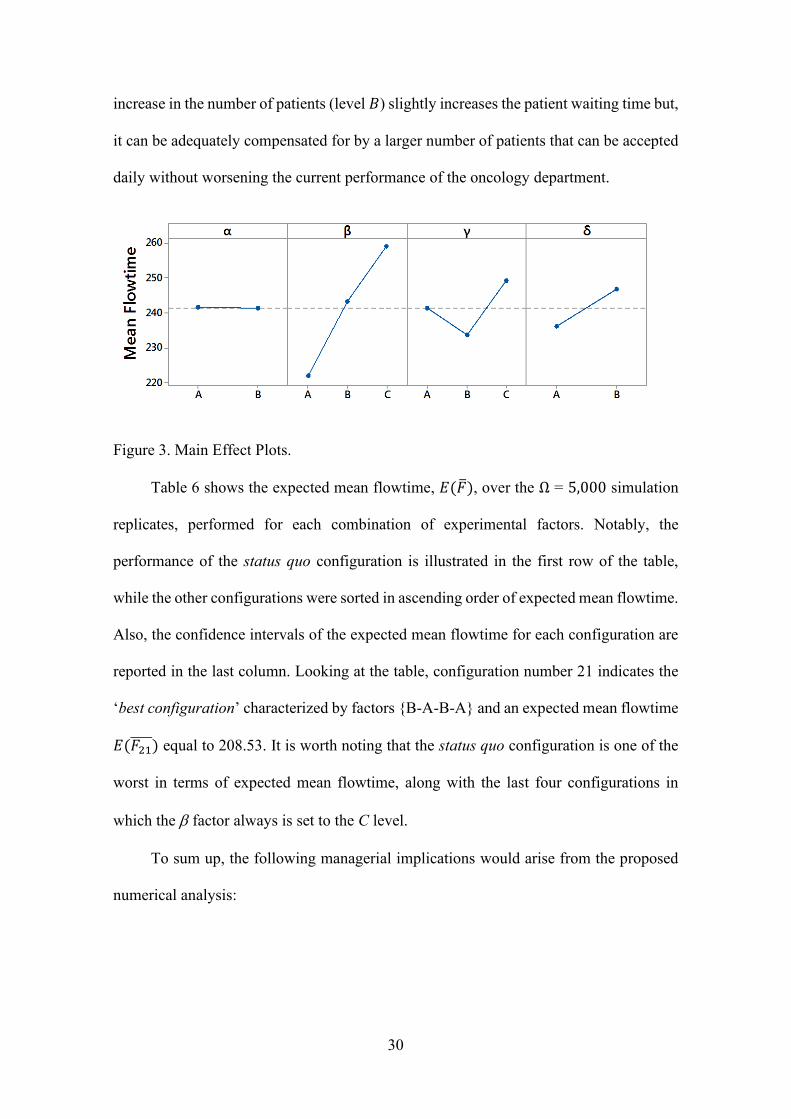
Interestingly, Figure 3 related to factor shows that fixing the batch size at the
lowest value (level A) would favour the mean flow time reduction, while the current
strategy based on a random batch size (level 𝐶) negatively biases the mean waiting time
of patients. As for 𝛾, rendering the arrival of the patients smoother by introducing new
appointment distribution strategies (e.g., levels 𝐴 and 𝐵) makes the service level better
than the actual one (level 𝐶). In particular, the strategy corresponding to level 𝐵 reduces
patient waiting time by approximately 20 minutes on average. Finally, as for factor 𝛿, an
30
increase in the number of patients (level 𝐵) slightly increases the patient waiting time but,
it can be adequately compensated for by a larger number of patients that can be accepted
daily without worsening the current performance of the oncology department.
Figure 3. Main Effect Plots.
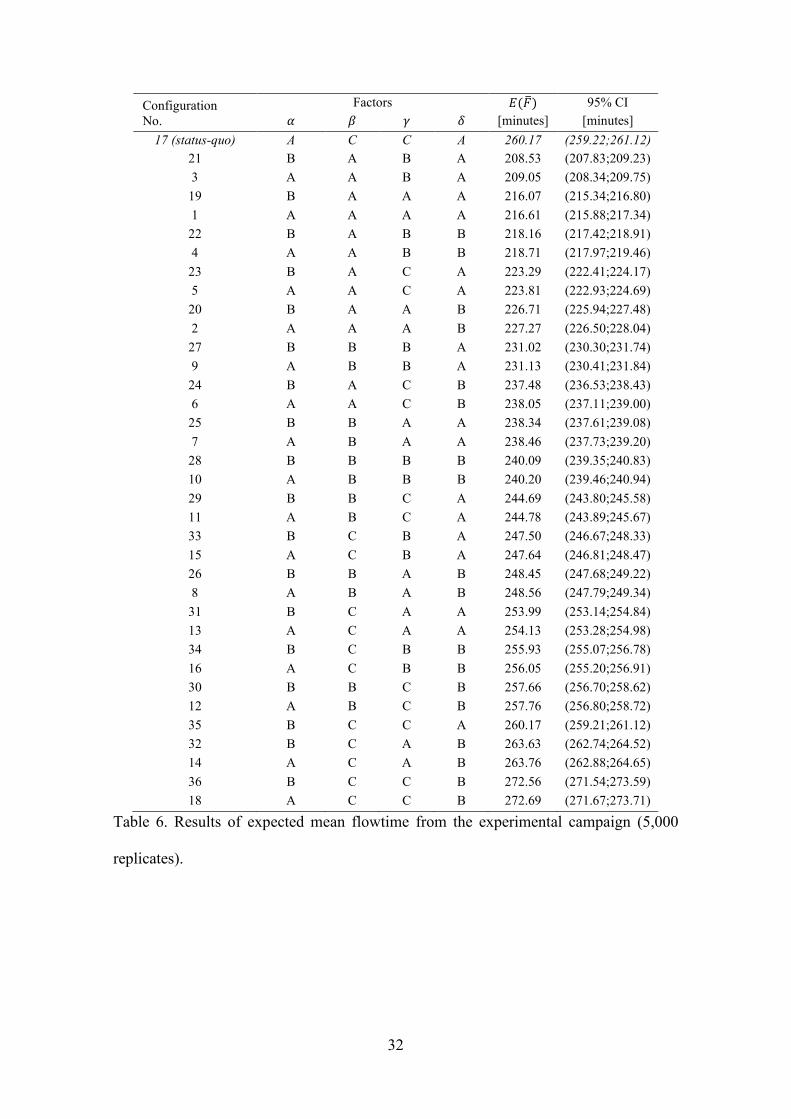
Table 6 shows the expected mean flowtime, 𝐸(�̅�), over the Ω = 5,000 simulation
replicates, performed for each combination of experimental factors. Notably, the
performance of the status quo configuration is illustrated in the first row of the table,
while the other configurations were sorted in ascending order of expected mean flowtime.
Also, the confidence intervals of the expected mean flowtime for each configuration are
reported in the last column. Looking at the table, configuration number 21 indicates the
‘best configuration’ characterized by factors {B-A-B-A} and an expected mean flowtime
𝐸(𝐹21̅̅ ̅̅ ) equal to 208.53. It is worth noting that the status quo configuration is one of the
worst in terms of expected mean flowtime, along with the last four configurations in
which the factor always is set to the C level.
To sum up, the following managerial implications would arise from the proposed
numerical analysis:
31
1) On the daily basis, the oncology department could save 40 minutes of patient
waiting time by moving from a random batch size to a fixed batch size of three
therapies. This improvement could be realized without investing additional funds;
2) Focusing on the patients’ appointments could also reduce the patient waiting time.
A uniform distribution of patients’ arrival times through five time-windows of one
hour emerges as a valid alternative to enhance the performance of the department
without investing additional funds;
3) Looking at the best configuration, an increase in the number of patients per day
(configuration number 22) would involve a slight increase in expected patient
waiting time to about ten minutes on average. However, this configuration
remains more successful than the status-quo configuration in terms of patient
waiting time;
4) Since the number of couriers does not influence the expected mean flowtime, there
would be no benefit from the addition of new resources dedicated to therapy
delivery.
32
Configuration
No.
Factors 𝐸(�̅�) 95% CI
𝛼 𝛽 𝛾 𝛿 [minutes] [minutes]
17 (status-quo) A C C A 260.17 (259.22;261.12)
21 B A B A 208.53 (207.83;209.23)
3 A A B A 209.05 (208.34;209.75)
19 B A A A 216.07 (215.34;216.80)
1 A A A A 216.61 (215.88;217.34)
22 B A B B 218.16 (217.42;218.91)
4 A A B B 218.71 (217.97;219.46)
23 B A C A 223.29 (222.41;224.17)
5 A A C A 223.81 (222.93;224.69)
20 B A A B 226.71 (225.94;227.48)
2 A A A B 227.27 (226.50;228.04)
27 B B B A 231.02 (230.30;231.74)
9 A B B A 231.13 (230.41;231.84)
24 B A C B 237.48 (236.53;238.43)
6 A A C B 238.05 (237.11;239.00)
25 B B A A 238.34 (237.61;239.08)
7 A B A A 238.46 (237.73;239.20)
28 B B B B 240.09 (239.35;240.83)
10 A B B B 240.20 (239.46;240.94)
29 B B C A 244.69 (243.80;245.58)
11 A B C A 244.78 (243.89;245.67)
33 B C B A 247.50 (246.67;248.33)
15 A C B A 247.64 (246.81;248.47)
26 B B A B 248.45 (247.68;249.22)
8 A B A B 248.56 (247.79;249.34)
31 B C A A 253.99 (253.14;254.84)
13 A C A A 254.13 (253.28;254.98)
34 B C B B 255.93 (255.07;256.78)
16 A C B B 256.05 (255.20;256.91)
30 B B C B 257.66 (256.70;258.62)
12 A B C B 257.76 (256.80;258.72)
35 B C C A 260.17 (259.21;261.12)
32 B C A B 263.63 (262.74;264.52)
14 A C A B 263.76 (262.88;264.65)
36 B C C B 272.56 (271.54;273.59)
18 A C C B 272.69 (271.67;273.71)
Table 6. Results of expected mean flowtime from the experimental campaign (5,000
replicates).

33
Finally, Table 7 compares the best simulated configuration and the simulated
status quo in terms of expected mean flowtime, 𝐸(�̅�), expected mean waiting time,
𝐸(𝑊𝑇̅̅ ̅̅ ̅), and expected efficiency, 𝐸(𝐸𝑓𝑓). Notably, Table 7 also reports the related 95%
confidence intervals (CI) and the percentage deviations (𝐷𝑒𝑣). The percentage deviations
reveal that the best configuration reduces the expected flowtime, 𝐸(�̅�), by 19.85%, the
expected mean waiting time, 𝐸(𝑊𝑇̅̅ ̅̅ ̅), by 37.73% and increases the expected efficiency,
𝐸(𝐸𝑓𝑓), by 24.77%.
KPIs Simul. status quo 95% CI Simul. best config. 95% CI 𝐷𝑒𝑣
𝐸(�̅�) 260.17 min (259.22;261.12) 208.53 min (207.83;209.23)
19.85%
𝐸(𝑊𝑇̅̅ ̅̅ ̅) 136.87 min (136.01;137.73) 85.23 min (84.66;85.80) 37.73%
𝐸(𝐸𝑓𝑓) 47.39% (47.21;47.57) 59.13% (58.96;59.30) 24.77%
Table 7. Simulation results from 5,000 replicates/runs: status quo vs best configuration.
6. Conclusion
In this study, we developed a computer agent-based simulation model explicitly designed
to be configurable and adaptable to the needs of oncology departments. The case in which
the pharmacy is detached from the oncology department and, therefore, a courier service
delivers batches of therapies is considered. The validity of the proposed model was
demonstrated through a statistical analysis based on a set of experimental data obtained
by studying an oncology department located in southern Italy. Consequently, a series of
alternative configurations were tested through a robust simulation campaign based on a
full-factorial design of experiments. The results were evaluated through an ANOVA
analysis, revealing that a fixed batch size with a low number of therapies and an effective
appointment strategy significantly decrease the patient waiting time. The best simulated
configuration was selected and compared with the status quo by means of three main key
34
performance indicators. This comparison shows that the expected patient waiting time
can be reduced by 37.7% in percentage deviation and the expected department efficiency
can be increased by 24.8%. Finally, the simulation model was delivered to the healthcare
managers who implemented the “best configuration” to the chemotherapy department at
hand. Due to the COVID pandemic we are not allowed to visit the department, but we
received positive feedback from the medical staff regarding a significant improvement in
service level. Hopefully, further data will be collected in the near future to support the
validity of the proposed research.
The present paper reports an experimental campaign specifically conducted for
the oncology department at hand. In fact, the proposed DOE was defined jointly with the
healthcare staff of the hospital, with the aim of identifying an improved service
configuration, without investing additional funds (according to lean principles).
However, in accordance with the managing staff, further efforts will be dedicated to a
future project to assess the impact of additional resources (e.g., the number of pharmacy
technicians or treatment chairs) and different queuing mechanisms on the same or new
performance indicators (e.g., overtime after the closing time or nurse workload). To this
end, future research can be oriented towards either simulation-optimization approaches
or hybrid simulation models, capable of adequately capturing macro- and micro-level
dynamics of such complex healthcare systems.
Reference:
Abar, S., Theodoropoulos, G. K., Lemarinier, P., & O’Hare, G. M. (2017). Agent Based Modelling and
Simulation tools: A review of the state-of-art software. Computer Science Review, 24, 13-33.
Abo-Hamad, W., & Arisha, A. (2014). Multi-criteria approach using simulation-based balanced scorecard
for supporting decisions in health-care facilities: an emergency department case study. Health
Systems, 3(1), 43-59.
35
Aboumatar, H. J., Winner, L. E., Davis, R. O., Trovitch, P. B., Berg, M. M., Violette, K. M., ... &
Lehmann, C. U. (2008). No time to waste: decreasing patient wait times for chemotherapy administration
using automated prioritization in an oncology pharmacy system. American Journal of Managed Care,
14(5).
Ahmed, M. A., & Alkhamis, T. M. (2009). Simulation optimization for an emergency department
healthcare unit in Kuwait. European journal of operational research, 198(3), 936-942.
Ahmed, Z., ElMekkawy, T. Y., & Bates, S. (2011). Developing an efficient scheduling template of a
chemotherapy treatment unit: A case study. The Australasian medical journal, 4(10), 575.
Ajmi, F., Zgaya, H., Othman, S. B., & Hammadi, S. (2019). Agent-based dynamic optimization for
managing the workflow of the patient's pathway. Simulation Modelling Practice and Theory, 96, 101935.
Alvarado, M. M., Cotton, T. G., Ntaimo, L., Pérez, E., & Carpentier, W. R. (2018). Modeling and
simulation of oncology clinic operations in discrete event system specification. Simulation, 94(2), 105-121.
Arafeh, M., Barghash, M. A., Haddad, N., Musharbash, N., Nashawati, D., Al-Bashir, A., & Assaf, F.
(2018). Using Six Sigma DMAIC methodology and discrete event simulation to reduce patient discharge
time in King Hussein Cancer Center. Journal of healthcare engineering, 2018.
Baesler, F. F., & Sepúlveda, J. A. (2001, December). Multi-objective simulation optimization for a cancer
treatment center. In Proceeding of the 2001 Winter Simulation Conference (Cat. No. 01CH37304) (Vol. 2,
pp. 1405-1411). IEEE.
Balci, O. (2003, December). Verification, validation, and certification of modeling and simulation
applications. In Winter Simulation Conference (Vol. 1, pp. 150-158).
Baril, C., Gascon, V., & Miller, J. (2020). Design of experiments and discrete-event simulation to study
oncology nurse workload. IISE Transactions on Healthcare Systems Engineering, 10(1), 74-86.
Baril, C., Gascon, V., Miller, J., & Bounhol, C. (2016a). Studying nurse workload and patient waiting time
in a hematology-oncology clinic with discrete event simulation. IIE Transactions on Healthcare Systems
Engineering, 6(4), 223-234.
Baril, C., Gascon, V., Miller, J., & Bounhol, C. (2017). The importance of considering resource’s tasks
when modeling healthcare services with discrete-event simulation: an approach using work sampling
method. Journal of Simulation, 11(2), 103-114.
Baril, C., Gascon, V., Miller, J., & Côté, N. (2016b). Use of a discrete-event simulation in a Kaizen event:
A case study in healthcare. European Journal of Operational Research, 249(1), 327-339.
36
Borshchev, A., & Filippov, A. (2004, July). From system dynamics and discrete event to practical agent
based modeling: reasons, techniques, tools. In Proceedings of the 22nd international conference of the
system dynamics society (Vol. 22, pp. 25-29). Oxford.
Bouras, A., Masmoudi, M., Saadani, N. E. H., & Bahroun, Z. (2017, April). A three-stage appointment
scheduling for an outpatient chemotherapy unit using integer programming. In 2017 4th International
Conference on Control, Decision and Information Technologies (CoDIT) (pp. 0916-0921). IEEE.
Brailsford, S. C., Eldabi, T., Kunc, M., Mustafee, N., & Osorio, A. F. (2019). Hybrid simulation modelling
in operational research: A state-of-the-art review. European Journal of Operational Research, 278(3), 721-
737.
Cabrera, E., Luque, E., Taboada, M., Epelde, F., & Iglesias, M. L. (2012, December). ABMS optimization
for emergency departments. In Proceedings of the 2012 Winter Simulation Conference (WSC) (pp. 1-12).
IEEE.
Candore, G., Colonna-Romano, G., Balistreri, C. R., Carlo, D. D., Grimaldi, M. P., Listì, F., ... & Caruso,
C. (2006). Biology of longevity: role of the innate immune system. Rejuvenation research, 9(1), 143-148.
Cassidy, R., Singh, N. S., Schiratti, P. R., Semwanga, A., Binyaruka, P., Sachingongu, N., ... & Blanchet,
K. (2019). Mathematical modelling for health systems research: a systematic review of system dynamics
and agent-based models. BMC health services research, 19(1), 1-24.
Chiacchio, F., Pennisi, M., Russo, G., Motta, S., & Pappalardo, F. (2014). Agent-based modeling of the
immune system: NetLogo, a promising framework. BioMed research international, 2014.
Costa, A., Viagas, V. F., & Framinam, J. M. (2020). Solving the hybrid flow shop scheduling problem with
limited human resource constraint. Computers & Industrial Engineering, 106545.
Demir, E., Gunal, M. M., & Southern, D. (2017). Demand and capacity modelling for acute services using
discrete event simulation. Health Systems, 6(1), 33-40.
Demir, N. B., Gul, S., & Çelik, M. (2021). A stochastic programming approach for chemotherapy
appointment scheduling. Naval Research Logistics (NRL), 68(1), 112-133.
Djanatliev, A., & German, R. (2013, December). Prospective healthcare decision-making by combined
system dynamics, discrete-event and agent-based simulation. In 2013 Winter Simulations Conference
(WSC) (pp. 270-281). IEEE.

37
Edaibat, E. A., Dever, J., & Stuban, S. M. (2017). System dynamics simulation modeling of health
information exchange (HIE) adoption and policy intervention: A case study in the State of
Maryland. Operations Research for Health Care, 12, 60-70.
Edwards, L., Hermis, K., LeGette, C. R., Lujan, L. A., & Scarlett, C. (2017). Acuity-Based Scheduling.
Clinical journal of oncology nursing, 21(2).
Farris, J. A., Van Aken, E. M., Doolen, T. L., & Worley, J. (2009). Critical success factors for human
resource outcomes in Kaizen events: An empirical study. International Journal of Production Economics,
117(1), 42-65.
Forrester, J. W. (1958). Industrial Dynamics. A major breakthrough for decision makers. Harvard business
review, 36(4), 37-66.
Fragapane, G. I., Zhang, C., Sgarbossa, F., & Strandhagen, J. O. (2019). An agent-based simulation
approach to model hospital logistics. Int J Simul Model, 18(4), 654-665.
Gesell, S. B., & Gregory, N. (2004). Identifying priority actions for improving patient satisfaction with
outpatient cancer care. Journal of nursing care quality, 19(3), 226-233.
Goldstein, M., Bajorin, D., Beekman, K. W., Kosty, M. P., Paulson, R. S., Rodriguez, G. I., & Williams,
S. F. (2008). Future supply of and demand for oncologists. Journal of Oncology Practice, 4(6), 300-302.
Gourdji, I., McVey, L., & Loiselle, C. (2003). Patients' satisfaction and importance ratings of quality in an
outpatient oncology center. Journal of nursing care quality, 18(1), 43-55.
Gunal, M. M. (2012). A guide for building hospital simulation models. Health Systems, 1(1), 17-25.
Hahn-Goldberg, S., Carter, M. W., Beck, J. C., Trudeau, M., Sousa, P., & Beattie, K. (2014). Dynamic
optimization of chemotherapy outpatient scheduling with uncertainty. Health care management
science, 17(4), 379-392.
Hesaraki, A. F., Dellaert, N. P., & de Kok, T. (2019). Generating outpatient chemotherapy appointment
templates with balanced flowtime and makespan. European Journal of Operational Research, 275(1), 304-
318.
Katzke, V. A., Kaaks, R., & Kühn, T. (2015). Lifestyle and cancer risk. The Cancer Journal, 21(2), 104-
110.
Kleijnen, J. P. (1995). Verification and validation of simulation models. European journal of operational
research, 82(1), 145-162.
38
Liang, B., Turkcan, A., Ceyhan, M. E., & Stuart, K. (2015). Improvement of chemotherapy patient flow
and scheduling in an outpatient oncology clinic. International Journal of Production Research, 53(24),
7177-7190.
Liu, Z., Rexachs, D., Epelde, F., & Luque, E. (2017). A simulation and optimization based method for
calibrating agent-based emergency department models under data scarcity. Computers & Industrial
Engineering, 103, 300-309.
Luo, L., Zhang, Y., Qing, F., Ding, H., Shi, Y., & Guo, H. (2018). A discrete event simulation approach
for reserving capacity for emergency patients in the radiology department. BMC health services
research, 18(1), 1-11.
Martoni, A. A. (2018). Air pollution and Cancer. In Clinical Handbook of Air Pollution-Related
Diseases (pp. 445-457). Springer, Cham.
Metzner, N. (2019). A comparison of agent-based and discrete event simulation for assessing airport
terminal resilience. Transportation Research Procedia, 43, 209-218.
Monks, T., Currie, C. S., Onggo, B. S., Robinson, S., Kunc, M., & Taylor, S. J. (2019). Strengthening the
reporting of empirical simulation studies: Introducing the STRESS guidelines. Journal of Simulation,
13(1), 55-67.
Montesano, R., & Hall, J. (2001). Environmental causes of human cancers. European journal of cancer, 37,
67-87.
Mustafee, N., Katsaliaki, K., & Taylor, S. J. (2010). Profiling literature in healthcare
simulation. Simulation, 86(8-9), 543-558.
Olave-Rojas, D., & Nickel, S. (2021). Modeling a pre-hospital emergency medical service using hybrid
simulation and a machine learning approach. Simulation Modelling Practice and Theory, 102302.
Ordu, M., Demir, E., Tofallis, C., & Gunal, M. M. (2020). A novel healthcare resource allocation decision
support tool: A forecasting-simulation-optimization approach. Journal of the operational research society,
1-16.
Rashwan, W., Abo-Hamad, W., & Arisha, A. (2015). A system dynamics view of the acute bed blockage
problem in the Irish healthcare system. European Journal of Operational Research, 247(1), 276-293.
Robinson, S. (1997, December). Simulation model verification and validation: increasing the users'
confidence. In Proceedings of the 29th conference on Winter simulation (pp. 53-59).
39
Roza, M., Voogd, J., & Sebalj, D. (2013). The Generic Methodology for Verification and Validation to
support acceptance of models, simulations and data. The Journal of Defense Modeling and Simulation,
10(4), 347-365.
Saeedian, M., Sepehri, M. M., Jalalimanesh, A., & Shadpour, P. (2019). Operating room orchestration by
using agent-based simulation. Perioperative Care and Operating Room Management, 15, 100074.
Salleh, S., Thokala, P., Brennan, A., Hughes, R., & Booth, A. (2017). Simulation modelling in healthcare:
an umbrella review of systematic literature reviews. PharmacoEconomics, 35(9), 937-949.
Sargent, R. G. (2013). Verification and validation of simulation models. Journal of simulation, 7(1), 12-
24.
Sepúlveda, J. A., Thompson, W. J., Baesler, F. F., Alvarez, M. I., & Cahoon, L. E. (1999, December). The
use of simulation for process improvement in a cancer treatment center. In WSC'99. 1999 Winter Simulation
Conference Proceedings.'Simulation-A Bridge to the Future'(Cat. No. 99CH37038) (Vol. 2, pp. 1541-
1548). IEEE.
Siebers, P. O., Macal, C. M., Garnett, J., Buxton, D., & Pidd, M. (2010). Discrete-event simulation is dead,
long live agent-based simulation!. Journal of Simulation, 4(3), 204-210.
Siegel, R. L., Miller, K. D., Fuchs, H. E., & Jemal, A. (2021). Cancer Statistics, 2021. CA: a Cancer Journal
for Clinicians, 71(1), 7-33.
Sulis, E., Terna, P., Di Leva, A., Boella, G., & Boccuzzi, A. (2020). Agent-oriented decision support system
for business processes management with genetic algorithm optimization: an application in
healthcare. Journal of Medical Systems, 44(9), 1-7.
Taboada, M., Cabrera, E., Iglesias, M. L., Epelde, F., & Luque, E. (2011). An agent-based decision support
system for hospitals emergency departments. Procedia Computer Science, 4, 1870-1879.
Taboada, M., Cabrera, E., Luque, E., Epelde, F., & Iglesias, M. L. (2012, August). A decision support
system for hospital emergency departments designed using agent-based modeling and simulation. In 2012
IEEE 13th International Conference on Information Reuse & Integration (IRI) (pp. 364-370). IEEE.
Troen, B. R. (2003). The biology of aging. The Mount Sinai journal of medicine, New York, 70(1), 3-22.
Vahdat, V., Namin, A., Azghandi, R., & Griffin, J. (2019). Improving patient timeliness of care through
efficient outpatient clinic layout design using data-driven simulation and optimisation. Health
Systems, 8(3), 162-183.

40
Vasto, S., Carruba, G., Lio, D., Colonna-Romano, G., Di Bona, D., Candore, G., & Caruso, C. (2009).
Inflammation, ageing and cancer. Mechanisms of ageing and development, 130(1-2), 40-45.
Wilensky, U. (1999). Netlogo, 1999.
Woodall, J. C., Gosselin, T., Boswell, A., Murr, M., & Denton, B. T. (2013). Improving patient access to
chemotherapy treatment at Duke Cancer Institute. Interfaces, 43(5), 449-461.
Yang, W., Williams, J. H., Hogan, P. F., Bruinooge, S. S., Rodriguez, G. I., Kosty, M. P., ... & Goldstein,
M. (2014). Projected supply of and demand for oncologists and radiation oncologists through 2025: an
aging, better-insured population will result in shortage. Journal of oncology practice, 10(1), 39-45.
Yousefi, M., & Ferreira, R. P. M. (2017). An agent-based simulation combined with group decision-making
technique for improving the performance of an emergency department. Brazilian journal of medical and
biological research, 50(5).
Yu, C., Semeraro, Q., & Matta, A. (2018). A genetic algorithm for the hybrid flow shop scheduling with
unrelated machines and machine eligibility. Computers & Operations Research, 100, 211-229.


![UvA-DARE (Digital Academic Repository) Turbulent drag · PDF file... with the drag reducing agent, ... Most Widely Used Drag Reducing Polymer agents [15]. Xanthan gum Polyethylene](https://img.pdfslide.us/doc/110x75/5aa65ede7f8b9a185d8e899d/uva-dare-digital-academic-repository-turbulent-drag-with-the-drag-reducing.jpg)
![Importance of the Reducing Agent in Direct Reductive Heck ... · Importance of the Reducing Agent in Direct Reductive Heck Reactions Saeed Raoufmoghaddam,[a] Subramaniyan Mannathan,[b]](https://img.pdfslide.us/doc/110x75/601377dfcbe43d4a117e8bac/importance-of-the-reducing-agent-in-direct-reductive-heck-importance-of-the.jpg)


![MPC8548E Configurable Development System … Configurable Development System Reference Manual, ... [4:0] ... MPC8548E Configurable Development System Reference Manual,](https://img.pdfslide.us/doc/110x75/5af028337f8b9ac62b8e4c0e/mpc8548e-configurable-development-system-configurable-development-system-reference.jpg)