Embed Size (px)
Citation preview
Available on website http://www.wrc.org.zaISSN 0378-4738 (Print) = Water SA Vol. 36 No. 4 July 2010ISSN 1816-7950 (On-line) = Water SA Vol. 36 No. 4 July 2010
461
* To whom all correspondence should be addressed. +234 (80) 35779520; fax: +234 (31) 227790; e-mail: [email protected] 13 July 2009; accepted in revised form 31 May 2010.
A conceptual model for the development and management of the Cape Flats aquifer, South Africa
Segun Adelana1*, Yongxin Xu2 and Petr Vrbka3
1 Geology and Mineral Sciences Department, University of Ilorin, PMB 1515, Ilorin, Nigeria2 Earth Sciences Department, University of the Western Cape, Bellville, South Africa
3 Dieburger Str. 108, D-64846 Groß-Zimmern, Germany
Abstract
This paper provides an integrated approach to the analysis of the geological, hydrological and hydrogeological characteris-tics of the Cape Flats: a coastal plain sand formed within the mountains of the Cape Town metropolitan area. The study is mainly based on evaluation of available data, on surface water and groundwater, rainfall and selected springs, to describe the Cape Flats aquifer. Qualitative analysis has shown that both surface water and groundwater of the investigated area are of good quality; whereas sources of contamination indicated are restricted to certain parts of the area. Interpretation of hydrogeological data and aquifer parameters revealed that the Cape Flats aquifer has good storage characteristics to support its development for water supply, although the generally unconfined conditions render it highly susceptible to pollution from the surface. From the analysis of long-term climate data in Cape Town, it is evident that fluctuation exists in the pattern of rainfall; this rainfall pattern has implications for recharge and water management issues in the city. Therefore, a conceptual hydrogeological model was developed to elucidate groundwater flow and recharge mechanisms in the Cape Flats.
Keywords: water resource management, Cape Town, water quality, surface-water/groundwater relations, conceptualisation
330 30' 330 30'
340 00' 340 00'
180 30'
Philippi
Strandfontein
Eersteriver
Muizenberg
Bellville
Cape Town
Noordhoek
Kraaifontein
Atlantis
Bloubergstrand
Cape PointCape Hangklip
Railway
Sand-covered area
StrandMacassarFaure
Figure 1Location of the
Cape Flats area in the Western Cape,
South Africa
Introduction
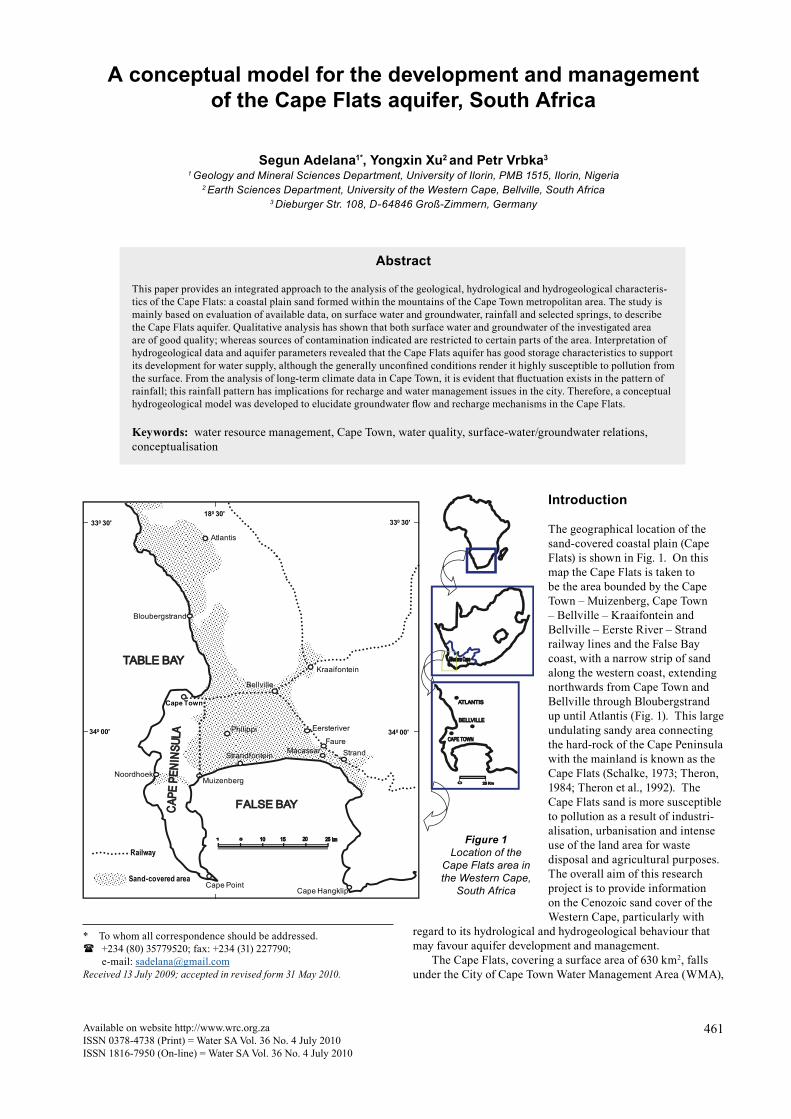
The geographical location of the sand-covered coastal plain (Cape Flats) is shown in Fig. 1. On this map the Cape Flats is taken to be the area bounded by the Cape Town – Muizenberg, Cape Town – Bellville – Kraaifontein and Bellville – Eerste River – Strand railway lines and the False Bay coast, with a narrow strip of sand along the western coast, extending northwards from Cape Town and Bellville through Bloubergstrand up until Atlantis (Fig. 1). This large undulating sandy area connecting the hard-rock of the Cape Peninsula with the mainland is known as the Cape Flats (Schalke, 1973; Theron, 1984; Theron et al., 1992). The Cape Flats sand is more susceptible to pollution as a result of industri-alisation, urbanisation and intense use of the land area for waste disposal and agricultural purposes. The overall aim of this research project is to provide information on the Cenozoic sand cover of the Western Cape, particularly with
regard to its hydrological and hydrogeological behaviour that may favour aquifer development and management.
The Cape Flats, covering a surface area of 630 km2, falls under the City of Cape Town Water Management Area (WMA),
Available on website http://www.wrc.org.zaISSN 0378-4738 (Print) = Water SA Vol. 36 No. 4 July 2010
ISSN 1816-7950 (On-line) = Water SA Vol. 36 No. 4 July 2010
462
an extensive area of approximately 2 159 km2. Presently, most of the area underlain by the Cape Flats aquifer is built up, which has given the area both an urban and industrial face-lift. Cape Town’s central business district is on the western edge of the Cape Flats with part of the city and its suburbs entirely underlain by Cenozoic sands. Detailed physiographic descrip-tion of the present study area and the demographic growth of the city have been presented in Adelana and Xu, 2008.
Information on boreholes and well points in the Western Cape is found in the National Groundwater Database. The location, altitude, depth and source of each well are recorded in detail in the database, where stratigraphic and piezometric data, as well as the measured physical and chemical data on groundwater are archived. Some of these have been collated and utilised in this study. The geological and hydrogeologi-cal features of the study area have been inferred from the data analysis of these boreholes, with few additional wells sam-pled during the course of this study. All acquired knowledge and information are to be utilised to propose management guidelines to prevent further degradation of this groundwater resource, which at the moment is under-utilised.
Geomorphology and geology of the Cape Flats
The Cape Flats area is essentially lowland. Generally, the WMA has a varied terrain, ranging from low-lying sandy plains (with an average elevation of 30 m a.m.s.l.) to rocky mountains (the Cape Peninsula mountain chain) with a series of peaks, rising to up to 1 038 m on Table Mountain and dropping sharply to the sea in many parts of the peninsula. Topographical features are varied and include narrow flats, kloofs and gorges, cliffs, rocky shores, wave-cut platforms, small bays, and sandy and gravel beaches (Theron, 1992). On the Cape Flats sand dunes are frequent with a prevalent south-easterly orientation; the highest dunes are approximately 65 m a.m.s.l.
The oldest rocks in the Western Cape are meta-sediments of the pre-Cambrian Malmesbury Group (Ne), which occupy the coastal plain between Saldanha and False Bay, in the west, and the first mountain ranges in the east. Several erosional windows to this group are exposed in mainly fault-controlled
valleys further to the east and south, of which the Breede River valley is the most conspicuous (Meyer, 2001). The Malmesbury Group consists of low-grade metamorphic rocks such as phyllitic shale, quartz and schist, siltstone, sandstone and greywacke.
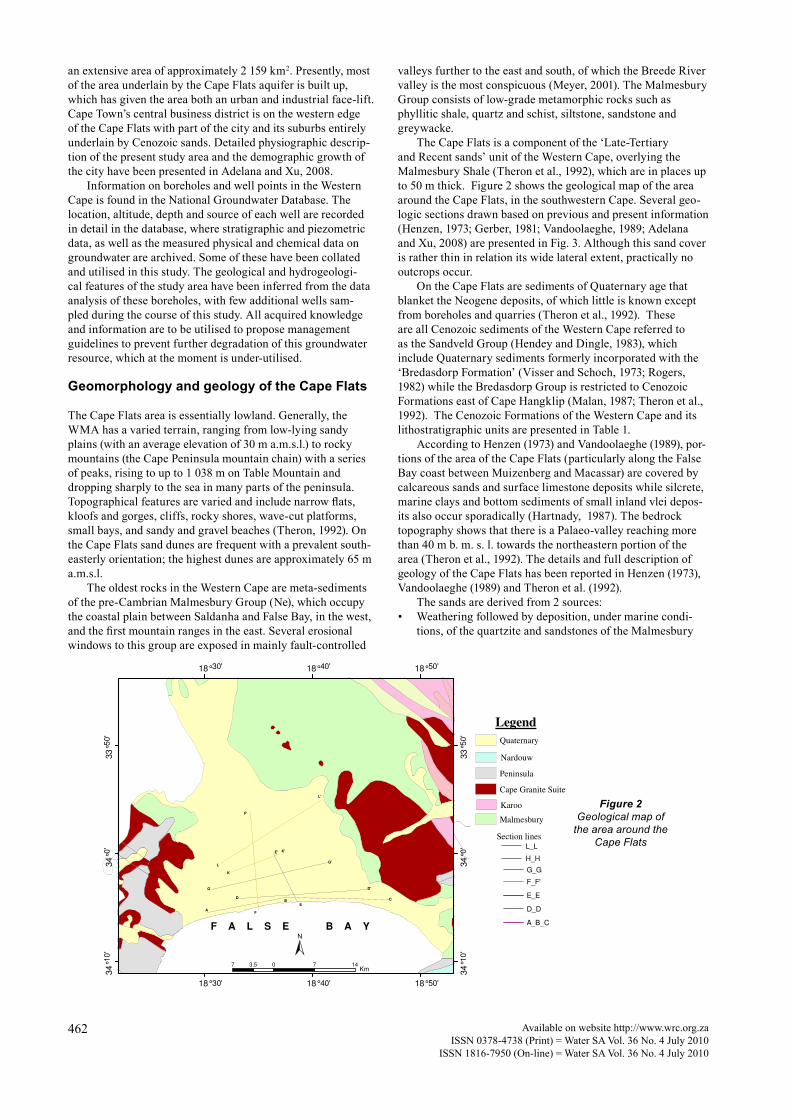
The Cape Flats is a component of the ‘Late-Tertiary and Recent sands’ unit of the Western Cape, overlying the Malmesbury Shale (Theron et al., 1992), which are in places up to 50 m thick. Figure 2 shows the geological map of the area around the Cape Flats, in the southwestern Cape. Several geo-logic sections drawn based on previous and present information (Henzen, 1973; Gerber, 1981; Vandoolaeghe, 1989; Adelana and Xu, 2008) are presented in Fig. 3. Although this sand cover is rather thin in relation its wide lateral extent, practically no outcrops occur.
On the Cape Flats are sediments of Quaternary age that blanket the Neogene deposits, of which little is known except from boreholes and quarries (Theron et al., 1992). These are all Cenozoic sediments of the Western Cape referred to as the Sandveld Group (Hendey and Dingle, 1983), which include Quaternary sediments formerly incorporated with the ‘Bredasdorp Formation’ (Visser and Schoch, 1973; Rogers, 1982) while the Bredasdorp Group is restricted to Cenozoic Formations east of Cape Hangklip (Malan, 1987; Theron et al., 1992). The Cenozoic Formations of the Western Cape and its lithostratigraphic units are presented in Table 1.
According to Henzen (1973) and Vandoolaeghe (1989), por-tions of the area of the Cape Flats (particularly along the False Bay coast between Muizenberg and Macassar) are covered by calcareous sands and surface limestone deposits while silcrete, marine clays and bottom sediments of small inland vlei depos-its also occur sporadically (Hartnady, 1987). The bedrock topography shows that there is a Palaeo-valley reaching more than 40 m b. m. s. l. towards the northeastern portion of the area (Theron et al., 1992). The details and full description of geology of the Cape Flats has been reported in Henzen (1973), Vandoolaeghe (1989) and Theron et al. (1992).
The sands are derived from 2 sources:• Weathering followed by deposition, under marine condi-
tions, of the quartzite and sandstones of the Malmesbury
Fig2:
A
B C
F'
F
G
G'
D'
D
E
E'
L
L'
K
K'
18°30'
18°30'
18°40'
18°40'
18°50'
18°50'
34
°10
'
34
°10
'
34
°0'
34
°0'
33
°50'
33
°50'
F A L S E B A Y
7 0 7 143.5
Km
Legend
Quaternary
Nardouw
Peninsula
Cape Granite Suite
Malmesbury
Karoo
Section lines
G_G
F_F'
E_E
D_D
A_B_C
L_L
H_H
Figure 2Geological map of
the area around the Cape Flats
Available on website http://www.wrc.org.zaISSN 0378-4738 (Print) = Water SA Vol. 36 No. 4 July 2010ISSN 1816-7950 (On-line) = Water SA Vol. 36 No. 4 July 2010
463
Formation and Table Mountain Group (TMG)• The beaches in the areas, from where aeolian sand was
deposited as dunes on the top of the marine sands.
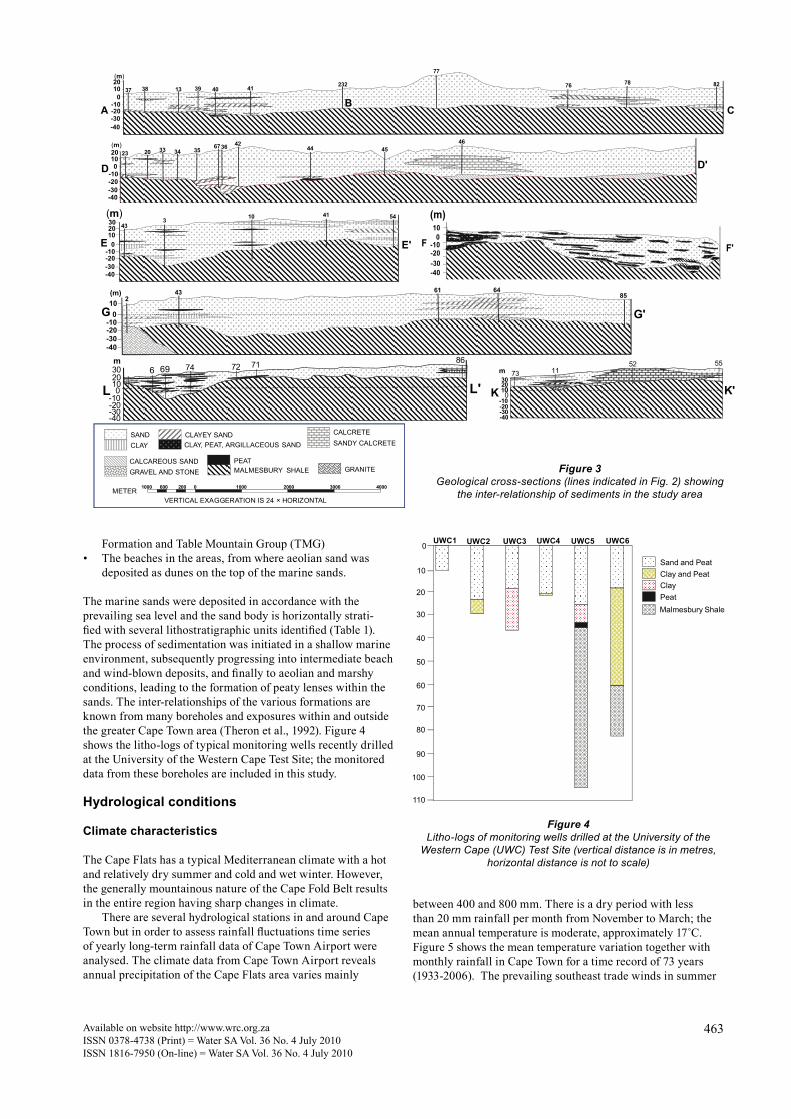
The marine sands were deposited in accordance with the prevailing sea level and the sand body is horizontally strati-fied with several lithostratigraphic units identified (Table 1). The process of sedimentation was initiated in a shallow marine environment, subsequently progressing into intermediate beach and wind-blown deposits, and finally to aeolian and marshy conditions, leading to the formation of peaty lenses within the sands. The inter-relationships of the various formations are known from many boreholes and exposures within and outside the greater Cape Town area (Theron et al., 1992). Figure 4 shows the litho-logs of typical monitoring wells recently drilled at the University of the Western Cape Test Site; the monitored data from these boreholes are included in this study.
Hydrological conditions
Climate characteristics
The Cape Flats has a typical Mediterranean climate with a hot and relatively dry summer and cold and wet winter. However, the generally mountainous nature of the Cape Fold Belt results in the entire region having sharp changes in climate.
There are several hydrological stations in and around Cape Town but in order to assess rainfall fluctuations time series of yearly long-term rainfall data of Cape Town Airport were analysed. The climate data from Cape Town Airport reveals annual precipitation of the Cape Flats area varies mainly
4
77
37 38 13 39 40 41 232
B
76 78 82
A
20100
-10-20-30-40
C
(m)
20
D'20 44
100
-10-20-30-40
23 33 34 35 6736 42
D
4546(m)
E'E
433 10 41 54(m)
20100
-10-20-30-40
30(m)100
-10-20-30-40
F F'
243 61 64
85
G G'
(m)100
-10-20-30-40
-40
6 69 74 72 71 86m
-30-20-10
0102030
L'L73 11
52 55m
-40-30-20-10
0102030
K K'
VERTICAL EXAGGERATION IS 24 × HORIZONTAL
1000 600 200 0 1000 2000 3000 4000METER
SANDCLAY
CLAYEY SAND CALCRETESANDY CALCRETECLAY, PEAT, ARGILLACEOUS SAND
CALCAREOUS SANDGRAVEL AND STONE GRANITEMALMESBURY SHALE
PEAT
Figure 3Geological cross-sections (lines indicated in Fig. 2) showing
the inter-relationship of sediments in the study area
Sand and PeatClay and PeatClayPeatMalmesbury Shale
0
10
20
30
40
50
60
70
80
90
100
110
UWC1 UWC2 UWC3 UWC4 UWC5 UWC6
Figure 4Litho-logs of monitoring wells drilled at the University of the
Western Cape (UWC) Test Site (vertical distance is in metres, horizontal distance is not to scale)
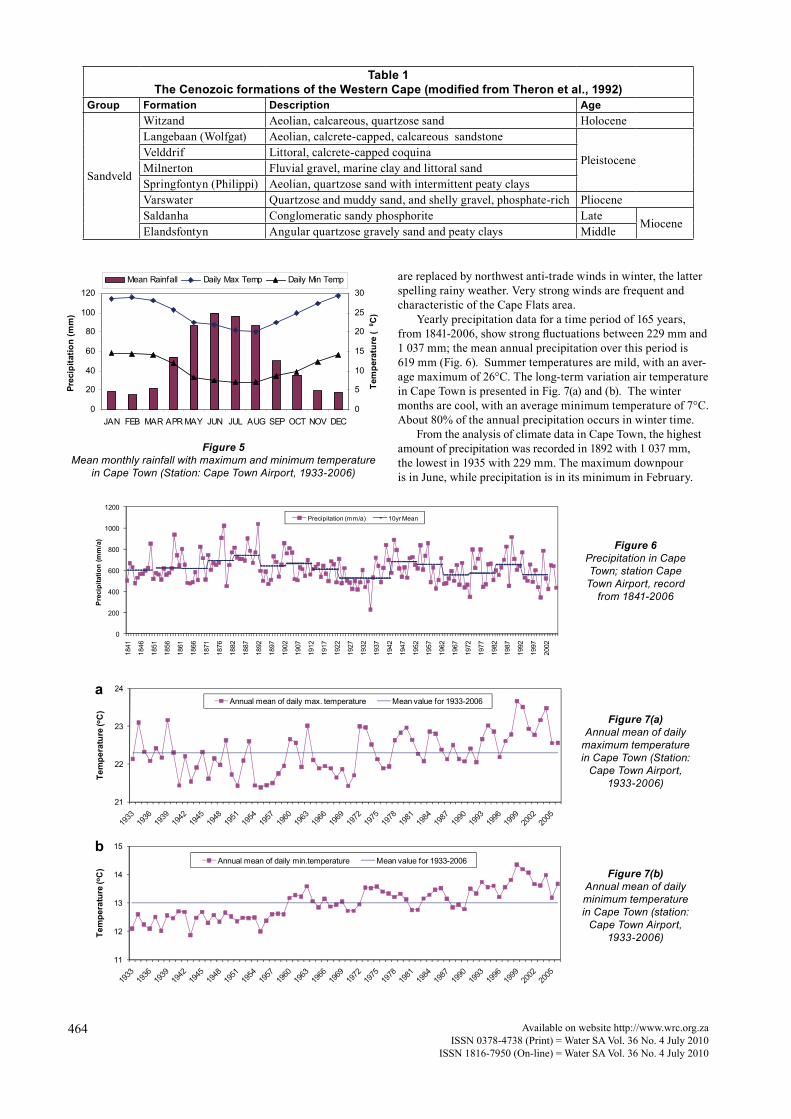
between 400 and 800 mm. There is a dry period with less than 20 mm rainfall per month from November to March; the mean annual temperature is moderate, approximately 17˚C. Figure 5 shows the mean temperature variation together with monthly rainfall in Cape Town for a time record of 73 years (1933-2006). The prevailing southeast trade winds in summer
Available on website http://www.wrc.org.zaISSN 0378-4738 (Print) = Water SA Vol. 36 No. 4 July 2010
ISSN 1816-7950 (On-line) = Water SA Vol. 36 No. 4 July 2010
464
are replaced by northwest anti-trade winds in winter, the latter spelling rainy weather. Very strong winds are frequent and characteristic of the Cape Flats area.
Yearly precipitation data for a time period of 165 years, from 1841-2006, show strong fluctuations between 229 mm and 1 037 mm; the mean annual precipitation over this period is 619 mm (Fig. 6). Summer temperatures are mild, with an aver-age maximum of 26°C. The long-term variation air temperature in Cape Town is presented in Fig. 7(a) and (b). The winter months are cool, with an average minimum temperature of 7°C. About 80% of the annual precipitation occurs in winter time.
From the analysis of climate data in Cape Town, the highest amount of precipitation was recorded in 1892 with 1 037 mm, the lowest in 1935 with 229 mm. The maximum downpour is in June, while precipitation is in its minimum in February.
Table 1The Cenozoic formations of the Western Cape (modified from Theron et al., 1992)
Group Formation Description Age
Sandveld
Witzand Aeolian, calcareous, quartzose sand HoloceneLangebaan (Wolfgat) Aeolian, calcrete-capped, calcareous sandstone
PleistoceneVelddrif Littoral, calcrete-capped coquinaMilnerton Fluvial gravel, marine clay and littoral sandSpringfontyn (Philippi) Aeolian, quartzose sand with intermittent peaty claysVarswater Quartzose and muddy sand, and shelly gravel, phosphate-rich PlioceneSaldanha Conglomeratic sandy phosphorite Late
MioceneElandsfontyn Angular quartzose gravely sand and peaty clays Middle
0
20
40
60
80
100
120
JAN FEB MAR APR MAY JUN JUL AUG SEP OCT NOV DEC
Prec
ipita
tion
(mm
)
0
5
10
15
20
25
30
Tem
pera
ture
(0 C
)
Mean Rainfall Daily Max Temp Daily Min Temp
Figure 5Mean monthly rainfall with maximum and minimum temperature
in Cape Town (Station: Cape Town Airport, 1933-2006)
0
200
400
600
800
1000
1200
1841
1846
1851
1856
1861
1866
1871
1876
1882
1887
1892
1897
1902
1907
1912
1917
1922
1927
1932
1937
1942
1947
1952
1957
1962
1967
1972
1977
1982
1987
1992
1997
2002
Pre
cipi
tatio
n (m
m/a
)
Precipitation (mm/a) 10yr Mean
21
22
23
24
Tem
pera
ture
(o C)
Annual mean of daily max. temperature Mean value for 1933-2006
11
12
13
14
15
Tem
pera
ture
(o C)
Annual mean of daily min.temperature Mean value for 1933-2006
a
b
Figure 6Precipitation in Cape Town; station Cape
Town Airport, record from 1841-2006
Figure 7(a)Annual mean of daily
maximum temperature in Cape Town (Station:
Cape Town Airport, 1933-2006)
Figure 7(b)Annual mean of daily minimum temperature in Cape Town (station:
Cape Town Airport, 1933-2006)
Available on website http://www.wrc.org.zaISSN 0378-4738 (Print) = Water SA Vol. 36 No. 4 July 2010ISSN 1816-7950 (On-line) = Water SA Vol. 36 No. 4 July 2010
465
Moreover, positive and negative trends become evident when the entire time series is examined in segments of 50 years. The first 50 years (1841-1891) in the time series show a significant positive trend, whereas a significant negative trend is noted when the 50-year segment is taken at the end of the record (1956-2006). A change of mean was obvious when the aver-age of annual rainfall for the entire record was calculated by decades. The pattern and variability of the precipitation in Cape Town is as follows: the average of annual rainfall was increasing until 1891; from 1892 the trend showed continuous
decrease up until 1941, but there was a ‘climatic jump’ about 1941-1942. Such a ‘climatic jump’ occurred much later in the Sahel of Western Africa, about 1969-1970, as reported by Hubert and Carbonnel (1987). This coincided with the period when the probability of a sudden change in the mean reached a maximum.
The fluctuations in Cape Town rainfall are further illus-trated by the ‘rising’ and ‘dropping’ 10-year means in Fig. 6. The figure shows the 2 decades from 1921-1941 as relatively dry periods; least annual rainfall of 229 mm was recorded in 1935. A similarly low rainfall was observed from 1999-2003, with the exception of the year 2001 (with up to 784 mm). This fluctuation in the rainfall pattern has implications for ground-water recharge and, consequently, water management issues in the area.
Hydrological balance
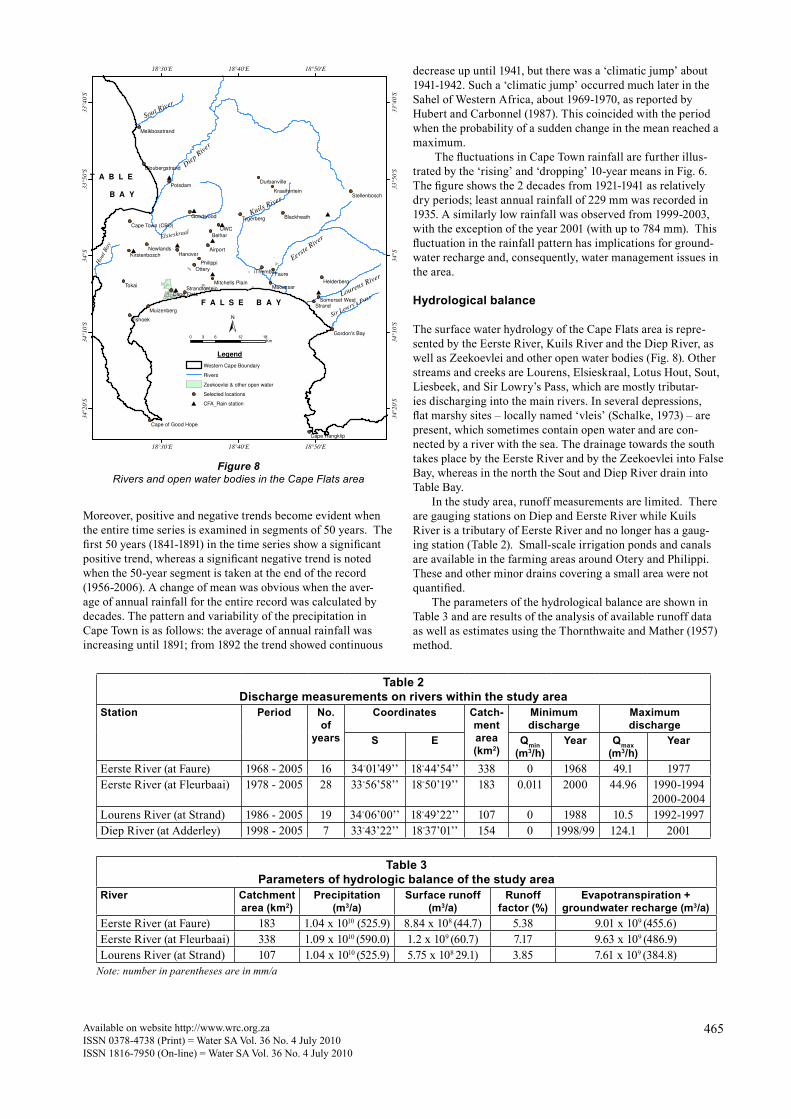
The surface water hydrology of the Cape Flats area is repre-sented by the Eerste River, Kuils River and the Diep River, as well as Zeekoevlei and other open water bodies (Fig. 8). Other streams and creeks are Lourens, Elsieskraal, Lotus Hout, Sout, Liesbeek, and Sir Lowry’s Pass, which are mostly tributar-ies discharging into the main rivers. In several depressions, flat marshy sites – locally named ‘vleis’ (Schalke, 1973) – are present, which sometimes contain open water and are con-nected by a river with the sea. The drainage towards the south takes place by the Eerste River and by the Zeekoevlei into False Bay, whereas in the north the Sout and Diep River drain into Table Bay.
In the study area, runoff measurements are limited. There are gauging stations on Diep and Eerste River while Kuils River is a tributary of Eerste River and no longer has a gaug-ing station (Table 2). Small-scale irrigation ponds and canals are available in the farming areas around Otery and Philippi. These and other minor drains covering a small area were not quantified.
The parameters of the hydrological balance are shown in Table 3 and are results of the analysis of available runoff data as well as estimates using the Thornthwaite and Mather (1957) method.
Fig 8
UWC
Tokai
Faure
Strand
Ottery
Belhar
Hanover
Vishoek
Potsdam
iThemba
Airport
Goodwood
Newlands
Philippi
Macassar
Tygerberg Blackheath
Cape Flats
Muizenberg
Helderberg
Durbanville
Kirstenbosch
StellenboschKraaifontein
Gordon's Bay
Cape Hangklip
Strandfontein
Somerset West
Melkbosstrand
Bloubergstrand
Mitchells Plain
Cape Town (CBD)
Cape of Good Hope
18°50'E
18°50'E
18°40'E
18°40'E
18°30'E
18°30'E
33
°40
'S
33
°40
'S
33°5
0'S
33°5
0'S
34°S
34°S
34°1
0'S
34°1
0'S
34°2
0'S
34°2
0'S
F A L S E B A Y
Legend
Western Cape Boundary
Rivers
Zeekoevlei & other open water
Selected locations
CFA_Rain station
Kuils River
Die
p Riv
er
Sout River
Eerste
River
Lourens River
Hou
t B
ay
Elsieskraal
T A B L E
B A Y
0 6 12 183
Km
Sir Lowry's Pass
Figure 8Rivers and open water bodies in the Cape Flats area
Table 2Discharge measurements on rivers within the study area
Station Period No. of
years
Coordinates Catch-ment area (km2)
Minimum discharge
Maximum discharge
S E Qmin(m3/h)
Year Qmax(m3/h)
Year
Eerste River (at Faure) 1968 - 2005 16 34◦01’49’’ 18◦44’54’’ 338 0 1968 49.1 1977Eerste River (at Fleurbaai) 1978 - 2005 28 33◦56’58’’ 18◦50’19’’ 183 0.011 2000 44.96 1990-1994
2000-2004Lourens River (at Strand) 1986 - 2005 19 34◦06’00’’ 18◦49’22’’ 107 0 1988 10.5 1992-1997Diep River (at Adderley) 1998 - 2005 7 33◦43’22’’ 18◦37’01’’ 154 0 1998/99 124.1 2001
Table 3Parameters of hydrologic balance of the study area
River Catchment area (km2)
Precipitation(m3/a)
Surface runoff (m3/a)
Runoff factor (%)
Evapotranspiration + groundwater recharge (m3/a)
Eerste River (at Faure) 183 1.04 x 10¹⁰ (525.9) 8.84 x 10⁸ (44.7) 5.38 9.01 x 10⁹ (455.6)Eerste River (at Fleurbaai) 338 1.09 x 10¹⁰ (590.0) 1.2 x 10⁹ (60.7) 7.17 9.63 x 10⁹ (486.9)Lourens River (at Strand) 107 1.04 x 10¹⁰ (525.9) 5.75 x 10⁸ 29.1) 3.85 7.61 x 10⁹ (384.8)
Note: number in parentheses are in mm/a
Available on website http://www.wrc.org.zaISSN 0378-4738 (Print) = Water SA Vol. 36 No. 4 July 2010
ISSN 1816-7950 (On-line) = Water SA Vol. 36 No. 4 July 2010
466
According to Gerber (1981), the maximum flow rate of the Lotus River at its entry point into Zeekoevlei – using manual measurements (winter of 1980) – was 11 000 m3/h in response to a rainfall intensity of 50 mm/d at the height of the rainy season. The corresponding figure for the upper stretches of the Elsieskraal River, at its crossing with Hein road, was estimated at 2 000 m3/h (Gerber, 1981). The ‘baseflow’ component of the Great Lotus River was in the range of 400 to 1 000 m3/h.
The parameters of water balance for the year 2002-2003, such as precipitation, surface runoff, estimates of actual eva-potranspiration together with recharge, are listed in Table 3 for 3 selected stations, based on the method of Thornwaite and Mather (1957). If the groundwater recharge is low, a large part of the precipitation is lost to evapotranspiration and vice versa. The recharge value is in the proportion of 16 to 47% of precipitation.
In field observations, irrigation may be significant to water balance as the farmers in the area irrigate their crops during the dry summer months, but there are no data to show the extent of water use for irrigation in the study area. Assuming a conservative value of 1 000 mm mean annual rainfall over the study region of 630 km2, the total volume of rainfall is 6.30×10⁸ m3/a. There are 211 irrigation permits within the study area (as at 2006). Assuming a conservative, 60-day long irrigation season, the total amount of returned irrigation water is 1.03×10⁵ m3/a or 0.0163% of the rainfall. If the irrigation season was 365 days long, irrigation water would only amount to 0.1% of the rainfall over the study area.
Hydrogeological conditions
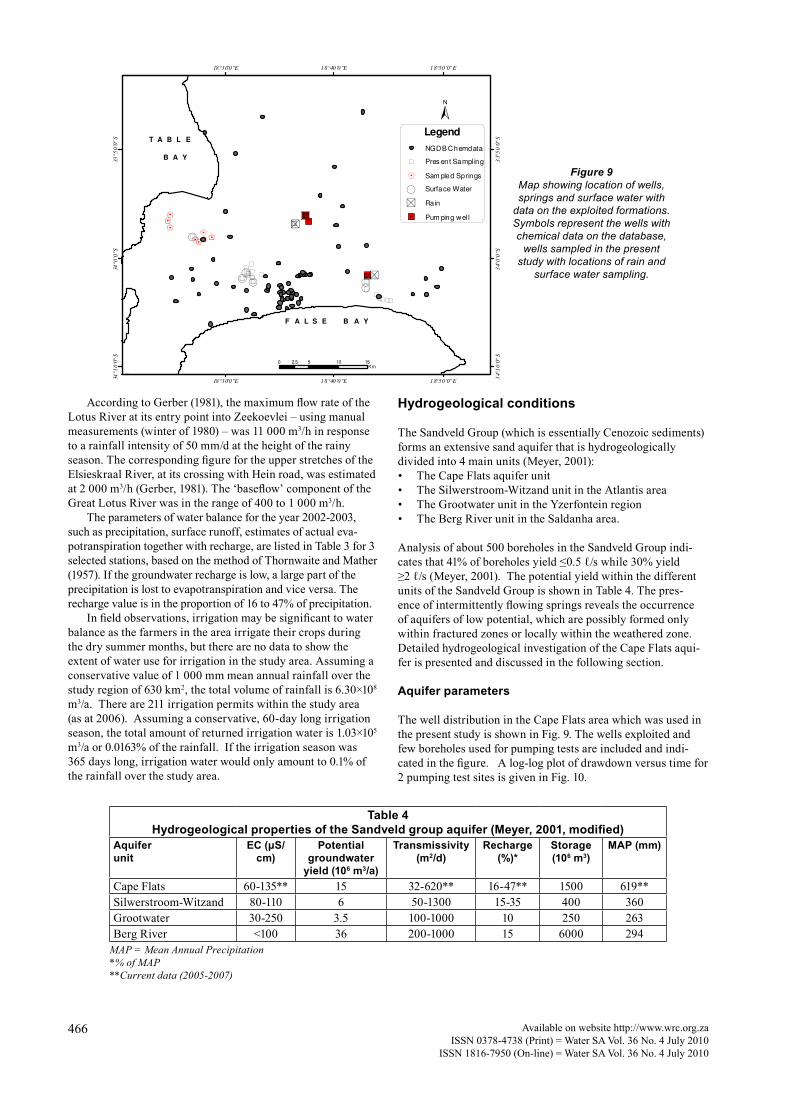
The Sandveld Group (which is essentially Cenozoic sediments) forms an extensive sand aquifer that is hydrogeologically divided into 4 main units (Meyer, 2001): • The Cape Flats aquifer unit • The Silwerstroom-Witzand unit in the Atlantis area• The Grootwater unit in the Yzerfontein region• The Berg River unit in the Saldanha area.
Analysis of about 500 boreholes in the Sandveld Group indi-cates that 41% of boreholes yield ≤0.5 ℓ/s while 30% yield ≥2 ℓ/s (Meyer, 2001). The potential yield within the different units of the Sandveld Group is shown in Table 4. The pres-ence of intermittently flowing springs reveals the occurrence of aquifers of low potential, which are possibly formed only within fractured zones or locally within the weathered zone. Detailed hydrogeological investigation of the Cape Flats aqui-fer is presented and discussed in the following section.
Aquifer parameters
The well distribution in the Cape Flats area which was used in the present study is shown in Fig. 9. The wells exploited and few boreholes used for pumping tests are included and indi-cated in the figure. A log-log plot of drawdown versus time for 2 pumping test sites is given in Fig. 10.
Fig 9
18°30'0"E
18°30'0"E
18°40'0"E
18°40'0"E
18°50'0" E
18°50'0" E
34°1
0'0
"S
34°
10
'0"
S
34°0
'0"S
34°
0'0
"S
33°5
0'0
"S
33°
50
'0"
S
F A L S E B A Y
T A B L E
B A Y
0 5 10 152.5Km
Legend
NGDB Chemdata
Pres ent Sampl ing
Sam pled Springs
Surface Water
Rain
Pum ping wel l
Figure 9Map showing location of wells, springs and surface water with
data on the exploited formations. Symbols represent the wells with chemical data on the database,
wells sampled in the present study with locations of rain and
surface water sampling.
Table 4Hydrogeological properties of the Sandveld group aquifer (Meyer, 2001, modified)
Aquifer unit
EC (µS/cm)
Potential groundwater
yield (106 m3/a)
Transmissivity (m2/d)
Recharge (%)*
Storage (106 m3)
MAP (mm)
Cape Flats 60-135** 15 32-620** 16-47** 1500 619**Silwerstroom-Witzand 80-110 6 50-1300 15-35 400 360Grootwater 30-250 3.5 100-1000 10 250 263Berg River <100 36 200-1000 15 6000 294
MAP = Mean Annual Precipitation*% of MAP**Current data (2005-2007)
Available on website http://www.wrc.org.zaISSN 0378-4738 (Print) = Water SA Vol. 36 No. 4 July 2010ISSN 1816-7950 (On-line) = Water SA Vol. 36 No. 4 July 2010
467
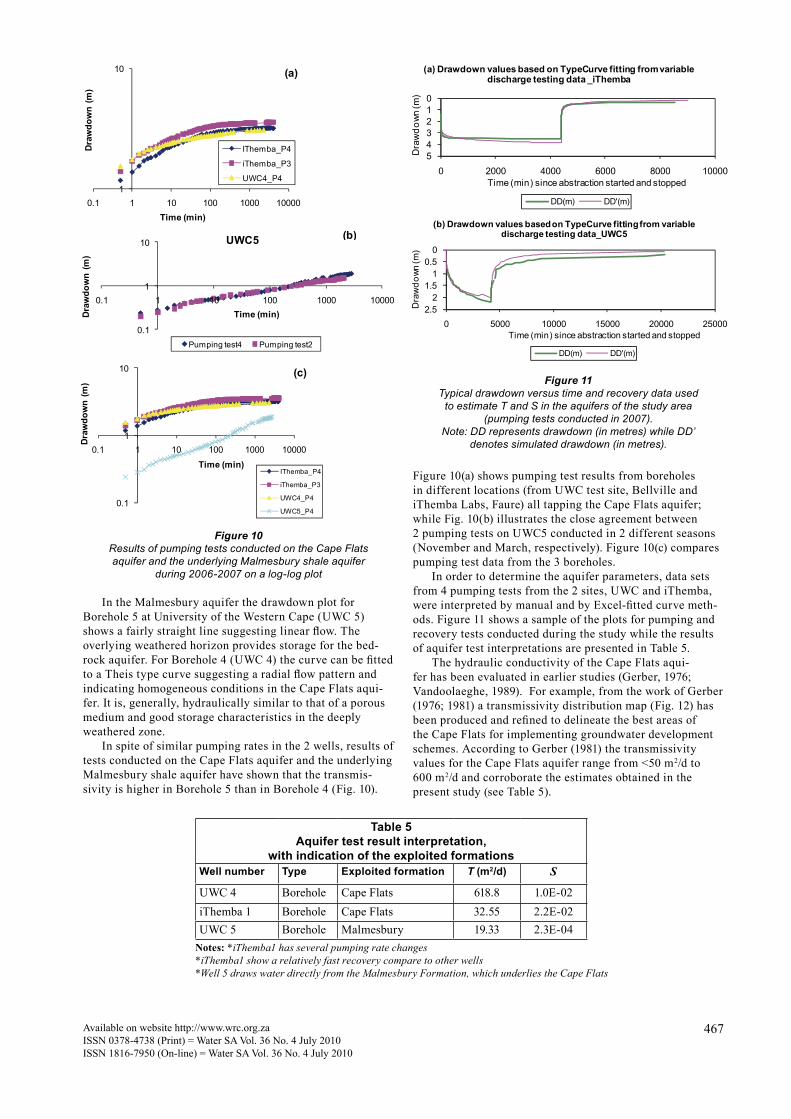
In the Malmesbury aquifer the drawdown plot for Borehole 5 at University of the Western Cape (UWC 5) shows a fairly straight line suggesting linear flow. The overlying weathered horizon provides storage for the bed-rock aquifer. For Borehole 4 (UWC 4) the curve can be fitted to a Theis type curve suggesting a radial flow pattern and indicating homogeneous conditions in the Cape Flats aqui-fer. It is, generally, hydraulically similar to that of a porous medium and good storage characteristics in the deeply weathered zone.
In spite of similar pumping rates in the 2 wells, results of tests conducted on the Cape Flats aquifer and the underlying Malmesbury shale aquifer have shown that the transmis-sivity is higher in Borehole 5 than in Borehole 4 (Fig. 10).
Figure 10(a) shows pumping test results from boreholes in different locations (from UWC test site, Bellville and iThemba Labs, Faure) all tapping the Cape Flats aquifer; while Fig. 10(b) illustrates the close agreement between 2 pumping tests on UWC5 conducted in 2 different seasons (November and March, respectively). Figure 10(c) compares pumping test data from the 3 boreholes.
In order to determine the aquifer parameters, data sets from 4 pumping tests from the 2 sites, UWC and iThemba, were interpreted by manual and by Excel-fitted curve meth-ods. Figure 11 shows a sample of the plots for pumping and recovery tests conducted during the study while the results of aquifer test interpretations are presented in Table 5.
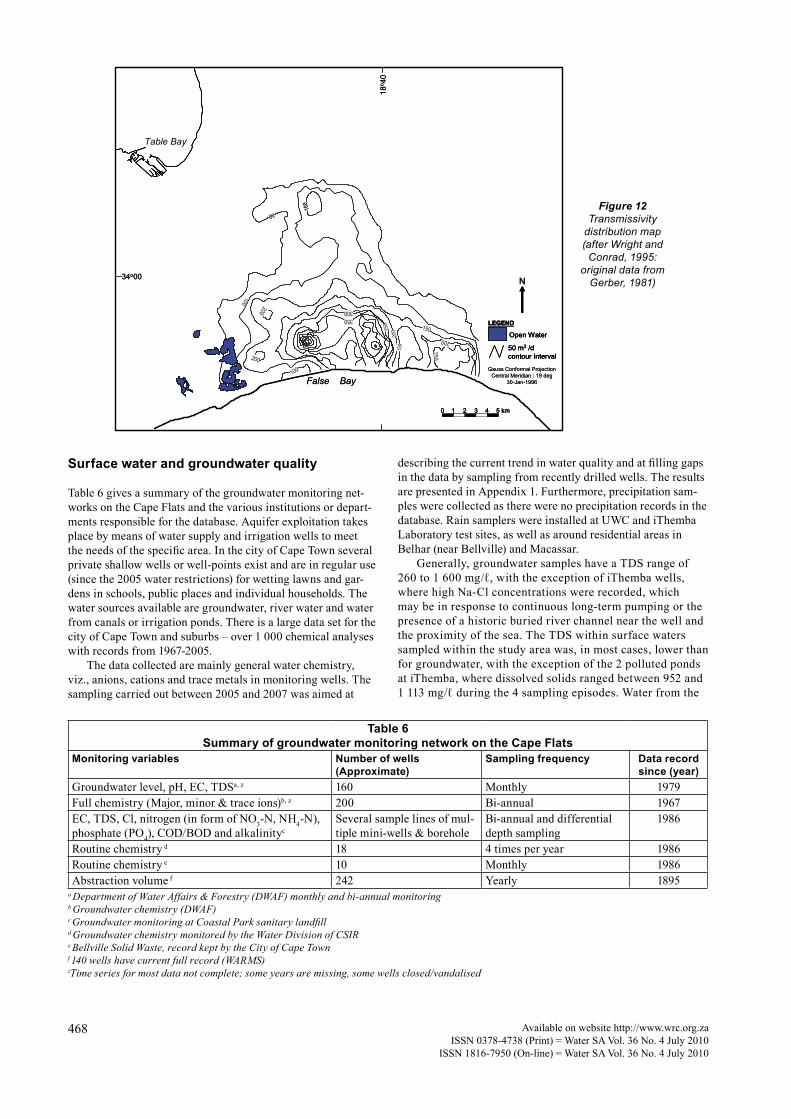
The hydraulic conductivity of the Cape Flats aqui-fer has been evaluated in earlier studies (Gerber, 1976; Vandoolaeghe, 1989). For example, from the work of Gerber (1976; 1981) a transmissivity distribution map (Fig. 12) has been produced and refined to delineate the best areas of the Cape Flats for implementing groundwater development schemes. According to Gerber (1981) the transmissivity values for the Cape Flats aquifer range from <50 m2/d to 600 m2/d and corroborate the estimates obtained in the present study (see Table 5).
1
10
0.1 1 10 100 1000 10000
Draw
dow
n (m
)
Time (min)
IThemba_P4
iThemba_P3
UWC4_P4
(a)
0.1
1
10
0.1 1 10 100 1000 10000
Dra
wdo
wn
(m)
Time (min)
UWC5
Pumping test4 Pumping test2
(b)
0.1
1
10
0.1 1 10 100 1000 10000
Draw
dow
n (m
)
Time (min)IThemba_P4
iThemba_P3
UWC4_P4
UWC5_P4
(c)
012345
0 2000 4000 6000 8000 10000
Dra
wdo
wn (m
)
Time (min) since abstraction started and stopped
(a) Drawdown values based on TypeCurve fitting from variable discharge testing data _iThemba
DD(m) DD'(m)
00.5
11.5
22.5
0 5000 10000 15000 20000 25000
Dra
wdo
wn (m
)
Time (min) since abstraction started and stopped
(b) Drawdown values based on TypeCurve fitting from variable discharge testing data_UWC5
DD(m) DD'(m)
Figure 11Typical drawdown versus time and recovery data used
to estimate T and S in the aquifers of the study area (pumping tests conducted in 2007).
Note: DD represents drawdown (in metres) while DD’ denotes simulated drawdown (in metres).
Figure 10Results of pumping tests conducted on the Cape Flats aquifer and the underlying Malmesbury shale aquifer
during 2006-2007 on a log-log plot
Table 5Aquifer test result interpretation,
with indication of the exploited formationsWell number Type Exploited formation T (m2/d) S
UWC 4 Borehole Cape Flats 618.8 1.0E-02iThemba 1 Borehole Cape Flats 32.55 2.2E-02UWC 5 Borehole Malmesbury 19.33 2.3E-04Notes: *iThemba1 has several pumping rate changes*iThemba1 show a relatively fast recovery compare to other wells*Well 5 draws water directly from the Malmesbury Formation, which underlies the Cape Flats
Available on website http://www.wrc.org.zaISSN 0378-4738 (Print) = Water SA Vol. 36 No. 4 July 2010
ISSN 1816-7950 (On-line) = Water SA Vol. 36 No. 4 July 2010
468
Surface water and groundwater quality
Table 6 gives a summary of the groundwater monitoring net-works on the Cape Flats and the various institutions or depart-ments responsible for the database. Aquifer exploitation takes place by means of water supply and irrigation wells to meet the needs of the specific area. In the city of Cape Town several private shallow wells or well-points exist and are in regular use (since the 2005 water restrictions) for wetting lawns and gar-dens in schools, public places and individual households. The water sources available are groundwater, river water and water from canals or irrigation ponds. There is a large data set for the city of Cape Town and suburbs – over 1 000 chemical analyses with records from 1967-2005.
The data collected are mainly general water chemistry, viz., anions, cations and trace metals in monitoring wells. The sampling carried out between 2005 and 2007 was aimed at
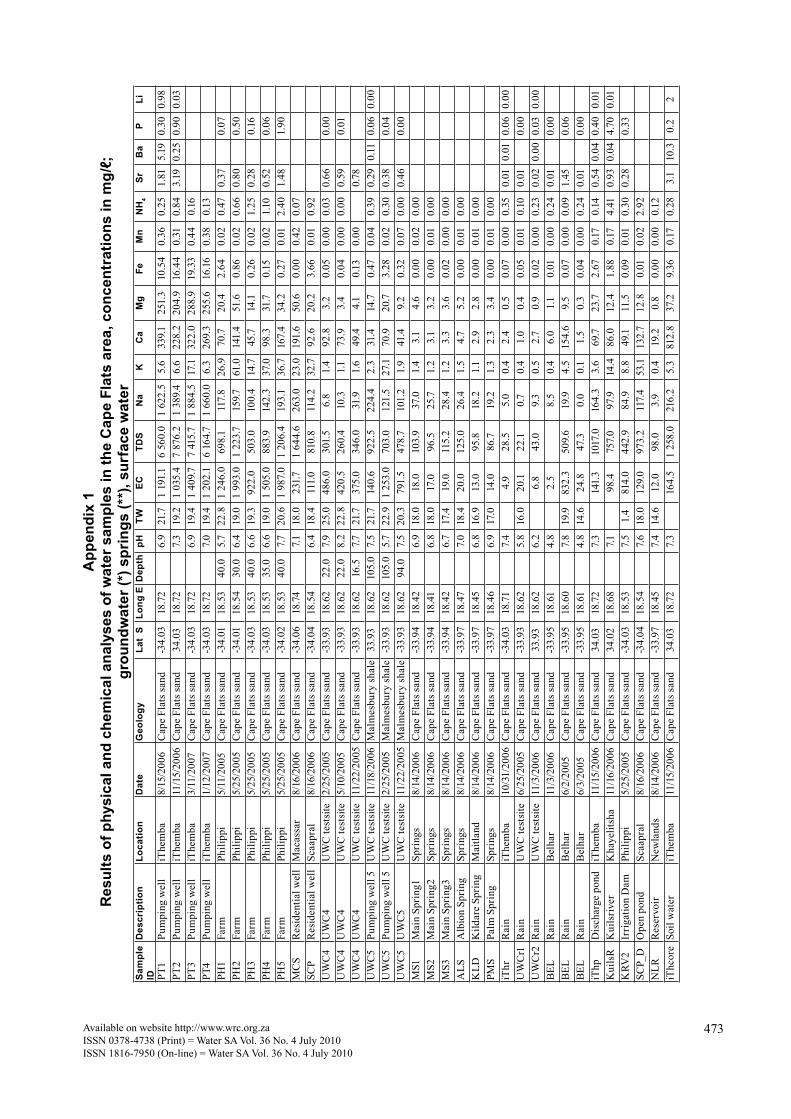
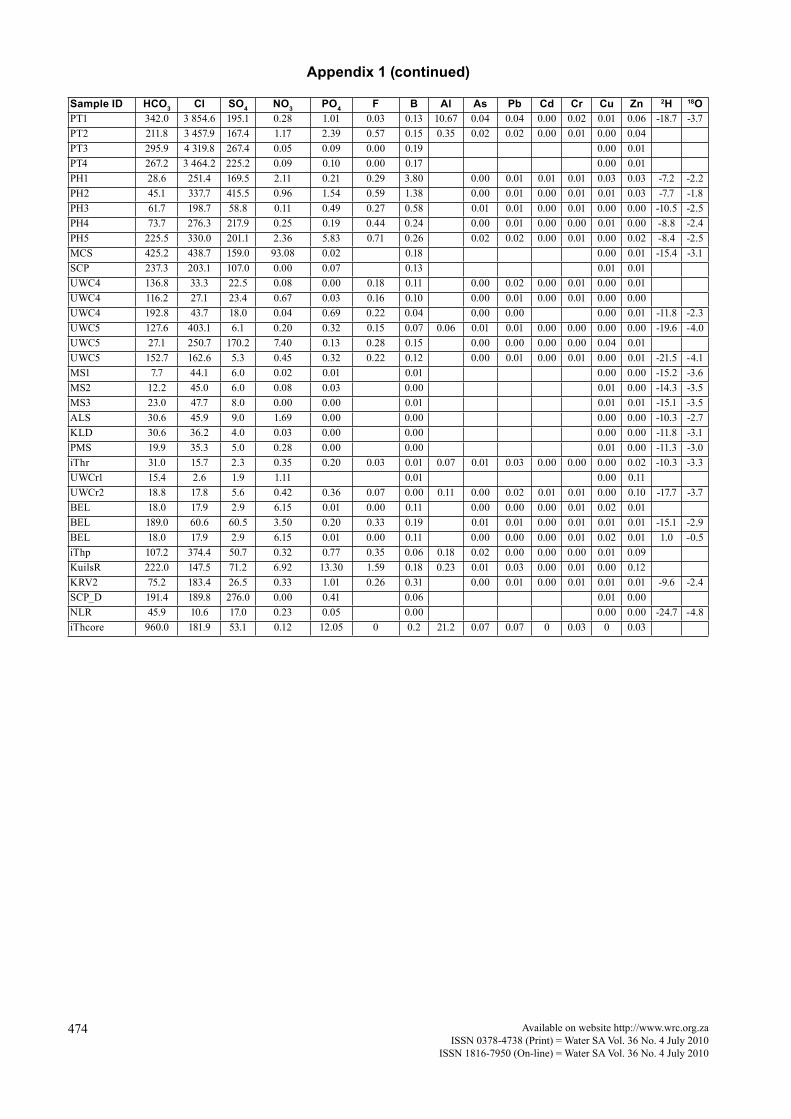
describing the current trend in water quality and at filling gaps in the data by sampling from recently drilled wells. The results are presented in Appendix 1. Furthermore, precipitation sam-ples were collected as there were no precipitation records in the database. Rain samplers were installed at UWC and iThemba Laboratory test sites, as well as around residential areas in Belhar (near Bellville) and Macassar.
Generally, groundwater samples have a TDS range of 260 to 1 600 mg/ℓ, with the exception of iThemba wells, where high Na-Cl concentrations were recorded, which may be in response to continuous long-term pumping or the presence of a historic buried river channel near the well and the proximity of the sea. The TDS within surface waters sampled within the study area was, in most cases, lower than for groundwater, with the exception of the 2 polluted ponds at iThemba, where dissolved solids ranged between 952 and 1 113 mg/ℓ during the 4 sampling episodes. Water from the
100
200
100
200
350300
20025
0
150
250
150
200
50
100
Gauss Conformal ProjectionCentral Meridian : 19 deg
30-Jan-1996
50 m2 /dcontour Interval
Open Water
LEGEND
Table Bay
N
0 1 2 3 4 5 km
False Bay
34o00
18o 4
0100
200
100
200
350300
20025
0
150
250
150
200
50
100
Gauss Conformal ProjectionCentral Meridian : 19 deg
30-Jan-1996
50 m2 /dcontour Interval
Open Water
LEGEND
50 m2 /dcontour Interval
Open Water
LEGEND
Table Bay
NN
0 1 2 3 4 5 km0 1 2 3 4 5 km
False Bay
34o00
18o 4
0
Figure 12Transmissivity
distribution map (after Wright and
Conrad, 1995: original data from
Gerber, 1981)
Table 6Summary of groundwater monitoring network on the Cape Flats
Monitoring variables Number of wells(Approximate)
Sampling frequency Data record since (year)
Groundwater level, pH, EC, TDSa, z 160 Monthly 1979Full chemistry (Major, minor & trace ions)b, z 200 Bi-annual 1967EC, TDS, Cl, nitrogen (in form of NO3-N, NH4-N), phosphate (PO4), COD/BOD and alkalinityc
Several sample lines of mul-tiple mini-wells & borehole
Bi-annual and differential depth sampling
1986
Routine chemistry d 18 4 times per year 1986Routine chemistry e 10 Monthly 1986Abstraction volume f 242 Yearly 1895
a Department of Water Affairs & Forestry (DWAF) monthly and bi-annual monitoringb Groundwater chemistry (DWAF)c Groundwater monitoring at Coastal Park sanitary landfill d Groundwater chemistry monitored by the Water Division of CSIR
e Bellville Solid Waste, record kept by the City of Cape Townf 140 wells have current full record (WARMS)zTime series for most data not complete; some years are missing, some wells closed/vandalised
Available on website http://www.wrc.org.zaISSN 0378-4738 (Print) = Water SA Vol. 36 No. 4 July 2010ISSN 1816-7950 (On-line) = Water SA Vol. 36 No. 4 July 2010
469
pumping well at iThemba is discharged into these ponds, coupled with the treated wastewater from the laboratories. Newlands reservoir water recorded a low TDS (98 mg/ℓ), in the range of the springs. This is raw water transported from the Berg River (several kilometres away) to be used for the city’s water supply.
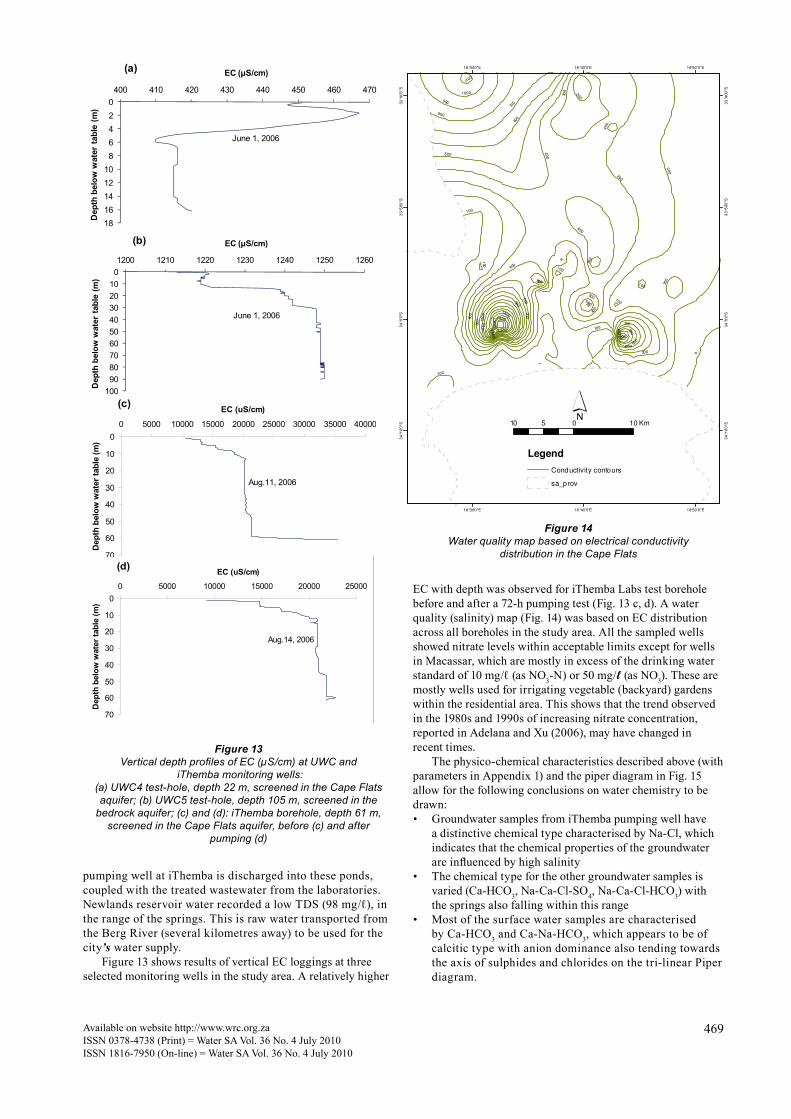
Figure 13 shows results of vertical EC loggings at three selected monitoring wells in the study area. A relatively higher
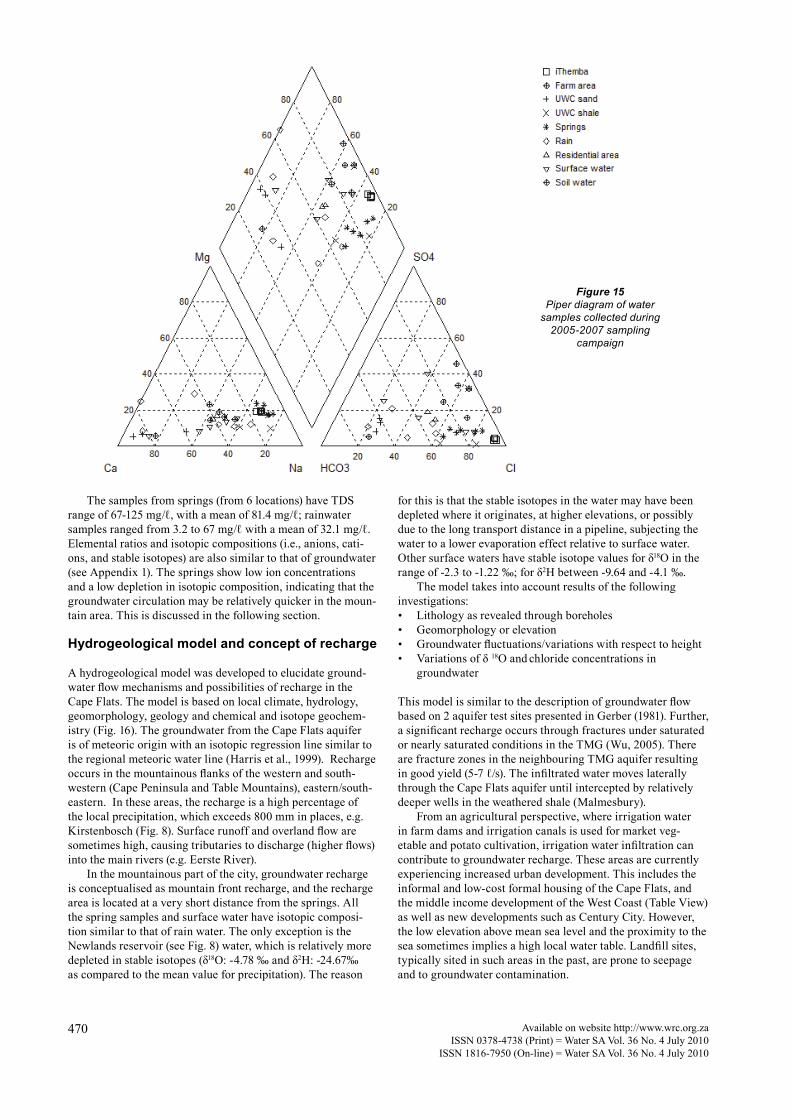
EC with depth was observed for iThemba Labs test borehole before and after a 72-h pumping test (Fig. 13 c, d). A water quality (salinity) map (Fig. 14) was based on EC distribution across all boreholes in the study area. All the sampled wells showed nitrate levels within acceptable limits except for wells in Macassar, which are mostly in excess of the drinking water standard of 10 mg/ℓ (as NO3-N) or 50 mg/ℓ (as NO3). These are mostly wells used for irrigating vegetable (backyard) gardens within the residential area. This shows that the trend observed in the 1980s and 1990s of increasing nitrate concentration, reported in Adelana and Xu (2006), may have changed in recent times.
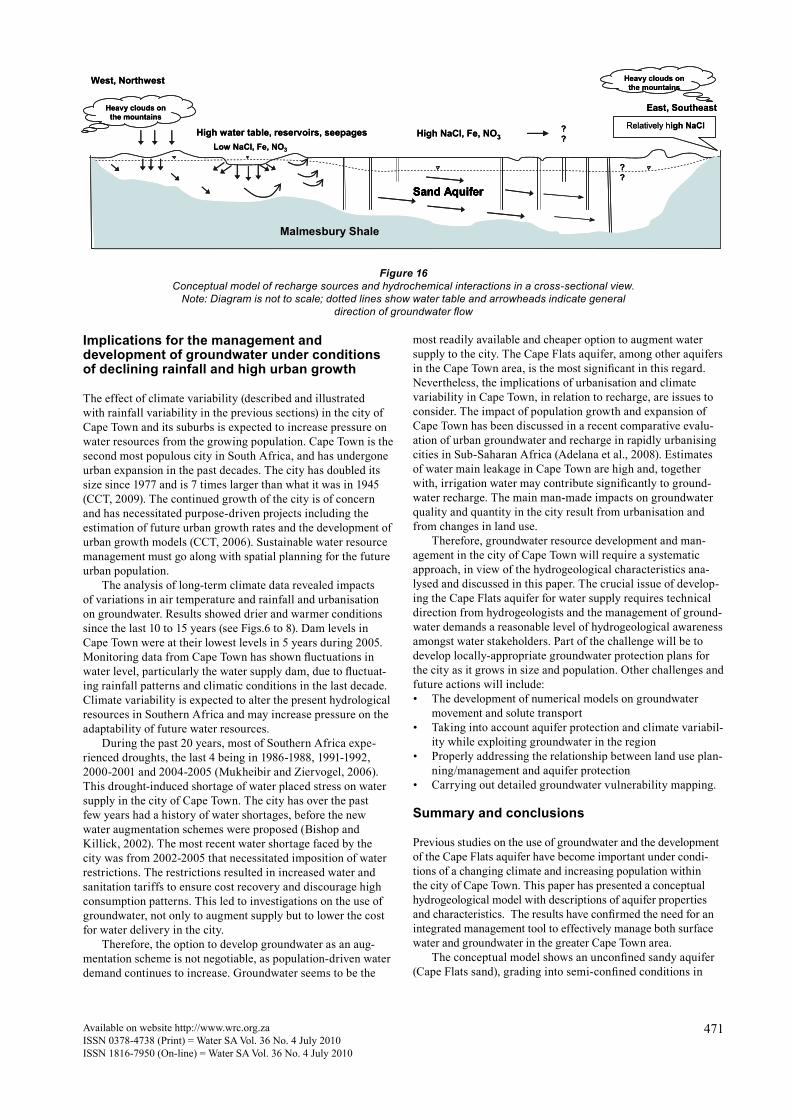
The physico-chemical characteristics described above (with parameters in Appendix 1) and the piper diagram in Fig. 15 allow for the following conclusions on water chemistry to be drawn: • Groundwater samples from iThemba pumping well have
a distinctive chemical type characterised by Na-Cl, which indicates that the chemical properties of the groundwater are influenced by high salinity
• The chemical type for the other groundwater samples is varied (Ca-HCO3, Na-Ca-Cl-SO4, Na-Ca-Cl-HCO3) with the springs also falling within this range
• Most of the surface water samples are characterised by Ca-HCO3 and Ca-Na-HCO3, which appears to be of calcitic type with anion dominance also tending towards the axis of sulphides and chlorides on the tri-linear Piper diagram.
11
02468
1012141618
400 410 420 430 440 450 460 470D
epth
bel
ow w
ater
tabl
e (m
)
EC (µS/cm)
June 1, 2006
(a)
0102030405060708090
100
1200 1210 1220 1230 1240 1250 1260
Dep
th b
elow
wat
er ta
ble
(m)
EC (µS/cm)
June 1, 2006
(b)
Aug.11, 2006
0
10
20
30
40
50
60
70
0 5000 10000 15000 20000 25000 30000 35000 40000
EC (uS/cm)
Dep
th b
elow
wat
er ta
ble
(m)
(c)
Aug.14, 2006
0
10
20
30
40
50
60
70
0 5000 10000 15000 20000 25000
EC (uS/cm)
Dep
th b
elow
wat
er ta
ble
(m)
(d)
Figure 13
Vertical depth profiles of EC (µS/cm) at UWC and iThemba monitoring wells:
(a) UWC4 test-hole, depth 22 m, screened in the Cape Flats aquifer; (b) UWC5 test-hole, depth 105 m, screened in the
bedrock aquifer; (c) and (d): iThemba borehole, depth 61 m, screened in the Cape Flats aquifer, before (c) and after
pumping (d)
Fig 14
20
0
300
0
100
40
0
500
600
700
800
900
100
011
00
1200
13
00
14
00
15001800
200
500
400
400
600
300
100
100
600
800
100
100
300
400
500
100
1100
500
500
500
900
400
1000
1000
700
400
200
900
100
700
600
18°30'0"E
18°30'0"E
18°40'0"E
18°40'0"E
18°50'0"E
18°50'0"E
34
°10'
0"S
34
°10'
0"S
34
°0'0
"S
34
°0'0
"S
33
°50'
0"S
33
°50'
0"S
33
°40'
0"S
33
°40'
0"S
Legend
Conductivity contours
sa_prov
10 0 105 Km
Figure 14Water quality map based on electrical conductivity
distribution in the Cape Flats
Available on website http://www.wrc.org.zaISSN 0378-4738 (Print) = Water SA Vol. 36 No. 4 July 2010
ISSN 1816-7950 (On-line) = Water SA Vol. 36 No. 4 July 2010
470
The samples from springs (from 6 locations) have TDS range of 67-125 mg/ℓ, with a mean of 81.4 mg/ℓ; rainwater samples ranged from 3.2 to 67 mg/ℓ with a mean of 32.1 mg/ℓ. Elemental ratios and isotopic compositions (i.e., anions, cati-ons, and stable isotopes) are also similar to that of groundwater (see Appendix 1). The springs show low ion concentrations and a low depletion in isotopic composition, indicating that the groundwater circulation may be relatively quicker in the moun-tain area. This is discussed in the following section.
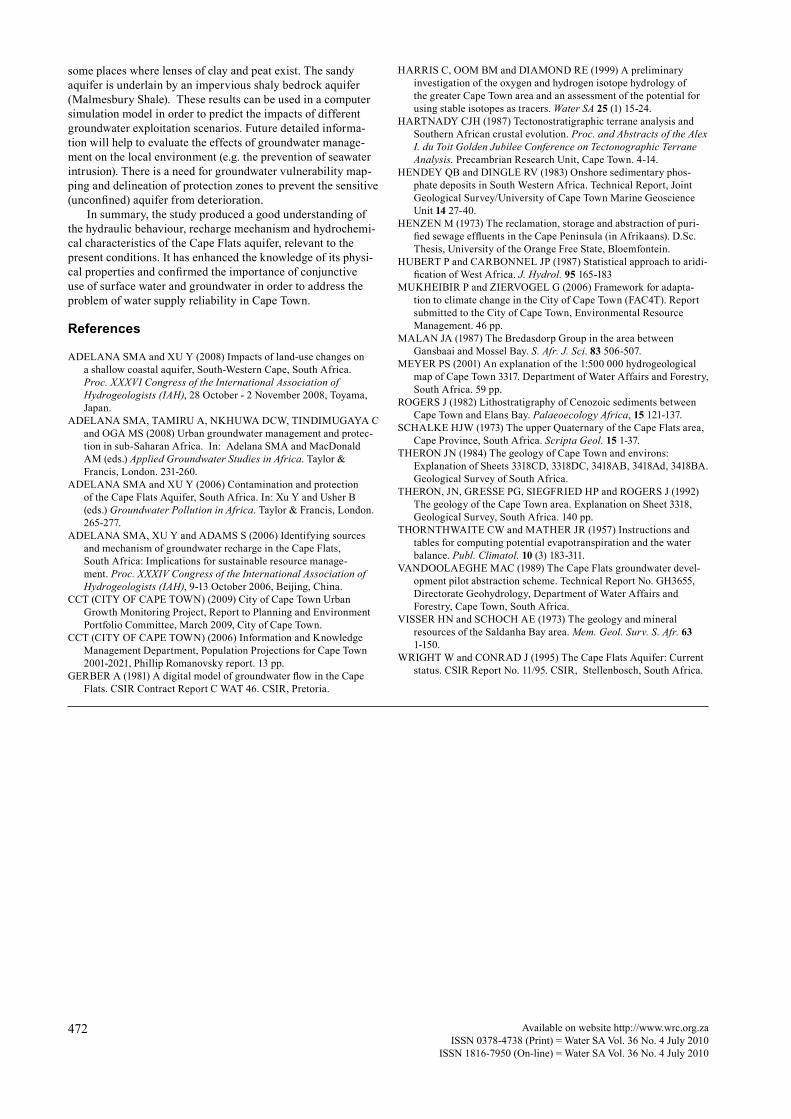
Hydrogeological model and concept of recharge
A hydrogeological model was developed to elucidate ground-water flow mechanisms and possibilities of recharge in the Cape Flats. The model is based on local climate, hydrology, geomorphology, geology and chemical and isotope geochem-istry (Fig. 16). The groundwater from the Cape Flats aquifer is of meteoric origin with an isotopic regression line similar to the regional meteoric water line (Harris et al., 1999). Recharge occurs in the mountainous flanks of the western and south-western (Cape Peninsula and Table Mountains), eastern/south-eastern. In these areas, the recharge is a high percentage of the local precipitation, which exceeds 800 mm in places, e.g. Kirstenbosch (Fig. 8). Surface runoff and overland flow are sometimes high, causing tributaries to discharge (higher flows) into the main rivers (e.g. Eerste River).
In the mountainous part of the city, groundwater recharge is conceptualised as mountain front recharge, and the recharge area is located at a very short distance from the springs. All the spring samples and surface water have isotopic composi-tion similar to that of rain water. The only exception is the Newlands reservoir (see Fig. 8) water, which is relatively more depleted in stable isotopes (δ18O: -4.78 ‰ and δ2H: -24.67‰ as compared to the mean value for precipitation). The reason
Figure 15Piper diagram of water
samples collected during 2005-2007 sampling
campaign
for this is that the stable isotopes in the water may have been depleted where it originates, at higher elevations, or possibly due to the long transport distance in a pipeline, subjecting the water to a lower evaporation effect relative to surface water. Other surface waters have stable isotope values for δ18O in the range of -2.3 to -1.22 ‰; for δ2H between -9.64 and -4.1 ‰.
The model takes into account results of the following investigations: • Lithology as revealed through boreholes • Geomorphology or elevation• Groundwater fluctuations/variations with respect to height• Variations of δ 18O and chloride concentrations in
groundwater
This model is similar to the description of groundwater flow based on 2 aquifer test sites presented in Gerber (1981). Further, a significant recharge occurs through fractures under saturated or nearly saturated conditions in the TMG (Wu, 2005). There are fracture zones in the neighbouring TMG aquifer resulting in good yield (5-7 ℓ/s). The infiltrated water moves laterally through the Cape Flats aquifer until intercepted by relatively deeper wells in the weathered shale (Malmesbury).
From an agricultural perspective, where irrigation water in farm dams and irrigation canals is used for market veg-etable and potato cultivation, irrigation water infiltration can contribute to groundwater recharge. These areas are currently experiencing increased urban development. This includes the informal and low-cost formal housing of the Cape Flats, and the middle income development of the West Coast (Table View) as well as new developments such as Century City. However, the low elevation above mean sea level and the proximity to the sea sometimes implies a high local water table. Landfill sites, typically sited in such areas in the past, are prone to seepage and to groundwater contamination.
Available on website http://www.wrc.org.zaISSN 0378-4738 (Print) = Water SA Vol. 36 No. 4 July 2010ISSN 1816-7950 (On-line) = Water SA Vol. 36 No. 4 July 2010
471
Implications for the management and development of groundwater under conditions of declining rainfall and high urban growth
The effect of climate variability (described and illustrated with rainfall variability in the previous sections) in the city of Cape Town and its suburbs is expected to increase pressure on water resources from the growing population. Cape Town is the second most populous city in South Africa, and has undergone urban expansion in the past decades. The city has doubled its size since 1977 and is 7 times larger than what it was in 1945 (CCT, 2009). The continued growth of the city is of concern and has necessitated purpose-driven projects including the estimation of future urban growth rates and the development of urban growth models (CCT, 2006). Sustainable water resource management must go along with spatial planning for the future urban population.
The analysis of long-term climate data revealed impacts of variations in air temperature and rainfall and urbanisation on groundwater. Results showed drier and warmer conditions since the last 10 to 15 years (see Figs.6 to 8). Dam levels in Cape Town were at their lowest levels in 5 years during 2005. Monitoring data from Cape Town has shown fluctuations in water level, particularly the water supply dam, due to fluctuat-ing rainfall patterns and climatic conditions in the last decade. Climate variability is expected to alter the present hydrological resources in Southern Africa and may increase pressure on the adaptability of future water resources.
During the past 20 years, most of Southern Africa expe-rienced droughts, the last 4 being in 1986-1988, 1991-1992, 2000-2001 and 2004-2005 (Mukheibir and Ziervogel, 2006). This drought-induced shortage of water placed stress on water supply in the city of Cape Town. The city has over the past few years had a history of water shortages, before the new water augmentation schemes were proposed (Bishop and Killick, 2002). The most recent water shortage faced by the city was from 2002-2005 that necessitated imposition of water restrictions. The restrictions resulted in increased water and sanitation tariffs to ensure cost recovery and discourage high consumption patterns. This led to investigations on the use of groundwater, not only to augment supply but to lower the cost for water delivery in the city.
Therefore, the option to develop groundwater as an aug-mentation scheme is not negotiable, as population-driven water demand continues to increase. Groundwater seems to be the
most readily available and cheaper option to augment water supply to the city. The Cape Flats aquifer, among other aquifers in the Cape Town area, is the most significant in this regard. Nevertheless, the implications of urbanisation and climate variability in Cape Town, in relation to recharge, are issues to consider. The impact of population growth and expansion of Cape Town has been discussed in a recent comparative evalu-ation of urban groundwater and recharge in rapidly urbanising cities in Sub-Saharan Africa (Adelana et al., 2008). Estimates of water main leakage in Cape Town are high and, together with, irrigation water may contribute significantly to ground-water recharge. The main man-made impacts on groundwater quality and quantity in the city result from urbanisation and from changes in land use.
Therefore, groundwater resource development and man-agement in the city of Cape Town will require a systematic approach, in view of the hydrogeological characteristics ana-lysed and discussed in this paper. The crucial issue of develop-ing the Cape Flats aquifer for water supply requires technical direction from hydrogeologists and the management of ground-water demands a reasonable level of hydrogeological awareness amongst water stakeholders. Part of the challenge will be to develop locally-appropriate groundwater protection plans for the city as it grows in size and population. Other challenges and future actions will include: • The development of numerical models on groundwater
movement and solute transport• Taking into account aquifer protection and climate variabil-
ity while exploiting groundwater in the region• Properly addressing the relationship between land use plan-
ning/management and aquifer protection• Carrying out detailed groundwater vulnerability mapping.
Summary and conclusions
Previous studies on the use of groundwater and the development of the Cape Flats aquifer have become important under condi-tions of a changing climate and increasing population within the city of Cape Town. This paper has presented a conceptual hydrogeological model with descriptions of aquifer properties and characteristics. The results have confirmed the need for an integrated management tool to effectively manage both surface water and groundwater in the greater Cape Town area.
The conceptual model shows an unconfined sandy aquifer (Cape Flats sand), grading into semi-confined conditions in
Sand Aquifer
Malmesbury Shale
Sand Aquifer
Malmesbury ShaleGranite
West, Northwest
East, Southeast
High water table, reservoirs, seepages High NaCl, Fe, NO3
??
??
Malmesbury Shale
Heavy clouds on the mountains
Low NaCl, Fe, NO3
Heavy clouds on the mountains
Relatively high NaCl
Sand Aquifer
Malmesbury Shale
Sand Aquifer
Malmesbury ShaleGranite
West, Northwest
East, Southeast
High water table, reservoirs, seepages High NaCl, Fe, NO3
??
??
Malmesbury Shale
Heavy clouds on the mountains
Low NaCl, Fe, NO3
Heavy clouds on the mountains
Relatively high NaCl
Figure 16Conceptual model of recharge sources and hydrochemical interactions in a cross-sectional view.
Note: Diagram is not to scale; dotted lines show water table and arrowheads indicate general direction of groundwater flow
Available on website http://www.wrc.org.zaISSN 0378-4738 (Print) = Water SA Vol. 36 No. 4 July 2010
ISSN 1816-7950 (On-line) = Water SA Vol. 36 No. 4 July 2010
472
some places where lenses of clay and peat exist. The sandy aquifer is underlain by an impervious shaly bedrock aquifer (Malmesbury Shale). These results can be used in a computer simulation model in order to predict the impacts of different groundwater exploitation scenarios. Future detailed informa-tion will help to evaluate the effects of groundwater manage-ment on the local environment (e.g. the prevention of seawater intrusion). There is a need for groundwater vulnerability map-ping and delineation of protection zones to prevent the sensitive (unconfined) aquifer from deterioration.
In summary, the study produced a good understanding of the hydraulic behaviour, recharge mechanism and hydrochemi-cal characteristics of the Cape Flats aquifer, relevant to the present conditions. It has enhanced the knowledge of its physi-cal properties and confirmed the importance of conjunctive use of surface water and groundwater in order to address the problem of water supply reliability in Cape Town.
References
ADELANA SMA and XU Y (2008) Impacts of land-use changes on a shallow coastal aquifer, South-Western Cape, South Africa. Proc. XXXVI Congress of the International Association of Hydrogeologists (IAH), 28 October - 2 November 2008, Toyama, Japan.
ADELANA SMA, TAMIRU A, NKHUWA DCW, TINDIMUGAYA C and OGA MS (2008) Urban groundwater management and protec-tion in sub-Saharan Africa. In: Adelana SMA and MacDonald AM (eds.) Applied Groundwater Studies in Africa. Taylor & Francis, London. 231-260.
ADELANA SMA and XU Y (2006) Contamination and protection of the Cape Flats Aquifer, South Africa. In: Xu Y and Usher B (eds.) Groundwater Pollution in Africa. Taylor & Francis, London. 265-277.
ADELANA SMA, XU Y and ADAMS S (2006) Identifying sources and mechanism of groundwater recharge in the Cape Flats, South Africa: Implications for sustainable resource manage-ment. Proc. XXXIV Congress of the International Association of Hydrogeologists (IAH), 9-13 October 2006, Beijing, China.
CCT (CITY OF CAPE TOWN) (2009) City of Cape Town Urban Growth Monitoring Project, Report to Planning and Environment Portfolio Committee, March 2009, City of Cape Town.
CCT (CITY OF CAPE TOWN) (2006) Information and Knowledge Management Department, Population Projections for Cape Town 2001-2021, Phillip Romanovsky report. 13 pp.
GERBER A (1981) A digital model of groundwater flow in the Cape Flats. CSIR Contract Report C WAT 46. CSIR, Pretoria.
HARRIS C, OOM BM and DIAMOND RE (1999) A preliminary investigation of the oxygen and hydrogen isotope hydrology of the greater Cape Town area and an assessment of the potential for using stable isotopes as tracers. Water SA 25 (1) 15-24.
HARTNADY CJH (1987) Tectonostratigraphic terrane analysis and Southern African crustal evolution. Proc. and Abstracts of the Alex I. du Toit Golden Jubilee Conference on Tectonographic Terrane Analysis. Precambrian Research Unit, Cape Town. 4-14.
HENDEY QB and DINGLE RV (1983) Onshore sedimentary phos-phate deposits in South Western Africa. Technical Report, Joint Geological Survey/University of Cape Town Marine Geoscience Unit 14 27-40.
HENZEN M (1973) The reclamation, storage and abstraction of puri-fied sewage effluents in the Cape Peninsula (in Afrikaans). D.Sc. Thesis, University of the Orange Free State, Bloemfontein.
HUBERT P and CARBONNEL JP (1987) Statistical approach to aridi-fication of West Africa. J. Hydrol. 95 165-183
MUKHEIBIR P and ZIERVOGEL G (2006) Framework for adapta-tion to climate change in the City of Cape Town (FAC4T). Report submitted to the City of Cape Town, Environmental Resource Management. 46 pp.
MALAN JA (1987) The Bredasdorp Group in the area between Gansbaai and Mossel Bay. S. Afr. J. Sci. 83 506-507.
MEYER PS (2001) An explanation of the 1:500 000 hydrogeological map of Cape Town 3317. Department of Water Affairs and Forestry, South Africa. 59 pp.
ROGERS J (1982) Lithostratigraphy of Cenozoic sediments between Cape Town and Elans Bay. Palaeoecology Africa, 15 121-137.
SCHALKE HJW (1973) The upper Quaternary of the Cape Flats area, Cape Province, South Africa. Scripta Geol. 15 1-37.
THERON JN (1984) The geology of Cape Town and environs: Explanation of Sheets 3318CD, 3318DC, 3418AB, 3418Ad, 3418BA. Geological Survey of South Africa.
THERON, JN, GRESSE PG, SIEGFRIED HP and ROGERS J (1992) The geology of the Cape Town area. Explanation on Sheet 3318, Geological Survey, South Africa. 140 pp.
THORNTHWAITE CW and MATHER JR (1957) Instructions and tables for computing potential evapotranspiration and the water balance. Publ. Climatol. 10 (3) 183-311.
VANDOOLAEGHE MAC (1989) The Cape Flats groundwater devel-opment pilot abstraction scheme. Technical Report No. GH3655, Directorate Geohydrology, Department of Water Affairs and Forestry, Cape Town, South Africa.
VISSER HN and SCHOCH AE (1973) The geology and mineral resources of the Saldanha Bay area. Mem. Geol. Surv. S. Afr. 63 1-150.
WRIGHT W and CONRAD J (1995) The Cape Flats Aquifer: Current status. CSIR Report No. 11/95. CSIR, Stellenbosch, South Africa.
Available on website http://www.wrc.org.zaISSN 0378-4738 (Print) = Water SA Vol. 36 No. 4 July 2010ISSN 1816-7950 (On-line) = Water SA Vol. 36 No. 4 July 2010
473
App
endi
x 1
Res
ults
of p
hysi
cal a
nd c
hem
ical
ana
lyse
s of
wat
er s
ampl
es in
the
Cap
e Fl
ats
area
, con
cent
ratio
ns in
mg/
ℓ;
grou
ndw
ater
(*) s
prin
gs (*
*), s
urfa
ce w
ater
Sam
ple
IDD
escr
iptio
nLo
catio
nD
ate
Geo
logy
Lat
SLo
ng E
Dep
thpH
TWEC
TDS
Na
KC
aM
gFe
Mn
NH
4Sr
Ba
PLi
PT1
Pum
ping
wel
liT
hem
ba8/
15/2
006
Cap
e Fl
ats s
and
-34.
0318
.72
6.9
21.7
1 19
1.1
6 56
0.0
1 62
2.5
5.6
339.
125
1.3
10.5
40.
360.
251.
815.
190.
300.
98PT
2Pu
mpi
ng w
ell
iThe
mba
11/1
5/20
06C
ape
Flat
s san
d34
.03
18.7
27.
319
.21
035.
47
876.
21
389.
46.
622
8.2
204.
916
.44
0.31
0.84
3.19
0.25
0.90
0.03
PT3
Pum
ping
wel
liT
hem
ba3/
11/2
007
Cap
e Fl
ats s
and
-34.
0318
.72
6.9
19.4
1 40
9.77
415.
71
884.
517
.132
2.0
288.
919
.33
0.44
0.16
PT4
Pum
ping
wel
liT
hem
ba1/
12/2
007
Cap
e Fl
ats s
and
-34.
0318
.72
7.0
19.4
1 20
2.1
6 16
4.7
1 66
0.0
6.3
269.
325
5.6
16.16
0.38
0.13
PH1
Farm
Phili
ppi
5/11
/200
5C
ape
Flat
s san
d-3
4.01
18.5
340
.05.
722
.81
246.
069
8.1
117.
826
.970
.720
.42.
640.
020.
470.
370.
07PH
2Fa
rmPh
ilipp
i5/
25/2
005
Cap
e Fl
ats s
and
-34.
0118
.54
30.0
6.4
19.0
1 99
3.0
1 22
3.7
159.7
61.0
141.
451
.60.
860.
020.
660.
800.
50PH
3Fa
rmPh
ilipp
i5/
25/2
005
Cap
e Fl
ats s
and
-34.
0318
.53
40.0
6.6
19.3
922.
050
3.0
100.
414
.745
.714
.10.
260.
021.
250.
280.
16PH
4Fa
rmPh
ilipp
i5/
25/2
005
Cap
e Fl
ats s
and
-34.
0318
.53
35.0
6.6
19.0
1 50
5.0
883.
914
2.3
37.0
98.3
31.7
0.15
0.02
1.10
0.52
0.06
PH5
Farm
Phili
ppi
5/25
/200
5C
ape
Flat
s san
d-3
4.02
18.5
340
.07.7
20.6
1 98
7.0
1 20
6.4
193.
136
.716
7.4
34.2
0.27
0.01
2.40
1.48
1.90
MC
SR
esid
entia
l wel
lM
acas
sar
8/16
/200
6C
ape
Flat
s san
d-3
4.06
18.7
47.1
18.0
231.
71
644.
626
3.0
23.0
191.
650
.60.
000.
420.
07SC
PR
esid
entia
l wel
lSc
aapr
al8/
16/2
006
Cap
e Fl
ats s
and
-34.
0418
.54
6.4
18.4
111.
081
0.8
114.
232
.792
.620
.23.
660.
010.
92U
WC
4 U
WC
4U
WC
test
site
2/25
/200
5C
ape
Flat
s san
d-3
3.93
18.6
222
.07.
925
.048
6.0
301.
56.
81.
492
.83.
20.
050.
000.
030.
660.
00U
WC
4U
WC
4U
WC
test
site
5/10
/200
5C
ape
Flat
s san
d-3
3.93
18.6
222
.08.
222
.842
0.5
260.
410
.31.
173
.93.
40.
040.
000.
000.
590.
01U
WC
4U
WC
4U
WC
test
site
11/2
2/20
05C
ape
Flat
s san
d-3
3.93
18.6
216
.57.7
21.7
375.
034
6.0
31.9
1.6
49.4
4.1
0.13
0.00
0.78
UW
C5Pu
mpi
ng w
ell 5
UW
C te
stsi
te11
/18/
2006
Mal
mes
bury
shal
e33
.93
18.6
210
5.0
7.5
21.7
140.
692
2.5
224.
42.
331
.414
.70.
470.
040.
390.
290.
110.
060.
00U
WC5
Pum
ping
wel
l 5U
WC
test
site
2/25
/200
5M
alm
esbu
ry sh
ale
-33.
9318
.62
105.
05.
722
.91
253.
070
3.0
121.
527
.170
.920
.73.
280.
020.
300.
380.
04U
WC5
UW
C5U
WC
test
site
11/2
2/20
05M
alm
esbu
ry sh
ale
-33.
9318
.62
94.0
7.5
20.3
791.
547
8.7
101.
21.
941
.49.
20.
320.
070.
000.
460.
00M
S1M
ain
Spri
ng1
Spri
ngs
8/14
/200
6C
ape
Flat
s san
d-3
3.94
18.4
26.
918
.018
.010
3.9
37.0
1.4
3.1
4.6
0.00
0.02
0.00
MS2
Mai
n Sp
ring
2Sp
ring
s8/
14/2
006
Cap
e Fl
ats s
and
-33.
9418
.41
6.8
18.0
17.0
96.5
2 5.7
1.2
3.1
3.2
0.00
0.01
0.00
MS3
Mai
n Sp
ring
3Sp
ring
s8/
14/2
006
Cap
e Fl
ats s
and
-33.
9418
.42
6.7
17.4
19.0
115.
228
.41.
23.
33.
60.
020.
000.
00A
LSA
lbio
n Sp
ring
Spri
ngs
8/14
/200
6C
ape
Flat
s san
d-3
3.97
18.4
77.
018
.420
.012
5.0
26.4
1.5
4.7
5.2
0.00
0.01
0.00
KLD
Kild
are
Spri
ngM
aitla
nd8/
14/2
006
Cap
e Fl
ats s
and
-33.
9718
.45
6.8
16.9
13.0
95.8
18.2
1.1
2.9
2.8
0.00
0.01
0.00
PMS
Palm
Spr
ing
Spri
ngs
8/14
/200
6C
ape
Flat
s san
d-3
3.97
18.4
66.
917
.014
.086
.719
.21.
32.
33.
40.
000.
010.
00iT
hrR
ain
iThe
mba
10/3
1/20
06C
ape
Flat
s san
d-3
4.03
18.7
17.
44.
928
.55.
00.
42.
40.
50.
070.
000.
350.
010.
010.
060.
00U
WC
r1R
ain
UW
C te
stsi
te6/
25/2
005
Cap
e Fl
ats s
and
-33.
9318
.62
5.8
16.0
20.1
22.1
0.7
0.4
1.0
0.4
0.05
0.01
0.10
0.01
0.00
UW
Cr2
Rai
nU
WC
test
site
11/3
/200
6C
ape
Flat
s san
d33
.93
18.6
26.
26.
843
.09.
30.
52.
70.
90.
020.
000.
230.
020.
000.
030.
00BE
LR
ain
Bel
har
11/3
/200
6C
ape
Flat
s san
d-3
3.95
18.6
14.
82.
58.
50.
46.
01.
10.
010.
000.
240.
010.
00BE
LR
ain
Bel
har
6/2/
2005
Cap
e Fl
ats s
and
-33.
9518
.60
7.8
19.9
832.
350
9.6
19.9
4.5
154.
69.
50.
070.
000.
091.
450.
06BE
LR
ain
Bel
har
6/3/
2005
Cap
e Fl
ats s
and
-33.
9518
.61
4.8
14.6
24.8
47.3
0.0
0.1
1.5
0.3
0.04
0.00
0.24
0.01
0.00
iThp
Dis
char
ge p
ond
iThe
mba
11/1
5/20
06C
ape
Flat
s san
d34
.03
18.7
27.
314
1.3
1017
.016
4.3
3.6
69.7
23.7
2.67
0.17
0.14
0.54
0.04
0.40
0.01
Kui
lsR
Kui
lsriv
erK
haye
litsh
a11
/16/
2006
Cap
e Fl
ats s
and
34.0
218
.68
7.198
.475
7.0
97.9
14.4
86.0
12.4
1.88
0.17
4.41
0.93
0.04
4.70
0.01
KRV
2Ir
rigat
ion
Dam
Phili
ppi
5/25
/200
5C
ape
Flat
s san
d-3
4.03
18.5
37.
51.
481
4.0
442.
984
.98.
849
.111
.50.
090.
010.
300.
280.
33SC
P_D
Ope
n po
ndSc
aapr
al8/
16/2
006
Cap
e Fl
ats s
and
-34.
0418
.54
7.6
18.0
129.
097
3.2
117.
453
.113
2.7
12.8
0.01
0.02
2.92
NLR
Res
ervo
irN
ewla
nds
8/14
/200
6C
ape
Flat
s san
d-3
3.97
18.4
57.
414
.612
.098
.03.
90.
419
.20.
80.
000.
000.
12iT
hcor
eSo
il w
ater
iThe
mba
11/1
5/20
06C
ape
Flat
s san
d34
.03
18.7
27.
316
4.5
1 25
8.0
216.
25.
381
2.8
37.2
9.36
0.17
0.28
3.1
10.3
0.2
2
Available on website http://www.wrc.org.zaISSN 0378-4738 (Print) = Water SA Vol. 36 No. 4 July 2010
ISSN 1816-7950 (On-line) = Water SA Vol. 36 No. 4 July 2010
474
Sample ID HCO3 Cl SO4 NO3 PO4 F B Al As Pb Cd Cr Cu Zn 2H 18OPT1 342.0 3 854.6 195.1 0.28 1.01 0.03 0.13 10.67 0.04 0.04 0.00 0.02 0.01 0.06 -18.7 -3.7PT2 211.8 3 457.9 167.4 1.17 2.39 0.57 0.15 0.35 0.02 0.02 0.00 0.01 0.00 0.04PT3 295.9 4 319.8 267.4 0.05 0.09 0.00 0.19 0.00 0.01PT4 267.2 3 464.2 225.2 0.09 0.10 0.00 0.17 0.00 0.01PH1 28.6 251.4 169.5 2.11 0.21 0.29 3.80 0.00 0.01 0.01 0.01 0.03 0.03 -7.2 -2.2PH2 45.1 337.7 415.5 0.96 1.54 0.59 1.38 0.00 0.01 0.00 0.01 0.01 0.03 -7.7 -1.8PH3 61.7 198.7 58.8 0.11 0.49 0.27 0.58 0.01 0.01 0.00 0.01 0.00 0.00 -10.5 -2.5PH4 73.7 276.3 217.9 0.25 0.19 0.44 0.24 0.00 0.01 0.00 0.00 0.01 0.00 -8.8 -2.4PH5 225.5 330.0 201.1 2.36 5.83 0.71 0.26 0.02 0.02 0.00 0.01 0.00 0.02 -8.4 -2.5MCS 425.2 438.7 159.0 93.08 0.02 0.18 0.00 0.01 -15.4 -3.1SCP 237.3 203.1 107.0 0.00 0.07 0.13 0.01 0.01UWC4 136.8 33.3 22.5 0.08 0.00 0.18 0.11 0.00 0.02 0.00 0.01 0.00 0.01UWC4 116.2 27.1 23.4 0.67 0.03 0.16 0.10 0.00 0.01 0.00 0.01 0.00 0.00UWC4 192.8 43.7 18.0 0.04 0.69 0.22 0.04 0.00 0.00 0.00 0.01 -11.8 -2.3UWC5 127.6 403.1 6.1 0.20 0.32 0.15 0.07 0.06 0.01 0.01 0.00 0.00 0.00 0.00 -19.6 -4.0UWC5 27.1 250.7 170.2 7.40 0.13 0.28 0.15 0.00 0.00 0.00 0.00 0.04 0.01UWC5 152.7 162.6 5.3 0.45 0.32 0.22 0.12 0.00 0.01 0.00 0.01 0.00 0.01 -21.5 -4.1MS1 7.7 44.1 6.0 0.02 0.01 0.01 0.00 0.00 -15.2 -3.6MS2 12.2 45.0 6.0 0.08 0.03 0.00 0.01 0.00 -14.3 -3.5MS3 23.0 47.7 8.0 0.00 0.00 0.01 0.01 0.01 -15.1 -3.5ALS 30.6 45.9 9.0 1.69 0.00 0.00 0.00 0.00 -10.3 -2.7KLD 30.6 36.2 4.0 0.03 0.00 0.00 0.00 0.00 -11.8 -3.1PMS 19.9 35.3 5.0 0.28 0.00 0.00 0.01 0.00 -11.3 -3.0iThr 31.0 15.7 2.3 0.35 0.20 0.03 0.01 0.07 0.01 0.03 0.00 0.00 0.00 0.02 -10.3 -3.3UWCr1 15.4 2.6 1.9 1.11 0.01 0.00 0.11UWCr2 18.8 17.8 5.6 0.42 0.36 0.07 0.00 0.11 0.00 0.02 0.01 0.01 0.00 0.10 -17.7 -3.7BEL 18.0 17.9 2.9 6.15 0.01 0.00 0.11 0.00 0.00 0.00 0.01 0.02 0.01BEL 189.0 60.6 60.5 3.50 0.20 0.33 0.19 0.01 0.01 0.00 0.01 0.01 0.01 -15.1 -2.9BEL 18.0 17.9 2.9 6.15 0.01 0.00 0.11 0.00 0.00 0.00 0.01 0.02 0.01 1.0 -0.5iThp 107.2 374.4 50.7 0.32 0.77 0.35 0.06 0.18 0.02 0.00 0.00 0.00 0.01 0.09KuilsR 222.0 147.5 71.2 6.92 13.30 1.59 0.18 0.23 0.01 0.03 0.00 0.01 0.00 0.12KRV2 75.2 183.4 26.5 0.33 1.01 0.26 0.31 0.00 0.01 0.00 0.01 0.01 0.01 -9.6 -2.4SCP_D 191.4 189.8 276.0 0.00 0.41 0.06 0.01 0.00NLR 45.9 10.6 17.0 0.23 0.05 0.00 0.00 0.00 -24.7 -4.8iThcore 960.0 181.9 53.1 0.12 12.05 0 0.2 21.2 0.07 0.07 0 0.03 0 0.03
Appendix 1 (continued)