Embed Size (px)
Citation preview
e c o l o g i c a l i n d i c a t o r s 8 ( 2 0 0 8 ) 1 4 – 2 5
A conceptual framework for selecting environmentalindicator sets
David Niemeijer *, Rudolf S. de Groot 1
Environmental Systems Analysis Group, Department of Environmental Sciences, Wageningen University, P.O. Box 47,
6700 AA Wageningen, The Netherlands
a r t i c l e i n f o
Article history:
Received 23 December 2004
Received in revised form
7 November 2006
Accepted 13 November 2006
Keywords:
Indicator selection
Ecological indicators
Environmental indicators
Environmental assessment
Causal chain
a b s t r a c t
In recent years, environmental indicators have become a vital component of environmental
impact assessments and ‘‘state of the environment’’ reporting. This has increased the
influence of environmental indicators on environmental management and policy making at
all scales of decision making. However, the scientific basis of the selection process of the
indicators used in environmental reporting can be significantly improved. In many studies
no formal selection criteria are mentioned and when selection criteria are used they are
typically applied to indicators individually. Often, no formal criteria are applied regarding an
indicator’s analytical utility within the total constellation of a selected set of indicators. As a
result, the indicator selection process is subject to more or less arbitrary decisions, and
reports dealing with a similar subject matter or similar geographical entities may use widely
different indicators and consequently paint different pictures of the environment. In this
paper, a conceptual framework for environmental indicator selection is proposed that puts
the indicator set at the heart of the selection process and not the individual indicators. To
achieve this objective, the framework applies the concept of the causal network that focuses
on the inter-relation of indicators. The concept of causal networks can facilitate the
identification of the most relevant indicators for a specific domain, problem and location,
leading to an indicator set that is at once transparent, efficient and powerful in its ability to
assess the state of the environment.
# 2007 Elsevier Ltd. All rights reserved.
avai lable at www.sc iencedi rec t .com
journal homepage: www.e lsev ier .com/ locate /ecol ind
1. Introduction
National and international environmental regulations are
rapidly increasing in number, which has lead to a boom in
environmental assessment reports (EEA, 1999; McRae et al.,
2000; Wascher, 2000; World Resources Institute, 2000; EEA,
2001; OECD, 2001; The Heinz Center, 2002; UNEP, 2002; EPA,
2003; EEA, 2005b; Esty et al., 2005; World Resources Institute,
2005). Environmental assessments have become common-
place in planning and evaluation at all scales of decision
making, from private enterprises to town councils, govern-
* Corresponding author. Tel.: +31 317 484812; fax: +31 317 419000.E-mail addresses: [email protected], d.niemeijer@environm
1 Fax: +31 317 419000.1470-160X/$ – see front matter # 2007 Elsevier Ltd. All rights reservedoi:10.1016/j.ecolind.2006.11.012
ments and international forums. Environmental indicators, as
prime assessors of the pressures on the environment, of the
evolving state of the environment, and of the appropriateness
of policy measures, have come to play a vital role in
environmental reporting.
Environmental indicators have taken on such importance
because they provide ‘‘a sign or signal that relays a complex
message, potentially from numerous sources, in a simplified
and useful manner’’ (Jackson et al., 2000, p. vii). Environmental
indicators provide an important source of information for
policy makers and help to guide decision-making as well as
ental-indicators.org (D. Niemeijer).
d.
e c o l o g i c a l i n d i c a t o r s 8 ( 2 0 0 8 ) 1 4 – 2 5 15
monitoring and evaluation (OECD, 1999), because they can
provide valuable information on complex issues in a relatively
accessible way. However, it is a major challenge to determine
‘‘which of the numerous measures of ecological systems
characterize the entire system yet are simple enough to be
effectively and efficiently monitored and modeled’’ (Dale and
Beyeler, 2001, p. 4).
In an earlier paper (Niemeijer, 2002), data-driven and
theory-driven approaches to the development of environ-
mental indicator sets were examined. In the process of writing
that paper, it was realized that while indicator reports and
their use of indicators is undeniably useful, there is still
considerable room for improvement in the indicator selection
process. As Dale and Beyeler (2001, p. 6) observe, ‘‘lack of
robust procedures for selecting indicators makes it difficult to
validate the information provided by those indicators.’’ A
more rigorous and transparent indicator selection process will
increase both the value and the scientific credibility of
environmental assessment reports and ensure they meet
management concerns (Belnap, 1998; Slocombe, 1998; Dale
and Beyeler, 2001). Another benefit of a more structured
indicator selection process is that it allows for proper
conceptual validation of indicators (Bockstaller and Girardin,
2003). It may also help in identifying indicators that can link
ecological dimensions with environmental, social and eco-
nomic dimensions, which is vital for good policy making
(Niemi and McDonald, 2004).
While a number of conceptual frameworks are used within
the context of environmental assessments (for example EPA
(1998) ecological risk assessment framework), the most
common frameworks used in indicator based studies are
the driving force–pressure–state–impact–response (DPSIR),
pressure–state–response (PSR), or driving force–state–
response (DSR) conceptual frameworks, which organize and
structure indicators in the context of a so-called causal chain
(e.g., Hammond et al., 1995; OECD, 1998, 1999; Smeets and
Weterings, 1999; EEA, 2000; Wascher, 2000; Bridges et al., 2001;
OECD, 2001). In the causal chain, social and economic
developments are considered driving forces that exert
pressure on the environment, leading to changes in the state
of the environment. In turn, these changes lead to impacts on
human health, ecological systems and materials that may
elicit a societal response that feeds back on the driving forces,
pressures, or on the state or impacts directly (Smeets and
Weterings, 1999, p. 6).
In this paper it is argued that these causal chain
frameworks should be used to frame the indicator selection
process. In current practice, indicators are often selected
either based on historical practices and regulations or based
on ‘‘intuitive assessment of experts’’ (Bossel, 2001, p. 2) and
on the degree to which they meet a number of criteria
individually (e.g., NRC, 2000; OECD, 2001; EEA, 2005a), rather
than on the basis of how they jointly provide an answer to
our environmental questions. As Swart et al. (1995) argue, it
is important to distinguish between criteria that apply to
indicators as a set, and those that apply to individual
indicators. Conceptual indicator frameworks can potentially
play an important role in the indicator selection process
and in developing consistent indicator sets. This is especially
true in situations where the whole range from driving
forces and pressures to environmental impacts needs to be
covered.
In this paper an enhanced DPSIR framework (eDPSIR in
brief) is used that does not consider individual causal chains
but, inspired by systems thinking (Odum, 1953), tackles the
complexities of the real world by looking at causal networks in
which multiple causal chains interact and inter-connect
(Niemeijer and de Groot, 2007). The concept of causal networks
in itself is not new. Causal networks have been used in
mathematics (Perl, 2001) and, referred to as causal webs, also
in the fields of health and environmental health (e.g., Kay
et al., 2000). The idea of applying a systems approach to
indicator selection is not new either (e.g., Bossel, 2001). What is
novel in the approach taken here is the integration of familiar
concepts, such as the systems approach, causal networks and
the DPSIR framework in a systematic indicator selection
procedure that makes the inter-relation of indicators an
explicit part of the indicator selection process. The need for
such a systematic, transparent and generally applicable
indicator selection procedure was again underlined as a key
finding in a recent report from the US National Commission on
Science for Sustainable Forestry (NCSSF, 2005, p. 28) that
stated:
‘‘The bottleneck in effective selection and use of indicators
is not a lack of good indicators or good science, but rather
the lack of [. . .] a clear process for selecting indicators [. . .]
The reliability of identified measures is frequently ques-
tioned, at least in part because selection of indicators often
has lacked transparency, social inclusiveness, and/or a
logical structured process of selecting indicators.’’
This paper consists of two parts. The first part begins with a
brief introduction of the concept of environmental indicators
and causal-chain frameworks. It then moves to a discussion of
indicator selection and its impact on indicator reporting. The
second part introduces the enhanced DPSIR framework and,
using a concrete example, illustrates how this so-called
eDPSIR framework can lead to better and more transparent
indicator selection.
2. Environmental indicators andtheir selection
2.1. Environmental indicators and the causal-chainframeworks
Hammond et al. (1995, p. 1) describe an indicator as ‘‘some-
thing that provides a clue to a matter of larger significance or
makes perceptible a trend or phenomenon that is not
immediately detectable. [. . .] Thus an indicator’s significance
extends beyond what is actually measured to a larger
phenomena of interest’’. To give an example, measuring body
temperature not only gives the current temperature of the
human body, but if that temperature is higher than normal
also provides a strong indication that the person is ill and
currently experiencing a virus or infection. So body tempera-
ture is not just a temperature indicator, but also a human
health indicator.
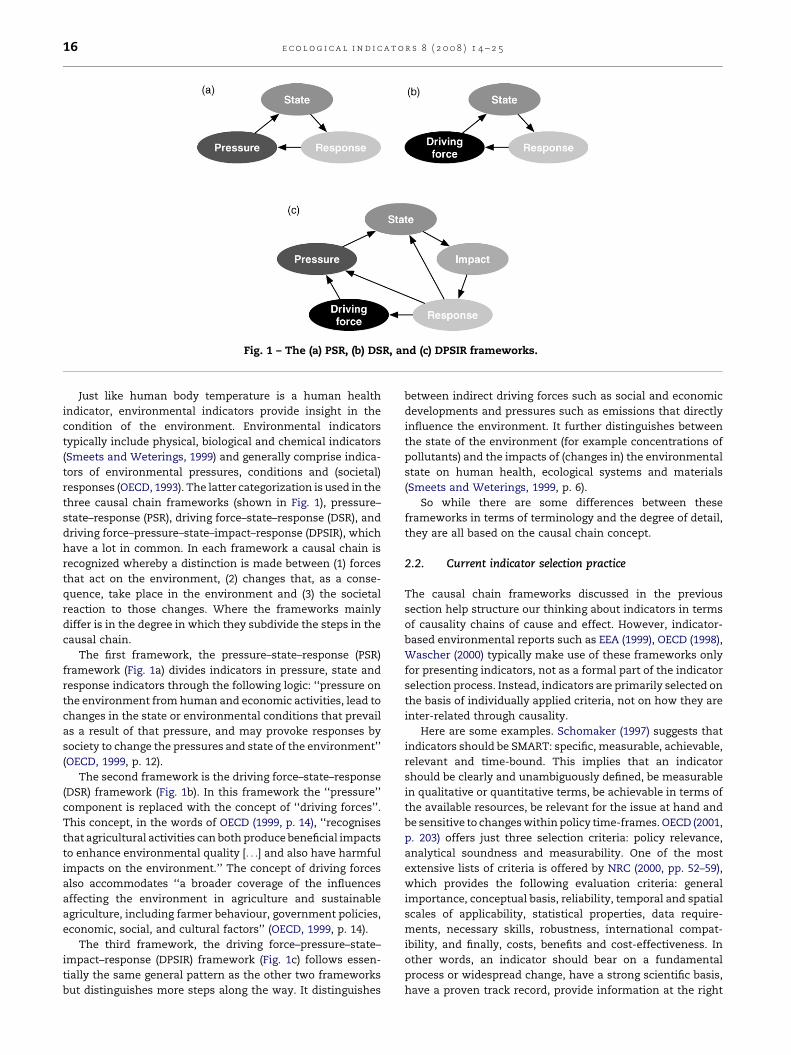
Fig. 1 – The (a) PSR, (b) DSR, and (c) DPSIR frameworks.
e c o l o g i c a l i n d i c a t o r s 8 ( 2 0 0 8 ) 1 4 – 2 516
Just like human body temperature is a human health
indicator, environmental indicators provide insight in the
condition of the environment. Environmental indicators
typically include physical, biological and chemical indicators
(Smeets and Weterings, 1999) and generally comprise indica-
tors of environmental pressures, conditions and (societal)
responses (OECD, 1993). The latter categorization is used in the
three causal chain frameworks (shown in Fig. 1), pressure–
state–response (PSR), driving force–state–response (DSR), and
driving force–pressure–state–impact–response (DPSIR), which
have a lot in common. In each framework a causal chain is
recognized whereby a distinction is made between (1) forces
that act on the environment, (2) changes that, as a conse-
quence, take place in the environment and (3) the societal
reaction to those changes. Where the frameworks mainly
differ is in the degree in which they subdivide the steps in the
causal chain.
The first framework, the pressure–state–response (PSR)
framework (Fig. 1a) divides indicators in pressure, state and
response indicators through the following logic: ‘‘pressure on
the environment from human and economic activities, lead to
changes in the state or environmental conditions that prevail
as a result of that pressure, and may provoke responses by
society to change the pressures and state of the environment’’
(OECD, 1999, p. 12).
The second framework is the driving force–state–response
(DSR) framework (Fig. 1b). In this framework the ‘‘pressure’’
component is replaced with the concept of ‘‘driving forces’’.
This concept, in the words of OECD (1999, p. 14), ‘‘recognises
that agricultural activities can both produce beneficial impacts
to enhance environmental quality [. . .] and also have harmful
impacts on the environment.’’ The concept of driving forces
also accommodates ‘‘a broader coverage of the influences
affecting the environment in agriculture and sustainable
agriculture, including farmer behaviour, government policies,
economic, social, and cultural factors’’ (OECD, 1999, p. 14).
The third framework, the driving force–pressure–state–
impact–response (DPSIR) framework (Fig. 1c) follows essen-
tially the same general pattern as the other two frameworks
but distinguishes more steps along the way. It distinguishes
between indirect driving forces such as social and economic
developments and pressures such as emissions that directly
influence the environment. It further distinguishes between
the state of the environment (for example concentrations of
pollutants) and the impacts of (changes in) the environmental
state on human health, ecological systems and materials
(Smeets and Weterings, 1999, p. 6).
So while there are some differences between these
frameworks in terms of terminology and the degree of detail,
they are all based on the causal chain concept.
2.2. Current indicator selection practice
The causal chain frameworks discussed in the previous
section help structure our thinking about indicators in terms
of causality chains of cause and effect. However, indicator-
based environmental reports such as EEA (1999), OECD (1998),
Wascher (2000) typically make use of these frameworks only
for presenting indicators, not as a formal part of the indicator
selection process. Instead, indicators are primarily selected on
the basis of individually applied criteria, not on how they are
inter-related through causality.
Here are some examples. Schomaker (1997) suggests that
indicators should be SMART: specific, measurable, achievable,
relevant and time-bound. This implies that an indicator
should be clearly and unambiguously defined, be measurable
in qualitative or quantitative terms, be achievable in terms of
the available resources, be relevant for the issue at hand and
be sensitive to changes within policy time-frames. OECD (2001,
p. 203) offers just three selection criteria: policy relevance,
analytical soundness and measurability. One of the most
extensive lists of criteria is offered by NRC (2000, pp. 52–59),
which provides the following evaluation criteria: general
importance, conceptual basis, reliability, temporal and spatial
scales of applicability, statistical properties, data require-
ments, necessary skills, robustness, international compat-
ibility, and finally, costs, benefits and cost-effectiveness. In
other words, an indicator should bear on a fundamental
process or widespread change, have a strong scientific basis,
have a proven track record, provide information at the right
e c o l o g i c a l i n d i c a t o r s 8 ( 2 0 0 8 ) 1 4 – 2 5 17
spatial scales and within appropriate time-frames, have
excellent statistical properties that allow unambiguous inter-
pretation, have manageable data requirements, not require
excessive data collection skills, be relatively insensitive to
expected sources of interference, be compatible with indica-
tors developed and used in other regions, and, finally, the
benefits of the information provided by the indicator should
outweigh the costs of usage.
Riley (2000) suggests that indicators should ideally have the
following properties: universality (applicable to many areas/
situations and scales of measurement), portability (repeat-
ability and reproducibility), sensitivity to change, operation-
ally simple, inexpensive, already existing with historical
comparative data, and have wide (international) use. Dale
and Beyeler (2001), focusing on ecological indicators, suggest
that these should be easily measured, be sensitive to stresses
on the system, respond to those stresses in a predictable
manner, be anticipatory (signify an impeding change), predict
changes that can be averted by management, be integrative
(the full suit of indicators should cover the key ecological
gradients), should have known responses to disturbances,
stresses and changes over time, and have low variability in
response. CBD (1999), looking at biodiversity indicators,
suggests that indicators should: quantify information so that
its significance is apparent, be user-driven to be relevant for
the target audience, be scientifically credible, be responsive to
changes in time and/or space, be simple and easily understood
by the target audience, be based on information that can be
collected within realistic capacity and time limits, and be
linkable to socio-economic developments and indicators of
sustainable use and response. Pannell and Glenn (2000),
talking about sustainability indicators for agriculture, note
that it is desirable that there is a high uncertainty about the
level of the indicator to be monitored, a low uncertainty about
links between the indicator, management practices and
production (in other words if the indicator has taken on an
undesirable level the insight necessary to ‘‘fix’’ the problem is
present), that the indicator can be measured reliably and
accurately, and that the cost of monitoring the indicator at the
necessary scale are low.
Kurtz et al. (2001) take a slightly different approach than
most of the other studies by focusing on hierarchical
evaluation guidelines for indicators instead of selection
criteria. The idea is that unlike criteria, the guidelines provide
a framework to ask the right questions in a structured manner
without by themselves determining indicator applicability or
effectiveness. They recognize four phases, leading from
conceptual relevance to feasibility of implementation to
response variability and finally to interpretation and utility.
Each phase is composed of 2–5 guidelines leading to a total of
15 guidelines. These are: relevance to the assessment,
relevance to the ecological resource or function at risk,
feasibility of data collection methods, feasibility of the
logistics, feasibility of the information management, feasi-
bility of the quality assurance, feasibility of the monetary
costs, estimation of measurement error, within-season
temporal variability, across-year variability, spatial variability,
discriminatory ability, data quality objectives, assessment
thresholds (for when to take action), and finally, linkage to
management actions.
Finally, EEA (2005a) gives nine criteria for their core set of
indicators of which four are policy related: Policy relevance,
progress towards policy targets, understandability of the
indicator, and part of EU priority policy issues. Four criteria
are data related: availability of routinely collected data, spatial
coverage of data, temporal coverage of data, and national scale
and representativeness of data (allowing benchmarking). The
last criterion is science-focussed, namely whether an indi-
cator is methodologically well founded. The EEA clearly has a
strong focus on practical and policy dimensions.
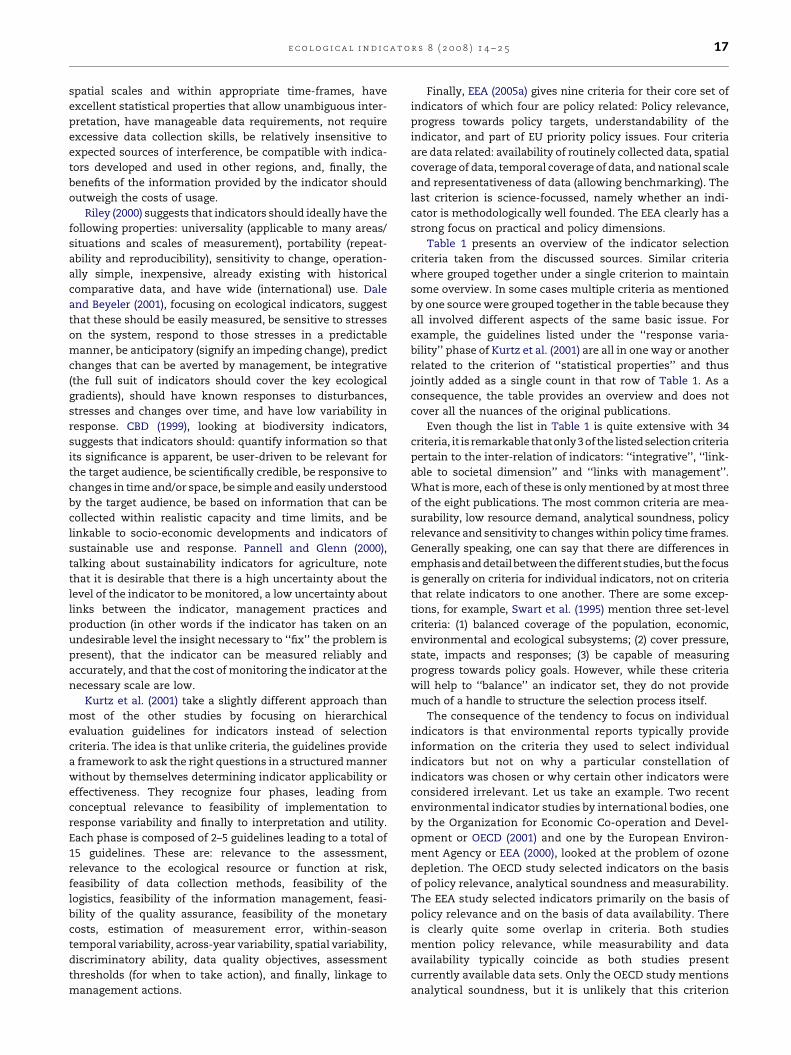
Table 1 presents an overview of the indicator selection
criteria taken from the discussed sources. Similar criteria
where grouped together under a single criterion to maintain
some overview. In some cases multiple criteria as mentioned
by one source were grouped together in the table because they
all involved different aspects of the same basic issue. For
example, the guidelines listed under the ‘‘response varia-
bility’’ phase of Kurtz et al. (2001) are all in one way or another
related to the criterion of ‘‘statistical properties’’ and thus
jointly added as a single count in that row of Table 1. As a
consequence, the table provides an overview and does not
cover all the nuances of the original publications.
Even though the list in Table 1 is quite extensive with 34
criteria, it is remarkable thatonly3 of the listed selection criteria
pertain to the inter-relation of indicators: ‘‘integrative’’, ‘‘link-
able to societal dimension’’ and ‘‘links with management’’.
What is more, each of these is only mentioned by at most three
of the eight publications. The most common criteria are mea-
surability, low resource demand, analytical soundness, policy
relevance and sensitivity to changes within policy time frames.
Generally speaking, one can say that there are differences in
emphasis and detail between the different studies, but thefocus
is generally on criteria for individual indicators, not on criteria
that relate indicators to one another. There are some excep-
tions, for example, Swart et al. (1995) mention three set-level
criteria: (1) balanced coverage of the population, economic,
environmental and ecological subsystems; (2) cover pressure,
state, impacts and responses; (3) be capable of measuring
progress towards policy goals. However, while these criteria
will help to ‘‘balance’’ an indicator set, they do not provide
much of a handle to structure the selection process itself.
The consequence of the tendency to focus on individual
indicators is that environmental reports typically provide
information on the criteria they used to select individual
indicators but not on why a particular constellation of
indicators was chosen or why certain other indicators were
considered irrelevant. Let us take an example. Two recent
environmental indicator studies by international bodies, one
by the Organization for Economic Co-operation and Devel-
opment or OECD (2001) and one by the European Environ-
ment Agency or EEA (2000), looked at the problem of ozone
depletion. The OECD study selected indicators on the basis
of policy relevance, analytical soundness and measurability.
The EEA study selected indicators primarily on the basis of
policy relevance and on the basis of data availability. There
is clearly quite some overlap in criteria. Both studies
mention policy relevance, while measurability and data
availability typically coincide as both studies present
currently available data sets. Only the OECD study mentions
analytical soundness, but it is unlikely that this criterion
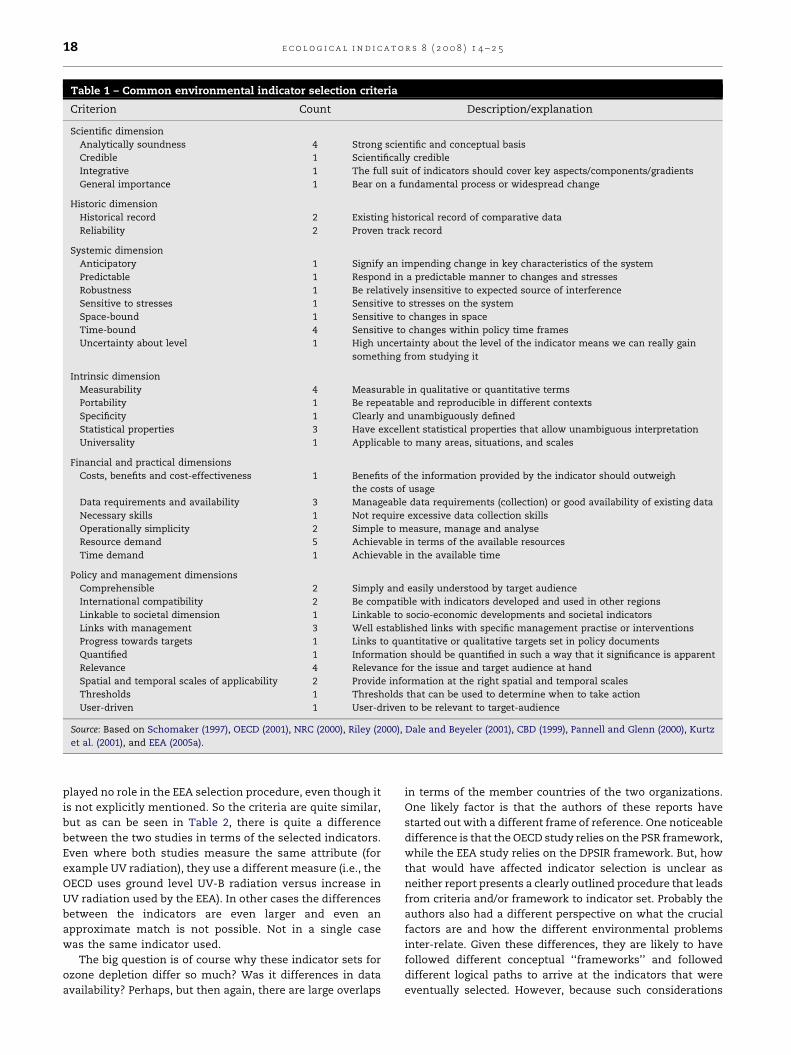
Table 1 – Common environmental indicator selection criteria
Criterion Count Description/explanation
Scientific dimension
Analytically soundness 4 Strong scientific and conceptual basis
Credible 1 Scientifically credible
Integrative 1 The full suit of indicators should cover key aspects/components/gradients
General importance 1 Bear on a fundamental process or widespread change
Historic dimension
Historical record 2 Existing historical record of comparative data
Reliability 2 Proven track record
Systemic dimension
Anticipatory 1 Signify an impending change in key characteristics of the system
Predictable 1 Respond in a predictable manner to changes and stresses
Robustness 1 Be relatively insensitive to expected source of interference
Sensitive to stresses 1 Sensitive to stresses on the system
Space-bound 1 Sensitive to changes in space
Time-bound 4 Sensitive to changes within policy time frames
Uncertainty about level 1 High uncertainty about the level of the indicator means we can really gain
something from studying it
Intrinsic dimension
Measurability 4 Measurable in qualitative or quantitative terms
Portability 1 Be repeatable and reproducible in different contexts
Specificity 1 Clearly and unambiguously defined
Statistical properties 3 Have excellent statistical properties that allow unambiguous interpretation
Universality 1 Applicable to many areas, situations, and scales
Financial and practical dimensions
Costs, benefits and cost-effectiveness 1 Benefits of the information provided by the indicator should outweigh
the costs of usage
Data requirements and availability 3 Manageable data requirements (collection) or good availability of existing data
Necessary skills 1 Not require excessive data collection skills
Operationally simplicity 2 Simple to measure, manage and analyse
Resource demand 5 Achievable in terms of the available resources
Time demand 1 Achievable in the available time
Policy and management dimensions
Comprehensible 2 Simply and easily understood by target audience
International compatibility 2 Be compatible with indicators developed and used in other regions
Linkable to societal dimension 1 Linkable to socio-economic developments and societal indicators
Links with management 3 Well established links with specific management practise or interventions
Progress towards targets 1 Links to quantitative or qualitative targets set in policy documents
Quantified 1 Information should be quantified in such a way that it significance is apparent
Relevance 4 Relevance for the issue and target audience at hand
Spatial and temporal scales of applicability 2 Provide information at the right spatial and temporal scales
Thresholds 1 Thresholds that can be used to determine when to take action
User-driven 1 User-driven to be relevant to target-audience
Source: Based on Schomaker (1997), OECD (2001), NRC (2000), Riley (2000), Dale and Beyeler (2001), CBD (1999), Pannell and Glenn (2000), Kurtz
et al. (2001), and EEA (2005a).
e c o l o g i c a l i n d i c a t o r s 8 ( 2 0 0 8 ) 1 4 – 2 518
played no role in the EEA selection procedure, even though it
is not explicitly mentioned. So the criteria are quite similar,
but as can be seen in Table 2, there is quite a difference
between the two studies in terms of the selected indicators.
Even where both studies measure the same attribute (for
example UV radiation), they use a different measure (i.e., the
OECD uses ground level UV-B radiation versus increase in
UV radiation used by the EEA). In other cases the differences
between the indicators are even larger and even an
approximate match is not possible. Not in a single case
was the same indicator used.
The big question is of course why these indicator sets for
ozone depletion differ so much? Was it differences in data
availability? Perhaps, but then again, there are large overlaps
in terms of the member countries of the two organizations.
One likely factor is that the authors of these reports have
started out with a different frame of reference. One noticeable
difference is that the OECD study relies on the PSR framework,
while the EEA study relies on the DPSIR framework. But, how
that would have affected indicator selection is unclear as
neither report presents a clearly outlined procedure that leads
from criteria and/or framework to indicator set. Probably the
authors also had a different perspective on what the crucial
factors are and how the different environmental problems
inter-relate. Given these differences, they are likely to have
followed different conceptual ‘‘frameworks’’ and followed
different logical paths to arrive at the indicators that were
eventually selected. However, because such considerations
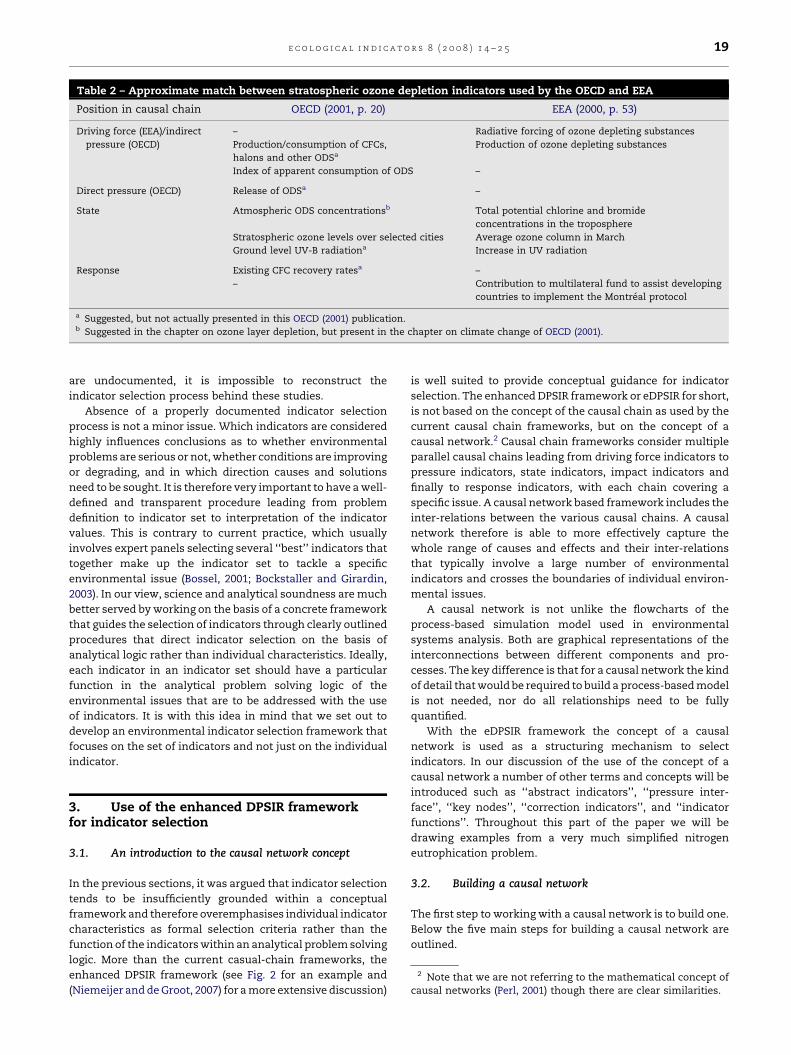
Table 2 – Approximate match between stratospheric ozone depletion indicators used by the OECD and EEA
Position in causal chain OECD (2001, p. 20) EEA (2000, p. 53)
Driving force (EEA)/indirect
pressure (OECD)
– Radiative forcing of ozone depleting substances
Production/consumption of CFCs,
halons and other ODSa
Production of ozone depleting substances
Index of apparent consumption of ODS –
Direct pressure (OECD) Release of ODSa –
State Atmospheric ODS concentrationsb Total potential chlorine and bromide
concentrations in the troposphere
Stratospheric ozone levels over selected cities Average ozone column in March
Ground level UV-B radiationa Increase in UV radiation
Response Existing CFC recovery ratesa –
– Contribution to multilateral fund to assist developing
countries to implement the Montreal protocol
a Suggested, but not actually presented in this OECD (2001) publication.b Suggested in the chapter on ozone layer depletion, but present in the chapter on climate change of OECD (2001).
e c o l o g i c a l i n d i c a t o r s 8 ( 2 0 0 8 ) 1 4 – 2 5 19
are undocumented, it is impossible to reconstruct the
indicator selection process behind these studies.
Absence of a properly documented indicator selection
process is not a minor issue. Which indicators are considered
highly influences conclusions as to whether environmental
problems are serious or not, whether conditions are improving
or degrading, and in which direction causes and solutions
need to be sought. It is therefore very important to have a well-
defined and transparent procedure leading from problem
definition to indicator set to interpretation of the indicator
values. This is contrary to current practice, which usually
involves expert panels selecting several ‘‘best’’ indicators that
together make up the indicator set to tackle a specific
environmental issue (Bossel, 2001; Bockstaller and Girardin,
2003). In our view, science and analytical soundness are much
better served by working on the basis of a concrete framework
that guides the selection of indicators through clearly outlined
procedures that direct indicator selection on the basis of
analytical logic rather than individual characteristics. Ideally,
each indicator in an indicator set should have a particular
function in the analytical problem solving logic of the
environmental issues that are to be addressed with the use
of indicators. It is with this idea in mind that we set out to
develop an environmental indicator selection framework that
focuses on the set of indicators and not just on the individual
indicator.
2 Note that we are not referring to the mathematical concept ofcausal networks (Perl, 2001) though there are clear similarities.
3. Use of the enhanced DPSIR frameworkfor indicator selection
3.1. An introduction to the causal network concept
In the previous sections, it was argued that indicator selection
tends to be insufficiently grounded within a conceptual
framework and therefore overemphasises individual indicator
characteristics as formal selection criteria rather than the
function of the indicators within an analytical problem solving
logic. More than the current casual-chain frameworks, the
enhanced DPSIR framework (see Fig. 2 for an example and
(Niemeijer and de Groot, 2007) for a more extensive discussion)
is well suited to provide conceptual guidance for indicator
selection. The enhanced DPSIR framework or eDPSIR for short,
is not based on the concept of the causal chain as used by the
current causal chain frameworks, but on the concept of a
causal network.2 Causal chain frameworks consider multiple
parallel causal chains leading from driving force indicators to
pressure indicators, state indicators, impact indicators and
finally to response indicators, with each chain covering a
specific issue. A causal network based framework includes the
inter-relations between the various causal chains. A causal
network therefore is able to more effectively capture the
whole range of causes and effects and their inter-relations
that typically involve a large number of environmental
indicators and crosses the boundaries of individual environ-
mental issues.
A causal network is not unlike the flowcharts of the
process-based simulation model used in environmental
systems analysis. Both are graphical representations of the
interconnections between different components and pro-
cesses. The key difference is that for a causal network the kind
of detail that would be required to build a process-based model
is not needed, nor do all relationships need to be fully
quantified.
With the eDPSIR framework the concept of a causal
network is used as a structuring mechanism to select
indicators. In our discussion of the use of the concept of a
causal network a number of other terms and concepts will be
introduced such as ‘‘abstract indicators’’, ‘‘pressure inter-
face’’, ‘‘key nodes’’, ‘‘correction indicators’’, and ‘‘indicator
functions’’. Throughout this part of the paper we will be
drawing examples from a very much simplified nitrogen
eutrophication problem.
3.2. Building a causal network
The first step to working with a causal network is to build one.
Below the five main steps for building a causal network are
outlined.
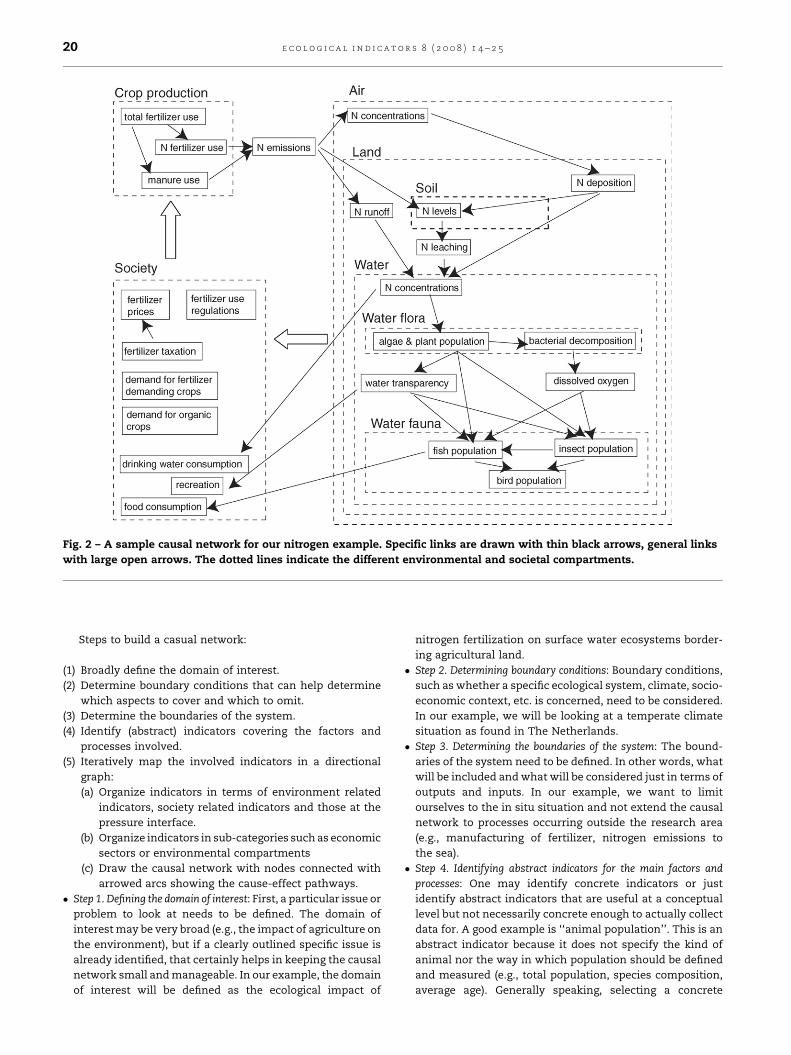
Fig. 2 – A sample causal network for our nitrogen example. Specific links are drawn with thin black arrows, general links
with large open arrows. The dotted lines indicate the different environmental and societal compartments.
e c o l o g i c a l i n d i c a t o r s 8 ( 2 0 0 8 ) 1 4 – 2 520
Steps to build a casual network:
(1) B
roadly define the domain of interest.(2) D
etermine boundary conditions that can help determinewhich aspects to cover and which to omit.
(3) D
etermine the boundaries of the system.(4) I
dentify (abstract) indicators covering the factors andprocesses involved.
(5) I
teratively map the involved indicators in a directionalgraph:
(a) Organize indicators in terms of environment related
indicators, society related indicators and those at the
pressure interface.
(b) Organize indicators in sub-categories such as economic
sectors or environmental compartments
(c) Draw the causal network with nodes connected with
arrowed arcs showing the cause-effect pathways.
� S
tep 1. Defining the domain of interest: First, a particular issue orproblem to look at needs to be defined. The domain of
interest may be very broad (e.g., the impact of agriculture on
the environment), but if a clearly outlined specific issue is
already identified, that certainly helps in keeping the causal
network small and manageable. In our example, the domain
of interest will be defined as the ecological impact of
nitrogen fertilization on surface water ecosystems border-
ing agricultural land.
� S
tep 2. Determining boundary conditions: Boundary conditions,such as whether a specific ecological system, climate, socio-
economic context, etc. is concerned, need to be considered.
In our example, we will be looking at a temperate climate
situation as found in The Netherlands.
� S
tep 3. Determining the boundaries of the system: The bound-aries of the system need to be defined. In other words, what
will be included and what will be considered just in terms of
outputs and inputs. In our example, we want to limit
ourselves to the in situ situation and not extend the causal
network to processes occurring outside the research area
(e.g., manufacturing of fertilizer, nitrogen emissions to
the sea).
� S
tep 4. Identifying abstract indicators for the main factors andprocesses: One may identify concrete indicators or just
identify abstract indicators that are useful at a conceptual
level but not necessarily concrete enough to actually collect
data for. A good example is ‘‘animal population’’. This is an
abstract indicator because it does not specify the kind of
animal nor the way in which population should be defined
and measured (e.g., total population, species composition,
average age). Generally speaking, selecting a concrete
e c o l o g i c a l i n d i c a t o r s 8 ( 2 0 0 8 ) 1 4 – 2 5 21
indicator is best done after it has been established that this
is the factor or component that should actually be
measured.
At the stage of indicator identification, it is possible to go
into great detail, but it is equally possible to work along broad
lines and consider only the most significant indicators,
processes and factors. It is even possible to work out certain
processes in detailed sub-processes because they seem
particularly relevant for the research question at hand and
stick to the main processes for other aspects. There are no
hard rules here and at any time (during subsequent steps) it is
possible to delve deeper or reduce detail. The DPSIR frame-
work can be used to get a handle on all the different
components that need to be considered. The best approach
is to start out with the pressures, as these are typically more
concrete than the driving forces and then subsequently work
forward from pressures to state, impact and responses and
then backward from pressures to driving forces. At this stage
there is no reason to be too much concerned about the
category in which an indicator should be placed or to develop
an exhaustive list of indicators. This is merely an intermediate
step intended to facilitate getting started with mapping the
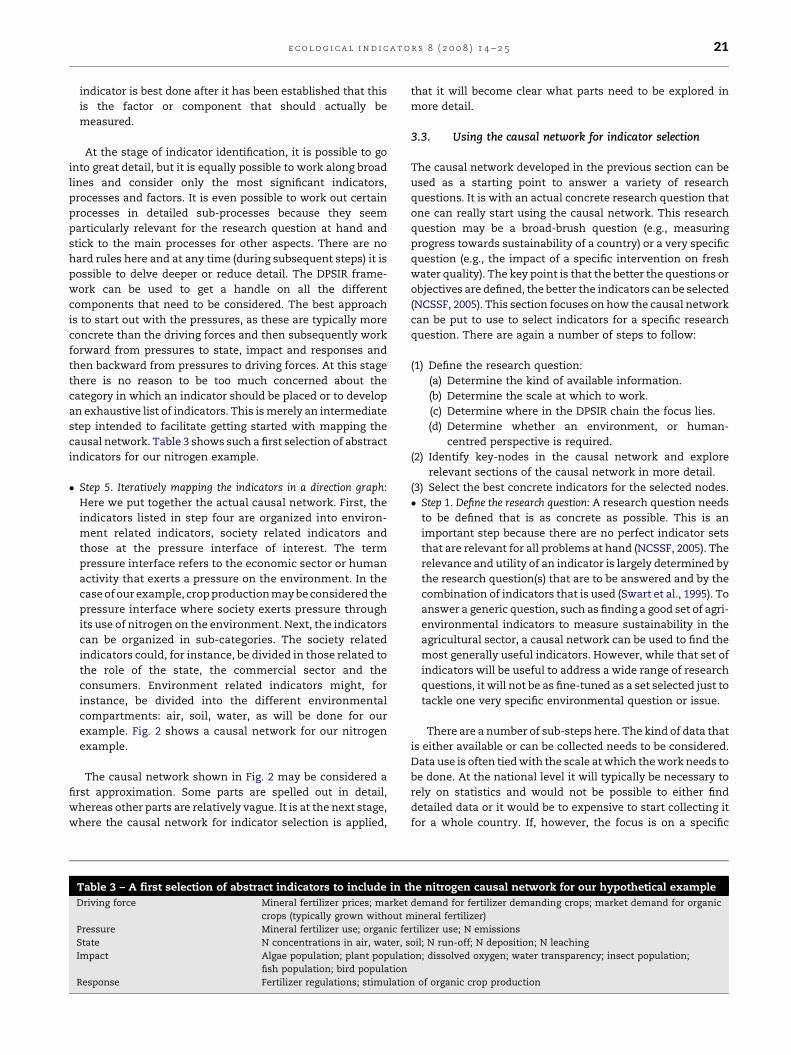
causal network. Table 3 shows such a first selection of abstract
indicators for our nitrogen example.
� S
tep 5. Iteratively mapping the indicators in a direction graph:Here we put together the actual causal network. First, the
indicators listed in step four are organized into environ-
ment related indicators, society related indicators and
those at the pressure interface of interest. The term
pressure interface refers to the economic sector or human
activity that exerts a pressure on the environment. In the
case of our example, crop production may be considered the
pressure interface where society exerts pressure through
its use of nitrogen on the environment. Next, the indicators
can be organized in sub-categories. The society related
indicators could, for instance, be divided in those related to
the role of the state, the commercial sector and the
consumers. Environment related indicators might, for
instance, be divided into the different environmental
compartments: air, soil, water, as will be done for our
example. Fig. 2 shows a causal network for our nitrogen
example.
The causal network shown in Fig. 2 may be considered a
first approximation. Some parts are spelled out in detail,
whereas other parts are relatively vague. It is at the next stage,
where the causal network for indicator selection is applied,
Table 3 – A first selection of abstract indicators to include in t
Driving force Mineral fertilizer prices; market
crops (typically grown without m
Pressure Mineral fertilizer use; organic fe
State N concentrations in air, water, s
Impact Algae population; plant populat
fish population; bird population
Response Fertilizer regulations; stimulatio
that it will become clear what parts need to be explored in
more detail.
3.3. Using the causal network for indicator selection
The causal network developed in the previous section can be
used as a starting point to answer a variety of research
questions. It is with an actual concrete research question that
one can really start using the causal network. This research
question may be a broad-brush question (e.g., measuring
progress towards sustainability of a country) or a very specific
question (e.g., the impact of a specific intervention on fresh
water quality). The key point is that the better the questions or
objectives are defined, the better the indicators can be selected
(NCSSF, 2005). This section focuses on how the causal network
can be put to use to select indicators for a specific research
question. There are again a number of steps to follow:
(1) D
he
dem
ine
rtili
oil;
ion;
n of
efine the research question:
(a) Determine the kind of available information.
(b) Determine the scale at which to work.
(c) Determine where in the DPSIR chain the focus lies.
(d) Determine whether an environment, or human-
centred perspective is required.
nitr
and
ral
zer u
N ru
diss
org
(2) Id
entify key-nodes in the causal network and explorerelevant sections of the causal network in more detail.
(3) S
elect the best concrete indicators for the selected nodes.� S
tep 1. Define the research question: A research question needsto be defined that is as concrete as possible. This is an
important step because there are no perfect indicator sets
that are relevant for all problems at hand (NCSSF, 2005). The
relevance and utility of an indicator is largely determined by
the research question(s) that are to be answered and by the
combination of indicators that is used (Swart et al., 1995). To
answer a generic question, such as finding a good set of agri-
environmental indicators to measure sustainability in the
agricultural sector, a causal network can be used to find the
most generally useful indicators. However, while that set of
indicators will be useful to address a wide range of research
questions, it will not be as fine-tuned as a set selected just to
tackle one very specific environmental question or issue.
There are a number of sub-steps here. The kind of data that
is either available or can be collected needs to be considered.
Data use is often tied with the scale at which the work needs to
be done. At the national level it will typically be necessary to
rely on statistics and would not be possible to either find
detailed data or it would be to expensive to start collecting it
for a whole country. If, however, the focus is on a specific
ogen causal network for our hypothetical example
for fertilizer demanding crops; market demand for organic
fertilizer)
se; N emissions
n-off; N deposition; N leaching
olved oxygen; water transparency; insect population;
anic crop production
e c o l o g i c a l i n d i c a t o r s 8 ( 2 0 0 8 ) 1 4 – 2 522
catchment it may be possible to find detailed data for that
catchment or, at relatively low costs, set up a measurement
program. There will typically be a tendency to rely on driving
force and pressure indicators for national or global level
analyses as these are often based on available statistical data
or can be relatively easily estimated with some inferences. For
more detailed studies, data on state and impact indicators
may be more readily available. If good data is available, or
measurement is a sensible solution, it may be necessary to
make a choice in terms of where in the DPSIR chain the focus
should be. If the objective is to know how serious a problem is,
working with state or impact indicators is preferable, but if the
objective is to know how best to control a situation, pressure
and response indicators may be a more obvious focus. Finally,
it needs to be determined whether an environment or human-
centred perspective should be taken. For example, if the
question relates to pollution, is the main interest the
consequences for ecological system functioning or, first of
all, the consequences for human health? The perspective
taken will naturally affect indicator selection.
Returning to our nitrogen example, we might, for instance,
want to answer the question what the impact of nitrogen
eutrophication by crop production is on water quality of
nearby surface water. With such a question, appropriate
indicators at the cause and effects ends are most relevant,
while remedies are less of a concern. For indicator selection it
would obviously also be in important to refine the water
quality concept by defining it in either environmental or
human health terms (or both). Based on the domain of interest
given in the previous section an environmental operationa-
lization makes most sense in the context of our example.
� S
tep 2. Identify key-nodes: To use the causal network to helpselect appropriate indicators, it is necessary to start out by
locating key-nodes in the causal network. There are three
types of key nodes: root-nodes, central nodes and end-of-
chain nodes. Root nodes are those nodes that have many
outgoing arcs (the arcs diverge from these nodes). Fig. 2,
because of its focus on crop production and nitrogen alone,
does not have an example of this type of node, but it is not
hard to image manure use having such a role considering
that it is a source not only of nitrogen, but also of
phosphorus and heavy metals. Central nodes are those
nodes that have many incoming and/or outgoing arcs
(converging and diverging arcs). Examples from Fig. 2 are
the N concentrations node for the water compartment and
the N emissions node. End-of-chain nodes typically have
multiple incoming arcs (the arcs converge at these nodes)
that bring together a number of longer chains. In Fig. 2,
insect, fish and especially bird population are typical end-of-
chain nodes.
Root nodes are important because their associated indica-
tors typically provide information on the source of multiple
issues or environmental problems. Central and end-of-chain
nodes are important because the associated indicators will
typically allow gauging the impact of multiple processes or
issues at once. This is especially the case for end-of chain
nodes, because they are located at the end of a series of cause-
effect chains. Central nodes further have the characteristic
that their associated indicators are also at the root of multiple
processes. Indicators associated with key nodes with a large
number of connecting arcs will typically be the most generally
useful indicators since they are likely to have a bearing on a
large number of issues and research questions.
Returning to our nitrogen question, we may want to start
out by determining the water quality. If one is interested in
water quality as such, indicators at end-of-chain nodes would
be most useful, because these typically provide an overall
picture of, in this case, water quality. However, such end-of-
chain nodes are less useful to isolate a particular cause
because indicators associated with end-of-chain nodes are
typically influenced by multiple factors. This leaves two
strategies, either (A) additional indicators will be needed that
would provide evidence to exclude or correct for other factors
causing changes in the end-of-chain indicator, or (B) one can
move backwards through the network in order to identify
nodes that bring together only process which have the same
original cause. Below we will explore both strategies for our
nitrogen example.
Strategy A: looking for additional indicators. If we start out with
an end-of-chain indicator we need to identify what factors, in
addition to the factor of interest (nitrogen eutrophication by
crop production), influence this indicator. What other factors
would have to be taken into account if bird population is the
starting point? There would be factors such as bird nesting
opportunities, or, in the case of migratory birds, problems
occurring in the summer or winter environments they spend
their time in. These factors are external to the studied water
ecosystem and thus make bird population a less suitable
indicator to use for water quality. With fish population that
would be much less an issue, but even for that indicator there
are other factors that affect the population outside of our
nitrogen eutrophication problem and that need to be explored.
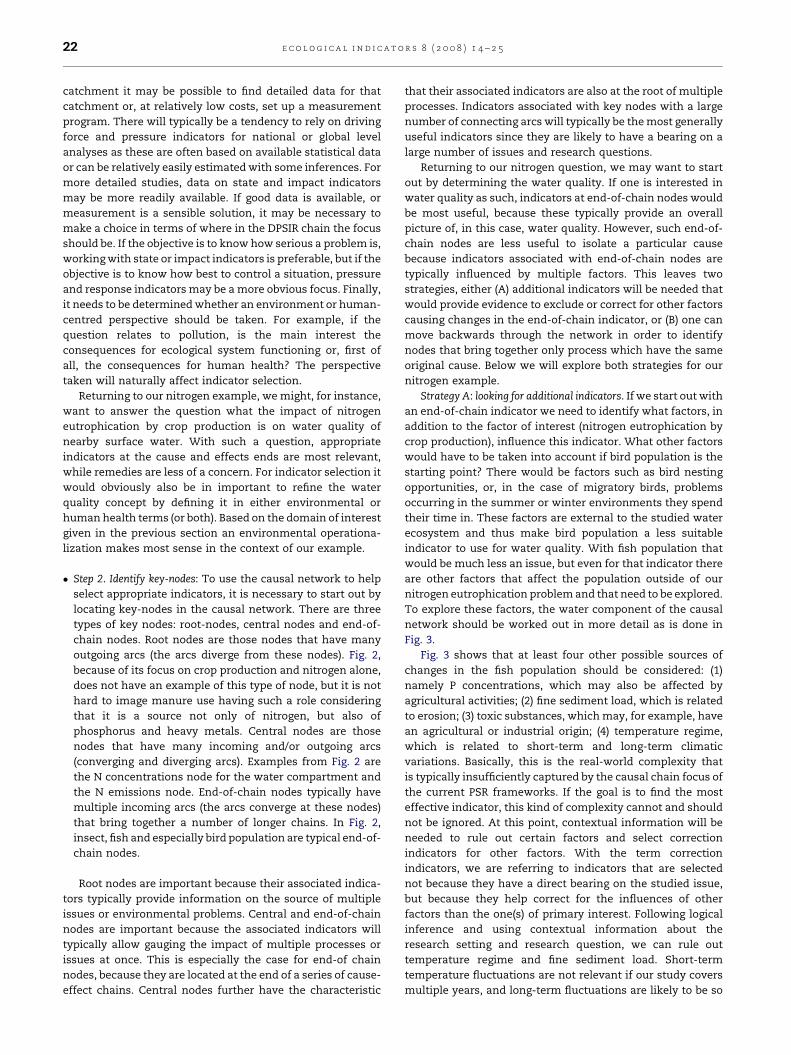
To explore these factors, the water component of the causal
network should be worked out in more detail as is done in
Fig. 3.
Fig. 3 shows that at least four other possible sources of
changes in the fish population should be considered: (1)
namely P concentrations, which may also be affected by
agricultural activities; (2) fine sediment load, which is related
to erosion; (3) toxic substances, which may, for example, have
an agricultural or industrial origin; (4) temperature regime,
which is related to short-term and long-term climatic
variations. Basically, this is the real-world complexity that
is typically insufficiently captured by the causal chain focus of
the current PSR frameworks. If the goal is to find the most
effective indicator, this kind of complexity cannot and should
not be ignored. At this point, contextual information will be
needed to rule out certain factors and select correction
indicators for other factors. With the term correction
indicators, we are referring to indicators that are selected
not because they have a direct bearing on the studied issue,
but because they help correct for the influences of other
factors than the one(s) of primary interest. Following logical
inference and using contextual information about the
research setting and research question, we can rule out
temperature regime and fine sediment load. Short-term
temperature fluctuations are not relevant if our study covers
multiple years, and long-term fluctuations are likely to be so
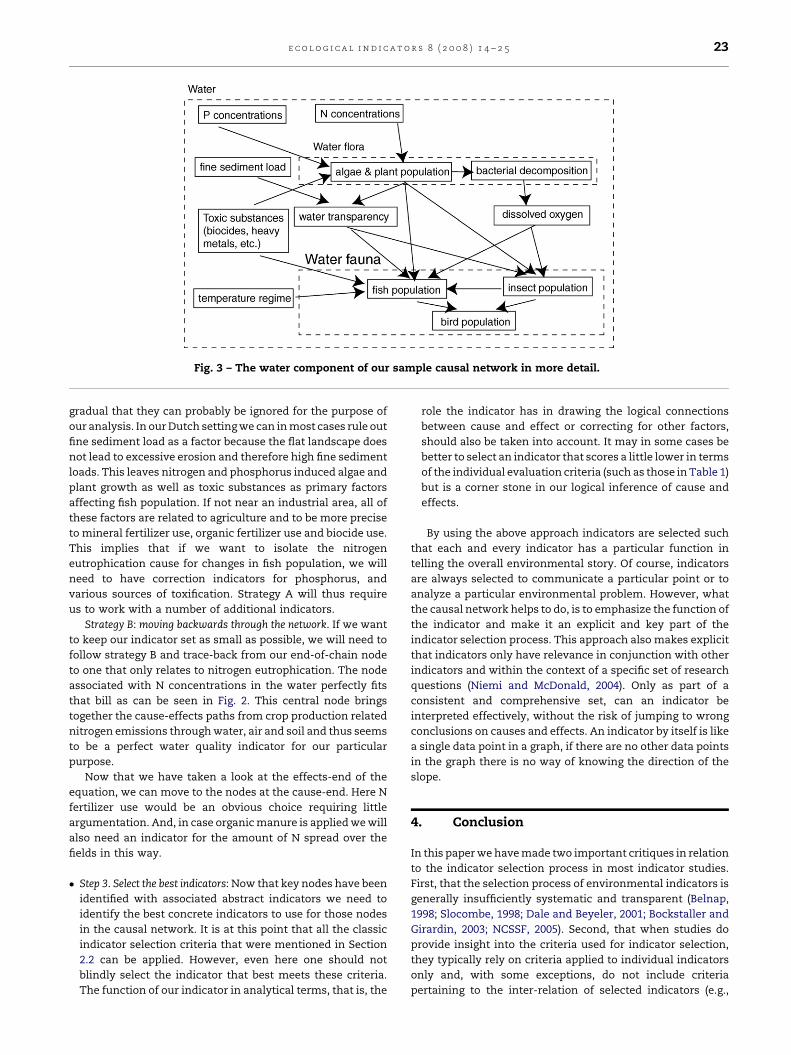
Fig. 3 – The water component of our sample causal network in more detail.
e c o l o g i c a l i n d i c a t o r s 8 ( 2 0 0 8 ) 1 4 – 2 5 23
gradual that they can probably be ignored for the purpose of
our analysis. In our Dutch setting we can in most cases rule out
fine sediment load as a factor because the flat landscape does
not lead to excessive erosion and therefore high fine sediment
loads. This leaves nitrogen and phosphorus induced algae and
plant growth as well as toxic substances as primary factors
affecting fish population. If not near an industrial area, all of
these factors are related to agriculture and to be more precise
to mineral fertilizer use, organic fertilizer use and biocide use.
This implies that if we want to isolate the nitrogen
eutrophication cause for changes in fish population, we will
need to have correction indicators for phosphorus, and
various sources of toxification. Strategy A will thus require
us to work with a number of additional indicators.
Strategy B: moving backwards through the network. If we want
to keep our indicator set as small as possible, we will need to
follow strategy B and trace-back from our end-of-chain node
to one that only relates to nitrogen eutrophication. The node
associated with N concentrations in the water perfectly fits
that bill as can be seen in Fig. 2. This central node brings
together the cause-effects paths from crop production related
nitrogen emissions through water, air and soil and thus seems
to be a perfect water quality indicator for our particular
purpose.
Now that we have taken a look at the effects-end of the
equation, we can move to the nodes at the cause-end. Here N
fertilizer use would be an obvious choice requiring little
argumentation. And, in case organic manure is applied we will
also need an indicator for the amount of N spread over the
fields in this way.
� S
tep 3. Select the best indicators: Now that key nodes have beenidentified with associated abstract indicators we need to
identify the best concrete indicators to use for those nodes
in the causal network. It is at this point that all the classic
indicator selection criteria that were mentioned in Section
2.2 can be applied. However, even here one should not
blindly select the indicator that best meets these criteria.
The function of our indicator in analytical terms, that is, the
role the indicator has in drawing the logical connections
between cause and effect or correcting for other factors,
should also be taken into account. It may in some cases be
better to select an indicator that scores a little lower in terms
of the individual evaluation criteria (such as those in Table 1)
but is a corner stone in our logical inference of cause and
effects.
By using the above approach indicators are selected such
that each and every indicator has a particular function in
telling the overall environmental story. Of course, indicators
are always selected to communicate a particular point or to
analyze a particular environmental problem. However, what
the causal network helps to do, is to emphasize the function of
the indicator and make it an explicit and key part of the
indicator selection process. This approach also makes explicit
that indicators only have relevance in conjunction with other
indicators and within the context of a specific set of research
questions (Niemi and McDonald, 2004). Only as part of a
consistent and comprehensive set, can an indicator be
interpreted effectively, without the risk of jumping to wrong
conclusions on causes and effects. An indicator by itself is like
a single data point in a graph, if there are no other data points
in the graph there is no way of knowing the direction of the
slope.
4. Conclusion
In this paper we have made two important critiques in relation
to the indicator selection process in most indicator studies.
First, that the selection process of environmental indicators is
generally insufficiently systematic and transparent (Belnap,
1998; Slocombe, 1998; Dale and Beyeler, 2001; Bockstaller and
Girardin, 2003; NCSSF, 2005). Second, that when studies do
provide insight into the criteria used for indicator selection,
they typically rely on criteria applied to individual indicators
only and, with some exceptions, do not include criteria
pertaining to the inter-relation of selected indicators (e.g.,
e c o l o g i c a l i n d i c a t o r s 8 ( 2 0 0 8 ) 1 4 – 2 524
Schomaker, 1997; CBD, 1999; NRC, 2000; Pannell and Glenn,
2000; Riley, 2000; Kurtz et al., 2001; OECD, 2001; EEA, 2005a).
Subsequently, it was argued that the utility and scientific
credibility of indicator studies can be greatly enhanced if
formal selection criteria are applied not just to indicators
individually, but also in relation to an indicator’s analytical
utility within the total constellation of a selected set of
indicators. This approach requires the selection process to be
grounded in a conceptual framework that structures the inter-
relation of individual indicators.
The enhanced DPSIR (eDPSIR) framework (Niemeijer and de
Groot, 2007) is proposed as a way to provide improved
conceptual guidance in indicator selection, while building
upon existing concepts such as the DPSIR approach, systems
analysis, and causal networks. A major benefit of the proposed
framework is that it does not consider individual causal chains
but tackles the complexities of the real world by looking at
causal networks in which multiple causal chains interact and
inter-connect. Working with a causal network allows us to
make use of the process-based knowledge used in modelling
studies but typically left unexploited in indicator studies
(Niemeijer, 2001).
The paper showed that, by constructing a causal network
for a particular problem, it is possible to identify relevant
indicators in a structured, yet flexible manner. At the same
time the approach brings out the structural relation between
indicators making this relation one of the key selection
criteria. The traditional selection criteria applied to indicators
individually (e.g., measurability, international compatibility)
still have an important role to play, but only after the most
crucial key nodes of the causal network have been identified.
The approach outlined in this paper emphasizes the analytical
function each indicator has in identifying, highlighting and
monitoring environmental issues. It also lays the foundation
for the development of powerful and transparent indicator
sets that lead to relevant and more meaningful indicator-
based analysis of the environment. Finally, by contributing to
a more uniform approach to indicator selection, the eDPSIR
framework can lead to more effective and consistent
environmental reporting.
Acknowledgements
The research for this paper was carried out as part of a project
on the ‘‘Development of ecological indicators for sustainable
food production’’ project of the PROFETAS (Protein Foods,
Environment, Technology and Society) research program
funded by The Netherlands Organization for Scientific
Research (NWO). The authors would like to thank Harry
Aiking, the anonymous reviewers and the editors for their
useful comments on earlier versions of this paper.
r e f e r e n c e s
Belnap, J., 1998. Environmental auditing: choosing indicators ofnatural resource condition: a case study in Arches NationalPark, Utah, USA. Environ. Manage. 22, 635–642.
Bockstaller, C., Girardin, P., 2003. How to validate environmentalindicators. Agric. Syst. 76, 639–653.
Bossel, H., 2001. Assessing viability and sustainability: asystems-based approach for deriving comprehensiveindicator sets. Conserv. Ecol. 5, 12.
Bridges, E.M., Hannam, I.D., Oldeman, L.R., de Vries,F.W.T.P., Scherr, S.J., Sombatpanit, S. (Eds.), 2001.Response to Land Degradation, vol. xxii. SciencePublishers, Enfield, NH, pp. 519.
CBD, 1999. Development of Indicators of Biological Diversity.Nairobi: Convention on Biological Diversity, subsidiary Bodyon Scientific, Technical and Technological Advice. ReportNo. UNEP/CBD/SBSTTA/5/12, 14 pp.
Dale, V.H., Beyeler, S.C., 2001. Challenges in the developmentand use of ecological indicators. Ecol. Indicators 1, 3–10.
EEA, 1999. Environment in the European Union at the Turn ofthe Century. European Environment Agency, Copenhagen.Report No. 2, 446 pp.
EEA, 2000. Environmental signals 2000. European EnvironmentAgency, Copenhagen. Report No. 6, 109 pp.
EEA, 2001. Environmental Signals 2001. European EnvironmentAgency, Copenhagen. Report No. 8, 112 pp.
EEA, 2005a. EEA Core Set of Indicators—Guide. EuropeanEnvironment Agency, Copenhagen. Report No. 1/2005, 37 pp.
EEA, 2005b. The European Environment: State and Outlook 2005.European Environment Agency, Copenhagen, 576 pp.
EEA, 1998. Guidelines for Ecological Risk Assessment. U.S.Environmental Protection Agency, Washington, DC, 188 pp.
EPA, 2003. Draft Report on The Environment 2003. United StatesEnvironmental Protection Agency, Washington, DC. ReportNo. EPA 260-R-02-006, 166 pp.
Esty, D.C., Levy, M., Srebotnjak, T., de Sherbinin, A., 2005. 2005Environmental Sustainability Index: BenchmarkingNational Environmental Stewardship. Yale Center forEnvironmental Law and Policy & Center for InternationalEarth Science Information Network, Davos.
Hammond, A., Adriaanse, A., Rodenburg, E., Bryant, D.,Woodward, R., 1995. Environmental Indicators: ASystematic Approach to Measuring and Reporting onEnvironmental Policy Performance in the Context ofSustainable Development. World Resources Institute,Washington, DC, 50 pp.
Jackson, L.E., Kurtz, J.C., Fisher, W.S., 2000. EvaluationGuidelines for Ecological Indicators. EnvironmentalProtection Agency, Washington, DC. Report No. EPA/620/R-99/005, 110 pp.
Kay, D., Pruss, A., Covalan, C., 2000. Methodology forAssessment of Environmental Burden of Disease. WorldHealth Organization, Geneva, 93 pp.
Kurtz, J.C., Jackson, L.E., Fisher, W.S., 2001. Strategies forEvaluating Indicators Based on Guidelines from theEnvironmental Protection Agency’s Office of Research andDevelopment Ecological Indicators 1, pp. 49–60.
McRae, T., Smith, C.A.S., Gregorich, L.J., 2000. EnvironmentalSustainability of Canadian Agriculture: Report of the Agri-Environmental Indicator Project. Agriculture and Agri-FoodCanada, Ottawa, Ontario, 224 pp.
NCSSF, 2005. Science, Biodiversity and Sustainable Forestry: AFindings Report of the National Commission on Science forSustainable Forestry. National Commission on Science forSustainable Forestry, Washington, DC, 52 pp.
Niemeijer, D., 2001. Assessing environmental sustainability:process-based models versus state indicators. In: PaperPresented at the 97th Annual Meeting of the Association ofAmerican Geographers, 27 February to 3 March, 2001, NewYork, USA.
Niemeijer, D., 2002. Developing indicators for environmentalpolicy: data-driven and theory-driven approachesexamined by example. Environ. Sci. Policy 5, 91–103.
e c o l o g i c a l i n d i c a t o r s 8 ( 2 0 0 8 ) 1 4 – 2 5 25
Niemeijer, D., de Groot, R., 2007. Framing environmentalindicators: moving from causal chains to causal networks.Environ. Dev. Sustain 9, doi:10.1007/s10668-006-9040-9.
Niemi, G.J., McDonald, M.E., 2004. Application of ecologicalindicators. Annu. Rev. Ecol. Evol. Syst. 35, 89–111.
NRC, 2000. Ecological Indicators for the Nation. NationalAcademy Press, Washington, DC, 180 pp.
Odum, E.P., 1953. Fundamentals of Ecology. Saunders,Philadelphia, 384 pp.
OECD, 1993. OECD Core Set of Indicators for EnvironmentalPerformance Reviews: A Synthesis Report by the Group onthe State of the Environment. Organisation for EconomicCo-operation and Development, Paris. Report No. 83, 39 pp.
OECD, 1998. Towards Sustainable Development: EnvironmentalIndicators. Organisation for Economic Co-operation andDevelopment, Paris, 129 pp.
OECD, 1999. Environmental Indicators for Agriculture: Volume 1Concepts and Frameworks. Organisation for Economic Co-operation and Development, Paris, 45 pp.
OECD, 2001. OECD Environmental Indicators: TowardsSustainable Development. Organisation for Economic Co-operation and Development, Paris, 155 pp.
Pannell, D.J., Glenn, N.A., 2000. A framework for the economicevaluation and selection of sustainability indicators inagriculture. Ecol. Econ. 33, 135–149.
Perl, J. 2001. Bayesian Networks, Causal Inference andKnowledge Discovery. http://www.secondmoment.org.
Riley, J., 2000. Summary of the discussion session contributionsto topic 1: what should a set of guidelines with regard toindicators contain? UNIQUAIMS Newslett. 10, 5–6.
Schomaker, M., 1997. Development of environmental indicatorsin UNEP. In: Paper Presented at the Land Quality Indicatorsand their Use in Sustainable Agriculture and RuralDevelopment, January 25–26, 1996, Rome, FAO, pp. 35–36.
Slocombe, D.S., 1998. Forum: defining goals and criteria forecosystem-based management. Environ. Manage. 22,483–493.
Smeets, E., Weterings, R., 1999. Environmental Indicators:Typology and Overview. European Environment Agency,Copenhagen. Report No. 25, 19 pp.
Swart, R.J., Bakkes, J.A., Niessen, L.W., Rotmans, J., de Vries,H.J.M., Weterings, R., 1995. Scanning the GlobalEnvironment: A Framework and Methodology for IntegratedEnvironmental Reporting and Assessment. RIVM, Bilthoven.Report No. 402001002, 58 pp.
The Heinz Center, 2002. The State of the Nation’s Ecosystems:Measuring the Lands, Waters and Living Resources of theUnited States. The H. John Heinz III Center for Science,Economics, and the Environment, Washington, DC, 119 pp.
UNEP, 2002. Global Environment Outlook 3. United NationsEnvironment Programme, Nairobi.
Wascher, D.M., 2000. Agri-Environmental Indicators forSustainable Agriculture in Europe. European Centre forNature Conservation, Tilburg, 240 pp.
World Resources Institute, 2000. World Resources Report 2000–2001: People and Ecosystems: The Fraying Web of Life.World Resources Institute, Washington, DC.
World Resources Institute, 2005. World Resources 2005: TheWealth of the Poor Managing Ecosystems to Fight Poverty.World Resources Institute, Washington, DC.