Embed Size (px)
Citation preview
A computational study of H2 dissociation on silver surfaces: The effect of
oxygen in the added row structure of Ag(110)wzAmjad B. Mohammad,a Kok Hwa Lim,ya Ilya V. Yudanov,ab
Konstantin M. Neymancand Notker Rosch*
a
Received 15th November 2006, Accepted 6th December 2006
First published as an Advance Article on the web 19th January 2007
DOI: 10.1039/b616675j
We studied computationally the activation of H2 on clean planar (111), (110) and stepped (221) as
well as oxygen pre-covered silver surfaces using a density functional slab model approach. In line
with previous data we determined clean silver to be inert towards H2 dissociation, both
thermodynamically and kinetically. The reaction is endothermic by B40 kJ mol�1 and exhibits
high activation energies of B125 kJ mol�1. However, oxygen on the surface, modeled by the
reconstructed surface p(2 � 1)O/Ag(110) that exhibits –O–Ag–O– added rows, renders H2
dissociation clearly exothermic and kinetically feasible. The reaction was calculated to proceed in
two steps: first the H–H bond is broken at an Ag–O pair with an activation barrier Ea B70 kJ
mol�1, then the H atom bound at an Ag center migrates to a neighboring O center with
Ea B12 kJ mol�1.
1. Introduction
Dissociation of molecular hydrogen H2 on metals to form
atomic H species is a crucial step in numerous technologically
important processes; we just mention hydrogen storage.1
Differently from many other metals, H2 dissociation on clean
planar silver surfaces appears to be unlikely according to a
variety of surface science2–6 and theoretical7–9 studies. This
contradicts experimental findings which show silver, well-
known to catalyze oxidation reactions,10 also to be an efficient
hydrogenation catalyst which transforms a,b-unsaturated al-
dehydes to unsaturated alcohols.11 The mechanism of the
latter process is not well understood at the microscopic level
and activation of H2 on pure and correspondingly chemically
modified silver substrates is definitely one of the puzzling key
issues to be clarified. The present study is motivated by this
puzzle, but we addressed the problem of H2 dissociation on
well-defined silver surfaces. With hydrogenation reactions in
mind where oxygen adsorbates may be present (e.g. generated
by aldehyde decomposition12), we also considered model
surfaces with well-defined overlayers of oxygen.
We will briefly summarise relevant results on the interaction
of molecular and atomic hydrogen with silver surfaces. At a
very low temperature, 10 K, only physisorption of H2 was
observed on the Ag(111) surface indicating that H2 dissocia-
tion on silver is an activated process.2 From experimental
results, the binding energy of H2 at that surface has been
estimated at 15 kJ mol�1,4 to be compared with a density
functional (DF) result of 10 kJ mol�1, obtained in the local
density approximation (LDA).7 No H2 adsorption at all was
observed on the Ag(110) surface at 90 K.3 Based on the finding
that H2 does not dissociate on Ag(111) at 100 K the upper
limit for the binding energy of H atoms at this surface was
estimated at 218 kJ mol�1, i.e. half of the H2 dissociation
energy in the gas phase.5 DF calculations at the gradient-
corrected (GGA) level yielded even smaller values of the
binding energy that vary slightly with the exchange–correla-
tion approximation, B200 kJ mol�1 (PW91 functional)13 and
B185 kJ mol�1 (RPBE functional)14 for H adsorption at
3-fold hollow sites of the Ag(111) surface.9 Such an energy
gain by H adsorption is not sufficient for dissociating H2 from
the gas phase onto the Ag(111) surface, which requires an
energy expense of 436 kJ mol�1 (experiment)15 or 439 kJ
mol�1 (DF calculations with PBE16 and PW91 functionals).16
On the Ag(100) surface, a rather high activation barrier of
B105 kJ mol�1 has been determined from DF calculations
with the PW91 functional.8 Also, on the more open Ag(110)
surface dissociative adsorption of H2 is experimentally found
to be a strongly activated process;3 no accurate theoretical
results are yet available for this system.
As H2 cannot be activated under common experimental
conditions on clean low-index surfaces of silver, one has to
discuss alternative activation sites, either sites on higher-index
surfaces, which contain more active low-coordinated metal
centers, or surface sites formed by impurities, e.g. atomic
oxygen.12,17
aDepartment Chemie, Theoretische Chemie, Technische UniversitatMunchen, 85747 Garching, Germany. E-mail: [email protected];Fax: +49-89-289 13468
b Boreskov Institute of Catalysis, Russian Academy of Sciences,630090 Novosibirsk, Russia
c Institucio Catalana de Recerca i Estudis Avancats (ICREA), 08010Barcelona and Departament de Quımica Fısica i Centre especial deRecerca en Quımica Teorica, Universitat de Barcelona i ParcCientıfic de Barcelona, 08028 Barcelona, Spainw The HTML version of this article has been enhanced with colourimages.z Electronic supplementary information (ESI) available: Calculatedstructural, energetic and vibrational parameters of selected investi-gated systems. See DOI: 10.1039/b616675jy Present address: School of Chemical and Biomedical Engineering,Nanyang Technological University, Singapore 637459.
This journal is �c the Owner Societies 2007 Phys. Chem. Chem. Phys., 2007, 9, 1247–1254 | 1247
PAPER www.rsc.org/pccp | Physical Chemistry Chemical Physics
Publ
ishe
d on
19
Janu
ary
2007
. Dow
nloa
ded
by U
nive
rsity
of
Prin
ce E
dwar
d Is
land
on
22/1
0/20
14 1
9:28
:51.
View Article Online / Journal Homepage / Table of Contents for this issue
The interaction of oxygen with silver has been intensively
studied, due to its important industrial application in the
epoxidation of ethene; yet, the nature of oxygen species under
epoxidation conditions is still debated controversially.10,18–25
Surface science studies under ultra-high vacuum (UHV) con-
ditions provided more detailed structural information. In
particular, an added-row reconstruction of the Ag(110) sur-
face by adsorbed oxygen is experimentally well-estab-
lished:26–30 Ag–O–Ag–O chains develop along the [001]
direction. The interaction between the chains is repulsive and
ordered (n � 1) structures (n = 2–8) have been observed, with
n larger for lower oxygen coverage. This added-row p(n� 1)O/
Ag(110) system appears to be the only surface phase of oxygen
on silver with a well-defined structure. Such Ag–O added rows
are formed on the Ag(110) surface at UHV conditions and
very low oxygen coverages,26,29 thus representing a tempting
model of surface oxygen species that may exist even in oxygen-
deficient atmosphere.
In the present computational study, we compared the
activation of molecular hydrogen on clean Ag surfaces and
on added-row modified Ag(110) surfaces. To examine the
effect of the surface morphology on the activation of hydro-
gen, we first considered the adsorption of H2 on the most
stable surface Ag(111), on the more open surface Ag(110), and
on the stepped surface Ag(221). Then, we went on to char-
acterize the reaction path of H2 dissociation on the Ag–O
chains of the p(n � 1)O/Ag(110) (n = 2, 3) surfaces.
2. Models and computational details
The calculations were performed with the plane-wave based
Vienna ab initio simulation package (VASP)31–33 using the
PW91 functional. The interaction between atomic cores and
electrons was described by the projector augmented wave
(PAW) method.34,35 For integrations over the Brillouin zone,
we combined (5 � 5 � 1) Monkhorst-Pack grids36 with first-
order Methfessel-Paxton smearing technique (smearing value
0.15 eV).37 An energy cut-off of 400 eV was used throughout.
To model (111) and (110) surfaces, we employed unit cells
with four Ag atoms per layer, enabling a surface coverage of
1/4 or higher. For the stepped Ag(221) [4(111) � (111)] surface,
we used unit cells of eight (or twelve) Ag atoms per layer. In
Fig. 1 we show the various adsorption sites studied. A vacuum
spacing of about 1 nm was adopted to separate the periodi-
cally repeated slabs. The adsorbed moieties were placed on one
side of a slab of five Ag layers. Three layers at the ‘‘bottom’’ of
the metallic substrate were kept fixed at the optimized geo-
metry of the bulk material (Ag–Ag = 293 pm), while the
atomic positions of two ‘‘top’’ Ag layers were optimized for
clean substrates and then kept fixed during the subsequent
adsorption studies. We have justified this type of models for
studies of this kind;38,39 see also below. Upon relaxation of the
clean Ag(111) surface, the interlayer distances changed by at
most 2 pm. At variance, the interlayer distance between the
top two layers of the Ag(110) surface decreased by 12 pm and
the distance between the second and third layers increased by
7 pm. For the Ag(221) surface, the second-layer atoms changed
their positions by less than 2 pm. The first-layer atoms showed
larger displacements; the edge atoms moved 6 pm toward the
‘‘bulk’’ while the terrace atoms moved 1–7 pm in the opposite
direction. With these changes, the distances between the first-
layer Ag atoms shortened to 289 pm. Further relaxation of the
top two Ag layers under the influence of adsorbed atomic
hydrogen at various sites of the Ag(110) surface (see Fig. 1)
was found to be insignificant. For instance, the distance H–Ag
changed by 1 pm compared to our standard model where the
substrate was kept at the structure optimized for a free surface.
At a coverage of 1/4, adsorbate-induced relaxation affects the
Ag–H binding energy by less than 2 kJ mol�1.
As already indicated, besides pure Ag substrates, we also
examined the reactivity of silver with respect to H2 dissocia-
tion in the presence of surface oxygen. For this purpose, we
chose the added-row p(2 � 1)O/Ag(110) surface, where the
AgO row structure is formed by formally depositing two Ag
and two O atoms per surface unit cell. Here, too, we used a
five-layer slab to model the Ag(110) substrate (Fig. 2). For
adsorption and reaction studies, the positions of the H ad-
sorbates and those of the AgO added row were allowed to
relax while keeping the Ag(110) substrate fixed at the geometry
optimized for the bare slab model.
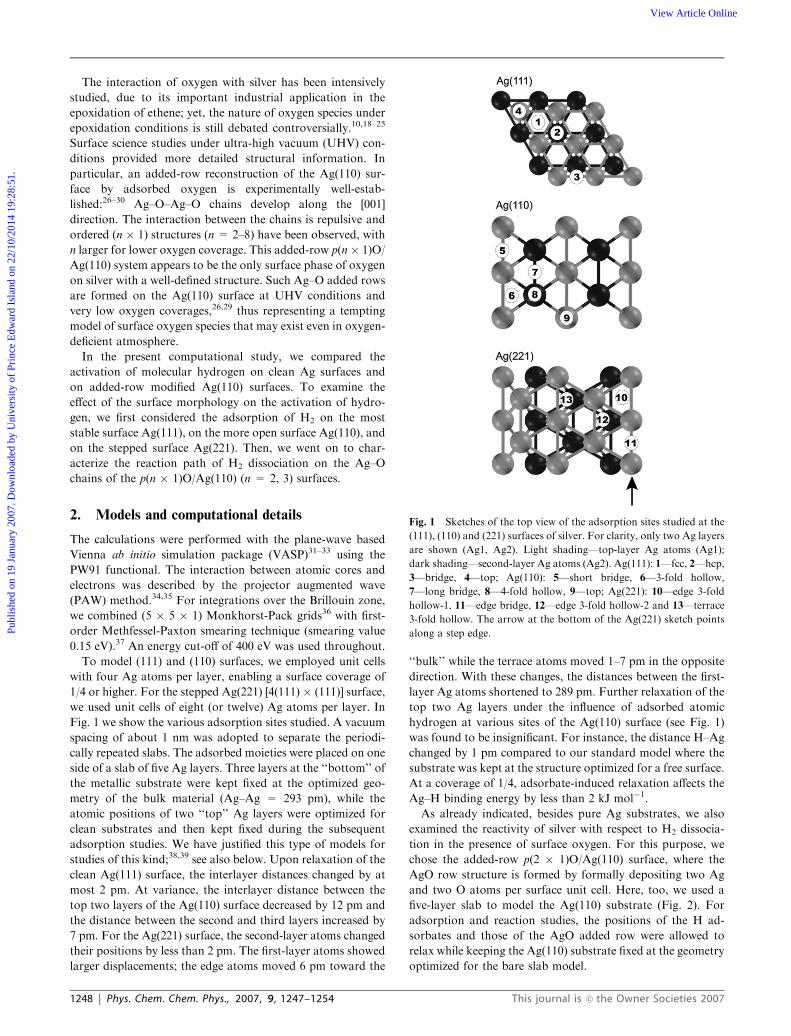
Fig. 1 Sketches of the top view of the adsorption sites studied at the
(111), (110) and (221) surfaces of silver. For clarity, only two Ag layers
are shown (Ag1, Ag2). Light shading—top-layer Ag atoms (Ag1);
dark shading—second-layer Ag atoms (Ag2). Ag(111): 1—fcc, 2—hcp,
3—bridge, 4—top; Ag(110): 5—short bridge, 6—3-fold hollow,
7—long bridge, 8—4-fold hollow, 9—top; Ag(221): 10—edge 3-fold
hollow-1, 11—edge bridge, 12—edge 3-fold hollow-2 and 13—terrace
3-fold hollow. The arrow at the bottom of the Ag(221) sketch points
along a step edge.
1248 | Phys. Chem. Chem. Phys., 2007, 9, 1247–1254 This journal is �c the Owner Societies 2007
Publ
ishe
d on
19
Janu
ary
2007
. Dow
nloa
ded
by U
nive
rsity
of
Prin
ce E
dwar
d Is
land
on
22/1
0/20
14 1
9:28
:51.
View Article Online
The energy of adsorption, Ead = Etot(ad_sub) – [Etot(ad) +
Etot(sub)], was calculated by subtracting the sum of the total
energies of the adsorbate (H atoms in the gas phase) and of the
clean substrate from the total energy Etot(ad_sub) of the slab
covered by the adsorbate in the optimized geometry. With this
definition, a negative value of Ead implies favorable adsorp-
tion, associated with a release of energy.
The potential energy surface for H2 adsorption is rather flat;
therefore, we first located approximate configurations for the
transition states (TS) of H2 dissociation on the clean Ag(110)
surface with the help of a constrained search, and subsequently
applied the nudged elastic band method.40 We distinguished
different dissociation pathways by the structure of the final
state (FS) which we labeled according to the sites where the
dissociated atoms H ended up (Table 2). For example, the FS
short-bridge/short-bridge 5/5 refers to dissociated H atoms at
two short bridge sites 5 (Fig. 1). The TS search of H2
dissociation on the p(2 � 1)O/Ag(110) surface was directly
carried out with the nudged elastic band method.40 We
checked all TS structures with a normal mode analysis invol-
ving all degrees of freedom of the geometry optimization to
ensure that the adsorption complex exhibited exactly one
imaginary frequency.
3. Results and discussion
3.1 Hydrogen adsorption on clean Ag(111), Ag(110) and
Ag(221) surfaces
To establish a consistent data set for comparison, we started
with calculations of H2 adsorption on the clean surfaces
Ag(111), Ag(110) and Ag(221). We calculated H2 molecules
to be essentially unbound at all these surfaces; the adsorption
energy Ead was at most �2 kJ mol�1. This agrees with the
experimental observations already mentioned (section 1): H2
does not adsorb on Ag(110) at 90 K3 and adsorbs only very
weakly at Ag(111) with Ead = �15 kJ mol�1.4 Common
GGA exchange–correlation functionals are not accurate en-
ough for such weak interactions to allow a more quantitative
comparison.41
In Table 1 we collected our results for pertinent structure
parameters of various adsorption complexes of atomic hydro-
gen on the clean surfaces Ag(111), Ag(110), and Ag(221) as
well as the corresponding energies of adsorption (see also
Fig. 1).
Adsorption of H on the Ag(111) surface. On Ag(111), we
computed adsorption complexes at 3-fold hollow sites to be
most stable and confirmed by normal mode analysis that they
are local minima; we were not able to determine a preference
among fcc 1 or hcp 2 sites. The calculated adsorption energy,
�198 kJ mol�1, is essentially the same as the value obtained in
earlier slab model DF PW91 calculations, about �200 kJ
mol�1,8 and lies (per absolute values) below the experimental
estimate which sets an upper limit of �218 kJ mol�1.5
HREELS (high-resolution electron-energy-loss spectroscopy)
data are most consistent with adsorption complexes at 3-fold
hollow sites.6 Adsorption complexes of H at bridge positions 3
are slightly less stable, with a calculated adsorption energy of
�187 kJ mol�1. Computed vibrations of these complexes
feature one imaginary frequency, indicating that the bridge
sites 3 represent a TS of the diffusion of H between 3-fold
hollows 1 and 2. Top sites 4 are least favorable for atomic H
on Ag(111), with Ead = �150 kJ mol�1; a vibrational analysis
identified this structure as a saddle point with two imaginary
frequencies. The calculated binding energies of H among the
sites 1 to 4 vary by only B50 kJ mol�1 and the estimated
barrier for H diffusion between the local minima 1 and 2 via
the bridge site 3 is merely 11 kJ mol�1. One expects from these
results that atomic hydrogen exhibits a notable mobility on the
Ag(111) surface already at rather low temperatures. The
calculated H–Ag distances of the adsorption complexes H/
Ag(111), ranging from 166 to 192 pm (Table 1), show an anti-
correlation with the coordination number of the adsorbate.
Adsorption of H on the Ag(110) surface. It is somewhat
surprising that we calculated similarly strong binding of atom-
ic H at the short bridge 5 (�196 kJ mol�1) and at the long
bridge 7 (�193 kJ mol�1) of the Ag(110) surface. Both
adsorption complexes are local minima according to vibra-
tional analysis. The corresponding adsorption energies are
very close to the value computed for the 3-fold hollow sites
of Ag(111) (Table 1, Fig. 1). At the long bridge site 7, H is
located essentially at the height of the top layer Ag1 of the
substrate. The distances, H–Ag2 = 200 pm, of adsorbed H to
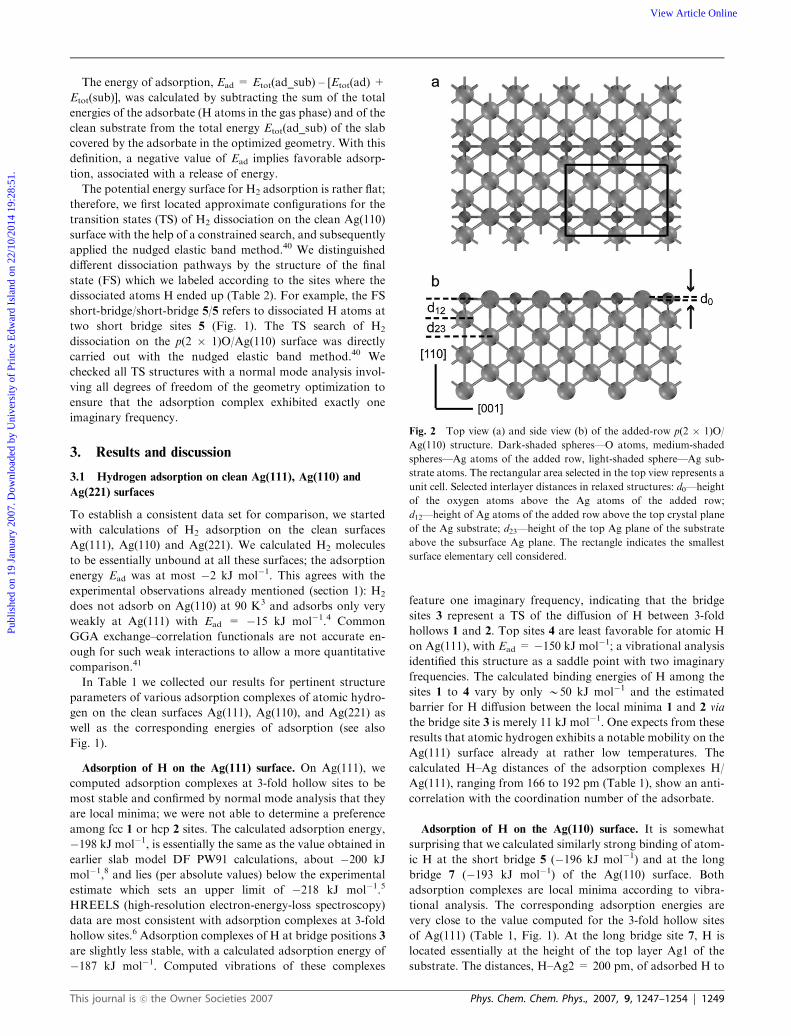
Fig. 2 Top view (a) and side view (b) of the added-row p(2 � 1)O/
Ag(110) structure. Dark-shaded spheres—O atoms, medium-shaded
spheres—Ag atoms of the added row, light-shaded sphere—Ag sub-
strate atoms. The rectangular area selected in the top view represents a
unit cell. Selected interlayer distances in relaxed structures: d0—height
of the oxygen atoms above the Ag atoms of the added row;
d12—height of Ag atoms of the added row above the top crystal plane
of the Ag substrate; d23—height of the top Ag plane of the substrate
above the subsurface Ag plane. The rectangle indicates the smallest
surface elementary cell considered.
This journal is �c the Owner Societies 2007 Phys. Chem. Chem. Phys., 2007, 9, 1247–1254 | 1249
Publ
ishe
d on
19
Janu
ary
2007
. Dow
nloa
ded
by U
nive
rsity
of
Prin
ce E
dwar
d Is
land
on
22/1
0/20
14 1
9:28
:51.
View Article Online
the Ag atoms of the second substrate layer are shorter than
those to the top-layer Ag atoms, H–Ag1 = 208 pm. This
finding may be interpreted as an adsorption complex of H
involving the four Ag atoms that form a long bridge site 7: two
atoms belong to the first layer Ag1 and the other two to the
second layer Ag2 (Fig. 1).
As suggested by experimental findings,3 we also studied
adsorption at the 3-fold hollow site 6 where H is displaced
from the short bridge 5 toward a 4-fold hollow position 8 (Fig.
1), but we were unable to find a stable structure with 1/4
surface coverage of hydrogen. At higher coverage, H atoms
may occupy 3-fold hollow sites 6 to minimize H–H repulsion
as observed experimentally at coverage values of 1/3 or
larger.3 Indeed, according to our calculations this is the case
at a hydrogen coverage of 1/2: the zig-zag ordering of hydro-
gen atoms along the [1�10] direction (corresponding to a
confirmed local minimum) is more stable than hydrogen
at the short bridge structure by 12 kJ mol�1 per H atom
(Table 1).
The 4-fold hollow site 8 binds H somewhat weaker, DEad =
�169 kJ mol�1, but it represents a saddle point with two
imaginary vibrational frequencies. In that adsorption com-
plex, the distance of H to the nearest Ag1 atom on the surface
layer, 256 pm, is much longer than the H–Ag2 contact,
178 pm, to a metal atom of the second layer; this finding
indicates that on this site H interacts predominantly with a
single Ag atom of the second layer of the substrate and the
H–Ag2 distance is just 12 pm longer than that with Ag atom of
the top sites 4 and 9. Similarly to the results for Ag(111), H
adsorption on Ag(110) was calculated to be least stable at the
top site 9, with DEad = �147 kJ mol�1 (again a saddle point
with two imaginary frequencies). In fact, the H–Ag distances
of adsorption complexes with the same coordination of H are
quite similar as well for these two surfaces (Table 1).
The similarities between the calculated results for the
Ag(111) and Ag(110) surfaces extend to the variation of the
calculated adsorption energies, which does not exceed
50 kJ mol�1 on Ag(110). To be more precise in quantifying
the propensity of H atoms to diffuse on the Ag(110) surface,
we identified the TS of H diffusion from the short bridge site 5
to the long bridge site 7 using the nudged elastic band method.
The resulting TS is less stable than the IS by only 14 kJ mol�1,
thus even more stable than the adsorption complex on the
4-fold hollow site 8. Therefore, H diffusion on Ag(110) surface
also appears to be very facile.
Adsorption of H on the Ag(221) surface. On the stepped
surface Ag(221) [4(111) � (111)], we focused on the adsorption
sites 10, 11 and 12 which are located at the step edges. When
selecting these sites, we relied on findings that less coordinated
edge atoms commonly form more active sites.38 In addition,
we considered the terrace 3-fold hollow site 13 as a reference to
characterize the mobility of the adsorbates. We confirmed that
all these sites correspond to local minima. Atomic H at the
edge hollow sites 10 and 12 as well as at the edge bridge sites 11
features very similar energy of adsorption, �198 to �202 kJ
mol�1 (Table 1, Fig. 1). These values are close to those
calculated for the most favorable sites of the surfaces
Ag(111) and Ag(110). The terrace reactivity of the Ag(221)
surface is similar to that of the (111) surface. This is mani-
fested by the energy of H adsorption on the terrace 3-fold
hollows 13, �193 kJ mol�1 that essentially matches the energy
of atomic H at the 3-fold hollow sites 1 and 2 of the Ag(111)
surface. Note that the interaction of H with the terrace site 13
is only slightly weaker than with the edge sites 10 to 12.
Consequently, we expect facile mobility of atomic H also on
this stepped Ag(221) surface, just as on the Ag(111) and
Ag(110) surfaces. Inspection of Table 1 reveals that H–Ag
distances are very similar to those of sites with the same
coordination on the other surfaces studied. Reducing the
surface coverage to 1/12 of a monolayer does not reveal any
noticeable change in the adsorption geometries and binding
energies of hydrogen atoms (Table 1).
Activation of H2 on the Ag(110) surface. Before addressing
the activation of H2 molecules on clean silver surfaces, it is
instructive to note that the present computational approach
reproduces pertinent characteristics of H2 in the gas phase,
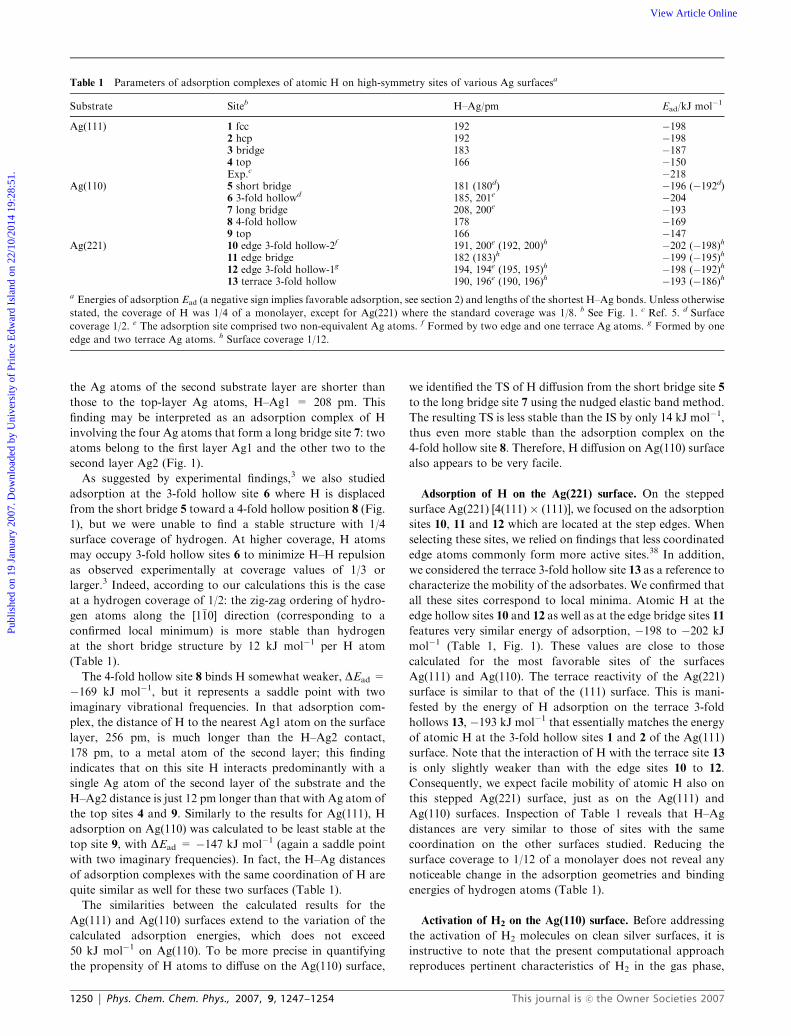
Table 1 Parameters of adsorption complexes of atomic H on high-symmetry sites of various Ag surfacesa
Substrate Siteb H–Ag/pm Ead/kJ mol�1
Ag(111) 1 fcc 192 �1982 hcp 192 �1983 bridge 183 �1874 top 166 �150Exp.c �218
Ag(110) 5 short bridge 181 (180d) �196 (�192d)6 3-fold hollowd 185, 201e �2047 long bridge 208, 200e �1938 4-fold hollow 178 �1699 top 166 �147
Ag(221) 10 edge 3-fold hollow-2f 191, 200e (192, 200)h �202 (�198)h11 edge bridge 182 (183)h �199 (�195)h12 edge 3-fold hollow-1g 194, 194e (195, 195)h �198 (�192)h13 terrace 3-fold hollow 190, 196e (190, 196)h �193 (�186)h
a Energies of adsorption Ead (a negative sign implies favorable adsorption, see section 2) and lengths of the shortest H–Ag bonds. Unless otherwise
stated, the coverage of H was 1/4 of a monolayer, except for Ag(221) where the standard coverage was 1/8. b See Fig. 1. c Ref. 5. d Surface
coverage 1/2. e The adsorption site comprised two non-equivalent Ag atoms. f Formed by two edge and one terrace Ag atoms. g Formed by one
edge and two terrace Ag atoms. h Surface coverage 1/12.
1250 | Phys. Chem. Chem. Phys., 2007, 9, 1247–1254 This journal is �c the Owner Societies 2007
Publ
ishe
d on
19
Janu
ary
2007
. Dow
nloa
ded
by U
nive
rsity
of
Prin
ce E
dwar
d Is
land
on
22/1
0/20
14 1
9:28
:51.
View Article Online
namely the binding energy, 439 kJ mol�1 vs. 436 kJ mol�1
(exp.) and the H–H bond length, 74 pm (calc. and exp.).2,15 As
already mentioned, dissociative adsorption of H2 at the three
Ag surfaces studied is an endothermic process, requiring about
40 kJ mol�1. The two more open surfaces Ag(110) and
Ag(221) do not exhibit any propensity for a more favorable
thermodynamics of H2 dissociation than the close-packed
surface Ag(111). Therefore, we explored in detail this process
at clean silver surfaces only for the example of Ag(110).
Table 2 shows pertinent calculated results for selected
reaction pathways of H2 dissociation on Ag(110): reaction
energies Er = Etot(2H_sub) � [Etot(H2) + Etot(sub)] of dis-
sociative H2 adsorption, the corresponding activation energies
Ea, and geometric parameters of the transition and final states.
As initial state, we chose a configuration where the H2
molecule practically does not interact with the substrate,
namely 300 pm above the top crystalline plane. Many combi-
nations of stable H adsorption sites seem possible as final state
of H2 dissociation because the potential energy surface of
atomic H adsorption on Ag is quite flat. We have chosen the
FS (with hydrogen coverage of 1/2) as combinations of various
stable adsorption complexes (Table 2; Fig. 1), namely the short
bridge site 5, the long bridge site 7, and 3-fold hollow site 6. All
selected FS have been shown to be local minima with the help
of a normal mode analysis. Based on these structures for
coverage 1/2, we also carried out single-point calculations at
coverage 1/3. The zig-zag FS configuration of hydrogen atoms
at 3-fold hollow sites, 6/6, is the least endothermic among the
configurations studied, with Er = 33 and 49 kJ mol�1 for
coverage of 1/2 and 1/3, respectively. Note that reducing the
surface coverage from 1/2 to 1/3 generally makes H2 dissocia-
tion slightly more endothermic except for the long-bridge/
long-bridge configuration 7/7 along one trough where the
reaction energy is essentially the same for both coverage values
(Table 2). This implies that more energy (B10 kJ mol�1) is
required for initial H2 dissociation when the surface is free of
adsorbed H, but the differences are small and within the
accuracy of the current computational method employed.
These differences can be rationalized by the resulting band
structure and nearest-neighbors interaction among the adsor-
bates. In the final states 5/5, 6/6, 7/7, and 5/6 at 1/2 coverage,
the nearest-neighbor distances within a unit cell and between
adjacent unit cells are identical; in other words, the adsorbates
form chain-like structures over the crystal plane, which results
in an additional stability gain. When the coverage is reduced,
nearest-neighbor distances among adsorbates in adjacent unit
cells increase, resulting in a reduced stability of the final state,
hence a more endothermic reaction. This effect is substantial
for the complexes 6/6 and 5/6, but hardly noticeable for the
complexes 5/5 and 7/7.
The lowest activation energies calculated for H2 dissociation
on Ag(110) with surface coverage at 1/2 is about 125 kJ mol�1.
This value is comparable to the reported lowest activation
energies of 106 kJ mol�1 on the Ag(100) surface,8 but notably
higher than on other transitional metal surface, e.g. Pt where a
vanishing activation barrier was calculated.42 Reducing the
surface coverage from 1/2 to 1/3 does not change the activa-
tion energies by more than 5 kJ mol�1 for all the configura-
tions studied. The changes of the activation energies with
coverage can be taken as uncertainty estimates of the results
of the current model strategy. Hence, on the basis of the
present results, one should consider the activation energies of
the final states 5/5, 5/6, 6/6, and 5/7 as very similar, an average
at B125 kJ mol�1 (see above). The present results are con-
sistent with the low dissociation probability of H2 determined
experimentally at silver surfaces (see section 1).5
In summary, we calculated H2 dissociation to be kinetically
and thermodynamically unfavorable on clean surfaces of
silver. Thus, other sites are likely responsible for the activation
of hydrogen on silver, e.g. reaction centers induced by the
presence of surface oxygen species.
3.2 Hydrogen adsorption and activation on p(n� 1)O/Ag(110)
surfaces
We begin our discussion with the surface p(2 � 1)O/Ag(110),
which is characterized by the smallest unit cell among the
(n � 1) reconstructed added-row structures. The surface for
n = 2 is sketched in Fig. 2: added-row Ag atoms are
positioned at 4-fold hollow sites 8 of the non-reconstructed
Ag(110) surface and O atoms occupy short bridge sites 5 on it.
In Table 3, we compare calculated geometric parameters of
the reconstructed p(2 � 1)O/Ag(110) surface with experimen-
tal data26–28 and results of previously reported calcula-
tions.43,44 The Ag and O atoms of the added row apparently
form almost linear chains; we computed the O atoms to be
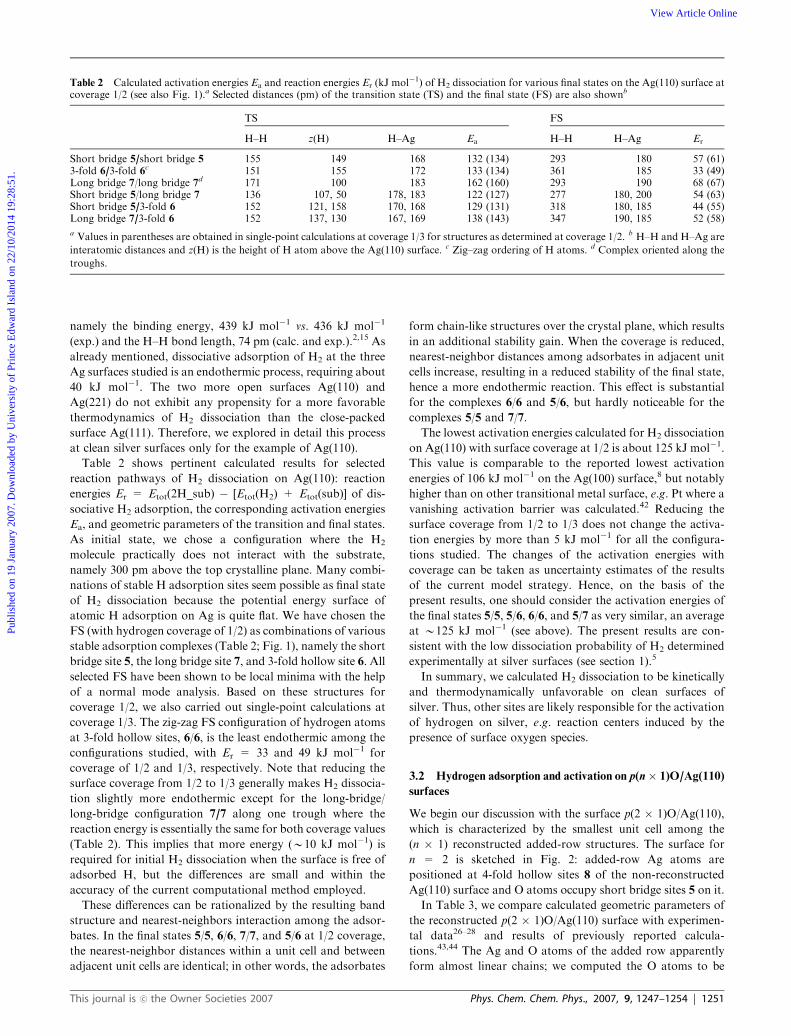
Table 2 Calculated activation energies Ea and reaction energies Er (kJ mol�1) of H2 dissociation for various final states on the Ag(110) surface atcoverage 1/2 (see also Fig. 1).a Selected distances (pm) of the transition state (TS) and the final state (FS) are also shownb
TS FS
H–H z(H) H–Ag Ea H–H H–Ag Er
Short bridge 5/short bridge 5 155 149 168 132 (134) 293 180 57 (61)3-fold 6/3-fold 6
c 151 155 172 133 (134) 361 185 33 (49)Long bridge 7/long bridge 7d 171 100 183 162 (160) 293 190 68 (67)Short bridge 5/long bridge 7 136 107, 50 178, 183 122 (127) 277 180, 200 54 (63)Short bridge 5/3-fold 6 152 121, 158 170, 168 129 (131) 318 180, 185 44 (55)Long bridge 7/3-fold 6 152 137, 130 167, 169 138 (143) 347 190, 185 52 (58)
a Values in parentheses are obtained in single-point calculations at coverage 1/3 for structures as determined at coverage 1/2. b H–H and H–Ag are
interatomic distances and z(H) is the height of H atom above the Ag(110) surface. c Zig–zag ordering of H atoms. d Complex oriented along the
troughs.
This journal is �c the Owner Societies 2007 Phys. Chem. Chem. Phys., 2007, 9, 1247–1254 | 1251
Publ
ishe
d on
19
Janu
ary
2007
. Dow
nloa
ded
by U
nive
rsity
of
Prin
ce E
dwar
d Is
land
on
22/1
0/20
14 1
9:28
:51.
View Article Online
displaced only 7 pm (d0) from the axis of the added Ag atoms
in the direction away from the substrate, in agreement
with the geometry of the photoelectron diffraction (PED)
study (Table 3), which is particularly sensitive to the para-
meter d0.26 The only notable difference with respect to the
PED experiment is the computed distance d23, 144 pm, which
is B10 pm (longer) out of the experimentally determined
range. Probably, for a more quantitative description of the
d23 values one should consider a thicker slab and allow
relaxation of more surface layers. Our results agree quite well
with all recently communicated experimentally derived struc-
tures26–28 and with the structure of a DF PW91 slab model
study.44
However, the structural characteristics obtained in an ear-
lier DF LDA model investigation43 (using the Perdew-Zunger
exchange–correlation functional45) differ considerably, but
they do so also from the values of other studies listed in Table
3. Most noticeable is the deviation of the d0 value, which is
B50 pm longer in the previous LDA work43 than in this work
and a former DF study,44 the latter two carried out with the
PW91 functional. At the same time the d12 value of ref. 43 is
B20 pm shorter compared to our PW91 result.
To rationalize these discrepancies, we also optimized the
structure of the surface p(2 � 1)O/Ag(110) at the LDA level45
(Table 3). Indeed, our LDA results agree only qualitatively
with those of the previous LDA calculation.43 Also, in our
LDA study the distance d0 is longer and the distance d12shorter compared to our PW91 results. Likely, the differences
between the two LDA structures have to be attributed to
different representations of the Kohn–Sham orbitals, namely
by localized functions in ref. 43 and the PAW technique in the
present study.34,35 The differences between the present LDA
and GGA (PW91) results are somewhat surprising as one
often observes that LDA structures are closer to experiment
than the corresponding PW91 structures. We also explored
whether a relaxation of the substrate is able to affect the
structure of the added row. However, when the top two layers
of the Ag substrate were allowed to relax together with the
added row, we found only very small structural changes: the
interlayer distance d0 changed from 7 to 8 pm, distance d12from 161 to 165 pm, and distance d23 from 144 to 139 pm (see
Table 3 and Fig. 2b).
The optimized structure of the added row surface system
changed only in a minor way when the interval between the
added rows increases, i.e. on going from the p(2 � 1)O/
Ag(110) to the p(4 � 1)O/Ag(110) structure.44 The corre-
sponding change of the calculated vibrational frequency of
O atoms was about 10 cm�1, in line with experimental
estimates of the effect of reduced oxygen coverage.44 This
implies that the adsorption propensity and, thus, the reactivity
of the Ag–O chains should not change significantly at a lower
oxygen coverage. In the following, we will corroborate this
expectation for the case of hydrogen adsorption.
Compared to a clean Ag(110) surface, a reconstructed
added-row p(n � 1)O/Ag(110) surface offers two new types
of positions for the adsorption of atomic hydrogen, on O and
Ag atoms of the added rows. We calculated the energy of H
adsorption on-top of an added-row Ag center of p(2 � 1)O/
Ag(110) at �77 kJ mol�1; in that structure, each Ag center of
the added rows is occupied with one atom H. The significantly
weaker interaction energy indicates a notable destabilization
compared to on-top adsorption complexes of the oxygen-free
surfaces Ag(110) and Ag(111), with Ead of about �150 kJ
mol�1 (Table 1). In contrast, the interaction with O centers
was calculated to be very strong, Ead = �331 kJ mol�1, in the
system with 1H : 1O where each of the O centers forms an H
adsorption complex. For a system with the lower coverage
1H : 2O, we calculated Ead = �317 kJ mol�1. This trend in
binding energies is likely due to the more flexible structure of
the added Ag–O row, when the O atoms are fully hydroge-
nated compared to the more rigid added Ag–O structure where
some O atoms are not hydrogenated. Note that, at 1H : 1O
coverage, all O atoms are bound to two Ag atoms of the added
row, whereas the O centers not hydrogenated at 2H : 3O
coverage are bound to two substrate Ag atoms and two added
row Ag atoms (Fig. 3).
On going from the (2 � 1) to the (3 � 1) and (4� 1) periodic
structures, where the distance between the added rows in-
creases, the adsorption energy at full coverage, 1H : 1O,
changes only negligibly, from �331 kJ mol�1 to �328 and
�329 kJ mol�1, respectively. Indeed, even in the (2 � 1)
structure the distance between neighboring added rows,
585 pm, is large enough to prevent any noticeable adsorbate–
adsorbate interaction between different rows. Thus, at var-
iance with clean silver surfaces, dissociation of H2 molecules
involving oxygen centers of added rows is exothermic by more
than 200 kJ mol�1.
Hydrogen adsorption induces significant changes in the
structure of the added row. Oxygen centers with hydrogen
adsorbed shift away from the substrate (Fig. 3); the Ag–O
distance increases from 207 pm, without adsorbate, to 226 pm
(Table 4).
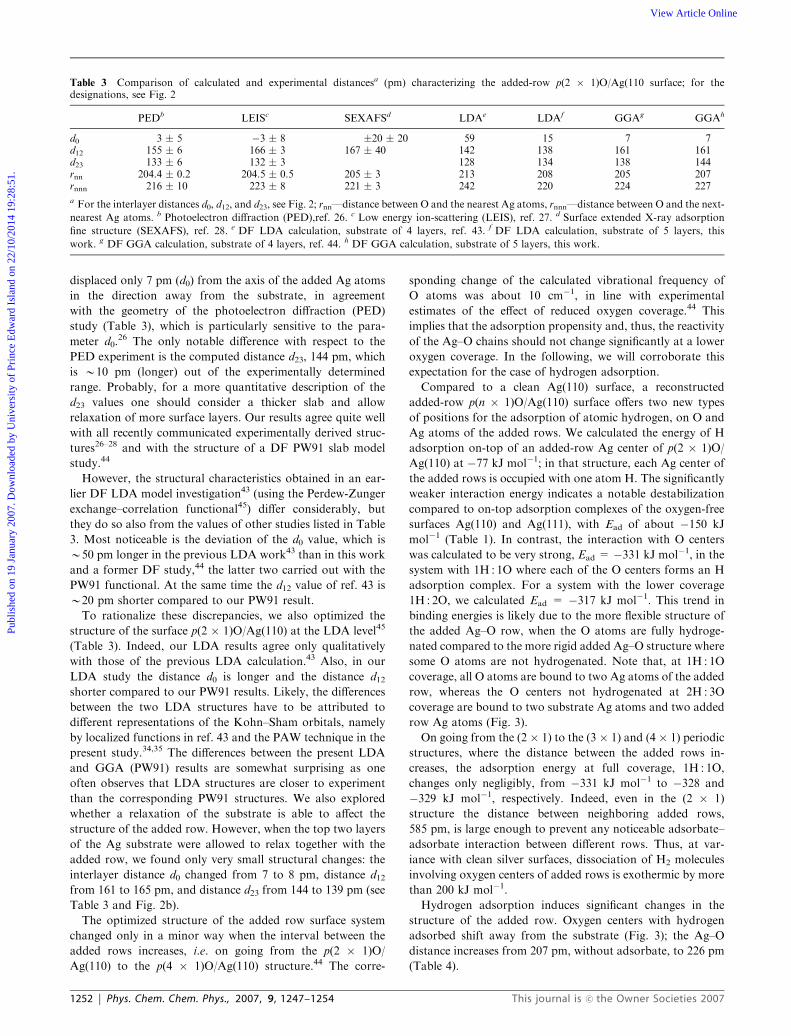
Table 3 Comparison of calculated and experimental distancesa (pm) characterizing the added-row p(2 � 1)O/Ag(110 surface; for thedesignations, see Fig. 2
PEDb LEISc SEXAFSd LDAe LDAf GGAg GGAh
d0 3 � 5 �3 � 8 �20 � 20 59 15 7 7d12 155 � 6 166 � 3 167 � 40 142 138 161 161d23 133 � 6 132 � 3 128 134 138 144rnn 204.4 � 0.2 204.5 � 0.5 205 � 3 213 208 205 207rnnn 216 � 10 223 � 8 221 � 3 242 220 224 227
a For the interlayer distances d0, d12, and d23, see Fig. 2; rnn—distance between O and the nearest Ag atoms, rnnn—distance between O and the next-
nearest Ag atoms. b Photoelectron diffraction (PED),ref. 26. c Low energy ion-scattering (LEIS), ref. 27. d Surface extended X-ray adsorption
fine structure (SEXAFS), ref. 28. e DF LDA calculation, substrate of 4 layers, ref. 43. f DF LDA calculation, substrate of 5 layers, this
work. g DF GGA calculation, substrate of 4 layers, ref. 44. h DF GGA calculation, substrate of 5 layers, this work.
1252 | Phys. Chem. Chem. Phys., 2007, 9, 1247–1254 This journal is �c the Owner Societies 2007
Publ
ishe
d on
19
Janu
ary
2007
. Dow
nloa
ded
by U
nive
rsity
of
Prin
ce E
dwar
d Is
land
on
22/1
0/20
14 1
9:28
:51.
View Article Online
Finally, we will discuss the reaction path for H2 dissociation
on Ag–O added rows of the p(n � 1)O/Ag(110) surfaces. We
begin with the p(2 � 1)O/Ag(110) structure which features the
most compact unit cell. H2 molecules physisorb on this sur-
face; the calculated energy of adsorption, Ead B �2 kJ mol�1,
is negligible. Therefore, we represented the initial state (IS)
of H2 dissociation (and the energy reference) by almost free H2
molecules at 300 pm above the added Ag–O rows (Fig. 3).
According to our calculations, the activation of H2 on the
added row proceeds in two steps (Fig. 3). First, H2 dissociates
and the two atomic H species bind to neighboring O and Ag
atoms of an added row. The calculated activation energy of
this dissociation step is 71 kJ mol�1 relative to the above
mentioned IS where H2 is essentially free (Table 4). This
activation barrier is reduced almost to half of that calculated
for H2 dissociation on the clean Ag(110) surface (Table 2). The
H–H distance in the corresponding transition state TSdiss,
122 pm, elongates to 231 pm in the intermediate state after
complete splitting of the H–H bond, to better match the Ag–O
distances of 207–226 pm (Table 4). That intermediate state is
destabilized by 32 kJ mol�1 with respect to the IS, due to the
relatively weak binding, �77 kJ mol�1 (see above), of an H
atom at an Ag center of the added row. In the second step, this
weakly bound H atom moves from Ag to a neighboring
(vacant) O center. The activation energy of this diffusion
transition state TSdiff is very small, only 12 kJ mol�1. As
already discussed, the resulting FS lies 224 kJ mol�1 lower in
energy than the IS (Table 4).
To examine an eventual effect of adsorbate–adsorbate inter-
action, we also studied a model with lower coverage of
adsorbed hydrogen—one H2 molecule per (2 � 3) unit cell,
where in the end one out of three O adsorption sites remains
unoccupied (Fig. 3). Table 4 shows that the reaction path is
affected only slightly, both structurally and energetically, by
this reduction of the hydrogen coverage along the added row.
In addition, we estimated the effect of a reduced oxygen
coverage, by studying H2 activation on the structure p(3 � 1)
O/Ag(110) with a (3 � 2) unit cell where the distance between
the added rows is increased; here, we returned to a model
where in the final state all oxygen centers are occupied by
hydrogen atoms. As expected, also in this case, we did not find
any essential changes of the characteristics of the reaction path
(Table 4, values in parentheses). Thus, the reaction profile is
almost independent of the hydrogen coverage along the added
rows and the distance between the added rows. Therefore, we
propose to generalize the present mechanism of H2 activation
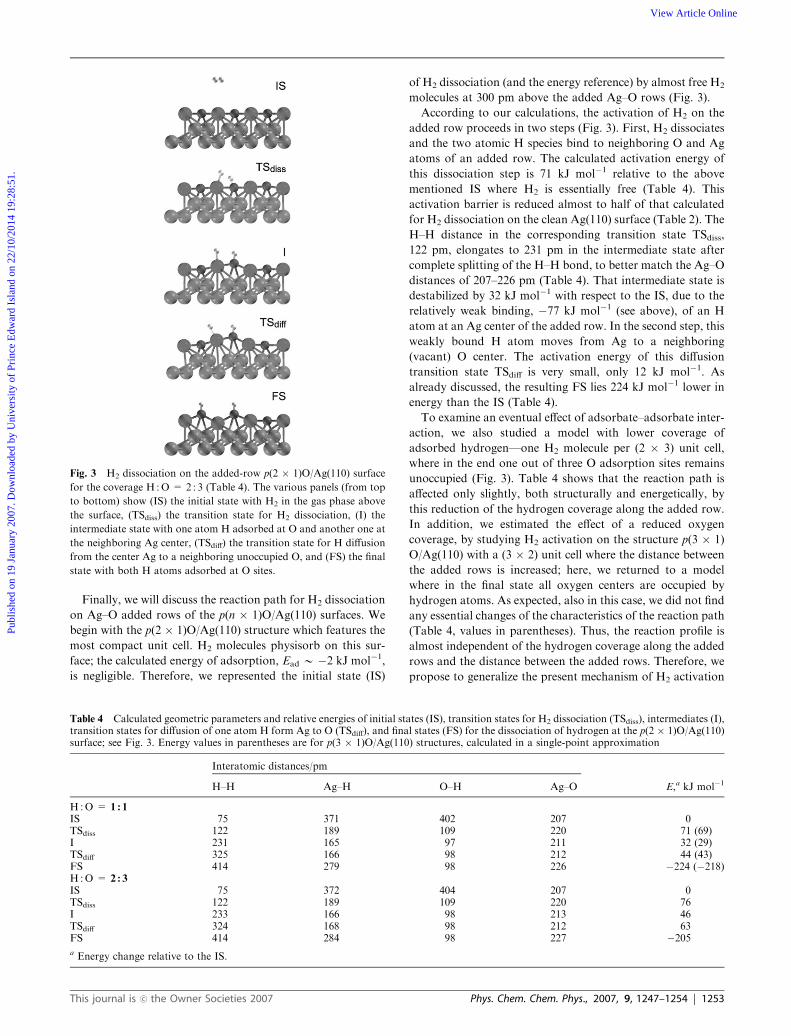
Fig. 3 H2 dissociation on the added-row p(2 � 1)O/Ag(110) surface
for the coverage H :O = 2 : 3 (Table 4). The various panels (from top
to bottom) show (IS) the initial state with H2 in the gas phase above
the surface, (TSdiss) the transition state for H2 dissociation, (I) the
intermediate state with one atom H adsorbed at O and another one at
the neighboring Ag center, (TSdiff) the transition state for H diffusion
from the center Ag to a neighboring unoccupied O, and (FS) the final
state with both H atoms adsorbed at O sites.
Table 4 Calculated geometric parameters and relative energies of initial states (IS), transition states for H2 dissociation (TSdiss), intermediates (I),transition states for diffusion of one atom H form Ag to O (TSdiff), and final states (FS) for the dissociation of hydrogen at the p(2 � 1)O/Ag(110)surface; see Fig. 3. Energy values in parentheses are for p(3 � 1)O/Ag(110) structures, calculated in a single-point approximation
Interatomic distances/pm
H–H Ag–H O–H Ag–O E,a kJ mol�1
H :O = 1 : 1
IS 75 371 402 207 0TSdiss 122 189 109 220 71 (69)I 231 165 97 211 32 (29)TSdiff 325 166 98 212 44 (43)FS 414 279 98 226 �224 (�218)H :O = 2 : 3
IS 75 372 404 207 0TSdiss 122 189 109 220 76I 233 166 98 213 46TSdiff 324 168 98 212 63FS 414 284 98 227 �205a Energy change relative to the IS.
This journal is �c the Owner Societies 2007 Phys. Chem. Chem. Phys., 2007, 9, 1247–1254 | 1253
Publ
ishe
d on
19
Janu
ary
2007
. Dow
nloa
ded
by U
nive
rsity
of
Prin
ce E
dwar
d Is
land
on
22/1
0/20
14 1
9:28
:51.
View Article Online
also to very low oxygen coverage, as long as local fragments
resembling added-row structures are formed.
4. Conclusions
We studied the activation of H2 on clean silver surfaces and on
a model surface pre-covered by oxygen. Using a density
functional method and a periodic slab models, we investigated
the adsorption of atomic hydrogen on the surfaces Ag(111),
Ag(110), and Ag(221) as well as on added-row structures
p(n � 1)O/Ag(110). According to these computational results,
the dissociation of H2 is thermodynamically (endothermic by
B40 kJ mol�1) and kinetically (activation barrier about 125 kJ
mol�1) unfavorable on clean silver surfaces. In contrast,
dissociation of H2 on the –Ag–O– added-row chains of
reconstructed p(n � 1)O/Ag(110) surfaces is highly exothermic
(by 200–220 kJ mol�1) and proceeds in two steps with low
activation barriers: (i) dissociation of H2 on an Ag–O pair with
an activation energy of B70 kJ mol�1, and (ii) diffusion of
hydrogen atoms from silver to more favorable neighboring
vacant oxygen positions with an activation barrier of B10 kJ
mol�1. On the basis of these results, the presence of atomic
oxygen species on silver surfaces seems essential for their
propensity to activate molecular hydrogen.
Acknowledgements
We thank Dr M. Bron and Prof. P. Claus for stimulating
discussions. Dr Z.-X. Chen provided advice during the initial
stage of the project. K.H.L. is grateful to Deutscher Aka-
demischer Austauschdienst for a fellowship. This study was
supported by Deutsche Forschungsgemeinschaft and Fonds
der Chemischen Industrie (Germany). K.M.N. acknowledges
financial support by the Spanish Ministry of Education and
Science (grants CTQ2005-08459-CO2-01, UNBA05-33-001)
and the Generalitat de Catalunya (grant 2005SGR-00697).
References
1 L. Schlapbach and A. Zuttel, Nature, 2001, 414, 353.2 Ph. Avouris, D. Schmeisser and J. E. Demuth, Phys. Rev. Lett.,1982, 48, 199.
3 P. T. Sprunger and E. W. Plummer, Phys. Rev. B, 1993, 48, 14436.4 K. Christmann, Surf. Sci. Rep., 1988, 9, 1.5 X. Zhou, J. M. White and B. E. Koel, Surf. Sci., 1989, 218, 201.6 G. Lee and E. W. Plummer, Phys. Rev. B, 1995, 51, 7250.7 C. Mijoule and V. Russier, Surf. Sci., 1991, 254, 329.8 A. Eichler, G. Kresse and J. Hafner, Surf. Sci., 1998, 397, 116.9 J. Greeley and M. Mavrikakis, J. Phys. Chem. B, 2005, 109, 3460.
10 R. A. Van Santen and H. P. C. E. Kuipers, Adv. Catal., 1987, 35,265.
11 P. Claus, Top. Catal., 1998, 5, 52.12 M. Bron and P. Claus, personal communication.13 J. P. Perdew, J. A. Chevary, S. H. Vosko, K. A. Jackson, M. R.
Pederson, D. J. Singh and C. Fiolhais, Phys. Rev. B, 1992, 46,6671.
14 B. Hammer, L. B. Hansen and J. K. Nørskov, Phys. Rev. B, 1999,59, 7413.
15 CRC Handbook of Chemistry and Physics, ed. D. R. Lide, CRCPress, London, 77th edn, 1996.
16 J. P. Perdew, K. Burke and M. Ernzerhof, Phys. Rev. Lett., 1996,77, 3865.
17 P. Claus, Appl. Catal. A, 2005, 291, 222.18 S. Linic and M. A. Barteau, J. Catal., 2003, 214, 200.19 C. Stegelmann, N. C. Schiodt, C. T. Campbell and P. Stoltze, J.
Catal., 2004, 221, 630.20 V. I. Bukhtiyarov, M. Havecker, V. V. Kaichev, A. Knop-Gericke,
R. W. Mayer and R. Schlogl, Phys. Rev. B, 2003, 67, 235422.21 S. A. Tan, R. B. Grant and R. M. Lambert, Appl. Catal., 1987, 31,
159.22 J. Schnadt, A. Michaelides, J. Knudsen, R. T. Vang, K. Reuter, M.
Lægsgaard, M. Scheffler and F. Besenbacher, Phys. Rev. Lett.,2006, 96, 146101.
23 M. Schmid, A. Reicho, A. Stierle, I. Costina, J. Klikovits, P.Kostelnik, O. Dubay, G. Kresse, J. Gustafson, E. Lungren, J. N.Andersen, H. Dosch and P. Varga, Phys. Rev. Lett., 2006, 96,146102.
24 C. T. Campbell and M. T. Paffett, Surf. Sci., 1984, 143, 517.25 C. T. Campbell, Surf. Sci., 1985, 157, 43.26 M. Pascal, C. L. A. Lamont, P. Baumgartel, R. Terborg, J. T.
Hoeft, O. Schaff, M. Polcik, A. M. Bradshaw, R. L. Toomes andD. P. Woodruff, Surf. Sci., 2000, 464, 83.
27 M. Canepa, P. Cantini, F. Fossa, L. Mattera and S. Terreni, Phys.Rev. B, 1993, 47, 15823.
28 L. Becker, S. Aminpirooz, A. Schmalz, B. Hillert, M. Pedio andJ. Haase, Phys. Rev. B, 1991, 44, 13655.
29 K. Berge and A. Goldmann, Surf. Sci., 2003, 540, 343.30 O. Nakagoe, K. Watanabe, N. Takagi and Y. Matsumoto, J. Phys.
Chem. B, 2005, 109, 14536.31 G. Kresse and J. Furthmuller, Phys. Rev. B, 1996, 54, 11169.32 G. Kresse and J. Hafner, Phys. Rev. B, 1993, 47, 558.33 G. Kresse and J. Furthmuller, Comput. Mat. Sci., 1996, 6, 15.34 P. E. Blochl, Phys. Rev. B, 1994, 50, 17953.35 G. Kresse and D. Joubert, Phys. Rev. B, 1999, 59, 1758.36 H. J. Monkhorst and J. D. Pack, Phys. Rev. B, 1976, 13, 5188.37 M. Methfessel and A. T. Paxton, Phys. Rev. B, 1989, 40, 3616.38 Z.-X. Chen, K. H. Lim, K. M. Neyman and N. Rosch, J. Phys.
Chem. B, 2005, 109, 4568.39 K. H. Lim, Z.-X. Chen, K. M. Neyman and N. Rosch, Chem.
Phys. Lett., 2006, 420, 60.40 G. Mills, H. Jonsson and G. K. Schenter, Surf. Sci., 1995, 324, 305.41 W. Koch and M. C. Holthausen, A Chemist’s Guide to Density
Functional Theory, 2nd edn, Wiley-VCH, Weinheim, 2002.42 S. Kandoi, A. A. Goklale, L. C. Grabow, J. A. Dumesic and M.
Mavrikakis, Catal. Lett., 2004, 93, 93.43 T. Schimizu and M. Tsukada, Surf. Sci., 1993, 295, L1017.44 H. Katagiri, T. Uda and K. Terakura, Surf. Sci., 1999, 424, 322.45 J. Perdew and A. Zunger, Phys. Rev. B, 1981, 23, 5048.
1254 | Phys. Chem. Chem. Phys., 2007, 9, 1247–1254 This journal is �c the Owner Societies 2007
Publ
ishe
d on
19
Janu
ary
2007
. Dow
nloa
ded
by U
nive
rsity
of
Prin
ce E
dwar
d Is
land
on
22/1
0/20
14 1
9:28
:51.
View Article Online