Embed Size (px)
Citation preview
Supporting Information on:
A comprehensive study on the cell chemistry
of the sodium superoxide (NaO2) battery with
ether based electrolyte
Pascal Hartmann1, Conrad L. Bender
1, Joachim Sann
1, Anna Katharina Dürr
2, Martin Jansen
3,
Jürgen Janek1* and Philipp Adelhelm
1*
1 Physikalisch-Chemisches Institut, Justus-Liebig-Universität Gießen, Heinrich-Buff-Ring 58,
35392 Gießen, Germany
2 BASF SE, 67056 Ludwigshafen, Germany
3 Max-Planck-Institut für Festkörperforschung, Heisenbergstrasse 1, D-70569 Stuttgart,
Germany
Physikalisch-Chemisches Institut, Justus-Liebig-Universität Gießen, Heinrich-Buff-Ring 58,
35392 Gießen, Germany
* Corresponding Authors: Jürgen Janek, [email protected]; Philipp
Adelhelm, [email protected]
Electronic Supplementary Material (ESI) for Physical Chemistry Chemical PhysicsThis journal is © The Owner Societies 2013
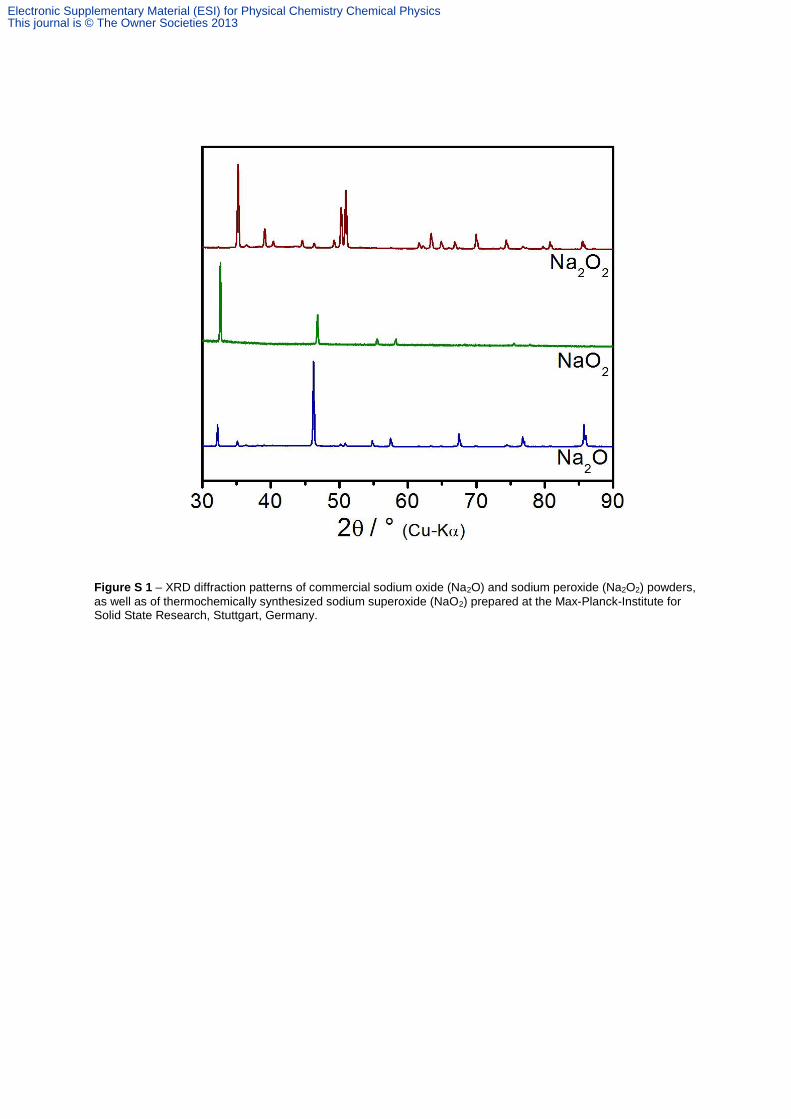
Figure S 1 – XRD diffraction patterns of commercial sodium oxide (Na2O) and sodium peroxide (Na2O2) powders,
as well as of thermochemically synthesized sodium superoxide (NaO2) prepared at the Max-Planck-Institute for Solid State Research, Stuttgart, Germany.
Electronic Supplementary Material (ESI) for Physical Chemistry Chemical PhysicsThis journal is © The Owner Societies 2013
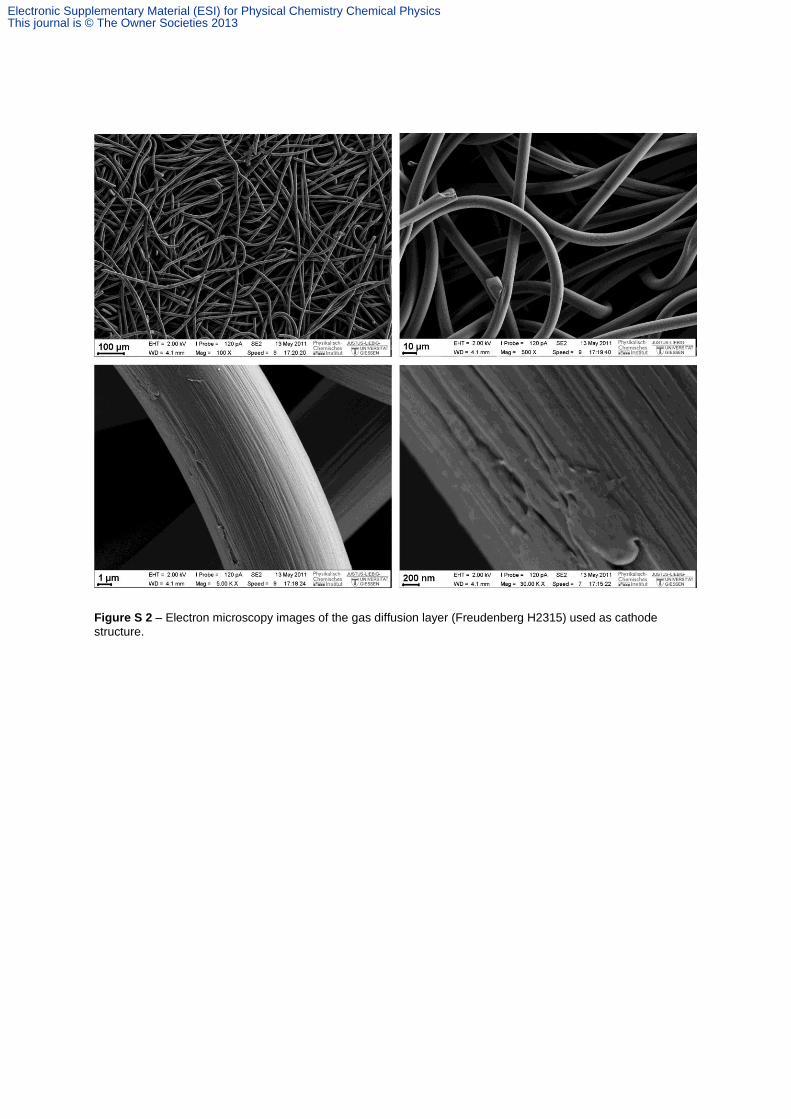
Figure S 2 – Electron microscopy images of the gas diffusion layer (Freudenberg H2315) used as cathode
structure.
Electronic Supplementary Material (ESI) for Physical Chemistry Chemical PhysicsThis journal is © The Owner Societies 2013
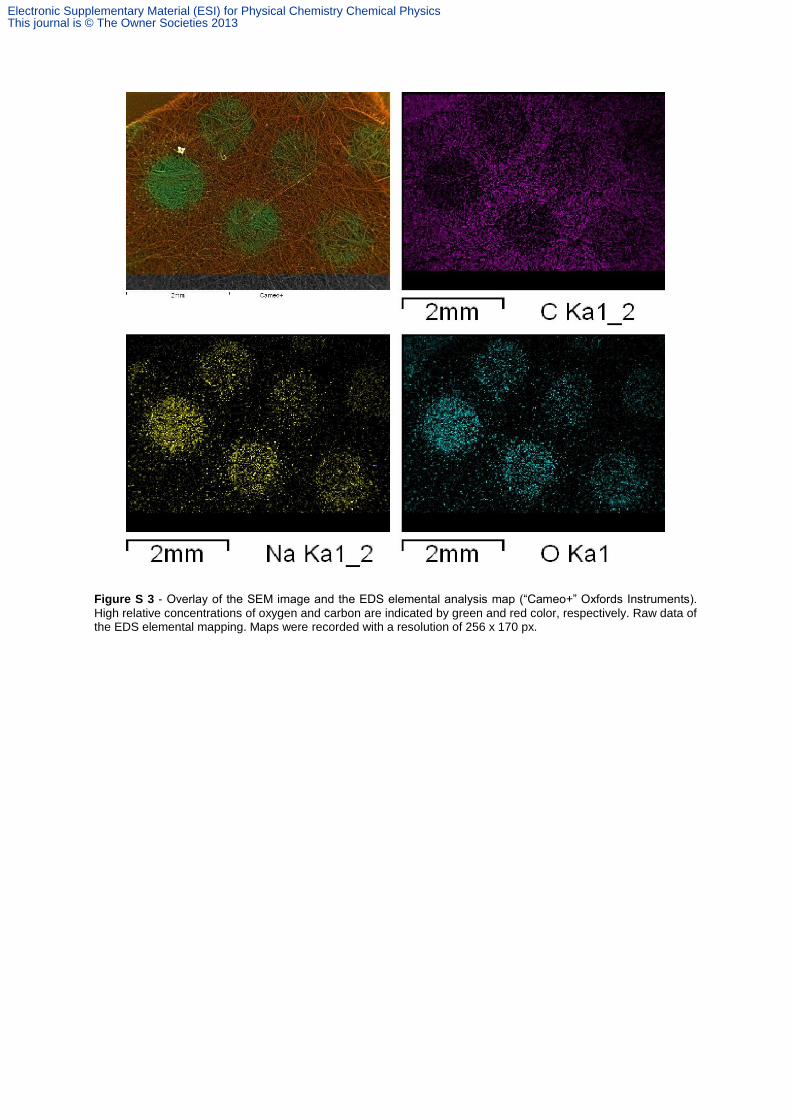
Figure S 3 - Overlay of the SEM image and the EDS elemental analysis map (“Cameo+” Oxfords Instruments).
High relative concentrations of oxygen and carbon are indicated by green and red color, respectively. Raw data of the EDS elemental mapping. Maps were recorded with a resolution of 256 x 170 px.
Electronic Supplementary Material (ESI) for Physical Chemistry Chemical PhysicsThis journal is © The Owner Societies 2013
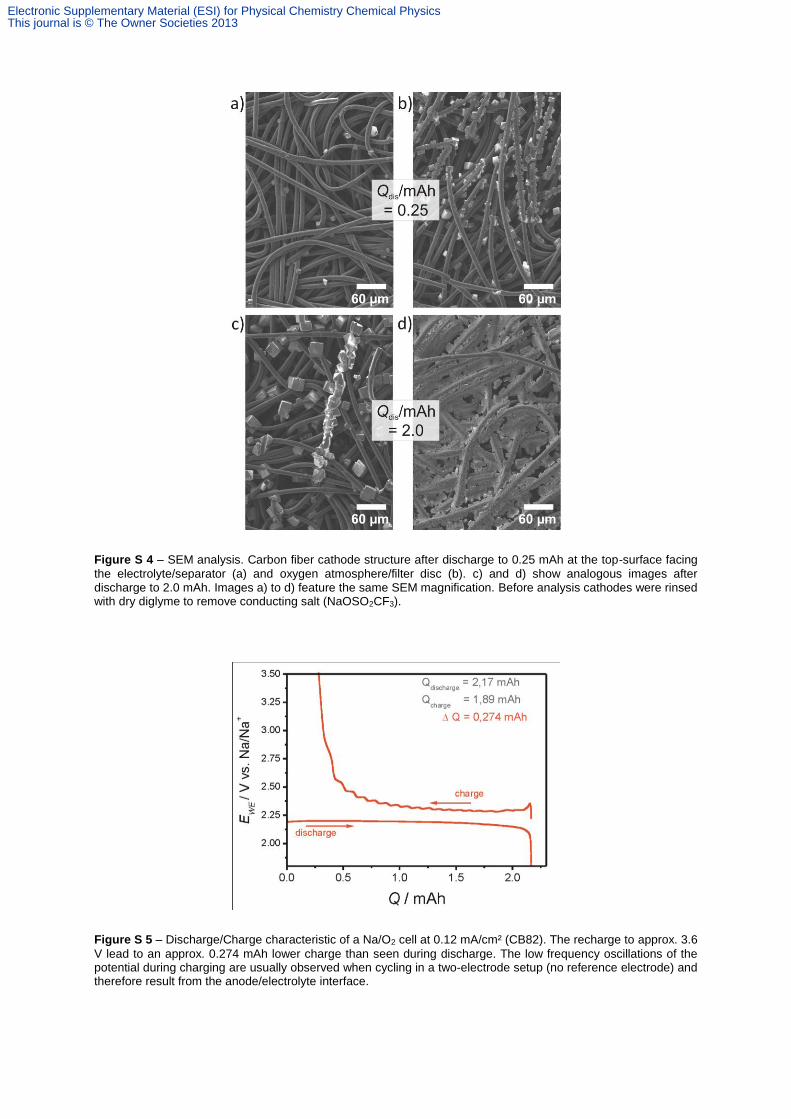
Figure S 4 – SEM analysis. Carbon fiber cathode structure after discharge to 0.25 mAh at the top-surface facing
the electrolyte/separator (a) and oxygen atmosphere/filter disc (b). c) and d) show analogous images after discharge to 2.0 mAh. Images a) to d) feature the same SEM magnification. Before analysis cathodes were rinsed with dry diglyme to remove conducting salt (NaOSO2CF3).
Figure S 5 – Discharge/Charge characteristic of a Na/O2 cell at 0.12 mA/cm² (CB82). The recharge to approx. 3.6
V lead to an approx. 0.274 mAh lower charge than seen during discharge. The low frequency oscillations of the potential during charging are usually observed when cycling in a two-electrode setup (no reference electrode) and therefore result from the anode/electrolyte interface.
Electronic Supplementary Material (ESI) for Physical Chemistry Chemical PhysicsThis journal is © The Owner Societies 2013
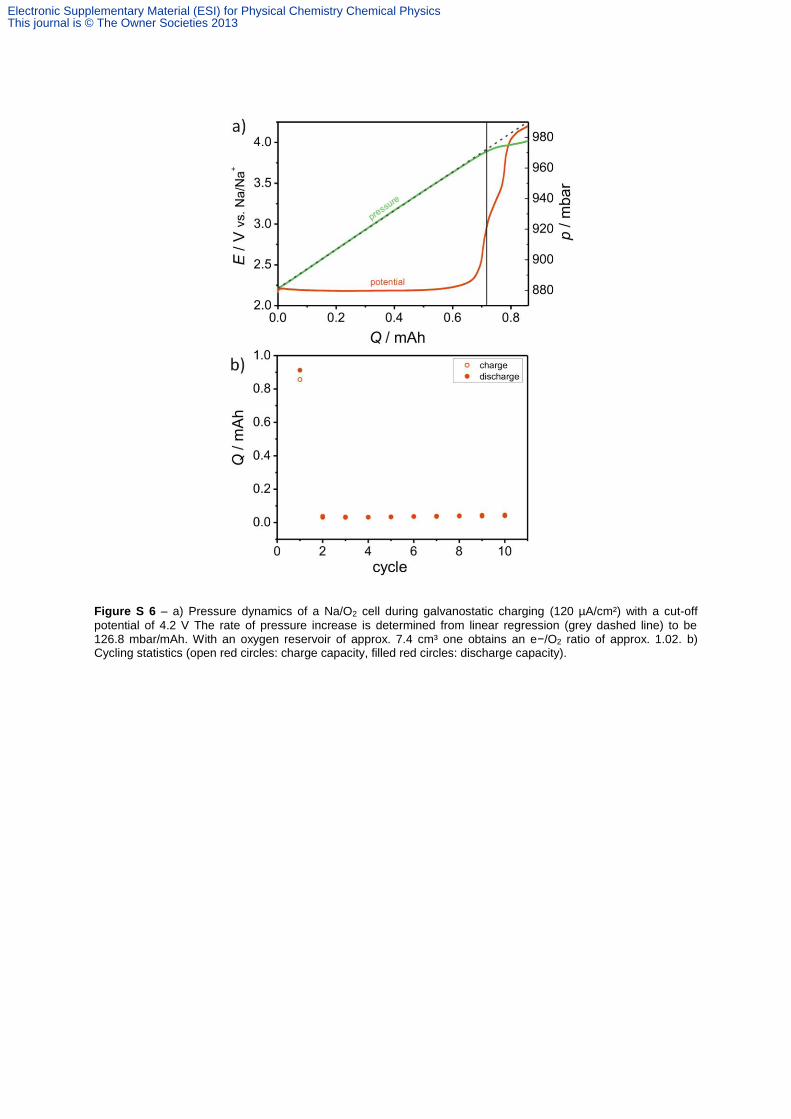
Figure S 6 – a) Pressure dynamics of a Na/O2 cell during galvanostatic charging (120 µA/cm²) with a cut-off
potential of 4.2 V The rate of pressure increase is determined from linear regression (grey dashed line) to be 126.8 mbar/mAh. With an oxygen reservoir of approx. 7.4 cm³ one obtains an e−/O2 ratio of approx. 1.02. b) Cycling statistics (open red circles: charge capacity, filled red circles: discharge capacity).
Electronic Supplementary Material (ESI) for Physical Chemistry Chemical PhysicsThis journal is © The Owner Societies 2013
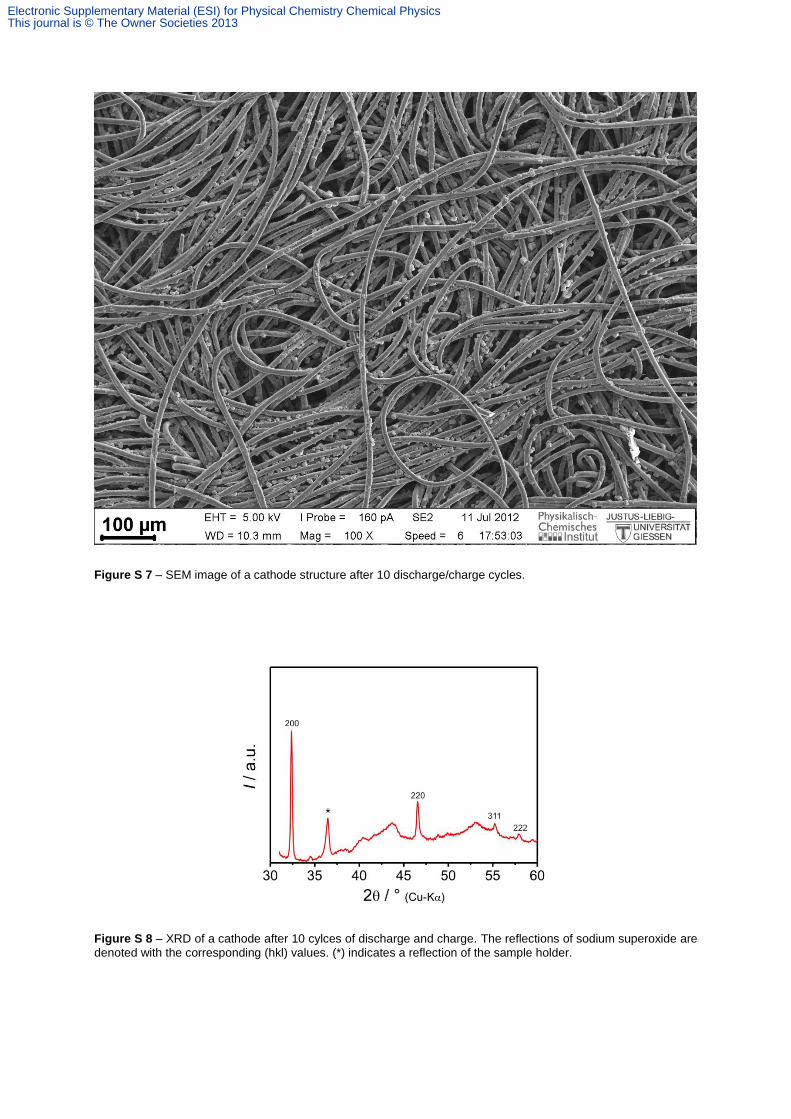
Figure S 7 – SEM image of a cathode structure after 10 discharge/charge cycles.
Figure S 8 – XRD of a cathode after 10 cylces of discharge and charge. The reflections of sodium superoxide are
denoted with the corresponding (hkl) values. (*) indicates a reflection of the sample holder.
Electronic Supplementary Material (ESI) for Physical Chemistry Chemical PhysicsThis journal is © The Owner Societies 2013
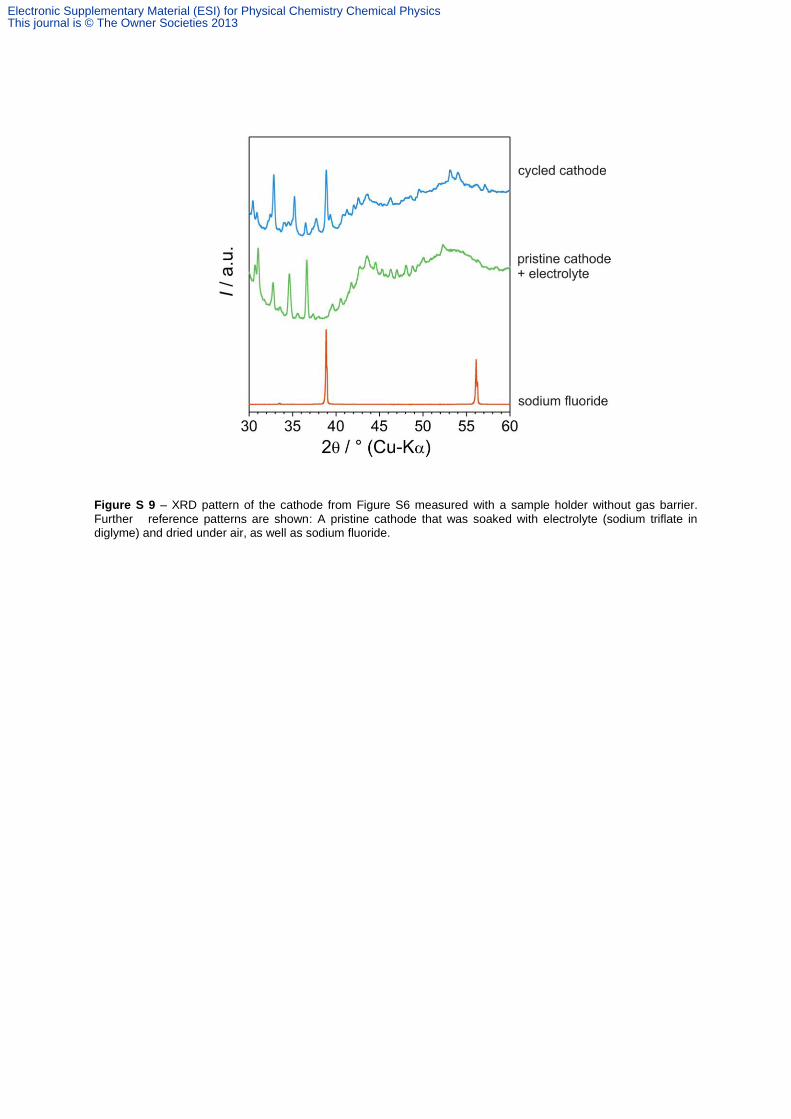
Figure S 9 – XRD pattern of the cathode from Figure S6 measured with a sample holder without gas barrier.
Further reference patterns are shown: A pristine cathode that was soaked with electrolyte (sodium triflate in diglyme) and dried under air, as well as sodium fluoride.
Electronic Supplementary Material (ESI) for Physical Chemistry Chemical PhysicsThis journal is © The Owner Societies 2013
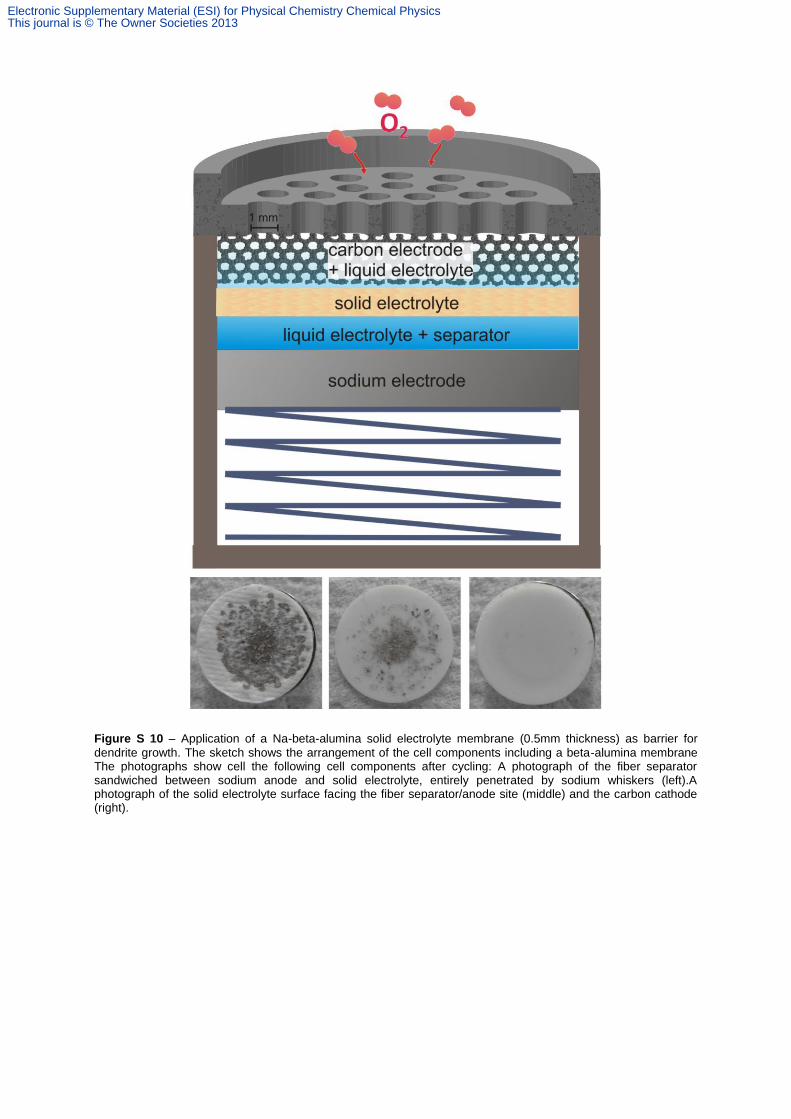
Figure S 10 – Application of a Na-beta-alumina solid electrolyte membrane (0.5mm thickness) as barrier for
dendrite growth. The sketch shows the arrangement of the cell components including a beta-alumina membrane The photographs show cell the following cell components after cycling: A photograph of the fiber separator sandwiched between sodium anode and solid electrolyte, entirely penetrated by sodium whiskers (left).A photograph of the solid electrolyte surface facing the fiber separator/anode site (middle) and the carbon cathode (right).
Electronic Supplementary Material (ESI) for Physical Chemistry Chemical PhysicsThis journal is © The Owner Societies 2013