Embed Size (px)
Citation preview

Florida International UniversityFIU Digital Commons
FIU Electronic Theses and Dissertations University Graduate School
6-21-2012
A Comprehensive Study of Bankruptcy Prediction:Accounting Ratios, Market Variables, andMicrostructureGiovanni FernandezFlorida International University, [email protected]
DOI: 10.25148/etd.FI12080805Follow this and additional works at: https://digitalcommons.fiu.edu/etd
This work is brought to you for free and open access by the University Graduate School at FIU Digital Commons. It has been accepted for inclusion inFIU Electronic Theses and Dissertations by an authorized administrator of FIU Digital Commons. For more information, please contact [email protected].
Recommended CitationFernandez, Giovanni, "A Comprehensive Study of Bankruptcy Prediction: Accounting Ratios, Market Variables, and Microstructure"(2012). FIU Electronic Theses and Dissertations. 712.https://digitalcommons.fiu.edu/etd/712

FLORIDA INTERNATIONAL UNIVERSITY
Miami, Florida
A COMPREHENSIVE STUDY OF BANKRUPTCY PREDICTION: ACCOUNTING
RATIOS, MARKET VARIABLES, AND MICROSTRUCTURE
A dissertation submitted in partial fulfillment of the
requirements for the degree of
DOCTOR OF PHILOSOPHY
in
BUSINESS ADMINISTRATION
by
Giovanni Fernandez
2012

ii
To: Dean Joyce Elam College of Business Administration This dissertation, written by Giovanni Fernandez, and entitled A Comprehensive Study of Bankruptcy Prediction: Accounting Ratios, Market Variables, and Microstructure, having been approved in respect to style and intellectual content, is referred to you for judgment. We have read this dissertation and recommend that it be approved.
_______________________________________ Dev Prasad
_______________________________________
Suchismita Mishra
_______________________________________ Chun-Hao Chang
_______________________________________
Arun J. Prakash, Major Professor Date of Defense: June 21, 2012 The dissertation of Giovanni Fernandez is approved.
_______________________________________ Dean Joyce Elam
College of Business Administration
_______________________________________
Dean Lakshmi N. Reddi University Graduate School
Florida International University, 2012

iii
© Copyright 2012 by Giovanni Fernandez
All rights reserved.

iv
ACKNOWLEDGMENTS
First and foremost, I would like to thank Dr. Arun J. Prakash, my major professor
for his assistance, guidance, support, and direction. Without his kind support and
encouragement, this dissertation would not have been possible.
I am grateful to my doctoral committee members, Dr. Chun-Hao Chang,
Dr. Suchismita Mishra, and Dr. Dev Prasad for their support and guidance. I am also
grateful to the faculty and staff of the Department of Finance and Real Estate for their
support and encouragement throughout my Ph.D. studies.
Last, but not least, I wish to acknowledge my family and friends for all their
support, patience, understanding, and love. I am very grateful to my parents, who shared
with me the pains and pleasures of my doctoral studies at Florida International
University. Without their support, I would have never taken the leap needed to begin and
persevere through my doctoral studies. I am also forever thankful to my
classmates/friends, who took this journey with me. Without each other, we would not
have made it this far.

v
ABSTRACT OF THE DISSERTATION
A COMPREHENSIVE STUDY OF BANKRUPTCY PREDICTION: ACCOUNTING
RATIOS, MARKET VARIABLES, AND MICROSTRUCTURE
by
Giovanni Fernandez
Florida International University, 2012
Miami, Florida
Professor Arun J. Prakash, Major Professor
Bankruptcy prediction has been a fruitful area of research. Univariate analysis and
discriminant analysis were the first methodologies used. While they perform relatively
well at correctly classifying bankrupt and nonbankrupt firms, their predictive ability has
come into question over time. Univariate analysis lacks the big picture that financial
distress entails. Multivariate discriminant analysis requires stringent assumptions that are
violated when dealing with accounting ratios and market variables. This has led to the use
of more complex models such as neural networks.
While the accuracy of the predictions has improved with the use of more technical
models, there is still an important point missing. Accounting ratios are the usual
discriminating variables used in bankruptcy prediction. However, accounting ratios are
backward-looking variables. At best, they are a current snapshot of the firm. Market
variables are forward-looking variables. They are determined by discounting future
outcomes. Microstructure variables, such as the bid-ask spread, also contain important
information. Insiders are privy to more information that the retail investor, so if any
financial distress is looming, the insiders should know before the general public.

vi
Therefore, any model in bankruptcy prediction should include market and
microstructure variables. This is the focus of this dissertation. The traditional models and
the newer, more technical models were tested and compared to the previous literature by
employing accounting ratios, market variables, and microstructure variables. Our findings
suggest that the more technical models are preferable, and that a mix of accounting and
market variables are best at correctly classifying and predicting bankrupt firms. Multi-
layer perceptron appears to be the most accurate model following the results. The set of
best discriminating variables includes price, standard deviation of price, the bid-ask
spread, net income to sale, working capital to total assets, and current liabilities to total
assets.

vii
TABLE OF CONTENTS
CHAPTER PAGE 1. INTRODUCTION ...................................................................................................... 1
2. UNIVARIATE ANALYSIS ....................................................................................... 4
2.1. Introduction .......................................................................................................... 4 2.2. Literature Review ................................................................................................ 6 2.3. Data ...................................................................................................................... 7 2.4. Methodology ........................................................................................................ 7 2.5. Empirical Results ............................................................................................... 12 2.6. Summary and Conclusions ................................................................................ 86
3. MULTIVARIATE DISCRIMINANT ANALYSIS ................................................ 87
3.1. Introduction ........................................................................................................ 87 3.2. Literature Review .............................................................................................. 88 3.3. Data .................................................................................................................... 90 3.4. Methodology ...................................................................................................... 91 3.5. Empirical Results ............................................................................................... 95 3.6. Summary and Conclusions .............................................................................. 264
4. NEURAL NETWORKS ......................................................................................... 265
4.1. Introduction ...................................................................................................... 265 4.2. Literature Review ............................................................................................ 266 4.3. Data .................................................................................................................. 268 4.4. Methodology .................................................................................................... 268 4.5. Empirical Results ............................................................................................. 269 4.6. Summary and Conclusions .............................................................................. 383
5. EVALUATION, COMPARISON OF MODELS, AND CONCLUSION ............. 384
5.1. Evaluation and Comparison of Models ........................................................... 384 5.2. Conclusion ....................................................................................................... 385
REFERENCES ............................................................................................................. 387 VITA ............................................................................................................................. 390

viii
LIST OF TABLES
TABLE PAGE
1. Summary of Accounting Ratios, Market Variables and Microstructure Variables ..... 8
2. Dichotomous Classification Test Results ................................................................... 38
3. Contingency Table Results for Classification Tests ................................................... 51
4. Univariate Normality Tests ......................................................................................... 96
5. Multivariate Normality Tests .....................................................................................102
6. Results of Box’s M Test for Equality of Variance-Covariance Matrix .....................107
7. Linear Multivariate Discriminant Analysis Results ...................................................113
8. Quadratic Multivariate Discriminant Analysis Results .............................................160
9. Nonparametric Multivariate Discriminant Analysis Results .....................................207
10. Out-of-Sample Nonparametric Multivariate Discriminant Analysis Results ............246
11. Multi-Layer Perceptron Results .................................................................................270
12. Radial Basis Function Results ...................................................................................325
13. Out-of-Sample Multi-Layer Perceptron Results ........................................................379

1
CHAPTER 1: INTRODUCTION
Bankruptcy prediction has been extensively studied over the past five decades.
Beaver (1966) and Altman’s (1968) studies are the seminal works that began a plethora
of research done on a very important topic. From academics to corporate directors to
investors, the financial distress, and the path taken to get there, is a very important topic.
While the research is rich in techniques and answers, many questions are still left
unanswered. The models used and the variables selected have been a huge topic in
themselves, and that is what is studied in this dissertation.
Beaver (1966) begins the conversation employing univariate analysis. Analyzing
the intertemporal behavior of numerous accounting ratios, he concludes that there is a
clear difference between the accounting ratios of bankrupt and nonbankrupt firms. Hence,
accounting ratios have been used as the main discriminating variables in bankruptcy
prediction studies since then. Following this finding, Altman (1968) employs multivariate
discriminant analysis to determine which set of accounting ratios are best at
discriminating between bankrupt and nonbankrupt firms. This is the famous Altman’s Z-
score model. The model performs well and has withstood time. However, as with many
traditional, parametric models, this model has stringent underlying assumptions that have
come into question over time. Prakash and Karels (1987) demonstrate that the
multivariate normality assumption needed to use the linear multivariate discriminant
model is violated when dealing with accounting ratios. This has led to the use of more
complex models, such as neural networks, which are less limited by distributional
assumptions.

2
Furthermore, as stated above, most research is centered on using accounting ratios
as the input or discriminatory variables in bankruptcy prediction models. While these
ratios have performed well over time, there is still space for improvement. An important
limitation of these ratios is the fact that these ratios are backward-looking variables.
When a company publishes its’ accounting numbers, it is months after these numbers
were created; at best, it is a current picture of the firm. Therefore, as an input variable in a
prediction model, a backward-looking or current-looking variable is not ideal. Ideally, a
forward-looking variable is best suited in a predictive framework. This has led to the use
of market variables.
Market variables are theoretically good predictors. For example, the price of a
company’s stock is not only reflective of the current situation of the firm, but also on its’
future potential cash flows and risks. While the accuracy of this price may not be exact,
over time, the markets’ sentiment (mixed with insiders and retail investors) is correct.
Forward-looking variables, such as price and volume, should provide better predictive
power.
Furthermore, microstructure is a growing field. The behavior of insiders and
information only found on the trading floor has been shown to contain information not
found in other variables. Since insiders are privy to more information than the general
public, they are more educated about the current and future prospects of their firm. If a
firm is in financial distress or is headed in that direction, insiders should be able to see it
coming before the market. Consequently, any bankruptcy prediction model should be
improved by the inclusion of microstructure variables.

3
This dissertation is a comprehensive study that tries to answer all of the above
mentioned questions. Different models are used in testing the classification accuracy as
well as the predictive ability of the models. Accounting ratios, market variables and
microstructure variables are used each by themselves and in conjunction with each other
to test whether each model is can be improved than previously found in the research.
In chapter 2, we study the univariate time-series behavior of each of the variables
prior to bankruptcy and see which variables change significantly prior to bankruptcy.
Discriminant analysis will is employed in chapter 3. Chapter 4 focuses on neural
networks. We evaluate, compare the models, and conclude with chapter 5.

4
CHAPTER 2: UNIVARIATE ANALYSIS
2.1 Introduction
While the behavior of individual accounting ratios prior to bankruptcy [Beaver
(1966)] and the multivariate time-series of accounting ratios [Gonedes(1973)] have been
studied, a comprehensive examination of the behavior of accounting, market, and
microstructure variables prior to bankruptcy has not been done. It has been demonstrated
throughout the literature that accounting ratios and market variables have predictive
power; however, some important aspects have been neglected. First, the intertemporal
behavior of market variables has been a very fruitful area of research. From volume to
price levels, the time-series patterns are well documented. However, the behavior of
those variables specifically for future bankrupt firms has not been studied. Second,
microstructure variables have not been fully implemented in terms of bankruptcy. Frino,
Jones, and Wong (2007) examine the behavior of stock prices on the Australian Stock
Exchange leading up to bankruptcy and document significant negative abnormal returns
leading up to bankruptcy along with a widening of the bid-ask spread up to 7 months
before bankruptcy. To understand the predictive ability of the bid-ask spread, it is
important to test whether the variable deteriorates before or after other market variables
and the accounting ratios. The purpose of this chapter is to dissect each of the above
mentioned components. To the best of our knowledge, this is the first study to investigate
the behavior of all three types of variables: accounting ratios, market variables, and
microstructure variables.
To understand why it is important to include market and microstructure variables
in the analysis, we need to explain their main difference with accounting ratios. Any firm

5
that is in financial distress will eventually show deteriorating accounting ratios; the ratios
are basically a measure of the financial health of a firm. The issue is with the timing.
Companies report their accounting numbers after the fact; the balance sheet of a company
is a snapshot of the company at the time it is created. Therefore, these ratios are
backward-looking, or at best, current. Market variables, such as price, are very different.
In determining a stock’s price, analysts use estimates of future cash flows. While the
accuracy of the market variables at any time can be called into question, over the long-
run they must be correct in an efficient market. This allows the stock price to be a
forward-looking variable.
Hence, as predictive tools, we want to focus more on forward-looking variables
than backward-looking variables. To do so, it is important to understand the behaviors of
these variables, comparing those of bankrupt and non-bankrupt firms, while also
comparing accounting and market variables.
The most important finding is that market and microstructure variables are best at
correctly classifying bankrupt firms. Furthermore, the Type I errors for these variables
are much smaller relative to Type II errors when compared to other variables in the prior
literature. The best predictors are price, standard deviation, and bid-ask spread. These
variables display the lowest misclassification rates.
With the accounting ratios, cash flow plays a less important role than found in
previous studies. Ratios that include net income, current liabilities, and working capital
perform much better than other ratios. Therefore, any multivariate bankruptcy prediction
model should include price, standard deviation, bid-ask spread, along with the accounting

6
ratios. That will be the starting point for the coming chapters. This should lead to more
powerful and accurate models.
This study attempts to describe and distinguish these two groups. The remainder
of this paper is organized as follows: Section 1.2 reviews the previous literature
associated with bankruptcy univariate analysis. Section 1.3 discusses the data used in this
study. Section 1.4 describes the methodology. Section 1.5 discusses the results, and
Section 1.6 summarizes and concludes.
2.2 Literature Review
Most of the literature focuses on multivariate analysis since the deterioration of a
company is multi-faceted, and one variable alone cannot describe the entire picture.
However, before the entire picture is seen, the pieces must be understood.
The study of bankruptcy prediction through ratio analysis truly began through
univariate analysis. Beaver (1966) set the field in a new direction. As a means of showing
the usefulness of financial ratios, Beaver chooses corporate failure. He finds that while
the time-series of the ratios of nonfailed firms are relatively stable, that of failed firms
significantly deteriorates as bankruptcy looms.
The distributions of certain ratios overlap substantially five years before failure,
but the overlap is very small a year before failure. Cash-flow to total-debt classifies failed
and nonfailed firms correctly and better than random up to at least five years before
failure. However, not all ratios perform as well. Most ratios are much more useful in
correctly classifying nonfailed firms than they are at classifying failed firms.
Furthermore, Beaver (1968) finds that changes in stock market prices are also indicative
of financial distress.

7
However, Casey and Bartczak (1984) find that none of the variables studied,
mostly cash flow variables, can accurately discriminate between bankrupt and non-
bankrupt firms. They conclude that this method of classification is faulty because of the
fact that many healthy firms go through periods of low operating cash flow.
Lin and Piesse (2001) also find that the ratios of failed and non-failed firms are
significantly different. Furthermore, the market-to-book ratio, which takes into account
forward-looking market prices, also is significantly different between failed and non-
failed firms. Nonetheless, the t-statistics are still highest for profitability and liquidity
ratios.
Neophytou et al. (2001) also document deterioration in accounting and cash-flow
variables. They find that the financial leverage ratios provide the highest classification
accuracy. Profitability and cash-flow ratios also perform very well.
2.3 Data
The list of bankrupt firms was obtained from bankruptcydata.com. The list
includes companies the filed for bankruptcy from January 1995 to December 2010. The
subsample of non-bankrupt firms comes from the entire database of Compustat,
consisting of firms that did not file for bankruptcy during our sample period. The
accounting ratios for all firms, bankrupt and non-bankrupt, are obtained from Compustat.
The market variables for these firms were obtained from CRSP.
2.4 Methodology
As is common in the bankruptcy prediction literature, the non-bankrupt firms are
selected in such a way so that firm size does not severely affect the results. Ex-ante,
successful firms are expected to be larger than failing firms. Furthermore, firm success

8
rates are highly influenced by their industry. For example, when the tech bubble was
growing, any firm with a dotcom in its name benefited heavily. To mitigate this issue, it
Table 1 Summary_Br_Nbr_Ratio_data Bankrupt
Variable N Mean Std Dev Minimum Maximum SHROUT 4624
86169.89 42 1571700
BIDLO 4530 11.12 13.21 -72.25 113.85 ASKHI 4530 13.25 15.69 -52.25 207.44 PRC 4512 12.10 14.44 -72.25 130.00 VOL 4530 86025.86 260903.62 0.00 4141655.00 BID 4249 12.65 13.92 0.03 130.00 ASK 4249 12.83 13.95 0.06 131.00 SPREAD 240 0.38 0.38 0.03 2.50 CEQQ 4541 452.38 1505.16 -2887.00 25789.00 CSHOQ 4513 48.67 91.09 0.01 1500.14 TXTQ 4573 6.82 47.83 -770.13 2076.00 REQ 4447 -17.15 1088.36 -13603.00 8450.15 REVTQ 4585 337.19 1182.21 0.00 36882.00 NETINCOMETOSALES 4431 -3.10 52.42 -2629.00 32.35 NETINCOMETOTOTALASSETS 4556 -0.05 0.79 -51.10 1.14 TOTALDEBT 4483 928.70 3242.33 0.00 44267.00 NETINCOMETOTOTALDEBT 4466 -0.46 19.63 -1307.00 2.10 CURLIABTOTOTASSET 4545 0.28 0.22 0.00 3.43 LTLIABTOTOTASSET 4483 0.29 0.58 0.00 22.68 TOTDEBTTOTOTASSET 4483 0.58 0.62 0.00 23.52 TOTDEBTPLUSPREFTOTOTASSET 4450 0.60 0.68 0.00 23.52 CASHTOTOTALASSETS 905 0.14 0.16 0.00 0.97 QUICKASSETS 4504 313.91 966.05 0.06 11579.00 QUICKASSETSTOTOTALASSTS 4504 0.36 0.24 0.01 1.00 WORKINGCAPITAL 4543 88.34 507.56 -4499.00 4907.00 WCTOTOTALASSETS 4543 0.19 0.30 -3.24 0.97 CASHTOCURLIABILITIES 904 0.98 1.86 0.00 24.94 QASSETSTOCURLIABILITIES 4503 2.90 39.98 0.02 2663.00 CURRENTRATIO 4543 3.40 42.23 0.02 2828.00 CASHTOSALES 878 1.72 17.96 0.00 516.90 INVENTORYTOSALES 4361 0.90 12.73 0.00 650.14 QUICKASSETSTOSALES 4334 10.63 224.58 0.05 13986.00 CURRENTASSETSTOSALES 4374 12.49 236.64 0.11 13986.00 WORKINGCAPITALTOSALES 4373 8.04 188.37 -606.07 11605.00 TOTALASSETSTOSALES 4403 19.90 266.90 0.63 14453.00

9
BIDASKSPREAD 4249 0.18 0.23 -0.81 3.50 HILOBIDASKSPREAD 4530 2.13 6.31 -101.13 153.94
Summary_Br_Nbr_Ratio_data Nonbankrupt
Variable N Mean Std Dev Minimum Maximum SHROUT 4250 113515.58 436934.97 35.00 6064759.00 BIDLO 4226 18.11 17.65 -25.53 119.86 ASKHI 4226 20.89 19.91 -34.88 161.39 PRC 4222 19.43 18.90 -38.50 153.29 VOL 4226 130886.25 454724.84 2.00 8280692.00 BID 3989 19.25 17.93 0.10 153.00 ASK 3989 19.44 17.99 0.11 153.37 SPREAD 101 0.33 0.26 0.02 1.50 CEQQ 4188 1541.63 6982.92 -424.48 115367.00 CSHOQ 4124 120.95 452.41 1.09 6043.55 TXTQ 4195 24.29 168.28 -6573.00 2863.00 REQ 3955 596.50 2846.65 -7586.00 35863.00 REVTQ 4211 666.70 2264.68 -0.13 31581.00 NETINCOMETOSALES 4167 -0.84 11.08 -480.98 36.60 NETINCOMETOTOTALASSETS 4184 -0.01 0.23 -10.76 0.34 TOTALDEBT 4030 2378.79 11350.47 0.26 172571.00 NETINCOMETOTOTALDEBT 4028 -0.04 0.45 -11.38 2.87 CURLIABTOTOTASSET 4093 0.24 0.21 0.00 6.01 LTLIABTOTOTASSET 4030 0.23 0.23 0.00 2.58 TOTDEBTTOTOTASSET 4030 0.48 0.31 0.01 7.22 TOTDEBTPLUSPREFTOTOTASSET
4028 0.49 0.33 0.01 7.84 CASHTOTOTALASSETS 1222 0.14 0.17 0.00 0.95 QUICKASSETS 4061 615.11 1820.24 0.01 23567.00 QUICKASSETSTOTOTALASSTS 4061 0.38 0.23 0.00 0.98 WORKINGCAPITAL 4091 98.53 1311.37 -21893.00 8960.48 WCTOTOTALASSETS 4091 0.27 0.30 -5.96 0.96 CASHTOCURLIABILITIES 1199 0.90 1.55 0.00 14.55 QASSETSTOCURLIABILITIES 4061 2.37 3.87 0.00 63.24 CURRENTRATIO 4091 2.98 3.89 0.00 64.71 CASHTOSALES 1212 5.38 55.11 0.00 1276.84 INVENTORYTOSALES 4072 0.53 1.12 -2.68 31.33 QUICKASSETSTOSALES 4015 5.88 54.46 -505.26 2340.64 CURRENTASSETSTOSALES 4045 6.37 54.31 -507.94 2341.76 WORKINGCAPITALTOSALES 4045 4.74 49.04 -494.21 2093.38 TOTALASSETSTOSALES 4143 14.29 113.44 -603.91 3802.83 BIDASKSPREAD 3989 0.19 0.28 -0.50 4.50 HILOBIDASKSPREAD 4226 2.77 4.99 -65.25 75.31

10
is common to select firms in such a way that size and industry factors do not distort the
results.
The procedure is two-fold. First, a bankrupt firm is selected. Second, a non-
bankrupt firm within the same industry with asset size closest to the bankrupt firm is
selected. These two firms (the one bankrupt and the one non-bankrupt) are then stored
and removed from the continuing procedure. A second bankrupt firm is selected, and the
selection process is done with the remaining non-bankrupt firms. This is done for each
bankrupt firm, so that in the end there are an equal number of bankrupt and non-bankrupt
firms.
To clearly understand the difference in behavior between the two subsamples, a
graphical demonstration is a great place to begin. To do so, the annual mean value of
each ratio is calculated from one year before failure to five years before failure. The same
is done for non-bankrupt firms, but the cutoff date is just matched to that of the bankrupt
firm. Furthermore, since the behavior of the ratios in the two subsamples should differ
over time, especially as bankruptcy approaches, a test of autocorrelation is applied. This
will demonstrate the trends of the ratios in each subsample.
To further demonstrate the behavior of the variables, especially the downward (or
upward spiral) for bankrupt firms as bankruptcy looms, tests of autocorrelation are run.
There should be a clear trend during the quarters nearest bankruptcy. For brevity, I run
the autocorrelations from the last quarter, three years before bankruptcy, up until the
quarter right before bankruptcy. This is performed also on the nonbankrupt sample.

11
While the trend analysis and autocorrelations provide explanations of the trends and
comparisons of the ratios of each subsample, this is not a predictive test.
A useful predictive test employed to test the power of each ratio in distinguishing
between bankrupt and non-bankrupt firms is a dichotomous test. The ratios for bankrupt
and non-bankrupt firms are each ranked from lowest to highest, and a cutoff point is
chosen to minimize the misclassification between failed and non-failed. This is
synonymous to the decision-making process of a practitioner; the ratios of a firm are
analyzed, and if they are above or below a certain level, then the firm is believed to be
healthy or under distress. This is procedure one.
The problem with this procedure is that the cutoff point is derived from the entire
sample, so it is not purely a predictive test. To avoid this issue, the entire sample is
further randomly divided into two subsamples. A cutoff point is then derived in each
subsample, but then that cutoff point is used to classify firms in the other subsample. This
is procedure 2.
One important problem with the preceding predictive test is that Type I
(misclassifying a failed firm) and Type II (misclassifying a non-failed firm) errors are
treated equally. However, the severity of committing these errors is very different. A
lender who wrongfully lends to a firm that eventually fails will suffer deeper
consequences than a lender who denies a loan to an eventually proven healthy firm. In
order to distinguish between these errors, contingency tables are employed. The
contingency tables are made for each ratio, one to five years before failure. The rows of
the table signify the predicted outcome (failed or non-failed), and the columns
demonstrates the actual outcome (failed or non-failed).

12
2.5 Empirical Results
While each variable does not tell the whole story, it is important to understand
how the different variables and types of variables behave prior to bankruptcy, and how
the behaviors of the ratios of failing and non-failing firms differ. The individual ratios are
studied through dichotomous tests, contingency tables, and likelihood ratios.
While the levels of the different ratios (accounting, market, or microstructure) for
the bankrupt and non-bankrupt firms are clearly different, the differences do not change
as much in magnitude as has been documented in the previous literature. Market turmoil
clearly has an effect on all firms, whether under distress or not. The magnitude may
differ, but the market as whole was effected. This will make the multivariate analysis in
the coming chapters that much more important.
Focusing on market and microstructure variables, volume for bankrupt firms is
substantially lower than that of non-bankrupt firms, but there is no trend. The market
might be able to notice financial distress farther than five years out. The spread stays in a
tight range, again indicating that the market made up its’ mind long before five years
before bankruptcy. However, the high-loww bid-ask spread does show an upward trend
for bankrupt firms.
While the prices of all securities show a downward trend (due to the financial
crisis), the stock prices of bankrupt firms decline by 40%, while those of non-bankrupt
firms decline by only 25%. Furthermore, there is an upward trend in prices one year
before the cutoff period for non-bankrupt firms. Since this sample time-period includes
the financial crisis, most stock prices trend downward. However, one year before either
bankruptcy or the cutoff, the market is able to distinguish between firms in distress and

13
those not. Hence, the prices of bankrupt firms continue the downward spiral, while those
of nonbankrupt firms show a spike. Returns turn negative for bankrupt firms, while those
of non-bankrupt firms stay relatively flat; moreover, returns for nonbankrupt firms are
mean-reverting, as commonly found in the overall market, while those for bankrupt firms
display a downward trend. This is a substantial difference. Clearly, market determined
prices are leading indicators of financial distress. The standard deviation of the returns
are mostly higher for bankrupt firms. This is due to the uncertainty surrounding firms in
distress. While the entire market has a substantially higher level of systematic risk during
this sample period, the unsystematic risk is higher for deteriorating firms. Relative
systematic risk is upward trending for bankrupt firms, while the opposite is true for non-
bankrupt firms.
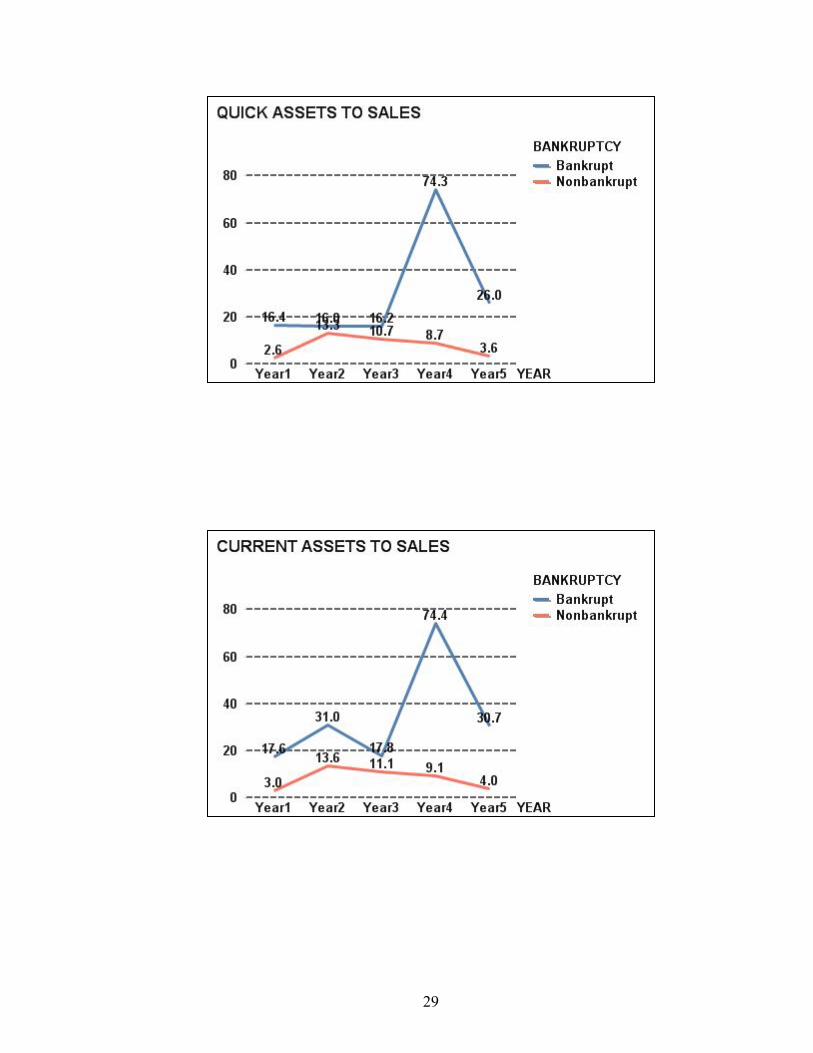
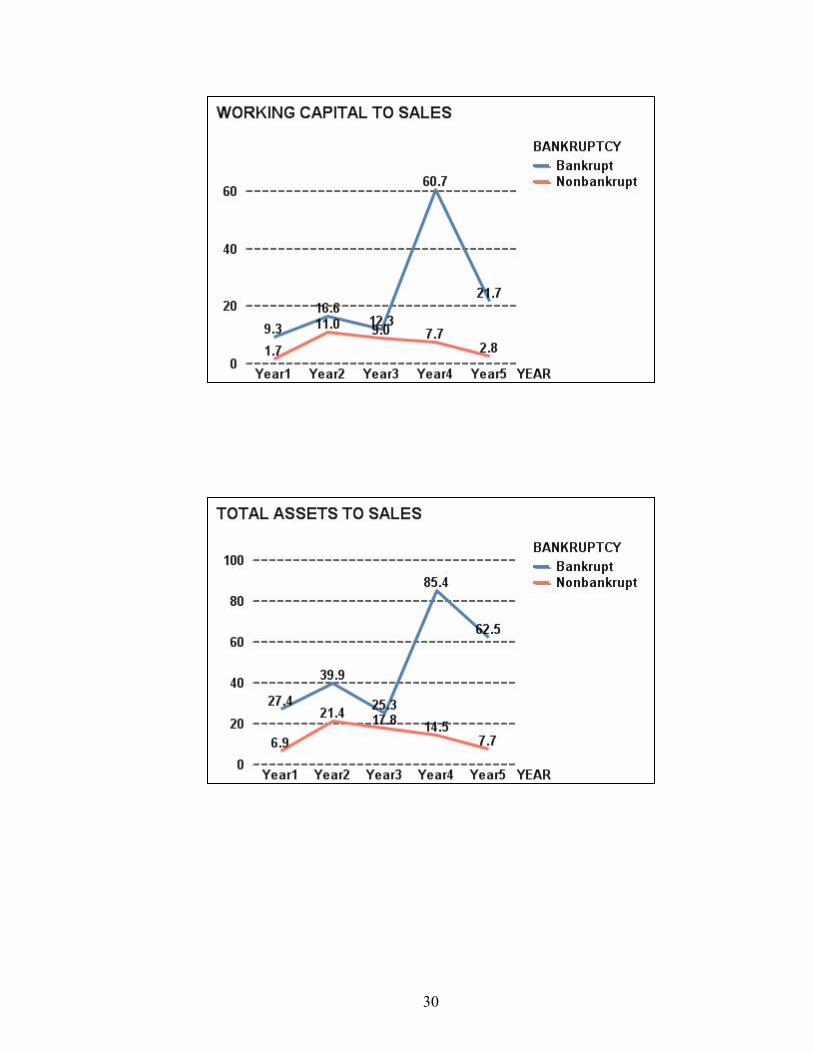
Figure 1
The figure present the market variables, accounting ratios, and the microstructure variables for the bankrupt and nonbankrupt firms from one year before bankruptcy (year 1) to five years before bankrupt (year 5).

14

15

16

17

18

19

20

21

22

23

24

25

26

27

28
29
30

31

32

33

34
When compared to previous studies, cash flow plays a much smaller role in this
study. While there is a clear difference between the cash flow ratios of the two samples,
there is not much of a trend. Net income to total assets tells a much different story. Due to

35
the crisis, net incomes are low and on the decline for both samples. However, the trend is
much steeper for the bankrupt firms. Net income to total debt is much more flat.
Even though total debt does not fluctuate too much, current liabilities do. This is
due to the fact that firms take on more short-term debt in distress to try to survive.
Current liabilities to total assets are relatively stable for non-bankrupt firms, those for
bankrupt firms increase 33% from five years before bankruptcy to one year before. Long-
term liabilities to total assets are more stable for both samples. Total debt to total assets
and total debt plus preferred stock to total assets increase 60-75% leading up to
bankruptcy, but those for non-bankrupt firms are stable. Cash to total assets increase for
both samples, which is at first surprising for bankrupt firms; this is mainly due to the
decline of total assets. Furthermore, working capital to total assets significantly declines
when approaching bankruptcy, demonstrating that current assets other than cash
decreased, and/or current liabilities increased. This is further highlighted through the cash
to current liabilities ratio. Also, both quick assets and all current assets decline as current
liabilities rise, as is expected. Inventories decline mostly 5 years prior to bankruptcy, and
then stay relatively flat. These findings are consistent with the belief that firms ramp up
short-term risks trying to find a last minute solution to the deterioration.
While the trend analysis serves an explanatory purpose, it is not a predictive
analysis. To do so, a dichotomous classification test is first applied. A clear difference
between this study and prior studies is that the misclassifications found using our sample
are much higher than those found in the literature. This is mainly due to the fact that
many firms, whether the firms went bankrupt or not, suffered some distress due to the
financial crisis. Therefore, any one variable or ratio alone will be less able to predict

36
which firm will go bankrupt and which firm will not. This will make the multivariate
analysis in the coming chapters even more important.
Since the results are fairly similar between procedure 1 and 2, the results
discussed in the following paragraphs will be specifically about procedure 2. This is more
accurately a predictive test since the cutoff point is derived from one sample and then
used to predict bankrupt or non-bankrupt firms in the other sample.
We begin again with the market and microstructure variables. Volume seems to
have less predictive power as bankruptcy looms. The crisis led to heavy trading in all
securities, so this makes volume a less discriminatory variable. While there may be more
information in volume during normal periods, it is difficult to use during turmoil. Price,
however, performs better, and improves in accuracy as bankruptcy approaches. The same
occurs with the bid-ask spread and returns. Beta performs poorly and is erratic, but the
standard deviation performs as well as price does. Overall, the market variables that are
best at correctly classifying firms are prices, bid-ask spreads, and standard deviation.
However, the variable with the most long-term accuracy (five years before bankruptcy) is
the bid ask spread, with some misclassifications in the low 20%. This is consistent with
our hypothesis, that the bid-ask spread, which is set by market makers, is a leading
indicator since a lot of information not found in the accounting books or by retail
investors is found on the trading floor.
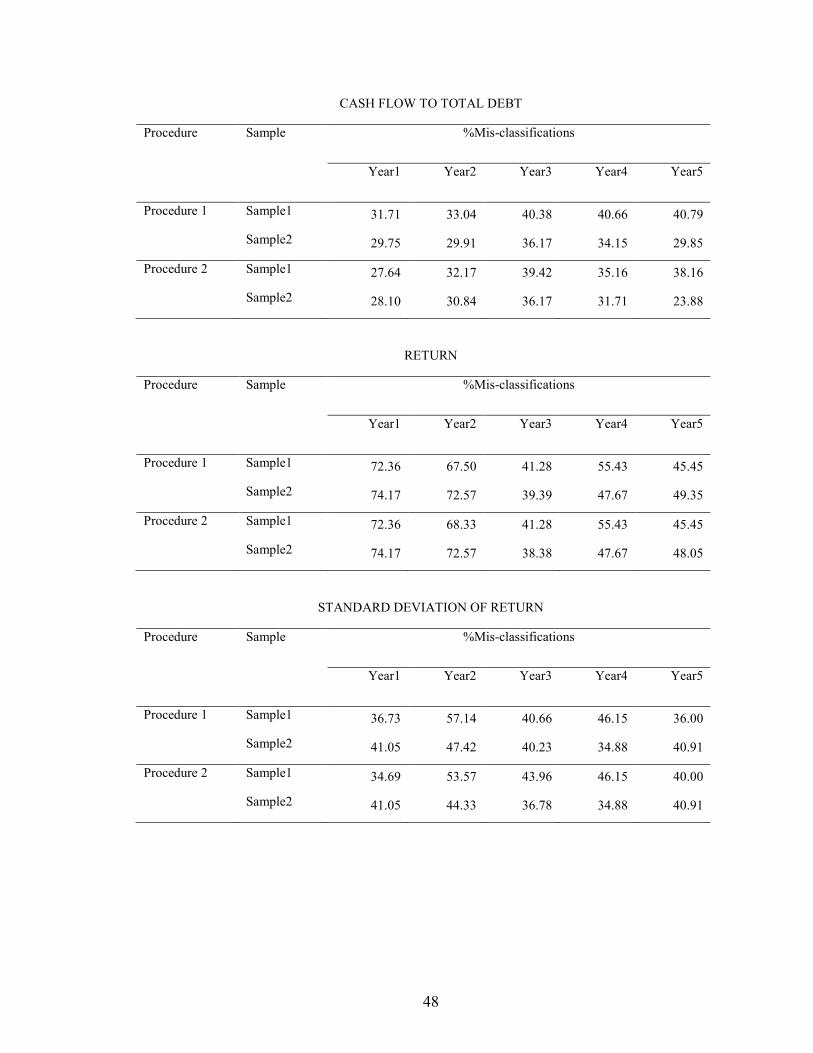
Moving on to accounting ratios, the most accurate group is the cash flow group.
While the accuracy is not monotonic, the misclassifications mostly range from the mid
20% to the mid 30%. Cash flow to total assets and cash flow to total debt correctly
classify about 75% of the firms even five years before bankruptcy. This is interesting,
37
especially since we later find that the cash flow variables are not part of the set of best
predictors in the multivariate frameworks.
The net income ratios also perform well, but are less accurate and more erratic
than the cash flow or market variables. The inaccuracy mostly ranges from the high 20%
to 40%. The net income to sales ratio misclassifies 25% to 33% of the firms.
Surprisingly, the debt ratios are poor classifiers. This seems to go against the idea that
firms leverage themselves as financial distress occurs in order to survive. However, one
key characteristic of all firms during the recent financial crisis was high leverage.
Therefore, it is much more difficult to use debt as a discriminating variable in our sample.
The same seems to occur with assets; this is clearly seen through the accounting identity.
Working capital performs well by itself, meaning that the relationship between current
assets and current liabilities is important; unfortunately, the same is not found for the
current ratio.
While the results of the dichotomous test lead to predictions, they lack in one
important area. Clearly, a loan officer or investor would prefer incorrectly predicting that
a future non-bankrupt will go bankrupt (Type II error) to predicting that a future bankrupt
firm will not go bankrupt (Type I error). One way to display these different errors is
through a contingency table. Since we have already seen that certain variables or ratios
perform substantially better than others, we will focus on those better performing
variables and ratios.

38
Table 2
Dichotomous classification Test Results for Ratios
This table presents the dichotomous classification test by classifying firms as either bankrupt or nonbankrupt by using a cutoff point for each variable or ratio that minimizes the misclassification rate.
Procedure 1 classifies firms in each sample by using a cutoff derived from the same sample. Procedure 2 classifies firms in each sample by using a cutoff derived from the other sample. Year 1 is one year before
bankruptcy and year 5 is five years before bankruptcy.
SHROUT
Procedure Sample %Mis-classifications
Year1 Year2 Year3 Year4 Year5
Procedure 1 Sample1 40.16 39.34 37.72 35.92 40.45
Sample2 42.52 39.17 35.24 30.43 34.18
Procedure 2 Sample1 40.16 37.70 36.84 37.86 39.33
Sample2 43.31 39.17 35.24 30.43 34.18
PRC
Procedure Sample %Mis-classifications
Year1 Year2 Year3 Year4 Year5
Procedure 1 Sample1 32.80 39.67 37.72 35.92 40.45
Sample2 29.13 35.83 37.14 35.87 32.91
Procedure 2 Sample1 32.80 38.84 41.23 34.95 40.45
Sample2 29.92 38.33 39.05 34.78 34.18
VOL
Procedure Sample %Mis-classifications
Year1 Year2 Year3 Year4 Year5
Procedure 1 Sample1 41.73 38.52 37.72 34.95 38.20
Sample2 40.16 39.17 36.19 36.96 32.91

39
Procedure 2 Sample1 40.94 37.70 36.84 33.98 37.08
Sample2 43.31 37.50 36.19 35.87 32.91
SPREAD
Procedure Sample %Mis-classifications
Year1 Year2 Year3 Year4 Year5
Procedure 1 Sample1 100.00 42.86 28.57 20.00 33.33
Sample2 57.14 60.00 33.33 66.67 33.33
Procedure 2 Sample1 100.00 42.86 28.57 0.00 33.33
Sample2 42.86 80.00 66.67 66.67 66.67
NET INCOME TO SALES
Procedure Sample %Mis-classifications
Year1 Year2 Year3 Year4 Year5
Procedure 1 Sample1 34.68 35.83 49.11 43.00 40.23
Sample2 24.17 28.45 32.35 33.33 28.57
Procedure 2 Sample1 36.29 34.17 45.54 40.00 40.23
Sample2 25.00 26.72 31.37 32.22 29.87
NET INCOME TO TOTAL ASSETS
Procedure Sample %Mis-classifications
Year1 Year2 Year3 Year4 Year5
Procedure 1 Sample1 33.59 34.71 44.74 38.83 40.45
Sample2 26.19 29.17 31.43 33.70 29.11
Procedure 2 Sample1 36.72 33.88 45.61 40.78 40.45
Sample2 26.98 26.67 30.48 31.52 29.11

40
TOTAL DEBT
Procedure Sample %Mis-classifications
Year1 Year2 Year3 Year4 Year5
Procedure 1 Sample1 64.00 61.86 63.06 64.00 67.44
Sample2 54.40 58.82 61.54 63.74 62.82
Procedure 2 Sample1 64.00 61.86 63.06 61.00 69.77
Sample2 55.20 57.98 62.50 65.93 62.82
NET INCOME TO TOTAL DEBT
Procedure Sample %Mis-classifications
Year1 Year2 Year3 Year4 Year5
Procedure 1 Sample1 31.20 33.90 45.95 40.00 40.70
Sample2 28.00 28.57 31.73 32.97 32.05
Procedure 2 Sample1 34.40 33.05 44.14 42.00 39.53
Sample2 29.60 27.73 31.73 31.87 29.49
CURRENT LIABILITIES TO TOTAL ASSETS
Procedure Sample %Mis-classifications
Year1 Year2 Year3 Year4 Year5
Procedure 1 Sample1 38.10 44.54 41.96 42.57 51.72
Sample2 40.48 45.00 46.67 42.39 50.63
Procedure 2 Sample1 35.71 42.02 41.07 42.57 51.72
Sample2 39.68 45.83 46.67 40.22 50.63

41
LONG TERM LIABILTIES TO TOTAL ASSETS
Procedure Sample %Mis-classifications
Year1 Year2 Year3 Year4 Year5
Procedure 1 Sample1 49.60 50.00 49.55 53.00 46.51
Sample2 44.00 41.18 50.96 48.35 47.44
Procedure 2 Sample1 50.40 53.39 53.15 57.00 52.33
Sample2 44.00 44.54 50.00 49.45 50.00
TOTAL DEBT TO TOTAL ASSETS
Procedure Sample %Mis-classifications
Year1 Year2 Year3 Year4 Year5
Procedure 1 Sample1 38.40 41.53 41.44 41.00 52.33
Sample2 32.00 38.66 44.23 42.86 46.15
Procedure 2 Sample1 40.80 42.37 41.44 44.00 53.49
Sample2 32.80 42.02 41.35 41.76 46.15
TOTAL DEBT PLUS PREF TO TOTAL ASSETS
Procedure Sample %Mis-classifications
Year1 Year2 Year3 Year4 Year5
Procedure 1 Sample1 39.20 42.37 42.34 37.00 48.84
Sample2 31.45 37.82 39.42 37.36 44.87
Procedure 2 Sample1 40.00 42.37 42.34 43.00 53.49
Sample2 31.45 40.34 42.31 42.86 41.03

42
CASH TO TOTAL ASSETS
Procedure Sample %Mis-classifications
Year1 Year2 Year3 Year4 Year5
Procedure 1 Sample1 42.11 46.30 50.00 50.00 66.67
Sample2 48.08 52.94 52.27 61.90 100.00
Procedure 2 Sample1 59.65 57.41 66.00 65.22 66.67
Sample2 34.62 33.33 43.18 45.24 100.00
QUICK ASSETS
Procedure Sample %Mis-classifications
Year1 Year2 Year3 Year4 Year5
Procedure 1 Sample1 36.29 38.14 34.23 29.70 36.05
Sample2 25.40 30.00 28.57 21.74 29.11
Procedure 2 Sample1 36.29 38.14 35.14 29.70 36.05
Sample2 25.40 30.00 28.57 21.74 29.11
QUICK ASSETS TO TOTAL ASSETS
Procedure Sample %Mis-classifications
Year1 Year2 Year3 Year4 Year5
Procedure 1 Sample1 51.61 52.54 55.86 49.50 52.33
Sample2 39.68 53.33 48.57 50.00 48.10
Procedure 2 Sample1 50.00 50.85 54.05 50.50 50.00
Sample2 43.65 50.00 50.48 50.00 46.84

43
WORKING CAPITAL
Procedure Sample %Mis-classifications
Year1 Year2 Year3 Year4 Year5
Procedure 1 Sample1 35.71 39.50 35.71 35.64 34.48
Sample2 26.19 30.83 30.48 27.17 35.44
Procedure 2 Sample1 35.71 39.50 34.82 35.64 34.48
Sample2 25.40 30.83 27.62 27.17 31.65
WORKING CAPITAL TO TOTAL ASSETS
Procedure Sample %Mis-classifications
Year1 Year2 Year3 Year4 Year5
Procedure 1 Sample1 40.48 50.42 46.43 47.52 49.43
Sample2 31.75 46.67 48.57 48.91 49.37
Procedure 2 Sample1 43.65 49.58 50.00 46.53 51.72
Sample2 34.92 43.33 46.67 47.83 48.10
CASH TO CURRENT LIABILITIES
Procedure Sample %Mis-classifications
Year1 Year2 Year3 Year4 Year5
Procedure 1 Sample1 38.18 48.08 52.08 50.00 66.67
Sample2 38.46 52.94 50.00 57.14 100.00
Procedure 2 Sample1 49.09 50.00 58.33 61.36 66.67
Sample2 36.54 33.33 45.45 45.24 100.00

44
QUICK ASSETS TO CURRENT LIABILITIES
Procedure Sample %Mis-classifications
Year1 Year2 Year3 Year4 Year5
Procedure 1 Sample1 41.13 44.07 48.65 44.55 50.00
Sample2 35.71 43.33 46.67 44.57 50.63
Procedure 2 Sample1 41.13 44.07 49.55 50.50 55.81
Sample2 33.33 42.50 43.81 41.30 49.37
CURRENT RATIO
Procedure Sample %Mis-classifications
Year1 Year2 Year3 Year4 Year5
Procedure 1 Sample1 38.89 42.02 44.64 44.55 50.57
Sample2 34.13 47.50 41.90 45.65 51.90
Procedure 2 Sample1 38.89 42.02 46.43 44.55 48.28
Sample2 33.33 47.50 44.76 46.74 51.90
CASH TO SALES
Procedure Sample %Mis-classifications
Year1 Year2 Year3 Year4 Year5
Procedure 1 Sample1 42.86 43.40 48.98 52.17 66.67
Sample2 49.02 42.00 58.14 61.90 100.00
Procedure 2 Sample1 46.43 52.83 55.10 54.35 66.67
Sample2 43.14 40.00 53.49 54.76 50.00

45
INVENTORY TO SALES
Procedure Sample %Mis-classifications
Year1 Year2 Year3 Year4 Year5
Procedure 1 Sample1 49.18 52.59 52.25 48.00 54.12
Sample2 50.00 47.41 52.94 48.89 49.35
Procedure 2 Sample1 48.36 52.59 52.25 46.00 54.12
Sample2 50.83 48.28 53.92 50.00 50.65
QUICK ASSETS TO SALES
Procedure Sample %Mis-classifications
Year1 Year2 Year3 Year4 Year5
Procedure 1 Sample1 58.68 53.04 55.96 55.10 57.14
Sample2 53.33 50.86 51.96 55.56 50.65
Procedure 2 Sample1 55.37 51.30 57.80 56.12 59.52
Sample2 51.67 54.31 51.96 47.78 44.16
CURRENT ASSETS TO SALES
Procedure Sample %Mis-classifications
Year1 Year2 Year3 Year4 Year5
Procedure 1 Sample1 59.35 52.99 52.73 54.08 55.29
Sample2 53.33 56.03 51.96 53.33 50.65
Procedure 2 Sample1 56.10 52.14 53.64 55.10 57.65
Sample2 52.50 52.59 50.98 51.11 50.65

46
WORKING CAPITAL TO SALES
Procedure Sample %Mis-classifications
Year1 Year2 Year3 Year4 Year5
Procedure 1 Sample1 39.84 46.15 43.64 44.90 54.12
Sample2 39.17 48.28 47.06 48.89 53.25
Procedure 2 Sample1 43.90 47.01 51.82 54.08 57.65
Sample2 35.00 40.52 45.10 48.89 49.35
TOTAL ASSETS TO SALES
Procedure Sample %Mis-classifications
Year1 Year2 Year3 Year4 Year5
Procedure 1 Sample1 47.20 50.42 50.00 52.00 49.43
Sample2 47.50 50.86 46.08 51.11 48.05
Procedure 2 Sample1 47.20 50.42 50.00 51.00 49.43
Sample2 46.67 49.14 46.08 51.11 48.05
BID ASK SPREAD
Procedure Sample %Mis-classifications
Year1 Year2 Year3 Year4 Year5
Procedure 1 Sample1 32.26 28.93 33.33 33.01 30.59
Sample2 30.40 24.37 35.58 24.18 19.74
Procedure 2 Sample1 27.42 26.45 33.33 35.92 29.41
Sample2 36.00 29.41 37.50 23.08 22.37

47
HI LO BID ASK SPREAD
Procedure Sample %Mis-classifications
Year1 Year2 Year3 Year4 Year5
Procedure 1 Sample1 55.91 58.20 64.04 62.14 56.18
Sample2 59.84 57.50 59.05 53.26 60.76
Procedure 2 Sample1 57.48 59.02 60.53 60.19 55.06
Sample2 59.06 57.50 60.00 48.91 53.16
CASH FLOW TO SALES
Procedure Sample %Mis-classifications
Year1 Year2 Year3 Year4 Year5
Procedure 1 Sample1 28.69 35.65 37.50 38.46 35.53
Sample2 28.57 31.48 39.36 36.59 26.87
Procedure 2 Sample1 29.51 33.04 38.46 38.46 38.16
Sample2 27.73 30.56 40.43 37.80 28.36
CASH FLOW TO TOTAL ASSETS
Procedure Sample %Mis-classifications
Year1 Year2 Year3 Year4 Year5
Procedure 1 Sample1 27.42 30.17 40.00 34.78 36.36
Sample2 27.42 29.09 38.14 32.94 28.57
Procedure 2 Sample1 29.84 31.03 38.10 33.70 33.77
Sample2 29.84 27.27 40.21 32.94 24.29
48
CASH FLOW TO TOTAL DEBT
Procedure Sample %Mis-classifications
Year1 Year2 Year3 Year4 Year5
Procedure 1 Sample1 31.71 33.04 40.38 40.66 40.79
Sample2 29.75 29.91 36.17 34.15 29.85
Procedure 2 Sample1 27.64 32.17 39.42 35.16 38.16
Sample2 28.10 30.84 36.17 31.71 23.88
RETURN
Procedure Sample %Mis-classifications
Year1 Year2 Year3 Year4 Year5
Procedure 1 Sample1 72.36 67.50 41.28 55.43 45.45
Sample2 74.17 72.57 39.39 47.67 49.35
Procedure 2 Sample1 72.36 68.33 41.28 55.43 45.45
Sample2 74.17 72.57 38.38 47.67 48.05
STANDARD DEVIATION OF RETURN
Procedure Sample %Mis-classifications
Year1 Year2 Year3 Year4 Year5
Procedure 1 Sample1 36.73 57.14 40.66 46.15 36.00
Sample2 41.05 47.42 40.23 34.88 40.91
Procedure 2 Sample1 34.69 53.57 43.96 46.15 40.00
Sample2 41.05 44.33 36.78 34.88 40.91

49
BETA
Procedure Sample %Mis-classifications
Year1 Year2 Year3 Year4 Year5
Procedure 1 Sample1 56.47 26.83 32.43 60.61 63.64
Sample2 57.14 34.07 28.57 41.94 45.90
Procedure 2 Sample1 58.82 26.83 35.14 48.48 61.82
Sample2 51.65 34.07 27.27 41.94 44.26
The best classifying market variables according to the dichotomous test are price,
bid-ask spread, and standard deviation. One year before failure, price leads to a 20%
Type I error versus a 44% type II error, whereas five years before failure it leads to a
36% Type I error versus a 32% Type II error. For the bid-ask spread, one year before
failure there is a 52% Type I error versus a 15% Type II error, but five years before
failure it leads to an 18% Type I error versus a 37% Type II error. Lastly, the standard
deviation predictions have a Type I error of 31% versus a Type II error of 38% in year
one, and Type I error of 38% versus a Type II error of 11% in year five. One key
difference with these results and those found previously in the literature is that Type I
errors are sometimes lower than Type II errors using this sample. The prior literature
consistently found that it was easier to correctly classify non-bankrupt firms than
bankrupt firms. While this is not a definitive finding, it does show that market variables
are better at correctly classifying firms that under distress, which is of utmost importance.
This is consistent with our hypothesis that market variables are good long-term predictors

50
of bankruptcy since market variables take into account future events, making them
forward-looking variables.
Accounting ratios perform relatively well, but a clear pattern persists. Cash flow
to total assets provides a Type I error of 15% versus a Type II error of 47% in year one,
and a Type I error of 36% versus a Type II error of 33% in year five. Net income to total
asset leads to a Type I error of 22% versus a Type II error of 52% in year one, and a Type
I error of 46% versus a Type II error of 37% in year five. Net income to sales produce a
Type I error of 20% versus a Type II error of 31% on year before bankruptcy, and Type I
error of 51% versus a Type II error of 15% five years before bankruptcy. For working
capital to total assets, the Type I and Type II errors in year one are 34% versus 54%, and
49% versus 54% in year five, respectively. For the most part, Type I errors are smaller
than Type II errors one year before failure, whereas Type I errors are larger than Type II
errors five years before failure. This validates the idea that accounting ratios are
backward-looking. By the time accounting ratios begin to correctly signal that firms are
under distress, bankruptcy is imminent. This does not mean that these ratios are not
important in the predictive process; it just means that there is more to the story. This
finding, along with the above mentioned finding that market variables have overall lower
Type I errors, are important findings. Any bankruptcy prediction model and/or research
should include both accounting ratios and market variables to capture both short-term and
long-term information.

51
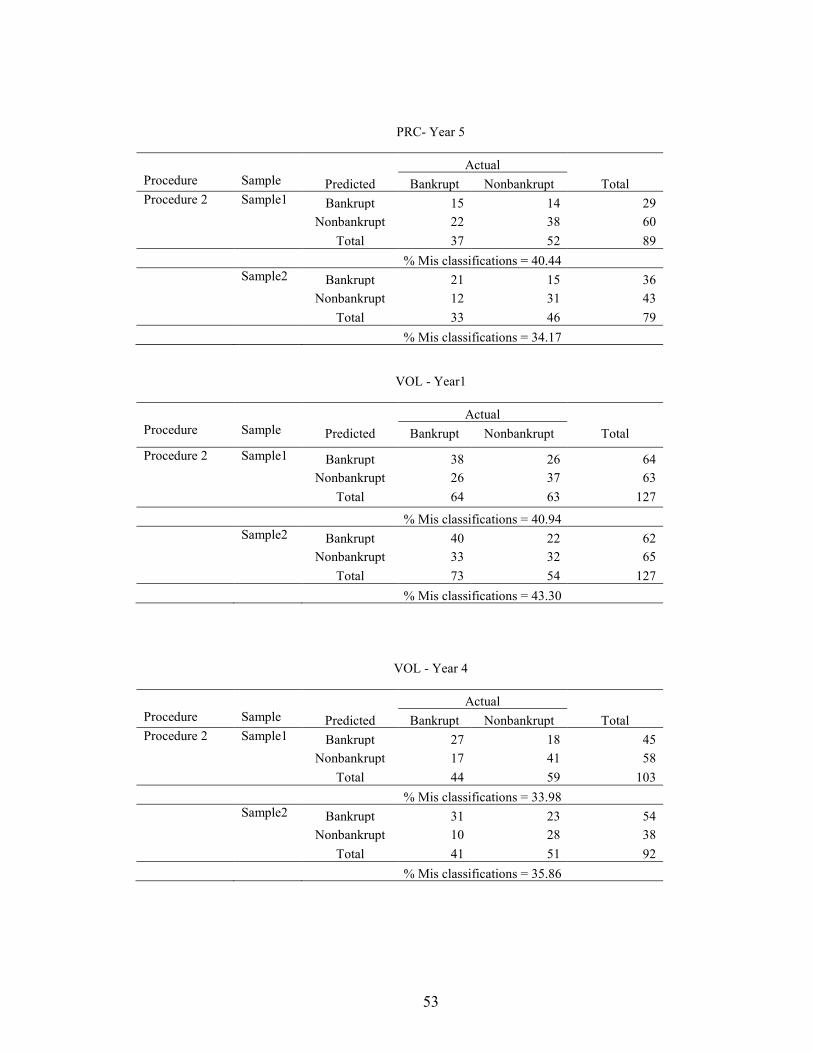
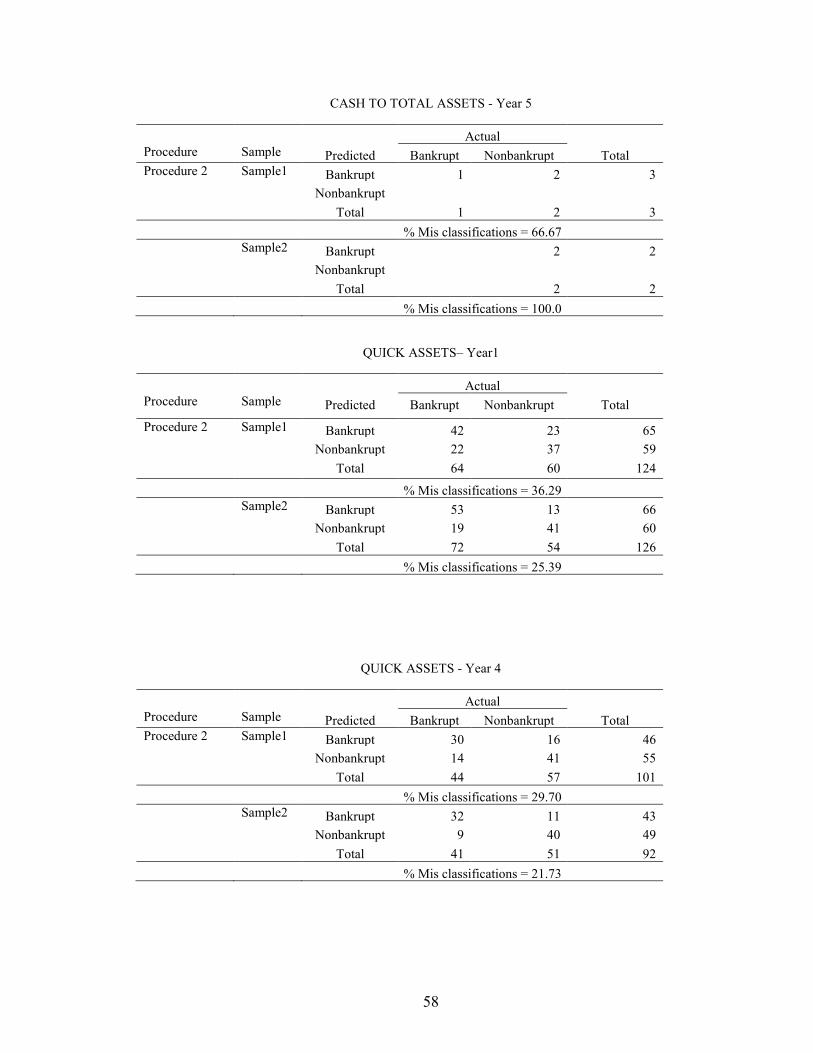
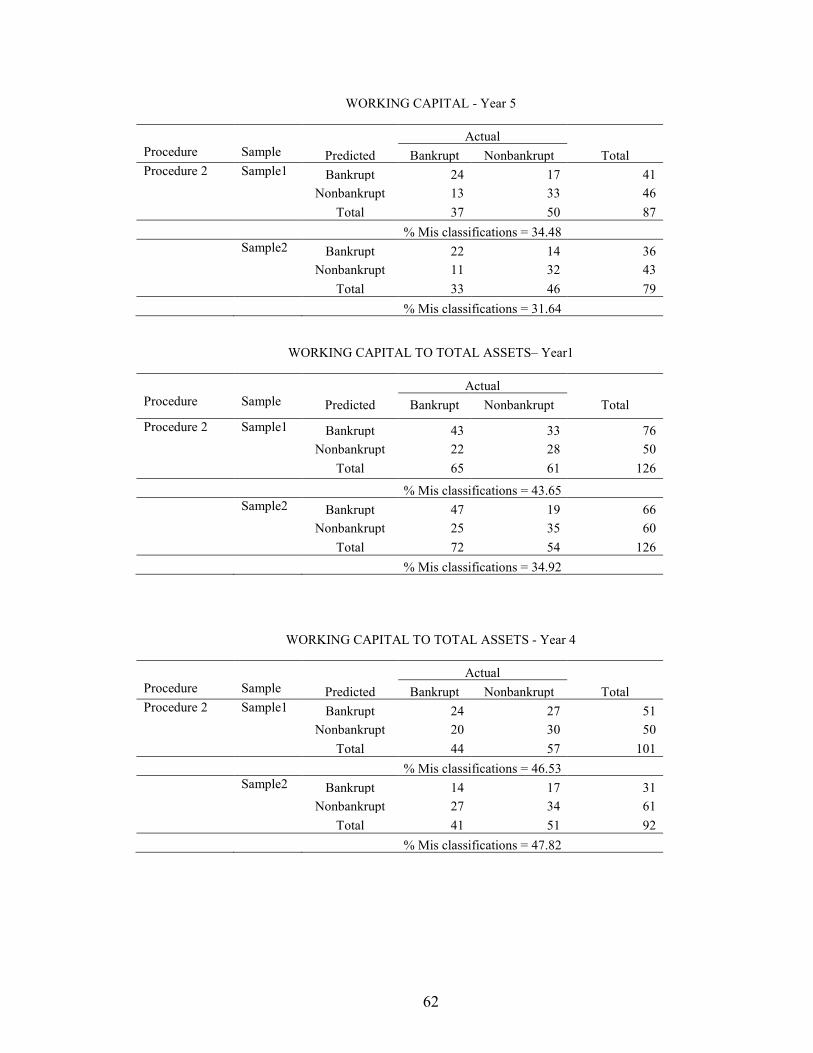
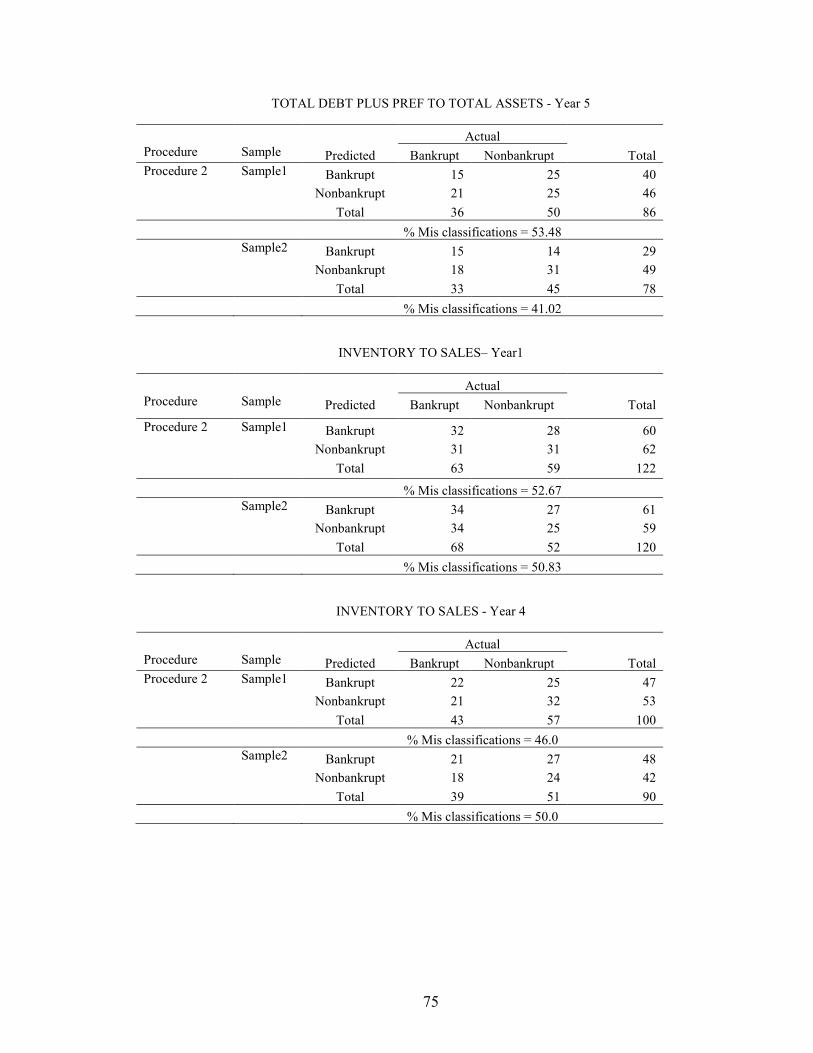
Table 3
Contingency Table Results for Classification Tests of Ratios
This table presents the contingency tables of classifying firms as either bankrupt or nonbankrupt by using a cutoff point for each variable or ratio that minimizes the misclassification rate. Procedure 2 classifies firms in each sample by using a cutoff derived from the other sample. Year 1 is one year before bankruptcy and
year 5 is five years before bankruptcy.
SHROUT – Year1
Actual Procedure Sample Predicted Bankrupt Nonbankrupt Total
Procedure 2 Sample1 Bankrupt 37 24 61 Nonbankrupt 27 39 66 Total 64 63 127 % Mis classifications = 40.15 Sample2 Bankrupt 38 20 58 Nonbankrupt 35 34 69 Total 73 54 127 % Mis classifications = 43.30
SHROUT - Year 4
Actual Procedure Sample Predicted Bankrupt Nonbankrupt Total Procedure 2 Sample1 Bankrupt 30 25 55 Nonbankrupt 14 34 48 Total 44 59 103 % Mis classifications = 37.86 Sample2 Bankrupt 31 18 49 Nonbankrupt 10 33 43 Total 41 51 92 % Mis classifications = 30.43

52
SHROUT - Year 5
Actual Procedure Sample Predicted Bankrupt Nonbankrupt Total Procedure 2 Sample1 Bankrupt 24 22 46 Nonbankrupt 13 30 43 Total 37 52 89 % Mis classifications = 39.32 Sample2 Bankrupt 23 17 40 Nonbankrupt 10 29 39 Total 33 46 79 % Mis classifications = 34.17
PRC– Year1
Actual Procedure Sample Predicted Bankrupt Nonbankrupt Total
Procedure 2 Sample1 Bankrupt 47 25 72 Nonbankrupt 16 37 53 Total 63 62 125 % Mis classifications = 32.8 Sample2 Bankrupt 59 24 83 Nonbankrupt 14 30 44 Total 73 54 127 % Mis classifications = 29.92
PRC - Year 4
Actual Procedure Sample Predicted Bankrupt Nonbankrupt Total Procedure 2 Sample1 Bankrupt 22 14 36 Nonbankrupt 22 45 67 Total 44 59 103 % Mis classifications = 34.95 Sample2 Bankrupt 26 17 43 Nonbankrupt 15 34 49 Total 41 51 92 % Mis classifications = 34.78
53
PRC- Year 5
Actual Procedure Sample Predicted Bankrupt Nonbankrupt Total Procedure 2 Sample1 Bankrupt 15 14 29 Nonbankrupt 22 38 60 Total 37 52 89 % Mis classifications = 40.44 Sample2 Bankrupt 21 15 36 Nonbankrupt 12 31 43 Total 33 46 79 % Mis classifications = 34.17
VOL - Year1
Actual Procedure Sample Predicted Bankrupt Nonbankrupt Total
Procedure 2 Sample1 Bankrupt 38 26 64 Nonbankrupt 26 37 63 Total 64 63 127 % Mis classifications = 40.94 Sample2 Bankrupt 40 22 62 Nonbankrupt 33 32 65 Total 73 54 127 % Mis classifications = 43.30
VOL - Year 4
Actual Procedure Sample Predicted Bankrupt Nonbankrupt Total Procedure 2 Sample1 Bankrupt 27 18 45 Nonbankrupt 17 41 58 Total 44 59 103 % Mis classifications = 33.98 Sample2 Bankrupt 31 23 54 Nonbankrupt 10 28 38 Total 41 51 92 % Mis classifications = 35.86

54
VOL - Year 5
Actual Procedure Sample Predicted Bankrupt Nonbankrupt Total Procedure 2 Sample1 Bankrupt 27 23 50 Nonbankrupt 10 29 39 Total 37 52 89 % Mis classifications = 37.07 Sample2 Bankrupt 25 18 43 Nonbankrupt 8 28 36 Total 33 46 79 % Mis classifications = 32.91
NET INCOME TO SALES– Year1
Actual Procedure Sample Predicted Bankrupt Nonbankrupt Total
Procedure 2 Sample1 Bankrupt 50 31 81 Nonbankrupt 14 29 43 Total 64 60 124 % Mis classifications = 36.29 Sample2 Bankrupt 54 16 70 Nonbankrupt 14 36 50 Total 68 52 120 % Mis classifications = 25.0
NET INCOME TO SALES - Year 4
Actual Procedure Sample Predicted Bankrupt Nonbankrupt Total Procedure 2 Sample1 Bankrupt 25 22 47 Nonbankrupt 18 35 53 Total 43 57 100 % Mis classifications = 30.0 Sample2 Bankrupt 20 10 30 Nonbankrupt 19 41 60 Total 39 51 90 % Mis classifications = 32.22

55
NET INCOME TO SALES - Year 5
Actual Procedure Sample Predicted Bankrupt Nonbankrupt Total Procedure 2 Sample1 Bankrupt 20 18 38 Nonbankrupt 17 32 49 Total 37 50 87 % Mis classifications = 40.22 Sample2 Bankrupt 15 7 22 Nonbankrupt 16 39 55 Total 31 46 77 % Mis classifications = 29.87
NET INCOME TO TOTAL ASSETS– Year1
Actual Procedure Sample Predicted Bankrupt Nonbankrupt Total
Procedure 2 Sample1 Bankrupt 51 33 84 Nonbankrupt 14 30 44 Total 65 63 128 % Mis classifications = 36.71 Sample2 Bankrupt 57 19 76 Nonbankrupt 15 35 50 Total 72 54 126 % Mis classifications = 26.98
NET INCOME TO TOTAL ASSETS - Year 4
Actual Procedure Sample Predicted Bankrupt Nonbankrupt Total Procedure 2 Sample1 Bankrupt 26 24 50 Nonbankrupt 18 35 53 Total 44 59 103 % Mis classifications = 40.77 Sample2 Bankrupt 22 10 32 Nonbankrupt 19 41 60 Total 41 51 92 % Mis classifications = 31.52

56
NET INCOME TO TOTAL ASSETS - Year 5
Actual Procedure Sample Predicted Bankrupt Nonbankrupt Total Procedure 2 Sample1 Bankrupt 20 19 39 Nonbankrupt 17 33 50 Total 37 52 89 % Mis classifications = 40.44 Sample2 Bankrupt 16 6 22 Nonbankrupt 17 40 57 Total 33 46 79 % Mis classifications = 29.11
NET INCOME TO TOTAL DEBT– Year1
Actual Procedure Sample Predicted Bankrupt Nonbankrupt Total
Procedure 2 Sample1 Bankrupt 51 30 81 Nonbankrupt 13 31 44 Total 64 61 125 % Mis classifications = 34.4 Sample2 Bankrupt 54 19 73 Nonbankrupt 18 34 52 Total 72 53 125 % Mis classifications = 29.6
NET INCOME TO TOTAL DEBT - Year 4
Actual Procedure Sample Predicted Bankrupt Nonbankrupt Total Procedure 2 Sample1 Bankrupt 24 23 47 Nonbankrupt 19 34 53 Total 43 57 100 % Mis classifications = 42.0 Sample2 Bankrupt 22 10 32 Nonbankrupt 19 40 59 Total 41 50 91 % Mis classifications = 31.86

57
NET INCOME TO TOTAL DEBT - Year 5
Actual Procedure Sample Predicted Bankrupt Nonbankrupt Total Procedure 2 Sample1 Bankrupt 20 18 38 Nonbankrupt 16 32 48 Total 36 50 86 % Mis classifications = 39.53 Sample2 Bankrupt 16 6 22 Nonbankrupt 17 39 56 Total 33 45 78 % Mis classifications = 29.48
CASH TO TOTAL ASSETS– Year1
Actual Procedure Sample Predicted Bankrupt Nonbankrupt Total
Procedure 2 Sample1 Bankrupt 4 33 37 Nonbankrupt 1 19 20 Total 5 52 57 % Mis classifications = 59.64 Sample2 Bankrupt 0 15 15 Nonbankrupt 3 34 37 Total 3 49 52 % Mis classifications = 34.61
CASH TO TOTAL ASSETS - Year 4
Actual Procedure Sample Predicted Bankrupt Nonbankrupt Total Procedure 2 Sample1 Bankrupt 1 30 31 Nonbankrupt 0 15 15 Total 1 45 46 % Mis classifications = 65.21 Sample2 Bankrupt 19 19 Nonbankrupt 23 23 Total 42 42 % Mis classifications = 45.23
58
CASH TO TOTAL ASSETS - Year 5
Actual Procedure Sample Predicted Bankrupt Nonbankrupt Total Procedure 2 Sample1 Bankrupt 1 2 3 Nonbankrupt Total 1 2 3 % Mis classifications = 66.67 Sample2 Bankrupt 2 2 Nonbankrupt Total 2 2 % Mis classifications = 100.0
QUICK ASSETS– Year1
Actual Procedure Sample Predicted Bankrupt Nonbankrupt Total
Procedure 2 Sample1 Bankrupt 42 23 65 Nonbankrupt 22 37 59 Total 64 60 124 % Mis classifications = 36.29 Sample2 Bankrupt 53 13 66 Nonbankrupt 19 41 60 Total 72 54 126 % Mis classifications = 25.39
QUICK ASSETS - Year 4
Actual Procedure Sample Predicted Bankrupt Nonbankrupt Total Procedure 2 Sample1 Bankrupt 30 16 46 Nonbankrupt 14 41 55 Total 44 57 101 % Mis classifications = 29.70 Sample2 Bankrupt 32 11 43 Nonbankrupt 9 40 49 Total 41 51 92 % Mis classifications = 21.73

59
QUICK ASSETS - Year 5
Actual Procedure Sample Predicted Bankrupt Nonbankrupt Total Procedure 2 Sample1 Bankrupt 27 21 48 Nonbankrupt 10 28 38 Total 37 49 86 % Mis classifications = 36.04 Sample2 Bankrupt 26 16 42 Nonbankrupt 7 30 37 Total 33 46 79 % Mis classifications = 29.11
QUICK ASSETS TO TOTAL ASSETS– Year1
Actual Procedure Sample Predicted Bankrupt Nonbankrupt Total
Procedure 2 Sample1 Bankrupt 39 37 76 Nonbankrupt 25 23 48 Total 64 60 124 % Mis classifications = 50.0 Sample2 Bankrupt 37 20 57 Nonbankrupt 35 34 69 Total 72 54 126 % Mis classifications = 43.65
QUICK ASSETS TO TOTAL ASSETS - Year 4
Actual Procedure Sample Predicted Bankrupt Nonbankrupt Total Procedure 2 Sample1 Bankrupt 27 34 61 Nonbankrupt 17 23 40 Total 44 57 101 % Mis classifications = 50.49 Sample2 Bankrupt 17 22 39 Nonbankrupt 24 29 53 Total 41 51 92 % Mis classifications = 50.0

60
QUICK ASSETS TO TOTAL ASSETS - Year 5
Actual Procedure Sample Predicted Bankrupt Nonbankrupt Total Procedure 2 Sample1 Bankrupt 22 28 50 Nonbankrupt 15 21 36 Total 37 49 86 % Mis classifications = 50.0 Sample2 Bankrupt 13 17 30 Nonbankrupt 20 29 49 Total 33 46 79 % Mis classifications = 46.83
QUICK ASSETS TO SALES– Year1
Actual Procedure Sample Predicted Bankrupt Nonbankrupt Total
Procedure 2 Sample1 Bankrupt 29 33 62 Nonbankrupt 34 25 59 Total 63 58 121 % Mis classifications = 52.89 Sample2 Bankrupt 23 17 40 Nonbankrupt 45 35 80 Total 68 52 120 % Mis classifications = 51.67
QUICK ASSETS TO SALES - Year 4
Actual Procedure Sample Predicted Bankrupt Nonbankrupt Total Procedure 2 Sample1 Bankrupt 24 36 60 Nonbankrupt 19 19 38 Total 43 55 98 % Mis classifications = 56.12 Sample2 Bankrupt 17 21 38 Nonbankrupt 22 30 52 Total 39 51 90 % Mis classifications = 47.78

61
QUICK ASSETS TO SALES - Year 5
Actual Procedure Sample Predicted Bankrupt Nonbankrupt Total Procedure 2 Sample1 Bankrupt 18 31 49 Nonbankrupt 19 16 35 Total 37 47 84 % Mis classifications = 59.52 Sample2 Bankrupt 14 17 31 Nonbankrupt 17 29 46 Total 31 46 77 % Mis classifications = 44.15
WORKING CAPITAL– Year1
Actual Procedure Sample Predicted Bankrupt Nonbankrupt Total
Procedure 2 Sample1 Bankrupt 46 26 72 Nonbankrupt 19 35 54 Total 65 61 126 % Mis classifications = 35.71 Sample2 Bankrupt 54 14 68 Nonbankrupt 18 40 58 Total 72 54 126 % Mis classifications = 25.39
WORKING CAPITAL - Year 4
Actual Procedure Sample Predicted Bankrupt Nonbankrupt Total Procedure 2 Sample1 Bankrupt 26 18 44 Nonbankrupt 18 39 57 Total 44 57 101 % Mis classifications = 35.64 Sample2 Bankrupt 25 9 34 Nonbankrupt 16 42 58 Total 41 51 92 % Mis classifications = 27.17
62
WORKING CAPITAL - Year 5
Actual Procedure Sample Predicted Bankrupt Nonbankrupt Total Procedure 2 Sample1 Bankrupt 24 17 41 Nonbankrupt 13 33 46 Total 37 50 87 % Mis classifications = 34.48 Sample2 Bankrupt 22 14 36 Nonbankrupt 11 32 43 Total 33 46 79 % Mis classifications = 31.64
WORKING CAPITAL TO TOTAL ASSETS– Year1
Actual Procedure Sample Predicted Bankrupt Nonbankrupt Total
Procedure 2 Sample1 Bankrupt 43 33 76 Nonbankrupt 22 28 50 Total 65 61 126 % Mis classifications = 43.65 Sample2 Bankrupt 47 19 66 Nonbankrupt 25 35 60 Total 72 54 126 % Mis classifications = 34.92
WORKING CAPITAL TO TOTAL ASSETS - Year 4
Actual Procedure Sample Predicted Bankrupt Nonbankrupt Total Procedure 2 Sample1 Bankrupt 24 27 51 Nonbankrupt 20 30 50 Total 44 57 101 % Mis classifications = 46.53 Sample2 Bankrupt 14 17 31 Nonbankrupt 27 34 61 Total 41 51 92 % Mis classifications = 47.82

63
WORKING CAPITAL TO TOTAL ASSETS - Year 5
Actual Procedure Sample Predicted Bankrupt Nonbankrupt Total Procedure 2 Sample1 Bankrupt 19 27 46 Nonbankrupt 18 23 41 Total 37 50 87 % Mis classifications = 51.72 Sample2 Bankrupt 14 19 33 Nonbankrupt 19 27 46 Total 33 46 79 % Mis classifications = 48.10
WORKING CAPITAL TO SALES– Year1
Actual Procedure Sample Predicted Bankrupt Nonbankrupt Total
Procedure 2 Sample1 Bankrupt 42 32 74 Nonbankrupt 22 27 49 Total 64 59 123 % Mis classifications = 43.90 Sample2 Bankrupt 40 14 54 Nonbankrupt 28 38 66 Total 68 52 120 % Mis classifications = 35.0
WORKING CAPITAL TO SALES - Year 4
Actual Procedure Sample Predicted Bankrupt Nonbankrupt Total Procedure 2 Sample1 Bankrupt 26 36 62 Nonbankrupt 17 19 36 Total 43 55 98 % Mis classifications = 54.08 Sample2 Bankrupt 14 19 33 Nonbankrupt 25 32 57 Total 39 51 90 % Mis classifications = 48.89

64
WORKING CAPITAL TO SALES - Year 5
Actual Procedure Sample Predicted Bankrupt Nonbankrupt Total Procedure 2 Sample1 Bankrupt 20 32 52 Nonbankrupt 17 16 33 Total 37 48 85 % Mis classifications = 57.64 Sample2 Bankrupt 10 17 27 Nonbankrupt 21 29 50 Total 31 46 77 % Mis classifications = 49.35
CASH TO CURRENT LIABILITIES– Year1
Actual Procedure Sample Predicted Bankrupt Nonbankrupt Total
Procedure 2 Sample1 Bankrupt 4 26 30 Nonbankrupt 1 24 25 Total 5 50 55 % Mis classifications = 49.09 Sample2 Bankrupt 2 18 20 Nonbankrupt 1 31 32 Total 3 49 52 % Mis classifications = 36.53
CASH TO CURRENT LIABILITIES - Year 4
Actual Procedure Sample Predicted Bankrupt Nonbankrupt Total Procedure 2 Sample1 Bankrupt 1 27 28 Nonbankrupt 0 16 16 Total 1 43 44 % Mis classifications = 61.36 Sample2 Bankrupt 19 19 Nonbankrupt 23 23 Total 42 42 % Mis classifications = 54.76

65
CASH TO CURRENT LIABILITIES - Year 5
Actual Procedure Sample Predicted Bankrupt Nonbankrupt Total Procedure 2 Sample1 Bankrupt 1 2 3 Nonbankrupt Total 1 2 3 % Mis classifications = 66.67 Sample2 Bankrupt 2 2 Nonbankrupt Total 2 2 % Mis classifications = 100.0
QUICK ASSETS TO CURRENT LIABILITIES– Year1
Actual Procedure Sample Predicted Bankrupt Nonbankrupt Total
Procedure 2 Sample1 Bankrupt 43 30 73 Nonbankrupt 21 30 51 Total 64 60 124 % Mis classifications = 41.12 Sample2 Bankrupt 46 16 62 Nonbankrupt 26 38 64 Total 72 54 126 % Mis classifications = 33.33
QUICK ASSETS TO CURRENT LIABILITIES - Year 4
Actual Procedure Sample Predicted Bankrupt Nonbankrupt Total Procedure 2 Sample1 Bankrupt 26 33 59 Nonbankrupt 18 24 42 Total 44 57 101 % Mis classifications = 50.49 Sample2 Bankrupt 17 14 31 Nonbankrupt 24 37 61 Total 41 51 92 % Mis classifications = 41.3

66
QUICK ASSETS TO CURRENT LIABILITIES - Year 5
Actual Procedure Sample Predicted Bankrupt Nonbankrupt Total Procedure 2 Sample1 Bankrupt 18 29 47 Nonbankrupt 19 20 39 Total 37 49 86 % Mis classifications = 55.81 Sample2 Bankrupt 12 18 30 Nonbankrupt 21 28 49 Total 33 46 79 % Mis classifications = 49.36
CURRENT RATIO– Year1
Actual Procedure Sample Predicted Bankrupt Nonbankrupt Total
Procedure 2 Sample1 Bankrupt 42 26 68 Nonbankrupt 23 35 58 Total 65 61 126 % Mis classifications = 38.89 Sample2 Bankrupt 52 22 74 Nonbankrupt 20 32 52 Total 72 54 126 % Mis classifications = 33.33
CURRENT RATIO - Year 4
Actual Procedure Sample Predicted Bankrupt Nonbankrupt Total Procedure 2 Sample1 Bankrupt 23 24 47 Nonbankrupt 21 33 54 Total 44 57 101 % Mis classifications = 44.55 Sample2 Bankrupt 19 21 40 Nonbankrupt 22 30 52 Total 41 51 92 % Mis classifications = 46.73

67
CURRENT RATIO - Year 5
Actual Procedure Sample Predicted Bankrupt Nonbankrupt Total Procedure 2 Sample1 Bankrupt 19 24 43 Nonbankrupt 18 26 44 Total 37 50 87 % Mis classifications = 48.27 Sample2 Bankrupt 15 23 38 Nonbankrupt 18 23 41 Total 33 46 79 % Mis classifications = 51.89
CASH TO SALES– Year1
Actual Procedure Sample Predicted Bankrupt Nonbankrupt Total
Procedure 2 Sample1 Bankrupt 4 25 29 Nonbankrupt 1 26 27 Total 5 51 56 % Mis classifications = 46.42 Sample2 Bankrupt 0 20 20 Nonbankrupt 2 29 31 Total 2 49 51 % Mis classifications = 43.13
CASH TO SALES - Year 4
Actual Procedure Sample Predicted Bankrupt Nonbankrupt Total Procedure 2 Sample1 Bankrupt 1 25 26 Nonbankrupt 0 20 20 Total 1 45 46 % Mis classifications = 54.34 Sample2 Bankrupt 23 23 Nonbankrupt 19 19 Total 42 42 % Mis classifications = 54.76

68
CASH TO SALES - Year 5
Actual Procedure Sample Predicted Bankrupt Nonbankrupt Total Procedure 2 Sample1 Bankrupt 1 2 3 Nonbankrupt Total 1 2 3 % Mis classifications = 66.67 Sample2 Bankrupt 1 1 Nonbankrupt 1 1 Total 2 2 % Mis classifications = 50.0
CURRENT ASSETS TO SALES– Year1
Actual Procedure Sample Predicted Bankrupt Nonbankrupt Total
Procedure 2 Sample1 Bankrupt 31 36 67 Nonbankrupt 33 23 56 Total 64 59 123 % Mis classifications = 56.09 Sample2 Bankrupt 22 17 39 Nonbankrupt 46 35 81 Total 68 52 120 % Mis classifications = 52.5
CURRENT ASSETS TO SALES - Year 4
Actual Procedure Sample Predicted Bankrupt Nonbankrupt Total Procedure 2 Sample1 Bankrupt 26 37 63 Nonbankrupt 17 18 35 Total 43 55 98 % Mis classifications = 55.10 Sample2 Bankrupt 14 21 35 Nonbankrupt 25 30 55 Total 39 51 90 % Mis classifications = 51.11

69
CURRENT ASSETS TO SALES - Year 5
Actual Procedure Sample Predicted Bankrupt Nonbankrupt Total Procedure 2 Sample1 Bankrupt 21 33 54 Nonbankrupt 16 15 31 Total 37 48 85 % Mis classifications = 57.64 Sample2 Bankrupt 11 19 30 Nonbankrupt 20 27 47 Total 31 46 77 % Mis classifications = 50.64
SPREAD– Year1
Actual Procedure Sample Predicted Bankrupt Nonbankrupt Total
Procedure 2 Sample1 Bankrupt 0 2 2 Nonbankrupt 4 0 4 Total 4 2 6 % Mis classifications = 100.0 Sample2 Bankrupt 3 0 3 Nonbankrupt 3 1 4 Total 6 1 7 % Mis classifications = 42.85
SPREAD - Year 4
Actual Procedure Sample Predicted Bankrupt Nonbankrupt Total Procedure 2 Sample1 Bankrupt 4 0 4 Nonbankrupt 0 1 1 Total 4 1 5 % Mis classifications = 0 Sample2 Bankrupt 1 1 Nonbankrupt 2 2 Total 3 3 % Mis classifications = 66.67

70
SPREAD - Year 5
Actual Procedure Sample Predicted Bankrupt Nonbankrupt Total Procedure 2 Sample1 Bankrupt 3 1 4 Nonbankrupt 1 1 2 Total 4 2 6 % Mis classifications = 33.33 Sample2 Bankrupt 1 0 1 Nonbankrupt 4 1 5 Total 5 1 6 % Mis classifications = 66.67
TOTAL DEBT– Year1
Actual Procedure Sample Predicted Bankrupt Nonbankrupt Total
Procedure 2 Sample1 Bankrupt 29 45 74 Nonbankrupt 35 16 51 Total 64 61 125 % Mis classifications = 64.0 Sample2 Bankrupt 33 30 63 Nonbankrupt 39 23 62 Total 72 53 125 % Mis classifications = 55.2
TOTAL DEBT - Year 4
Actual Procedure Sample Predicted Bankrupt Nonbankrupt Total Procedure 2 Sample1 Bankrupt 19 37 56 Nonbankrupt 24 20 44 Total 43 57 100 % Mis classifications = 61.0 Sample2 Bankrupt 11 30 41 Nonbankrupt 30 20 50 Total 41 50 91 % Mis classifications = 65.93

71
TOTAL DEBT - Year 5
Actual Procedure Sample Predicted Bankrupt Nonbankrupt Total Procedure 2 Sample1 Bankrupt 10 34 44 Nonbankrupt 26 16 42 Total 36 50 86 % Mis classifications = 69.76 Sample2 Bankrupt 9 25 34 Nonbankrupt 24 20 44 Total 33 45 78 % Mis classifications = 62.82
CURRENT LIABILITIES TO TOTAL ASSETS– Year1
Actual Procedure Sample Predicted Bankrupt Nonbankrupt Total
Procedure 2 Sample1 Bankrupt 47 27 74 Nonbankrupt 18 34 52 Total 65 61 126 % Mis classifications = 35.71 Sample2 Bankrupt 44 22 66 Nonbankrupt 28 32 60 Total 72 54 126 % Mis classifications = 39.68
CURRENT LIABILITIES TO TOTAL ASSETS - Year 4
Actual Procedure Sample Predicted Bankrupt Nonbankrupt Total Procedure 2 Sample1 Bankrupt 26 25 51 Nonbankrupt 18 32 50 Total 44 57 101 % Mis classifications = 42.57 Sample2 Bankrupt 23 19 42 Nonbankrupt 18 32 50 Total 41 51 92 % Mis classifications = 40.21

72
CURRENT LIABILITIES TO TOTAL ASSETS - Year 5
Actual Procedure Sample Predicted Bankrupt Nonbankrupt Total Procedure 2 Sample1 Bankrupt 16 24 40 Nonbankrupt 21 26 47 Total 37 50 87 % Mis classifications = 51.72 Sample2 Bankrupt 14 21 35 Nonbankrupt 19 25 44 Total 33 46 79 % Mis classifications = 50.63
LONGTERM LIABILITIES TO TOTAL ASSETS– Year1
Actual Procedure Sample Predicted Bankrupt Nonbankrupt Total
Procedure 2 Sample1 Bankrupt 38 37 75 Nonbankrupt 26 24 50 Total 64 61 125 % Mis classifications = 50.4 Sample2 Bankrupt 40 23 63 Nonbankrupt 32 30 62 Total 72 53 125 % Mis classifications = 44.0
LONGTERM LIABILITIES TO TOTAL ASSETS - Year 4
Actual Procedure Sample Predicted Bankrupt Nonbankrupt Total Procedure 2 Sample1 Bankrupt 18 32 50 Nonbankrupt 25 25 50 Total 43 57 100 % Mis classifications = 57.0 Sample2 Bankrupt 19 23 42 Nonbankrupt 22 27 49 Total 41 50 91 % Mis classifications = 49.45

73
LONGTERM LIABILITIES TO TOTAL ASSETS - Year 5
Actual Procedure Sample Predicted Bankrupt Nonbankrupt Total Procedure 2 Sample1 Bankrupt 19 28 47 Nonbankrupt 17 22 39 Total 36 50 86 % Mis classifications = 52.32 Sample2 Bankrupt 11 17 28 Nonbankrupt 22 28 50 Total 33 45 78 % Mis classifications = 50.0
TOTAL DEBT TO TOTAL ASSETS– Year1
Actual Procedure Sample Predicted Bankrupt Nonbankrupt Total
Procedure 2 Sample1 Bankrupt 45 32 77 Nonbankrupt 19 29 48 Total 64 61 125 % Mis classifications = 40.8 Sample2 Bankrupt 47 16 63 Nonbankrupt 25 37 62 Total 72 53 125 % Mis classifications = 32.8
TOTAL DEBT TO TOTAL ASSETS - Year 4
Actual Procedure Sample Predicted Bankrupt Nonbankrupt Total Procedure 2 Sample1 Bankrupt 25 26 51 Nonbankrupt 18 31 49 Total 43 57 100 % Mis classifications = 44.0 Sample2 Bankrupt 18 15 33 Nonbankrupt 23 35 58 Total 41 50 91 % Mis classifications = 52.74

74
TOTAL DEBT TO TOTAL ASSETS - Year 5
Actual Procedure Sample Predicted Bankrupt Nonbankrupt Total Procedure 2 Sample1 Bankrupt 15 25 40 Nonbankrupt 21 25 46 Total 36 50 86 % Mis classifications = 53.48 Sample2 Bankrupt 13 16 29 Nonbankrupt 20 29 49 Total 33 45 78 % Mis classifications = 46.15
TOTAL DEBT PLUS PREF TO TOTAL ASSETS– Year1
Actual Procedure Sample Predicted Bankrupt Nonbankrupt Total
Procedure 2 Sample1 Bankrupt 46 32 78 Nonbankrupt 18 29 47 Total 64 61 125 % Mis classifications = 40.0 Sample2 Bankrupt 48 15 63 Nonbankrupt 24 37 61 Total 72 52 124 % Mis classifications = 31.45
TOTAL DEBT PLUS PREF TO TOTAL ASSETS - Year 4
Actual Procedure Sample Predicted Bankrupt Nonbankrupt Total Procedure 2 Sample1 Bankrupt 26 26 52 Nonbankrupt 17 31 48 Total 43 57 100 % Mis classifications = 43.0 Sample2 Bankrupt 17 15 32 Nonbankrupt 24 35 59 Total 41 50 91 % Mis classifications = 42.85
75
TOTAL DEBT PLUS PREF TO TOTAL ASSETS - Year 5
Actual Procedure Sample Predicted Bankrupt Nonbankrupt Total Procedure 2 Sample1 Bankrupt 15 25 40 Nonbankrupt 21 25 46 Total 36 50 86 % Mis classifications = 53.48 Sample2 Bankrupt 15 14 29 Nonbankrupt 18 31 49 Total 33 45 78 % Mis classifications = 41.02
INVENTORY TO SALES– Year1
Actual Procedure Sample Predicted Bankrupt Nonbankrupt Total
Procedure 2 Sample1 Bankrupt 32 28 60 Nonbankrupt 31 31 62 Total 63 59 122 % Mis classifications = 52.67 Sample2 Bankrupt 34 27 61 Nonbankrupt 34 25 59 Total 68 52 120 % Mis classifications = 50.83
INVENTORY TO SALES - Year 4
Actual Procedure Sample Predicted Bankrupt Nonbankrupt Total Procedure 2 Sample1 Bankrupt 22 25 47 Nonbankrupt 21 32 53 Total 43 57 100 % Mis classifications = 46.0 Sample2 Bankrupt 21 27 48 Nonbankrupt 18 24 42 Total 39 51 90 % Mis classifications = 50.0

76
INVENTORY TO SALES - Year 5
Actual Procedure Sample Predicted Bankrupt Nonbankrupt Total Procedure 2 Sample1 Bankrupt 19 28 47 Nonbankrupt 18 20 38 Total 37 48 85 % Mis classifications = 54.11 Sample2 Bankrupt 16 24 40 Nonbankrupt 15 22 37 Total 31 46 77 % Mis classifications = 50.64
TOTAL ASSETS TO SALES– Year1
Actual Procedure Sample Predicted Bankrupt Nonbankrupt Total
Procedure 2 Sample1 Bankrupt 33 28 61 Nonbankrupt 31 33 64 Total 64 61 125 % Mis classifications = 47.2 Sample2 Bankrupt 41 29 70 Nonbankrupt 27 23 50 Total 68 52 120 % Mis classifications = 46.67
TOTAL ASSETS TO SALES - Year 4
Actual Procedure Sample Predicted Bankrupt Nonbankrupt Total Procedure 2 Sample1 Bankrupt 19 27 46 Nonbankrupt 24 30 54 Total 43 57 100 % Mis classifications = 51.0 Sample2 Bankrupt 17 24 41 Nonbankrupt 22 27 49 Total 39 51 90 % Mis classifications = 51.11

77
TOTAL ASSETS TO SALES - Year 5
Actual Procedure Sample Predicted Bankrupt Nonbankrupt Total Procedure 2 Sample1 Bankrupt 18 24 42 Nonbankrupt 19 26 45 Total 37 50 87 % Mis classifications = 49.42 Sample2 Bankrupt 15 21 36 Nonbankrupt 16 25 41 Total 31 46 77 % Mis classifications = 48.05
BID ASK SPREAD– Year1
Actual Procedure Sample Predicted Bankrupt Nonbankrupt Total
Procedure 2 Sample1 Bankrupt 39 11 50 Nonbankrupt 23 51 74 Total 62 62 124 % Mis classifications = 27.41 Sample2 Bankrupt 34 8 42 Nonbankrupt 37 46 83 Total 71 54 125 % Mis classifications = 36.0
BID ASK SPREAD - Year 4
Actual Procedure Sample Predicted Bankrupt Nonbankrupt Total Procedure 2 Sample1 Bankrupt 37 30 67 Nonbankrupt 7 29 36 Total 44 59 103 % Mis classifications = 35.92 Sample2 Bankrupt 34 15 49 Nonbankrupt 6 36 42 Total 40 51 91 % Mis classifications = 20.37

78
BID ASK SPREAD - Year 5
Actual Procedure Sample Predicted Bankrupt Nonbankrupt Total Procedure 2 Sample1 Bankrupt 28 19 47 Nonbankrupt 6 32 38 Total 34 51 85 % Mis classifications = 29.41 Sample2 Bankrupt 24 11 35 Nonbankrupt 6 35 41 Total 30 46 76 % Mis classifications = 22.36
HI LO BID ASK SPREAD– Year1
Actual Procedure Sample Predicted Bankrupt Nonbankrupt Total
Procedure 2 Sample1 Bankrupt 24 33 57 Nonbankrupt 40 30 70 Total 64 63 127 % Mis classifications = 57.48 Sample2 Bankrupt 22 24 46 Nonbankrupt 51 30 81 Total 73 54 127 % Mis classifications = 59.05
HI LO BID ASK SPREAD - Year 4
Actual Procedure Sample Predicted Bankrupt Nonbankrupt Total Procedure 2 Sample1 Bankrupt 24 42 66 Nonbankrupt 20 17 37 Total 44 59 103 % Mis classifications = 60.19 Sample2 Bankrupt 22 26 48 Nonbankrupt 19 25 44 Total 41 51 92 % Mis classifications = 48.91

79
HI LO BID ASK SPREAD - Year 5
Actual Procedure Sample Predicted Bankrupt Nonbankrupt Total Procedure 2 Sample1 Bankrupt 22 34 56 Nonbankrupt 15 18 33 Total 37 52 89 % Mis classifications = 55.05 Sample2 Bankrupt 10 19 29 Nonbankrupt 23 27 50 Total 33 46 79 % Mis classifications = 53.16
CASHFLOW TO SALES– Year1
Actual Procedure Sample Predicted Bankrupt Nonbankrupt Total
Procedure 2 Sample1 Bankrupt 58 28 86 Nonbankrupt 8 28 36 Total 66 56 122 % Mis classifications = 29.5 Sample2 Bankrupt 44 15 59 Nonbankrupt 18 42 60 Total 62 57 119 % Mis classifications = 27.73
CASHFLOW TO SALES - Year 4
Actual Procedure Sample Predicted Bankrupt Nonbankrupt Total Procedure 2 Sample1 Bankrupt 23 21 44 Nonbankrupt 14 33 47 Total 37 54 91 % Mis classifications = 38.46 Sample2 Bankrupt 11 13 24 Nonbankrupt 18 40 58 Total 29 53 82 % Mis classifications = 37.80

80
CASHFLOW TO SALES - Year 5
Actual Procedure Sample Predicted Bankrupt Nonbankrupt Total Procedure 2 Sample1 Bankrupt 19 20 39 Nonbankrupt 9 28 37 Total 28 48 76 % Mis classifications = 38.15 Sample2 Bankrupt 8 7 15 Nonbankrupt 12 40 52 Total 20 47 67 % Mis classifications = 28.35
CASHFLOW TO TOTAL ASSETS– Year1
Actual Procedure Sample Predicted Bankrupt Nonbankrupt Total
Procedure 2 Sample1 Bankrupt 57 27 84 Nonbankrupt 10 30 40 Total 67 57 124 % Mis classifications = 29.83 Sample2 Bankrupt 49 21 70 Nonbankrupt 16 38 54 Total 65 59 124 % Mis classifications = 29.83
CASHFLOW TO TOTAL ASSETS - Year 4
Actual Procedure Sample Predicted Bankrupt Nonbankrupt Total Procedure 2 Sample1 Bankrupt 25 19 44 Nonbankrupt 12 36 48 Total 37 55 92 % Mis classifications = 33.69 Sample2 Bankrupt 14 11 25 Nonbankrupt 17 43 60 Total 31 54 85 % Mis classifications = 32.94

81
CASHFLOW TO TOTAL ASSETS - Year 5
Actual Procedure Sample Predicted Bankrupt Nonbankrupt Total Procedure 2 Sample1 Bankrupt 18 16 34 Nonbankrupt 10 33 43 Total 28 49 77 % Mis classifications = 33.76 Sample2 Bankrupt 11 6 17 Nonbankrupt 11 42 53 Total 22 48 70 % Mis classifications = 24.28
CASHFLOW TO TOTAL DEBT– Year1
Actual Procedure Sample Predicted Bankrupt Nonbankrupt Total
Procedure 2 Sample1 Bankrupt 58 25 83 Nonbankrupt 9 31 40 Total 67 56 123 % Mis classifications = 27.64 Sample2 Bankrupt 49 19 68 Nonbankrupt 15 38 53 Total 64 57 121 % Mis classifications = 28.09
CASHFLOW TO TOTAL DEBT - Year 4
Actual Procedure Sample Predicted Bankrupt Nonbankrupt Total Procedure 2 Sample1 Bankrupt 24 19 43 Nonbankrupt 13 35 48 Total 37 54 91 % Mis classifications = 35.16 Sample2 Bankrupt 15 11 26 Nonbankrupt 15 41 56 Total 30 52 82 % Mis classifications = 31.70

82
CASHFLOW TO TOTAL DEBT - Year 5
Actual Procedure Sample Predicted Bankrupt Nonbankrupt Total Procedure 2 Sample1 Bankrupt 17 18 35 Nonbankrupt 11 30 41 Total 28 48 76 % Mis classifications = 38.15 Sample2 Bankrupt 11 6 17 Nonbankrupt 10 40 50 Total 21 46 67 % Mis classifications = 23.88
RETURN– Year1
Actual Procedure Sample Predicted Bankrupt Nonbankrupt Total
Procedure 2 Sample1 Bankrupt 20 42 62 Nonbankrupt 47 14 61 Total 67 56 123 % Mis classifications = 72.35 Sample2 Bankrupt 21 48 69 Nonbankrupt 41 10 51 Total 62 58 120 % Mis classifications = 74.16
RETURN - Year 4
Actual Procedure Sample Predicted Bankrupt Nonbankrupt Total Procedure 2 Sample1 Bankrupt 23 32 55 Nonbankrupt 19 18 37 Total 42 50 92 % Mis classifications = 55.43 Sample2 Bankrupt 22 27 49 Nonbankrupt 14 23 37 Total 36 50 86 % Mis classifications = 47.67

83
RETURN - Year 5
Actual Procedure Sample Predicted Bankrupt Nonbankrupt Total Procedure 2 Sample1 Bankrupt 18 24 42 Nonbankrupt 11 24 35 Total 29 48 77 % Mis classifications = 45.45 Sample2 Bankrupt 17 24 41 Nonbankrupt 13 23 36 Total 30 47 77 % Mis classifications = 48.05
STANDARD DEVIATION OF RETURN– Year1
Actual Procedure Sample Predicted Bankrupt Nonbankrupt Total
Procedure 2 Sample1 Bankrupt 31 20 51 Nonbankrupt 14 33 47 Total 45 53 98 % Mis classifications = 34.69 Sample2 Bankrupt 22 17 39 Nonbankrupt 22 34 56 Total 44 51 95 % Mis classifications = 41.05
STANDARD DEVIATION OF RETURN - Year 4
Actual Procedure Sample Predicted Bankrupt Nonbankrupt Total Procedure 2 Sample1 Bankrupt 22 8 30 Nonbankrupt 16 6 22 Total 38 14 52 % Mis classifications = 46.15 Sample2 Bankrupt 20 5 25 Nonbankrupt 10 8 18 Total 30 13 43 % Mis classifications = 34.88

84
STANDARD DEVIATION OF RETURN - Year 5
Actual Procedure Sample Predicted Bankrupt Nonbankrupt Total Procedure 2 Sample1 Bankrupt 10 4 14 Nonbankrupt 6 5 11 Total 16 9 25 % Mis classifications = 40.0 Sample2 Bankrupt 5 1 6 Nonbankrupt 8 8 16 Total 13 9 22 % Mis classifications = 40.90
BETA– Year1
Actual Procedure Sample Predicted Bankrupt Nonbankrupt Total
Procedure 2 Sample1 Bankrupt 25 33 58 Nonbankrupt 17 10 27 Total 42 43 85 % Mis classifications = 58.82 Sample2 Bankrupt 20 29 49 Nonbankrupt 18 24 42 Total 38 53 91 % Mis classifications = 51.64
BETA - Year 4
Actual Procedure Sample Predicted Bankrupt Nonbankrupt Total Procedure 2 Sample1 Bankrupt 17 5 22 Nonbankrupt 11 0 11 Total 28 5 33 % Mis classifications = 48.48 Sample2 Bankrupt 16 5 21 Nonbankrupt 8 2 10 Total 24 7 31 % Mis classifications = 41.93

85
BETA - Year 5
Actual Procedure Sample Predicted Bankrupt Nonbankrupt Total Procedure 2 Sample1 Bankrupt 10 24 34 Nonbankrupt 10 11 21 Total 20 35 55 % Mis classifications = 61.81 Sample2 Bankrupt 12 23 35 Nonbankrupt 4 22 26 Total 16 45 61 % Mis classifications = 44.26

86
2.6 Summary and Conclusions
The literature on bankruptcy prediction has focused on utilizing accounting ratios,
backward-looking variables. While these have provided decent predictive power, they do
not tell the whole story. To add to the literature, we have included market and
microstructure variables in our analysis. These variables are forward-looking since they
are derived from discounted estimates of the future. Therefore, any type of predictive
process should employ variables that are focused on the future.
We find that the best performing predictors are price, standard deviation, and bid-
ask spread. The market correctly signals that the future of a distressed firm is grim.
However, accounting ratios still have explanatory power, namely those ratios that include
working capital, net income, and current liabilities. Cash flow plays a less important role
in correctly classifying distressed firms than is found in the prior literature. Therefore,
our most important findings are that, while accounting ratios are still important to
bankruptcy prediction, market variables need to be included for more accuracy.
The univariate analysis is a starting point in understanding how the different
underlying variables behave prior to bankruptcy. However, a firm is not just one puzzle
piece, but rather a sum of all of the pieces. While many of the pieces alone might not
signal distress, together a very differ story is painted. Hence, we will now move on to
multivariate analysis. Certain variables that did not play important roles in the univariate
analysis might actually be extremely important when looking at the picture as a whole.
This is where we begin the next chapter.

87
CHAPTER 3: MULTIVARIATE DISCIMINANT ANALYSIS
3.1 Introduction
Bankruptcy prediction has been thoroughly investigated in the literature,
especially with financial ratios as predictors. The main models used in bankruptcy
prediction have been discriminant analysis and logit regression. The assumption of
multivariate normality of the ratios used in these models is an important one. Any
significant deviation from normality will put into question any conclusions made with the
models. Karels and Prakash (1987) study the financial ratios used in previous studies.
The preliminary results demonstrate statistical significance of multivariate skewness and
kurtosis for the ratios used in the prior studies. A set of ratios that best conforms to
multivariate normality is selected and used for prediction. However, most of the ratios
used are accounting ratios, while only a couple are market variables. Following the
results found in essay one, a set of variables will be selected that best conforms to
multivariate normality. One set will contain only accounting ratios, another will contain
only market variables, and the last will contain a mixture of the two. While market
variables have been previously included in bankruptcy prediction, the assumptions
underlying these models have not been verified. Furthermore, microstructure variables in
a study of this kind have not been included.
This study attempts to describe and distinguish these two groups. The remainder
of this paper is organized as follows: Section 3.2 reviews the previous literature
associated with bankruptcy prediction and multivariate discriminant analysis. Section 3.3
discusses the data used in this study. Section 3.4 describes the methodology. Section 3.5
discusses the results, and Section 3.6 summarizes and concludes.

88
3.2 Literature Review
The literature of bankruptcy prediction, and especially those applying multivariate
discriminant analyses, is vast. The focus of most studies is the usefulness of accounting
ratios in discriminating between bankrupt and non-bankrupt firms. The genesis of this
methodology in bankruptcy prediction can be traced back to Altman (1968).
Altman (1968) extends the univariate analysis used for bankruptcy prediction.
Employing twenty-two ratios that have been used in the prior literature, Altman finds that
five ratios are best at discriminating between bankrupt and non-bankrupt firms. Even
though some of these ratios performed poorly in a univariate setting, they still boosted the
discriminating power of the function. The ratios are Working Capital/Total Assets,
Retained Earnings/Total Assets, Earnings Before Interest and Taxes/Total Assets, Market
Value of Equity/Book Value of Total Debt, and Sales/Total Assets. This analysis results
in correctly classifying 94% of the bankrupt firms in the original sample, and 95% of the
firms in the bankrupt and non-bankrupt samples.
Deakin (1972) extends the research done by Beaver (1968) and Altman (1968),
and his results support those found in the prior literature. Blum (1974) performs a similar
analysis, finding 94% accuracy one year before failure, 80% accuracy two years before
failure, and 70% accuracy three to five years before failure. Most important, Type II
errors occur less than Type I errors one year before bankruptcy. In agreement with
Beaver (1968), Cash Flow/Total Debt is found to be the best predictor. Interestingly, a
market variable included in his analysis does not enhance predictability.
Moyer (1977) applies Altman’s (1968) methodology and concludes that the model
does not perform as well out-of-sample, and that predictive accuracy is modest when

89
larger firms are included in the analysis. Re-estimating the model parameters, Moyer
finds that two of the discriminating variables can be eliminated leading to better
explanatory power.
Ketz (1978) tests the hypothesis that price-level variables are better at correctly
classifying failed and non-failed firms than are historical accounting ratios. The R2,
overall error rates, and error rates of classifying non-failed firms are equivalent using
both methods, but the price-level variables show lower error rates in misclassifying failed
firms. Norton and Smith (1979) perform a similar study, but find that the two different
sets of variables perform relatively equally, meaning that price-level variables do not
improve the predictability of bankruptcy prediction models.
Booth (1983) employs a decomposition measure to predict financial failure and
discriminate between failed and non-failed firms. The decomposition measures are total
assets, total liabilities, total equities, and total balance sheet, and these measures represent
the change in the balance sheet from year to year. The findings do not support the
inclusion of decomposition measures in bankruptcy prediction.
Hennaway and Morris (1983) develop multivariate discriminant models each
year, one to five years before bankruptcy, and also incorporate macro-level and industry-
level variables/indicators. The main finding is that the models perform well one to five
years before failure, which is important since earlier predictions are desirable.
Frydman et al. (1985) focus on the issues with discriminant analysis, along with
other parametric models, namely the violations of the underlying assumptions. While
their non-parametric model outperforms the more traditional parametric models, the
discriminant analysis model still performs well.

90
Gombola et al. (1987) focus on the ability of Cash Flow from Operations to
predict financial deterioration. Previous studies find this to be an important variable in
bankruptcy prediction. Their main finding is that the Cash Flow variables’ predictive
ability declines over time, going from a significant to an insignificant discriminatory
variable. However, Aziz et al. (1988) find that Cash Flow based models perform well in
relation to the traditional models, especially three or more years prior to bankruptcy.
McGurr and DeVaney (1998) study the financial ratios and cash flow items of
bankrupt and non-bankrupt retail firms. They conclude that there are three apparent
biases: industry bias (different ratio levels for companies in different industries),
population bias (changing population over time in Compustat, leading to a bias in older
studies), and time bias (the effect of recessionary and expansionary periods on different
industries). Yang et al. (1999) compare MDA to newer, more data-intensive techniques,
and find that MDA still performs better in bankruptcy prediction. However, Dimitras et
al. (1999) find that using rough sets to avoid some of the limiting assumptions underlying
MDA provides better predictive results. Brockman and Turtle (2003) apply an options
framework to bankruptcy prediction and find that this outperforms Z-scores found
through MDA.
3.3 Data
The list of bankrupt firms was obtained from bankruptcydata.com. The list
includes companies the filed for bankruptcy from January 1995 to December 2010. The
subsample of non-bankrupt firms comes from the entire database of Compustat,
consisting of firms that did not file for bankruptcy during our sample period. The

91
accounting ratios for all firms, bankrupt and non-bankrupt, are obtained from Compustat.
The market variables for these firms were obtained from CRSP.
3.4 Methodology
As is common in the bankruptcy prediction literature, the non-bankrupt firms are
selected in such a way so that firm size does not severely affect the results. Ex-ante,
successful firms are expected to be larger than failing firms. Furthermore, firm success
rates are highly influenced by their industry. For example, when the tech bubble was
growing, any firm with a dotcom in its name benefited heavily. To mitigate this issue, it
is common to select firms in such a way that size and industry factors do not distort the
results.
The procedure is two-fold. First, a bankrupt firm is selected. Second, a non-
bankrupt firm within the same industry with asset size closest to the bankrupt firm is
selected. These two firms (the one bankrupt and the one non-bankrupt) are then stored
and removed from the continuing procedure. A second bankrupt firm is selected, and the
selection process is done with the remaining non-bankrupt firms. This is done for each
bankrupt firm, so that in the end there are an equal number of bankrupt and non-bankrupt
firms.
Before beginning the MDA, it is important to check whether or not the underlying
assumptions are upheld (notably the normality assumptions and the equality of the
dispersion matrices). We begin by studying the individual distribution of each ratio. To
test for univariate normality, we employ the Shapiro-Wilk W test. The procedure is as
follows:
H0: The parent population is normal.

92
H1: The parent population is not normal.
The procedure is as follows:
1. Let FVij be the ith financial variable for the jth company (i=1, 2,…,k;
j=1,2,…,n), where FVin and FVi1 are the largest and smallest ratios over all the
companies in the sample.
2. Arrange the ratios in decreasing order:
a. FVi1≤FVi2≤…≤FVin
3. Set m=n/2 if n is even, (n-1)/2 otherwise.
4. Calculate:
a. 𝑏𝑖 = 𝑎𝑛(𝐹𝑉𝑖𝑛 − 𝐹𝑉𝑖1) + ⋯+ 𝑎𝑛−𝑚+1(𝐹𝑉𝑖,𝑛−𝑚+1 − 𝐹𝑉𝑖𝑚)
b. 𝑎𝑖 can be found in Hahn and Shapiro (1970).
5. Calculate:
a. 𝑆𝑖2 = 1𝑛∑ (𝑛𝑗=1 𝐹𝑉𝑖𝑗 − 𝐹𝑉𝑖𝑏𝑎𝑟)
6. Calculate the W-statistic:
a. 𝑊𝑖 = 𝑏𝑖2
𝑆𝑖2 for each ratio (i=1,2,…,k).
Small values for Wi will indicate non-normality. Due to the fact that financial variables
tend to more often be lognormally distributed, the same procedure will be done to the
logarithm of the ratios.
Next, since an important assumption of the MDA is multivariate normality, we
will test to check whether or not the set of ratios selected are multivariate normal. To do
so, we employ Maridia’s test of multivariate normality, which tests skewness and kurtosis

93
statistics. As a robustness check, the Henze-Zirkler T test is also used. The Mardia test is
as follows:
Let V be a vector of p financial variables with Vr as the rth element of the vector,
µ as the unknown mean vector, and ∑ as the covariance-variance matrix. The test then
depends on an augmentation of the univariate measures of skewness and kurtosis. The
steps are as follows:
Skewness:
1. Calculate the p- sample means:
a. 𝑉𝑟𝑏𝑎𝑟 = 1𝑛∑ 𝑉𝑟𝑖𝑛𝑖=1
b. For any two attributes 𝑉𝑟 and 𝑉𝑟′, calculate the sum of squares:
i. 𝑆𝑟𝑟′ = 1𝑛∑ (𝑉𝑟𝑖 − 𝑉𝑟𝑏𝑎𝑟𝑛𝑖=1 )(𝑉𝑟′𝑖 − 𝑉𝑟′𝑏𝑎𝑟)
c. For any three attributes 𝑉𝑟, 𝑉𝑞 ,𝑎𝑛𝑑 𝑉𝑦 , calculate:
i. 𝑀𝑟𝑞𝑦 = 1𝑛∑ (𝑉𝑟𝑖 − 𝑉𝑟𝑏𝑎𝑟𝑛𝑖=1 )(𝑉𝑞𝑖 − 𝑉𝑞𝑏𝑎𝑟)(𝑉𝑦𝑖 − 𝑉𝑦𝑏𝑎𝑟)
2. Calculate the multivariate measure of skewness:
a. 𝑏1,𝑝 = ∑ ∑ 𝑆𝑟𝑟′𝑆𝑞𝑞′𝑆𝑦𝑦′𝑟′𝑞′𝑦′𝑟,𝑞,𝑦 𝑀𝑟𝑞𝑦𝑀𝑟′𝑞′𝑦′
i. where 𝑆𝑟𝑟′ = 𝑆𝑟𝑟′−1 .
3. Under the null hypothesis 𝐻0: 𝛽1,𝑝 = 0, the test statistic 𝐴 = 1/6𝑛 𝑏1,𝑝 will
follow a chi-squared distribution with p(p+1)(p+2)/6 degrees of freedom.
Kurtosis:
1. Calculate:
𝑏2,𝑝 =1𝑛�[(𝑉𝑟𝑖 − 𝑉𝑟𝑏𝑎𝑟𝑛
𝑖=1
)𝑆𝑟𝑞(𝑉𝑞𝑖 − 𝑉𝑞𝑏𝑎𝑟)]2 =1𝑛�(𝑉𝑖 − 𝑉𝑏𝑎𝑟)′𝑛
𝑖=1
𝑆−1(𝑉𝑖 − 𝑉𝑏𝑎𝑟)]2

94
i. where 𝑉𝑖 = �𝑉1𝑖,𝑉2𝑖, … ,𝑉𝑝𝑖�, 𝑖 = 1,2, … , 𝑛 is the vector of the ith
measure on each of the p-attributes, Vbar is the vector of sample
means for the p-sample, and 𝑆−1 is the inverse of the sample
variance-covariance matrix.
2. Under the null hypothesis 𝐻0:𝛽2,𝑝 = 𝑝(𝑝 + 2), the test statistic 𝐵 =
𝑏2,𝑝−𝛽2,𝑝
[8𝑝(𝑝+2)𝑛 ]1/2
will be a N(0,1) variate.
Finally, since equality of the dispersion matrix is another important assumption
underlying MDA, we use Box M Test for the equality of the variance-covariance matrix.
To test for multivariate normality, we must choose sets of variables. First, we will
test for multivariate normality for all accounting ratios. Second, we will do so for all
market variables (this will be done four different ways, substituting different measures of
the bid-ask spread). Third, we will do so for the three accounting ratios and three market
variables that had the highest W statistic from the above mentioned univariate normality
test; this is also done for the logarithm of the ratios/variables. Finally, the same procedure
is done for the six variables (three accounting ratios and three market variables) that
showed the highest predictive power from the univariate analysis performed in the
previous chapter.
While certain types of MDA are better suited for certain data than others, our
purpose is to comprehensively study bankruptcy prediction. Therefore, we will not limit
ourselves to one model specification. When the underlying assumptions that are
mentioned above are satisfied, then linear MDA is appropriate. While this is a possibility,
it is highly unlikely. Quadratic MDA is one possible solution to this problem; it is useful

95
when the equality of the dispersion matrices is rejected. Furthermore, when the data does
not prove to come from a normally distributed population (or any specified distribution),
the nonparametric MDA is another solution. Given these outcomes, we will apply the
analysis using the three different MDA methods.
Finally, to test that actual predictive ability of the MDA, we perform an out-of-
sample test. Since we found the nonparametric MDA to perform best at correctly
classifying bankrupt firms, also use it in the out-of-sample test. Using the ratios and
variables from 5 years up until 2 years before bankruptcy, the nonparametric MDA model
is created. Then, using this model, the predictive ability of the model is test one year
before bankruptcy.
3.5 Empirical Results
We begin with the univariate normality test results (Table I). The W-statistic is
used. For all the ratios, whether those of bankrupt or non-bankrupt firms, the null is
rejected (i.e. the results indicate a departure from normality); all ratio statistics have p
values of less (and much less in most cases) than 1%. After taking the logarithm of the
ratios, the results only change for the spread variable. However, this must be taken with
caution; the dataset for the spread variable is much smaller than that of the other
ratios/variables. When looking at other measures of the spread, the variables are still
found to be non-normal.
While univariate normality is not met, the underlying assumption for MDA
requires multivariate normality. Even though the ratios and variables are not univariate
normal, this does not necessarily mean that a set of the ratios are not multivariate normal.

96
Therefore, we test for multivariate normality for the different sets of variables mentioned
above.
Table 4
Univariate normality results for Ratios : Bankrupt firms
RATIO N W STATISTIC
P VALUE
SHROUT 1339 0.467422 <0.0001
PRC 1331 0.718935 <0.0001
VOL 1339 0.45501 <0.0001
SPREAD 53 0.840866 <0.0001
NET INCOME TO SALES 1267 0.057279 <0.0001
NET INCOME TO TOTAL ASSETS 1327 0.480268 <0.0001
TOTAL DEBT 1313 0.260369 <0.0001
NET INCOME TO TOTAL DEBT 1310 0.289402 <0.0001
CURRENT LIABILITIES TO TOTAL ASSETS
1329 0.813787 <0.0001
LONG TERM LIABILITIES TO TOTAL ASSETS
1313 0.828406 <0.0001
TOTAL DEBT TO TOTAL ASSETS 1313 0.919367 <0.0001
TOTAL DEBT PLUS PREF TO TOTAL ASSETS
1310 0.85664 <0.0001
CASH TO TOTAL ASSETS 52 0.794427 <0.0001
QUICK ASSETS TO TOTAL ASSETS 1315 0.942621 <0.0001
WORKING CAPITAL TO TOTAL ASSETS 1329 0.954237 <0.0001
CASH TO CURRENT LIABILITIES 52 0.77012 <0.0001
QUICK ASSETS TO CURRENT LIABILITIES
1315 0.50031 <0.0001
CURRENT RATIO 1329 0.519753 <0.0001
CASH TO SALES 46 0.738928 <0.0001
INVENTORY TO SALES 1248 0.044135 <0.0001
QUICK ASSETS TO SALES 1248 0.034549 <0.0001

97
CURRENT ASSETS TO SALES 1262 0.042619 <0.0001
WORKING CAPITAL TO SALES 1262 0.040176 <0.0001
TOTAL ASSETS TO SALES 1263 0.053942 <0.0001
BID ASK SPREAD 1297 0.802743 <0.0001
HI LO BID ASK SPREAD 1339 0.274931 <0.0001
STANDARD DEVIATION OF RETURN 1116 0.4026 <0.0001
BETA 892 0.378702 <0.0001
Univariate normality results for Logarithmic Ratios : Bankrupt firms
RATIO N W STATISTIC
P VALUE
SHROUT 1339 0.972232 <0.0001
PRC 1278 0.981476 <0.0001
VOL 1337 0.993966 <0.0001
SPREAD 53 0.94208 0.0125
NET INCOME TO SALES 493 0.970445 <0.0001
NET INCOME TO TOTAL ASSETS 497 0.969024 <0.0001
TOTAL DEBT 1313 0.975077 <0.0001
NET INCOME TO TOTAL DEBT 482 0.98526 <0.0001
CURRENT LIABILITIES TO TOTAL ASSETS
1329 0.989039 <0.0001
LONG TERM LIABILITIES TO TOTAL ASSETS
1198 0.909605 <0.0001
TOTAL DEBT TO TOTAL ASSETS 1313 0.914667 <0.0001
TOTAL DEBT PLUS PREF TO TOTAL ASSETS
1310 0.933872 <0.0001
CASH TO TOTAL ASSETS 52 0.895725 0.0003
QUICK ASSETS TO TOTAL ASSETS 1315 0.949774 <0.0001
WORKING CAPITAL TO TOTAL ASSETS 943 0.841992 <0.0001
CASH TO CURRENT LIABILITIES 52 0.94103 0.0123

98
QUICK ASSETS TO CURRENT LIABILITIES
1315 0.995243 0.0004
CURRENT RATIO 1329 0.993424 <0.0001
CASH TO SALES 46 0.91722 0.0030
INVENTORY TO SALES 945 0.945348 <0.0001
QUICK ASSETS TO SALES 1248 0.927727 <0.0001
CURRENT ASSETS TO SALES 1262 0.884118 <0.0001
WORKING CAPITAL TO SALES 901 0.95849 <0.0001
TOTAL ASSETS TO SALES 1263 0.858276 <0.0001
BID ASK SPREAD 1269 0.96145 <0.0001
HI LO BID ASK SPREAD 1283 0.992995 <0.0001
STANDARD DEVIATION OF RETURN 1116 0.972684 <0.0001
BETA 588 0.960947 <0.0001
Univariate normality results for Ratios : Nonbankrupt firms
RATIO N W STATISTIC
P VALUE
SHROUT 1611 0.205651 <0.0001
PRC 1601 0.865639 <0.0001
VOL 1605 0.33087 <0.0001
SPREAD 26 0.88319 0.0067
NET INCOME TO SALES 1559 0.051582 <0.0001
NET INCOME TO TOTAL ASSETS 1584 0.234626 <0.0001
TOTAL DEBT 1541 0.175537 <0.0001
NET INCOME TO TOTAL DEBT 1540 0.571895 <0.0001
CURRENT LIABILITIES TO TOTAL ASSETS
1558 0.505346 <0.0001
LONG TERM LIABILITIES TO TOTAL ASSETS
1541 0.843893 <0.0001

99
TOTAL DEBT TO TOTAL ASSETS 1541 0.727685 <0.0001
TOTAL DEBT PLUS PREF TO TOTAL ASSETS
1540 0.64565 <0.0001
CASH TO TOTAL ASSETS 1175 0.799459 <0.0001
QUICK ASSETS TO TOTAL ASSETS 1540 0.955474 <0.0001
WORKING CAPITAL TO TOTAL ASSETS 1558 0.749972 <0.0001
CASH TO CURRENT LIABILITIES 1152 0.548243 <0.0001
QUICK ASSETS TO CURRENT LIABILITIES
1540 0.570288 <0.0001
CURRENT RATIO 1558 0.636071 <0.0001
CASH TO SALES 1165 0.067674 <0.0001
INVENTORY TO SALES 1529 0.43067 <0.0001
QUICK ASSETS TO SALES 1511 0.0645 <0.0001
CURRENT ASSETS TO SALES 1529 0.064764 <0.0001
WORKING CAPITAL TO SALES 1529 0.066057 <0.0001
TOTAL ASSETS TO SALES 1558 0.073278 <0.0001
BID ASK SPREAD 1597 0.418527 <0.0001
HI LO BID ASK SPREAD 1605 0.534956 <0.0001
STANDARD DEVIATION OF RETURN 1337 0.149911 <0.0001
BETA 1287 0.527272 <0.0001
Univariate normality results for Logarithmic Ratios : Nonbankrupt firms
RATIO N W STATISTIC
P VALUE
SHROUT 1611 0.960442 <0.0001
PRC 1575 0.955702 <0.0001
VOL 1605 0.990826 <0.0001
SPREAD 26 0.950027 0.2322

100
NET INCOME TO SALES 1052 0.954629 <0.0001
NET INCOME TO TOTAL ASSETS 1054 0.94683 <0.0001
TOTAL DEBT 1541 0.971175 <0.0001
NET INCOME TO TOTAL DEBT 1030 0.976557 <0.0001
CURRENT LIABILITIES TO TOTAL ASSETS
1558 0.934419 <0.0001
LONG TERM LIABILITIES TO TOTAL ASSETS
1469 0.897339 <0.0001
TOTAL DEBT TO TOTAL ASSETS 1541 0.955337 <0.0001
TOTAL DEBT PLUS PREF TO TOTAL ASSETS
1540 0.956655 <0.0001
CASH TO TOTAL ASSETS 1161 0.953687 <0.0001
QUICK ASSETS TO TOTAL ASSETS 1540 0.934988 <0.0001
WORKING CAPITAL TO TOTAL ASSETS 1334 0.860201 <0.0001
CASH TO CURRENT LIABILITIES 1138 0.976883 <0.0001
QUICK ASSETS TO CURRENT LIABILITIES
1540 0.9697 <0.0001
CURRENT RATIO 1558 0.967229 <0.0001
CASH TO SALES 1151 0.963218 <0.0001
INVENTORY TO SALES 1204 0.93087 <0.0001
QUICK ASSETS TO SALES 1511 0.870741 <0.0001
CURRENT ASSETS TO SALES 1529 0.833411 <0.0001
WORKING CAPITAL TO SALES 1312 0.927458 <0.0001
TOTAL ASSETS TO SALES 1558 0.874383 <0.0001
BID ASK SPREAD 1577 0.910491 <0.0001
HI LO BID ASK SPREAD 1578 0.990328 <0.0001
STANDARD DEVIATION OF RETURN 1337 0.958347 <0.0001
BETA 612 0.979232 <0.0001

101
As seen in Table 5, for the most part, all variables and ratios, whether for
bankrupt or nonbankrupt firms, display results indicating that these samples are
multivariate nonnormal. The null is rejected for almost all sets of variables. This has been
documented in the literature [Karels and Prakash (1987)] as a major problem with
interpreting the results of other MDA results in the past. Multivariate normality is an
important assumption underpinning these types of models.
Furthermore, the equality of the variance-covariance matrix is another important
assumption. It is often violated. We find similar results (Table 6). While certain
subgroups display equality of the dispersion matrices (null not rejected), these results
must be taken with caution; the subgroups that have equal dispersion matrices suffer from
small sample bias. When looking at the larger subgroups (i.e. all of the market variables,
and the two subgroups of the top three market variables and accounting ratios from the
univariate analysis in Chapter 2), it is evident that the Variance-Covariance matrices are
not equivalent. Therefore, linear MDA is not appropriate. Quadratic MDA has been used
as a solution the issue of non-equal dispersion matrices. However, we also have to deal
with the fact that the variables are not multivariate normal. Since our purpose is a
comprehensive study of bankruptcy prediction, we will employ linear, quadratic, and
nonparametric MDA, and then compare the results of each.
Since accounting ratios alone in bankruptcy prediction have been exhaustively
used in the prior literature, we will begin by looking at the market variables, and then the
mix of the two. This is the crux of the analysis. The analysis is performed for years one
through five before bankruptcy, but we will focus on year one and year five. The market

102
variables used are shares outstanding, price, volume, and two different measures of the
bid-ask spread.
Table 5
Multivariate Normality Results for Ratios : Bankrupt firms
Accounting variables
Test Statistic P value
Mardia Skewness 1459 <.0001
Mardia Kurtosis 1.89 0.0582
Henze-Zirkler T 47.19 <.0001
Market variables
Test Statistic P value
Mardia Skewness 73699 <.0001
Mardia Kurtosis 1069 <.0001
Henze-Zirkler T 107.5 <.0001
Market variables without spread and hi lo bid ask spread
=Test Statistic P value
Mardia Skewness 19073 <.0001
Mardia Kurtosis 377.3 <.0001
Henze-Zirkler T 65.33 <.0001
Market variables without spread and bid ask spread
Test Statistic P value
Mardia Skewness 75729 <.0001
Mardia Kurtosis 1309 <.0001
Henze-Zirkler T 73.90 <.0001
Market variables without bid ask spread and hi lo bid ask spread
Test Statistic P value
Mardia Skewness 296.8 <.0001
Mardia Kurtosis 15.78 <.0001
Henze-Zirkler T 14.28 <.0001

103
Top 3 Account and Market variables
Test Statistic P value
Mardia Skewness 8470 <.0001
Mardia Kurtosis 117.6 <.0001
Henze-Zirkler T 88.27 <.0001
Top 3 account and market logarithmic variables
Test Statistic P value
Mardia Skewness 74521 <.0001
Mardia Kurtosis 897.8 <.0001
Henze-Zirkler T 135.8 <.0001
Variables (Price, Standard deviation, bid ask spread, net income to sales, working capital to total assets and
current liabilities to total assets )
Test Statistic P value
Mardia Skewness 93575 <.0001
Mardia Kurtosis 1026 <.0001
Henze-Zirkler T 104.2 <.0001
Variables (Price, Standard deviation, hi lo bid ask spread, net income to sales, working capital to total
assets and current liabilities to total assets )
Test Statistic P value
Mardia Skewness 134E3 <.0001
Mardia Kurtosis 1517 <.0001
Henze-Zirkler T 123.7 <.0001

104
Multivariate Normality Results for Ratios : Non bankrupt firms
Accounting variables
Test Statistic P value
Mardia Skewness 729E3 <.0001
Mardia Kurtosis 3166 <.0001
Henze-Zirkler T 4597 <.0001
Market variables
Test Statistic P value
Mardia Skewness 45305 <.0001
Mardia Kurtosis 791.3 <.0001
Henze-Zirkler T 119.8 <.0001
Market variables without spread and hi lo bid ask spread
Test Statistic P value
Mardia Skewness 42249 <.0001
Mardia Kurtosis 674.8 <.0001
Henze-Zirkler T 74.18 <.0001
Market variables without spread and bid ask spread
Test Statistic P value
Mardia Skewness 29502 <.0001
Mardia Kurtosis 653.8 <.0001
Henze-Zirkler T 76.50 <.0001
Market variables without bid ask spread and hi lo bid ask spread
Test Statistic P value
Mardia Skewness 45.83 0.0008
Mardia Kurtosis 1.28 0.2010
Henze-Zirkler T 3.17 0.0015

105
Top 3 Account and Market variables
Test Statistic P value
Mardia Skewness 27625 <.0001
Mardia Kurtosis 408.0 <.0001
Henze-Zirkler T 94.18 <.0001
Top 3 Account and Market logarithmic variables
Test Statistic P value
Mardia Skewness 34570 <.0001
Mardia Kurtosis 482.8 <.0001
Henze-Zirkler T 165.0 <.0001
Variables (Price, Standard deviation, bid ask spread, net income to sales, working capital to total assets and
current liabilities to total assets )
Test Statistic P value
Mardia Skewness 169E3 <.0001
Mardia Kurtosis 1674 <.0001
Henze-Zirkler T 131.1 <.0001
Variables (Price, Standard deviation, hi lo bid ask spread, net income to sales, working capital to total
assets and current liabilities to total assets )
Test Statistic P value
Mardia Skewness 157E3 <.0001
Mardia Kurtosis 1706 <.0001
Henze-Zirkler T 131.5 <.0001

106
For the linear MDA, one year before bankruptcy, 16% of actual bankrupt firms are
erroneously labeled as non-bankrupt, whereas 38% of non-bankrupt firms are erroneously
labeled as bankrupt. Five years before bankruptcy the error rates are 28% and 10%,
respectively. Interestingly, the misclassification rate for bankrupt firms decreases as
bankruptcy looms, but the opposite occurs for nonbankrupt firms. For the quadratic
MDA, one year before bankruptcy, 10% of actual bankrupt firms are erroneously labeled
as non-bankrupt, whereas 57% of non-bankrupt firms are erroneously labeled as
bankrupt. Five years before bankruptcy the error rates are 8% and 61%, respectively.
Here, both misclassification rates decrease as bankruptcy looms. For the nonparametric
MDA, one year before bankruptcy, 12% of actual bankrupt firms are erroneously labeled
as non-bankrupt, whereas 15% of non-bankrupt firms are erroneously labeled as
bankrupt. Five years before bankruptcy the error rates are 25% and 3%, respectively.
These results are similar, but lower in magnitude, to the linear MDA.
For the set of only market variables, the quadratic MDA performs the best at
correctly classifying bankrupt firms, whereas the nonparametric MDA performs best at
correctly classifying nonbankrupt firms. Overall, the total error rates are lowest for the
nonparametric MDA (misclassification rates for bankrupt as well as those of nonbankrupt
firms). While this form of MDA has not been widely used throughout the literature, it is
consistent and a continuation of prior research. As noted earlier, the assumptions
underlying the parametric models are almost always violated. Therefore, it should come
as no surprise that this (nonparametric) version of the model performs well.
The next two sets of variables used consist of those variables that performed best
in the univariate analysis. The first set of these two contains price, standard deviation,

107
bid-ask spread, net income to total sales, working capital to total assets, and current
liabilities to total assets. For the linear MDA, one year before bankruptcy, 30% of actual
bankrupt firms are erroneously labeled as non-bankrupt, whereas 12% of non-bankrupt
firms are erroneously labeled as bankrupt. Five years before bankruptcy the error rates
are 22% and 13%, respectively. While the misclassification rates of the bankrupt firms
slightly worsen as bankruptcy looms, those of nonbankrupt firms stay relatively flat. For
the quadratic MDA, one year before bankruptcy, 45% of actual bankrupt firms are
erroneously labeled as non-bankrupt, whereas 8% of non-bankrupt
Table 6
Results of Box’s M Test for Equality of Variance-Covariance Matrix
Accounting variables
Year Bankruptcy N Chi-square Statistic P value
Year 1 Bankrupt 6 0.000000 1.0000
Nonbankrupt 95
Year 2 Bankrupt 6 0.000000 1.0000
Nonbankrupt 93
Year 3 Bankrupt 2 0.000000 1.0000
Nonbankrupt 86
Year 4 Bankrupt - - -
Nonbankrupt
Year 5 Bankrupt - - -
Nonbankrupt
Market variables
Year Bankruptcy N Chi-square Statistic P value
Year 1 Bankrupt 133 967.451325 <.0001
Nonbankrupt 116
Year 2 Bankrupt 128 607.058492 <.0001
Nonbankrupt 112

108
Year 3 Bankrupt 107 515.281454 <.0001 Nonbankrupt 111
Year 4 Bankrupt 84 567.979735 <.0001
Nonbankrupt 110
Year 5 Bankrupt 64 316.579924 <.0001
Nonbankrupt 97
Market variables without spread and hi lo bid ask spread
Year Bankruptcy N Chi-square Statistic P value
Year 1 Bankrupt 133 629.701533 <.0001
Nonbankrupt 116
Year 2 Bankrupt 128 547.342903 <.0001
Nonbankrupt 112
Year 3 Bankrupt 107 504.123756 <.0001 Nonbankrupt 111
Year 4 Bankrupt 84 469.823469 <.0001
Nonbankrupt 110
Year 5 Bankrupt 64 311.466705 <.0001
Nonbankrupt 97
Market variables without spread and bid ask spread
Year Bankruptcy N Chi-square Statistic P value
Year 1 Bankrupt 136 935.473575 <.0001
Nonbankrupt 116
Year 2 Bankrupt 129 584.366113 <.0001
Nonbankrupt 112
Year 3 Bankrupt 108 510.771170 <.0001 Nonbankrupt 111

109
Year 4 Bankrupt 85 507.031076 <.0001
Nonbankrupt 110
Year 5 Bankrupt 70 247.083392 <.0001
Nonbankrupt 98
Market variables without bid ask spread and hi lo bid ask spread
Year Bankruptcy N Chi-square Statistic P value
Year 1 Bankrupt 10 21.306626 0.0191
Nonbankrupt 3
Year 2 Bankrupt 6 15.350371 0.1198
Nonbankrupt 6
Year 3 Bankrupt 7 15.637599 0.1105 Nonbankrupt 3
Year 4 Bankrupt 7 - -
Nonbankrupt 1
Year 5 Bankrupt 9 19.382668 0.0357
Nonbankrupt 3
Top 3 Account and Market variables
Year Bankruptcy N Chi-square Statistic P value
Year 1 Bankrupt 7 45.947752 0.0013
Nonbankrupt 97
Year 2 Bankrupt 7 45.432227 0.0015
Nonbankrupt 93
Year 3 Bankrupt 3 0.000000 1.0000 Nonbankrupt 87
Year 4 Bankrupt - - -
Nonbankrupt
Year 5 Bankrupt - - -
Nonbankrupt

110
Top 3 Account and Market logarithmic variables
Year Bankruptcy N Chi-square Statistic P value
Year 1 Bankrupt 4 43.532931 0.0027
Nonbankrupt 78
Year 2 Bankrupt 3 0.000000 1.0000
Nonbankrupt 77
Year 3 Bankrupt 1 - -
Nonbankrupt 74
Year 4 Bankrupt - - -
Nonbankrupt
Year 5 Bankrupt - - -
Nonbankrupt
Variables (Price, Standard deviation, bid ask spread, net income to sales, working capital to total assets and
current liabilities to total assets )
Year Bankruptcy N Chi-square Statistic P value
Year 1 Bankrupt 85 898.519782 <.0001
Nonbankrupt 99
Year 2 Bankrupt 95 445.264189 <.0001
Nonbankrupt 106
Year 3 Bankrupt 74 173.135756 <.0001 Nonbankrupt 99
Year 4 Bankrupt 66 391.112753 <.0001
Nonbankrupt 24
Year 5 Bankrupt 27 177.245746 <.0001
Nonbankrupt 16

111
Variables (Price, Standard deviation, hi lo bid ask spread, net income to sales, working capital to total assets and current liabilities to total assets )
Year Bankruptcy N Chi-square Statistic P value
Year 1 Bankrupt 86 1159.435684 <.0001
Nonbankrupt 99
Year 2 Bankrupt 95 435.487169 <.0001
Nonbankrupt 106
Year 3 Bankrupt 75 182.030581 <.0001 Nonbankrupt 99
Year 4 Bankrupt 66 380.104350 <.0001
Nonbankrupt 24
Year 5 Bankrupt 29 163.480053 <.0001
Nonbankrupt 16

112
firms are erroneously labeled as bankrupt. Five years before bankruptcy the error rates
are 33% and 0%, respectively. The misclassification rates for bankrupt firms are
surprisingly high. For the nonparametric MDA, one year before bankruptcy, 20% of
actual bankrupt firms are erroneously labeled as non-bankrupt, whereas 10% of non-
bankrupt firms are erroneously labeled as bankrupt. Five years before bankruptcy the
error rates are 11% and 25%, respectively.
For this first set of mixed accounting ratios and market variables, the
nonparametric MDA is most accurate at classifying bankrupt firms as such, but this set is
better at correctly classifying nonbankrupt firms with the use of the quadratic MDA.
Unfortunately, the quadratic MDA has very high misclassification rates for bankrupt
firms. Therefore, again, overall accuracy is mostly best with the nonparametric MDA,
and is consistent with the violations of the underlying assumptions tested above.
The second set of these two contains price, standard deviation, high-low bid-ask
spread, net income to total sales, working capital to total assets, and current liabilities to
total assets. For the linear MDA, one year before bankruptcy, 28% of actual bankrupt
firms are erroneously labeled as non-bankrupt, whereas 14% of non-bankrupt firms are
erroneously labeled as bankrupt. Five years before bankruptcy the error rates are 22% and
13%, respectively. This is similar to the first ‘mixed’ set. For the quadratic MDA, one
year before bankruptcy, 54% of actual bankrupt firms are erroneously labeled as non-
bankrupt, whereas 7% of non-bankrupt firms are erroneously labeled as bankrupt. Five
years before bankruptcy the error rates are 59% and 0%, respectively. This is also
consistent with the first ‘mixed’ set, but the misclassification rates for bankrupt firms are
even higher. For the nonparametric MDA, one year before bankruptcy, 24% of actual

113
bankrupt firms are erroneously labeled as non-bankrupt, whereas 9% of non-bankrupt
firms are erroneously labeled as bankrupt. Five years before bankruptcy the error rates
are 21% and 31%, respectively.
For this last set of accounting ratios and market variables, the nonparametric MDA
slightly outperforms the linear MDA at correctly classifying bankrupt firms, whereas the
Table 7
Results of Linear Discriminant Analysis : Accounting variables
YEAR 1
Observations 101 DF Total 100
Variables 17 DF Within Classes 99
Classes 2 DF Between Classes 1
Class Level Information
BANKRUPTCY Variable Name Frequency Weight Proportion
Prior Probability
Bankrupt Bankrupt 6 6.0000 0.059406 0.500000
Nonbankrupt Nonbankrupt 95 95.0000 0.940594 0.500000
Pooled Covariance Matrix Information
Covariance Matrix Rank
Natural Log of the Determinant of the Covariance Matrix
17 -22.67893
Generalized Squared Distance to BANKRUPTCY
From BANKRUPTCY Bankrupt Nonbankrupt
Bankrupt 0 11.07153
Nonbankrupt 11.07153 0

114
LINEAR DISCRIMINANT FUNCTION
Variable Bankrupt Nonbankrupt
Constant -23.89413 -11.26707
M_NETINCOMETOSALES 4.75443 1.30017
M_NETINCOMETOTOTALASSETS -0.52603 20.53297
M_TOTALDEBT 0.0000126 0.0000354
M_NETINCOMETOTOTALDEBT 2.04585 -0.23351
M_CURLIABTOTOTASSET 83.15026 54.41938
M_LTLIABTOTOTASSET 81.27229 45.39088
M_TOTDEBTPLUSPREFTOTOTASSET -54.09291 -28.20442
M_WCTOTOTALASSETS 14.38336 15.48818
M_QASSETSTOCURLIABILITIES 5.48194 4.43071
M_CURRENTRATIO 0.79798 0.12866
M_INVENTORYTOSALES 6.26052 3.77308
M_QUICKASSETSTOSALES 2.67253 -0.27784
M_WORKINGCAPITALTOSALES -7.14631 -3.34170
M_TOTALASSETSTOSALES 0.27541 0.43231
M_CASHTOTOTALASSETS 8.50860 4.37690
M_CASHTOCURLIABILITIES -6.49114 -4.81007
M_CASHTOSALES 5.16078 4.11512

115
CLASSIFICATION SUMMARY
Number of Observations and Percent Classified into BANKRUPTCY
From BANKRUPTCY Bankrupt Nonbankrupt Total
Bankrupt 3 50.00
3 50.00
6 100.00
Nonbankrupt 3 3.16
92 96.84
95 100.00
Total 6 5.94
95 94.06
101 100.00
Priors 0.5
0.5
Error Count Estimates for BANKRUPTCY
Bankrupt Nonbankrupt Total
Rate 0.5000 0.0316 0.2658
Priors 0.5000 0.5000
Results of Linear Discriminant Analysis : Market variables
YEAR 1
Observations 249 DF Total 248
Variables 5 DF Within Classes 247
Classes 2 DF Between Classes 1
Class Level Information
BANKRUPTCY Variable Name Frequency Weight Proportion
Prior Probability
Bankrupt Bankrupt 133 133.0000 0.534137 0.500000
Nonbankrupt Nonbankrupt 116 116.0000 0.465863 0.500000
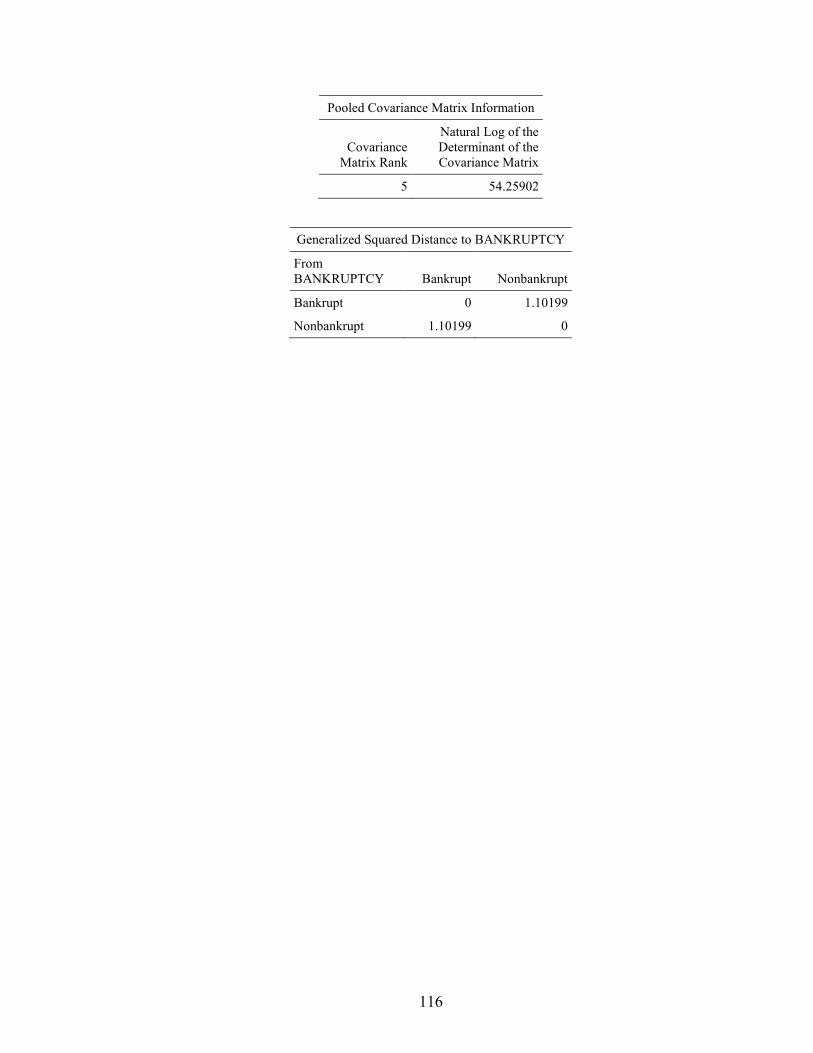
116
Pooled Covariance Matrix Information
Covariance Matrix Rank
Natural Log of the Determinant of the Covariance Matrix
5 54.25902
Generalized Squared Distance to BANKRUPTCY
From BANKRUPTCY Bankrupt Nonbankrupt
Bankrupt 0 1.10199
Nonbankrupt 1.10199 0

117
LINEAR DISCRIMINANT FUNCTION
Linear Discriminant Function for BANKRUPTCY
Variable Bankrupt Nonbankrupt
Constant -0.70287 -1.04106
M_SHROUT -1.1535E-6 -1.5762E-6
M_PRC 0.04253 0.12219
M_VOL 1.37506E-6 1.99419E-6
M_BIDASKSPREAD 8.49887 4.35015
M_HILOBIDASKSPREAD 0.01103 -0.06242
CLASSIFICATION SUMMARY
Number of Observations and Percent Classified into BANKRUPTCY
From BANKRUPTCY Bankrupt Nonbankrupt Total
Bankrupt 112 84.21
21 15.79
133 100.00
Nonbankrupt 44 37.93
72 62.07
116 100.00
Total 156 62.65
93 37.35
249 100.00
Priors 0.5
0.5
Error Count Estimates for BANKRUPTCY
Bankrupt Nonbankrupt Total
Rate 0.1579 0.3793 0.2686
Priors 0.5000 0.5000
YEAR 4
Observations 194 DF Total 193
Variables 5 DF Within Classes 192
Classes 2 DF Between Classes 1

118
Class Level Information
BANKRUPTCY Variable Name Frequency Weight Proportion
Prior Probability
Bankrupt Bankrupt 84 84.0000 0.432990 0.500000
Nonbankrupt Nonbankrupt 110 110.0000 0.567010 0.500000
Pooled Covariance Matrix Information
Covariance Matrix Rank
Natural Log of the Determinant of the Covariance Matrix
5 53.44970
Generalized Squared Distance to BANKRUPTCY
From BANKRUPTCY Bankrupt Nonbankrupt
Bankrupt 0 2.23491
Nonbankrupt 2.23491 0
LINEAR DISCRIMINANT FUNCTION
Linear Discriminant Function for BANKRUPTCY
Variable Bankrupt Nonbankrupt
Constant -1.81313 -1.10490
M_SHROUT -8.6769E-7 -6.0896E-7
M_PRC 0.03938 0.08833
M_VOL 1.12428E-6 8.52787E-7
M_BIDASKSPREAD 12.12005 3.11058
M_HILOBIDASKSPREAD 0.02012 0.04323

119
CLASSIFICATION SUMMARY
Number of Observations and Percent Classified into BANKRUPTCY
From BANKRUPTCY Bankrupt Nonbankrupt Total
Bankrupt 61 72.62
23 27.38
84 100.00
Nonbankrupt 11 10.00
99 90.00
110 100.00
Total 72 37.11
122 62.89
194 100.00
Priors 0.5
0.5
Error Count Estimates for BANKRUPTCY
Bankrupt Nonbankrupt Total
Rate 0.2738 0.1000 0.1869
Priors 0.5000 0.5000
YEAR 5
Observations 161 DF Total 160
Variables 5 DF Within Classes 159
Classes 2 DF Between Classes 1
Class Level Information
BANKRUPTCY Variable Name Frequency Weight Proportion
Prior Probability
Bankrupt Bankrupt 64 64.0000 0.397516 0.500000
Nonbankrupt Nonbankrupt 97 97.0000 0.602484 0.500000
Pooled Covariance Matrix Information
Covariance Matrix Rank
Natural Log of the Determinant of the Covariance Matrix
5 51.76772

120
Generalized Squared Distance to BANKRUPTCY
From BANKRUPTCY Bankrupt Nonbankrupt
Bankrupt 0 2.47216
Nonbankrupt 2.47216 0
LINEAR DISCRIMINANT FUNCTION
Linear Discriminant Function for BANKRUPTCY
Variable Bankrupt Nonbankrupt
Constant -2.04668 -1.02227
M_SHROUT 3.84133E-8 2.49029E-7
M_PRC 0.03473 0.06832
M_VOL 3.69855E-7 3.78623E-7
M_BIDASKSPREAD 13.64273 3.33147
M_HILOBIDASKSPREAD 0.08978 0.13395
CLASSIFICATION SUMMARY
Number of Observations and Percent Classified into BANKRUPTCY
From BANKRUPTCY Bankrupt Nonbankrupt Total
Bankrupt 46 71.88
18 28.13
64 100.00
Nonbankrupt 10 10.31
87 89.69
97 100.00
Total 56 34.78
105 65.22
161 100.00
Priors 0.5
0.5

121
Error Count Estimates for BANKRUPTCY
Bankrupt Nonbankrupt Total
Rate 0.2813 0.1031 0.1922
Priors 0.5000 0.5000
Results of Linear Discriminant Analysis : Market variables without spread and hi lo bid ask spread
YEAR 1
Observations 249 DF Total 248
Variables 4 DF Within Classes 247
Classes 2 DF Between Classes 1

122
Class Level Information
BANKRUPTCY Variable Name Frequency Weight Proportion
Prior Probability
Bankrupt Bankrupt 133 133.0000 0.534137 0.500000
Nonbankrupt Nonbankrupt 116 116.0000 0.465863 0.500000
Pooled Covariance Matrix Information
Covariance Matrix Rank
Natural Log of the Determinant of the Covariance Matrix
4 50.68621
Generalized Squared Distance to BANKRUPTCY
From BANKRUPTCY Bankrupt Nonbankrupt
Bankrupt 0 0.90985
Nonbankrupt 0.90985 0
LINEAR DISCRIMINANT FUNCTION
Linear Discriminant Function for BANKRUPTCY
Variable Bankrupt Nonbankrupt
Constant -0.70070 -0.97167
M_SHROUT -1.1779E-6 -1.4379E-6
M_PRC 0.04544 0.10574
M_VOL 1.38777E-6 1.92228E-6
M_BIDASKSPREAD 8.55784 4.01632

123
CLASSIFICATION SUMMARY
Number of Observations and Percent Classified into BANKRUPTCY
From BANKRUPTCY Bankrupt Nonbankrupt Total
Bankrupt 110 82.71
23 17.29
133 100.00
Nonbankrupt 45 38.79
71 61.21
116 100.00
Total 155 62.25
94 37.75
249 100.00
Priors 0.5
0.5
Error Count Estimates for BANKRUPTCY
Bankrupt Nonbankrupt Total
Rate 0.1729 0.3879 0.2804
Priors 0.5000 0.5000
YEAR 4
Observations 194 DF Total 193
Variables 4 DF Within Classes 192
Classes 2 DF Between Classes 1
Class Level Information
BANKRUPTCY Variable Name Frequency Weight Proportion
Prior Probability
Bankrupt Bankrupt 84 84.0000 0.432990 0.500000
Nonbankrupt Nonbankrupt 110 110.0000 0.567010 0.500000
Pooled Covariance Matrix Information
Covariance Matrix Rank
Natural Log of the Determinant of the Covariance Matrix
4 50.74589

124
Generalized Squared Distance to BANKRUPTCY
From BANKRUPTCY Bankrupt Nonbankrupt
Bankrupt 0 2.22693
Nonbankrupt 2.22693 0
LINEAR DISCRIMINANT FUNCTION
Linear Discriminant Function for BANKRUPTCY
Variable Bankrupt Nonbankrupt
Constant -1.81011 -1.09094
M_SHROUT -8.7659E-7 -6.2809E-7
M_PRC 0.04186 0.09366
M_VOL 1.12116E-6 8.46076E-7
M_BIDASKSPREAD 12.15603 3.18789
CLASSIFICATION SUMMARY
Number of Observations and Percent Classified into BANKRUPTCY
From BANKRUPTCY Bankrupt Nonbankrupt Total
Bankrupt 61 72.62
23 27.38
84 100.00
Nonbankrupt 11 10.00
99 90.00
110 100.00
Total 72 37.11
122 62.89
194 100.00
Priors 0.5
0.5
Error Count Estimates for BANKRUPTCY
Bankrupt Nonbankrupt Total
Rate 0.2738 0.1000 0.1869
Priors 0.5000 0.5000
YEAR 5

125
Observations 161 DF Total 160
Variables 4 DF Within Classes 159
Classes 2 DF Between Classes 1
Class Level Information
BANKRUPTCY Variable Name Frequency Weight Proportion
Prior Probability
Bankrupt Bankrupt 64 64.0000 0.397516 0.500000
Nonbankrupt Nonbankrupt 97 97.0000 0.602484 0.500000
Pooled Covariance Matrix Information
Covariance Matrix Rank
Natural Log of the Determinant of the Covariance Matrix
4 50.22446
Generalized Squared Distance to BANKRUPTCY
From BANKRUPTCY Bankrupt Nonbankrupt
Bankrupt 0 2.46303
Nonbankrupt 2.46303 0
LINEAR DISCRIMINANT FUNCTION
Linear Discriminant Function for BANKRUPTCY
Variable Bankrupt Nonbankrupt
Constant -2.02782 -0.98029
M_SHROUT -5.2201E-7 -5.8711E-7
M_PRC 0.04399 0.08213
M_VOL 8.31508E-7 1.06741E-6
M_BIDASKSPREAD 13.69023 3.40235

126
CLASSIFICATION SUMMARY
Number of Observations and Percent Classified into BANKRUPTCY
From BANKRUPTCY Bankrupt Nonbankrupt Total
Bankrupt 46 71.88
18 28.13
64 100.00
Nonbankrupt 10 10.31
87 89.69
97 100.00
Total 56 34.78
105 65.22
161 100.00
Priors 0.5
0.5
Error Count Estimates for BANKRUPTCY
Bankrupt Nonbankrupt Total
Rate 0.2813 0.1031 0.1922
Priors 0.5000 0.5000
Results of Linear Discriminant Analysis : Market variables without spread and bid ask spread
YEAR 1
Observations 252 DF Total 251
Variables 4 DF Within Classes 250
Classes 2 DF Between Classes 1
Class Level Information
BANKRUPTCY Variable Name Frequency Weight Proportion
Prior Probability
Bankrupt Bankrupt 136 136.0000 0.539683 0.500000
Nonbankrupt Nonbankrupt 116 116.0000 0.460317 0.500000

127
Pooled Covariance Matrix Information
Covariance Matrix Rank
Natural Log of the Determinant of the Covariance Matrix
4 58.41133
Generalized Squared Distance to BANKRUPTCY
From BANKRUPTCY Bankrupt Nonbankrupt
Bankrupt 0 0.86000
Nonbankrupt 0.86000 0
LINEAR DISCRIMINANT FUNCTION
Linear Discriminant Function for BANKRUPTCY
Variable Bankrupt Nonbankrupt
Constant -0.15620 -0.90788
M_SHROUT -6.0381E-7 -1.3142E-6
M_PRC 0.03592 0.12008
M_VOL 6.70847E-7 1.65622E-6
M_HILOBIDASKSPREAD 0.02972 -0.05339
CLASSIFICATION SUMMARY
Number of Observations and Percent Classified into BANKRUPTCY
From BANKRUPTCY Bankrupt Nonbankrupt Total
Bankrupt 115 84.56
21 15.44
136 100.00
Nonbankrupt 53 45.69
63 54.31
116 100.00
Total 168 66.67
84 33.33
252 100.00
Priors 0.5
0.5

128
Error Count Estimates for BANKRUPTCY
Bankrupt Nonbankrupt Total
Rate 0.1544 0.4569 0.3057
Priors 0.5000 0.5000
YEAR 4
Observations 195 DF Total 194
Variables 4 DF Within Classes 193
Classes 2 DF Between Classes 1
Class Level Information
BANKRUPTCY Variable Name Frequency Weight Proportion
Prior Probability
Bankrupt Bankrupt 85 85.0000 0.435897 0.500000
Nonbankrupt Nonbankrupt 110 110.0000 0.564103 0.500000
Pooled Covariance Matrix Information
Covariance Matrix Rank
Natural Log of the Determinant of the Covariance Matrix
4 57.29326
Generalized Squared Distance to BANKRUPTCY
From BANKRUPTCY Bankrupt Nonbankrupt
Bankrupt 0 0.53979
Nonbankrupt 0.53979 0

129
LINEAR DISCRIMINANT FUNCTION
Linear Discriminant Function for BANKRUPTCY
Variable Bankrupt Nonbankrupt
Constant -0.25703 -1.00358
M_SHROUT 3.21477E-7 -3.079E-7
M_PRC 0.04342 0.08958
M_VOL -5.4745E-7 4.30144E-7
M_HILOBIDASKSPREAD 0.05049 0.05113
CLASSIFICATION SUMMARY
Number of Observations and Percent Classified into BANKRUPTCY
From BANKRUPTCY Bankrupt Nonbankrupt Total
Bankrupt 67 78.82
18 21.18
85 100.00
Nonbankrupt 58 52.73
52 47.27
110 100.00
Total 125 64.10
70 35.90
195 100.00
Priors 0.5
0.5
Error Count Estimates for BANKRUPTCY
Bankrupt Nonbankrupt Total
Rate 0.2118 0.5273 0.3695
Priors 0.5000 0.5000
YEAR 5
Observations 168 DF Total 167
Variables 4 DF Within Classes 166
Classes 2 DF Between Classes 1

130
Class Level Information
BANKRUPTCY Variable Name Frequency Weight Proportion
Prior Probability
Bankrupt Bankrupt 70 70.0000 0.416667 0.500000
Nonbankrupt Nonbankrupt 98 98.0000 0.583333 0.500000
Pooled Covariance Matrix Information
Covariance Matrix Rank
Natural Log of the Determinant of the Covariance Matrix
4 55.60270
Generalized Squared Distance to BANKRUPTCY
From BANKRUPTCY Bankrupt Nonbankrupt
Bankrupt 0 0.48330
Nonbankrupt 0.48330 0
LINEAR DISCRIMINANT FUNCTION
Linear Discriminant Function for BANKRUPTCY
Variable Bankrupt Nonbankrupt
Constant -0.23238 -0.89786
M_SHROUT 9.80841E-7 4.47579E-7
M_PRC 0.03036 0.06769
M_VOL -9.1498E-7 1.15496E-7
M_HILOBIDASKSPREAD 0.11001 0.13359

131
CLASSIFICATION SUMMARY
Number of Observations and Percent Classified into BANKRUPTCY
From BANKRUPTCY Bankrupt Nonbankrupt Total
Bankrupt 55 78.57
15 21.43
70 100.00
Nonbankrupt 45 45.92
53 54.08
98 100.00
Total 100 59.52
68 40.48
168 100.00
Priors 0.5
0.5
Error Count Estimates for BANKRUPTCY
Bankrupt Nonbankrupt Total
Rate 0.2143 0.4592 0.3367
Priors 0.5000 0.5000

132
Results of Linear Discriminant Analysis : Market variables without bid ask spread and hi lo bid ask spread
YEAR 1
Observations 13 DF Total 12
Variables 4 DF Within Classes 11
Classes 2 DF Between Classes 1
Class Level Information
BANKRUPTCY Variable Name Frequency Weight Proportion
Prior Probability
Bankrupt Bankrupt 10 10.0000 0.769231 0.500000
Nonbankrupt Nonbankrupt 3 3.0000 0.230769 0.500000
Pooled Covariance Matrix Information
Covariance Matrix Rank
Natural Log of the Determinant of the Covariance Matrix
4 32.02790
Generalized Squared Distance to BANKRUPTCY
From BANKRUPTCY Bankrupt Nonbankrupt
Bankrupt 0 4.38366
Nonbankrupt 4.38366 0

133
LINEAR DISCRIMINANT FUNCTION
Linear Discriminant Function for BANKRUPTCY
Variable Bankrupt Nonbankrupt
Constant -2.76775 -2.96839
M_SHROUT 0.0004948 0.0002658
M_PRC 0.11450 0.09712
M_VOL 0.0005243 -0.0002326
M_SPREAD 3.30951 9.65757
CLASSIFICATION SUMMARY
Number of Observations and Percent Classified into BANKRUPTCY
From BANKRUPTCY Bankrupt Nonbankrupt Total
Bankrupt 9 90.00
1 10.00
10 100.00
Nonbankrupt 0 0.00
3 100.00
3 100.00
Total 9 69.23
4 30.77
13 100.00
Priors 0.5
0.5
Error Count Estimates for BANKRUPTCY
Bankrupt Nonbankrupt Total
Rate 0.1000 0.0000 0.0500
Priors 0.5000 0.5000
YEAR 4
Observations 8 DF Total 7
Variables 4 DF Within Classes 6
Classes 2 DF Between Classes 1

134
Class Level Information
BANKRUPTCY Variable Name Frequency Weight Proportion
Prior Probability
Bankrupt Bankrupt 7 7.0000 0.875000 0.500000
Nonbankrupt Nonbankrupt 1 1.0000 0.125000 0.500000
Pooled Covariance Matrix Information
Covariance Matrix Rank
Natural Log of the Determinant of the Covariance Matrix
4 32.64361
Generalized Squared Distance to BANKRUPTCY
From BANKRUPTCY Bankrupt Nonbankrupt
Bankrupt 0 20.01507
Nonbankrupt 20.01507 0
LINEAR DISCRIMINANT FUNCTION
Linear Discriminant Function for BANKRUPTCY
Variable Bankrupt Nonbankrupt
Constant -15.70441 -0.73522
M_SHROUT 0.00193 0.0003658
M_PRC -6.69821 -1.27927
M_VOL -0.0009417 -0.0001405
M_SPREAD 29.72955 6.22165

135
CLASSIFICATION SUMMARY
Number of Observations and Percent Classified into BANKRUPTCY
From BANKRUPTCY Bankrupt Nonbankrupt Total
Bankrupt 7 100.00
0 0.00
7 100.00
Nonbankrupt 0 0.00
1 100.00
1 100.00
Total 7 87.50
1 12.50
8 100.00
Priors 0.5
0.5
Error Count Estimates for BANKRUPTCY
Bankrupt Nonbankrupt Total
Rate 0.0000 0.0000 0.0000
Priors 0.5000 0.5000
YEAR 5
Observations 12 DF Total 11
Variables 4 DF Within Classes 10
Classes 2 DF Between Classes 1
Class Level Information
BANKRUPTCY Variable Name Frequency Weight Proportion
Prior Probability
Bankrupt Bankrupt 9 9.0000 0.750000 0.500000
Nonbankrupt Nonbankrupt 3 3.0000 0.250000 0.500000
Pooled Covariance Matrix Information
Covariance Matrix Rank
Natural Log of the Determinant of the Covariance Matrix
4 35.50994

136
Generalized Squared Distance to BANKRUPTCY
From BANKRUPTCY Bankrupt Nonbankrupt
Bankrupt 0 1.97567
Nonbankrupt 1.97567 0
LINEAR DISCRIMINANT FUNCTION
Linear Discriminant Function for BANKRUPTCY
Variable Bankrupt Nonbankrupt
Constant -3.34527 -0.90619
M_SHROUT 0.0000820 0.0000611
M_PRC -0.13147 -0.02655
M_VOL 0.0001999 0.0000167
M_SPREAD 10.97710 6.06596
CLASSIFICATION SUMMARY
Number of Observations and Percent Classified into BANKRUPTCY
From BANKRUPTCY Bankrupt Nonbankrupt Total
Bankrupt 6 66.67
3 33.33
9 100.00
Nonbankrupt 1 33.33
2 66.67
3 100.00
Total 7 58.33
5 41.67
12 100.00
Priors 0.5
0.5
Error Count Estimates for BANKRUPTCY
Bankrupt Nonbankrupt Total
Rate 0.3333 0.3333 0.3333
Priors 0.5000 0.5000

137
Results of Linear Discriminant Analysis : Top 3 Account and Market variables
YEAR 1
Observations 104 DF Total 103
Variables 6 DF Within Classes 102
Classes 2 DF Between Classes 1
Class Level Information
BANKRUPTCY Variable Name Frequency Weight Proportion
Prior Probability
Bankrupt Bankrupt 7 7.0000 0.067308 0.500000
Nonbankrupt Nonbankrupt 97 97.0000 0.932692 0.500000
Pooled Covariance Matrix Information
Covariance Matrix Rank
Natural Log of the Determinant of the Covariance Matrix
6 -10.80012
Generalized Squared Distance to BANKRUPTCY
From BANKRUPTCY Bankrupt Nonbankrupt
Bankrupt 0 1.21252
Nonbankrupt 1.21252 0

138
LINEAR DISCRIMINANT FUNCTION
Variable Bankrupt Nonbankrupt
Constant -6.55211 -5.22930
M_QUICKASSETSTOTOTALASSTS 16.80650 15.92397
M_LTLIABTOTOTASSET 12.56471 10.39807
M_CASHTOTOTALASSETS -2.63099 -3.59411
M_PRC -0.01314 0.09108
M_HILOBIDASKSPREAD 0.87001 0.12567
M_BIDASKSPREAD 11.05879 13.52051
CLASSIFICATION SUMMARY
Number of Observations and Percent Classified into BANKRUPTCY
From BANKRUPTCY Bankrupt Nonbankrupt Total
Bankrupt 6 85.71
1 14.29
7 100.00
Nonbankrupt 23 23.71
74 76.29
97 100.00
Total 29 27.88
75 72.12
104 100.00
Priors 0.5
0.5
Error Count Estimates for BANKRUPTCY
Bankrupt Nonbankrupt Total
Rate 0.1429 0.2371 0.1900
Priors 0.5000 0.5000
YEAR 2
Observations 100 DF Total 99
Variables 6 DF Within Classes 98
Classes 2 DF Between Classes 1

139
Class Level Information
BANKRUPTCY Variable Name Frequency Weight Proportion
Prior Probability
Bankrupt Bankrupt 7 7.0000 0.070000 0.500000
Nonbankrupt Nonbankrupt 93 93.0000 0.930000 0.500000
Pooled Covariance Matrix Information
Covariance Matrix Rank
Natural Log of the Determinant of the Covariance Matrix
6 -9.97322
Generalized Squared Distance to BANKRUPTCY
From BANKRUPTCY Bankrupt Nonbankrupt
Bankrupt 0 1.58188
Nonbankrupt 1.58188 0
LINEAR DISCRIMINANT FUNCTION
Variable Bankrupt Nonbankrupt
Constant -13.06377 -8.34462
M_QUICKASSETSTOTOTALASSTS 31.54882 26.14597
M_LTLIABTOTOTASSET 28.69393 21.37375
M_CASHTOTOTALASSETS -3.57459 -4.92930
M_PRC 0.13754 0.14330
M_HILOBIDASKSPREAD -0.17835 -0.16421
M_BIDASKSPREAD 12.93141 13.30320

140
CLASSIFICATION SUMMARY
Number of Observations and Percent Classified into BANKRUPTCY
From BANKRUPTCY Bankrupt Nonbankrupt Total
Bankrupt 6 85.71
1 14.29
7 100.00
Nonbankrupt 23 24.73
70 75.27
93 100.00
Total 29 29.00
71 71.00
100 100.00
Priors 0.5
0.5
Error Count Estimates for BANKRUPTCY
Bankrupt Nonbankrupt Total
Rate 0.1429 0.2473 0.1951
Priors 0.5000 0.5000
YEAR 3
Observations 90 DF Total 89
Variables 6 DF Within Classes 88
Classes 2 DF Between Classes 1
Class Level Information
BANKRUPTCY Variable Name Frequency Weight Proportion
Prior Probability
Bankrupt Bankrupt 3 3.0000 0.033333 0.500000
Nonbankrupt Nonbankrupt 87 87.0000 0.966667 0.500000
Pooled Covariance Matrix Information
Covariance Matrix Rank
Natural Log of the Determinant of the Covariance Matrix
6 -7.30000

141
Generalized Squared Distance to BANKRUPTCY
From BANKRUPTCY Bankrupt Nonbankrupt
Bankrupt 0 3.38909
Nonbankrupt 3.38909 0
LINEAR DISCRIMINANT FUNCTION
Variable Bankrupt Nonbankrupt
Constant -13.59752 -8.21522
M_QUICKASSETSTOTOTALASSTS 34.81509 24.38655
M_LTLIABTOTOTASSET 24.11595 20.88755
M_CASHTOTOTALASSETS -2.53731 -0.90059
M_PRC 0.06785 0.10697
M_HILOBIDASKSPREAD 0.09159 0.05053
M_BIDASKSPREAD 4.85112 7.29986
CLASSIFICATION SUMMARY
Number of Observations and Percent Classified into BANKRUPTCY
From BANKRUPTCY Bankrupt Nonbankrupt Total
Bankrupt 3 100.00
0 0.00
3 100.00
Nonbankrupt 19 21.84
68 78.16
87 100.00
Total 22 24.44
68 75.56
90 100.00
Priors 0.5
0.5
Error Count Estimates for BANKRUPTCY
Bankrupt Nonbankrupt Total
Rate 0.0000 0.2184 0.1092
Priors 0.5000 0.5000

142
Results of Linear Discriminant Analysis : Top 3 Account and Market logarithmic variables
YEAR 1
Observations 82 DF Total 81
Variables 6 DF Within Classes 80
Classes 2 DF Between Classes 1
Class Level Information
BANKRUPTCY Variable Name Frequency Weight Proportion
Prior Probability
Bankrupt Bankrupt 4 4.0000 0.048780 0.500000
Nonbankrupt Nonbankrupt 78 78.0000 0.951220 0.500000
Pooled Covariance Matrix Information
Covariance Matrix Rank
Natural Log of the Determinant of the Covariance Matrix
6 0.84296
Generalized Squared Distance to BANKRUPTCY
From BANKRUPTCY Bankrupt Nonbankrupt
Bankrupt 0 2.63756
Nonbankrupt 2.63756 0

143
LINEAR DISCRIMINANT FUNCTION
Linear Discriminant Function for BANKRUPTCY
Variable Bankrupt Nonbankrupt
Constant -84.13757 -74.82504
M_LOG_CASHTOCURLIABILITIES -2.20271 -1.35251
M_LOG_NETINCOMETOTOTALDEBT -8.35535 -7.97391
M_LOG_TOTALDEBT -10.21895 -9.89800
M_LOG_VOL -0.84229 -1.79058
M_LOG_HILOBIDASKSPREAD 12.69352 12.24994
M_LOG_SHROUT 17.63940 17.90549
CLASSIFICATION SUMMARY
Number of Observations and Percent Classified into BANKRUPTCY
From BANKRUPTCY Bankrupt Nonbankrupt Total
Bankrupt 3 75.00
1 25.00
4 100.00
Nonbankrupt 17 21.79
61 78.21
78 100.00
Total 20 24.39
62 75.61
82 100.00
Priors 0.5
0.5
Error Count Estimates for BANKRUPTCY
Bankrupt Nonbankrupt Total
Rate 0.2500 0.2179 0.2340
Priors 0.5000 0.5000

144
YEAR 2
Observations 80 DF Total 79
Variables 6 DF Within Classes 78
Classes 2 DF Between Classes 1
Class Level Information
BANKRUPTCY Variable Name Frequency Weight Proportion
Prior Probability
Bankrupt Bankrupt 3 3.0000 0.037500 0.500000
Nonbankrupt Nonbankrupt 77 77.0000 0.962500 0.500000
Pooled Covariance Matrix Information
Covariance Matrix Rank
Natural Log of the Determinant of the Covariance Matrix
6 0.82818
Generalized Squared Distance to BANKRUPTCY
From BANKRUPTCY Bankrupt Nonbankrupt
Bankrupt 0 1.45415
Nonbankrupt 1.45415 0
LINEAR DISCRIMINANT FUNCTION
Linear Discriminant Function for BANKRUPTCY
Variable Bankrupt Nonbankrupt
Constant -73.35527 -63.42261
M_LOG_CASHTOCURLIABILITIES -2.31427 -1.66690
M_LOG_NETINCOMETOTOTALDEBT -5.89715 -6.04658
M_LOG_TOTALDEBT -8.59159 -8.24209
M_LOG_VOL -2.35394 -2.30403
M_LOG_HILOBIDASKSPREAD 5.57258 5.72041
M_LOG_SHROUT 17.39879 16.29230

145
CLASSIFICATION SUMMARY
Number of Observations and Percent Classified into BANKRUPTCY
From BANKRUPTCY Bankrupt Nonbankrupt Total
Bankrupt 2 66.67
1 33.33
3 100.00
Nonbankrupt 18 23.38
59 76.62
77 100.00
Total 20 25.00
60 75.00
80 100.00
Priors 0.5
0.5
Error Count Estimates for BANKRUPTCY
Bankrupt Nonbankrupt Total
Rate 0.3333 0.2338 0.2835
Priors 0.5000 0.5000
YEAR 3
Observations 75 DF Total 74
Variables 6 DF Within Classes 73
Classes 2 DF Between Classes 1
Class Level Information
BANKRUPTCY Variable Name Frequency Weight Proportion
Prior Probability
Bankrupt Bankrupt 1 1.0000 0.013333 0.500000
Nonbankrupt Nonbankrupt 74 74.0000 0.986667 0.500000
Pooled Covariance Matrix Information
Covariance Matrix Rank
Natural Log of the Determinant of the Covariance Matrix
6 0.46670

146
Generalized Squared Distance to BANKRUPTCY
From BANKRUPTCY Bankrupt Nonbankrupt
Bankrupt 0 3.47549
Nonbankrupt 3.47549 0
LINEAR DISCRIMINANT FUNCTION
Linear Discriminant Function for BANKRUPTCY
Variable Bankrupt Nonbankrupt
Constant -89.44037 -76.37517
M_LOG_CASHTOCURLIABILITIES -0.75524 -1.40711
M_LOG_NETINCOMETOTOTALDEBT -11.56473 -9.85061
M_LOG_TOTALDEBT -12.35136 -10.75579
M_LOG_VOL -0.15926 -0.67424
M_LOG_HILOBIDASKSPREAD 10.23674 9.33632
M_LOG_SHROUT 17.53023 16.70143
CLASSIFICATION SUMMARY
Number of Observations and Percent Classified into BANKRUPTCY
From BANKRUPTCY Bankrupt Nonbankrupt Total
Bankrupt 1 100.00
0 0.00
1 100.00
Nonbankrupt 11 14.86
63 85.14
74 100.00
Total 12 16.00
63 84.00
75 100.00
Priors 0.5
0.5
Error Count Estimates for BANKRUPTCY
Bankrupt Nonbankrupt Total
Rate 0.0000 0.1486 0.0743
Priors 0.5000 0.5000

147
Results of Linear Discriminant Analysis : Variables (Price, Standard deviation, bid ask spread, net income to sales, working capital to total assets and current liabilities to total assets )
YEAR 1
Observations 184 DF Total 183
Variables 6 DF Within Classes 182
Classes 2 DF Between Classes 1
Class Level Information
BANKRUPTCY Variable Name Frequency Weight Proportion
Prior Probability
Bankrupt Bankrupt 85 85.0000 0.461957 0.500000
Nonbankrupt Nonbankrupt 99 99.0000 0.538043 0.500000
Pooled Covariance Matrix Information
Covariance Matrix Rank
Natural Log of the Determinant of the Covariance Matrix
6 -1.60984
Generalized Squared Distance to BANKRUPTCY
From BANKRUPTCY Bankrupt Nonbankrupt
Bankrupt 0 1.61073
Nonbankrupt 1.61073 0

148
LINEAR DISCRIMINANT FUNCTION
Variable Bankrupt Nonbankrupt
Constant -4.32807 -3.80474
M_PRC 0.11810 0.15330
M_SDRETURN 2.41645 2.05412
M_BIDASKSPREAD 9.73147 3.22090
M_NETINCOMETOSALES -0.02259 0.01054
M_WCTOTOTALASSETS 5.41778 7.32059
M_CURLIABTOTOTASSET 12.11498 10.67717
CLASSIFICATION SUMMARY
Number of Observations and Percent Classified into BANKRUPTCY
From BANKRUPTCY Bankrupt Nonbankrupt Total
Bankrupt 59 69.41
26 30.59
85 100.00
Nonbankrupt 12 12.12
87 87.88
99 100.00
Total 71 38.59
113 61.41
184 100.00
Priors 0.5
0.5
Error Count Estimates for BANKRUPTCY
Bankrupt Nonbankrupt Total
Rate 0.3059 0.1212 0.2135
Priors 0.5000 0.5000
Observations 90 DF Total 89
Variables 6 DF Within Classes 88
Classes 2 DF Between Classes 1
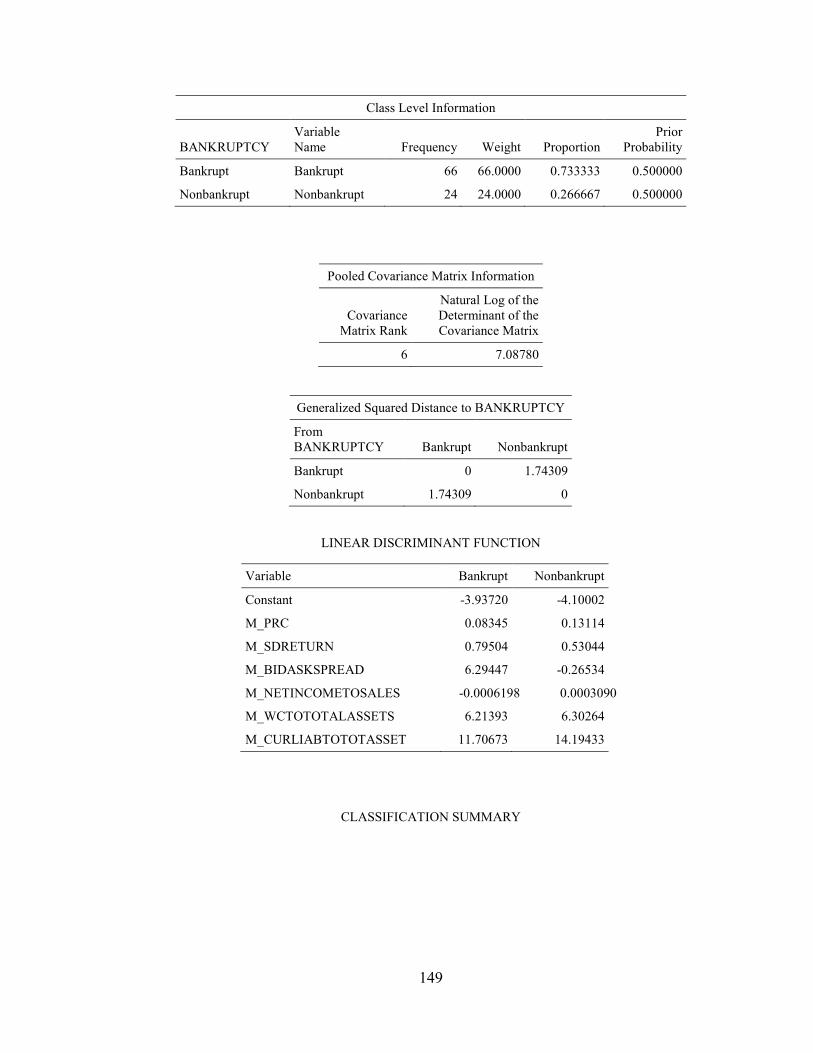
149
Class Level Information
BANKRUPTCY Variable Name Frequency Weight Proportion
Prior Probability
Bankrupt Bankrupt 66 66.0000 0.733333 0.500000
Nonbankrupt Nonbankrupt 24 24.0000 0.266667 0.500000
Pooled Covariance Matrix Information
Covariance Matrix Rank
Natural Log of the Determinant of the Covariance Matrix
6 7.08780
Generalized Squared Distance to BANKRUPTCY
From BANKRUPTCY Bankrupt Nonbankrupt
Bankrupt 0 1.74309
Nonbankrupt 1.74309 0
LINEAR DISCRIMINANT FUNCTION
Variable Bankrupt Nonbankrupt
Constant -3.93720 -4.10002
M_PRC 0.08345 0.13114
M_SDRETURN 0.79504 0.53044
M_BIDASKSPREAD 6.29447 -0.26534
M_NETINCOMETOSALES -0.0006198 0.0003090
M_WCTOTOTALASSETS 6.21393 6.30264
M_CURLIABTOTOTASSET 11.70673 14.19433
CLASSIFICATION SUMMARY

150
Number of Observations and Percent Classified into BANKRUPTCY
From BANKRUPTCY Bankrupt Nonbankrupt Total
Bankrupt 50 75.76
16 24.24
66 100.00
Nonbankrupt 4 16.67
20 83.33
24 100.00
Total 54 60.00
36 40.00
90 100.00
Priors 0.5
0.5
Error Count Estimates for BANKRUPTCY
Bankrupt Nonbankrupt Total
Rate 0.2424 0.1667 0.2045
Priors 0.5000 0.5000
YEAR 5
Observations 43 DF Total 42
Variables 6 DF Within Classes 41
Classes 2 DF Between Classes 1
Class Level Information
BANKRUPTCY Variable Name Frequency Weight Proportion
Prior Probability
Bankrupt Bankrupt 27 27.0000 0.627907 0.500000
Nonbankrupt Nonbankrupt 16 16.0000 0.372093 0.500000
Pooled Covariance Matrix Information
Covariance Matrix Rank
Natural Log of the Determinant of the Covariance Matrix
6 -0.52399

151
Generalized Squared Distance to BANKRUPTCY
From BANKRUPTCY Bankrupt Nonbankrupt
Bankrupt 0 1.38511
Nonbankrupt 1.38511 0
LINEAR DISCRIMINANT FUNCTION
Variable Bankrupt Nonbankrupt
Constant -4.57820 -3.57903
M_PRC 0.06467 0.09664
M_SDRETURN 2.45660 1.90797
M_BIDASKSPREAD 5.62832 1.17144
M_NETINCOMETOSALES -0.01887 -0.00846
M_WCTOTOTALASSETS 6.82650 5.81797
M_CURLIABTOTOTASSET 15.37149 14.10884
CLASSIFICATION SUMMARY
Number of Observations and Percent Classified into BANKRUPTCY
From BANKRUPTCY Bankrupt Nonbankrupt Total
Bankrupt 21 77.78
6 22.22
27 100.00
Nonbankrupt 2 12.50
14 87.50
16 100.00
Total 23 53.49
20 46.51
43 100.00
Priors 0.5
0.5
Error Count Estimates for BANKRUPTCY
Bankrupt Nonbankrupt Total
Rate 0.2222 0.1250 0.1736
Priors 0.5000 0.5000

152
Results of Linear Discriminant Analysis : Variables (Price, Standard deviation, hi lo bid ask spread, net income to sales, working capital to total assets and current liabilities to total assets )
YEAR 1
Observations 185 DF Total 184
Variables 6 DF Within Classes 183
Classes 2 DF Between Classes 1
Class Level Information
BANKRUPTCY Variable Name Frequency Weight Proportion
Prior Probability
Bankrupt Bankrupt 86 86.0000 0.464865 0.500000
Nonbankrupt Nonbankrupt 99 99.0000 0.535135 0.500000
Pooled Covariance Matrix Information
Covariance Matrix Rank
Natural Log of the Determinant of the Covariance Matrix
6 6.60198
Generalized Squared Distance to BANKRUPTCY
From BANKRUPTCY Bankrupt Nonbankrupt
Bankrupt 0 1.40346
Nonbankrupt 1.40346 0

153
LINEAR DISCRIMINANT FUNCTION
Variable Bankrupt Nonbankrupt
Constant -3.78217 -3.81762
M_PRC 0.10704 0.16872
M_SDRETURN 2.74784 2.11682
M_HILOBIDASKSPREAD 0.02652 -0.05729
M_NETINCOMETOSALES -0.01368 0.01312
M_WCTOTOTALASSETS 5.86099 7.52057
M_CURLIABTOTOTASSET 11.99349 10.62886
CLASSIFICATION SUMMARY
Number of Observations and Percent Classified into BANKRUPTCY
From BANKRUPTCY Bankrupt Nonbankrupt Total
Bankrupt 62 72.09
24 27.91
86 100.00
Nonbankrupt 14 14.14
85 85.86
99 100.00
Total 76 41.08
109 58.92
185 100.00
Priors 0.5
0.5
Error Count Estimates for BANKRUPTCY
Bankrupt Nonbankrupt Total
Rate 0.2791 0.1414 0.2102
Priors 0.5000 0.5000
YEAR 4
Observations 90 DF Total 89
Variables 6 DF Within Classes 88
Classes 2 DF Between Classes 1

154
Class Level Information
BANKRUPTCY Variable Name Frequency Weight Proportion
Prior Probability
Bankrupt Bankrupt 66 66.0000 0.733333 0.500000
Nonbankrupt Nonbankrupt 24 24.0000 0.266667 0.500000
Pooled Covariance Matrix Information
Covariance Matrix Rank
Natural Log of the Determinant of the Covariance Matrix
6 11.72874
Generalized Squared Distance to BANKRUPTCY
From BANKRUPTCY Bankrupt Nonbankrupt
Bankrupt 0 0.58867
Nonbankrupt 0.58867 0
LINEAR DISCRIMINANT FUNCTION
Variable Bankrupt Nonbankrupt
Constant -3.44353 -4.29162
M_PRC 0.11406 0.18214
M_SDRETURN 0.71053 0.59407
M_HILOBIDASKSPREAD -0.21427 -0.36226
M_NETINCOMETOSALES 0.0000734 0.0004625
M_WCTOTOTALASSETS 7.17306 7.08585
M_CURLIABTOTOTASSET 13.96813 14.83277

155
CLASSIFICATION SUMMARY
Number of Observations and Percent Classified into BANKRUPTCY
From BANKRUPTCY Bankrupt Nonbankrupt Total
Bankrupt 54 81.82
12 18.18
66 100.00
Nonbankrupt 15 62.50
9 37.50
24 100.00
Total 69 76.67
21 23.33
90 100.00
Priors 0.5
0.5
Error Count Estimates for BANKRUPTCY
Bankrupt Nonbankrupt Total
Rate 0.1818 0.6250 0.4034
Priors 0.5000 0.5000
YEAR 5
Observations 45 DF Total 44
Variables 6 DF Within Classes 43
Classes 2 DF Between Classes 1
Class Level Information
BANKRUPTCY Variable Name Frequency Weight Proportion
Prior Probability
Bankrupt Bankrupt 29 29.0000 0.644444 0.500000
Nonbankrupt Nonbankrupt 16 16.0000 0.355556 0.500000
Pooled Covariance Matrix Information
Covariance Matrix Rank
Natural Log of the Determinant of the Covariance Matrix
6 3.77731

156
Generalized Squared Distance to BANKRUPTCY
From BANKRUPTCY Bankrupt Nonbankrupt
Bankrupt 0 0.64545
Nonbankrupt 0.64545 0
LINEAR DISCRIMINANT FUNCTION
Variable Bankrupt Nonbankrupt
Constant -3.86992 -3.76312
M_PRC 0.02450 0.06279
M_SDRETURN 2.72330 2.02694
M_HILOBIDASKSPREAD 0.49479 0.49539
M_NETINCOMETOSALES -0.01455 -0.00591
M_WCTOTOTALASSETS 5.12025 5.03768
M_CURLIABTOTOTASSET 16.80802 14.95241
CLASSIFICATION SUMMARY
Number of Observations and Percent Classified into BANKRUPTCY
From BANKRUPTCY Bankrupt Nonbankrupt Total
Bankrupt 20 68.97
9 31.03
29 100.00
Nonbankrupt 7 43.75
9 56.25
16 100.00
Total 27 60.00
18 40.00
45 100.00
Priors 0.5
0.5
Error Count Estimates for BANKRUPTCY
Bankrupt Nonbankrupt Total
Rate 0.3103 0.4375 0.3739
Priors 0.5000 0.5000

157
quadratic MDA does so for nonbankrupt firms. For overall accuracy, the nonparametric
MDA slightly outperforms the linear MDA, consistent with the previously used sets of
variables.
We must highlight the two most interesting findings. First, overall accuracy in
classifying bankrupt firms (minimizing Type I error) is found through the use of market
variables alone. This is important since it is much more costly to incorrectly classify an
actual bankrupt firm than it is to do so with an actual nonbankrupt firm. This strikes a
divergence from the previous literature. Most research has highlighted the value of
adding market variables to bankruptcy prediction models, but concludes that accounting
ratios are still important in bankruptcy prediction. Our results lead us to conclude that
forward-looking market variables alone, without backward-looking accounting ratios, are
sufficient to accurately forecast bankruptcy. Notably, by adding price, standard deviation
of returns, and the bid-ask spread to the model, the model outperforms a model of just
accounting ratios. This ties together a vast array of literature. The behavior of price,
standard deviation of returns, and, recently, the bid-ask spread, has been documented to
contain information. Therefore, it is promising that these variables show discriminatory
power.
For correctly classifying nonbankrupt firms, which is of less importance than
doing so with bankrupt firms, the mix of accounting ratios and market variables are better
predictors than just the market variables. An explanation for this is the fact that the
accounting ratios are not deteriorating, and this pattern alone may be able to demonstrate
that these firms are not falling into distress. During non-financial crisis periods, the

158
findings will probably be stronger. While market variables are generally noisier variables,
the stability of accounting ratios is consistent with a firm that is not under distress. This
highlights why it is still important to include accounting ratios in any bankruptcy
prediction framework or model. They still contain important information, and while
correctly classifying bankrupt firms is more pertinent to investors and loan officers, it is
still important to lend and invest in firms that will not deteriorate.
The second important finding is the accuracy of the nonparametric MDA. While
much research concludes that the assumptions underlying the linear MDA are violated,
most researchers still employ parametric models. The improvement in technology and
programming languages allows us to use a bevy of models, so we conclude that there is
little use in still using the parametric models. While correctly classifying bankrupt firms
is more important than doing so with nonbankrupt firms, overall accuracy is still
desirable. An investor can be led to not optimally allocate her resources by avoiding
investments in certain firms that are incorrectly classified as probable bankrupt firms.
The nonparametric model provides the overall accuracy desired. While this has been
avoided due to the tradeoff between accuracy and model complexity, this is no longer a
reason to avoid these models. This will be further highlighted in the next chapter on
neural networks.
Lastly, an out-of-sample nonparametric MDA is performed. We choose to use the
nonparametric MDA because it has shown the highest overall accuracy. Using the ratios
and variables from five years to two years before bankruptcy, the nonparametric model is
estimated. Then, predictions are made as to whether firms are bankrupt or nonbankrupt
one year before bankruptcy. While the misclassification rates are important, a prediction
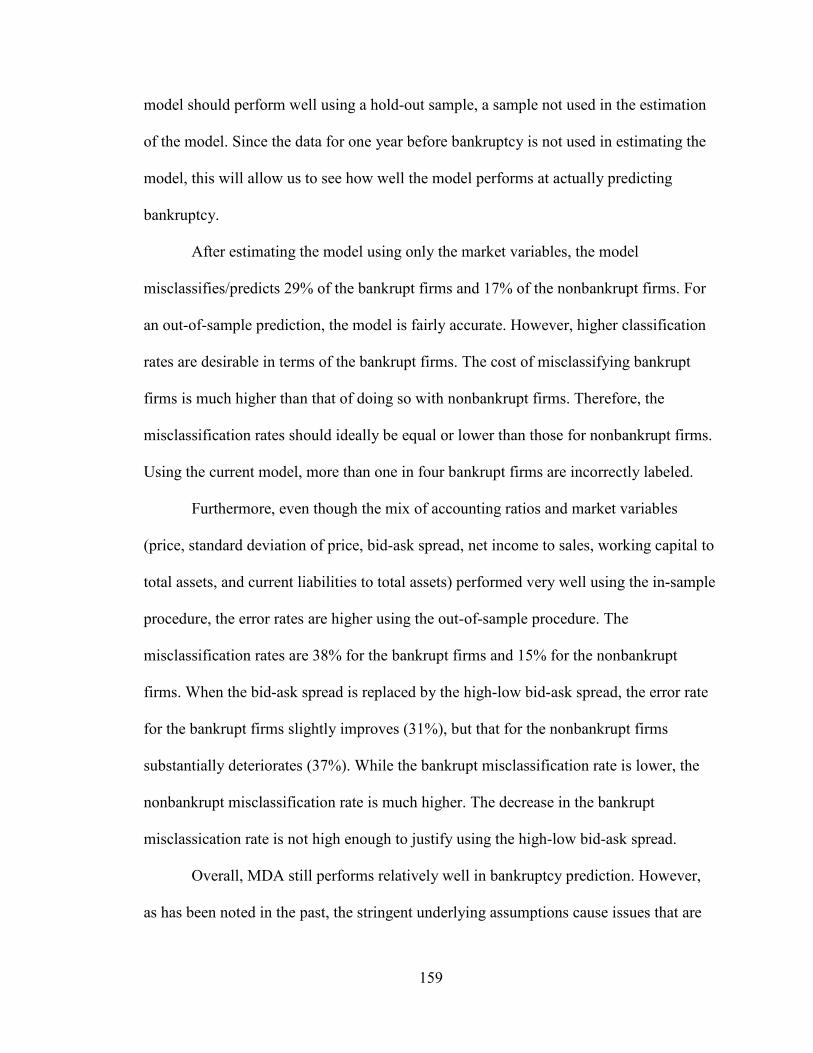
159
model should perform well using a hold-out sample, a sample not used in the estimation
of the model. Since the data for one year before bankruptcy is not used in estimating the
model, this will allow us to see how well the model performs at actually predicting
bankruptcy.
After estimating the model using only the market variables, the model
misclassifies/predicts 29% of the bankrupt firms and 17% of the nonbankrupt firms. For
an out-of-sample prediction, the model is fairly accurate. However, higher classification
rates are desirable in terms of the bankrupt firms. The cost of misclassifying bankrupt
firms is much higher than that of doing so with nonbankrupt firms. Therefore, the
misclassification rates should ideally be equal or lower than those for nonbankrupt firms.
Using the current model, more than one in four bankrupt firms are incorrectly labeled.
Furthermore, even though the mix of accounting ratios and market variables
(price, standard deviation of price, bid-ask spread, net income to sales, working capital to
total assets, and current liabilities to total assets) performed very well using the in-sample
procedure, the error rates are higher using the out-of-sample procedure. The
misclassification rates are 38% for the bankrupt firms and 15% for the nonbankrupt
firms. When the bid-ask spread is replaced by the high-low bid-ask spread, the error rate
for the bankrupt firms slightly improves (31%), but that for the nonbankrupt firms
substantially deteriorates (37%). While the bankrupt misclassification rate is lower, the
nonbankrupt misclassification rate is much higher. The decrease in the bankrupt
misclassication rate is not high enough to justify using the high-low bid-ask spread.
Overall, MDA still performs relatively well in bankruptcy prediction. However,
as has been noted in the past, the stringent underlying assumptions cause issues that are

160
difficult to correct. The nonparametric MDA is an improvement, but more technical
models are needed. This has led to the use of neural networks, which we discuss in
Chapter 4.
Furthermore, the out-of-sample model estimated with only market variables
shows much higher predictive power than that of the model estimated with market
variables and accounting ratios. While this deviates from prior findings, it is an important
addition to literature. This alone highlights the need to use forward-looking variables in
any predictive framework. However, one caveat is the sample period we use. Much has
been documented about the accounting ratios of firms over the past couple of decades,
namely off-balance sheet transactions. This, mixed with the fact that a financial crisis
loomed during our sample period (not the off-balance sheet transactions and the financial
crisis are mutually exclusive), makes it more difficult for the accounting ratios to
discriminate between firms. More evidence is needed during expansionary and normal
market cycles.
Table 8
Results of Quadratic Discriminant Analysis : Accounting variables
YEAR 1
Observations 101 DF Total 100
Variables 17 DF Within Classes 99
Classes 2 DF Between Classes 1
Class Level Information
BANKRUPTCY Variable Name Frequency Weight Proportion
Prior Probability
Bankrupt Bankrupt 6 6.0000 0.059406 0.500000
Nonbankrupt Nonbankrupt 95 95.0000 0.940594 0.500000
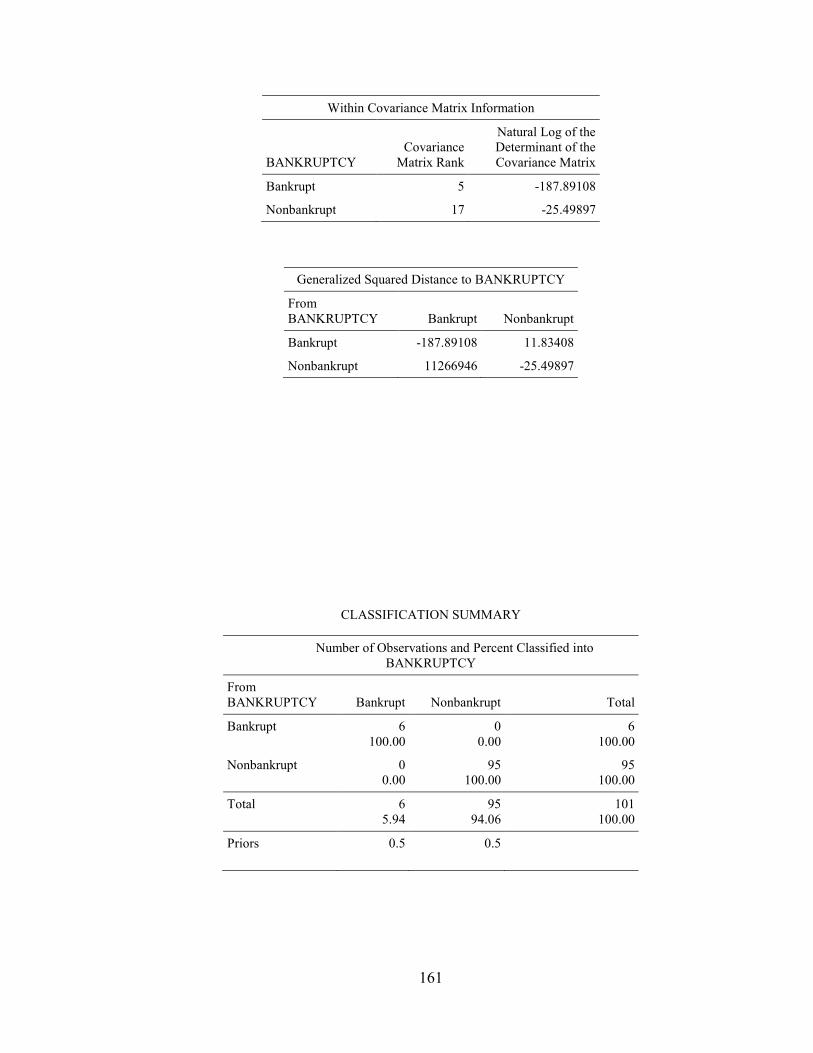
161
Generalized Squared Distance to BANKRUPTCY
From BANKRUPTCY Bankrupt Nonbankrupt
Bankrupt -187.89108 11.83408
Nonbankrupt 11266946 -25.49897
CLASSIFICATION SUMMARY
Number of Observations and Percent Classified into BANKRUPTCY
From BANKRUPTCY Bankrupt Nonbankrupt Total
Bankrupt 6 100.00
0 0.00
6 100.00
Nonbankrupt 0 0.00
95 100.00
95 100.00
Total 6 5.94
95 94.06
101 100.00
Priors 0.5
0.5
Within Covariance Matrix Information
BANKRUPTCY Covariance
Matrix Rank
Natural Log of the Determinant of the Covariance Matrix
Bankrupt 5 -187.89108
Nonbankrupt 17 -25.49897

162
Error Count Estimates for BANKRUPTCY
Bankrupt Nonbankrupt Total
Rate 0.0000 0.0000 0.0000
Priors 0.5000 0.5000
YEAR 2
Observations 99 DF Total 98
Variables 17 DF Within Classes 97
Classes 2 DF Between Classes 1
Class Level Information
BANKRUPTCY Variable Name Frequency Weight Proportion
Prior Probability
Bankrupt Bankrupt 6 6.0000 0.060606 0.500000
Nonbankrupt Nonbankrupt 93 93.0000 0.939394 0.500000
Within Covariance Matrix Information
BANKRUPTCY Covariance
Matrix Rank
Natural Log of the Determinant of the Covariance Matrix
Bankrupt 5 -173.21001
Nonbankrupt 17 -10.03209
Generalized Squared Distance to BANKRUPTCY
From BANKRUPTCY Bankrupt Nonbankrupt
Bankrupt -173.21001 -6.67155
Nonbankrupt 15873260 -10.03209

163
CLASSIFICATION SUMMARY
Number of Observations and Percent Classified into BANKRUPTCY
From BANKRUPTCY Bankrupt Nonbankrupt Total
Bankrupt 6 100.00
0 0.00
6 100.00
Nonbankrupt 0 0.00
93 100.00
93 100.00
Total 6 6.06
93 93.94
99 100.00
Priors 0.5
0.5
Error Count Estimates for BANKRUPTCY
Bankrupt Nonbankrupt Total
Rate 0.0000 0.0000 0.0000
Priors 0.5000 0.5000
YEAR 3
Observations 88 DF Total 87
Variables 17 DF Within Classes 86
Classes 2 DF Between Classes 1
Class Level Information
BANKRUPTCY Variable Name Frequency Weight Proportion
Prior Probability
Bankrupt Bankrupt 2 2.0000 0.022727 0.500000
Nonbankrupt Nonbankrupt 86 86.0000 0.977273 0.500000

164
Within Covariance Matrix Information
BANKRUPTCY Covariance
Matrix Rank
Natural Log of the Determinant of the Covariance Matrix
Bankrupt 1 -238.93864
Nonbankrupt 17 -8.66762
Generalized Squared Distance to BANKRUPTCY
From BANKRUPTCY Bankrupt Nonbankrupt
Bankrupt -238.93864 0.71480
Nonbankrupt 103908349 -8.66762
CLASSIFICATION SUMMARY
Number of Observations and Percent Classified into BANKRUPTCY
From BANKRUPTCY Bankrupt Nonbankrupt Total
Bankrupt 2 100.00
0 0.00
2 100.00
Nonbankrupt 0 0.00
86 100.00
86 100.00
Total 2 2.27
86 97.73
88 100.00
Priors 0.5
0.5
Error Count Estimates for BANKRUPTCY
Bankrupt Nonbankrupt Total
Rate 0.0000 0.0000 0.0000
Priors 0.5000 0.5000

165
Results of Quadratic Discriminant Analysis : Market variables
YEAR 1
Observations 249 DF Total 248
Variables 5 DF Within Classes 247
Classes 2 DF Between Classes 1
Class Level Information
BANKRUPTCY Variable Name Frequency Weight Proportion
Prior Probability
Bankrupt Bankrupt 133 133.0000 0.534137 0.500000
Nonbankrupt Nonbankrupt 116 116.0000 0.465863 0.500000
Within Covariance Matrix Information
BANKRUPTCY Covariance
Matrix Rank
Natural Log of the Determinant of the Covariance Matrix
Bankrupt 5 48.91501
Nonbankrupt 5 51.79354
Generalized Squared Distance to BANKRUPTCY
From BANKRUPTCY Bankrupt Nonbankrupt
Bankrupt 48.91501 54.55474
Nonbankrupt 52.55099 51.79354

166
CLASSIFICATION SUMMARY
Number of Observations and Percent Classified into BANKRUPTCY
From BANKRUPTCY Bankrupt Nonbankrupt Total
Bankrupt 119 89.47
14 10.53
133 100.00
Nonbankrupt 67 57.76
49 42.24
116 100.00
Total 186 74.70
63 25.30
249 100.00
Priors 0.5
0.5
Error Count Estimates for BANKRUPTCY
Bankrupt Nonbankrupt Total
Rate 0.1053 0.5776 0.3414
Priors 0.5000 0.5000
YEAR 4
Observations 194 DF Total 193
Variables 5 DF Within Classes 192
Classes 2 DF Between Classes 1
Class Level Information
BANKRUPTCY Variable Name Frequency Weight Proportion
Prior Probability
Bankrupt Bankrupt 84 84.0000 0.432990 0.500000
Nonbankrupt Nonbankrupt 110 110.0000 0.567010 0.500000
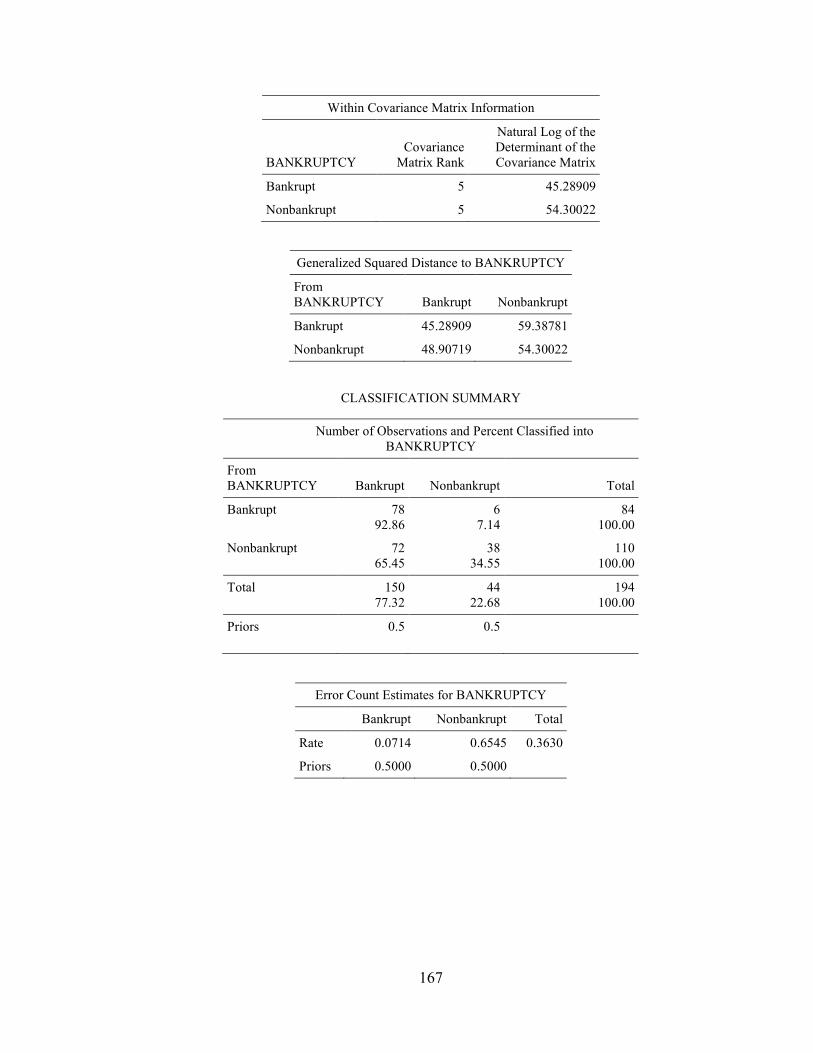
167
Within Covariance Matrix Information
BANKRUPTCY Covariance
Matrix Rank
Natural Log of the Determinant of the Covariance Matrix
Bankrupt 5 45.28909
Nonbankrupt 5 54.30022
Generalized Squared Distance to BANKRUPTCY
From BANKRUPTCY Bankrupt Nonbankrupt
Bankrupt 45.28909 59.38781
Nonbankrupt 48.90719 54.30022
CLASSIFICATION SUMMARY
Number of Observations and Percent Classified into BANKRUPTCY
From BANKRUPTCY Bankrupt Nonbankrupt Total
Bankrupt 78 92.86
6 7.14
84 100.00
Nonbankrupt 72 65.45
38 34.55
110 100.00
Total 150 77.32
44 22.68
194 100.00
Priors 0.5
0.5
Error Count Estimates for BANKRUPTCY
Bankrupt Nonbankrupt Total
Rate 0.0714 0.6545 0.3630
Priors 0.5000 0.5000

168
YEAR 5
Observations 161 DF Total 160
Variables 5 DF Within Classes 159
Classes 2 DF Between Classes 1
Class Level Information
BANKRUPTCY Variable Name Frequency Weight Proportion
Prior Probability
Bankrupt Bankrupt 64 64.0000 0.397516 0.500000
Nonbankrupt Nonbankrupt 97 97.0000 0.602484 0.500000
Within Covariance Matrix Information
BANKRUPTCY Covariance
Matrix Rank
Natural Log of the Determinant of the Covariance Matrix
Bankrupt 5 46.92654
Nonbankrupt 5 51.52546
Generalized Squared Distance to BANKRUPTCY
From BANKRUPTCY Bankrupt Nonbankrupt
Bankrupt 46.92654 60.74987
Nonbankrupt 49.99313 51.52546

169
CLASSIFICATION SUMMARY
Number of Observations and Percent Classified into BANKRUPTCY
From BANKRUPTCY Bankrupt Nonbankrupt Total
Bankrupt 59 92.19
5 7.81
64 100.00
Nonbankrupt 59 60.82
38 39.18
97 100.00
Total 118 73.29
43 26.71
161 100.00
Priors 0.5
0.5
Error Count Estimates for BANKRUPTCY
Bankrupt Nonbankrupt Total
Rate 0.0781 0.6082 0.3432
Priors 0.5000 0.5000

170
Results of Quadratic Discriminant Analysis : Market variables without spread and hi lo bid ask spread
YEAR 1
Observations 249 DF Total 248
Variables 4 DF Within Classes 247
Classes 2 DF Between Classes 1
Class Level Information
BANKRUPTCY Variable Name Frequency Weight Proportion
Prior Probability
Bankrupt Bankrupt 133 133.0000 0.534137 0.500000
Nonbankrupt Nonbankrupt 116 116.0000 0.465863 0.500000
Within Covariance Matrix Information
BANKRUPTCY Covariance
Matrix Rank
Natural Log of the Determinant of the Covariance Matrix
Bankrupt 4 45.00183
Nonbankrupt 4 51.63759
Generalized Squared Distance to BANKRUPTCY
From BANKRUPTCY Bankrupt Nonbankrupt
Bankrupt 45.00183 52.61127
Nonbankrupt 48.38619 51.63759

171
CLASSIFICATION SUMMARY
Number of Observations and Percent Classified into BANKRUPTCY
From BANKRUPTCY Bankrupt Nonbankrupt Total
Bankrupt 122 91.73
11 8.27
133 100.00
Nonbankrupt 83 71.55
33 28.45
116 100.00
Total 205 82.33
44 17.67
249 100.00
Priors 0.5
0.5
Error Count Estimates for BANKRUPTCY
Bankrupt Nonbankrupt Total
Rate 0.0827 0.7155 0.3991
Priors 0.5000 0.5000
YEAR 4
Observations 194 DF Total 193
Variables 4 DF Within Classes 192
Classes 2 DF Between Classes 1
Class Level Information
BANKRUPTCY Variable Name Frequency Weight Proportion
Prior Probability
Bankrupt Bankrupt 84 84.0000 0.432990 0.500000
Nonbankrupt Nonbankrupt 110 110.0000 0.567010 0.500000

172
Within Covariance Matrix Information
BANKRUPTCY Covariance
Matrix Rank
Natural Log of the Determinant of the Covariance Matrix
Bankrupt 4 44.44756
Nonbankrupt 4 51.13029
Generalized Squared Distance to BANKRUPTCY
From BANKRUPTCY Bankrupt Nonbankrupt
Bankrupt 44.44756 56.17319
Nonbankrupt 47.95322 51.13029
CLASSIFICATION SUMMARY
Number of Observations and Percent Classified into BANKRUPTCY
From BANKRUPTCY Bankrupt Nonbankrupt Total
Bankrupt 78 92.86
6 7.14
84 100.00
Nonbankrupt 73 66.36
37 33.64
110 100.00
Total 151 77.84
43 22.16
194 100.00
Priors 0.5
0.5
Error Count Estimates for BANKRUPTCY
Bankrupt Nonbankrupt Total
Rate 0.0714 0.6636 0.3675
Priors 0.5000 0.5000

173
YEAR 5
Observations 161 DF Total 160
Variables 4 DF Within Classes 159
Classes 2 DF Between Classes 1
Class Level Information
BANKRUPTCY Variable Name Frequency Weight Proportion
Prior Probability
Bankrupt Bankrupt 64 64.0000 0.397516 0.500000
Nonbankrupt Nonbankrupt 97 97.0000 0.602484 0.500000
Within Covariance Matrix Information
BANKRUPTCY Covariance
Matrix Rank
Natural Log of the Determinant of the Covariance Matrix
Bankrupt 4 45.68770
Nonbankrupt 4 49.86151
Generalized Squared Distance to BANKRUPTCY
From BANKRUPTCY Bankrupt Nonbankrupt
Bankrupt 45.68770 58.80715
Nonbankrupt 48.73746 49.86151

174
CLASSIFICATION SUMMARY
Number of Observations and Percent Classified into BANKRUPTCY
From BANKRUPTCY Bankrupt Nonbankrupt Total
Bankrupt 59 92.19
5 7.81
64 100.00
Nonbankrupt 61 62.89
36 37.11
97 100.00
Total 120 74.53
41 25.47
161 100.00
Priors 0.5
0.5
Error Count Estimates for BANKRUPTCY
Bankrupt Nonbankrupt Total
Rate 0.0781 0.6289 0.3535
Priors 0.5000 0.5000

175
Results of Quadratic Discriminant Analysis : Market variables without spread and bid ask spread
YEAR 1
Observations 252 DF Total 251
Variables 4 DF Within Classes 250
Classes 2 DF Between Classes 1
Class Level Information
BANKRUPTCY Variable Name Frequency Weight Proportion
Prior Probability
Bankrupt Bankrupt 136 136.0000 0.539683 0.500000
Nonbankrupt Nonbankrupt 116 116.0000 0.460317 0.500000
Within Covariance Matrix Information
BANKRUPTCY Covariance
Matrix Rank
Natural Log of the Determinant of the Covariance Matrix
Bankrupt 4 52.72158
Nonbankrupt 4 56.81245
Generalized Squared Distance to BANKRUPTCY
From BANKRUPTCY Bankrupt Nonbankrupt
Bankrupt 52.72158 59.26423
Nonbankrupt 56.34264 56.81245

176
CLASSIFICATION SUMMARY
Number of Observations and Percent Classified into BANKRUPTCY
From BANKRUPTCY Bankrupt Nonbankrupt Total
Bankrupt 124 91.18
12 8.82
136 100.00
Nonbankrupt 75 64.66
41 35.34
116 100.00
Total 199 78.97
53 21.03
252 100.00
Priors 0.5
0.5
Error Count Estimates for BANKRUPTCY
Bankrupt Nonbankrupt Total
Rate 0.0882 0.6466 0.3674
Priors 0.5000 0.5000
YEAR 4
Observations 195 DF Total 194
Variables 4 DF Within Classes 193
Classes 2 DF Between Classes 1
Class Level Information
BANKRUPTCY Variable Name Frequency Weight Proportion
Prior Probability
Bankrupt Bankrupt 85 85.0000 0.435897 0.500000
Nonbankrupt Nonbankrupt 110 110.0000 0.564103 0.500000

177
Within Covariance Matrix Information
BANKRUPTCY Covariance
Matrix Rank
Natural Log of the Determinant of the Covariance Matrix
Bankrupt 4 48.72453
Nonbankrupt 4 59.13656
Generalized Squared Distance to BANKRUPTCY
From BANKRUPTCY Bankrupt Nonbankrupt
Bankrupt 48.72453 59.51742
Nonbankrupt 52.30193 59.13656
CLASSIFICATION SUMMARY
Number of Observations and Percent Classified into BANKRUPTCY
From BANKRUPTCY Bankrupt Nonbankrupt Total
Bankrupt 80 94.12
5 5.88
85 100.00
Nonbankrupt 77 70.00
33 30.00
110 100.00
Total 157 80.51
38 19.49
195 100.00
Priors 0.5
0.5
Error Count Estimates for BANKRUPTCY
Bankrupt Nonbankrupt Total
Rate 0.0588 0.7000 0.3794
Priors 0.5000 0.5000
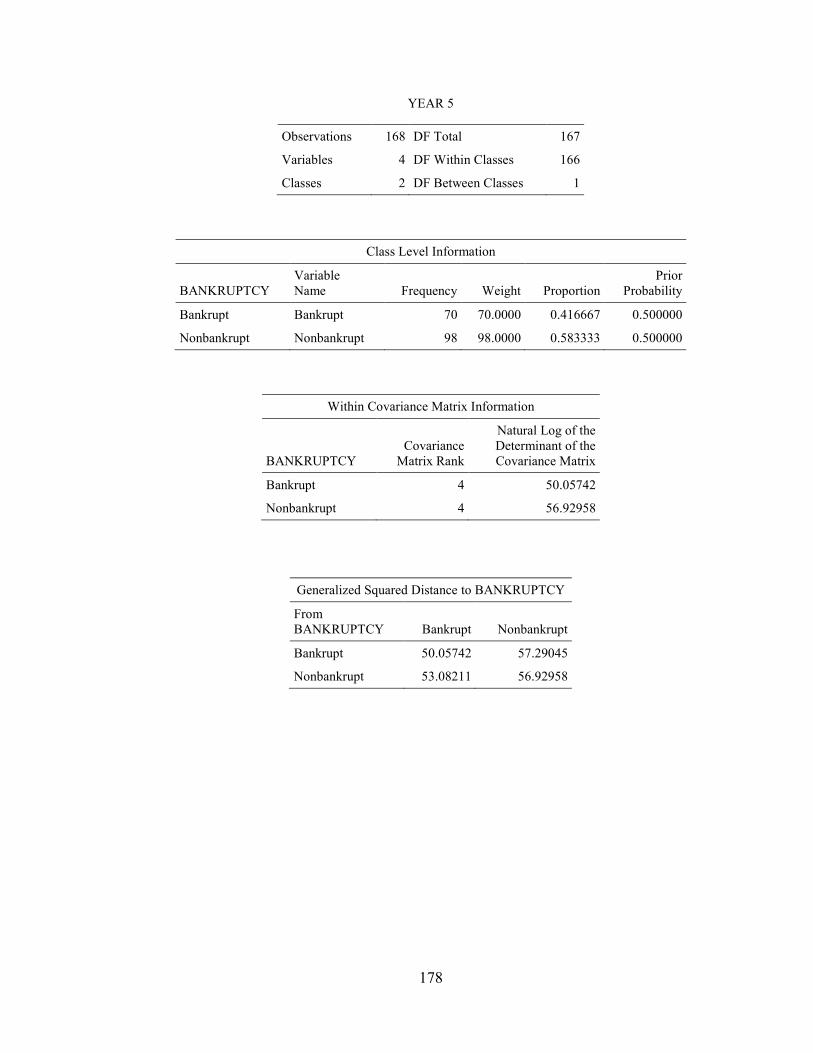
178
YEAR 5
Observations 168 DF Total 167
Variables 4 DF Within Classes 166
Classes 2 DF Between Classes 1
Class Level Information
BANKRUPTCY Variable Name Frequency Weight Proportion
Prior Probability
Bankrupt Bankrupt 70 70.0000 0.416667 0.500000
Nonbankrupt Nonbankrupt 98 98.0000 0.583333 0.500000
Within Covariance Matrix Information
BANKRUPTCY Covariance
Matrix Rank
Natural Log of the Determinant of the Covariance Matrix
Bankrupt 4 50.05742
Nonbankrupt 4 56.92958
Generalized Squared Distance to BANKRUPTCY
From BANKRUPTCY Bankrupt Nonbankrupt
Bankrupt 50.05742 57.29045
Nonbankrupt 53.08211 56.92958

179
CLASSIFICATION SUMMARY
Number of Observations and Percent Classified into BANKRUPTCY
From BANKRUPTCY Bankrupt Nonbankrupt Total
Bankrupt 65 92.86
5 7.14
70 100.00
Nonbankrupt 74 75.51
24 24.49
98 100.00
Total 139 82.74
29 17.26
168 100.00
Priors 0.5
0.5
Error Count Estimates for BANKRUPTCY
Bankrupt Nonbankrupt Total
Rate 0.0714 0.7551 0.4133
Priors 0.5000 0.5000

180
Results of Quadratic Discriminant Analysis : Market variables without bid ask spread and hi lo bid ask spread
YEAR 1
Observations 13 DF Total 12
Variables 4 DF Within Classes 11
Classes 2 DF Between Classes 1
Class Level Information
BANKRUPTCY Variable Name Frequency Weight Proportion
Prior Probability
Bankrupt Bankrupt 10 10.0000 0.769231 0.500000
Nonbankrupt Nonbankrupt 3 3.0000 0.230769 0.500000
Within Covariance Matrix Information
BANKRUPTCY Covariance
Matrix Rank
Natural Log of the Determinant of the Covariance Matrix
Bankrupt 4 29.90733
Nonbankrupt 2 -0.30956
Generalized Squared Distance to BANKRUPTCY
From BANKRUPTCY Bankrupt Nonbankrupt
Bankrupt 29.90733 91487822
Nonbankrupt 34.53467 -0.30956

181
CLASSIFICATION SUMMARY
Number of Observations and Percent Classified into BANKRUPTCY
From BANKRUPTCY Bankrupt Nonbankrupt Total
Bankrupt 10 100.00
0 0.00
10 100.00
Nonbankrupt 0 0.00
3 100.00
3 100.00
Total 10 76.92
3 23.08
13 100.00
Priors 0.5
0.5
Error Count Estimates for BANKRUPTCY
Bankrupt Nonbankrupt Total
Rate 0.0000 0.0000 0.0000
Priors 0.5000 0.5000
YEAR 5
Observations 12 DF Total 11
Variables 4 DF Within Classes 10
Classes 2 DF Between Classes 1
Class Level Information
BANKRUPTCY Variable Name Frequency Weight Proportion
Prior Probability
Bankrupt Bankrupt 9 9.0000 0.750000 0.500000
Nonbankrupt Nonbankrupt 3 3.0000 0.250000 0.500000

182
Within Covariance Matrix Information
BANKRUPTCY Covariance
Matrix Rank
Natural Log of the Determinant of the Covariance Matrix
Bankrupt 4 36.17780
Nonbankrupt 2 -6.31841
Generalized Squared Distance to BANKRUPTCY
From BANKRUPTCY Bankrupt Nonbankrupt
Bankrupt 36.17780 387580929
Nonbankrupt 37.93887 -6.31841
CLASSIFICATION SUMMARY
Number of Observations and Percent Classified into BANKRUPTCY
From BANKRUPTCY Bankrupt Nonbankrupt Total
Bankrupt 9 100.00
0 0.00
9 100.00
Nonbankrupt 0 0.00
3 100.00
3 100.00
Total 9 75.00
3 25.00
12 100.00
Priors 0.5
0.5
Error Count Estimates for BANKRUPTCY
Bankrupt Nonbankrupt Total
Rate 0.0000 0.0000 0.0000
Priors 0.5000 0.5000
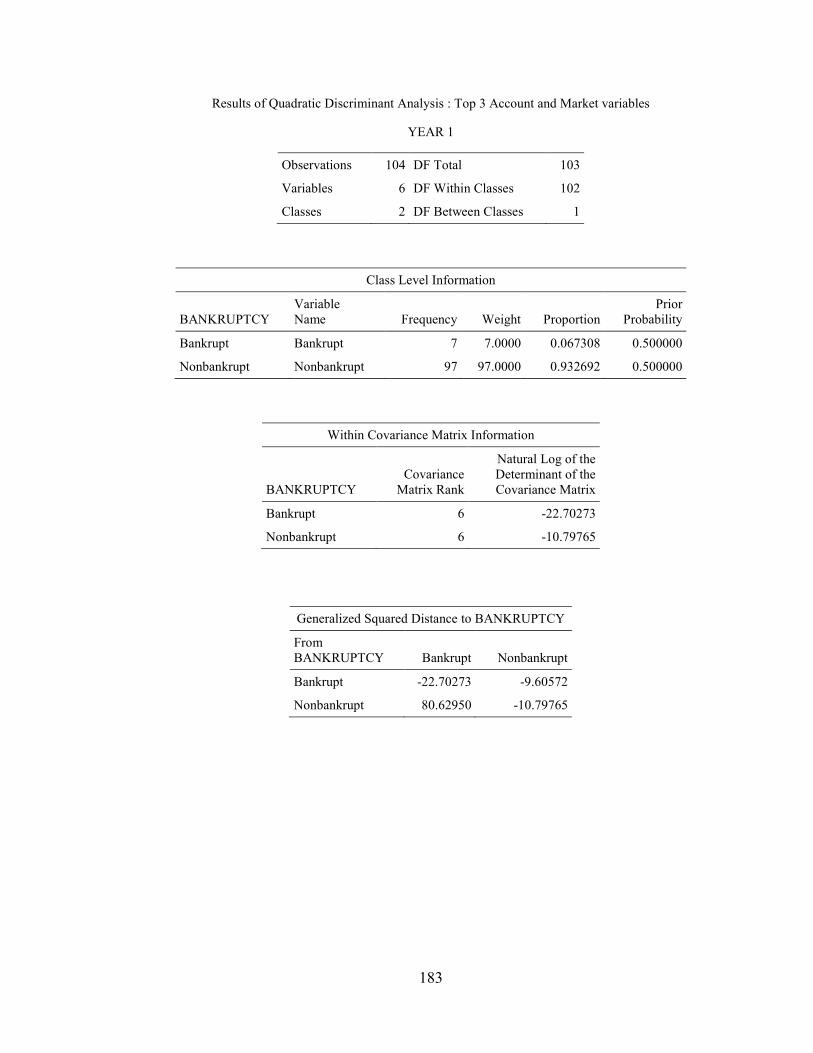
183
Results of Quadratic Discriminant Analysis : Top 3 Account and Market variables
YEAR 1
Observations 104 DF Total 103
Variables 6 DF Within Classes 102
Classes 2 DF Between Classes 1
Class Level Information
BANKRUPTCY Variable Name Frequency Weight Proportion
Prior Probability
Bankrupt Bankrupt 7 7.0000 0.067308 0.500000
Nonbankrupt Nonbankrupt 97 97.0000 0.932692 0.500000
Within Covariance Matrix Information
BANKRUPTCY Covariance
Matrix Rank
Natural Log of the Determinant of the Covariance Matrix
Bankrupt 6 -22.70273
Nonbankrupt 6 -10.79765
Generalized Squared Distance to BANKRUPTCY
From BANKRUPTCY Bankrupt Nonbankrupt
Bankrupt -22.70273 -9.60572
Nonbankrupt 80.62950 -10.79765

184
CLASSIFICATION SUMMARY
Number of Observations and Percent Classified into BANKRUPTCY
From BANKRUPTCY Bankrupt Nonbankrupt Total
Bankrupt 7 100.00
0 0.00
7 100.00
Nonbankrupt 5 5.15
92 94.85
97 100.00
Total 12 11.54
92 88.46
104 100.00
Priors 0.5
0.5
Error Count Estimates for BANKRUPTCY
Bankrupt Nonbankrupt Total
Rate 0.0000 0.0515 0.0258
Priors 0.5000 0.5000
YEAR 2
Observations 100 DF Total 99
Variables 6 DF Within Classes 98
Classes 2 DF Between Classes 1
Class Level Information
BANKRUPTCY Variable Name Frequency Weight Proportion
Prior Probability
Bankrupt Bankrupt 7 7.0000 0.070000 0.500000
Nonbankrupt Nonbankrupt 93 93.0000 0.930000 0.500000

185
Within Covariance Matrix Information
BANKRUPTCY Covariance
Matrix Rank
Natural Log of the Determinant of the Covariance Matrix
Bankrupt 6 -21.56348
Nonbankrupt 6 -9.98246
Generalized Squared Distance to BANKRUPTCY
From BANKRUPTCY Bankrupt Nonbankrupt
Bankrupt -21.56348 -8.36049
Nonbankrupt 806.37144 -9.98246
CLASSIFICATION SUMMARY
Number of Observations and Percent Classified into BANKRUPTCY
From BANKRUPTCY Bankrupt Nonbankrupt Total
Bankrupt 7 100.00
0 0.00
7 100.00
Nonbankrupt 7 7.53
86 92.47
93 100.00
Total 14 14.00
86 86.00
100 100.00
Priors 0.5
0.5
Error Count Estimates for BANKRUPTCY
Bankrupt Nonbankrupt Total
Rate 0.0000 0.0753 0.0376
Priors 0.5000 0.5000

186
YEAR 3
Observations 90 DF Total 89
Variables 6 DF Within Classes 88
Classes 2 DF Between Classes 1
Class Level Information
BANKRUPTCY Variable Name Frequency Weight Proportion
Prior Probability
Bankrupt Bankrupt 3 3.0000 0.033333 0.500000
Nonbankrupt Nonbankrupt 87 87.0000 0.966667 0.500000
Within Covariance Matrix Information
BANKRUPTCY Covariance
Matrix Rank
Natural Log of the Determinant of the Covariance Matrix
Bankrupt 2 -83.35910
Nonbankrupt 6 -7.25899
Generalized Squared Distance to BANKRUPTCY
From BANKRUPTCY Bankrupt Nonbankrupt
Bankrupt -83.35910 -3.89454
Nonbankrupt 753748767 -7.25899

187
CLASSIFICATION SUMMARY
Number of Observations and Percent Classified into BANKRUPTCY
From BANKRUPTCY Bankrupt Nonbankrupt Total
Bankrupt 3 100.00
0 0.00
3 100.00
Nonbankrupt 0 0.00
87 100.00
87 100.00
Total 3 3.33
87 96.67
90 100.00
Priors 0.5
0.5
Error Count Estimates for BANKRUPTCY
Bankrupt Nonbankrupt Total
Rate 0.0000 0.0000 0.0000
Priors 0.5000 0.5000

188
Results of Quadratic Discriminant Analysis : Top 3 Account and Market logarithmic variables
YEAR 1
Observations 82 DF Total 81
Variables 6 DF Within Classes 80
Classes 2 DF Between Classes 1
Class Level Information
BANKRUPTCY Variable Name Frequency Weight Proportion
Prior Probability
Bankrupt Bankrupt 4 4.0000 0.048780 0.500000
Nonbankrupt Nonbankrupt 78 78.0000 0.951220 0.500000
Within Covariance Matrix Information
BANKRUPTCY Covariance
Matrix Rank
Natural Log of the Determinant of the Covariance Matrix
Bankrupt 3 -50.22638
Nonbankrupt 6 0.90059
Generalized Squared Distance to BANKRUPTCY
From BANKRUPTCY Bankrupt Nonbankrupt
Bankrupt -50.22638 3.51367
Nonbankrupt 153457811 0.90059
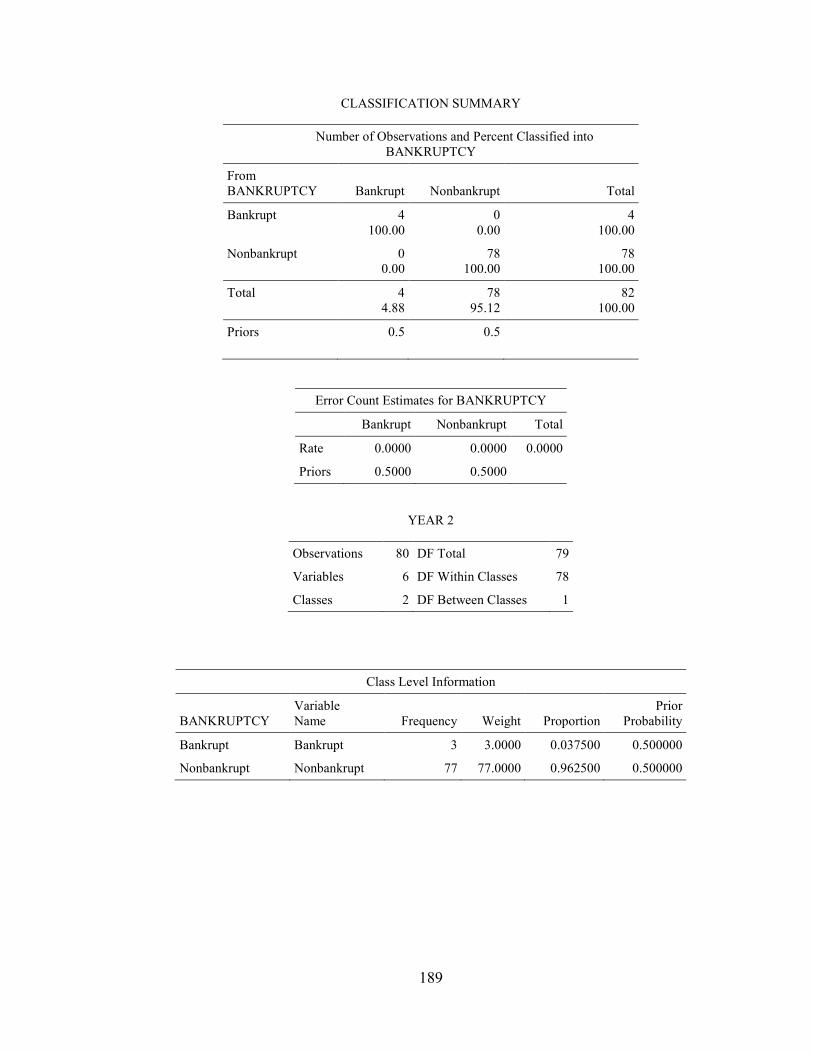
189
CLASSIFICATION SUMMARY
Number of Observations and Percent Classified into BANKRUPTCY
From BANKRUPTCY Bankrupt Nonbankrupt Total
Bankrupt 4 100.00
0 0.00
4 100.00
Nonbankrupt 0 0.00
78 100.00
78 100.00
Total 4 4.88
78 95.12
82 100.00
Priors 0.5
0.5
Error Count Estimates for BANKRUPTCY
Bankrupt Nonbankrupt Total
Rate 0.0000 0.0000 0.0000
Priors 0.5000 0.5000
YEAR 2
Observations 80 DF Total 79
Variables 6 DF Within Classes 78
Classes 2 DF Between Classes 1
Class Level Information
BANKRUPTCY Variable Name Frequency Weight Proportion
Prior Probability
Bankrupt Bankrupt 3 3.0000 0.037500 0.500000
Nonbankrupt Nonbankrupt 77 77.0000 0.962500 0.500000
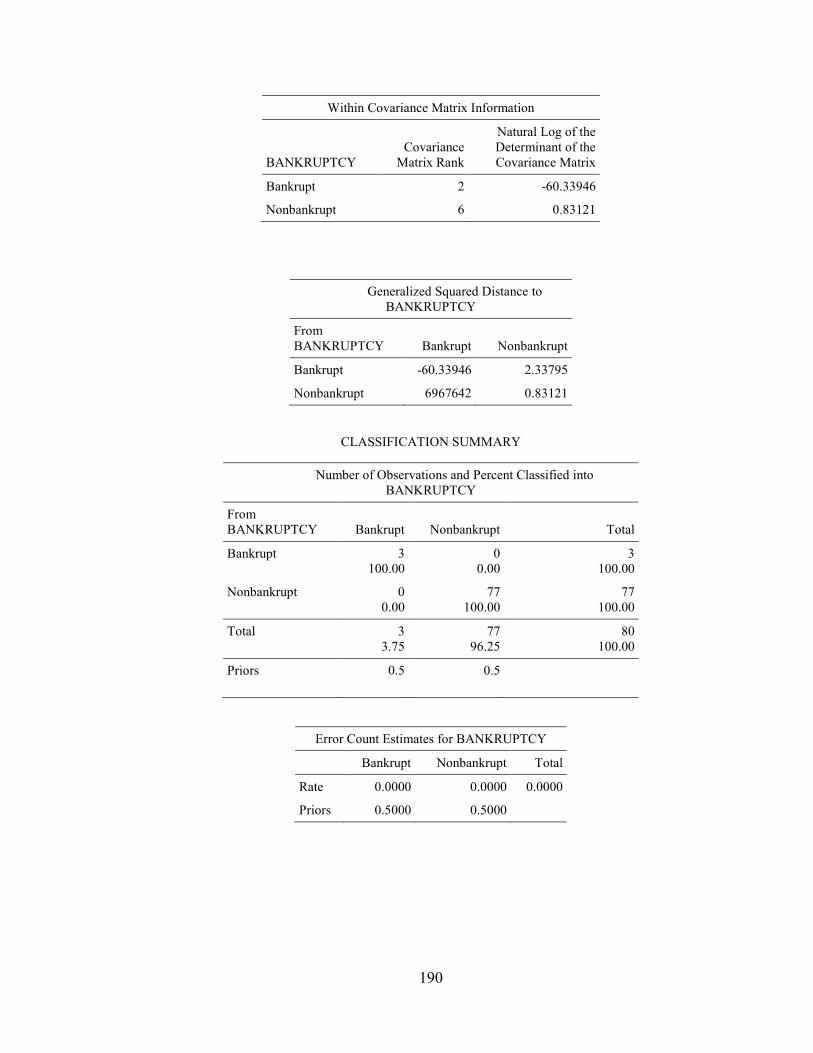
190
Within Covariance Matrix Information
BANKRUPTCY Covariance
Matrix Rank
Natural Log of the Determinant of the Covariance Matrix
Bankrupt 2 -60.33946
Nonbankrupt 6 0.83121
Generalized Squared Distance to BANKRUPTCY
From BANKRUPTCY Bankrupt Nonbankrupt
Bankrupt -60.33946 2.33795
Nonbankrupt 6967642 0.83121
CLASSIFICATION SUMMARY
Number of Observations and Percent Classified into BANKRUPTCY
From BANKRUPTCY Bankrupt Nonbankrupt Total
Bankrupt 3 100.00
0 0.00
3 100.00
Nonbankrupt 0 0.00
77 100.00
77 100.00
Total 3 3.75
77 96.25
80 100.00
Priors 0.5
0.5
Error Count Estimates for BANKRUPTCY
Bankrupt Nonbankrupt Total
Rate 0.0000 0.0000 0.0000
Priors 0.5000 0.5000

191
Results of Quadratic Discriminant Analysis : Variables (Price, Standard deviation, bid ask spread, net income to sales, working capital to total assets and current liabilities to total assets )
YEAR 1
Observations 184 DF Total 183
Variables 6 DF Within Classes 182
Classes 2 DF Between Classes 1
Class Level Information
BANKRUPTCY Variable Name Frequency Weight Proportion
Prior Probability
Bankrupt Bankrupt 85 85.0000 0.461957 0.500000
Nonbankrupt Nonbankrupt 99 99.0000 0.538043 0.500000
Within Covariance Matrix Information
BANKRUPTCY Covariance
Matrix Rank
Natural Log of the Determinant of the Covariance Matrix
Bankrupt 6 0.08497
Nonbankrupt 6 -12.56568
Generalized Squared Distance to BANKRUPTCY
From BANKRUPTCY Bankrupt Nonbankrupt
Bankrupt 0.08497 517.44508
Nonbankrupt 1.46675 -12.56568

192
CLASSIFICATION SUMMARY
Number of Observations and Percent Classified into BANKRUPTCY
From BANKRUPTCY Bankrupt Nonbankrupt Total
Bankrupt 46 54.12
39 45.88
85 100.00
Nonbankrupt 8 8.08
91 91.92
99 100.00
Total 54 29.35
130 70.65
184 100.00
Priors 0.5
0.5
Error Count Estimates for BANKRUPTCY
Bankrupt Nonbankrupt Total
Rate 0.4588 0.0808 0.2698
Priors 0.5000 0.5000
YEAR 2
Observations 201 DF Total 200
Variables 6 DF Within Classes 199
Classes 2 DF Between Classes 1
Class Level Information
BANKRUPTCY Variable Name Frequency Weight Proportion
Prior Probability
Bankrupt Bankrupt 95 95.0000 0.472637 0.500000
Nonbankrupt Nonbankrupt 106 106.0000 0.527363 0.500000

193
Within Covariance Matrix Information
BANKRUPTCY Covariance
Matrix Rank
Natural Log of the Determinant of the Covariance Matrix
Bankrupt 6 3.55063
Nonbankrupt 6 1.58352
Generalized Squared Distance to BANKRUPTCY
From BANKRUPTCY Bankrupt Nonbankrupt
Bankrupt 3.55063 3.52813
Nonbankrupt 4.87329 1.58352
CLASSIFICATION SUMMARY
Number of Observations and Percent Classified into BANKRUPTCY
From BANKRUPTCY Bankrupt Nonbankrupt Total
Bankrupt 33 34.74
62 65.26
95 100.00
Nonbankrupt 11 10.38
95 89.62
106 100.00
Total 44 21.89
157 78.11
201 100.00
Priors 0.5
0.5
Error Count Estimates for BANKRUPTCY
Bankrupt Nonbankrupt Total
Rate 0.6526 0.1038 0.3782
Priors 0.5000 0.5000

194
YEAR 3
Observations 173 DF Total 172
Variables 6 DF Within Classes 171
Classes 2 DF Between Classes 1
Class Level Information
BANKRUPTCY Variable Name Frequency Weight Proportion
Prior Probability
Bankrupt Bankrupt 74 74.0000 0.427746 0.500000
Nonbankrupt Nonbankrupt 99 99.0000 0.572254 0.500000
Within Covariance Matrix Information
BANKRUPTCY Covariance
Matrix Rank
Natural Log of the Determinant of the Covariance Matrix
Bankrupt 6 0.30543
Nonbankrupt 6 -3.09270
Generalized Squared Distance to BANKRUPTCY
From BANKRUPTCY Bankrupt Nonbankrupt
Bankrupt 0.30543 -1.46368
Nonbankrupt 1.21219 -3.09270

195
CLASSIFICATION SUMMARY
Number of Observations and Percent Classified into BANKRUPTCY
From BANKRUPTCY Bankrupt Nonbankrupt Total
Bankrupt 26 35.14
48 64.86
74 100.00
Nonbankrupt 9 9.09
90 90.91
99 100.00
Total 35 20.23
138 79.77
173 100.00
Priors 0.5
0.5
Error Count Estimates for BANKRUPTCY
Bankrupt Nonbankrupt Total
Rate 0.6486 0.0909 0.3698
Priors 0.5000 0.5000
YEAR 4
Observations 90 DF Total 89
Variables 6 DF Within Classes 88
Classes 2 DF Between Classes 1
Class Level Information
BANKRUPTCY Variable Name Frequency Weight Proportion
Prior Probability
Bankrupt Bankrupt 66 66.0000 0.733333 0.500000
Nonbankrupt Nonbankrupt 24 24.0000 0.266667 0.500000

196
Within Covariance Matrix Information
BANKRUPTCY Covariance
Matrix Rank
Natural Log of the Determinant of the Covariance Matrix
Bankrupt 6 7.45623
Nonbankrupt 6 -12.86147
Generalized Squared Distance to BANKRUPTCY
From BANKRUPTCY Bankrupt Nonbankrupt
Bankrupt 7.45623 292901
Nonbankrupt 9.10716 -12.86147
CLASSIFICATION SUMMARY
Number of Observations and Percent Classified into BANKRUPTCY
From BANKRUPTCY Bankrupt Nonbankrupt Total
Bankrupt 29 43.94
37 56.06
66 100.00
Nonbankrupt 0 0.00
24 100.00
24 100.00
Total 29 32.22
61 67.78
90 100.00
Priors 0.5
0.5
Error Count Estimates for BANKRUPTCY
Bankrupt Nonbankrupt Total
Rate 0.5606 0.0000 0.2803
Priors 0.5000 0.5000

197
YEAR 5
Observations 43 DF Total 42
Variables 6 DF Within Classes 41
Classes 2 DF Between Classes 1
Class Level Information
BANKRUPTCY Variable Name Frequency Weight Proportion
Prior Probability
Bankrupt Bankrupt 27 27.0000 0.627907 0.500000
Nonbankrupt Nonbankrupt 16 16.0000 0.372093 0.500000
Within Covariance Matrix Information
BANKRUPTCY Covariance
Matrix Rank
Natural Log of the Determinant of the Covariance Matrix
Bankrupt 6 0.52974
Nonbankrupt 6 -16.60573
Generalized Squared Distance to BANKRUPTCY
From BANKRUPTCY Bankrupt Nonbankrupt
Bankrupt 0.52974 14699
Nonbankrupt 1.71635 -16.60573

198
CLASSIFICATION SUMMARY
Number of Observations and Percent Classified into BANKRUPTCY
From BANKRUPTCY Bankrupt Nonbankrupt Total
Bankrupt 18 66.67
9 33.33
27 100.00
Nonbankrupt 0 0.00
16 100.00
16 100.00
Total 18 41.86
25 58.14
43 100.00
Priors 0.5
0.5
Error Count Estimates for BANKRUPTCY
Bankrupt Nonbankrupt Total
Rate 0.3333 0.0000 0.1667
Priors 0.5000 0.5000

199
Results of Quadratic Discriminant Analysis : Variables (Price, Standard deviation, hi lo bid ask spread, net income to sales, working capital to total assets and current liabilities to total assets )
YEAR 1
Observations 185 DF Total 184
Variables 6 DF Within Classes 183
Classes 2 DF Between Classes 1
Class Level Information
BANKRUPTCY Variable Name Frequency Weight Proportion
Prior Probability
Bankrupt Bankrupt 86 86.0000 0.464865 0.500000
Nonbankrupt Nonbankrupt 99 99.0000 0.535135 0.500000
Within Covariance Matrix Information
BANKRUPTCY Covariance
Matrix Rank
Natural Log of the Determinant of the Covariance Matrix
Bankrupt 6 8.41196
Nonbankrupt 6 -7.22763
Generalized Squared Distance to BANKRUPTCY
From BANKRUPTCY Bankrupt Nonbankrupt
Bankrupt 8.41196 508.07273
Nonbankrupt 9.82853 -7.22763

200
CLASSIFICATION SUMMARY
Number of Observations and Percent Classified into BANKRUPTCY
From BANKRUPTCY Bankrupt Nonbankrupt Total
Bankrupt 39 45.35
47 54.65
86 100.00
Nonbankrupt 7 7.07
92 92.93
99 100.00
Total 46 24.86
139 75.14
185 100.00
Priors 0.5
0.5
Error Count Estimates for BANKRUPTCY
Bankrupt Nonbankrupt Total
Rate 0.5465 0.0707 0.3086
Priors 0.5000 0.5000
YEAR 2
Observations 201 DF Total 200
Variables 6 DF Within Classes 199
Classes 2 DF Between Classes 1
Class Level Information
BANKRUPTCY Variable Name Frequency Weight Proportion
Prior Probability
Bankrupt Bankrupt 95 95.0000 0.472637 0.500000
Nonbankrupt Nonbankrupt 106 106.0000 0.527363 0.500000

201
Within Covariance Matrix Information
BANKRUPTCY Covariance
Matrix Rank
Natural Log of the Determinant of the Covariance Matrix
Bankrupt 6 8.34547
Nonbankrupt 6 6.98046
Generalized Squared Distance to BANKRUPTCY
From BANKRUPTCY Bankrupt Nonbankrupt
Bankrupt 8.34547 8.48245
Nonbankrupt 9.37163 6.98046
CLASSIFICATION SUMMARY
Number of Observations and Percent Classified into BANKRUPTCY
From BANKRUPTCY Bankrupt Nonbankrupt Total
Bankrupt 26 27.37
69 72.63
95 100.00
Nonbankrupt 6 5.66
100 94.34
106 100.00
Total 32 15.92
169 84.08
201 100.00
Priors 0.5
0.5
Error Count Estimates for BANKRUPTCY
Bankrupt Nonbankrupt Total
Rate 0.7263 0.0566 0.3915
Priors 0.5000 0.5000

202
YEAR 3
Observations 174 DF Total 173
Variables 6 DF Within Classes 172
Classes 2 DF Between Classes 1
Class Level Information
BANKRUPTCY Variable Name Frequency Weight Proportion
Prior Probability
Bankrupt Bankrupt 75 75.0000 0.431034 0.500000
Nonbankrupt Nonbankrupt 99 99.0000 0.568966 0.500000
Within Covariance Matrix Information
BANKRUPTCY Covariance
Matrix Rank
Natural Log of the Determinant of the Covariance Matrix
Bankrupt 6 6.58269
Nonbankrupt 6 2.51630
Generalized Squared Distance to BANKRUPTCY
From BANKRUPTCY Bankrupt Nonbankrupt
Bankrupt 6.58269 3.52036
Nonbankrupt 6.94238 2.51630

203
CLASSIFICATION SUMMARY
Number of Observations and Percent Classified into BANKRUPTCY
From BANKRUPTCY Bankrupt Nonbankrupt Total
Bankrupt 21 28.00
54 72.00
75 100.00
Nonbankrupt 7 7.07
92 92.93
99 100.00
Total 28 16.09
146 83.91
174 100.00
Priors 0.5
0.5
Error Count Estimates for BANKRUPTCY
Bankrupt Nonbankrupt Total
Rate 0.7200 0.0707 0.3954
Priors 0.5000 0.5000
YEAR 4
Observations 90 DF Total 89
Variables 6 DF Within Classes 88
Classes 2 DF Between Classes 1
Class Level Information
BANKRUPTCY Variable Name Frequency Weight Proportion
Prior Probability
Bankrupt Bankrupt 66 66.0000 0.733333 0.500000
Nonbankrupt Nonbankrupt 24 24.0000 0.266667 0.500000

204
Within Covariance Matrix Information
BANKRUPTCY Covariance
Matrix Rank
Natural Log of the Determinant of the Covariance Matrix
Bankrupt 6 11.88973
Nonbankrupt 6 -7.10209
Generalized Squared Distance to BANKRUPTCY
From BANKRUPTCY Bankrupt Nonbankrupt
Bankrupt 11.88973 251943
Nonbankrupt 12.70240 -7.10209
CLASSIFICATION SUMMARY
Number of Observations and Percent Classified into BANKRUPTCY
From BANKRUPTCY Bankrupt Nonbankrupt Total
Bankrupt 21 31.82
45 68.18
66 100.00
Nonbankrupt 0 0.00
24 100.00
24 100.00
Total 21 23.33
69 76.67
90 100.00
Priors 0.5
0.5
Error Count Estimates for BANKRUPTCY
Bankrupt Nonbankrupt Total
Rate 0.6818 0.0000 0.3409
Priors 0.5000 0.5000

205
YEAR 5
Observations 45 DF Total 44
Variables 6 DF Within Classes 43
Classes 2 DF Between Classes 1
Class Level Information
BANKRUPTCY Variable Name Frequency Weight Proportion
Prior Probability
Bankrupt Bankrupt 29 29.0000 0.644444 0.500000
Nonbankrupt Nonbankrupt 16 16.0000 0.355556 0.500000
Within Covariance Matrix Information
BANKRUPTCY Covariance
Matrix Rank
Natural Log of the Determinant of the Covariance Matrix
Bankrupt 6 4.66785
Nonbankrupt 6 -10.97919
Generalized Squared Distance to BANKRUPTCY
From BANKRUPTCY Bankrupt Nonbankrupt
Bankrupt 4.66785 13174
Nonbankrupt 5.37322 -10.97919

206
CLASSIFICATION SUMMARY
Number of Observations and Percent Classified into BANKRUPTCY
From BANKRUPTCY Bankrupt Nonbankrupt Total
Bankrupt 12 41.38
17 58.62
29 100.00
Nonbankrupt 0 0.00
16 100.00
16 100.00
Total 12 26.67
33 73.33
45 100.00
Priors 0.5
0.5
Error Count Estimates for BANKRUPTCY
Bankrupt Nonbankrupt Total
Rate 0.5862 0.0000 0.2931
Priors 0.5000 0.5000

207
Table 9
Results of Non-parametric Discriminant Analysis : Accounting variables
YEAR 1
Observations 101 DF Total 100
Variables 17 DF Within Classes 99
Classes 2 DF Between Classes 1
Class Level Information
BANKRUPTCY Variable Name Frequency Weight Proportion
Prior Probability
Bankrupt Bankrupt 6 6.0000 0.059406 0.500000
Nonbankrupt Nonbankrupt 95 95.0000 0.940594 0.500000
CLASSIFICATION SUMMARY
Number of Observations and Percent Classified into BANKRUPTCY
From BANKRUPTCY Bankrupt Nonbankrupt Total
Bankrupt 6 100.00
0 0.00
6 100.00
Nonbankrupt 4 4.21
91 95.79
95 100.00
Total 10 9.90
91 90.10
101 100.00
Priors 0.5
0.5
Error Count Estimates for BANKRUPTCY
Bankrupt Nonbankrupt Total
Rate 0.0000 0.0421 0.0211
Priors 0.5000 0.5000

208
YEAR 2
Observations 99 DF Total 98
Variables 17 DF Within Classes 97
Classes 2 DF Between Classes 1
Class Level Information
BANKRUPTCY Variable Name Frequency Weight Proportion
Prior Probability
Bankrupt Bankrupt 6 6.0000 0.060606 0.500000
Nonbankrupt Nonbankrupt 93 93.0000 0.939394 0.500000
CLASSIFICATION SUMMARY
Number of Observations and Percent Classified into BANKRUPTCY
From BANKRUPTCY Bankrupt Nonbankrupt Total
Bankrupt 6 100.00
0 0.00
6 100.00
Nonbankrupt 12 12.90
81 87.10
93 100.00
Total 18 18.18
81 81.82
99 100.00
Priors 0.5
0.5
Error Count Estimates for BANKRUPTCY
Bankrupt Nonbankrupt Total
Rate 0.0000 0.1290 0.0645
Priors 0.5000 0.5000
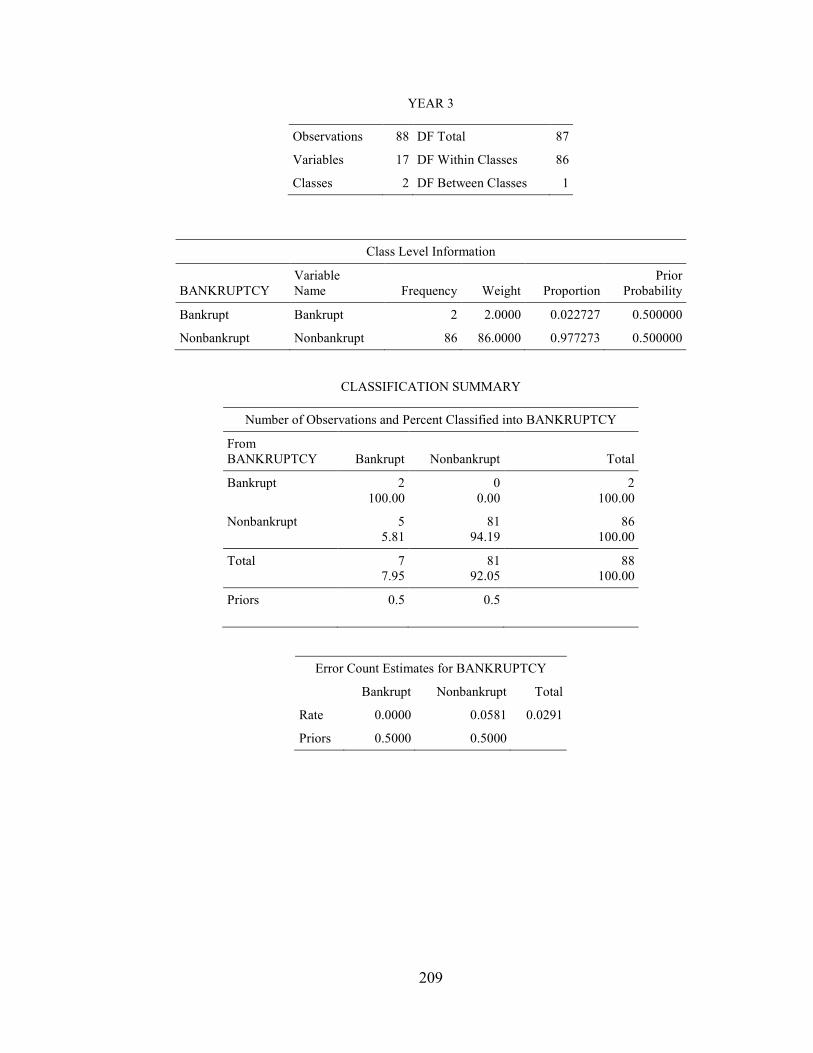
209
YEAR 3
Observations 88 DF Total 87
Variables 17 DF Within Classes 86
Classes 2 DF Between Classes 1
Class Level Information
BANKRUPTCY Variable Name Frequency Weight Proportion
Prior Probability
Bankrupt Bankrupt 2 2.0000 0.022727 0.500000
Nonbankrupt Nonbankrupt 86 86.0000 0.977273 0.500000
CLASSIFICATION SUMMARY
Number of Observations and Percent Classified into BANKRUPTCY
From BANKRUPTCY Bankrupt Nonbankrupt Total
Bankrupt 2 100.00
0 0.00
2 100.00
Nonbankrupt 5 5.81
81 94.19
86 100.00
Total 7 7.95
81 92.05
88 100.00
Priors 0.5
0.5
Error Count Estimates for BANKRUPTCY
Bankrupt Nonbankrupt Total
Rate 0.0000 0.0581 0.0291
Priors 0.5000 0.5000
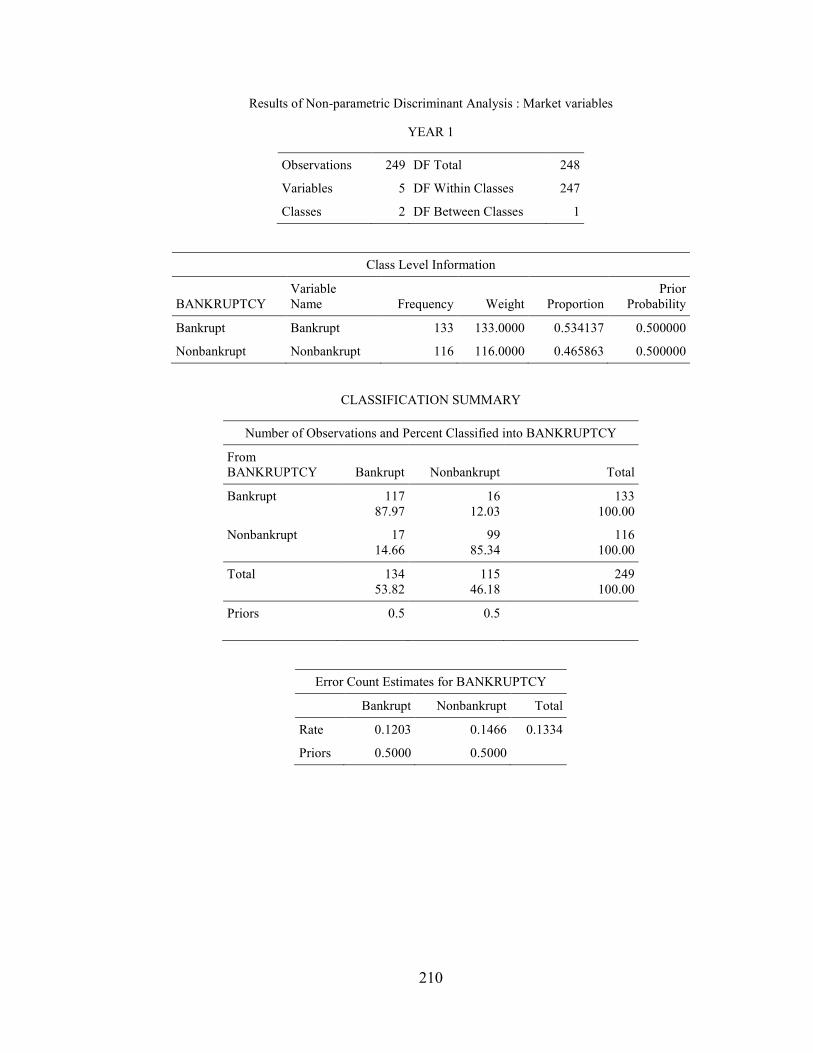
210
Results of Non-parametric Discriminant Analysis : Market variables
YEAR 1
Observations 249 DF Total 248
Variables 5 DF Within Classes 247
Classes 2 DF Between Classes 1
Class Level Information
BANKRUPTCY Variable Name Frequency Weight Proportion
Prior Probability
Bankrupt Bankrupt 133 133.0000 0.534137 0.500000
Nonbankrupt Nonbankrupt 116 116.0000 0.465863 0.500000
CLASSIFICATION SUMMARY
Number of Observations and Percent Classified into BANKRUPTCY
From BANKRUPTCY Bankrupt Nonbankrupt Total
Bankrupt 117 87.97
16 12.03
133 100.00
Nonbankrupt 17 14.66
99 85.34
116 100.00
Total 134 53.82
115 46.18
249 100.00
Priors 0.5
0.5
Error Count Estimates for BANKRUPTCY
Bankrupt Nonbankrupt Total
Rate 0.1203 0.1466 0.1334
Priors 0.5000 0.5000

211
YEAR 2
Observations 240 DF Total 239
Variables 5 DF Within Classes 238
Classes 2 DF Between Classes 1
Class Level Information
BANKRUPTCY Variable Name Frequency Weight Proportion
Prior Probability
Bankrupt Bankrupt 128 128.0000 0.533333 0.500000
Nonbankrupt Nonbankrupt 112 112.0000 0.466667 0.500000
CLASSIFICATION SUMMARY
Number of Observations and Percent Classified into BANKRUPTCY
From BANKRUPTCY Bankrupt Nonbankrupt Total
Bankrupt 108 84.38
20 15.63
128 100.00
Nonbankrupt 17 15.18
95 84.82
112 100.00
Total 125 52.08
115 47.92
240 100.00
Priors 0.5
0.5
Error Count Estimates for BANKRUPTCY
Bankrupt Nonbankrupt Total
Rate 0.1563 0.1518 0.1540
Priors 0.5000 0.5000

212
YEAR 3
Observations 218 DF Total 217
Variables 5 DF Within Classes 216
Classes 2 DF Between Classes 1
Class Level Information
BANKRUPTCY Variable Name Frequency Weight Proportion
Prior Probability
Bankrupt Bankrupt 107 107.0000 0.490826 0.500000
Nonbankrupt Nonbankrupt 111 111.0000 0.509174 0.500000
CLASSIFICATION SUMMARY
Number of Observations and Percent Classified into BANKRUPTCY
From BANKRUPTCY Bankrupt Nonbankrupt Total
Bankrupt 88 82.24
19 17.76
107 100.00
Nonbankrupt 23 20.72
88 79.28
111 100.00
Total 111 50.92
107 49.08
218 100.00
Priors 0.5
0.5
Error Count Estimates for BANKRUPTCY
Bankrupt Nonbankrupt Total
Rate 0.1776 0.2072 0.1924
Priors 0.5000 0.5000

213
YEAR 4
Observations 194 DF Total 193
Variables 5 DF Within Classes 192
Classes 2 DF Between Classes 1
Class Level Information
BANKRUPTCY Variable Name Frequency Weight Proportion
Prior Probability
Bankrupt Bankrupt 84 84.0000 0.432990 0.500000
Nonbankrupt Nonbankrupt 110 110.0000 0.567010 0.500000
CLASSIFICATION SUMMARY
Number of Observations and Percent Classified into BANKRUPTCY
From BANKRUPTCY Bankrupt Nonbankrupt Total
Bankrupt 70 83.33
14 16.67
84 100.00
Nonbankrupt 14 12.73
96 87.27
110 100.00
Total 84 43.30
110 56.70
194 100.00
Priors 0.5
0.5
Error Count Estimates for BANKRUPTCY
Bankrupt Nonbankrupt Total
Rate 0.1667 0.1273 0.1470
Priors 0.5000 0.5000

214
YEAR 5
Observations 161 DF Total 160
Variables 5 DF Within Classes 159
Classes 2 DF Between Classes 1
Class Level Information
BANKRUPTCY Variable Name Frequency Weight Proportion
Prior Probability
Bankrupt Bankrupt 64 64.0000 0.397516 0.500000
Nonbankrupt Nonbankrupt 97 97.0000 0.602484 0.500000
CLASSIFICATION SUMMARY
Number of Observations and Percent Classified into BANKRUPTCY
From BANKRUPTCY Bankrupt Nonbankrupt Total
Bankrupt 48 75.00
16 25.00
64 100.00
Nonbankrupt 3 3.09
94 96.91
97 100.00
Total 51 31.68
110 68.32
161 100.00
Priors 0.5
0.5
Error Count Estimates for BANKRUPTCY
Bankrupt Nonbankrupt Total
Rate 0.2500 0.0309 0.1405
Priors 0.5000 0.5000

215
Results of Non-parametric Discriminant Analysis : Market variables without spread and hi lo bid ask spread
YEAR 1
Observations 249 DF Total 248
Variables 4 DF Within Classes 247
Classes 2 DF Between Classes 1
Class Level Information
BANKRUPTCY Variable Name Frequency Weight Proportion
Prior Probability
Bankrupt Bankrupt 133 133.0000 0.534137 0.500000
Nonbankrupt Nonbankrupt 116 116.0000 0.465863 0.500000
CLASSIFICATION SUMMARY
Number of Observations and Percent Classified into BANKRUPTCY
From BANKRUPTCY Bankrupt Nonbankrupt Total
Bankrupt 114 85.71
19 14.29
133 100.00
Nonbankrupt 20 17.24
96 82.76
116 100.00
Total 134 53.82
115 46.18
249 100.00
Priors 0.5
0.5
Error Count Estimates for BANKRUPTCY
Bankrupt Nonbankrupt Total
Rate 0.1429 0.1724 0.1576
Priors 0.5000 0.5000

216
YEAR 2
Observations 240 DF Total 239
Variables 4 DF Within Classes 238
Classes 2 DF Between Classes 1
Class Level Information
BANKRUPTCY Variable Name Frequency Weight Proportion
Prior Probability
Bankrupt Bankrupt 128 128.0000 0.533333 0.500000
Nonbankrupt Nonbankrupt 112 112.0000 0.466667 0.500000
CLASSIFICATION SUMMARY
Number of Observations and Percent Classified into BANKRUPTCY
From BANKRUPTCY Bankrupt Nonbankrupt Total
Bankrupt 108 84.38
20 15.63
128 100.00
Nonbankrupt 17 15.18
95 84.82
112 100.00
Total 125 52.08
115 47.92
240 100.00
Priors 0.5
0.5
Error Count Estimates for BANKRUPTCY
Bankrupt Nonbankrupt Total
Rate 0.1563 0.1518 0.1540
Priors 0.5000 0.5000

217
YEAR 3
Observations 218 DF Total 217
Variables 4 DF Within Classes 216
Classes 2 DF Between Classes 1
Class Level Information
BANKRUPTCY Variable Name Frequency Weight Proportion
Prior Probability
Bankrupt Bankrupt 107 107.0000 0.490826 0.500000
Nonbankrupt Nonbankrupt 111 111.0000 0.509174 0.500000
CLASSIFICATION SUMMARY
Number of Observations and Percent Classified into BANKRUPTCY
From BANKRUPTCY Bankrupt Nonbankrupt Total
Bankrupt 85 79.44
22 20.56
107 100.00
Nonbankrupt 16 14.41
95 85.59
111 100.00
Total 101 46.33
117 53.67
218 100.00
Priors 0.5
0.5
Error Count Estimates for BANKRUPTCY
Bankrupt Nonbankrupt Total
Rate 0.2056 0.1441 0.1749
Priors 0.5000 0.5000

218
YEAR 4
Observations 194 DF Total 193
Variables 4 DF Within Classes 192
Classes 2 DF Between Classes 1
Class Level Information
BANKRUPTCY Variable Name Frequency Weight Proportion
Prior Probability
Bankrupt Bankrupt 84 84.0000 0.432990 0.500000
Nonbankrupt Nonbankrupt 110 110.0000 0.567010 0.500000
CLASSIFICATION SUMMARY
Number of Observations and Percent Classified into BANKRUPTCY
From BANKRUPTCY Bankrupt Nonbankrupt Total
Bankrupt 70 83.33
14 16.67
84 100.00
Nonbankrupt 14 12.73
96 87.27
110 100.00
Total 84 43.30
110 56.70
194 100.00
Priors 0.5
0.5
Error Count Estimates for BANKRUPTCY
Bankrupt Nonbankrupt Total
Rate 0.1667 0.1273 0.1470
Priors 0.5000 0.5000

219
YEAR 5
Observations 161 DF Total 160
Variables 4 DF Within Classes 159
Classes 2 DF Between Classes 1
Class Level Information
BANKRUPTCY Variable Name Frequency Weight Proportion
Prior Probability
Bankrupt Bankrupt 64 64.0000 0.397516 0.500000
Nonbankrupt Nonbankrupt 97 97.0000 0.602484 0.500000
CLASSIFICATION SUMMARY
Number of Observations and Percent Classified into BANKRUPTCY
From BANKRUPTCY Bankrupt Nonbankrupt Total
Bankrupt 46 71.88
18 28.13
64 100.00
Nonbankrupt 6 6.19
91 93.81
97 100.00
Total 52 32.30
109 67.70
161 100.00
Priors 0.5
0.5
Error Count Estimates for BANKRUPTCY
Bankrupt Nonbankrupt Total
Rate 0.2813 0.0619 0.1716
Priors 0.5000 0.5000

220
Results of Non-parametric Discriminant Analysis : Market variables without spread and bid ask spread
YEAR 1
Observations 252 DF Total 251
Variables 4 DF Within Classes 250
Classes 2 DF Between Classes 1
Class Level Information
BANKRUPTCY Variable Name Frequency Weight Proportion
Prior Probability
Bankrupt Bankrupt 136 136.0000 0.539683 0.500000
Nonbankrupt Nonbankrupt 116 116.0000 0.460317 0.500000
CLASSIFICATION SUMMARY
Number of Observations and Percent Classified into BANKRUPTCY
From BANKRUPTCY Bankrupt Nonbankrupt Total
Bankrupt 117 86.03
19 13.97
136 100.00
Nonbankrupt 24 20.69
92 79.31
116 100.00
Total 141 55.95
111 44.05
252 100.00
Priors 0.5
0.5
Error Count Estimates for BANKRUPTCY
Bankrupt Nonbankrupt Total
Rate 0.1397 0.2069 0.1733
Priors 0.5000 0.5000

221
YEAR 2
Observations 241 DF Total 240
Variables 4 DF Within Classes 239
Classes 2 DF Between Classes 1
Class Level Information
BANKRUPTCY Variable Name Frequency Weight Proportion
Prior Probability
Bankrupt Bankrupt 129 129.0000 0.535270 0.500000
Nonbankrupt Nonbankrupt 112 112.0000 0.464730 0.500000
CLASSIFICATION SUMMARY
Number of Observations and Percent Classified into BANKRUPTCY
From BANKRUPTCY Bankrupt Nonbankrupt Total
Bankrupt 106 82.17
23 17.83
129 100.00
Nonbankrupt 40 35.71
72 64.29
112 100.00
Total 146 60.58
95 39.42
241 100.00
Priors 0.5
0.5
Error Count Estimates for BANKRUPTCY
Bankrupt Nonbankrupt Total
Rate 0.1783 0.3571 0.2677
Priors 0.5000 0.5000

222
YEAR 3
Observations 219 DF Total 218
Variables 4 DF Within Classes 217
Classes 2 DF Between Classes 1
Class Level Information
BANKRUPTCY Variable Name Frequency Weight Proportion
Prior Probability
Bankrupt Bankrupt 108 108.0000 0.493151 0.500000
Nonbankrupt Nonbankrupt 111 111.0000 0.506849 0.500000
CLASSIFICATION SUMMARY
Number of Observations and Percent Classified into BANKRUPTCY
From BANKRUPTCY Bankrupt Nonbankrupt Total
Bankrupt 87 80.56
21 19.44
108 100.00
Nonbankrupt 26 23.42
85 76.58
111 100.00
Total 113 51.60
106 48.40
219 100.00
Priors 0.5
0.5
Error Count Estimates for BANKRUPTCY
Bankrupt Nonbankrupt Total
Rate 0.1944 0.2342 0.2143
Priors 0.5000 0.5000

223
YEAR 4
Observations 195 DF Total 194
Variables 4 DF Within Classes 193
Classes 2 DF Between Classes 1
Class Level Information
BANKRUPTCY Variable Name Frequency Weight Proportion
Prior Probability
Bankrupt Bankrupt 85 85.0000 0.435897 0.500000
Nonbankrupt Nonbankrupt 110 110.0000 0.564103 0.500000
CLASSIFICATION SUMMARY
Number of Observations and Percent Classified into BANKRUPTCY
From BANKRUPTCY Bankrupt Nonbankrupt Total
Bankrupt 66 77.65
19 22.35
85 100.00
Nonbankrupt 21 19.09
89 80.91
110 100.00
Total 87 44.62
108 55.38
195 100.00
Priors 0.5
0.5
Error Count Estimates for BANKRUPTCY
Bankrupt Nonbankrupt Total
Rate 0.2235 0.1909 0.2072
Priors 0.5000 0.5000

224
YEAR 5
Observations 168 DF Total 167
Variables 4 DF Within Classes 166
Classes 2 DF Between Classes 1
Class Level Information
BANKRUPTCY Variable Name Frequency Weight Proportion
Prior Probability
Bankrupt Bankrupt 70 70.0000 0.416667 0.500000
Nonbankrupt Nonbankrupt 98 98.0000 0.583333 0.500000
CLASSIFICATION SUMMARY
Number of Observations and Percent Classified into BANKRUPTCY
From BANKRUPTCY Bankrupt Nonbankrupt Total
Bankrupt 47 67.14
23 32.86
70 100.00
Nonbankrupt 11 11.22
87 88.78
98 100.00
Total 58 34.52
110 65.48
168 100.00
Priors 0.5
0.5
Error Count Estimates for BANKRUPTCY
Bankrupt Nonbankrupt Total
Rate 0.3286 0.1122 0.2204
Priors 0.5000 0.5000

225
Results of Non-parametric Discriminant Analysis : Market variables without bid ask spread and hi lo bid ask spread
YEAR 1
Observations 13 DF Total 12
Variables 4 DF Within Classes 11
Classes 2 DF Between Classes 1
Class Level Information
BANKRUPTCY Variable Name Frequency Weight Proportion
Prior Probability
Bankrupt Bankrupt 10 10.0000 0.769231 0.500000
Nonbankrupt Nonbankrupt 3 3.0000 0.230769 0.500000
CLASSIFICATION SUMMARY
Number of Observations and Percent Classified into BANKRUPTCY
From BANKRUPTCY Bankrupt Nonbankrupt Total
Bankrupt 8 80.00
2 20.00
10 100.00
Nonbankrupt 0 0.00
3 100.00
3 100.00
Total 8 61.54
5 38.46
13 100.00
Priors 0.5
0.5
Error Count Estimates for BANKRUPTCY
Bankrupt Nonbankrupt Total
Rate 0.2000 0.0000 0.1000
Priors 0.5000 0.5000

226
YEAR 2
Observations 12 DF Total 11
Variables 4 DF Within Classes 10
Classes 2 DF Between Classes 1
Class Level Information
BANKRUPTCY Variable Name Frequency Weight Proportion
Prior Probability
Bankrupt Bankrupt 6 6.0000 0.500000 0.500000
Nonbankrupt Nonbankrupt 6 6.0000 0.500000 0.500000
CLASSIFICATION SUMMARY
Number of Observations and Percent Classified into BANKRUPTCY
From BANKRUPTCY Bankrupt Nonbankrupt Total
Bankrupt 6 100.00
0 0.00
6 100.00
Nonbankrupt 1 16.67
5 83.33
6 100.00
Total 7 58.33
5 41.67
12 100.00
Priors 0.5
0.5
Error Count Estimates for BANKRUPTCY
Bankrupt Nonbankrupt Total
Rate 0.0000 0.1667 0.0833
Priors 0.5000 0.5000

227
YEAR 3
Observations 10 DF Total 9
Variables 4 DF Within Classes 8
Classes 2 DF Between Classes 1
Class Level Information
BANKRUPTCY Variable Name Frequency Weight Proportion
Prior Probability
Bankrupt Bankrupt 7 7.0000 0.700000 0.500000
Nonbankrupt Nonbankrupt 3 3.0000 0.300000 0.500000
CLASSIFICATION SUMMARY
Number of Observations and Percent Classified into BANKRUPTCY
From BANKRUPTCY Bankrupt Nonbankrupt Total
Bankrupt 6 85.71
1 14.29
7 100.00
Nonbankrupt 0 0.00
3 100.00
3 100.00
Total 6 60.00
4 40.00
10 100.00
Priors 0.5
0.5
Error Count Estimates for BANKRUPTCY
Bankrupt Nonbankrupt Total
Rate 0.1429 0.0000 0.0714
Priors 0.5000 0.5000

228
YEAR 4
Observations 8 DF Total 7
Variables 4 DF Within Classes 6
Classes 2 DF Between Classes 1
Class Level Information
BANKRUPTCY Variable Name Frequency Weight Proportion
Prior Probability
Bankrupt Bankrupt 7 7.0000 0.875000 0.500000
Nonbankrupt Nonbankrupt 1 1.0000 0.125000 0.500000
CLASSIFICATION SUMMARY
Number of Observations and Percent Classified into BANKRUPTCY
From BANKRUPTCY Bankrupt Nonbankrupt Total
Bankrupt 7 100.00
0 0.00
7 100.00
Nonbankrupt 0 0.00
1 100.00
1 100.00
Total 7 87.50
1 12.50
8 100.00
Priors 0.5
0.5
Error Count Estimates for BANKRUPTCY
Bankrupt Nonbankrupt Total
Rate 0.0000 0.0000 0.0000
Priors 0.5000 0.5000

229
YEAR 5
Observations 12 DF Total 11
Variables 4 DF Within Classes 10
Classes 2 DF Between Classes 1
Class Level Information
BANKRUPTCY Variable Name Frequency Weight Proportion
Prior Probability
Bankrupt Bankrupt 9 9.0000 0.750000 0.500000
Nonbankrupt Nonbankrupt 3 3.0000 0.250000 0.500000
CLASSIFICATION SUMMARY
Number of Observations and Percent Classified into BANKRUPTCY
From BANKRUPTCY Bankrupt Nonbankrupt Total
Bankrupt 3 33.33
6 66.67
9 100.00
Nonbankrupt 0 0.00
3 100.00
3 100.00
Total 3 25.00
9 75.00
12 100.00
Priors 0.5
0.5
Error Count Estimates for BANKRUPTCY
Bankrupt Nonbankrupt Total
Rate 0.6667 0.0000 0.3333
Priors 0.5000 0.5000

230
Results of Non-parametric Discriminant Analysis : Top 3 Account and Market variables
YEAR 1
Observations 104 DF Total 103
Variables 6 DF Within Classes 102
Classes 2 DF Between Classes 1
Class Level Information
BANKRUPTCY Variable Name Frequency Weight Proportion
Prior Probability
Bankrupt Bankrupt 7 7.0000 0.067308 0.500000
Nonbankrupt Nonbankrupt 97 97.0000 0.932692 0.500000
CLASSIFICATION SUMMARY
Number of Observations and Percent Classified into BANKRUPTCY
From BANKRUPTCY Bankrupt Nonbankrupt Total
Bankrupt 7 100.00
0 0.00
7 100.00
Nonbankrupt 10 10.31
87 89.69
97 100.00
Total 17 16.35
87 83.65
104 100.00
Priors 0.5
0.5
Error Count Estimates for BANKRUPTCY
Bankrupt Nonbankrupt Total
Rate 0.0000 0.1031 0.0515
Priors 0.5000 0.5000

231
YEAR 2
Observations 100 DF Total 99
Variables 6 DF Within Classes 98
Classes 2 DF Between Classes 1
Class Level Information
BANKRUPTCY Variable Name Frequency Weight Proportion
Prior Probability
Bankrupt Bankrupt 7 7.0000 0.070000 0.500000
Nonbankrupt Nonbankrupt 93 93.0000 0.930000 0.500000
CLASSIFICATION SUMMARY
Number of Observations and Percent Classified into BANKRUPTCY
From BANKRUPTCY Bankrupt Nonbankrupt Total
Bankrupt 7 100.00
0 0.00
7 100.00
Nonbankrupt 8 8.60
85 91.40
93 100.00
Total 15 15.00
85 85.00
100 100.00
Priors 0.5
0.5
Error Count Estimates for BANKRUPTCY
Bankrupt Nonbankrupt Total
Rate 0.0000 0.0860 0.0430
Priors 0.5000 0.5000

232
YEAR 3
Observations 90 DF Total 89
Variables 6 DF Within Classes 88
Classes 2 DF Between Classes 1
Class Level Information
BANKRUPTCY Variable Name Frequency Weight Proportion
Prior Probability
Bankrupt Bankrupt 3 3.0000 0.033333 0.500000
Nonbankrupt Nonbankrupt 87 87.0000 0.966667 0.500000
CLASSIFICATION SUMMARY
Number of Observations and Percent Classified into BANKRUPTCY
From BANKRUPTCY Bankrupt Nonbankrupt Total
Bankrupt 3 100.00
0 0.00
3 100.00
Nonbankrupt 8 9.20
79 90.80
87 100.00
Total 11 12.22
79 87.78
90 100.00
Priors 0.5
0.5
Error Count Estimates for BANKRUPTCY
Bankrupt Nonbankrupt Total
Rate 0.0000 0.0920 0.0460
Priors 0.5000 0.5000

233
Results of Non-parametric Discriminant Analysis : Top 3 Account and Market logarithmic variables
YEAR 1
Observations 82 DF Total 81
Variables 6 DF Within Classes 80
Classes 2 DF Between Classes 1
Class Level Information
BANKRUPTCY Variable Name Frequency Weight Proportion
Prior Probability
Bankrupt Bankrupt 4 4.0000 0.048780 0.500000
Nonbankrupt Nonbankrupt 78 78.0000 0.951220 0.500000
CLASSIFICATION SUMMARY
Number of Observations and Percent Classified into BANKRUPTCY
From BANKRUPTCY Bankrupt Nonbankrupt Total
Bankrupt 4 100.00
0 0.00
4 100.00
Nonbankrupt 6 7.69
72 92.31
78 100.00
Total 10 12.20
72 87.80
82 100.00
Priors 0.5
0.5
Error Count Estimates for BANKRUPTCY
Bankrupt Nonbankrupt Total
Rate 0.0000 0.0769 0.0385
Priors 0.5000 0.5000

234
YEAR 2
Observations 80 DF Total 79
Variables 6 DF Within Classes 78
Classes 2 DF Between Classes 1
Class Level Information
BANKRUPTCY Variable Name Frequency Weight Proportion
Prior Probability
Bankrupt Bankrupt 3 3.0000 0.037500 0.500000
Nonbankrupt Nonbankrupt 77 77.0000 0.962500 0.500000
CLASSIFICATION SUMMARY
Number of Observations and Percent Classified into BANKRUPTCY
From BANKRUPTCY Bankrupt Nonbankrupt Total
Bankrupt 3 100.00
0 0.00
3 100.00
Nonbankrupt 5 6.49
72 93.51
77 100.00
Total 8 10.00
72 90.00
80 100.00
Priors 0.5
0.5
Error Count Estimates for BANKRUPTCY
Bankrupt Nonbankrupt Total
Rate 0.0000 0.0649 0.0325
Priors 0.5000 0.5000

235
YEAR 3
Observations 75 DF Total 74
Variables 6 DF Within Classes 73
Classes 2 DF Between Classes 1
Class Level Information
BANKRUPTCY Variable Name Frequency Weight Proportion
Prior Probability
Bankrupt Bankrupt 1 1.0000 0.013333 0.500000
Nonbankrupt Nonbankrupt 74 74.0000 0.986667 0.500000
CLASSIFICATION SUMMARY
Number of Observations and Percent Classified into BANKRUPTCY
From BANKRUPTCY Bankrupt Nonbankrupt Total
Bankrupt 1 100.00
0 0.00
1 100.00
Nonbankrupt 4 5.41
70 94.59
74 100.00
Total 5 6.67
70 93.33
75 100.00
Priors 0.5
0.5
Error Count Estimates for BANKRUPTCY
Bankrupt Nonbankrupt Total
Rate 0.0000 0.0541 0.0270
Priors 0.5000 0.5000

236
Results of Non-parametric Discriminant Analysis : Variables (Price, Standard deviation, bid ask spread, net income to sales, working capital to total assets and current liabilities to total assets )
YEAR 1
Observations 184 DF Total 183
Variables 6 DF Within Classes 182
Classes 2 DF Between Classes 1
Class Level Information
BANKRUPTCY Variable Name Frequency Weight Proportion
Prior Probability
Bankrupt Bankrupt 85 85.0000 0.461957 0.500000
Nonbankrupt Nonbankrupt 99 99.0000 0.538043 0.500000
CLASSIFICATION SUMMARY
Number of Observations and Percent Classified into BANKRUPTCY
From BANKRUPTCY Bankrupt Nonbankrupt Total
Bankrupt 68 80.00
17 20.00
85 100.00
Nonbankrupt 10 10.10
89 89.90
99 100.00
Total 78 42.39
106 57.61
184 100.00
Priors 0.5
0.5
Error Count Estimates for BANKRUPTCY
Bankrupt Nonbankrupt Total
Rate 0.2000 0.1010 0.1505
Priors 0.5000 0.5000

237
YEAR 2
Observations 201 DF Total 200
Variables 6 DF Within Classes 199
Classes 2 DF Between Classes 1
Class Level Information
BANKRUPTCY Variable Name Frequency Weight Proportion
Prior Probability
Bankrupt Bankrupt 95 95.0000 0.472637 0.500000
Nonbankrupt Nonbankrupt 106 106.0000 0.527363 0.500000
CLASSIFICATION SUMMARY
Number of Observations and Percent Classified into BANKRUPTCY
From BANKRUPTCY Bankrupt Nonbankrupt Total
Bankrupt 82 86.32
13 13.68
95 100.00
Nonbankrupt 18 16.98
88 83.02
106 100.00
Total 100 49.75
101 50.25
201 100.00
Priors 0.5
0.5
Error Count Estimates for BANKRUPTCY
Bankrupt Nonbankrupt Total
Rate 0.1368 0.1698 0.1533
Priors 0.5000 0.5000

238
YEAR 3
Observations 173 DF Total 172
Variables 6 DF Within Classes 171
Classes 2 DF Between Classes 1
Class Level Information
BANKRUPTCY Variable Name Frequency Weight Proportion
Prior Probability
Bankrupt Bankrupt 74 74.0000 0.427746 0.500000
Nonbankrupt Nonbankrupt 99 99.0000 0.572254 0.500000
CLASSIFICATION SUMMARY
Number of Observations and Percent Classified into BANKRUPTCY
From BANKRUPTCY Bankrupt Nonbankrupt Total
Bankrupt 55 74.32
19 25.68
74 100.00
Nonbankrupt 9 9.09
90 90.91
99 100.00
Total 64 36.99
109 63.01
173 100.00
Priors 0.5
0.5
Error Count Estimates for BANKRUPTCY
Bankrupt Nonbankrupt Total
Rate 0.2568 0.0909 0.1738
Priors 0.5000 0.5000

239
YEAR 4
Observations 90 DF Total 89
Variables 6 DF Within Classes 88
Classes 2 DF Between Classes 1
Class Level Information
BANKRUPTCY Variable Name Frequency Weight Proportion
Prior Probability
Bankrupt Bankrupt 66 66.0000 0.733333 0.500000
Nonbankrupt Nonbankrupt 24 24.0000 0.266667 0.500000
CLASSIFICATION SUMMARY
Number of Observations and Percent Classified into BANKRUPTCY
From BANKRUPTCY Bankrupt Nonbankrupt Total
Bankrupt 42 63.64
24 36.36
66 100.00
Nonbankrupt 0 0.00
24 100.00
24 100.00
Total 42 46.67
48 53.33
90 100.00
Priors 0.5
0.5
Error Count Estimates for BANKRUPTCY
Bankrupt Nonbankrupt Total
Rate 0.3636 0.0000 0.1818
Priors 0.5000 0.5000

240
YEAR 5
Observations 43 DF Total 42
Variables 6 DF Within Classes 41
Classes 2 DF Between Classes 1
Class Level Information
BANKRUPTCY Variable Name Frequency Weight Proportion
Prior Probability
Bankrupt Bankrupt 27 27.0000 0.627907 0.500000
Nonbankrupt Nonbankrupt 16 16.0000 0.372093 0.500000
CLASSIFICATION SUMMARY
Number of Observations and Percent Classified into BANKRUPTCY
From BANKRUPTCY Bankrupt Nonbankrupt Total
Bankrupt 24 88.89
3 11.11
27 100.00
Nonbankrupt 4 25.00
12 75.00
16 100.00
Total 28 65.12
15 34.88
43 100.00
Priors 0.5
0.5
Error Count Estimates for BANKRUPTCY
Bankrupt Nonbankrupt Total
Rate 0.1111 0.2500 0.1806
Priors 0.5000 0.5000

241
Results of Non-parametric Discriminant Analysis : Variables (Price, Standard deviation, hi lo bid ask spread, net income to sales, working capital to total assets and current liabilities to total assets )
YEAR 1
Observations 185 DF Total 184
Variables 6 DF Within Classes 183
Classes 2 DF Between Classes 1
Class Level Information
BANKRUPTCY Variable Name Frequency Weight Proportion
Prior Probability
Bankrupt Bankrupt 86 86.0000 0.464865 0.500000
Nonbankrupt Nonbankrupt 99 99.0000 0.535135 0.500000
CLASSIFICATION SUMMARY
Number of Observations and Percent Classified into BANKRUPTCY
From BANKRUPTCY Bankrupt Nonbankrupt Total
Bankrupt 65 75.58
21 24.42
86 100.00
Nonbankrupt 9 9.09
90 90.91
99 100.00
Total 74 40.00
111 60.00
185 100.00
Priors 0.5
0.5
Error Count Estimates for BANKRUPTCY
Bankrupt Nonbankrupt Total
Rate 0.2442 0.0909 0.1675
Priors 0.5000 0.5000

242
YEAR 2
Observations 201 DF Total 200
Variables 6 DF Within Classes 199
Classes 2 DF Between Classes 1
Class Level Information
BANKRUPTCY Variable Name Frequency Weight Proportion
Prior Probability
Bankrupt Bankrupt 95 95.0000 0.472637 0.500000
Nonbankrupt Nonbankrupt 106 106.0000 0.527363 0.500000
CLASSIFICATION SUMMARY
Number of Observations and Percent Classified into BANKRUPTCY
From BANKRUPTCY Bankrupt Nonbankrupt Total
Bankrupt 72 75.79
23 24.21
95 100.00
Nonbankrupt 18 16.98
88 83.02
106 100.00
Total 90 44.78
111 55.22
201 100.00
Priors 0.5
0.5
Error Count Estimates for BANKRUPTCY
Bankrupt Nonbankrupt Total
Rate 0.2421 0.1698 0.2060
Priors 0.5000 0.5000

243
YEAR 3
Observations 174 DF Total 173
Variables 6 DF Within Classes 172
Classes 2 DF Between Classes 1
Class Level Information
BANKRUPTCY Variable Name Frequency Weight Proportion
Prior Probability
Bankrupt Bankrupt 75 75.0000 0.431034 0.500000
Nonbankrupt Nonbankrupt 99 99.0000 0.568966 0.500000
CLASSIFICATION SUMMARY
Number of Observations and Percent Classified into BANKRUPTCY
From BANKRUPTCY Bankrupt Nonbankrupt Total
Bankrupt 43 57.33
32 42.67
75 100.00
Nonbankrupt 10 10.10
89 89.90
99 100.00
Total 53 30.46
121 69.54
174 100.00
Priors 0.5
0.5
Error Count Estimates for BANKRUPTCY
Bankrupt Nonbankrupt Total
Rate 0.4267 0.1010 0.2638
Priors 0.5000 0.5000

244
YEAR 4
Observations 90 DF Total 89
Variables 6 DF Within Classes 88
Classes 2 DF Between Classes 1
Class Level Information
BANKRUPTCY Variable Name Frequency Weight Proportion
Prior Probability
Bankrupt Bankrupt 66 66.0000 0.733333 0.500000
Nonbankrupt Nonbankrupt 24 24.0000 0.266667 0.500000
CLASSIFICATION SUMMARY
Number of Observations and Percent Classified into BANKRUPTCY
From BANKRUPTCY Bankrupt Nonbankrupt Total
Bankrupt 36 54.55
30 45.45
66 100.00
Nonbankrupt 0 0.00
24 100.00
24 100.00
Total 36 40.00
54 60.00
90 100.00
Priors 0.5
0.5
Error Count Estimates for BANKRUPTCY
Bankrupt Nonbankrupt Total
Rate 0.4545 0.0000 0.2273
Priors 0.5000 0.5000

245
YEAR 5
Observations 45 DF Total 44
Variables 6 DF Within Classes 43
Classes 2 DF Between Classes 1
Class Level Information
BANKRUPTCY Variable Name Frequency Weight Proportion
Prior Probability
Bankrupt Bankrupt 29 29.0000 0.644444 0.500000
Nonbankrupt Nonbankrupt 16 16.0000 0.355556 0.500000
CLASSIFICATION SUMMARY
Number of Observations and Percent Classified into BANKRUPTCY
From BANKRUPTCY Bankrupt Nonbankrupt Total
Bankrupt 23 79.31
6 20.69
29 100.00
Nonbankrupt 5 31.25
11 68.75
16 100.00
Total 28 62.22
17 37.78
45 100.00
Priors 0.5
0.5
Error Count Estimates for BANKRUPTCY
Bankrupt Nonbankrupt Total
Rate 0.2069 0.3125 0.2597
Priors 0.5000 0.5000

246
Table 10
Non Parametric Discriminant analysis results for Out of sample validation : Accounting variables
Observations 274 DF Total 273
Variables 17 DF Within Classes 272
Classes 2 DF Between Classes 1
Class Level Information
BANKRUPTCY Variable Name Frequency Weight Proportion
Prior Probability
Bankrupt Bankrupt 8 8.0000 0.029197 0.500000
Nonbankrupt Nonbankrupt 266 266.0000 0.970803 0.500000
Classification summary
Number of Observations and Percent Classified into BANKRUPTCY
From BANKRUPTCY Bankrupt Nonbankrupt Total
Bankrupt 8 100.00
0 0.00
8 100.00
Nonbankrupt 8 3.01
258 96.99
266 100.00
Total 16 5.84
258 94.16
274 100.00
Priors 0.5
0.5
Error Count Estimates for BANKRUPTCY
Bankrupt Nonbankrupt Total
Rate 0.0000 0.0301 0.0150
Priors 0.5000 0.5000

247
Classification summary for Test Data
Number of Observations and Percent Classified into BANKRUPTCY
From BANKRUPTCY Bankrupt Nonbankrupt Total
Bankrupt 3 50.00
3 50.00
6 100.00
Nonbankrupt 3 3.16
92 96.84
95 100.00
Total 6 5.94
95 94.06
101 100.00
Priors 0.5
0.5
Error Count Estimates for BANKRUPTCY
Bankrupt Nonbankrupt Total
Rate 0.5000 0.0316 0.2658
Priors 0.5000 0.5000

248
Non Parametric Discriminant analysis results for Out of sample validation :Market variables
Observations 813 DF Total 812
Variables 5 DF Within Classes 811
Classes 2 DF Between Classes 1
Class Level Information
BANKRUPTCY Variable Name Frequency Weight Proportion
Prior Probability
Bankrupt Bankrupt 383 383.0000 0.471095 0.500000
Nonbankrupt Nonbankrupt 430 430.0000 0.528905 0.500000
Classification summary
Number of Observations and Percent Classified into BANKRUPTCY
From BANKRUPTCY Bankrupt Nonbankrupt Total
Bankrupt 310 80.94
73 19.06
383 100.00
Nonbankrupt 58 13.49
372 86.51
430 100.00
Total 368 45.26
445 54.74
813 100.00
Priors 0.5
0.5
Error Count Estimates for BANKRUPTCY
Bankrupt Nonbankrupt Total
Rate 0.1906 0.1349 0.1627
Priors 0.5000 0.5000

249
Classification summary for Test Data
Number of Observations and Percent Classified into BANKRUPTCY
From BANKRUPTCY Bankrupt Nonbankrupt Total
Bankrupt 94 70.68
39 29.32
133 100.00
Nonbankrupt 20 17.24
96 82.76
116 100.00
Total 114 45.78
135 54.22
249 100.00
Priors 0.5
0.5
Error Count Estimates for BANKRUPTCY
Bankrupt Nonbankrupt Total
Rate 0.2932 0.1724 0.2328
Priors 0.5000 0.5000

250
Non Parametric Discriminant analysis results for Out of sample validation : Market variables without spread and hi lo bid ask spread
Observations 813 DF Total 812
Variables 4 DF Within Classes 811
Classes 2 DF Between Classes 1
Class Level Information
BANKRUPTCY Variable Name Frequency Weight Proportion
Prior Probability
Bankrupt Bankrupt 383 383.0000 0.471095 0.500000
Nonbankrupt Nonbankrupt 430 430.0000 0.528905 0.500000
Classification summary
Number of Observations and Percent Classified into BANKRUPTCY
From BANKRUPTCY Bankrupt Nonbankrupt Total
Bankrupt 318 83.03
65 16.97
383 100.00
Nonbankrupt 55 12.79
375 87.21
430 100.00
Total 373 45.88
440 54.12
813 100.00
Priors 0.5
0.5
Error Count Estimates for BANKRUPTCY
Bankrupt Nonbankrupt Total
Rate 0.1697 0.1279 0.1488
Priors 0.5000 0.5000

251
Classification summary for Test Data
Number of Observations and Percent Classified into BANKRUPTCY
From BANKRUPTCY Bankrupt Nonbankrupt Total
Bankrupt 87 65.41
46 34.59
133 100.00
Nonbankrupt 22 18.97
94 81.03
116 100.00
Total 109 43.78
140 56.22
249 100.00
Priors 0.5
0.5
Error Count Estimates for BANKRUPTCY
Bankrupt Nonbankrupt Total
Rate 0.3459 0.1897 0.2678
Priors 0.5000 0.5000
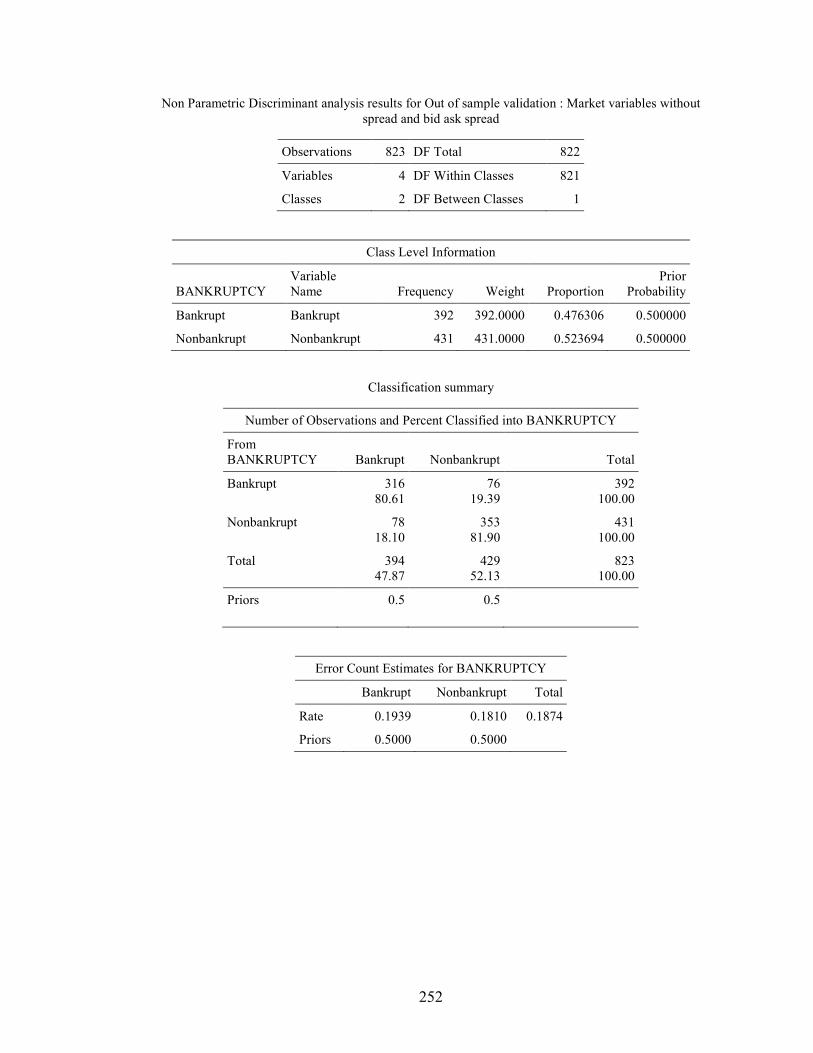
252
Non Parametric Discriminant analysis results for Out of sample validation : Market variables without spread and bid ask spread
Observations 823 DF Total 822
Variables 4 DF Within Classes 821
Classes 2 DF Between Classes 1
Class Level Information
BANKRUPTCY Variable Name Frequency Weight Proportion
Prior Probability
Bankrupt Bankrupt 392 392.0000 0.476306 0.500000
Nonbankrupt Nonbankrupt 431 431.0000 0.523694 0.500000
Classification summary
Number of Observations and Percent Classified into BANKRUPTCY
From BANKRUPTCY Bankrupt Nonbankrupt Total
Bankrupt 316 80.61
76 19.39
392 100.00
Nonbankrupt 78 18.10
353 81.90
431 100.00
Total 394 47.87
429 52.13
823 100.00
Priors 0.5
0.5
Error Count Estimates for BANKRUPTCY
Bankrupt Nonbankrupt Total
Rate 0.1939 0.1810 0.1874
Priors 0.5000 0.5000

253
Classification summary for Test Data
Number of Observations and Percent Classified into BANKRUPTCY
From BANKRUPTCY Bankrupt Nonbankrupt Total
Bankrupt 90 66.18
46 33.82
136 100.00
Nonbankrupt 49 42.24
67 57.76
116 100.00
Total 139 55.16
113 44.84
252 100.00
Priors 0.5
0.5
Error Count Estimates for BANKRUPTCY
Bankrupt Nonbankrupt Total
Rate 0.3382 0.4224 0.3803
Priors 0.5000 0.5000

254
Non Parametric Discriminant analysis results for Out of sample validation : Market variables without bid ask spread and hi lo bid ask spread
Observations 42 DF Total 41
Variables 4 DF Within Classes 40
Classes 2 DF Between Classes 1
Class Level Information
BANKRUPTCY Variable Name Frequency Weight Proportion
Prior Probability
Bankrupt Bankrupt 29 29.0000 0.690476 0.500000
Nonbankrupt Nonbankrupt 13 13.0000 0.309524 0.500000
Classification summary
Number of Observations and Percent Classified into BANKRUPTCY
From BANKRUPTCY Bankrupt Nonbankrupt Total
Bankrupt 13 44.83
16 55.17
29 100.00
Nonbankrupt 0 0.00
13 100.00
13 100.00
Total 13 30.95
29 69.05
42 100.00
Priors 0.5
0.5
Error Count Estimates for BANKRUPTCY
Bankrupt Nonbankrupt Total
Rate 0.5517 0.0000 0.2759
Priors 0.5000 0.5000

255
Classification summary for Test Data
Number of Observations and Percent Classified into BANKRUPTCY
From BANKRUPTCY Bankrupt Nonbankrupt Total
Bankrupt 1 10.00
9 90.00
10 100.00
Nonbankrupt 1 33.33
2 66.67
3 100.00
Total 2 15.38
11 84.62
13 100.00
Priors 0.5
0.5
Error Count Estimates for BANKRUPTCY
Bankrupt Nonbankrupt Total
Rate 0.9000 0.3333 0.6167
Priors 0.5000 0.5000

256
Non Parametric Discriminant analysis results for Out of sample validation : Top 3 Account and Market Ratios
Observations 277 DF Total 276
Variables 6 DF Within Classes 275
Classes 2 DF Between Classes 1
Class Level Information
BANKRUPTCY Variable Name Frequency Weight Proportion
Prior Probability
Bankrupt Bankrupt 10 10.0000 0.036101 0.500000
Nonbankrupt Nonbankrupt 267 267.0000 0.963899 0.500000
Classification summary
Number of Observations and Percent Classified into BANKRUPTCY
From BANKRUPTCY Bankrupt Nonbankrupt Total
Bankrupt 10 100.00
0 0.00
10 100.00
Nonbankrupt 12 4.49
255 95.51
267 100.00
Total 22 7.94
255 92.06
277 100.00
Priors 0.5
0.5
Error Count Estimates for BANKRUPTCY
Bankrupt Nonbankrupt Total
Rate 0.0000 0.0449 0.0225
Priors 0.5000 0.5000

257
Classification summary for Test Data
Number of Observations and Percent Classified into BANKRUPTCY
From BANKRUPTCY Bankrupt Nonbankrupt Total
Bankrupt 4 57.14
3 42.86
7 100.00
Nonbankrupt 14 14.43
83 85.57
97 100.00
Total 18 17.31
86 82.69
104 100.00
Priors 0.5
0.5
Error Count Estimates for BANKRUPTCY
Bankrupt Nonbankrupt Total
Rate 0.4286 0.1443 0.2865
Priors 0.5000 0.5000

258
Non Parametric Discriminant analysis results for Out of sample validation : Top 3 account and market logarithmic ratios
Observations 218 DF Total 217
Variables 6 DF Within Classes 216
Classes 2 DF Between Classes 1
Class Level Information
BANKRUPTCY Variable Name Frequency Weight Proportion
Prior Probability
Bankrupt Bankrupt 4 4.0000 0.018349 0.500000
Nonbankrupt Nonbankrupt 214 214.0000 0.981651 0.500000
Classification summary
Number of Observations and Percent Classified into BANKRUPTCY
From BANKRUPTCY Bankrupt Nonbankrupt Total
Bankrupt 4 100.00
0 0.00
4 100.00
Nonbankrupt 7 3.27
207 96.73
214 100.00
Total 11 5.05
207 94.95
218 100.00
Priors 0.5
0.5
Error Count Estimates for BANKRUPTCY
Bankrupt Nonbankrupt Total
Rate 0.0000 0.0327 0.0164
Priors 0.5000 0.5000

259
Classification summary for Test Data
Number of Observations and Percent Classified into BANKRUPTCY
From BANKRUPTCY Bankrupt Nonbankrupt Total
Bankrupt 2 50.00
2 50.00
4 100.00
Nonbankrupt 3 3.85
75 96.15
78 100.00
Total 5 6.10
77 93.90
82 100.00
Priors 0.5
0.5
Error Count Estimates for BANKRUPTCY
Bankrupt Nonbankrupt Total
Rate 0.5000 0.0385 0.2692
Priors 0.5000 0.5000
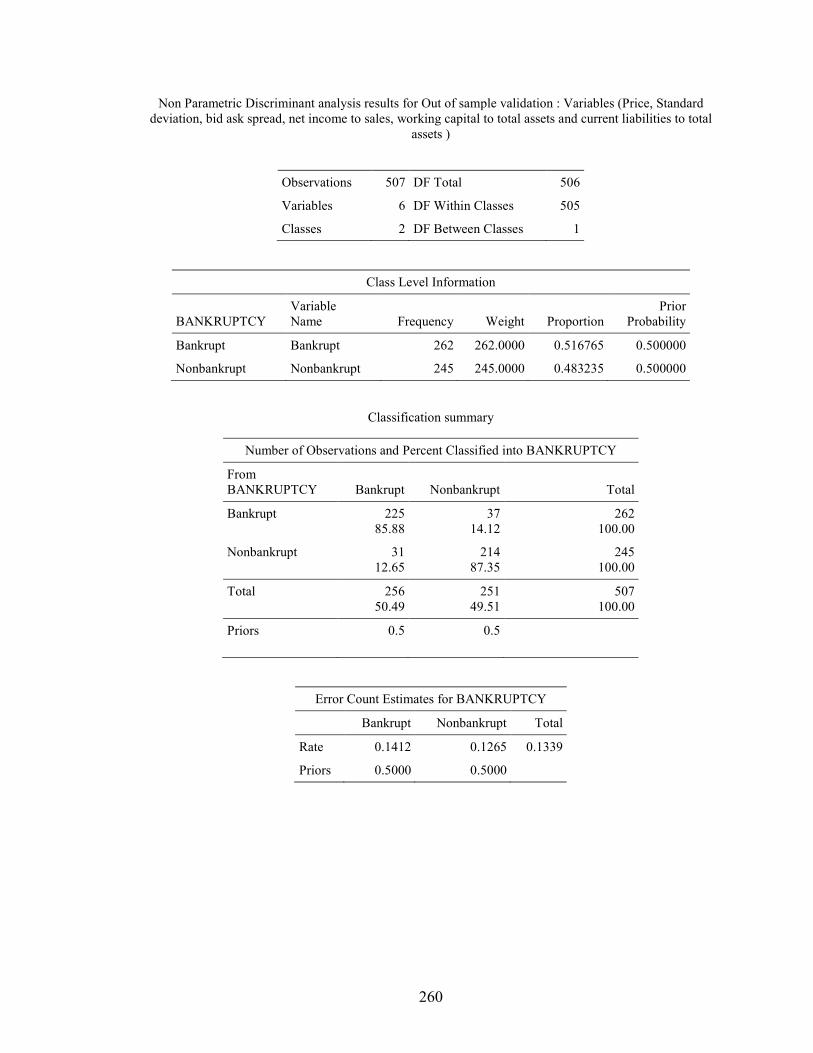
260
Non Parametric Discriminant analysis results for Out of sample validation : Variables (Price, Standard deviation, bid ask spread, net income to sales, working capital to total assets and current liabilities to total
assets )
Observations 507 DF Total 506
Variables 6 DF Within Classes 505
Classes 2 DF Between Classes 1
Class Level Information
BANKRUPTCY Variable Name Frequency Weight Proportion
Prior Probability
Bankrupt Bankrupt 262 262.0000 0.516765 0.500000
Nonbankrupt Nonbankrupt 245 245.0000 0.483235 0.500000
Classification summary
Number of Observations and Percent Classified into BANKRUPTCY
From BANKRUPTCY Bankrupt Nonbankrupt Total
Bankrupt 225 85.88
37 14.12
262 100.00
Nonbankrupt 31 12.65
214 87.35
245 100.00
Total 256 50.49
251 49.51
507 100.00
Priors 0.5
0.5
Error Count Estimates for BANKRUPTCY
Bankrupt Nonbankrupt Total
Rate 0.1412 0.1265 0.1339
Priors 0.5000 0.5000

261
Classification summary for Test Data
Number of Observations and Percent Classified into BANKRUPTCY
From BANKRUPTCY Bankrupt Nonbankrupt Total
Bankrupt 53 62.35
32 37.65
85 100.00
Nonbankrupt 15 15.15
84 84.85
99 100.00
Total 68 36.96
116 63.04
184 100.00
Priors 0.5
0.5
Error Count Estimates for BANKRUPTCY
Bankrupt Nonbankrupt Total
Rate 0.3765 0.1515 0.2640
Priors 0.5000 0.5000

262
Non Parametric Discriminant analysis results for Out of sample validation : Variables (Price, Standard deviation, hi lo bid ask spread, net income to sales, working capital to total assets and current liabilities to
total assets )
Observations 510 DF Total 509
Variables 6 DF Within Classes 508
Classes 2 DF Between Classes 1
Class Level Information
BANKRUPTCY Variable Name Frequency Weight Proportion
Prior Probability
Bankrupt Bankrupt 265 265.0000 0.519608 0.500000
Nonbankrupt Nonbankrupt 245 245.0000 0.480392 0.500000
Classification summary
Number of Observations and Percent Classified into BANKRUPTCY
From BANKRUPTCY Bankrupt Nonbankrupt Total
Bankrupt 206 77.74
59 22.26
265 100.00
Nonbankrupt 48 19.59
197 80.41
245 100.00
Total 254 49.80
256 50.20
510 100.00
Priors 0.5
0.5
Error Count Estimates for BANKRUPTCY
Bankrupt Nonbankrupt Total
Rate 0.2226 0.1959 0.2093
Priors 0.5000 0.5000

263
Classification summary for Test Data
Number of Observations and Percent Classified into BANKRUPTCY
From BANKRUPTCY Bankrupt Nonbankrupt Total
Bankrupt 59 68.60
27 31.40
86 100.00
Nonbankrupt 37 37.37
62 62.63
99 100.00
Total 96 51.89
89 48.11
185 100.00
Priors 0.5
0.5
Error Count Estimates for BANKRUPTCY
Bankrupt Nonbankrupt Total
Rate 0.3140 0.3737 0.3438
Priors 0.5000 0.5000

264
3.6 Summary and Conclusions
Bankruptcy prediction research, especially that employing discriminant analysis,
has been around for decades. The early research focuses on the ability of the linear MDA
at correctly classifying firms as bankrupt or non-bankrupt. It has been shown that MDA
does a good job (better than univariate analysis) at predicting bankruptcy. The subsequent
literature focuses on the model specifications, testing the underlying assumptions of the
models. It has been clearly documented that the underlying assumptions are often (if not
always) violated. Furthermore, most early research employs accounting ratios, which are
backward-looking, as the predictors of bankruptcy. Over time, the importance of market
variables, which are forward-looking, has been documented. The consensus has been that
a mix of accounting ratios and some market variables are best at predicting bankruptcy.
Through the use of linear, quadratic, and nonparametric MDA, along with using
sets of only market variables and two different sets of a mix of accounting ratios and
market variables, we have two main findings. First, market variables alone are best at
correctly classifying bankrupt firms. This is consistent with the hypothesis that market
variables should be better in a predictive model since they take into account future
prospects, whereas accounting ratios are only a snapshot in time and are always reported
after they have taken effect. This finding is consistent when performing an out-of-sample
procedure. Second, the nonparametric MDA displays the highest overall accuracy at
correctly classifying firms, no matter which set of variables is used. This is important
because it allows us to predict bankruptcy without necessarily having to worry about the
underlying assumptions.

265
CHAPTER 4: NEURAL NETWORKS
4.1 Introduction
While bankruptcy prediction has been a very fruitful area of research for decades,
it is still in its infancy in terms of accuracy. Most models that are used for bankruptcy
prediction hinge on the assumption that the data independent and normally distributed.
Even though it has been documented that many of the models used in previous studies are
incompatible with the data, there still have not been many solutions. We have
demonstrated in the previous chapter that the assumptions are violated for many
variables, whether they are accounting ratios or market and microstructure variables.
Therefore, traditional models, while somewhat accurate, are not the final solution.
There is always the trade-off between the complexity and accuracy of the model.
However, with the improvement in technology, some of the more complicated models are
much easier to use now. Therefore, settling for simpler models is less acceptable now.
This has led to the application of neural networks in many areas, specifically in
bankruptcy prediction.
The use of neural networks has been a positive turning point. Most relations
between variables are much more complex than allowed by traditional models. Using this
methodology, along with proper and broader variable selection, promising results shall
follow. We will apply the neural network methodology, which has shown to be a more
robust prediction methodology than older models to bankruptcy prediction, using both
forward-looking variables (market and microstructure variables) and backward-looking
variables (accounting ratios). While neural networks have been used previously, this will
be the first study to use all of these variables.
266
The most important findings are that the neural networks greatly outperform the
traditional models. Furthermore, the neural network performs best five years before
bankruptcy. In terms of prediction, this is an improvement when compared to the
univariate analysis and the multivariate discriminant analysis. Five years before
bankruptcy, the neural network using certain subsets of variables is able to correctly
classify bankrupt 97% of the firms. A mix of market variables and accounting ratios leads
to the highest classification rates. Namely, the market variables price, the standard
deviation of the price, and the bid-ask spread, along with the accounting ratios net income
to sales, working capital to total assets, and current liabilities to total assets are best at
correctly classifying bankrupt firms and also show the lowest overall misclassification
rates.
This study attempts to describe and distinguish these two groups. The remainder
of this paper is organized as follows: Section 4.2 reviews the previous literature
associated with bankruptcy univariate analysis. Section 4.3 discusses the data used in this
study. Section 4.4 describes the methodology. Section 4.5 discusses the results, and
Section 1.6 summarizes and concludes.
4.2 Literature Review
Salchenberger et al. (1992) study the ability of neural networks to predict the
probability of failure of savings and loan associations, and compare the performance of
neural networks with that of traditional models. They conclude that neural networks
outperform the traditional models at correctly classifying firms as failed or nonfailed.
Following these results and the prior literature that has found that the
assumptions underlying most traditional models are violated when studying bankruptcy

267
prediction, Coats and Fant (1993) use neural networks to test whether or not this model
can outperform Altman’s traditional Z score model using the five same ratios as Altman.
While the MDA performs better during the year of the going-concern opinion, the neural
network performs better in the year leading up to it. Therefore, the neural network is
more desirable since earlier prediction is always preferable to later prediction.
Boritz and Kennedy (1995) test different neural network models and also compare
these models to the traditional bankruptcy prediction models. The predictive ability of the
neural networks vary across different techniques, and the predictive power is highly
sensitive to the set of predictors used and to sampling error. Leshno and Spector (1996)
perform a similar study and confirm so of the previous findings. They also find that
including financial data from periods outside of the bankruptcy period enhance the
predictive ability of the model. Also, if an enhancement model is used, which makes the
model very strong, then the model becomes too specific to the data used, rather than as a
predictive model.
Jo et al. (1997) compare the accuracy of neural networks and multivariate
discriminant analysis at predicting bankruptcy of Korean firms. Using different
specifications and variables selection methods, they find that neural networks outperform
the traditional multivariate discriminant analysis.
Yang et al. (1999) study different neural network models and also compare them
to the traditional predictive models. Unlike the prior literature on bankruptcy prediction
employing neural networks, they find that discriminant analysis outperformed the neural
network models, especially at correctly classifying bankrupt firms.

268
4.3 Data
The list of bankrupt firms was obtained from bankruptcydata.com. The list
includes companies the filed for bankruptcy from January 1995 to December 2010. The
subsample of non-bankrupt firms comes from the entire database of Compustat,
consisting of firms that did not file for bankruptcy during our sample period. The
accounting ratios for all firms, bankrupt and non-bankrupt, are obtained from Compustat.
The market variables for these firms were obtained from CRSP.
4.4 Methodology
A neural network is a collection of elements that are connected by nodes. It is
designed after the human brain. Unlike traditional models that require stringent
assumptions, the neural network tries to find connections between the input and output
variables, regardless the distribution of the variables. A weighted combination of the
inputs is created, called NET. The output can be a weighted combination of the inputs or
a nonlinear transformation of the NET. Two types of neural networks are used: multi-
layer perceptron and radial basis function networks. Like all neural networks, these types
of neural networks make no assumptions about the underlying probability density
functions.
The multi-layer perceptron consists of three or more layers: an input and output
layer with one or more hidden layers. Each node in a layer connects with a specific
weight to every node in the proceeding layer. This is followed by a learning process. The
weights change every time a new piece of data is processed, and this is based on the
amount of error in the output when compared to the expected result. This is done through
backpropagation, which minimizes the objective function. This optimization process is

269
most useful for neural networks that do not have any feedback. The radial basis functions
are similar, but they are a more specialized activation function.
4.5. Empirical Results
Since the set of market variables and two subsets of accounting and market
variables have proven to be the best in the previous chapters, we will focus on those in
this chapter. We begin with the Multi-Layer Perceptron results, and then follow with the
Radial basis functions.
Starting with the market variables, the multi-layer perceptron correctly classifies
bankrupt firms 86%, 81%, 80%, 92%, and 87% of the time in years one through five,
and 88%, 81%, 77%, 88%, and 92% for nonbankrupt firms in years one through five. The
classification rates are higher than those for traditional models, but more important, the
model is better at classifying both bankrupt and non-bankrupt firms five years before
bankruptcy than it is at classifying firms one year before bankruptcy. As a predictive
model, this is desirable. The overall misclassification rates are 12.5% and 10% in years
one and five, respectively.
This is promising on two fronts. First, as mentioned above, market variables are
forward-looking variables. Therefore, in a predictive framework, the input variables
should be those that contain information about the future. Accounting ratios are not
useless, but they do contain mostly stale information. The above results validate this.
Second, a less stringent yet more technical model is desirable because financial distress,
and the path taken to get there, is not a simple, clear path. Univariate analysis and
multivariate discriminant analysis are not poor statistical techniques for certain studies,

270
but they lack the precision and breadth that the neural network allows. This is also
evident in the following results
Table 11
Results of Multi Layer Perceptron : Accounting variables
YEAR 1
VARIABLE SUMMARY
ROLE LEVEL COUNT
INPUT INTERVAL 17
TARGET TARGET 1
FIT STATISTICS
FIT STATISTIC STATISTIC LABEL
STATISTIC VALUE
_DFT_ Total Degrees of Freedom. 255 _DFE_ Degrees of Freedom for Error. 140 _DFM_ Model Degrees of Freedom. 115 _NW_ Number of Estimated Weights. 115 _AIC_ Akaike's Information Criterion. 239.105 _SBC_ Schwarz's Bayesian Criterion. 646.351 _ASE_ Average Squared Error. 0.003 _MAX_ Maximum Absolute Error. 0.496 _DIV_ Divisor for ASE. 510 _NOBS_ Sum of Frequencies. 255 _RASE_ Root Average Squared Error. 0.059 _SSE_ Sum of Squared Errors. 1.755 _SUMW_ Sum of Case Weights Times Freq. 510 _FPE_ Final Prediction Error. 0.009 _MSE_ Mean Squared Error. 0.006 _RFPE_ Root Final Prediction Error. 0.095 _RMSE_ Root Mean Squared Error. 0.079 _AVERR_ Average Error Function. 0.018 _ERR_ Error Function. 9.105 _MISC_ Misclassification Rate. 0 _WRONG_ Number of Wrong Classifications. 0

271
CLASSIFICATION SUMMARY
TARGET PREDICT
PERCENT OF TARGET
PERCENT OF PREDICT COUNT
PERCENT OF TOTAL
BANKRUPT BANKRUPT 100 100 138 54.1176 NONBANKRUPT NONBANKRUPT 100 100 117 45.8824
YEAR 2
VARIABLE SUMMARY
ROLE LEVEL COUNT
INPUT INTERVAL 17
TARGET TARGET 1
FIT STATISTICS
FIT STATISTIC STATISTIC LABEL
STATISTIC VALUE
_DFT_ Total Degrees of Freedom. 242 _DFE_ Degrees of Freedom for Error. 127 _DFM_ Model Degrees of Freedom. 115 _NW_ Number of Estimated Weights. 115 _AIC_ Akaike's Information Criterion. 233.523 _SBC_ Schwarz's Bayesian Criterion. 634.751 _ASE_ Average Squared Error. 0.002 _MAX_ Maximum Absolute Error. 0.476 _DIV_ Divisor for ASE. 484 _NOBS_ Sum of Frequencies. 242 _RASE_ Root Average Squared Error. 0.04 _SSE_ Sum of Squared Errors. 0.792 _SUMW_ Sum of Case Weights Times Freq. 484 _FPE_ Final Prediction Error. 0.005 _MSE_ Mean Squared Error. 0.003 _RFPE_ Root Final Prediction Error. 0.068 _RMSE_ Root Mean Squared Error. 0.056 _AVERR_ Average Error Function. 0.007 _ERR_ Error Function. 3.523 _MISC_ Misclassification Rate. 0 _WRONG_ Number of Wrong Classifications. 0

272
CLASSIFICATION SUMMARY
TARGET PREDICT
PERCENT OF TARGET
PERCENT OF PREDICT COUNT
PERCENT OF TOTAL
BANKRUPT BANKRUPT 100 100 129 53.3058 NONBANKRUPT NONBANKRUPT 100 100 113 46.6942
YEAR 3
VARIABLE SUMMARY
ROLE LEVEL COUNT
INPUT INTERVAL 17
TARGET TARGET 1
FIT STATISTICS
FIT STATISTIC STATISTIC LABEL
STATISTIC VALUE
_DFT_ Total Degrees of Freedom. 219 _DFE_ Degrees of Freedom for Error. 104 _DFM_ Model Degrees of Freedom. 115 _NW_ Number of Estimated Weights. 115 _AIC_ Akaike's Information Criterion. 244.337 _SBC_ Schwarz's Bayesian Criterion. 634.081 _ASE_ Average Squared Error. 0.006 _MAX_ Maximum Absolute Error. 0.486 _DIV_ Divisor for ASE. 438 _NOBS_ Sum of Frequencies. 219 _RASE_ Root Average Squared Error. 0.079 _SSE_ Sum of Squared Errors. 2.699 _SUMW_ Sum of Case Weights Times Freq. 438 _FPE_ Final Prediction Error. 0.02 _MSE_ Mean Squared Error. 0.013 _RFPE_ Root Final Prediction Error. 0.141 _RMSE_ Root Mean Squared Error. 0.114 _AVERR_ Average Error Function. 0.033 _ERR_ Error Function. 14.337 _MISC_ Misclassification Rate. 0 _WRONG_ Number of Wrong Classifications. 0

273
CLASSIFICATION SUMMARY
TARGET PREDICT
PERCENT OF TARGET
PERCENT OF PREDICT COUNT
PERCENT OF TOTAL
BANKRUPT BANKRUPT 100 100 108 49.3151 NONBANKRUPT NONBANKRUPT 100 100 111 50.6849
YEAR 4
VARIABLE SUMMARY
ROLE LEVEL COUNT
INPUT INTERVAL 17
TARGET TARGET 1
FIT STATISTICS
FIT STATISTIC STATISTIC LABEL
STATISTIC VALUE
_DFT_ Total Degrees of Freedom. 195 _DFE_ Degrees of Freedom for Error. 80 _DFM_ Model Degrees of Freedom. 115 _NW_ Number of Estimated Weights. 115 _AIC_ Akaike's Information Criterion. 242.227 _SBC_ Schwarz's Bayesian Criterion. 618.622 _ASE_ Average Squared Error. 0.006 _MAX_ Maximum Absolute Error. 0.465 _DIV_ Divisor for ASE. 390 _NOBS_ Sum of Frequencies. 195 _RASE_ Root Average Squared Error. 0.078 _SSE_ Sum of Squared Errors. 2.385 _SUMW_ Sum of Case Weights Times Freq. 390 _FPE_ Final Prediction Error. 0.024 _MSE_ Mean Squared Error. 0.015 _RFPE_ Root Final Prediction Error. 0.154 _RMSE_ Root Mean Squared Error. 0.122 _AVERR_ Average Error Function. 0.031 _ERR_ Error Function. 12.227 _MISC_ Misclassification Rate. 0 _WRONG_ Number of Wrong Classifications. 0

274
CLASSIFICATION SUMMARY
TARGET PREDICT
PERCENT OF TARGET
PERCENT OF PREDICT COUNT
PERCENT OF TOTAL
BANKRUPT BANKRUPT 100 100 85 43.5897 NONBANKRUPT NONBANKRUPT 100 100 110 56.4103
YEAR 5
VARIABLE SUMMARY
ROLE LEVEL COUNT
INPUT INTERVAL 17
TARGET TARGET 1
FIT STATISTICS
FIT STATISTIC STATISTIC LABEL
STATISTIC VALUE
_DFT_ Total Degrees of Freedom. 168 _DFE_ Degrees of Freedom for Error. 53 _DFM_ Model Degrees of Freedom. 115 _NW_ Number of Estimated Weights. 115 _AIC_ Akaike's Information Criterion. 238.324 _SBC_ Schwarz's Bayesian Criterion. 597.58 _ASE_ Average Squared Error. 0.004 _MAX_ Maximum Absolute Error. 0.373 _DIV_ Divisor for ASE. 336 _NOBS_ Sum of Frequencies. 168 _RASE_ Root Average Squared Error. 0.065 _SSE_ Sum of Squared Errors. 1.422 _SUMW_ Sum of Case Weights Times Freq. 336 _FPE_ Final Prediction Error. 0.023 _MSE_ Mean Squared Error. 0.013 _RFPE_ Root Final Prediction Error. 0.15 _RMSE_ Root Mean Squared Error. 0.116 _AVERR_ Average Error Function. 0.025 _ERR_ Error Function. 8.324 _MISC_ Misclassification Rate. 0 _WRONG_ Number of Wrong Classifications. 0

275
CLASSIFICATION SUMMARY
TARGET PREDICT
PERCENT OF TARGET
PERCENT OF PREDICT COUNT
PERCENT OF TOTAL
BANKRUPT BANKRUPT 100 100 70 41.6667 NONBANKRUPT NONBANKRUPT 100 100 98 58.3333
Results of Multi Layer Perceptron : Market variables
YEAR 1
VARIABLE SUMMARY
ROLE LEVEL COUNT
INPUT INTERVAL 5
TARGET TARGET 1
FIT STATISTICS
FIT STATISTIC STATISTIC LABEL
STATISTIC VALUE
_DFT_ Total Degrees of Freedom. 255 _DFE_ Degrees of Freedom for Error. 212 _DFM_ Model Degrees of Freedom. 43 _NW_ Number of Estimated Weights. 43 _AIC_ Akaike's Information Criterion. 254.472 _SBC_ Schwarz's Bayesian Criterion. 406.746 _ASE_ Average Squared Error. 0.102 _MAX_ Maximum Absolute Error. 0.937 _DIV_ Divisor for ASE. 510 _NOBS_ Sum of Frequencies. 255 _RASE_ Root Average Squared Error. 0.319 _SSE_ Sum of Squared Errors. 51.802 _SUMW_ Sum of Case Weights Times Freq. 510 _FPE_ Final Prediction Error. 0.143 _MSE_ Mean Squared Error. 0.122 _RFPE_ Root Final Prediction Error. 0.378 _RMSE_ Root Mean Squared Error. 0.35 _AVERR_ Average Error Function. 0.33 _ERR_ Error Function. 168.472 _MISC_ Misclassification Rate. 0.125 _WRONG_ Number of Wrong Classifications. 32

276
CLASSIFICATION SUMMARY
TARGET PREDICT
PERCENT OF TARGET
PERCENT OF PREDICT COUNT
PERCENT OF TOTAL
BANKRUPT BANKRUPT 86.3014 91.3043 126 49.4118 NONBANKRUPT BANKRUPT 13.6986 17.094 20 7.8431 BANKRUPT NONBANKRUPT 11.0092 8.6957 12 4.7059 NONBANKRUPT NONBANKRUPT 88.9908 82.906 97 38.0392
YEAR 2
VARIABLE SUMMARY
ROLE LEVEL COUNT
INPUT INTERVAL 5
TARGET TARGET 1
FIT STATISTICS
FIT STATISTIC STATISTIC LABEL
STATISTIC VALUE
_DFT_ Total Degrees of Freedom. 242 _DFE_ Degrees of Freedom for Error. 199 _DFM_ Model Degrees of Freedom. 43 _NW_ Number of Estimated Weights. 43 _AIC_ Akaike's Information Criterion. 297.655 _SBC_ Schwarz's Bayesian Criterion. 447.679 _ASE_ Average Squared Error. 0.139 _MAX_ Maximum Absolute Error. 0.912 _DIV_ Divisor for ASE. 484 _NOBS_ Sum of Frequencies. 242 _RASE_ Root Average Squared Error. 0.373 _SSE_ Sum of Squared Errors. 67.439 _SUMW_ Sum of Case Weights Times Freq. 484 _FPE_ Final Prediction Error. 0.2 _MSE_ Mean Squared Error. 0.169

277
_RFPE_ Root Final Prediction Error. 0.447 _RMSE_ Root Mean Squared Error. 0.412 _AVERR_ Average Error Function. 0.437 _ERR_ Error Function. 211.655 _MISC_ Misclassification Rate. 0.19 _WRONG_ Number of Wrong Classifications. 46
CLASSIFICATION SUMMARY
TARGET PREDICT
PERCENT OF TARGET
PERCENT OF PREDICT COUNT
PERCENT OF TOTAL
BANKRUPT BANKRUPT 81.203 83.7209 108 44.6281 NONBANKRUPT BANKRUPT 18.797 22.1239 25 10.3306 BANKRUPT NONBANKRUPT 19.2661 16.2791 21 8.6777 NONBANKRUPT NONBANKRUPT 80.7339 77.8761 88 36.3636
YEAR 3
VARIABLE SUMMARY
ROLE LEVEL COUNT
INPUT INTERVAL 5
TARGET TARGET 1
FIT STATISTICS
FIT STATISTIC STATISTIC LABEL
STATISTIC VALUE
_DFT_ Total Degrees of Freedom. 219 _DFE_ Degrees of Freedom for Error. 176 _DFM_ Model Degrees of Freedom. 43 _NW_ Number of Estimated Weights. 43 _AIC_ Akaike's Information Criterion. 287.3 _SBC_ Schwarz's Bayesian Criterion. 433.03 _ASE_ Average Squared Error. 0.153 _MAX_ Maximum Absolute Error. 0.923 _DIV_ Divisor for ASE. 438 _NOBS_ Sum of Frequencies. 219 _RASE_ Root Average Squared Error. 0.391 _SSE_ Sum of Squared Errors. 66.834 _SUMW_ Sum of Case Weights Times Freq. 438 _FPE_ Final Prediction Error. 0.227

278
_MSE_ Mean Squared Error. 0.19 _RFPE_ Root Final Prediction Error. 0.477 _RMSE_ Root Mean Squared Error. 0.436 _AVERR_ Average Error Function. 0.46 _ERR_ Error Function. 201.3 _MISC_ Misclassification Rate. 0.21 _WRONG_ Number of Wrong Classifications. 46
CLASSIFICATION SUMMARY
TARGET PREDICT
PERCENT OF TARGET
PERCENT OF PREDICT COUNT
PERCENT OF TOTAL
BANKRUPT BANKRUPT 80.3922 75.9259 82 37.4429 NONBANKRUPT BANKRUPT 19.6078 18.018 20 9.1324 BANKRUPT NONBANKRUPT 22.2222 24.0741 26 11.8721 NONBANKRUPT NONBANKRUPT 77.7778 81.982 91 41.5525
YEAR 4
VARIABLE SUMMARY
ROLE LEVEL COUNT
INPUT INTERVAL 5
TARGET TARGET 1
FIT STATISTICS
FIT STATISTIC STATISTIC LABEL
STATISTIC VALUE
_DFT_ Total Degrees of Freedom. 195 _DFE_ Degrees of Freedom for Error. 152 _DFM_ Model Degrees of Freedom. 43 _NW_ Number of Estimated Weights. 43 _AIC_ Akaike's Information Criterion. 190.354 _SBC_ Schwarz's Bayesian Criterion. 331.093 _ASE_ Average Squared Error. 0.081 _MAX_ Maximum Absolute Error. 0.941 _DIV_ Divisor for ASE. 390 _NOBS_ Sum of Frequencies. 195 _RASE_ Root Average Squared Error. 0.285 _SSE_ Sum of Squared Errors. 31.766 _SUMW_ Sum of Case Weights Times Freq. 390

279
_FPE_ Final Prediction Error. 0.128 _MSE_ Mean Squared Error. 0.104 _RFPE_ Root Final Prediction Error. 0.357 _RMSE_ Root Mean Squared Error. 0.323 _AVERR_ Average Error Function. 0.268 _ERR_ Error Function. 104.354 _MISC_ Misclassification Rate. 0.097 _WRONG_ Number of Wrong Classifications. 19
CLASSIFICATION SUMMARY
TARGET PREDICT
PERCENT OF TARGET
PERCENT OF PREDICT COUNT
PERCENT OF TOTAL
BANKRUPT BANKRUPT 92.3077 84.7059 72 36.9231 NONBANKRUPT BANKRUPT 7.6923 5.4545 6 3.0769 BANKRUPT NONBANKRUPT 11.1111 15.2941 13 6.6667 NONBANKRUPT NONBANKRUPT 88.8889 94.5455 104 53.3333
YEAR 5
VARIABLE SUMMARY
ROLE LEVEL COUNT
INPUT INTERVAL 5
TARGET TARGET 1
FIT STATISTICS
FIT STATISTIC STATISTIC LABEL
STATISTIC VALUE
_DFT_ Total Degrees of Freedom. 168 _DFE_ Degrees of Freedom for Error. 125 _DFM_ Model Degrees of Freedom. 43 _NW_ Number of Estimated Weights. 43 _AIC_ Akaike's Information Criterion. 186.053 _SBC_ Schwarz's Bayesian Criterion. 320.384 _ASE_ Average Squared Error. 0.092 _MAX_ Maximum Absolute Error. 0.954 _DIV_ Divisor for ASE. 336 _NOBS_ Sum of Frequencies. 168 _RASE_ Root Average Squared Error. 0.303 _SSE_ Sum of Squared Errors. 30.768

280
_SUMW_ Sum of Case Weights Times Freq. 336 _FPE_ Final Prediction Error. 0.155 _MSE_ Mean Squared Error. 0.123 _RFPE_ Root Final Prediction Error. 0.393 _RMSE_ Root Mean Squared Error. 0.351 _AVERR_ Average Error Function. 0.298 _ERR_ Error Function. 100.053 _MISC_ Misclassification Rate. 0.101 _WRONG_ Number of Wrong Classifications. 17
CLASSIFICATION SUMMARY
TARGET PREDICT
PERCENT OF TARGET
PERCENT OF PREDICT COUNT
PERCENT OF TOTAL
BANKRUPT BANKRUPT 87.3239 88.5714 62 36.9048 NONBANKRUPT BANKRUPT 12.6761 9.1837 9 5.3571 BANKRUPT NONBANKRUPT 8.2474 11.4286 8 4.7619 NONBANKRUPT NONBANKRUPT 91.7526 90.8163 89 52.9762

281
Results of Multi Layer Perceptron : Market variables without spread and hi lo bid ask spread
YEAR 1
VARIABLE SUMMARY
ROLE LEVEL COUNT
INPUT INTERVAL 4
TARGET TARGET 1
FIT STATISTICS
FIT STATISTIC STATISTIC LABEL
STATISTIC VALUE
_DFT_ Total Degrees of Freedom. 255 _DFE_ Degrees of Freedom for Error. 218 _DFM_ Model Degrees of Freedom. 37 _NW_ Number of Estimated Weights. 37 _AIC_ Akaike's Information Criterion. 296.65 _SBC_ Schwarz's Bayesian Criterion. 427.676 _ASE_ Average Squared Error. 0.141 _MAX_ Maximum Absolute Error. 0.959 _DIV_ Divisor for ASE. 510 _NOBS_ Sum of Frequencies. 255 _RASE_ Root Average Squared Error. 0.376 _SSE_ Sum of Squared Errors. 72.028 _SUMW_ Sum of Case Weights Times Freq. 510 _FPE_ Final Prediction Error. 0.189 _MSE_ Mean Squared Error. 0.165 _RFPE_ Root Final Prediction Error. 0.435 _RMSE_ Root Mean Squared Error. 0.406 _AVERR_ Average Error Function. 0.437 _ERR_ Error Function. 222.65 _MISC_ Misclassification Rate. 0.196 _WRONG_ Number of Wrong Classifications. 50

282
CLASSIFICATION SUMMARY
TARGET PREDICT
PERCENT OF TARGET
PERCENT OF PREDICT COUNT
PERCENT OF TOTAL
BANKRUPT BANKRUPT 83.8462 78.9855 109 42.7451 NONBANKRUPT BANKRUPT 16.1538 17.9487 21 8.2353 BANKRUPT NONBANKRUPT 23.2 21.0145 29 11.3725 NONBANKRUPT NONBANKRUPT 76.8 82.0513 96 37.6471
YEAR 2
VARIABLE SUMMARY
ROLE LEVEL COUNT
INPUT INTERVAL 4
TARGET TARGET 1
FIT STATISTICS
FIT STATISTIC STATISTIC LABEL
STATISTIC VALUE
_DFT_ Total Degrees of Freedom. 242 _DFE_ Degrees of Freedom for Error. 205 _DFM_ Model Degrees of Freedom. 37 _NW_ Number of Estimated Weights. 37 _AIC_ Akaike's Information Criterion. 305.497 _SBC_ Schwarz's Bayesian Criterion. 434.588 _ASE_ Average Squared Error. 0.155 _MAX_ Maximum Absolute Error. 0.919 _DIV_ Divisor for ASE. 484 _NOBS_ Sum of Frequencies. 242 _RASE_ Root Average Squared Error. 0.394 _SSE_ Sum of Squared Errors. 74.984 _SUMW_ Sum of Case Weights Times Freq. 484 _FPE_ Final Prediction Error. 0.211 _MSE_ Mean Squared Error. 0.183 _RFPE_ Root Final Prediction Error. 0.459 _RMSE_ Root Mean Squared Error. 0.428 _AVERR_ Average Error Function. 0.478 _ERR_ Error Function. 231.497 _MISC_ Misclassification Rate. 0.211 _WRONG_ Number of Wrong Classifications. 51

283
CLASSIFICATION SUMMARY
TARGET PREDICT
PERCENT OF TARGET
PERCENT OF PREDICT COUNT
PERCENT OF TOTAL
BANKRUPT BANKRUPT 77.0833 86.0465 111 45.8678 NONBANKRUPT BANKRUPT 22.9167 29.2035 33 13.6364 BANKRUPT NONBANKRUPT 18.3673 13.9535 18 7.438 NONBANKRUPT NONBANKRUPT 81.6327 70.7965 80 33.0579
YEAR 3
VARIABLE SUMMARY
ROLE LEVEL COUNT
INPUT INTERVAL 4
TARGET TARGET 1
FIT STATISTICS
FIT STATISTIC STATISTIC LABEL
STATISTIC VALUE
_DFT_ Total Degrees of Freedom. 219 _DFE_ Degrees of Freedom for Error. 182 _DFM_ Model Degrees of Freedom. 37 _NW_ Number of Estimated Weights. 37 _AIC_ Akaike's Information Criterion. 281.888 _SBC_ Schwarz's Bayesian Criterion. 407.284 _ASE_ Average Squared Error. 0.157 _MAX_ Maximum Absolute Error. 0.95 _DIV_ Divisor for ASE. 438 _NOBS_ Sum of Frequencies. 219 _RASE_ Root Average Squared Error. 0.396 _SSE_ Sum of Squared Errors. 68.587 _SUMW_ Sum of Case Weights Times Freq. 438 _FPE_ Final Prediction Error. 0.22 _MSE_ Mean Squared Error. 0.188 _RFPE_ Root Final Prediction Error. 0.469 _RMSE_ Root Mean Squared Error. 0.434 _AVERR_ Average Error Function. 0.475 _ERR_ Error Function. 207.888 _MISC_ Misclassification Rate. 0.219 _WRONG_ Number of Wrong Classifications. 48

284
CLASSIFICATION SUMMARY
TARGET PREDICT
PERCENT OF TARGET
PERCENT OF PREDICT COUNT
PERCENT OF TOTAL
BANKRUPT BANKRUPT 75.8621 81.4815 88 40.1826 NONBANKRUPT BANKRUPT 24.1379 25.2252 28 12.7854 BANKRUPT NONBANKRUPT 19.4175 18.5185 20 9.1324 NONBANKRUPT NONBANKRUPT 80.5825 74.7748 83 37.8995
YEAR 4
VARIABLE SUMMARY
ROLE LEVEL COUNT
INPUT INTERVAL 4
TARGET TARGET 1
FIT STATISTICS
FIT STATISTIC STATISTIC LABEL
STATISTIC VALUE
_DFT_ Total Degrees of Freedom. 195 _DFE_ Degrees of Freedom for Error. 158 _DFM_ Model Degrees of Freedom. 37 _NW_ Number of Estimated Weights. 37 _AIC_ Akaike's Information Criterion. 200.982 _SBC_ Schwarz's Bayesian Criterion. 322.083 _ASE_ Average Squared Error. 0.102 _MAX_ Maximum Absolute Error. 0.965 _DIV_ Divisor for ASE. 390 _NOBS_ Sum of Frequencies. 195 _RASE_ Root Average Squared Error. 0.319 _SSE_ Sum of Squared Errors. 39.801 _SUMW_ Sum of Case Weights Times Freq. 390 _FPE_ Final Prediction Error. 0.15 _MSE_ Mean Squared Error. 0.126 _RFPE_ Root Final Prediction Error. 0.387 _RMSE_ Root Mean Squared Error. 0.355 _AVERR_ Average Error Function. 0.326 _ERR_ Error Function. 126.982 _MISC_ Misclassification Rate. 0.128 _WRONG_ Number of Wrong Classifications. 25

285
CLASSIFICATION SUMMARY
TARGET PREDICT
PERCENT OF TARGET
PERCENT OF PREDICT COUNT
PERCENT OF TOTAL
BANKRUPT BANKRUPT 84.8837 85.8824 73 37.4359 NONBANKRUPT BANKRUPT 15.1163 11.8182 13 6.6667 BANKRUPT NONBANKRUPT 11.0092 14.1176 12 6.1538 NONBANKRUPT NONBANKRUPT 88.9908 88.1818 97 49.7436
YEAR 5
VARIABLE SUMMARY
ROLE LEVEL COUNT
INPUT INTERVAL 4
TARGET TARGET 1
FIT STATISTICS
FIT STATISTIC STATISTIC LABEL
STATISTIC VALUE
_DFT_ Total Degrees of Freedom. 168 _DFE_ Degrees of Freedom for Error. 131 _DFM_ Model Degrees of Freedom. 37 _NW_ Number of Estimated Weights. 37 _AIC_ Akaike's Information Criterion. 176.618 _SBC_ Schwarz's Bayesian Criterion. 292.205 _ASE_ Average Squared Error. 0.094 _MAX_ Maximum Absolute Error. 0.971 _DIV_ Divisor for ASE. 336 _NOBS_ Sum of Frequencies. 168 _RASE_ Root Average Squared Error. 0.307 _SSE_ Sum of Squared Errors. 31.688 _SUMW_ Sum of Case Weights Times Freq. 336 _FPE_ Final Prediction Error. 0.148 _MSE_ Mean Squared Error. 0.121 _RFPE_ Root Final Prediction Error. 0.384 _RMSE_ Root Mean Squared Error. 0.348 _AVERR_ Average Error Function. 0.305 _ERR_ Error Function. 102.618 _MISC_ Misclassification Rate. 0.119 _WRONG_ Number of Wrong Classifications. 20

286
CLASSIFICATION SUMMARY
TARGET PREDICT
PERCENT OF TARGET
PERCENT OF PREDICT COUNT
PERCENT OF TOTAL
BANKRUPT BANKRUPT 84.7222 87.1429 61 36.3095 NONBANKRUPT BANKRUPT 15.2778 11.2245 11 6.5476 BANKRUPT NONBANKRUPT 9.375 12.8571 9 5.3571 NONBANKRUPT NONBANKRUPT 90.625 88.7755 87 51.7857

287
Results of Multi Layer Perceptron : Market variables without spread and bid ask spread
YEAR 1
VARIABLE SUMMARY
ROLE LEVEL COUNT
INPUT INTERVAL 4
TARGET TARGET 1
FIT STATISTICS
FIT STATISTIC STATISTIC LABEL
STATISTIC VALUE
_DFT_ Total Degrees of Freedom. 255 _DFE_ Degrees of Freedom for Error. 218 _DFM_ Model Degrees of Freedom. 37 _NW_ Number of Estimated Weights. 37 _AIC_ Akaike's Information Criterion. 293.559 _SBC_ Schwarz's Bayesian Criterion. 424.586 _ASE_ Average Squared Error. 0.137 _MAX_ Maximum Absolute Error. 0.954 _DIV_ Divisor for ASE. 510 _NOBS_ Sum of Frequencies. 255 _RASE_ Root Average Squared Error. 0.37 _SSE_ Sum of Squared Errors. 69.776 _SUMW_ Sum of Case Weights Times Freq. 510 _FPE_ Final Prediction Error. 0.183 _MSE_ Mean Squared Error. 0.16 _RFPE_ Root Final Prediction Error. 0.428 _RMSE_ Root Mean Squared Error. 0.4 _AVERR_ Average Error Function. 0.431 _ERR_ Error Function. 219.559 _MISC_ Misclassification Rate. 0.196 _WRONG_ Number of Wrong Classifications. 50

288
CLASSIFICATION SUMMARY
TARGET PREDICT
PERCENT OF TARGET
PERCENT OF PREDICT COUNT
PERCENT OF TOTAL
BANKRUPT BANKRUPT 78.9474 86.9565 120 47.0588 NONBANKRUPT BANKRUPT 21.0526 27.3504 32 12.549 BANKRUPT NONBANKRUPT 17.4757 13.0435 18 7.0588 NONBANKRUPT NONBANKRUPT 82.5243 72.6496 85 33.3333
YEAR 2
VARIABLE SUMMARY
ROLE LEVEL COUNT
INPUT INTERVAL 4
TARGET TARGET 1
FIT STATISTICS
FIT STATISTIC STATISTIC LABEL
STATISTIC VALUE
_DFT_ Total Degrees of Freedom. 242 _DFE_ Degrees of Freedom for Error. 205 _DFM_ Model Degrees of Freedom. 37 _NW_ Number of Estimated Weights. 37 _AIC_ Akaike's Information Criterion. 349.622 _SBC_ Schwarz's Bayesian Criterion. 478.712 _ASE_ Average Squared Error. 0.195 _MAX_ Maximum Absolute Error. 0.854 _DIV_ Divisor for ASE. 484 _NOBS_ Sum of Frequencies. 242 _RASE_ Root Average Squared Error. 0.442 _SSE_ Sum of Squared Errors. 94.617 _SUMW_ Sum of Case Weights Times Freq. 484 _FPE_ Final Prediction Error. 0.266 _MSE_ Mean Squared Error. 0.231 _RFPE_ Root Final Prediction Error. 0.516 _RMSE_ Root Mean Squared Error. 0.48 _AVERR_ Average Error Function. 0.569 _ERR_ Error Function. 275.622 _MISC_ Misclassification Rate. 0.298 _WRONG_ Number of Wrong Classifications. 72

289
CLASSIFICATION SUMMARY
TARGET PREDICT
PERCENT OF TARGET
PERCENT OF PREDICT COUNT
PERCENT OF TOTAL
BANKRUPT BANKRUPT 67.7019 84.4961 109 45.0413 NONBANKRUPT BANKRUPT 32.2981 46.0177 52 21.4876 BANKRUPT NONBANKRUPT 24.6914 15.5039 20 8.2645 NONBANKRUPT NONBANKRUPT 75.3086 53.9823 61 25.2066
YEAR 3
VARIABLE SUMMARY
ROLE LEVEL COUNT
INPUT INTERVAL 4
TARGET TARGET 1
FIT STATISTICS
FIT STATISTIC STATISTIC LABEL
STATISTIC VALUE
_DFT_ Total Degrees of Freedom. 219 _DFE_ Degrees of Freedom for Error. 182 _DFM_ Model Degrees of Freedom. 37 _NW_ Number of Estimated Weights. 37 _AIC_ Akaike's Information Criterion. 324.718 _SBC_ Schwarz's Bayesian Criterion. 450.113 _ASE_ Average Squared Error. 0.197 _MAX_ Maximum Absolute Error. 0.803 _DIV_ Divisor for ASE. 438 _NOBS_ Sum of Frequencies. 219 _RASE_ Root Average Squared Error. 0.444 _SSE_ Sum of Squared Errors. 86.423 _SUMW_ Sum of Case Weights Times Freq. 438 _FPE_ Final Prediction Error. 0.278 _MSE_ Mean Squared Error. 0.237 _RFPE_ Root Final Prediction Error. 0.527 _RMSE_ Root Mean Squared Error. 0.487 _AVERR_ Average Error Function. 0.572 _ERR_ Error Function. 250.718 _MISC_ Misclassification Rate. 0.297 _WRONG_ Number of Wrong Classifications. 65

290
CLASSIFICATION SUMMARY
TARGET PREDICT
PERCENT OF TARGET
PERCENT OF PREDICT COUNT
PERCENT OF TOTAL
BANKRUPT BANKRUPT 67.2 77.7778 84 38.3562 NONBANKRUPT BANKRUPT 32.8 36.9369 41 18.7215 BANKRUPT NONBANKRUPT 25.5319 22.2222 24 10.9589 NONBANKRUPT NONBANKRUPT 74.4681 63.0631 70 31.9635
YEAR 4
VARIABLE SUMMARY
ROLE LEVEL COUNT
INPUT INTERVAL 4
TARGET TARGET 1
FIT STATISTICS
FIT STATISTIC STATISTIC LABEL
STATISTIC VALUE
_DFT_ Total Degrees of Freedom. 195 _DFE_ Degrees of Freedom for Error. 158 _DFM_ Model Degrees of Freedom. 37 _NW_ Number of Estimated Weights. 37 _AIC_ Akaike's Information Criterion. 267.887 _SBC_ Schwarz's Bayesian Criterion. 388.988 _ASE_ Average Squared Error. 0.169 _MAX_ Maximum Absolute Error. 0.902 _DIV_ Divisor for ASE. 390 _NOBS_ Sum of Frequencies. 195 _RASE_ Root Average Squared Error. 0.411 _SSE_ Sum of Squared Errors. 65.74 _SUMW_ Sum of Case Weights Times Freq. 390 _FPE_ Final Prediction Error. 0.248 _MSE_ Mean Squared Error. 0.208 _RFPE_ Root Final Prediction Error. 0.498 _RMSE_ Root Mean Squared Error. 0.456 _AVERR_ Average Error Function. 0.497 _ERR_ Error Function. 193.887 _MISC_ Misclassification Rate. 0.262 _WRONG_ Number of Wrong Classifications. 51

291
CLASSIFICATION SUMMARY
TARGET PREDICT
PERCENT OF TARGET
PERCENT OF PREDICT COUNT
PERCENT OF TOTAL
BANKRUPT BANKRUPT 67.7083 76.4706 65 33.3333 NONBANKRUPT BANKRUPT 32.2917 28.1818 31 15.8974 BANKRUPT NONBANKRUPT 20.202 23.5294 20 10.2564 NONBANKRUPT NONBANKRUPT 79.798 71.8182 79 40.5128
YEAR 5
VARIABLE SUMMARY
ROLE LEVEL COUNT
INPUT INTERVAL 4
TARGET TARGET 1
FIT STATISTICS
FIT STATISTIC STATISTIC LABEL
STATISTIC VALUE
_DFT_ Total Degrees of Freedom. 168 _DFE_ Degrees of Freedom for Error. 131 _DFM_ Model Degrees of Freedom. 37 _NW_ Number of Estimated Weights. 37 _AIC_ Akaike's Information Criterion. 229.214 _SBC_ Schwarz's Bayesian Criterion. 344.801 _ASE_ Average Squared Error. 0.153 _MAX_ Maximum Absolute Error. 0.974 _DIV_ Divisor for ASE. 336 _NOBS_ Sum of Frequencies. 168 _RASE_ Root Average Squared Error. 0.391 _SSE_ Sum of Squared Errors. 51.495 _SUMW_ Sum of Case Weights Times Freq. 336 _FPE_ Final Prediction Error. 0.24 _MSE_ Mean Squared Error. 0.197 _RFPE_ Root Final Prediction Error. 0.49 _RMSE_ Root Mean Squared Error. 0.443 _AVERR_ Average Error Function. 0.462 _ERR_ Error Function. 155.214 _MISC_ Misclassification Rate. 0.226 _WRONG_ Number of Wrong Classifications. 38

292
CLASSIFICATION SUMMARY
TARGET PREDICT
PERCENT OF TARGET
PERCENT OF PREDICT COUNT
PERCENT OF TOTAL
BANKRUPT BANKRUPT 72.8571 72.8571 51 30.3571 NONBANKRUPT BANKRUPT 27.1429 19.3878 19 11.3095 BANKRUPT NONBANKRUPT 19.3878 27.1429 19 11.3095 NONBANKRUPT NONBANKRUPT 80.6122 80.6122 79 47.0238

293
Results of Multi Layer Perceptron : Market variables without bid ask spread and hi lo bid ask spread
YEAR 1
VARIABLE SUMMARY
ROLE LEVEL COUNT
INPUT INTERVAL 4
TARGET TARGET 1
FIT STATISTICS
FIT STATISTIC STATISTIC LABEL
STATISTIC VALUE
_DFT_ Total Degrees of Freedom. 255 _DFE_ Degrees of Freedom for Error. 218 _DFM_ Model Degrees of Freedom. 37 _NW_ Number of Estimated Weights. 37 _AIC_ Akaike's Information Criterion. 354.963 _SBC_ Schwarz's Bayesian Criterion. 485.989 _ASE_ Average Squared Error. 0.189 _MAX_ Maximum Absolute Error. 0.902 _DIV_ Divisor for ASE. 510 _NOBS_ Sum of Frequencies. 255 _RASE_ Root Average Squared Error. 0.434 _SSE_ Sum of Squared Errors. 96.281 _SUMW_ Sum of Case Weights Times Freq. 510 _FPE_ Final Prediction Error. 0.253 _MSE_ Mean Squared Error. 0.221 _RFPE_ Root Final Prediction Error. 0.503 _RMSE_ Root Mean Squared Error. 0.47 _AVERR_ Average Error Function. 0.551 _ERR_ Error Function. 280.963 _MISC_ Misclassification Rate. 0.275 _WRONG_ Number of Wrong Classifications. 70

294
CLASSIFICATION SUMMARY
TARGET PREDICT
PERCENT OF TARGET
PERCENT OF PREDICT COUNT
PERCENT OF TOTAL
BANKRUPT BANKRUPT 71.7949 81.1594 112 43.9216 NONBANKRUPT BANKRUPT 28.2051 37.6068 44 17.2549 BANKRUPT NONBANKRUPT 26.2626 18.8406 26 10.1961 NONBANKRUPT NONBANKRUPT 73.7374 62.3932 73 28.6275
YEAR 2
VARIABLE SUMMARY
ROLE LEVEL COUNT
INPUT INTERVAL 4
TARGET TARGET 1
FIT STATISTICS
FIT STATISTIC STATISTIC LABEL
STATISTIC VALUE
_DFT_ Total Degrees of Freedom. 242 _DFE_ Degrees of Freedom for Error. 205 _DFM_ Model Degrees of Freedom. 37 _NW_ Number of Estimated Weights. 37 _AIC_ Akaike's Information Criterion. 360.782 _SBC_ Schwarz's Bayesian Criterion. 489.873 _ASE_ Average Squared Error. 0.206 _MAX_ Maximum Absolute Error. 0.767 _DIV_ Divisor for ASE. 484 _NOBS_ Sum of Frequencies. 242 _RASE_ Root Average Squared Error. 0.454 _SSE_ Sum of Squared Errors. 99.646 _SUMW_ Sum of Case Weights Times Freq. 484 _FPE_ Final Prediction Error. 0.28 _MSE_ Mean Squared Error. 0.243 _RFPE_ Root Final Prediction Error. 0.529 _RMSE_ Root Mean Squared Error. 0.493 _AVERR_ Average Error Function. 0.593 _ERR_ Error Function. 286.782 _MISC_ Misclassification Rate. 0.318 _WRONG_ Number of Wrong Classifications. 77

295
CLASSIFICATION SUMMARY
TARGET PREDICT
PERCENT OF TARGET
PERCENT OF PREDICT COUNT
PERCENT OF TOTAL
BANKRUPT BANKRUPT 67.5676 77.5194 100 41.3223 NONBANKRUPT BANKRUPT 32.4324 42.4779 48 19.8347 BANKRUPT NONBANKRUPT 30.8511 22.4806 29 11.9835 NONBANKRUPT NONBANKRUPT 69.1489 57.5221 65 26.8595
YEAR 3
VARIABLE SUMMARY
ROLE LEVEL COUNT
INPUT INTERVAL 4
TARGET TARGET 1
FIT STATISTICS
FIT STATISTIC STATISTIC LABEL
STATISTIC VALUE
_DFT_ Total Degrees of Freedom. 219 _DFE_ Degrees of Freedom for Error. 182 _DFM_ Model Degrees of Freedom. 37 _NW_ Number of Estimated Weights. 37 _AIC_ Akaike's Information Criterion. 323.336 _SBC_ Schwarz's Bayesian Criterion. 448.732 _ASE_ Average Squared Error. 0.196 _MAX_ Maximum Absolute Error. 0.796 _DIV_ Divisor for ASE. 438 _NOBS_ Sum of Frequencies. 219 _RASE_ Root Average Squared Error. 0.442 _SSE_ Sum of Squared Errors. 85.738 _SUMW_ Sum of Case Weights Times Freq. 438 _FPE_ Final Prediction Error. 0.275 _MSE_ Mean Squared Error. 0.236 _RFPE_ Root Final Prediction Error. 0.525 _RMSE_ Root Mean Squared Error. 0.485 _AVERR_ Average Error Function. 0.569 _ERR_ Error Function. 249.336 _MISC_ Misclassification Rate. 0.279 _WRONG_ Number of Wrong Classifications. 61

296
CLASSIFICATION SUMMARY
TARGET PREDICT
PERCENT OF TARGET
PERCENT OF PREDICT COUNT
PERCENT OF TOTAL
BANKRUPT BANKRUPT 69.4215 77.7778 84 38.3562 NONBANKRUPT BANKRUPT 30.5785 33.3333 37 16.895 BANKRUPT NONBANKRUPT 24.4898 22.2222 24 10.9589 NONBANKRUPT NONBANKRUPT 75.5102 66.6667 74 33.79
YEAR 4
VARIABLE SUMMARY
ROLE LEVEL COUNT
INPUT INTERVAL 4
TARGET TARGET 1
FIT STATISTICS
FIT STATISTIC STATISTIC LABEL
STATISTIC VALUE
_DFT_ Total Degrees of Freedom. 195 _DFE_ Degrees of Freedom for Error. 158 _DFM_ Model Degrees of Freedom. 37 _NW_ Number of Estimated Weights. 37 _AIC_ Akaike's Information Criterion. 281.918 _SBC_ Schwarz's Bayesian Criterion. 403.019 _ASE_ Average Squared Error. 0.183 _MAX_ Maximum Absolute Error. 0.925 _DIV_ Divisor for ASE. 390 _NOBS_ Sum of Frequencies. 195 _RASE_ Root Average Squared Error. 0.428 _SSE_ Sum of Squared Errors. 71.309 _SUMW_ Sum of Case Weights Times Freq. 390 _FPE_ Final Prediction Error. 0.268 _MSE_ Mean Squared Error. 0.226 _RFPE_ Root Final Prediction Error. 0.518 _RMSE_ Root Mean Squared Error. 0.475 _AVERR_ Average Error Function. 0.533 _ERR_ Error Function. 207.918 _MISC_ Misclassification Rate. 0.262 _WRONG_ Number of Wrong Classifications. 51

297
CLASSIFICATION SUMMARY
TARGET PREDICT
PERCENT OF TARGET
PERCENT OF PREDICT COUNT
PERCENT OF TOTAL
BANKRUPT BANKRUPT 68.4783 74.1176 63 32.3077 NONBANKRUPT BANKRUPT 31.5217 26.3636 29 14.8718 BANKRUPT NONBANKRUPT 21.3592 25.8824 22 11.2821 NONBANKRUPT NONBANKRUPT 78.6408 73.6364 81 41.5385
YEAR 5
VARIABLE SUMMARY
ROLE LEVEL COUNT
INPUT INTERVAL 4
TARGET TARGET 1
FIT STATISTICS
FIT STATISTIC STATISTIC LABEL
STATISTIC VALUE
_DFT_ Total Degrees of Freedom. 168 _DFE_ Degrees of Freedom for Error. 131 _DFM_ Model Degrees of Freedom. 37 _NW_ Number of Estimated Weights. 37 _AIC_ Akaike's Information Criterion. 252.594 _SBC_ Schwarz's Bayesian Criterion. 368.181 _ASE_ Average Squared Error. 0.182 _MAX_ Maximum Absolute Error. 0.932 _DIV_ Divisor for ASE. 336 _NOBS_ Sum of Frequencies. 168 _RASE_ Root Average Squared Error. 0.427 _SSE_ Sum of Squared Errors. 61.217 _SUMW_ Sum of Case Weights Times Freq. 336 _FPE_ Final Prediction Error. 0.285 _MSE_ Mean Squared Error. 0.234 _RFPE_ Root Final Prediction Error. 0.534 _RMSE_ Root Mean Squared Error. 0.483 _AVERR_ Average Error Function. 0.532 _ERR_ Error Function. 178.594 _MISC_ Misclassification Rate. 0.28 _WRONG_ Number of Wrong Classifications. 47

298
CLASSIFICATION SUMMARY
TARGET PREDICT
PERCENT OF TARGET
PERCENT OF PREDICT COUNT
PERCENT OF TOTAL
BANKRUPT BANKRUPT 64.9351 71.4286 50 29.7619 NONBANKRUPT BANKRUPT 35.0649 27.551 27 16.0714 BANKRUPT NONBANKRUPT 21.978 28.5714 20 11.9048 NONBANKRUPT NONBANKRUPT 78.022 72.449 71 42.2619

299
Results of Multi Layer Perceptron : Top 3 Account and Market variables
YEAR 1
VARIABLE SUMMARY
ROLE LEVEL COUNT
INPUT INTERVAL 6
TARGET TARGET 1
FIT STATISTICS
FIT STATISTIC STATISTIC LABEL
STATISTIC VALUE
_DFT_ Total Degrees of Freedom. 255 _DFE_ Degrees of Freedom for Error. 206 _DFM_ Model Degrees of Freedom. 49 _NW_ Number of Estimated Weights. 49 _AIC_ Akaike's Information Criterion. 254.282 _SBC_ Schwarz's Bayesian Criterion. 427.804 _ASE_ Average Squared Error. 0.094 _MAX_ Maximum Absolute Error. 0.947 _DIV_ Divisor for ASE. 510 _NOBS_ Sum of Frequencies. 255 _RASE_ Root Average Squared Error. 0.307 _SSE_ Sum of Squared Errors. 48.082 _SUMW_ Sum of Case Weights Times Freq. 510 _FPE_ Final Prediction Error. 0.139 _MSE_ Mean Squared Error. 0.117 _RFPE_ Root Final Prediction Error. 0.373 _RMSE_ Root Mean Squared Error. 0.342 _AVERR_ Average Error Function. 0.306 _ERR_ Error Function. 156.282 _MISC_ Misclassification Rate. 0.122 _WRONG_ Number of Wrong Classifications. 31

300
CLASSIFICATION SUMMARY
TARGET PREDICT
PERCENT OF TARGET
PERCENT OF PREDICT COUNT
PERCENT OF TOTAL
BANKRUPT BANKRUPT 86.3946 92.029 127 49.8039 NONBANKRUPT BANKRUPT 13.6054 17.094 20 7.8431 BANKRUPT NONBANKRUPT 10.1852 7.971 11 4.3137 NONBANKRUPT NONBANKRUPT 89.8148 82.906 97 38.0392
YEAR 2
VARIABLE SUMMARY
ROLE LEVEL COUNT
INPUT INTERVAL 6
TARGET TARGET 1
FIT STATISTICS
FIT STATISTIC STATISTIC LABEL
STATISTIC VALUE
_DFT_ Total Degrees of Freedom. 242 _DFE_ Degrees of Freedom for Error. 193 _DFM_ Model Degrees of Freedom. 49 _NW_ Number of Estimated Weights. 49 _AIC_ Akaike's Information Criterion. 246.106 _SBC_ Schwarz's Bayesian Criterion. 417.064 _ASE_ Average Squared Error. 0.094 _MAX_ Maximum Absolute Error. 0.972 _DIV_ Divisor for ASE. 484 _NOBS_ Sum of Frequencies. 242 _RASE_ Root Average Squared Error. 0.307 _SSE_ Sum of Squared Errors. 45.516 _SUMW_ Sum of Case Weights Times Freq. 484 _FPE_ Final Prediction Error. 0.142 _MSE_ Mean Squared Error. 0.118 _RFPE_ Root Final Prediction Error. 0.377 _RMSE_ Root Mean Squared Error. 0.343 _AVERR_ Average Error Function. 0.306 _ERR_ Error Function. 148.106 _MISC_ Misclassification Rate. 0.112 _WRONG_ Number of Wrong Classifications. 27

301
CLASSIFICATION SUMMARY
TARGET PREDICT
PERCENT OF TARGET
PERCENT OF PREDICT COUNT
PERCENT OF TOTAL
BANKRUPT BANKRUPT 88.0597 91.4729 118 48.7603 NONBANKRUPT BANKRUPT 11.9403 14.1593 16 6.6116 BANKRUPT NONBANKRUPT 10.1852 8.5271 11 4.5455 NONBANKRUPT NONBANKRUPT 89.8148 85.8407 97 40.0826
YEAR 3
VARIABLE SUMMARY
ROLE LEVEL COUNT
INPUT INTERVAL 6
TARGET TARGET 1
FIT STATISTICS
FIT STATISTIC STATISTIC LABEL
STATISTIC VALUE
_DFT_ Total Degrees of Freedom. 219 _DFE_ Degrees of Freedom for Error. 170 _DFM_ Model Degrees of Freedom. 49 _NW_ Number of Estimated Weights. 49 _AIC_ Akaike's Information Criterion. 232.603 _SBC_ Schwarz's Bayesian Criterion. 398.667 _ASE_ Average Squared Error. 0.093 _MAX_ Maximum Absolute Error. 0.975 _DIV_ Divisor for ASE. 438 _NOBS_ Sum of Frequencies. 219 _RASE_ Root Average Squared Error. 0.305 _SSE_ Sum of Squared Errors. 40.777 _SUMW_ Sum of Case Weights Times Freq. 438 _FPE_ Final Prediction Error. 0.147 _MSE_ Mean Squared Error. 0.12 _RFPE_ Root Final Prediction Error. 0.383 _RMSE_ Root Mean Squared Error. 0.346 _AVERR_ Average Error Function. 0.307 _ERR_ Error Function. 134.603 _MISC_ Misclassification Rate. 0.105 _WRONG_ Number of Wrong Classifications. 23

302
CLASSIFICATION SUMMARY
TARGET PREDICT
PERCENT OF TARGET
PERCENT OF PREDICT COUNT
PERCENT OF TOTAL
BANKRUPT BANKRUPT 89.7196 88.8889 96 43.8356 NONBANKRUPT BANKRUPT 10.2804 9.9099 11 5.0228 BANKRUPT NONBANKRUPT 10.7143 11.1111 12 5.4795 NONBANKRUPT NONBANKRUPT 89.2857 90.0901 100 45.6621
YEAR 4
VARIABLE SUMMARY
ROLE LEVEL COUNT
INPUT INTERVAL 6
TARGET TARGET 1
FIT STATISTICS
FIT STATISTIC STATISTIC LABEL
STATISTIC VALUE
_DFT_ Total Degrees of Freedom. 195 _DFE_ Degrees of Freedom for Error. 146 _DFM_ Model Degrees of Freedom. 49 _NW_ Number of Estimated Weights. 49 _AIC_ Akaike's Information Criterion. 168.74 _SBC_ Schwarz's Bayesian Criterion. 329.117 _ASE_ Average Squared Error. 0.057 _MAX_ Maximum Absolute Error. 0.858 _DIV_ Divisor for ASE. 390 _NOBS_ Sum of Frequencies. 195 _RASE_ Root Average Squared Error. 0.239 _SSE_ Sum of Squared Errors. 22.291 _SUMW_ Sum of Case Weights Times Freq. 390 _FPE_ Final Prediction Error. 0.096 _MSE_ Mean Squared Error. 0.076 _RFPE_ Root Final Prediction Error. 0.309 _RMSE_ Root Mean Squared Error. 0.276 _AVERR_ Average Error Function. 0.181 _ERR_ Error Function. 70.74 _MISC_ Misclassification Rate. 0.072 _WRONG_ Number of Wrong Classifications. 14

303
CLASSIFICATION SUMMARY
TARGET PREDICT
PERCENT OF TARGET
PERCENT OF PREDICT COUNT
PERCENT OF TOTAL
BANKRUPT BANKRUPT 93.8272 89.4118 76 38.9744 NONBANKRUPT BANKRUPT 6.1728 4.5455 5 2.5641 BANKRUPT NONBANKRUPT 7.8947 10.5882 9 4.6154 NONBANKRUPT NONBANKRUPT 92.1053 95.4545 105 53.8462
YEAR 5
VARIABLE SUMMARY
ROLE LEVEL COUNT
INPUT INTERVAL 6
TARGET TARGET 1
FIT STATISTICS
FIT STATISTIC STATISTIC LABEL
STATISTIC VALUE
_DFT_ Total Degrees of Freedom. 168 _DFE_ Degrees of Freedom for Error. 119 _DFM_ Model Degrees of Freedom. 49 _NW_ Number of Estimated Weights. 49 _AIC_ Akaike's Information Criterion. 169.834 _SBC_ Schwarz's Bayesian Criterion. 322.908 _ASE_ Average Squared Error. 0.066 _MAX_ Maximum Absolute Error. 0.941 _DIV_ Divisor for ASE. 336 _NOBS_ Sum of Frequencies. 168 _RASE_ Root Average Squared Error. 0.256 _SSE_ Sum of Squared Errors. 22.103 _SUMW_ Sum of Case Weights Times Freq. 336 _FPE_ Final Prediction Error. 0.12 _MSE_ Mean Squared Error. 0.093 _RFPE_ Root Final Prediction Error. 0.346 _RMSE_ Root Mean Squared Error. 0.305 _AVERR_ Average Error Function. 0.214 _ERR_ Error Function. 71.834 _MISC_ Misclassification Rate. 0.083 _WRONG_ Number of Wrong Classifications. 14

304
CLASSIFICATION SUMMARY
TARGET PREDICT
PERCENT OF TARGET
PERCENT OF PREDICT COUNT
PERCENT OF TOTAL
BANKRUPT BANKRUPT 88.8889 91.4286 64 38.0952 NONBANKRUPT BANKRUPT 11.1111 8.1633 8 4.7619 BANKRUPT NONBANKRUPT 6.25 8.5714 6 3.5714 NONBANKRUPT NONBANKRUPT 93.75 91.8367 90 53.5714
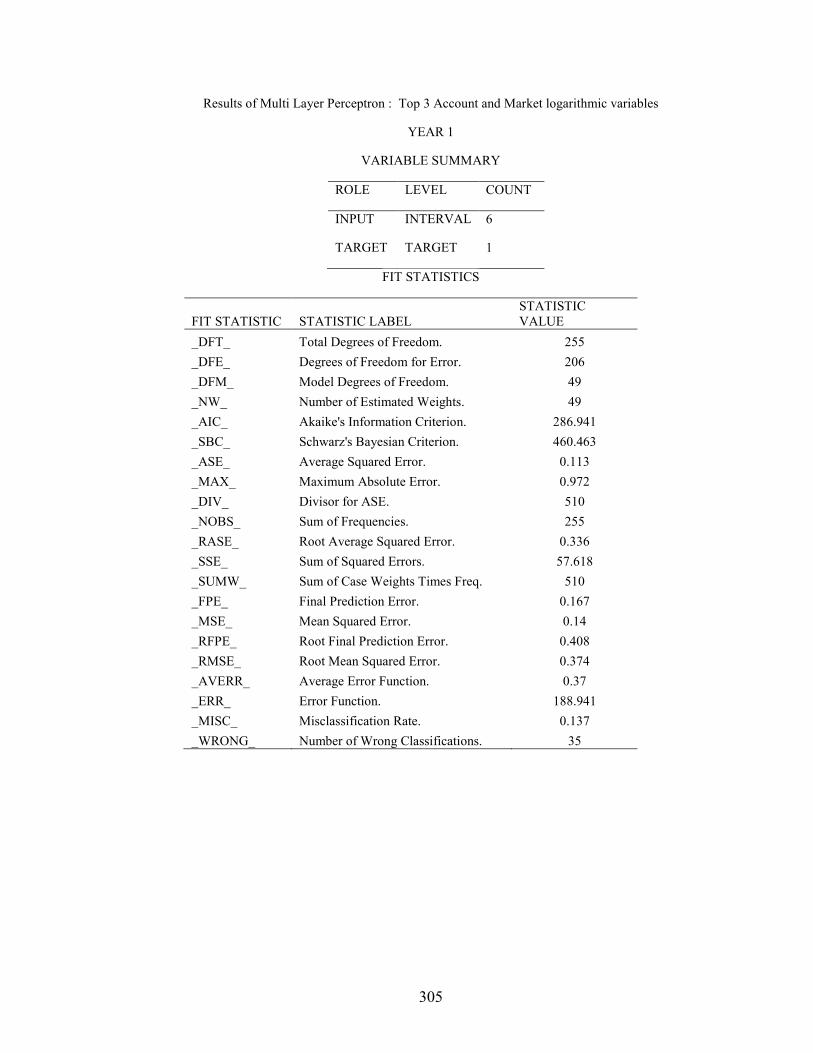
305
Results of Multi Layer Perceptron : Top 3 Account and Market logarithmic variables
YEAR 1
VARIABLE SUMMARY
ROLE LEVEL COUNT
INPUT INTERVAL 6
TARGET TARGET 1
FIT STATISTICS
FIT STATISTIC STATISTIC LABEL STATISTIC VALUE
_DFT_ Total Degrees of Freedom. 255 _DFE_ Degrees of Freedom for Error. 206 _DFM_ Model Degrees of Freedom. 49 _NW_ Number of Estimated Weights. 49 _AIC_ Akaike's Information Criterion. 286.941 _SBC_ Schwarz's Bayesian Criterion. 460.463 _ASE_ Average Squared Error. 0.113 _MAX_ Maximum Absolute Error. 0.972 _DIV_ Divisor for ASE. 510 _NOBS_ Sum of Frequencies. 255 _RASE_ Root Average Squared Error. 0.336 _SSE_ Sum of Squared Errors. 57.618 _SUMW_ Sum of Case Weights Times Freq. 510 _FPE_ Final Prediction Error. 0.167 _MSE_ Mean Squared Error. 0.14 _RFPE_ Root Final Prediction Error. 0.408 _RMSE_ Root Mean Squared Error. 0.374 _AVERR_ Average Error Function. 0.37 _ERR_ Error Function. 188.941 _MISC_ Misclassification Rate. 0.137 _WRONG_ Number of Wrong Classifications. 35

306
CLASSIFICATION SUMMARY
TARGET PREDICT
PERCENT OF TARGET
PERCENT OF PREDICT COUNT
PERCENT OF TOTAL
BANKRUPT BANKRUPT 87.5912 86.9565 120 47.0588 NONBANKRUPT BANKRUPT 12.4088 14.5299 17 6.6667 BANKRUPT NONBANKRUPT 15.2542 13.0435 18 7.0588 NONBANKRUPT NONBANKRUPT 84.7458 85.4701 100 39.2157
YEAR 2
VARIABLE SUMMARY
ROLE LEVEL COUNT
INPUT INTERVAL 6
TARGET TARGET 1
FIT STATISTICS
FIT STATISTIC STATISTIC LABEL
STATISTIC VALUE
_DFT_ Total Degrees of Freedom. 242 _DFE_ Degrees of Freedom for Error. 193 _DFM_ Model Degrees of Freedom. 49 _NW_ Number of Estimated Weights. 49 _AIC_ Akaike's Information Criterion. 278.68 _SBC_ Schwarz's Bayesian Criterion. 449.638 _ASE_ Average Squared Error. 0.118 _MAX_ Maximum Absolute Error. 0.964 _DIV_ Divisor for ASE. 484 _NOBS_ Sum of Frequencies. 242 _RASE_ Root Average Squared Error. 0.344 _SSE_ Sum of Squared Errors. 57.23 _SUMW_ Sum of Case Weights Times Freq. 484 _FPE_ Final Prediction Error. 0.178 _MSE_ Mean Squared Error. 0.148 _RFPE_ Root Final Prediction Error. 0.422 _RMSE_ Root Mean Squared Error. 0.385 _AVERR_ Average Error Function. 0.373 _ERR_ Error Function. 180.68 _MISC_ Misclassification Rate. 0.161 _WRONG_ Number of Wrong Classifications. 39

307
CLASSIFICATION SUMMARY
TARGET PREDICT
PERCENT OF TARGET
PERCENT OF PREDICT COUNT
PERCENT OF TOTAL
BANKRUPT BANKRUPT 84.0909 86.0465 111 45.8678 NONBANKRUPT BANKRUPT 15.9091 18.5841 21 8.6777 BANKRUPT NONBANKRUPT 16.3636 13.9535 18 7.438 NONBANKRUPT NONBANKRUPT 83.6364 81.4159 92 38.0165
YEAR 3
VARIABLE SUMMARY
ROLE LEVEL COUNT
INPUT INTERVAL 6
TARGET TARGET 1
FIT STATISTICS
FIT STATISTIC STATISTIC LABEL
STATISTIC VALUE
_DFT_ Total Degrees of Freedom. 219 _DFE_ Degrees of Freedom for Error. 170 _DFM_ Model Degrees of Freedom. 49 _NW_ Number of Estimated Weights. 49 _AIC_ Akaike's Information Criterion. 240.753 _SBC_ Schwarz's Bayesian Criterion. 406.818 _ASE_ Average Squared Error. 0.101 _MAX_ Maximum Absolute Error. 0.975 _DIV_ Divisor for ASE. 438 _NOBS_ Sum of Frequencies. 219 _RASE_ Root Average Squared Error. 0.318 _SSE_ Sum of Squared Errors. 44.213 _SUMW_ Sum of Case Weights Times Freq. 438 _FPE_ Final Prediction Error. 0.159 _MSE_ Mean Squared Error. 0.13 _RFPE_ Root Final Prediction Error. 0.399 _RMSE_ Root Mean Squared Error. 0.361 _AVERR_ Average Error Function. 0.326 _ERR_ Error Function. 142.753 _MISC_ Misclassification Rate. 0.11 _WRONG_ Number of Wrong Classifications. 24

308
CLASSIFICATION SUMMARY
TARGET PREDICT
PERCENT OF TARGET
PERCENT OF PREDICT COUNT
PERCENT OF TOTAL
BANKRUPT BANKRUPT 88.1818 89.8148 97 44.2922 NONBANKRUPT BANKRUPT 11.8182 11.7117 13 5.9361 BANKRUPT NONBANKRUPT 10.0917 10.1852 11 5.0228 NONBANKRUPT NONBANKRUPT 89.9083 88.2883 98 44.7489
YEAR 4
VARIABLE SUMMARY
ROLE LEVEL COUNT
INPUT INTERVAL 6
TARGET TARGET 1
FIT STATISTICS
FIT STATISTIC STATISTIC LABEL
STATISTIC VALUE
_DFT_ Total Degrees of Freedom. 195 _DFE_ Degrees of Freedom for Error. 146 _DFM_ Model Degrees of Freedom. 49 _NW_ Number of Estimated Weights. 49 _AIC_ Akaike's Information Criterion. 192.392 _SBC_ Schwarz's Bayesian Criterion. 352.769 _ASE_ Average Squared Error. 0.077 _MAX_ Maximum Absolute Error. 0.981 _DIV_ Divisor for ASE. 390 _NOBS_ Sum of Frequencies. 195 _RASE_ Root Average Squared Error. 0.277 _SSE_ Sum of Squared Errors. 29.947 _SUMW_ Sum of Case Weights Times Freq. 390 _FPE_ Final Prediction Error. 0.128 _MSE_ Mean Squared Error. 0.103 _RFPE_ Root Final Prediction Error. 0.358 _RMSE_ Root Mean Squared Error. 0.32 _AVERR_ Average Error Function. 0.242 _ERR_ Error Function. 94.392 _MISC_ Misclassification Rate. 0.103 _WRONG_ Number of Wrong Classifications. 20

309
CLASSIFICATION SUMMARY
TARGET PREDICT
PERCENT OF TARGET
PERCENT OF PREDICT COUNT
PERCENT OF TOTAL
BANKRUPT BANKRUPT 88.2353 88.2353 75 38.4615 NONBANKRUPT BANKRUPT 11.7647 9.0909 10 5.1282 BANKRUPT NONBANKRUPT 9.0909 11.7647 10 5.1282 NONBANKRUPT NONBANKRUPT 90.9091 90.9091 100 51.2821
YEAR 5
VARIABLE SUMMARY
ROLE LEVEL COUNT
INPUT INTERVAL 6
TARGET TARGET 1
FIT STATISTICS
FIT STATISTIC STATISTIC LABEL
STATISTIC VALUE
_DFT_ Total Degrees of Freedom. 168 _DFE_ Degrees of Freedom for Error. 119 _DFM_ Model Degrees of Freedom. 49 _NW_ Number of Estimated Weights. 49 _AIC_ Akaike's Information Criterion. 219.711 _SBC_ Schwarz's Bayesian Criterion. 372.786 _ASE_ Average Squared Error. 0.113 _MAX_ Maximum Absolute Error. 0.916 _DIV_ Divisor for ASE. 336 _NOBS_ Sum of Frequencies. 168 _RASE_ Root Average Squared Error. 0.336 _SSE_ Sum of Squared Errors. 37.897 _SUMW_ Sum of Case Weights Times Freq. 336 _FPE_ Final Prediction Error. 0.206 _MSE_ Mean Squared Error. 0.159 _RFPE_ Root Final Prediction Error. 0.454 _RMSE_ Root Mean Squared Error. 0.399 _AVERR_ Average Error Function. 0.362 _ERR_ Error Function. 121.711 _MISC_ Misclassification Rate. 0.125 _WRONG_ Number of Wrong Classifications. 21

310
CLASSIFICATION SUMMARY
TARGET PREDICT
PERCENT OF TARGET
PERCENT OF PREDICT COUNT
PERCENT OF TOTAL
BANKRUPT BANKRUPT 90.1639 78.5714 55 32.7381 NONBANKRUPT BANKRUPT 9.8361 6.1224 6 3.5714 BANKRUPT NONBANKRUPT 14.0187 21.4286 15 8.9286 NONBANKRUPT NONBANKRUPT 85.9813 93.8776 92 54.7619

311
Results of Multi Layer Perceptron : Variables (Price, Standard deviation, bid ask spread, net income to sales, working capital to total assets and current liabilities to total assets )
YEAR 1
VARIABLE SUMMARY
ROLE LEVEL COUNT
INPUT INTERVAL 6
TARGET TARGET 1
FIT STATISTICS
FIT STATISTIC STATISTIC LABEL
STATISTIC VALUE
_DFT_ Total Degrees of Freedom. 255 _DFE_ Degrees of Freedom for Error. 206 _DFM_ Model Degrees of Freedom. 49 _NW_ Number of Estimated Weights. 49 _AIC_ Akaike's Information Criterion. 259.926 _SBC_ Schwarz's Bayesian Criterion. 433.448 _ASE_ Average Squared Error. 0.096 _MAX_ Maximum Absolute Error. 0.968 _DIV_ Divisor for ASE. 510 _NOBS_ Sum of Frequencies. 255 _RASE_ Root Average Squared Error. 0.31 _SSE_ Sum of Squared Errors. 49.015 _SUMW_ Sum of Case Weights Times Freq. 510 _FPE_ Final Prediction Error. 0.142 _MSE_ Mean Squared Error. 0.119 _RFPE_ Root Final Prediction Error. 0.377 _RMSE_ Root Mean Squared Error. 0.345 _AVERR_ Average Error Function. 0.318 _ERR_ Error Function. 161.926 _MISC_ Misclassification Rate. 0.106 _WRONG_ Number of Wrong Classifications. 27

312
CLASSIFICATION SUMMARY
TARGET PREDICT
PERCENT OF TARGET
PERCENT OF PREDICT COUNT
PERCENT OF TOTAL
BANKRUPT BANKRUPT 90.5109 89.8551 124 48.6275 NONBANKRUPT BANKRUPT 9.4891 11.1111 13 5.098 BANKRUPT NONBANKRUPT 11.8644 10.1449 14 5.4902 NONBANKRUPT NONBANKRUPT 88.1356 88.8889 104 40.7843
YEAR 2
VARIABLE SUMMARY
ROLE LEVEL COUNT
INPUT INTERVAL 6
TARGET TARGET 1
FIT STATISTICS
FIT STATISTIC STATISTIC LABEL
STATISTIC VALUE
_DFT_ Total Degrees of Freedom. 242 _DFE_ Degrees of Freedom for Error. 193 _DFM_ Model Degrees of Freedom. 49 _NW_ Number of Estimated Weights. 49 _AIC_ Akaike's Information Criterion. 280.076 _SBC_ Schwarz's Bayesian Criterion. 451.034 _ASE_ Average Squared Error. 0.123 _MAX_ Maximum Absolute Error. 0.896 _DIV_ Divisor for ASE. 484 _NOBS_ Sum of Frequencies. 242 _RASE_ Root Average Squared Error. 0.351 _SSE_ Sum of Squared Errors. 59.77 _SUMW_ Sum of Case Weights Times Freq. 484 _FPE_ Final Prediction Error. 0.186 _MSE_ Mean Squared Error. 0.155 _RFPE_ Root Final Prediction Error. 0.432 _RMSE_ Root Mean Squared Error. 0.394 _AVERR_ Average Error Function. 0.376 _ERR_ Error Function. 182.076 _MISC_ Misclassification Rate. 0.165 _WRONG_ Number of Wrong Classifications. 40

313
CLASSIFICATION SUMMARY
TARGET PREDICT
PERCENT OF TARGET
PERCENT OF PREDICT COUNT
PERCENT OF TOTAL
BANKRUPT BANKRUPT 83.9695 85.2713 110 45.4545 NONBANKRUPT BANKRUPT 16.0305 18.5841 21 8.6777 BANKRUPT NONBANKRUPT 17.1171 14.7287 19 7.8512 NONBANKRUPT NONBANKRUPT 82.8829 81.4159 92 38.0165
YEAR 3
VARIABLE SUMMARY
ROLE LEVEL COUNT
INPUT INTERVAL 6
TARGET TARGET 1
FIT STATISTICS
FIT STATISTIC STATISTIC LABEL
STATISTIC VALUE
_DFT_ Total Degrees of Freedom. 219 _DFE_ Degrees of Freedom for Error. 170 _DFM_ Model Degrees of Freedom. 49 _NW_ Number of Estimated Weights. 49 _AIC_ Akaike's Information Criterion. 250.47 _SBC_ Schwarz's Bayesian Criterion. 416.535 _ASE_ Average Squared Error. 0.109 _MAX_ Maximum Absolute Error. 0.984 _DIV_ Divisor for ASE. 438 _NOBS_ Sum of Frequencies. 219 _RASE_ Root Average Squared Error. 0.331 _SSE_ Sum of Squared Errors. 47.952 _SUMW_ Sum of Case Weights Times Freq. 438 _FPE_ Final Prediction Error. 0.173 _MSE_ Mean Squared Error. 0.141 _RFPE_ Root Final Prediction Error. 0.415 _RMSE_ Root Mean Squared Error. 0.376 _AVERR_ Average Error Function. 0.348 _ERR_ Error Function. 152.47 _MISC_ Misclassification Rate. 0.169 _WRONG_ Number of Wrong Classifications. 37

314
CLASSIFICATION SUMMARY
TARGET PREDICT
PERCENT OF TARGET
PERCENT OF PREDICT COUNT
PERCENT OF TOTAL
BANKRUPT BANKRUPT 81.4159 85.1852 92 42.0091 NONBANKRUPT BANKRUPT 18.5841 18.9189 21 9.589 BANKRUPT NONBANKRUPT 15.0943 14.8148 16 7.3059 NONBANKRUPT NONBANKRUPT 84.9057 81.0811 90 41.0959
YEAR 4
VARIABLE SUMMARY
ROLE LEVEL COUNT
INPUT INTERVAL 6
TARGET TARGET 1
FIT STATISTICS
FIT STATISTIC STATISTIC LABEL
STATISTIC VALUE
_DFT_ Total Degrees of Freedom. 195 _DFE_ Degrees of Freedom for Error. 146 _DFM_ Model Degrees of Freedom. 49 _NW_ Number of Estimated Weights. 49 _AIC_ Akaike's Information Criterion. 179.296 _SBC_ Schwarz's Bayesian Criterion. 339.673 _ASE_ Average Squared Error. 0.061 _MAX_ Maximum Absolute Error. 0.953 _DIV_ Divisor for ASE. 390 _NOBS_ Sum of Frequencies. 195 _RASE_ Root Average Squared Error. 0.248 _SSE_ Sum of Squared Errors. 23.964 _SUMW_ Sum of Case Weights Times Freq. 390 _FPE_ Final Prediction Error. 0.103 _MSE_ Mean Squared Error. 0.082 _RFPE_ Root Final Prediction Error. 0.32 _RMSE_ Root Mean Squared Error. 0.286 _AVERR_ Average Error Function. 0.208 _ERR_ Error Function. 81.296 _MISC_ Misclassification Rate. 0.067 _WRONG_ Number of Wrong Classifications. 13

315
CLASSIFICATION SUMMARY
TARGET PREDICT
PERCENT OF TARGET
PERCENT OF PREDICT COUNT
PERCENT OF TOTAL
BANKRUPT BANKRUPT 93.9024 90.5882 77 39.4872 NONBANKRUPT BANKRUPT 6.0976 4.5455 5 2.5641 BANKRUPT NONBANKRUPT 7.0796 9.4118 8 4.1026 NONBANKRUPT NONBANKRUPT 92.9204 95.4545 105 53.8462
YEAR 5
VARIABLE SUMMARY
ROLE LEVEL COUNT
INPUT INTERVAL 6
TARGET TARGET 1
FIT STATISTICS
FIT STATISTIC STATISTIC LABEL
STATISTIC VALUE
_DFT_ Total Degrees of Freedom. 168 _DFE_ Degrees of Freedom for Error. 119 _DFM_ Model Degrees of Freedom. 49 _NW_ Number of Estimated Weights. 49 _AIC_ Akaike's Information Criterion. 158.573 _SBC_ Schwarz's Bayesian Criterion. 311.647 _ASE_ Average Squared Error. 0.051 _MAX_ Maximum Absolute Error. 0.973 _DIV_ Divisor for ASE. 336 _NOBS_ Sum of Frequencies. 168 _RASE_ Root Average Squared Error. 0.226 _SSE_ Sum of Squared Errors. 17.199 _SUMW_ Sum of Case Weights Times Freq. 336 _FPE_ Final Prediction Error. 0.093 _MSE_ Mean Squared Error. 0.072 _RFPE_ Root Final Prediction Error. 0.306 _RMSE_ Root Mean Squared Error. 0.269 _AVERR_ Average Error Function. 0.18 _ERR_ Error Function. 60.573 _MISC_ Misclassification Rate. 0.048 _WRONG_ Number of Wrong Classifications. 8

316
CLASSIFICATION SUMMARY
TARGET PREDICT
PERCENT OF TARGET
PERCENT OF PREDICT COUNT
PERCENT OF TOTAL
BANKRUPT BANKRUPT 94.2857 94.2857 66 39.2857 NONBANKRUPT BANKRUPT 5.7143 4.0816 4 2.381 BANKRUPT NONBANKRUPT 4.0816 5.7143 4 2.381 NONBANKRUPT NONBANKRUPT 95.9184 95.9184 94 55.9524

317
Results of Multi Layer Perceptron : Variables (Price, Standard deviation, hi lo bid ask spread, net income to sales, working capital to total assets and current liabilities to total assets )
YEAR 1
VARIABLE SUMMARY
ROLE LEVEL COUNT
INPUT INTERVAL 6
TARGET TARGET 1
FIT STATISTICS
FIT STATISTIC STATISTIC LABEL
STATISTIC VALUE
_DFT_ Total Degrees of Freedom. 255 _DFE_ Degrees of Freedom for Error. 206 _DFM_ Model Degrees of Freedom. 49 _NW_ Number of Estimated Weights. 49 _AIC_ Akaike's Information Criterion. 263.773 _SBC_ Schwarz's Bayesian Criterion. 437.295 _ASE_ Average Squared Error. 0.097 _MAX_ Maximum Absolute Error. 0.991 _DIV_ Divisor for ASE. 510 _NOBS_ Sum of Frequencies. 255 _RASE_ Root Average Squared Error. 0.311 _SSE_ Sum of Squared Errors. 49.443 _SUMW_ Sum of Case Weights Times Freq. 510 _FPE_ Final Prediction Error. 0.143 _MSE_ Mean Squared Error. 0.12 _RFPE_ Root Final Prediction Error. 0.378 _RMSE_ Root Mean Squared Error. 0.346 _AVERR_ Average Error Function. 0.325 _ERR_ Error Function. 165.773 _MISC_ Misclassification Rate. 0.118 _WRONG_ Number of Wrong Classifications. 30
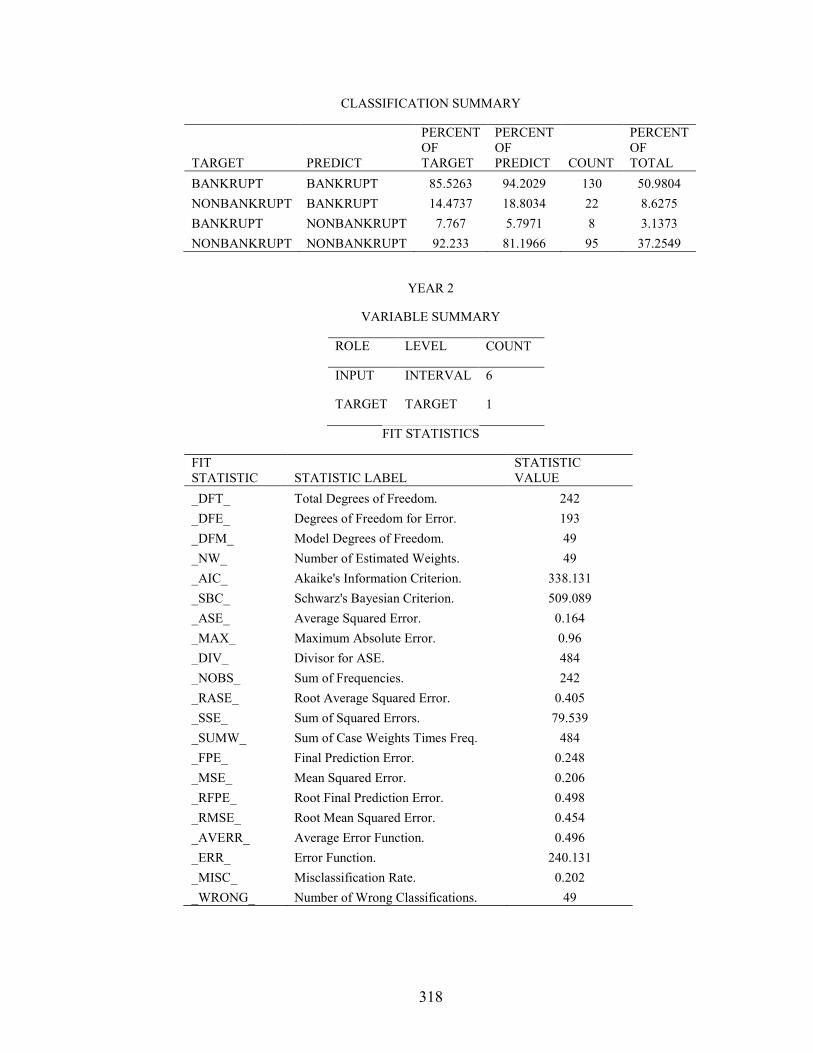
318
CLASSIFICATION SUMMARY
TARGET PREDICT
PERCENT OF TARGET
PERCENT OF PREDICT COUNT
PERCENT OF TOTAL
BANKRUPT BANKRUPT 85.5263 94.2029 130 50.9804 NONBANKRUPT BANKRUPT 14.4737 18.8034 22 8.6275 BANKRUPT NONBANKRUPT 7.767 5.7971 8 3.1373 NONBANKRUPT NONBANKRUPT 92.233 81.1966 95 37.2549
YEAR 2
VARIABLE SUMMARY
ROLE LEVEL COUNT
INPUT INTERVAL 6
TARGET TARGET 1
FIT STATISTICS
FIT STATISTIC STATISTIC LABEL
STATISTIC VALUE
_DFT_ Total Degrees of Freedom. 242 _DFE_ Degrees of Freedom for Error. 193 _DFM_ Model Degrees of Freedom. 49 _NW_ Number of Estimated Weights. 49 _AIC_ Akaike's Information Criterion. 338.131 _SBC_ Schwarz's Bayesian Criterion. 509.089 _ASE_ Average Squared Error. 0.164 _MAX_ Maximum Absolute Error. 0.96 _DIV_ Divisor for ASE. 484 _NOBS_ Sum of Frequencies. 242 _RASE_ Root Average Squared Error. 0.405 _SSE_ Sum of Squared Errors. 79.539 _SUMW_ Sum of Case Weights Times Freq. 484 _FPE_ Final Prediction Error. 0.248 _MSE_ Mean Squared Error. 0.206 _RFPE_ Root Final Prediction Error. 0.498 _RMSE_ Root Mean Squared Error. 0.454 _AVERR_ Average Error Function. 0.496 _ERR_ Error Function. 240.131 _MISC_ Misclassification Rate. 0.202 _WRONG_ Number of Wrong Classifications. 49

319
CLASSIFICATION SUMMARY
TARGET PREDICT
PERCENT OF TARGET
PERCENT OF PREDICT COUNT
PERCENT OF TOTAL
BANKRUPT BANKRUPT 79.8507 82.9457 107 44.2149 NONBANKRUPT BANKRUPT 20.1493 23.8938 27 11.157 BANKRUPT NONBANKRUPT 20.3704 17.0543 22 9.0909 NONBANKRUPT NONBANKRUPT 79.6296 76.1062 86 35.5372
YEAR 3
VARIABLE SUMMARY
ROLE LEVEL COUNT
INPUT INTERVAL 6
TARGET TARGET 1
FIT STATISTICS
FIT STATISTIC STATISTIC LABEL
STATISTIC VALUE
_DFT_ Total Degrees of Freedom. 219 _DFE_ Degrees of Freedom for Error. 170 _DFM_ Model Degrees of Freedom. 49 _NW_ Number of Estimated Weights. 49 _AIC_ Akaike's Information Criterion. 283.966 _SBC_ Schwarz's Bayesian Criterion. 450.03 _ASE_ Average Squared Error. 0.137 _MAX_ Maximum Absolute Error. 0.993 _DIV_ Divisor for ASE. 438 _NOBS_ Sum of Frequencies. 219 _RASE_ Root Average Squared Error. 0.37 _SSE_ Sum of Squared Errors. 59.808 _SUMW_ Sum of Case Weights Times Freq. 438 _FPE_ Final Prediction Error. 0.215 _MSE_ Mean Squared Error. 0.176 _RFPE_ Root Final Prediction Error. 0.464 _RMSE_ Root Mean Squared Error. 0.419 _AVERR_ Average Error Function. 0.425 _ERR_ Error Function. 185.966 _MISC_ Misclassification Rate. 0.192 _WRONG_ Number of Wrong Classifications. 42

320
CLASSIFICATION SUMMARY
TARGET PREDICT
PERCENT OF TARGET
PERCENT OF PREDICT COUNT
PERCENT OF TOTAL
BANKRUPT BANKRUPT 79.4643 82.4074 89 40.6393 NONBANKRUPT BANKRUPT 20.5357 20.7207 23 10.5023 BANKRUPT NONBANKRUPT 17.757 17.5926 19 8.6758 NONBANKRUPT NONBANKRUPT 82.243 79.2793 88 40.1826
YEAR 4
VARIABLE SUMMARY
ROLE LEVEL COUNT
INPUT INTERVAL 6
TARGET TARGET 1
FIT STATISTICS
FIT STATISTIC STATISTIC LABEL
STATISTIC VALUE
_DFT_ Total Degrees of Freedom. 195 _DFE_ Degrees of Freedom for Error. 146 _DFM_ Model Degrees of Freedom. 49 _NW_ Number of Estimated Weights. 49 _AIC_ Akaike's Information Criterion. 246.888 _SBC_ Schwarz's Bayesian Criterion. 407.265 _ASE_ Average Squared Error. 0.121 _MAX_ Maximum Absolute Error. 0.863 _DIV_ Divisor for ASE. 390 _NOBS_ Sum of Frequencies. 195 _RASE_ Root Average Squared Error. 0.348 _SSE_ Sum of Squared Errors. 47.141 _SUMW_ Sum of Case Weights Times Freq. 390 _FPE_ Final Prediction Error. 0.202 _MSE_ Mean Squared Error. 0.161 _RFPE_ Root Final Prediction Error. 0.449 _RMSE_ Root Mean Squared Error. 0.402 _AVERR_ Average Error Function. 0.382 _ERR_ Error Function. 148.888 _MISC_ Misclassification Rate. 0.123 _WRONG_ Number of Wrong Classifications. 24
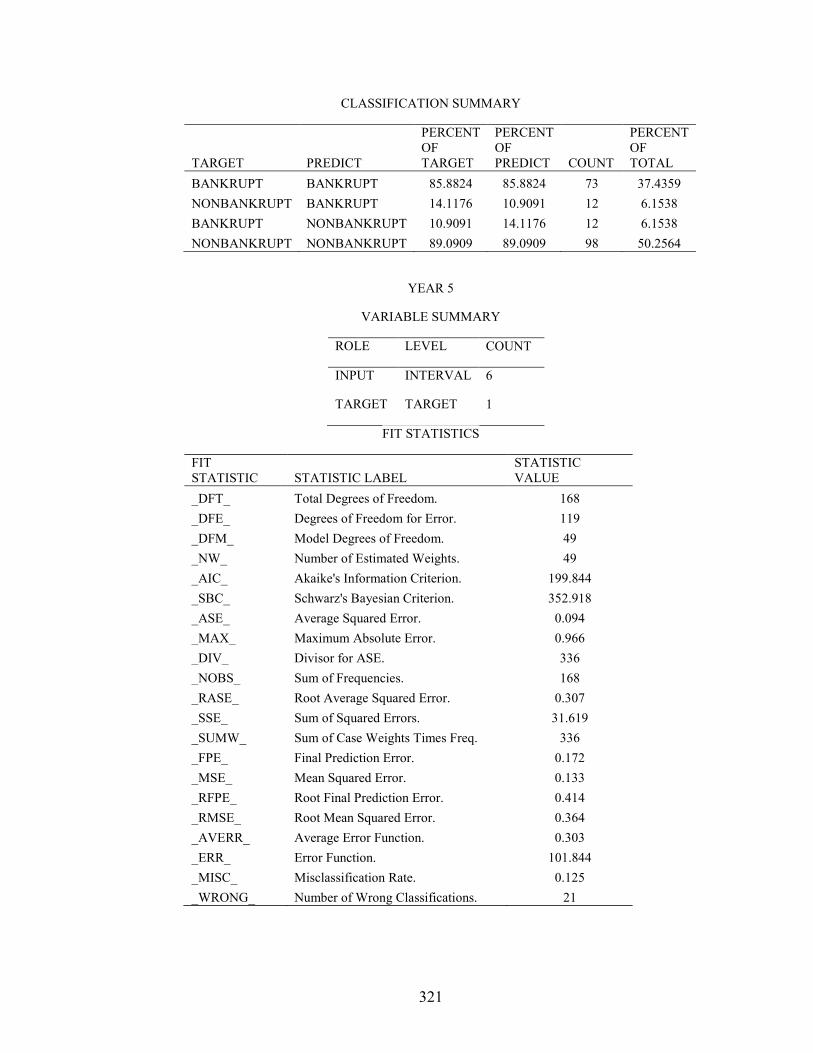
321
CLASSIFICATION SUMMARY
TARGET PREDICT
PERCENT OF TARGET
PERCENT OF PREDICT COUNT
PERCENT OF TOTAL
BANKRUPT BANKRUPT 85.8824 85.8824 73 37.4359 NONBANKRUPT BANKRUPT 14.1176 10.9091 12 6.1538 BANKRUPT NONBANKRUPT 10.9091 14.1176 12 6.1538 NONBANKRUPT NONBANKRUPT 89.0909 89.0909 98 50.2564
YEAR 5
VARIABLE SUMMARY
ROLE LEVEL COUNT
INPUT INTERVAL 6
TARGET TARGET 1
FIT STATISTICS
FIT STATISTIC STATISTIC LABEL
STATISTIC VALUE
_DFT_ Total Degrees of Freedom. 168 _DFE_ Degrees of Freedom for Error. 119 _DFM_ Model Degrees of Freedom. 49 _NW_ Number of Estimated Weights. 49 _AIC_ Akaike's Information Criterion. 199.844 _SBC_ Schwarz's Bayesian Criterion. 352.918 _ASE_ Average Squared Error. 0.094 _MAX_ Maximum Absolute Error. 0.966 _DIV_ Divisor for ASE. 336 _NOBS_ Sum of Frequencies. 168 _RASE_ Root Average Squared Error. 0.307 _SSE_ Sum of Squared Errors. 31.619 _SUMW_ Sum of Case Weights Times Freq. 336 _FPE_ Final Prediction Error. 0.172 _MSE_ Mean Squared Error. 0.133 _RFPE_ Root Final Prediction Error. 0.414 _RMSE_ Root Mean Squared Error. 0.364 _AVERR_ Average Error Function. 0.303 _ERR_ Error Function. 101.844 _MISC_ Misclassification Rate. 0.125 _WRONG_ Number of Wrong Classifications. 21

322
CLASSIFICATION SUMMARY
TARGET PREDICT
PERCENT OF TARGET
PERCENT OF PREDICT COUNT
PERCENT OF TOTAL
BANKRUPT BANKRUPT 82.6667 88.5714 62 36.9048 NONBANKRUPT BANKRUPT 17.3333 13.2653 13 7.7381 BANKRUPT NONBANKRUPT 8.6022 11.4286 8 4.7619 NONBANKRUPT NONBANKRUPT 91.3978 86.7347 85 50.5952
323
The next two sets of variables are those six variables that performed best in both
the univariate analysis and the multivariate discriminant analysis. The two sets contain
price, standard deviation, bid-ask spread, net income to sales, working capital to total
assets, and current liabilities to total assets (the second set is the same as the first, but the
bid-ask spread is measured by the high-low bid-ask spread).
For the first set, the classification rates for the bankrupt firms are 90%, 84%, 82%,
94%, and 94% in years one through five, and 88%, 83%, 85%, 93%, and 96% in years
one through five for the nonbankrupt firms. The overall misclassification rates are 10.6%
and 5% in years one and five, respectively.
For the second set, bankrupt firms in years one through five, respectively, have
the following classification rates: 86%, 80%, 79%, 85%, and 83%. The classification
rates for nonbankrupt firms are 92%, 80%, 82%, 89%, and 91% in years one through
five. The misclassification rates ranges are around 12% in both years one and five. The
high-low bid-ask spread allows the multi-layer perceptron to correctly classify the
nonbankrupt firms better, but it does slightly the opposite for the bankrupt firms.
Therefore, the high-low bid ask spread is less desirable than the end-of-day bid-ask
spread since correctly classifying bankrupt firms is of higher importance.
It is important to note that by adding a few accounting ratios to the input variables
along with price, standard deviation, and bid-ask spread, the model becomes more
accurate than it is with only market variables. While market variables are forward-
looking and account ratios are backward-looking, accounting ratios still contain
information. More importantly, the deterioration and pattern of the account ratios contain
certain information that the market variables do not include. Accounting ratios are also

324
much less noisy than the market variables, not as highly affected by human sentiment and
market movements.
We now direct our attention to the radial basis functions. With the market
variables as the inputs, the classification rates for the bankrupt firms are 80%, 77%, 76%,
84%, and 82%, whereas those for nonbankrupt firms are 84%, 73%, 70%, 86%, and 88%,
from years one to five. The overall misclassification rates are 18% and 15% in years one
and five, respectively.
For the first set of mixed variables, the classification rates for the bankrupt firms
are 83%, 75%, 81%, 90%, and 97%, whereas those for the nonbankrupt firms are 81%,
82%, 71%, 89%, and 91%. The overall misclassification rates are 18% one year before
bankruptcy versus 6.5% five years before bankruptcy. For the second set, the bankruptcy
classification rates for years one through five are 88%, 69%, 72%, 80%, and 88%, while
those of the nonbankrupt firms are 89%, 64%, 70%, 79%, and 81%. The misclassification
rates, overall, are 11.4% and 17% in years one and five, respectively.
While the radial basis function still performs relatively well, the multi-layer
perceptron has higher classification rates for all different input sets and years. This is
likely due to the fact that the parameters of the multi-layer perceptron are non-linear,
while those of the radial basis function are linear. As discussed earlier in this chapter and
in previous chapter, the relations between the variables and the likelihood of bankruptcy
are not linear. This is consistent with the findings in the literature and the previous
chapter.

325
Table 12
Results of Radial Basis Function Networks : Accounting variables
YEAR 1
VARIABLE SUMMARY
ROLE LEVEL COUNT
INPUT INTERVAL 17
TARGET TARGET 1
FIT STATISTICS
FIT STATISTIC STATISTIC LABEL
STATISTIC VALUE
_DFT_ Total Degrees of Freedom. 255 _DFE_ Degrees of Freedom for Error. 141 _DFM_ Model Degrees of Freedom. 114 _NW_ Number of Estimated Weights. 114 _AIC_ Akaike's Information Criterion. 385.235 _SBC_ Schwarz's Bayesian Criterion. 788.939 _ASE_ Average Squared Error. 0.088 _MAX_ Maximum Absolute Error. 0.919 _DIV_ Divisor for ASE. 510 _NOBS_ Sum of Frequencies. 255 _RASE_ Root Average Squared Error. 0.297 _SSE_ Sum of Squared Errors. 45.05 _SUMW_ Sum of Case Weights Times Freq. 510 _FPE_ Final Prediction Error. 0.231 _MSE_ Mean Squared Error. 0.16 _RFPE_ Root Final Prediction Error. 0.481 _RMSE_ Root Mean Squared Error. 0.4 _AVERR_ Average Error Function. 0.308 _ERR_ Error Function. 157.235 _MISC_ Misclassification Rate. 0.098 _WRONG_ Number of Wrong Classifications. 25

326
CLASSIFICATION SUMMARY
TARGET PREDICT
PERCENT OF TARGET
PERCENT OF PREDICT COUNT
PERCENT OF TOTAL
BANKRUPT BANKRUPT 87.4172 95.6522 132 51.7647 NONBANKRUPT BANKRUPT 12.5828 16.2393 19 7.451 BANKRUPT NONBANKRUPT 5.7692 4.3478 6 2.3529 NONBANKRUPT NONBANKRUPT 94.2308 83.7607 98 38.4314
YEAR 2
VARIABLE SUMMARY
ROLE LEVEL COUNT
INPUT INTERVAL 17
TARGET TARGET 1
FIT STATISTICS
FIT STATISTIC STATISTIC LABEL
STATISTIC VALUE
_DFT_ Total Degrees of Freedom. 242 _DFE_ Degrees of Freedom for Error. 128 _DFM_ Model Degrees of Freedom. 114 _NW_ Number of Estimated Weights. 114 _AIC_ Akaike's Information Criterion. 397.3 _SBC_ Schwarz's Bayesian Criterion. 795.039 _ASE_ Average Squared Error. 0.101 _MAX_ Maximum Absolute Error. 0.914 _DIV_ Divisor for ASE. 484 _NOBS_ Sum of Frequencies. 242 _RASE_ Root Average Squared Error. 0.318 _SSE_ Sum of Squared Errors. 48.799 _SUMW_ Sum of Case Weights Times Freq. 484 _FPE_ Final Prediction Error. 0.28 _MSE_ Mean Squared Error. 0.191 _RFPE_ Root Final Prediction Error. 0.53 _RMSE_ Root Mean Squared Error. 0.437 _AVERR_ Average Error Function. 0.35 _ERR_ Error Function. 169.3 _MISC_ Misclassification Rate. 0.116 _WRONG_ Number of Wrong Classifications. 28

327
CLASSIFICATION SUMMARY
TARGET PREDICT
PERCENT OF TARGET
PERCENT OF PREDICT COUNT
PERCENT OF TOTAL
BANKRUPT BANKRUPT 87.4074 91.4729 118 48.7603 NONBANKRUPT BANKRUPT 12.5926 15.0442 17 7.0248 BANKRUPT NONBANKRUPT 10.2804 8.5271 11 4.5455 NONBANKRUPT NONBANKRUPT 89.7196 84.9558 96 39.6694
YEAR 3
VARIABLE SUMMARY
ROLE LEVEL COUNT
INPUT INTERVAL 17
TARGET TARGET 1
FIT STATISTICS
FIT STATISTIC STATISTIC LABEL
STATISTIC VALUE
_DFT_ Total Degrees of Freedom. 219 _DFE_ Degrees of Freedom for Error. 105 _DFM_ Model Degrees of Freedom. 114 _NW_ Number of Estimated Weights. 114 _AIC_ Akaike's Information Criterion. 450.195 _SBC_ Schwarz's Bayesian Criterion. 836.549 _ASE_ Average Squared Error. 0.168 _MAX_ Maximum Absolute Error. 0.936 _DIV_ Divisor for ASE. 438 _NOBS_ Sum of Frequencies. 219 _RASE_ Root Average Squared Error. 0.41 _SSE_ Sum of Squared Errors. 73.669 _SUMW_ Sum of Case Weights Times Freq. 438 _FPE_ Final Prediction Error. 0.533 _MSE_ Mean Squared Error. 0.351 _RFPE_ Root Final Prediction Error. 0.73 _RMSE_ Root Mean Squared Error. 0.592 _AVERR_ Average Error Function. 0.507 _ERR_ Error Function. 222.195 _MISC_ Misclassification Rate. 0.233 _WRONG_ Number of Wrong Classifications. 51

328
CLASSIFICATION SUMMARY
TARGET PREDICT
PERCENT OF TARGET
PERCENT OF PREDICT COUNT
PERCENT OF TOTAL
BANKRUPT BANKRUPT 70.2128 91.6667 99 45.2055 NONBANKRUPT BANKRUPT 29.7872 37.8378 42 19.1781 BANKRUPT NONBANKRUPT 11.5385 8.3333 9 4.1096 NONBANKRUPT NONBANKRUPT 88.4615 62.1622 69 31.5068
YEAR 4
VARIABLE SUMMARY
ROLE LEVEL COUNT
INPUT INTERVAL 17
TARGET TARGET 1
FIT STATISTICS
FIT STATISTIC STATISTIC LABEL
STATISTIC VALUE
_DFT_ Total Degrees of Freedom. 195 _DFE_ Degrees of Freedom for Error. 81 _DFM_ Model Degrees of Freedom. 114 _NW_ Number of Estimated Weights. 114 _AIC_ Akaike's Information Criterion. 412.793 _SBC_ Schwarz's Bayesian Criterion. 785.914 _ASE_ Average Squared Error. 0.158 _MAX_ Maximum Absolute Error. 0.935 _DIV_ Divisor for ASE. 390 _NOBS_ Sum of Frequencies. 195 _RASE_ Root Average Squared Error. 0.398 _SSE_ Sum of Squared Errors. 61.695 _SUMW_ Sum of Case Weights Times Freq. 390 _FPE_ Final Prediction Error. 0.603 _MSE_ Mean Squared Error. 0.381 _RFPE_ Root Final Prediction Error. 0.777 _RMSE_ Root Mean Squared Error. 0.617 _AVERR_ Average Error Function. 0.474 _ERR_ Error Function. 184.793 _MISC_ Misclassification Rate. 0.241 _WRONG_ Number of Wrong Classifications. 47

329
CLASSIFICATION SUMMARY
TARGET PREDICT
PERCENT OF TARGET
PERCENT OF PREDICT COUNT
PERCENT OF TOTAL
BANKRUPT BANKRUPT 70.6522 76.4706 65 33.3333 NONBANKRUPT BANKRUPT 29.3478 24.5455 27 13.8462 BANKRUPT NONBANKRUPT 19.4175 23.5294 20 10.2564 NONBANKRUPT NONBANKRUPT 80.5825 75.4545 83 42.5641
YEAR 5
VARIABLE SUMMARY
ROLE LEVEL COUNT
INPUT INTERVAL 17
TARGET TARGET 1
FIT STATISTICS
FIT STATISTIC STATISTIC LABEL
STATISTIC VALUE
_DFT_ Total Degrees of Freedom. 168 _DFE_ Degrees of Freedom for Error. 54 _DFM_ Model Degrees of Freedom. 114 _NW_ Number of Estimated Weights. 114 _AIC_ Akaike's Information Criterion. 428.477 _SBC_ Schwarz's Bayesian Criterion. 784.609 _ASE_ Average Squared Error. 0.204 _MAX_ Maximum Absolute Error. 0.778 _DIV_ Divisor for ASE. 336 _NOBS_ Sum of Frequencies. 168 _RASE_ Root Average Squared Error. 0.451 _SSE_ Sum of Squared Errors. 68.479 _SUMW_ Sum of Case Weights Times Freq. 336 _FPE_ Final Prediction Error. 1.064 _MSE_ Mean Squared Error. 0.634 _RFPE_ Root Final Prediction Error. 1.032 _RMSE_ Root Mean Squared Error. 0.796 _AVERR_ Average Error Function. 0.597 _ERR_ Error Function. 200.477 _MISC_ Misclassification Rate. 0.292 _WRONG_ Number of Wrong Classifications. 49
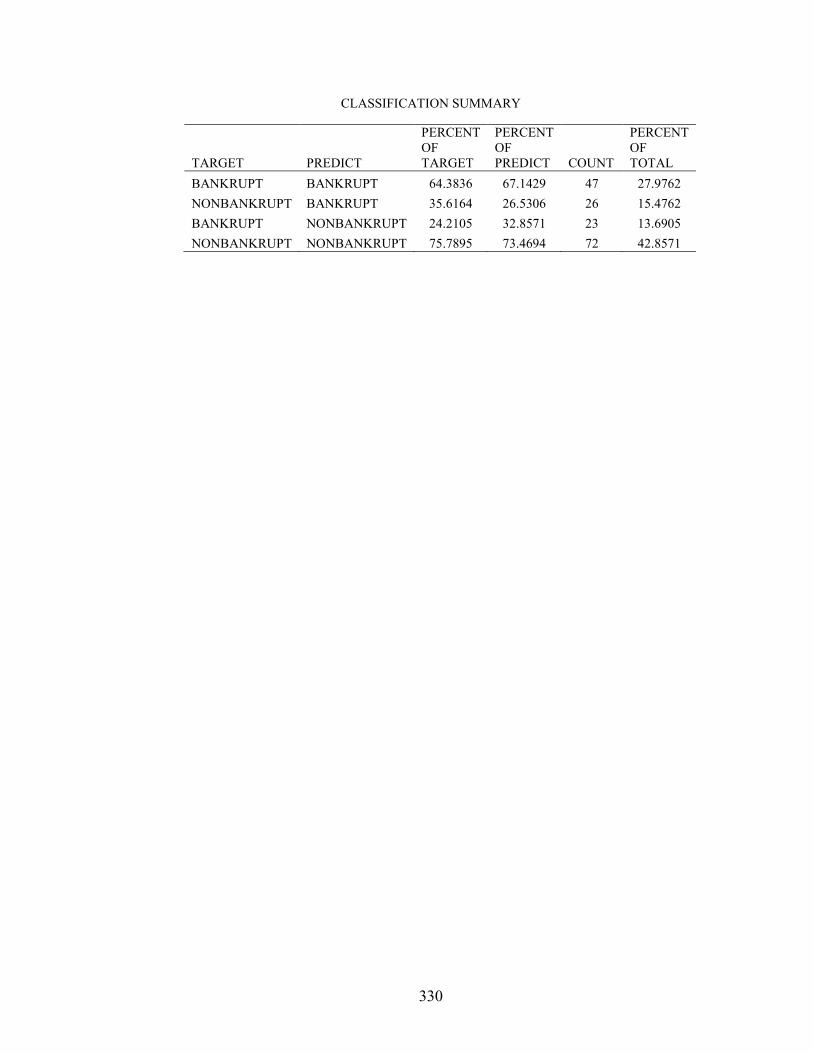
330
CLASSIFICATION SUMMARY
TARGET PREDICT
PERCENT OF TARGET
PERCENT OF PREDICT COUNT
PERCENT OF TOTAL
BANKRUPT BANKRUPT 64.3836 67.1429 47 27.9762 NONBANKRUPT BANKRUPT 35.6164 26.5306 26 15.4762 BANKRUPT NONBANKRUPT 24.2105 32.8571 23 13.6905 NONBANKRUPT NONBANKRUPT 75.7895 73.4694 72 42.8571

331
Results of Radial Basis Function Networks : Market variables
YEAR 1
VARIABLE SUMMARY
ROLE LEVEL COUNT
INPUT INTERVAL 5
TARGET TARGET 1
FIT STATISTICS
FIT STATISTIC STATISTIC LABEL
STATISTIC VALUE
_DFT_ Total Degrees of Freedom. 255 _DFE_ Degrees of Freedom for Error. 213 _DFM_ Model Degrees of Freedom. 42 _NW_ Number of Estimated Weights. 42 _AIC_ Akaike's Information Criterion. 321.332 _SBC_ Schwarz's Bayesian Criterion. 470.065 _ASE_ Average Squared Error. 0.147 _MAX_ Maximum Absolute Error. 0.881 _DIV_ Divisor for ASE. 510 _NOBS_ Sum of Frequencies. 255 _RASE_ Root Average Squared Error. 0.383 _SSE_ Sum of Squared Errors. 74.972 _SUMW_ Sum of Case Weights Times Freq. 510 _FPE_ Final Prediction Error. 0.205 _MSE_ Mean Squared Error. 0.176 _RFPE_ Root Final Prediction Error. 0.453 _RMSE_ Root Mean Squared Error. 0.42 _AVERR_ Average Error Function. 0.465 _ERR_ Error Function. 237.332 _MISC_ Misclassification Rate. 0.18 _WRONG_ Number of Wrong Classifications. 46

332
CLASSIFICATION SUMMARY
TARGET PREDICT
PERCENT OF TARGET
PERCENT OF PREDICT COUNT
PERCENT OF TOTAL
BANKRUPT BANKRUPT 80.2632 88.4058 122 47.8431 NONBANKRUPT BANKRUPT 19.7368 25.641 30 11.7647 BANKRUPT NONBANKRUPT 15.534 11.5942 16 6.2745 NONBANKRUPT NONBANKRUPT 84.466 74.359 87 34.1176
YEAR 2
VARIABLE SUMMARY
ROLE LEVEL COUNT
INPUT INTERVAL 5
TARGET TARGET 1
FIT STATISTICS
FIT STATISTIC STATISTIC LABEL
STATISTIC VALUE
_DFT_ Total Degrees of Freedom. 242 _DFE_ Degrees of Freedom for Error. 200 _DFM_ Model Degrees of Freedom. 42 _NW_ Number of Estimated Weights. 42 _AIC_ Akaike's Information Criterion. 353.263 _SBC_ Schwarz's Bayesian Criterion. 499.798 _ASE_ Average Squared Error. 0.185 _MAX_ Maximum Absolute Error. 0.834 _DIV_ Divisor for ASE. 484 _NOBS_ Sum of Frequencies. 242 _RASE_ Root Average Squared Error. 0.43 _SSE_ Sum of Squared Errors. 89.692 _SUMW_ Sum of Case Weights Times Freq. 484 _FPE_ Final Prediction Error. 0.263 _MSE_ Mean Squared Error. 0.224 _RFPE_ Root Final Prediction Error. 0.513 _RMSE_ Root Mean Squared Error. 0.474 _AVERR_ Average Error Function. 0.556 _ERR_ Error Function. 269.263 _MISC_ Misclassification Rate. 0.244 _WRONG_ Number of Wrong Classifications. 59

333
CLASSIFICATION SUMMARY
TARGET PREDICT
PERCENT OF TARGET
PERCENT OF PREDICT COUNT
PERCENT OF TOTAL
BANKRUPT BANKRUPT 77.3438 76.7442 99 40.9091 NONBANKRUPT BANKRUPT 22.6563 25.6637 29 11.9835 BANKRUPT NONBANKRUPT 26.3158 23.2558 30 12.3967 NONBANKRUPT NONBANKRUPT 73.6842 74.3363 84 34.7107
YEAR 3
VARIABLE SUMMARY
ROLE LEVEL COUNT
INPUT INTERVAL 5
TARGET TARGET 1
FIT STATISTICS
FIT STATISTIC STATISTIC LABEL
STATISTIC VALUE
_DFT_ Total Degrees of Freedom. 219 _DFE_ Degrees of Freedom for Error. 177 _DFM_ Model Degrees of Freedom. 42 _NW_ Number of Estimated Weights. 42 _AIC_ Akaike's Information Criterion. 330.372 _SBC_ Schwarz's Bayesian Criterion. 472.713 _ASE_ Average Squared Error. 0.19 _MAX_ Maximum Absolute Error. 0.872 _DIV_ Divisor for ASE. 438 _NOBS_ Sum of Frequencies. 219 _RASE_ Root Average Squared Error. 0.435 _SSE_ Sum of Squared Errors. 83.046 _SUMW_ Sum of Case Weights Times Freq. 438 _FPE_ Final Prediction Error. 0.28 _MSE_ Mean Squared Error. 0.235 _RFPE_ Root Final Prediction Error. 0.529 _RMSE_ Root Mean Squared Error. 0.484 _AVERR_ Average Error Function. 0.562 _ERR_ Error Function. 246.372 _MISC_ Misclassification Rate. 0.269 _WRONG_ Number of Wrong Classifications. 59

334
CLASSIFICATION SUMMARY
TARGET PREDICT
PERCENT OF TARGET
PERCENT OF PREDICT COUNT
PERCENT OF TOTAL
BANKRUPT BANKRUPT 77.5281 63.8889 69 31.5068 NONBANKRUPT BANKRUPT 22.4719 18.018 20 9.1324 BANKRUPT NONBANKRUPT 30 36.1111 39 17.8082 NONBANKRUPT NONBANKRUPT 70 81.982 91 41.5525
YEAR 4
VARIABLE SUMMARY
ROLE LEVEL COUNT
INPUT INTERVAL 5
TARGET TARGET 1
FIT STATISTICS
FIT STATISTIC STATISTIC LABEL
STATISTIC VALUE
_DFT_ Total Degrees of Freedom. 195 _DFE_ Degrees of Freedom for Error. 153 _DFM_ Model Degrees of Freedom. 42 _NW_ Number of Estimated Weights. 42 _AIC_ Akaike's Information Criterion. 237.763 _SBC_ Schwarz's Bayesian Criterion. 375.229 _ASE_ Average Squared Error. 0.119 _MAX_ Maximum Absolute Error. 0.916 _DIV_ Divisor for ASE. 390 _NOBS_ Sum of Frequencies. 195 _RASE_ Root Average Squared Error. 0.345 _SSE_ Sum of Squared Errors. 46.441 _SUMW_ Sum of Case Weights Times Freq. 390 _FPE_ Final Prediction Error. 0.184 _MSE_ Mean Squared Error. 0.152 _RFPE_ Root Final Prediction Error. 0.429 _RMSE_ Root Mean Squared Error. 0.39 _AVERR_ Average Error Function. 0.394 _ERR_ Error Function. 153.763 _MISC_ Misclassification Rate. 0.149 _WRONG_ Number of Wrong Classifications. 29

335
CLASSIFICATION SUMMARY
TARGET PREDICT
PERCENT OF TARGET
PERCENT OF PREDICT COUNT
PERCENT OF TOTAL
BANKRUPT BANKRUPT 84.1463 81.1765 69 35.3846 NONBANKRUPT BANKRUPT 15.8537 11.8182 13 6.6667 BANKRUPT NONBANKRUPT 14.1593 18.8235 16 8.2051 NONBANKRUPT NONBANKRUPT 85.8407 88.1818 97 49.7436
YEAR 5
VARIABLE SUMMARY
ROLE LEVEL COUNT
INPUT INTERVAL 5
TARGET TARGET 1
FIT STATISTICS
FIT STATISTIC STATISTIC LABEL
STATISTIC VALUE
_DFT_ Total Degrees of Freedom. 168 _DFE_ Degrees of Freedom for Error. 126 _DFM_ Model Degrees of Freedom. 42 _NW_ Number of Estimated Weights. 42 _AIC_ Akaike's Information Criterion. 219.788 _SBC_ Schwarz's Bayesian Criterion. 350.995 _ASE_ Average Squared Error. 0.122 _MAX_ Maximum Absolute Error. 0.913 _DIV_ Divisor for ASE. 336 _NOBS_ Sum of Frequencies. 168 _RASE_ Root Average Squared Error. 0.349 _SSE_ Sum of Squared Errors. 40.892 _SUMW_ Sum of Case Weights Times Freq. 336 _FPE_ Final Prediction Error. 0.203 _MSE_ Mean Squared Error. 0.162 _RFPE_ Root Final Prediction Error. 0.45 _RMSE_ Root Mean Squared Error. 0.403 _AVERR_ Average Error Function. 0.404 _ERR_ Error Function. 135.788 _MISC_ Misclassification Rate. 0.149 _WRONG_ Number of Wrong Classifications. 25

336
CLASSIFICATION SUMMARY
TARGET PREDICT
PERCENT OF TARGET
PERCENT OF PREDICT COUNT
PERCENT OF TOTAL
BANKRUPT BANKRUPT 81.6901 82.8571 58 34.5238 NONBANKRUPT BANKRUPT 18.3099 13.2653 13 7.7381 BANKRUPT NONBANKRUPT 12.3711 17.1429 12 7.1429 NONBANKRUPT NONBANKRUPT 87.6289 86.7347 85 50.5952

337
Results of Radial Basis Function Networks : Market variables without spread and hi lo bid ask spread
YEAR 1
VARIABLE SUMMARY
ROLE LEVEL COUNT
INPUT INTERVAL 4
TARGET TARGET 1
FIT STATISTICS
FIT STATISTIC STATISTIC LABEL
STATISTIC VALUE
_DFT_ Total Degrees of Freedom. 255 _DFE_ Degrees of Freedom for Error. 219 _DFM_ Model Degrees of Freedom. 36 _NW_ Number of Estimated Weights. 36 _AIC_ Akaike's Information Criterion. 334.768 _SBC_ Schwarz's Bayesian Criterion. 462.253 _ASE_ Average Squared Error. 0.169 _MAX_ Maximum Absolute Error. 0.879 _DIV_ Divisor for ASE. 510 _NOBS_ Sum of Frequencies. 255 _RASE_ Root Average Squared Error. 0.411 _SSE_ Sum of Squared Errors. 86.194 _SUMW_ Sum of Case Weights Times Freq. 510 _FPE_ Final Prediction Error. 0.225 _MSE_ Mean Squared Error. 0.197 _RFPE_ Root Final Prediction Error. 0.474 _RMSE_ Root Mean Squared Error. 0.444 _AVERR_ Average Error Function. 0.515 _ERR_ Error Function. 262.768 _MISC_ Misclassification Rate. 0.259 _WRONG_ Number of Wrong Classifications. 66

338
CLASSIFICATION SUMMARY
TARGET PREDICT
PERCENT OF TARGET
PERCENT OF PREDICT COUNT
PERCENT OF TOTAL
BANKRUPT BANKRUPT 74 80.4348 111 43.5294 NONBANKRUPT BANKRUPT 26 33.3333 39 15.2941 BANKRUPT NONBANKRUPT 25.7143 19.5652 27 10.5882 NONBANKRUPT NONBANKRUPT 74.2857 66.6667 78 30.5882
YEAR 2
VARIABLE SUMMARY
ROLE LEVEL COUNT
INPUT INTERVAL 4
TARGET TARGET 1
FIT STATISTICS
FIT STATISTIC STATISTIC LABEL
STATISTIC VALUE
_DFT_ Total Degrees of Freedom. 242 _DFE_ Degrees of Freedom for Error. 206 _DFM_ Model Degrees of Freedom. 36 _NW_ Number of Estimated Weights. 36 _AIC_ Akaike's Information Criterion. 314.49 _SBC_ Schwarz's Bayesian Criterion. 440.092 _ASE_ Average Squared Error. 0.162 _MAX_ Maximum Absolute Error. 0.89 _DIV_ Divisor for ASE. 484 _NOBS_ Sum of Frequencies. 242 _RASE_ Root Average Squared Error. 0.403 _SSE_ Sum of Squared Errors. 78.621 _SUMW_ Sum of Case Weights Times Freq. 484 _FPE_ Final Prediction Error. 0.219 _MSE_ Mean Squared Error. 0.191 _RFPE_ Root Final Prediction Error. 0.468 _RMSE_ Root Mean Squared Error. 0.437 _AVERR_ Average Error Function. 0.501 _ERR_ Error Function. 242.49 _MISC_ Misclassification Rate. 0.231 _WRONG_ Number of Wrong Classifications. 56

339
CLASSIFICATION SUMMARY
TARGET PREDICT
PERCENT OF TARGET
PERCENT OF PREDICT COUNT
PERCENT OF TOTAL
BANKRUPT BANKRUPT 76.6423 81.3953 105 43.3884 NONBANKRUPT BANKRUPT 23.3577 28.3186 32 13.2231 BANKRUPT NONBANKRUPT 22.8571 18.6047 24 9.9174 NONBANKRUPT NONBANKRUPT 77.1429 71.6814 81 33.4711
YEAR 3
VARIABLE SUMMARY
ROLE LEVEL COUNT
INPUT INTERVAL 4
TARGET TARGET 1
FIT STATISTICS
FIT STATISTIC STATISTIC LABEL
STATISTIC VALUE
_DFT_ Total Degrees of Freedom. 219 _DFE_ Degrees of Freedom for Error. 183 _DFM_ Model Degrees of Freedom. 36 _NW_ Number of Estimated Weights. 36 _AIC_ Akaike's Information Criterion. 309.794 _SBC_ Schwarz's Bayesian Criterion. 431.801 _ASE_ Average Squared Error. 0.182 _MAX_ Maximum Absolute Error. 0.92 _DIV_ Divisor for ASE. 438 _NOBS_ Sum of Frequencies. 219 _RASE_ Root Average Squared Error. 0.427 _SSE_ Sum of Squared Errors. 79.835 _SUMW_ Sum of Case Weights Times Freq. 438 _FPE_ Final Prediction Error. 0.254 _MSE_ Mean Squared Error. 0.218 _RFPE_ Root Final Prediction Error. 0.504 _RMSE_ Root Mean Squared Error. 0.467 _AVERR_ Average Error Function. 0.543 _ERR_ Error Function. 237.794 _MISC_ Misclassification Rate. 0.269 _WRONG_ Number of Wrong Classifications. 59

340
CLASSIFICATION SUMMARY
TARGET PREDICT
PERCENT OF TARGET
PERCENT OF PREDICT COUNT
PERCENT OF TOTAL
BANKRUPT BANKRUPT 76.9231 64.8148 70 31.9635 NONBANKRUPT BANKRUPT 23.0769 18.9189 21 9.589 BANKRUPT NONBANKRUPT 29.6875 35.1852 38 17.3516 NONBANKRUPT NONBANKRUPT 70.3125 81.0811 90 41.0959
YEAR 4
VARIABLE SUMMARY
ROLE LEVEL COUNT
INPUT INTERVAL 4
TARGET TARGET 1
FIT STATISTICS
FIT STATISTIC STATISTIC LABEL
STATISTIC VALUE
_DFT_ Total Degrees of Freedom. 195 _DFE_ Degrees of Freedom for Error. 159 _DFM_ Model Degrees of Freedom. 36 _NW_ Number of Estimated Weights. 36 _AIC_ Akaike's Information Criterion. 220.204 _SBC_ Schwarz's Bayesian Criterion. 338.032 _ASE_ Average Squared Error. 0.115 _MAX_ Maximum Absolute Error. 0.936 _DIV_ Divisor for ASE. 390 _NOBS_ Sum of Frequencies. 195 _RASE_ Root Average Squared Error. 0.339 _SSE_ Sum of Squared Errors. 44.913 _SUMW_ Sum of Case Weights Times Freq. 390 _FPE_ Final Prediction Error. 0.167 _MSE_ Mean Squared Error. 0.141 _RFPE_ Root Final Prediction Error. 0.409 _RMSE_ Root Mean Squared Error. 0.376 _AVERR_ Average Error Function. 0.38 _ERR_ Error Function. 148.204 _MISC_ Misclassification Rate. 0.154 _WRONG_ Number of Wrong Classifications. 30

341
CLASSIFICATION SUMMARY
TARGET PREDICT
PERCENT OF TARGET
PERCENT OF PREDICT COUNT
PERCENT OF TOTAL
BANKRUPT BANKRUPT 83.1325 81.1765 69 35.3846 NONBANKRUPT BANKRUPT 16.8675 12.7273 14 7.1795 BANKRUPT NONBANKRUPT 14.2857 18.8235 16 8.2051 NONBANKRUPT NONBANKRUPT 85.7143 87.2727 96 49.2308
YEAR 5
VARIABLE SUMMARY
ROLE LEVEL COUNT
INPUT INTERVAL 4
TARGET TARGET 1
FIT STATISTICS
FIT STATISTIC STATISTIC LABEL
STATISTIC VALUE
_DFT_ Total Degrees of Freedom. 168 _DFE_ Degrees of Freedom for Error. 132 _DFM_ Model Degrees of Freedom. 36 _NW_ Number of Estimated Weights. 36 _AIC_ Akaike's Information Criterion. 203.775 _SBC_ Schwarz's Bayesian Criterion. 316.238 _ASE_ Average Squared Error. 0.118 _MAX_ Maximum Absolute Error. 0.934 _DIV_ Divisor for ASE. 336 _NOBS_ Sum of Frequencies. 168 _RASE_ Root Average Squared Error. 0.344 _SSE_ Sum of Squared Errors. 39.754 _SUMW_ Sum of Case Weights Times Freq. 336 _FPE_ Final Prediction Error. 0.183 _MSE_ Mean Squared Error. 0.151 _RFPE_ Root Final Prediction Error. 0.428 _RMSE_ Root Mean Squared Error. 0.388 _AVERR_ Average Error Function. 0.392 _ERR_ Error Function. 131.775 _MISC_ Misclassification Rate. 0.137 _WRONG_ Number of Wrong Classifications. 23

342
CLASSIFICATION SUMMARY
TARGET PREDICT
PERCENT OF TARGET
PERCENT OF PREDICT COUNT
PERCENT OF TOTAL
BANKRUPT BANKRUPT 83.0986 84.2857 59 35.119 NONBANKRUPT BANKRUPT 16.9014 12.2449 12 7.1429 BANKRUPT NONBANKRUPT 11.3402 15.7143 11 6.5476 NONBANKRUPT NONBANKRUPT 88.6598 87.7551 86 51.1905

343
Results of Radial Basis Function Networks : Market variables without spread and bid ask spread
YEAR 1
VARIABLE SUMMARY
ROLE LEVEL COUNT
INPUT INTERVAL 4
TARGET TARGET 1
FIT STATISTICS
FIT STATISTIC STATISTIC LABEL
STATISTIC VALUE
_DFT_ Total Degrees of Freedom. 255 _DFE_ Degrees of Freedom for Error. 219 _DFM_ Model Degrees of Freedom. 36 _NW_ Number of Estimated Weights. 36 _AIC_ Akaike's Information Criterion. 310.732 _SBC_ Schwarz's Bayesian Criterion. 438.218 _ASE_ Average Squared Error. 0.149 _MAX_ Maximum Absolute Error. 0.916 _DIV_ Divisor for ASE. 510 _NOBS_ Sum of Frequencies. 255 _RASE_ Root Average Squared Error. 0.386 _SSE_ Sum of Squared Errors. 75.953 _SUMW_ Sum of Case Weights Times Freq. 510 _FPE_ Final Prediction Error. 0.198 _MSE_ Mean Squared Error. 0.173 _RFPE_ Root Final Prediction Error. 0.445 _RMSE_ Root Mean Squared Error. 0.416 _AVERR_ Average Error Function. 0.468 _ERR_ Error Function. 238.732 _MISC_ Misclassification Rate. 0.2 _WRONG_ Number of Wrong Classifications. 51

344
CLASSIFICATION SUMMARY
TARGET PREDICT
PERCENT OF TARGET
PERCENT OF PREDICT COUNT
PERCENT OF TOTAL
BANKRUPT BANKRUPT 79.1946 85.5072 118 46.2745 NONBANKRUPT BANKRUPT 20.8054 26.4957 31 12.1569 BANKRUPT NONBANKRUPT 18.8679 14.4928 20 7.8431 NONBANKRUPT NONBANKRUPT 81.1321 73.5043 86 33.7255
YEAR 2
VARIABLE SUMMARY
ROLE LEVEL COUNT
INPUT INTERVAL 4
TARGET TARGET 1
FIT STATISTICS
FIT STATISTIC STATISTIC LABEL
STATISTIC VALUE
_DFT_ Total Degrees of Freedom. 242 _DFE_ Degrees of Freedom for Error. 206 _DFM_ Model Degrees of Freedom. 36 _NW_ Number of Estimated Weights. 36 _AIC_ Akaike's Information Criterion. 368.383 _SBC_ Schwarz's Bayesian Criterion. 493.984 _ASE_ Average Squared Error. 0.212 _MAX_ Maximum Absolute Error. 0.799 _DIV_ Divisor for ASE. 484 _NOBS_ Sum of Frequencies. 242 _RASE_ Root Average Squared Error. 0.461 _SSE_ Sum of Squared Errors. 102.671 _SUMW_ Sum of Case Weights Times Freq. 484 _FPE_ Final Prediction Error. 0.286 _MSE_ Mean Squared Error. 0.249 _RFPE_ Root Final Prediction Error. 0.535 _RMSE_ Root Mean Squared Error. 0.499 _AVERR_ Average Error Function. 0.612 _ERR_ Error Function. 296.383 _MISC_ Misclassification Rate. 0.326 _WRONG_ Number of Wrong Classifications. 79

345
CLASSIFICATION SUMMARY
TARGET PREDICT
PERCENT OF TARGET
PERCENT OF PREDICT COUNT
PERCENT OF TOTAL
BANKRUPT BANKRUPT 65.625 81.3953 105 43.3884 NONBANKRUPT BANKRUPT 34.375 48.6726 55 22.7273 BANKRUPT NONBANKRUPT 29.2683 18.6047 24 9.9174 NONBANKRUPT NONBANKRUPT 70.7317 51.3274 58 23.9669
YEAR 3
VARIABLE SUMMARY
ROLE LEVEL COUNT
INPUT INTERVAL 4
TARGET TARGET 1
FIT STATISTICS
FIT STATISTIC STATISTIC LABEL
STATISTIC VALUE
_DFT_ Total Degrees of Freedom. 219 _DFE_ Degrees of Freedom for Error. 183 _DFM_ Model Degrees of Freedom. 36 _NW_ Number of Estimated Weights. 36 _AIC_ Akaike's Information Criterion. 335.846 _SBC_ Schwarz's Bayesian Criterion. 457.853 _ASE_ Average Squared Error. 0.208 _MAX_ Maximum Absolute Error. 0.807 _DIV_ Divisor for ASE. 438 _NOBS_ Sum of Frequencies. 219 _RASE_ Root Average Squared Error. 0.457 _SSE_ Sum of Squared Errors. 91.289 _SUMW_ Sum of Case Weights Times Freq. 438 _FPE_ Final Prediction Error. 0.29 _MSE_ Mean Squared Error. 0.249 _RFPE_ Root Final Prediction Error. 0.539 _RMSE_ Root Mean Squared Error. 0.499 _AVERR_ Average Error Function. 0.602 _ERR_ Error Function. 263.846 _MISC_ Misclassification Rate. 0.297 _WRONG_ Number of Wrong Classifications. 65

346
CLASSIFICATION SUMMARY
TARGET PREDICT
PERCENT OF TARGET
PERCENT OF PREDICT COUNT
PERCENT OF TOTAL
BANKRUPT BANKRUPT 66.4122 80.5556 87 39.726 NONBANKRUPT BANKRUPT 33.5878 39.6396 44 20.0913 BANKRUPT NONBANKRUPT 23.8636 19.4444 21 9.589 NONBANKRUPT NONBANKRUPT 76.1364 60.3604 67 30.5936
YEAR 4
VARIABLE SUMMARY
ROLE LEVEL COUNT
INPUT INTERVAL 4
TARGET TARGET 1
FIT STATISTICS
FIT STATISTIC STATISTIC LABEL
STATISTIC VALUE
_DFT_ Total Degrees of Freedom. 195 _DFE_ Degrees of Freedom for Error. 159 _DFM_ Model Degrees of Freedom. 36 _NW_ Number of Estimated Weights. 36 _AIC_ Akaike's Information Criterion. 289.662 _SBC_ Schwarz's Bayesian Criterion. 407.49 _ASE_ Average Squared Error. 0.19 _MAX_ Maximum Absolute Error. 0.925 _DIV_ Divisor for ASE. 390 _NOBS_ Sum of Frequencies. 195 _RASE_ Root Average Squared Error. 0.436 _SSE_ Sum of Squared Errors. 74.08 _SUMW_ Sum of Case Weights Times Freq. 390 _FPE_ Final Prediction Error. 0.276 _MSE_ Mean Squared Error. 0.233 _RFPE_ Root Final Prediction Error. 0.525 _RMSE_ Root Mean Squared Error. 0.483 _AVERR_ Average Error Function. 0.558 _ERR_ Error Function. 217.662 _MISC_ Misclassification Rate. 0.277 _WRONG_ Number of Wrong Classifications. 54

347
CLASSIFICATION SUMMARY
TARGET PREDICT
PERCENT OF TARGET
PERCENT OF PREDICT COUNT
PERCENT OF TOTAL
BANKRUPT BANKRUPT 67.4157 70.5882 60 30.7692 NONBANKRUPT BANKRUPT 32.5843 26.3636 29 14.8718 BANKRUPT NONBANKRUPT 23.5849 29.4118 25 12.8205 NONBANKRUPT NONBANKRUPT 76.4151 73.6364 81 41.5385
YEAR 5
VARIABLE SUMMARY
ROLE LEVEL COUNT
INPUT INTERVAL 4
TARGET TARGET 1
FIT STATISTICS
FIT STATISTIC STATISTIC LABEL
STATISTIC VALUE
_DFT_ Total Degrees of Freedom. 168 _DFE_ Degrees of Freedom for Error. 132 _DFM_ Model Degrees of Freedom. 36 _NW_ Number of Estimated Weights. 36 _AIC_ Akaike's Information Criterion. 267.413 _SBC_ Schwarz's Bayesian Criterion. 379.876 _ASE_ Average Squared Error. 0.199 _MAX_ Maximum Absolute Error. 0.877 _DIV_ Divisor for ASE. 336 _NOBS_ Sum of Frequencies. 168 _RASE_ Root Average Squared Error. 0.446 _SSE_ Sum of Squared Errors. 66.699 _SUMW_ Sum of Case Weights Times Freq. 336 _FPE_ Final Prediction Error. 0.307 _MSE_ Mean Squared Error. 0.253 _RFPE_ Root Final Prediction Error. 0.554 _RMSE_ Root Mean Squared Error. 0.503 _AVERR_ Average Error Function. 0.582 _ERR_ Error Function. 195.413 _MISC_ Misclassification Rate. 0.292 _WRONG_ Number of Wrong Classifications. 49

348
CLASSIFICATION SUMMARY
TARGET PREDICT
PERCENT OF TARGET
PERCENT OF PREDICT COUNT
PERCENT OF TOTAL
BANKRUPT BANKRUPT 65.6716 62.8571 44 26.1905 NONBANKRUPT BANKRUPT 34.3284 23.4694 23 13.6905 BANKRUPT NONBANKRUPT 25.7426 37.1429 26 15.4762 NONBANKRUPT NONBANKRUPT 74.2574 76.5306 75 44.6429

349
Results of Radial Basis Function Networks : Market variables without bid ask spread and hi lo bid ask spread
YEAR 1
VARIABLE SUMMARY
ROLE LEVEL COUNT
INPUT INTERVAL 4
TARGET TARGET 1
FIT STATISTICS
FIT STATISTIC STATISTIC LABEL
STATISTIC VALUE
_DFT_ Total Degrees of Freedom. 255 _DFE_ Degrees of Freedom for Error. 219 _DFM_ Model Degrees of Freedom. 36 _NW_ Number of Estimated Weights. 36 _AIC_ Akaike's Information Criterion. 362.741 _SBC_ Schwarz's Bayesian Criterion. 490.227 _ASE_ Average Squared Error. 0.194 _MAX_ Maximum Absolute Error. 0.888 _DIV_ Divisor for ASE. 510 _NOBS_ Sum of Frequencies. 255 _RASE_ Root Average Squared Error. 0.44 _SSE_ Sum of Squared Errors. 98.93 _SUMW_ Sum of Case Weights Times Freq. 510 _FPE_ Final Prediction Error. 0.258 _MSE_ Mean Squared Error. 0.226 _RFPE_ Root Final Prediction Error. 0.508 _RMSE_ Root Mean Squared Error. 0.475 _AVERR_ Average Error Function. 0.57 _ERR_ Error Function. 290.741 _MISC_ Misclassification Rate. 0.294 _WRONG_ Number of Wrong Classifications. 75

350
CLASSIFICATION SUMMARY
TARGET PREDICT
PERCENT OF TARGET
PERCENT OF PREDICT COUNT
PERCENT OF TOTAL
BANKRUPT BANKRUPT 76.0331 66.6667 92 36.0784 NONBANKRUPT BANKRUPT 23.9669 24.7863 29 11.3725 BANKRUPT NONBANKRUPT 34.3284 33.3333 46 18.0392 NONBANKRUPT NONBANKRUPT 65.6716 75.2137 88 34.5098
YEAR 2
VARIABLE SUMMARY
ROLE LEVEL COUNT
INPUT INTERVAL 4
TARGET TARGET 1
FIT STATISTICS
FIT STATISTIC STATISTIC LABEL
STATISTIC VALUE
_DFT_ Total Degrees of Freedom. 242 _DFE_ Degrees of Freedom for Error. 206 _DFM_ Model Degrees of Freedom. 36 _NW_ Number of Estimated Weights. 36 _AIC_ Akaike's Information Criterion. 373.013 _SBC_ Schwarz's Bayesian Criterion. 498.615 _ASE_ Average Squared Error. 0.216 _MAX_ Maximum Absolute Error. 0.76 _DIV_ Divisor for ASE. 484 _NOBS_ Sum of Frequencies. 242 _RASE_ Root Average Squared Error. 0.465 _SSE_ Sum of Squared Errors. 104.485 _SUMW_ Sum of Case Weights Times Freq. 484 _FPE_ Final Prediction Error. 0.291 _MSE_ Mean Squared Error. 0.254 _RFPE_ Root Final Prediction Error. 0.54 _RMSE_ Root Mean Squared Error. 0.504 _AVERR_ Average Error Function. 0.622 _ERR_ Error Function. 301.013 _MISC_ Misclassification Rate. 0.326 _WRONG_ Number of Wrong Classifications. 79

351
CLASSIFICATON SUMMARY
TARGET PREDICT
PERCENT OF TARGET
PERCENT OF PREDICT COUNT
PERCENT OF TOTAL
BANKRUPT BANKRUPT 67.8571 73.6434 95 39.2562 NONBANKRUPT BANKRUPT 32.1429 39.823 45 18.595 BANKRUPT NONBANKRUPT 33.3333 26.3566 34 14.0496 NONBANKRUPT NONBANKRUPT 66.6667 60.177 68 28.0992
YEAR 3
VARIABLE SUMMARY
ROLE LEVEL COUNT
INPUT INTERVAL 4
TARGET TARGET 1
FIT STATISTICS
FIT STATISTIC STATISTIC LABEL
STATISTIC VALUE
_DFT_ Total Degrees of Freedom. 219 _DFE_ Degrees of Freedom for Error. 183 _DFM_ Model Degrees of Freedom. 36 _NW_ Number of Estimated Weights. 36 _AIC_ Akaike's Information Criterion. 347.577 _SBC_ Schwarz's Bayesian Criterion. 469.584 _ASE_ Average Squared Error. 0.219 _MAX_ Maximum Absolute Error. 0.807 _DIV_ Divisor for ASE. 438 _NOBS_ Sum of Frequencies. 219 _RASE_ Root Average Squared Error. 0.468 _SSE_ Sum of Squared Errors. 95.907 _SUMW_ Sum of Case Weights Times Freq. 438 _FPE_ Final Prediction Error. 0.305 _MSE_ Mean Squared Error. 0.262 _RFPE_ Root Final Prediction Error. 0.552 _RMSE_ Root Mean Squared Error. 0.512 _AVERR_ Average Error Function. 0.629 _ERR_ Error Function. 275.577 _MISC_ Misclassification Rate. 0.32 _WRONG_ Number of Wrong Classifications. 70

352
CLASSIFICATION SUMMARY
TARGET PREDICT
PERCENT OF TARGET
PERCENT OF PREDICT COUNT
PERCENT OF TOTAL
BANKRUPT BANKRUPT 66.1017 72.2222 78 35.6164 NONBANKRUPT BANKRUPT 33.8983 36.036 40 18.2648 BANKRUPT NONBANKRUPT 29.703 27.7778 30 13.6986 NONBANKRUPT NONBANKRUPT 70.297 63.964 71 32.4201
YEAR 4
VARIABLE SUMMARY
ROLE LEVEL COUNT
INPUT INTERVAL 4
TARGET TARGET 1
FIT STATISTICS
FIT STATISTIC STATISTIC LABEL
STATISTIC VALUE
_DFT_ Total Degrees of Freedom. 195 _DFE_ Degrees of Freedom for Error. 159 _DFM_ Model Degrees of Freedom. 36 _NW_ Number of Estimated Weights. 36 _AIC_ Akaike's Information Criterion. 293.73 _SBC_ Schwarz's Bayesian Criterion. 411.558 _ASE_ Average Squared Error. 0.194 _MAX_ Maximum Absolute Error. 0.936 _DIV_ Divisor for ASE. 390 _NOBS_ Sum of Frequencies. 195 _RASE_ Root Average Squared Error. 0.441 _SSE_ Sum of Squared Errors. 75.726 _SUMW_ Sum of Case Weights Times Freq. 390 _FPE_ Final Prediction Error. 0.282 _MSE_ Mean Squared Error. 0.238 _RFPE_ Root Final Prediction Error. 0.531 _RMSE_ Root Mean Squared Error. 0.488 _AVERR_ Average Error Function. 0.569 _ERR_ Error Function. 221.73

353
_MISC_ Misclassification Rate. 0.277 _WRONG_ Number of Wrong Classifications. 54
CLASSIFICATION SUMMARY
TARGET PREDICT
PERCENT OF TARGET
PERCENT OF PREDICT COUNT
PERCENT OF TOTAL
BANKRUPT BANKRUPT 69.1358 65.8824 56 28.7179 NONBANKRUPT BANKRUPT 30.8642 22.7273 25 12.8205 BANKRUPT NONBANKRUPT 25.4386 34.1176 29 14.8718 NONBANKRUPT NONBANKRUPT 74.5614 77.2727 85 43.5897
YEAR 5
VARIABLE SUMMARY
ROLE LEVEL COUNT
INPUT INTERVAL 4
TARGET TARGET 1
FIT STATISTICS
FIT STATISTIC STATISTIC LABEL
STATISTIC VALUE
_DFT_ Total Degrees of Freedom. 168 _DFE_ Degrees of Freedom for Error. 132 _DFM_ Model Degrees of Freedom. 36 _NW_ Number of Estimated Weights. 36 _AIC_ Akaike's Information Criterion. 275.095 _SBC_ Schwarz's Bayesian Criterion. 387.558 _ASE_ Average Squared Error. 0.209 _MAX_ Maximum Absolute Error. 0.846 _DIV_ Divisor for ASE. 336 _NOBS_ Sum of Frequencies. 168 _RASE_ Root Average Squared Error. 0.457 _SSE_ Sum of Squared Errors. 70.293 _SUMW_ Sum of Case Weights Times Freq. 336 _FPE_ Final Prediction Error. 0.323 _MSE_ Mean Squared Error. 0.266 _RFPE_ Root Final Prediction Error. 0.569 _RMSE_ Root Mean Squared Error. 0.516 _AVERR_ Average Error Function. 0.604

354
_ERR_ Error Function. 203.095 _MISC_ Misclassification Rate. 0.315 _WRONG_ Number of Wrong Classifications. 53
CLASSIFICATION SUMMARY
TARGET PREDICT
PERCENT OF TARGET
PERCENT OF PREDICT COUNT
PERCENT OF TOTAL
BANKRUPT BANKRUPT 61.9718 62.8571 44 26.1905 NONBANKRUPT BANKRUPT 38.0282 27.551 27 16.0714 BANKRUPT NONBANKRUPT 26.8041 37.1429 26 15.4762 NONBANKRUPT NONBANKRUPT 73.1959 72.449 71 42.2619

355
Results of Radial Basis Function Networks : Top 3 Account and Market variables
YEAR 1
VARIABLE SUMMARY
ROLE LEVEL COUNT
INPUT INTERVAL 6
TARGET TARGET 1
FIT STATISTICS
FIT STATISTIC STATISTIC LABEL
STATISTIC VALUE
_DFT_ Total Degrees of Freedom. 255 _DFE_ Degrees of Freedom for Error. 207 _DFM_ Model Degrees of Freedom. 48 _NW_ Number of Estimated Weights. 48 _AIC_ Akaike's Information Criterion. 332.364 _SBC_ Schwarz's Bayesian Criterion. 502.345 _ASE_ Average Squared Error. 0.148 _MAX_ Maximum Absolute Error. 0.891 _DIV_ Divisor for ASE. 510 _NOBS_ Sum of Frequencies. 255 _RASE_ Root Average Squared Error. 0.385 _SSE_ Sum of Squared Errors. 75.428 _SUMW_ Sum of Case Weights Times Freq. 510 _FPE_ Final Prediction Error. 0.216 _MSE_ Mean Squared Error. 0.182 _RFPE_ Root Final Prediction Error. 0.465 _RMSE_ Root Mean Squared Error. 0.427 _AVERR_ Average Error Function. 0.463 _ERR_ Error Function. 236.364 _MISC_ Misclassification Rate. 0.216 _WRONG_ Number of Wrong Classifications. 55

356
CLASSIFICATION SUMMARY
TARGET PREDICT
PERCENT OF TARGET
PERCENT OF PREDICT COUNT
PERCENT OF TOTAL
BANKRUPT BANKRUPT 74.8503 90.5797 125 49.0196 NONBANKRUPT BANKRUPT 25.1497 35.8974 42 16.4706 BANKRUPT NONBANKRUPT 14.7727 9.4203 13 5.098 NONBANKRUPT NONBANKRUPT 85.2273 64.1026 75 29.4118
YEAR 2
VARIABLE SUMMARY
ROLE LEVEL COUNT
INPUT INTERVAL 6
TARGET TARGET 1
FIT STATISTICS
FIT STATISTIC STATISTIC LABEL
STATISTIC VALUE
_DFT_ Total Degrees of Freedom. 242 _DFE_ Degrees of Freedom for Error. 194 _DFM_ Model Degrees of Freedom. 48 _NW_ Number of Estimated Weights. 48 _AIC_ Akaike's Information Criterion. 319.177 _SBC_ Schwarz's Bayesian Criterion. 486.646 _ASE_ Average Squared Error. 0.144 _MAX_ Maximum Absolute Error. 0.868 _DIV_ Divisor for ASE. 484 _NOBS_ Sum of Frequencies. 242 _RASE_ Root Average Squared Error. 0.379 _SSE_ Sum of Squared Errors. 69.58 _SUMW_ Sum of Case Weights Times Freq. 484 _FPE_ Final Prediction Error. 0.215 _MSE_ Mean Squared Error. 0.179 _RFPE_ Root Final Prediction Error. 0.464 _RMSE_ Root Mean Squared Error. 0.423 _AVERR_ Average Error Function. 0.461 _ERR_ Error Function. 223.177
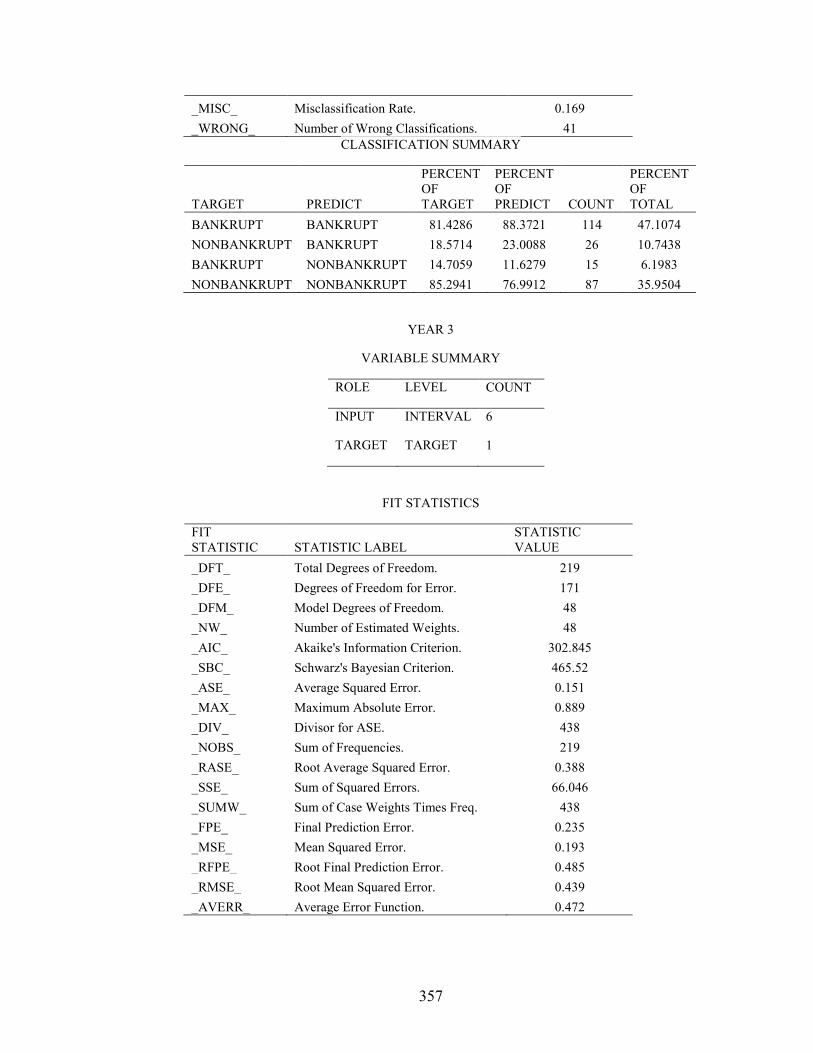
357
_MISC_ Misclassification Rate. 0.169 _WRONG_ Number of Wrong Classifications. 41
CLASSIFICATION SUMMARY
TARGET PREDICT
PERCENT OF TARGET
PERCENT OF PREDICT COUNT
PERCENT OF TOTAL
BANKRUPT BANKRUPT 81.4286 88.3721 114 47.1074 NONBANKRUPT BANKRUPT 18.5714 23.0088 26 10.7438 BANKRUPT NONBANKRUPT 14.7059 11.6279 15 6.1983 NONBANKRUPT NONBANKRUPT 85.2941 76.9912 87 35.9504
YEAR 3
VARIABLE SUMMARY
ROLE LEVEL COUNT
INPUT INTERVAL 6
TARGET TARGET 1
FIT STATISTICS
FIT STATISTIC STATISTIC LABEL
STATISTIC VALUE
_DFT_ Total Degrees of Freedom. 219 _DFE_ Degrees of Freedom for Error. 171 _DFM_ Model Degrees of Freedom. 48 _NW_ Number of Estimated Weights. 48 _AIC_ Akaike's Information Criterion. 302.845 _SBC_ Schwarz's Bayesian Criterion. 465.52 _ASE_ Average Squared Error. 0.151 _MAX_ Maximum Absolute Error. 0.889 _DIV_ Divisor for ASE. 438 _NOBS_ Sum of Frequencies. 219 _RASE_ Root Average Squared Error. 0.388 _SSE_ Sum of Squared Errors. 66.046 _SUMW_ Sum of Case Weights Times Freq. 438 _FPE_ Final Prediction Error. 0.235 _MSE_ Mean Squared Error. 0.193 _RFPE_ Root Final Prediction Error. 0.485 _RMSE_ Root Mean Squared Error. 0.439 _AVERR_ Average Error Function. 0.472

358
_ERR_ Error Function. 206.845 _MISC_ Misclassification Rate. 0.192 _WRONG_ Number of Wrong Classifications. 42
CLASSIFICATION SUMMARY
TARGET PREDICT
PERCENT OF TARGET
PERCENT OF PREDICT COUNT
PERCENT OF TOTAL
BANKRUPT BANKRUPT 79.4643 82.4074 89 40.6393 NONBANKRUPT BANKRUPT 20.5357 20.7207 23 10.5023 BANKRUPT NONBANKRUPT 17.757 17.5926 19 8.6758 NONBANKRUPT NONBANKRUPT 82.243 79.2793 88 40.1826
YEAR 4
VARIABLE SUMMARY
ROLE LEVEL COUNT
INPUT INTERVAL 6
TARGET TARGET 1
FIT STATISTICS
FIT STATISTIC STATISTIC LABEL
STATISTIC VALUE
_DFT_ Total Degrees of Freedom. 195 _DFE_ Degrees of Freedom for Error. 147 _DFM_ Model Degrees of Freedom. 48 _NW_ Number of Estimated Weights. 48 _AIC_ Akaike's Information Criterion. 216.526 _SBC_ Schwarz's Bayesian Criterion. 373.63 _ASE_ Average Squared Error. 0.089 _MAX_ Maximum Absolute Error. 0.955 _DIV_ Divisor for ASE. 390 _NOBS_ Sum of Frequencies. 195 _RASE_ Root Average Squared Error. 0.298 _SSE_ Sum of Squared Errors. 34.648 _SUMW_ Sum of Case Weights Times Freq. 390 _FPE_ Final Prediction Error. 0.147 _MSE_ Mean Squared Error. 0.118 _RFPE_ Root Final Prediction Error. 0.383 _RMSE_ Root Mean Squared Error. 0.343

359
_AVERR_ Average Error Function. 0.309 _ERR_ Error Function. 120.526 _MISC_ Misclassification Rate. 0.103 _WRONG_ Number of Wrong Classifications. 20
CLASSIFICATION SUMMARY
TARGET PREDICT
PERCENT OF TARGET
PERCENT OF PREDICT COUNT
PERCENT OF TOTAL
BANKRUPT BANKRUPT 87.3563 89.4118 76 38.9744 NONBANKRUPT BANKRUPT 12.6437 10 11 5.641 BANKRUPT NONBANKRUPT 8.3333 10.5882 9 4.6154 NONBANKRUPT NONBANKRUPT 91.6667 90 99 50.7692
YEAR 5
VARIABLE SUMMARY
ROLE LEVEL COUNT
INPUT INTERVAL 6
TARGET TARGET 1
FIT STATISTICS
FIT STATISTIC STATISTIC LABEL
STATISTIC VALUE
_DFT_ Total Degrees of Freedom. 168 _DFE_ Degrees of Freedom for Error. 120 _DFM_ Model Degrees of Freedom. 48 _NW_ Number of Estimated Weights. 48 _AIC_ Akaike's Information Criterion. 205.68 _SBC_ Schwarz's Bayesian Criterion. 355.631 _ASE_ Average Squared Error. 0.097 _MAX_ Maximum Absolute Error. 0.954 _DIV_ Divisor for ASE. 336 _NOBS_ Sum of Frequencies. 168 _RASE_ Root Average Squared Error. 0.311 _SSE_ Sum of Squared Errors. 32.574 _SUMW_ Sum of Case Weights Times Freq. 336 _FPE_ Final Prediction Error. 0.175 _MSE_ Mean Squared Error. 0.136 _RFPE_ Root Final Prediction Error. 0.418

360
_RMSE_ Root Mean Squared Error. 0.368 _AVERR_ Average Error Function. 0.326 _ERR_ Error Function. 109.68 _MISC_ Misclassification Rate. 0.119 _WRONG_ Number of Wrong Classifications. 20
CLASSIFICATION SUMMARY
TARGET PREDICT
PERCENT OF TARGET
PERCENT OF PREDICT COUNT
PERCENT OF TOTAL
BANKRUPT BANKRUPT 85.7143 85.7143 60 35.7143 NONBANKRUPT BANKRUPT 14.2857 10.2041 10 5.9524 BANKRUPT NONBANKRUPT 10.2041 14.2857 10 5.9524 NONBANKRUPT NONBANKRUPT 89.7959 89.7959 88 52.381

361
Results of Radial Basis Function Networks : Top 3 Account and Market logarithmic variables
YEAR 1
VARIABLE SUMMARY
ROLE LEVEL COUNT
INPUT INTERVAL 6
TARGET TARGET 1
FIT STATISTICS
FIT STATISTIC STATISTIC LABEL
STATISTIC VALUE
_DFT_ Total Degrees of Freedom. 255 _DFE_ Degrees of Freedom for Error. 207 _DFM_ Model Degrees of Freedom. 48 _NW_ Number of Estimated Weights. 48 _AIC_ Akaike's Information Criterion. 351.13 _SBC_ Schwarz's Bayesian Criterion. 521.111 _ASE_ Average Squared Error. 0.163 _MAX_ Maximum Absolute Error. 0.884 _DIV_ Divisor for ASE. 510 _NOBS_ Sum of Frequencies. 255 _RASE_ Root Average Squared Error. 0.404 _SSE_ Sum of Squared Errors. 83.249 _SUMW_ Sum of Case Weights Times Freq. 510 _FPE_ Final Prediction Error. 0.239 _MSE_ Mean Squared Error. 0.201 _RFPE_ Root Final Prediction Error. 0.489 _RMSE_ Root Mean Squared Error. 0.448 _AVERR_ Average Error Function. 0.5 _ERR_ Error Function. 255.13 _MISC_ Misclassification Rate. 0.216 _WRONG_ Number of Wrong Classifications. 55

362
CLASSIFICATION SUMMARY
TARGET PREDICT
PERCENT OF TARGET
PERCENT OF PREDICT COUNT
PERCENT OF TOTAL
BANKRUPT BANKRUPT 73.9884 92.7536 128 50.1961 NONBANKRUPT BANKRUPT 26.0116 38.4615 45 17.6471 BANKRUPT NONBANKRUPT 12.1951 7.2464 10 3.9216 NONBANKRUPT NONBANKRUPT 87.8049 61.5385 72 28.2353
YEAR 2
VARIABLE SUMMARY
ROLE LEVEL COUNT
INPUT INTERVAL 6
TARGET TARGET 1
FIT STATISTICS
FIT STATISTIC STATISTIC LABEL
STATISTIC VALUE
_DFT_ Total Degrees of Freedom. 242 _DFE_ Degrees of Freedom for Error. 194 _DFM_ Model Degrees of Freedom. 48 _NW_ Number of Estimated Weights. 48 _AIC_ Akaike's Information Criterion. 356.335 _SBC_ Schwarz's Bayesian Criterion. 523.804 _ASE_ Average Squared Error. 0.178 _MAX_ Maximum Absolute Error. 0.87 _DIV_ Divisor for ASE. 484 _NOBS_ Sum of Frequencies. 242 _RASE_ Root Average Squared Error. 0.421 _SSE_ Sum of Squared Errors. 85.94 _SUMW_ Sum of Case Weights Times Freq. 484 _FPE_ Final Prediction Error. 0.265 _MSE_ Mean Squared Error. 0.221 _RFPE_ Root Final Prediction Error. 0.515 _RMSE_ Root Mean Squared Error. 0.471 _AVERR_ Average Error Function. 0.538 _ERR_ Error Function. 260.335

363
_MISC_ Misclassification Rate. 0.236 _WRONG_ Number of Wrong Classifications. 57
CLASSIFICATION SUMMARY
TARGET PREDICT
PERCENT OF TARGET
PERCENT OF PREDICT COUNT
PERCENT OF TOTAL
BANKRUPT BANKRUPT 77.2727 79.0698 102 42.1488 NONBANKRUPT BANKRUPT 22.7273 26.5487 30 12.3967 BANKRUPT NONBANKRUPT 24.5455 20.9302 27 11.157 NONBANKRUPT NONBANKRUPT 75.4545 73.4513 83 34.2975
YEAR 3
VARIABLE SUMMARY
ROLE LEVEL COUNT
INPUT INTERVAL 6
TARGET TARGET 1
FIT STATISTICS
FIT STATISTIC STATISTIC LABEL
STATISTIC VALUE
_DFT_ Total Degrees of Freedom. 219 _DFE_ Degrees of Freedom for Error. 171 _DFM_ Model Degrees of Freedom. 48 _NW_ Number of Estimated Weights. 48 _AIC_ Akaike's Information Criterion. 319.649 _SBC_ Schwarz's Bayesian Criterion. 482.325 _ASE_ Average Squared Error. 0.167 _MAX_ Maximum Absolute Error. 0.914 _DIV_ Divisor for ASE. 438 _NOBS_ Sum of Frequencies. 219 _RASE_ Root Average Squared Error. 0.408 _SSE_ Sum of Squared Errors. 73.009 _SUMW_ Sum of Case Weights Times Freq. 438 _FPE_ Final Prediction Error. 0.26 _MSE_ Mean Squared Error. 0.213 _RFPE_ Root Final Prediction Error. 0.51 _RMSE_ Root Mean Squared Error. 0.462

364
_AVERR_ Average Error Function. 0.511 _ERR_ Error Function. 223.649 _MISC_ Misclassification Rate. 0.233 _WRONG_ Number of Wrong Classifications. 51
CLASSIFICATION SUMMARY
TARGET PREDICT
PERCENT OF TARGET
PERCENT OF PREDICT COUNT
PERCENT OF TOTAL
BANKRUPT BANKRUPT 77.6699 74.0741 80 36.5297 NONBANKRUPT BANKRUPT 22.3301 20.7207 23 10.5023 BANKRUPT NONBANKRUPT 24.1379 25.9259 28 12.7854 NONBANKRUPT NONBANKRUPT 75.8621 79.2793 88 40.1826
YEAR 4
VARIABLE SUMMARY
ROLE LEVEL COUNT
INPUT INTERVAL 6
TARGET TARGET 1
FIT STATISTICS
FIT STATISTIC STATISTIC LABEL
STATISTIC VALUE
_DFT_ Total Degrees of Freedom. 195 _DFE_ Degrees of Freedom for Error. 147 _DFM_ Model Degrees of Freedom. 48 _NW_ Number of Estimated Weights. 48 _AIC_ Akaike's Information Criterion. 254.967 _SBC_ Schwarz's Bayesian Criterion. 412.07 _ASE_ Average Squared Error. 0.129 _MAX_ Maximum Absolute Error. 0.876 _DIV_ Divisor for ASE. 390 _NOBS_ Sum of Frequencies. 195 _RASE_ Root Average Squared Error. 0.359 _SSE_ Sum of Squared Errors. 50.317 _SUMW_ Sum of Case Weights Times Freq. 390 _FPE_ Final Prediction Error. 0.213 _MSE_ Mean Squared Error. 0.171 _RFPE_ Root Final Prediction Error. 0.462
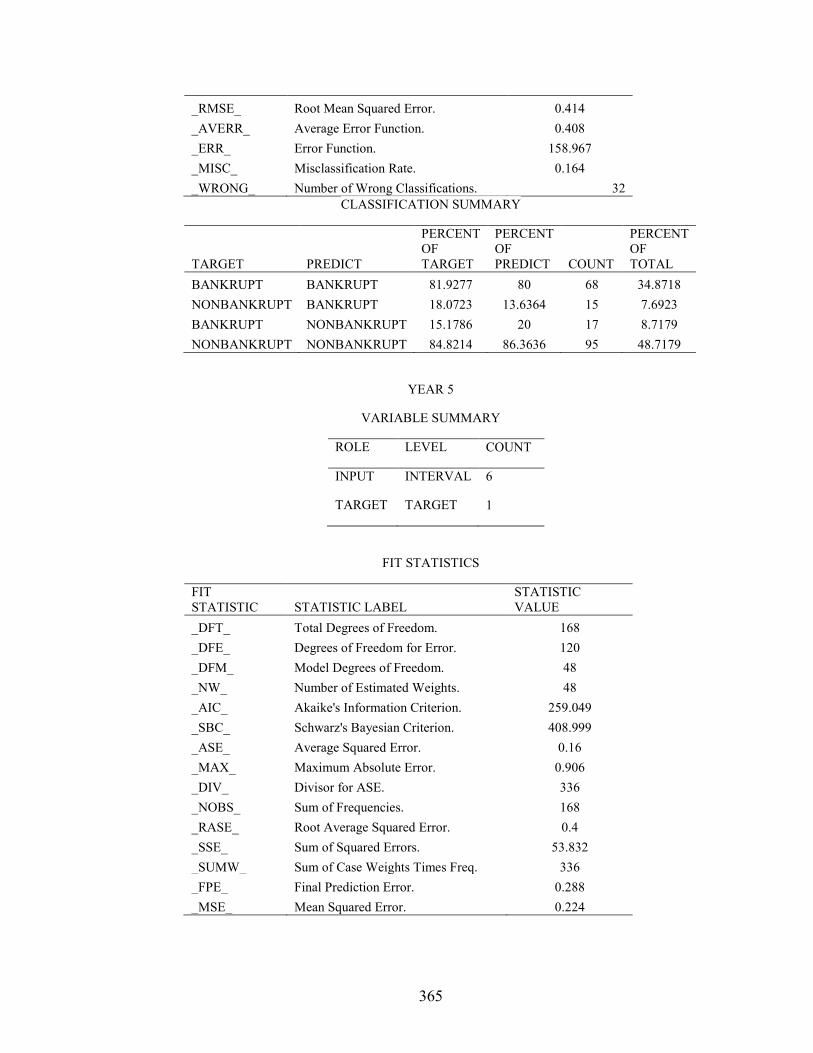
365
_RMSE_ Root Mean Squared Error. 0.414 _AVERR_ Average Error Function. 0.408 _ERR_ Error Function. 158.967 _MISC_ Misclassification Rate. 0.164 _WRONG_ Number of Wrong Classifications. 32
CLASSIFICATION SUMMARY
TARGET PREDICT
PERCENT OF TARGET
PERCENT OF PREDICT COUNT
PERCENT OF TOTAL
BANKRUPT BANKRUPT 81.9277 80 68 34.8718 NONBANKRUPT BANKRUPT 18.0723 13.6364 15 7.6923 BANKRUPT NONBANKRUPT 15.1786 20 17 8.7179 NONBANKRUPT NONBANKRUPT 84.8214 86.3636 95 48.7179
YEAR 5
VARIABLE SUMMARY
ROLE LEVEL COUNT
INPUT INTERVAL 6
TARGET TARGET 1
FIT STATISTICS
FIT STATISTIC STATISTIC LABEL
STATISTIC VALUE
_DFT_ Total Degrees of Freedom. 168 _DFE_ Degrees of Freedom for Error. 120 _DFM_ Model Degrees of Freedom. 48 _NW_ Number of Estimated Weights. 48 _AIC_ Akaike's Information Criterion. 259.049 _SBC_ Schwarz's Bayesian Criterion. 408.999 _ASE_ Average Squared Error. 0.16 _MAX_ Maximum Absolute Error. 0.906 _DIV_ Divisor for ASE. 336 _NOBS_ Sum of Frequencies. 168 _RASE_ Root Average Squared Error. 0.4 _SSE_ Sum of Squared Errors. 53.832 _SUMW_ Sum of Case Weights Times Freq. 336 _FPE_ Final Prediction Error. 0.288 _MSE_ Mean Squared Error. 0.224

366
_RFPE_ Root Final Prediction Error. 0.537 _RMSE_ Root Mean Squared Error. 0.474 _AVERR_ Average Error Function. 0.485 _ERR_ Error Function. 163.049 _MISC_ Misclassification Rate. 0.25 _WRONG_ Number of Wrong Classifications. 42
CLASSIFICATION SUMMARY
TARGET PREDICT
PERCENT OF TARGET
PERCENT OF PREDICT COUNT
PERCENT OF TOTAL
BANKRUPT BANKRUPT 68.9189 72.8571 51 30.3571 NONBANKRUPT BANKRUPT 31.0811 23.4694 23 13.6905 BANKRUPT NONBANKRUPT 20.2128 27.1429 19 11.3095 NONBANKRUPT NONBANKRUPT 79.7872 76.5306 75 44.6429

367
Results of Radial Basis Function Networks : Variables (Price, Standard deviation, bid ask spread, net income to sales, working capital to total assets and current liabilities to total assets )
YEAR 1
VARIABLE SUMMARY
ROLE LEVEL COUNT
INPUT INTERVAL 6
TARGET TARGET 1
FIT STATISTICS
FIT STATISTIC STATISTIC LABEL
STATISTIC VALUE
_DFT_ Total Degrees of Freedom. 255 _DFE_ Degrees of Freedom for Error. 207 _DFM_ Model Degrees of Freedom. 48 _NW_ Number of Estimated Weights. 48 _AIC_ Akaike's Information Criterion. 309.809 _SBC_ Schwarz's Bayesian Criterion. 479.789 _ASE_ Average Squared Error. 0.13 _MAX_ Maximum Absolute Error. 0.927 _DIV_ Divisor for ASE. 510 _NOBS_ Sum of Frequencies. 255 _RASE_ Root Average Squared Error. 0.361 _SSE_ Sum of Squared Errors. 66.54 _SUMW_ Sum of Case Weights Times Freq. 510 _FPE_ Final Prediction Error. 0.191 _MSE_ Mean Squared Error. 0.161 _RFPE_ Root Final Prediction Error. 0.437 _RMSE_ Root Mean Squared Error. 0.401 _AVERR_ Average Error Function. 0.419 _ERR_ Error Function. 213.809 _MISC_ Misclassification Rate. 0.176 _WRONG_ Number of Wrong Classifications. 45

368
CLASSIFICATION SUMMARY
TARGET PREDICT
PERCENT OF TARGET
PERCENT OF PREDICT COUNT
PERCENT OF TOTAL
BANKRUPT BANKRUPT 83.4532 84.058 116 45.4902 NONBANKRUPT BANKRUPT 16.5468 19.6581 23 9.0196 BANKRUPT NONBANKRUPT 18.9655 15.942 22 8.6275 NONBANKRUPT NONBANKRUPT 81.0345 80.3419 94 36.8627
YEAR 2
VARIABLE SUMMARY
ROLE LEVEL COUNT
INPUT INTERVAL 6
TARGET TARGET 1
FIT STATISTICS
FIT STATISTIC STATISTIC LABEL
STATISTIC VALUE
_DFT_ Total Degrees of Freedom. 242 _DFE_ Degrees of Freedom for Error. 194 _DFM_ Model Degrees of Freedom. 48 _NW_ Number of Estimated Weights. 48 _AIC_ Akaike's Information Criterion. 335.255 _SBC_ Schwarz's Bayesian Criterion. 502.724 _ASE_ Average Squared Error. 0.16 _MAX_ Maximum Absolute Error. 0.91 _DIV_ Divisor for ASE. 484 _NOBS_ Sum of Frequencies. 242 _RASE_ Root Average Squared Error. 0.401 _SSE_ Sum of Squared Errors. 77.669 _SUMW_ Sum of Case Weights Times Freq. 484 _FPE_ Final Prediction Error. 0.24 _MSE_ Mean Squared Error. 0.2 _RFPE_ Root Final Prediction Error. 0.49 _RMSE_ Root Mean Squared Error. 0.447 _AVERR_ Average Error Function. 0.494 _ERR_ Error Function. 239.255

369
_MISC_ Misclassification Rate. 0.223 _WRONG_ Number of Wrong Classifications. 54
CLASSIFICATION SUMMARY
TARGET PREDICT
PERCENT OF TARGET
PERCENT OF PREDICT COUNT
PERCENT OF TOTAL
BANKRUPT BANKRUPT 74.8344 87.5969 113 46.6942 NONBANKRUPT BANKRUPT 25.1656 33.6283 38 15.7025 BANKRUPT NONBANKRUPT 17.5824 12.4031 16 6.6116 NONBANKRUPT NONBANKRUPT 82.4176 66.3717 75 30.9917
YEAR 3
VARIABLE SUMMARY
ROLE LEVEL COUNT
INPUT INTERVAL 6
TARGET TARGET 1
FIT STATISTICS
FIT STATISTIC STATISTIC LABEL
STATISTIC VALUE
_DFT_ Total Degrees of Freedom. 219 _DFE_ Degrees of Freedom for Error. 171 _DFM_ Model Degrees of Freedom. 48 _NW_ Number of Estimated Weights. 48 _AIC_ Akaike's Information Criterion. 307.717 _SBC_ Schwarz's Bayesian Criterion. 470.393 _ASE_ Average Squared Error. 0.157 _MAX_ Maximum Absolute Error. 0.916 _DIV_ Divisor for ASE. 438 _NOBS_ Sum of Frequencies. 219 _RASE_ Root Average Squared Error. 0.397 _SSE_ Sum of Squared Errors. 68.92 _SUMW_ Sum of Case Weights Times Freq. 438 _FPE_ Final Prediction Error. 0.246 _MSE_ Mean Squared Error. 0.202 _RFPE_ Root Final Prediction Error. 0.496 _RMSE_ Root Mean Squared Error. 0.449
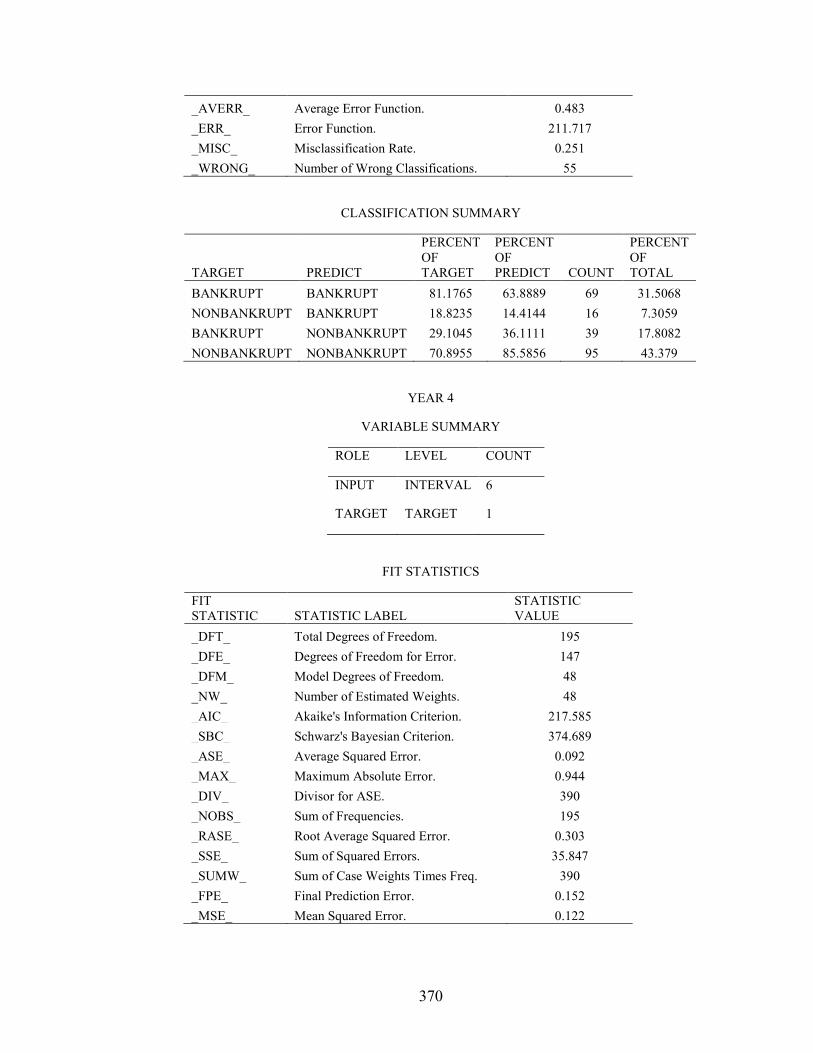
370
_AVERR_ Average Error Function. 0.483 _ERR_ Error Function. 211.717 _MISC_ Misclassification Rate. 0.251 _WRONG_ Number of Wrong Classifications. 55
CLASSIFICATION SUMMARY
TARGET PREDICT
PERCENT OF TARGET
PERCENT OF PREDICT COUNT
PERCENT OF TOTAL
BANKRUPT BANKRUPT 81.1765 63.8889 69 31.5068 NONBANKRUPT BANKRUPT 18.8235 14.4144 16 7.3059 BANKRUPT NONBANKRUPT 29.1045 36.1111 39 17.8082 NONBANKRUPT NONBANKRUPT 70.8955 85.5856 95 43.379
YEAR 4
VARIABLE SUMMARY
ROLE LEVEL COUNT
INPUT INTERVAL 6
TARGET TARGET 1
FIT STATISTICS
FIT STATISTIC STATISTIC LABEL
STATISTIC VALUE
_DFT_ Total Degrees of Freedom. 195 _DFE_ Degrees of Freedom for Error. 147 _DFM_ Model Degrees of Freedom. 48 _NW_ Number of Estimated Weights. 48 _AIC_ Akaike's Information Criterion. 217.585 _SBC_ Schwarz's Bayesian Criterion. 374.689 _ASE_ Average Squared Error. 0.092 _MAX_ Maximum Absolute Error. 0.944 _DIV_ Divisor for ASE. 390 _NOBS_ Sum of Frequencies. 195 _RASE_ Root Average Squared Error. 0.303 _SSE_ Sum of Squared Errors. 35.847 _SUMW_ Sum of Case Weights Times Freq. 390 _FPE_ Final Prediction Error. 0.152 _MSE_ Mean Squared Error. 0.122

371
_RFPE_ Root Final Prediction Error. 0.39 _RMSE_ Root Mean Squared Error. 0.349 _AVERR_ Average Error Function. 0.312 _ERR_ Error Function. 121.585 _MISC_ Misclassification Rate. 0.108 _WRONG_ Number of Wrong Classifications. 21
CLASSIFICATION SUMMARY
TARGET PREDICT
PERCENT OF TARGET
PERCENT OF PREDICT COUNT
PERCENT OF TOTAL
BANKRUPT BANKRUPT 90 84.7059 72 36.9231 NONBANKRUPT BANKRUPT 10 7.2727 8 4.1026 BANKRUPT NONBANKRUPT 11.3043 15.2941 13 6.6667 NONBANKRUPT NONBANKRUPT 88.6957 92.7273 102 52.3077
YEAR 5
VARIABLE SUMMARY
ROLE LEVEL COUNT
INPUT INTERVAL 6
TARGET TARGET 1
FIT STATISTICS
FIT STATISTIC STATISTIC LABEL
STATISTIC VALUE
_DFT_ Total Degrees of Freedom. 168 _DFE_ Degrees of Freedom for Error. 120 _DFM_ Model Degrees of Freedom. 48 _NW_ Number of Estimated Weights. 48 _AIC_ Akaike's Information Criterion. 182.001 _SBC_ Schwarz's Bayesian Criterion. 331.952 _ASE_ Average Squared Error. 0.065 _MAX_ Maximum Absolute Error. 0.957 _DIV_ Divisor for ASE. 336 _NOBS_ Sum of Frequencies. 168 _RASE_ Root Average Squared Error. 0.255 _SSE_ Sum of Squared Errors. 21.908 _SUMW_ Sum of Case Weights Times Freq. 336

372
_FPE_ Final Prediction Error. 0.117 _MSE_ Mean Squared Error. 0.091 _RFPE_ Root Final Prediction Error. 0.343 _RMSE_ Root Mean Squared Error. 0.302 _AVERR_ Average Error Function. 0.256 _ERR_ Error Function. 86.001 _MISC_ Misclassification Rate. 0.065 _WRONG_ Number of Wrong Classifications. 11
CLASSIFICATION SUMMARY
TARGET PREDICT
PERCENT OF TARGET
PERCENT OF PREDICT COUNT
PERCENT OF TOTAL
BANKRUPT BANKRUPT 96.8254 87.1429 61 36.3095 NONBANKRUPT BANKRUPT 3.1746 2.0408 2 1.1905 BANKRUPT NONBANKRUPT 8.5714 12.8571 9 5.3571 NONBANKRUPT NONBANKRUPT 91.4286 97.9592 96 57.1429

373
Results of Radial Basis Function Networks : Variables (Price, Standard deviation, hi lo bid ask spread, net income to sales, working capital to total assets and current liabilities to total assets )
YEAR 1
VARIABLE SUMMARY
ROLE LEVEL COUNT
INPUT INTERVAL 6
TARGET TARGET 1
FIT STATISTICS
FIT STATISTIC STATISTIC LABEL
STATISTIC VALUE
_DFT_ Total Degrees of Freedom. 255 _DFE_ Degrees of Freedom for Error. 207 _DFM_ Model Degrees of Freedom. 48 _NW_ Number of Estimated Weights. 48 _AIC_ Akaike's Information Criterion. 288.321 _SBC_ Schwarz's Bayesian Criterion. 458.302 _ASE_ Average Squared Error. 0.109 _MAX_ Maximum Absolute Error. 0.922 _DIV_ Divisor for ASE. 510 _NOBS_ Sum of Frequencies. 255 _RASE_ Root Average Squared Error. 0.33 _SSE_ Sum of Squared Errors. 55.555 _SUMW_ Sum of Case Weights Times Freq. 510 _FPE_ Final Prediction Error. 0.159 _MSE_ Mean Squared Error. 0.134 _RFPE_ Root Final Prediction Error. 0.399 _RMSE_ Root Mean Squared Error. 0.366 _AVERR_ Average Error Function. 0.377 _ERR_ Error Function. 192.321 _MISC_ Misclassification Rate. 0.114 _WRONG_ Number of Wrong Classifications. 29

374
CLASSIFICATION SUMMARY
TARGET PREDICT
PERCENT OF TARGET
PERCENT OF PREDICT COUNT
PERCENT OF TOTAL
BANKRUPT BANKRUPT 88.1119 91.3043 126 49.4118 NONBANKRUPT BANKRUPT 11.8881 14.5299 17 6.6667 BANKRUPT NONBANKRUPT 10.7143 8.6957 12 4.7059 NONBANKRUPT NONBANKRUPT 89.2857 85.4701 100 39.2157
YEAR 2
VARIABLE SUMMARY
ROLE LEVEL COUNT
INPUT INTERVAL 6
TARGET TARGET 1
FIT STATISTICS
FIT STATISTIC STATISTIC LABEL
STATISTIC VALUE
_DFT_ Total Degrees of Freedom. 242 _DFE_ Degrees of Freedom for Error. 194 _DFM_ Model Degrees of Freedom. 48 _NW_ Number of Estimated Weights. 48 _AIC_ Akaike's Information Criterion. 394.503 _SBC_ Schwarz's Bayesian Criterion. 561.972 _ASE_ Average Squared Error. 0.214 _MAX_ Maximum Absolute Error. 0.793 _DIV_ Divisor for ASE. 484 _NOBS_ Sum of Frequencies. 242 _RASE_ Root Average Squared Error. 0.463 _SSE_ Sum of Squared Errors. 103.587 _SUMW_ Sum of Case Weights Times Freq. 484 _FPE_ Final Prediction Error. 0.32 _MSE_ Mean Squared Error. 0.267 _RFPE_ Root Final Prediction Error. 0.566 _RMSE_ Root Mean Squared Error. 0.517 _AVERR_ Average Error Function. 0.617 _ERR_ Error Function. 298.503 _MISC_ Misclassification Rate. 0.331

375
_WRONG_ Number of Wrong Classifications. 80
CLASSIFICATION SUMMARY
TARGET PREDICT
PERCENT OF TARGET
PERCENT OF PREDICT COUNT
PERCENT OF TOTAL
BANKRUPT BANKRUPT 69.2913 68.2171 88 36.3636 NONBANKRUPT BANKRUPT 30.7087 34.5133 39 16.1157 BANKRUPT NONBANKRUPT 35.6522 31.7829 41 16.9421 NONBANKRUPT NONBANKRUPT 64.3478 65.4867 74 30.5785
YEAR 3
VARIABLE SUMMARY
ROLE LEVEL COUNT
INPUT INTERVAL 6
TARGET TARGET 1
FIT STATISTICS
FIT STATISTIC STATISTIC LABEL
STATISTIC VALUE
_DFT_ Total Degrees of Freedom. 219 _DFE_ Degrees of Freedom for Error. 171 _DFM_ Model Degrees of Freedom. 48 _NW_ Number of Estimated Weights. 48 _AIC_ Akaike's Information Criterion. 320.465 _SBC_ Schwarz's Bayesian Criterion. 483.14 _ASE_ Average Squared Error. 0.175 _MAX_ Maximum Absolute Error. 0.805 _DIV_ Divisor for ASE. 438 _NOBS_ Sum of Frequencies. 219 _RASE_ Root Average Squared Error. 0.418 _SSE_ Sum of Squared Errors. 76.519 _SUMW_ Sum of Case Weights Times Freq. 438 _FPE_ Final Prediction Error. 0.273 _MSE_ Mean Squared Error. 0.224 _RFPE_ Root Final Prediction Error. 0.522 _RMSE_ Root Mean Squared Error. 0.473 _AVERR_ Average Error Function. 0.512
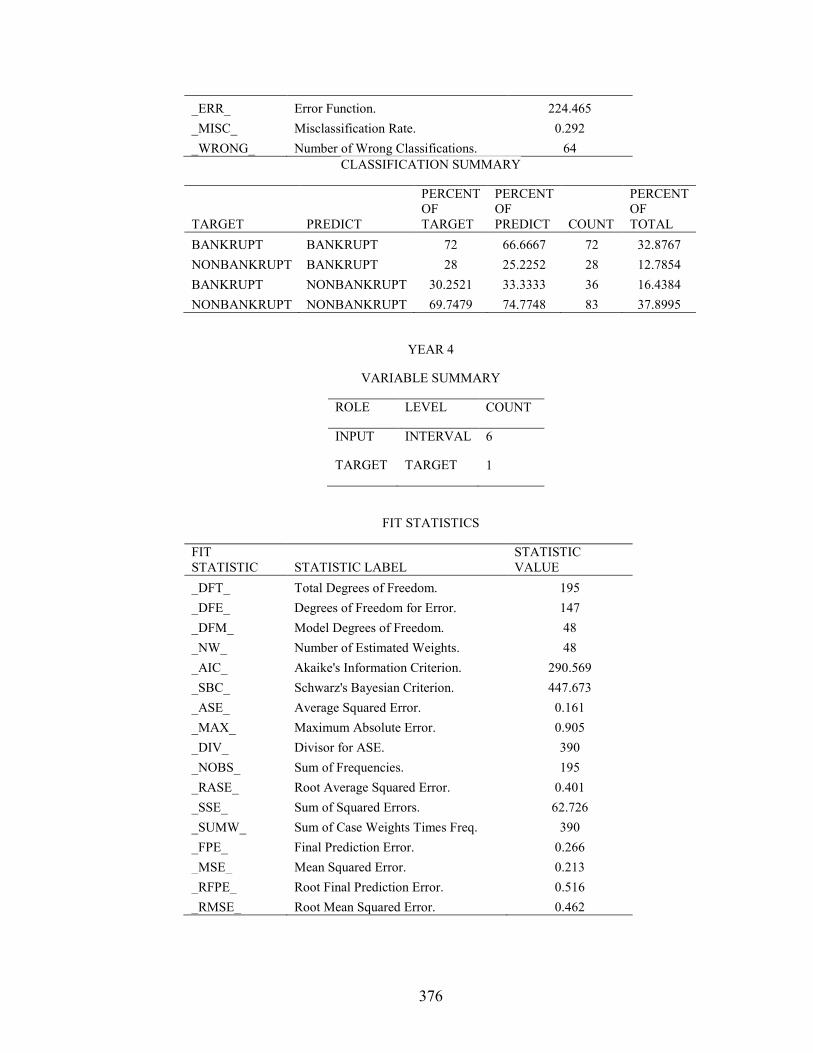
376
_ERR_ Error Function. 224.465 _MISC_ Misclassification Rate. 0.292 _WRONG_ Number of Wrong Classifications. 64
CLASSIFICATION SUMMARY
TARGET PREDICT
PERCENT OF TARGET
PERCENT OF PREDICT COUNT
PERCENT OF TOTAL
BANKRUPT BANKRUPT 72 66.6667 72 32.8767 NONBANKRUPT BANKRUPT 28 25.2252 28 12.7854 BANKRUPT NONBANKRUPT 30.2521 33.3333 36 16.4384 NONBANKRUPT NONBANKRUPT 69.7479 74.7748 83 37.8995
YEAR 4
VARIABLE SUMMARY
ROLE LEVEL COUNT
INPUT INTERVAL 6
TARGET TARGET 1
FIT STATISTICS
FIT STATISTIC STATISTIC LABEL
STATISTIC VALUE
_DFT_ Total Degrees of Freedom. 195 _DFE_ Degrees of Freedom for Error. 147 _DFM_ Model Degrees of Freedom. 48 _NW_ Number of Estimated Weights. 48 _AIC_ Akaike's Information Criterion. 290.569 _SBC_ Schwarz's Bayesian Criterion. 447.673 _ASE_ Average Squared Error. 0.161 _MAX_ Maximum Absolute Error. 0.905 _DIV_ Divisor for ASE. 390 _NOBS_ Sum of Frequencies. 195 _RASE_ Root Average Squared Error. 0.401 _SSE_ Sum of Squared Errors. 62.726 _SUMW_ Sum of Case Weights Times Freq. 390 _FPE_ Final Prediction Error. 0.266 _MSE_ Mean Squared Error. 0.213 _RFPE_ Root Final Prediction Error. 0.516 _RMSE_ Root Mean Squared Error. 0.462

377
_AVERR_ Average Error Function. 0.499 _ERR_ Error Function. 194.569 _MISC_ Misclassification Rate. 0.205 _WRONG_ Number of Wrong Classifications. 40
CLASSIFICATION SUMMARY
TARGET PREDICT
PERCENT OF TARGET
PERCENT OF PREDICT COUNT
PERCENT OF TOTAL
BANKRUPT BANKRUPT 80 70.5882 60 30.7692 NONBANKRUPT BANKRUPT 20 13.6364 15 7.6923 BANKRUPT NONBANKRUPT 20.8333 29.4118 25 12.8205 NONBANKRUPT NONBANKRUPT 79.1667 86.3636 95 48.7179
YEAR 5
VARIABLE SUMMARY
ROLE LEVEL COUNT
INPUT INTERVAL 6
TARGET TARGET 1
FIT STATISTICS
FIT STATISTIC STATISTIC LABEL
STATISTIC VALUE
_DFT_ Total Degrees of Freedom. 168 _DFE_ Degrees of Freedom for Error. 120 _DFM_ Model Degrees of Freedom. 48 _NW_ Number of Estimated Weights. 48 _AIC_ Akaike's Information Criterion. 228.562 _SBC_ Schwarz's Bayesian Criterion. 378.513 _ASE_ Average Squared Error. 0.123 _MAX_ Maximum Absolute Error. 0.952 _DIV_ Divisor for ASE. 336 _NOBS_ Sum of Frequencies. 168 _RASE_ Root Average Squared Error. 0.351 _SSE_ Sum of Squared Errors. 41.454 _SUMW_ Sum of Case Weights Times Freq. 336 _FPE_ Final Prediction Error. 0.222 _MSE_ Mean Squared Error. 0.173
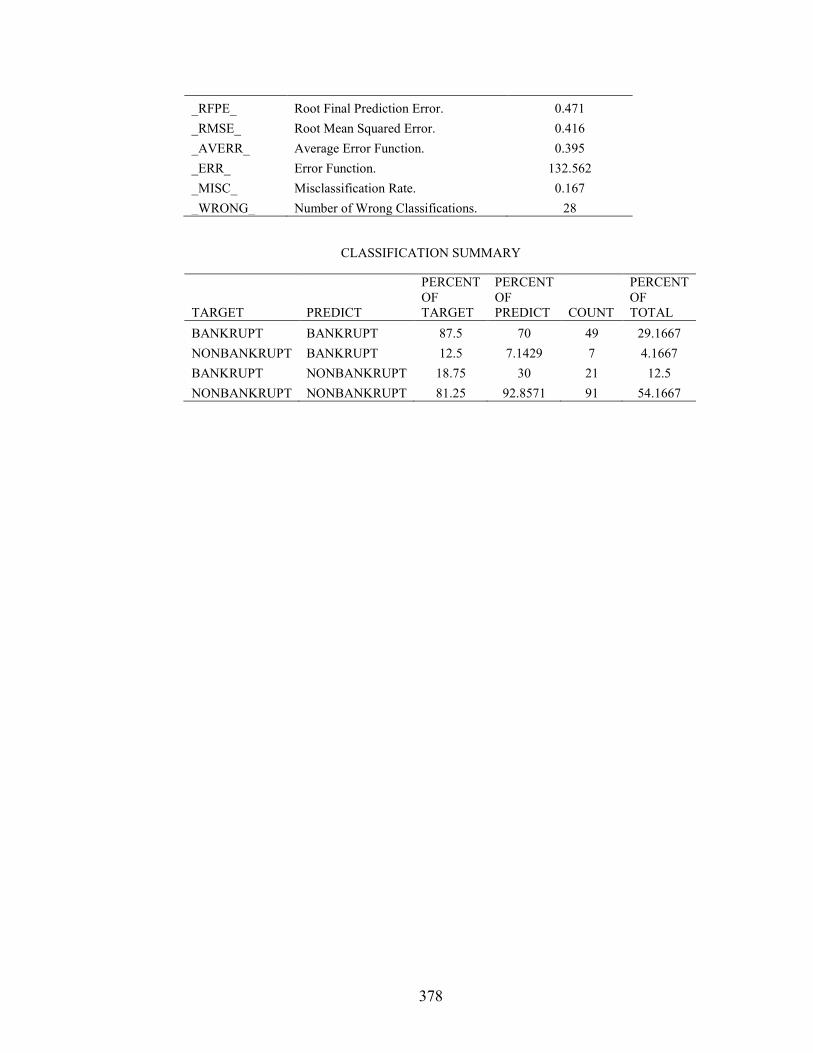
378
_RFPE_ Root Final Prediction Error. 0.471 _RMSE_ Root Mean Squared Error. 0.416 _AVERR_ Average Error Function. 0.395 _ERR_ Error Function. 132.562 _MISC_ Misclassification Rate. 0.167 _WRONG_ Number of Wrong Classifications. 28
CLASSIFICATION SUMMARY
TARGET PREDICT
PERCENT OF TARGET
PERCENT OF PREDICT COUNT
PERCENT OF TOTAL
BANKRUPT BANKRUPT 87.5 70 49 29.1667 NONBANKRUPT BANKRUPT 12.5 7.1429 7 4.1667 BANKRUPT NONBANKRUPT 18.75 30 21 12.5 NONBANKRUPT NONBANKRUPT 81.25 92.8571 91 54.1667

379
Table 13
MLP analysis results for Out of sample validation :Market variables
VARIABLE SUMMARY
ROLE LEVEL COUNT
INPUT INTERVAL 6
TARGET TARGET 1
FIT STATISTICS
FIT STATISTIC STATISTIC LABEL STATISTIC VALUE _DFT_ Total Degrees of Freedom. 824 _DFE_ Degrees of Freedom for Error. 781 _DFM_ Model Degrees of Freedom. 43 _NW_ Number of Estimated Weights. 43 _AIC_ Akaike's Information Criterion. 822.02 _SBC_ Schwarz's Bayesian Criterion. 1024.73 _ASE_ Average Squared Error. 0.14 _MAX_ Maximum Absolute Error. 0.96 _DIV_ Divisor for ASE. 1648 _NOBS_ Sum of Frequencies. 824 _RASE_ Root Average Squared Error. 0.38 _SSE_ Sum of Squared Errors. 236.61 _SUMW_ Sum of Case Weights Times Freq. 1648 _FPE_ Final Prediction Error. 0.16 _MSE_ Mean Squared Error. 0.15 _RFPE_ Root Final Prediction Error. 0.4 _RMSE_ Root Mean Squared Error. 0.39 _AVERR_ Average Error Function. 0.45 _ERR_ Error Function. 736.02 _MISC_ Misclassification Rate. 0.2 _WRONG_ Number of Wrong Classifications. 164

380
CLASSIFICATION SUMMARY (YEAR 2 TO 5)
TARGET PREDICT
PERCENT OF TARGET
PERCENT OF PREDICT COUNT
PERCENT OF TOTAL
BANKRUPT BANKRUPT 79.0816 79.0816 310 37.6214 NONBANKRUPT BANKRUPT 20.9184 18.9815 82 9.9515 BANKRUPT NONBANKRUPT 18.9815 20.9184 82 9.9515 NONBANKRUPT NONBANKRUPT 81.0185 81.0185 350 42.4757
CLASSIFICATION SUMMARY FOR TEST DATA (YEAR 1)
Actual Predicted Total
Bankrupt Nonbankrupt
Bankrupt 96 69.57
42 30.43
138
Nonbankrupt 20 17.09
97 82.91
117
Total 116 139 2

381
MLP analysis results for Out of sample validation : Variables (Price, Standard deviation, bid ask spread, net income to sales, working capital to total assets and current liabilities to total assets )
VARIABLE SUMMARY
ROLE LEVEL COUNT
INPUT INTERVAL 6
TARGET TARGET 1
FIT STATISTICS
FIT STATISTIC STATISTIC LABEL
STATISTIC VALUE
_DFT_ Total Degrees of Freedom. 824 _DFE_ Degrees of Freedom for Error. 775 _DFM_ Model Degrees of Freedom. 49 _NW_ Number of Estimated Weights. 49 _AIC_ Akaike's Information Criterion. 818.71 _SBC_ Schwarz's Bayesian Criterion. 1049.7 _ASE_ Average Squared Error. 0.14 _MAX_ Maximum Absolute Error. 0.96 _DIV_ Divisor for ASE. 1648 _NOBS_ Sum of Frequencies. 824 _RASE_ Root Average Squared Error. 0.37 _SSE_ Sum of Squared Errors. 230.42 _SUMW_ Sum of Case Weights Times Freq. 1648 _FPE_ Final Prediction Error. 0.16 _MSE_ Mean Squared Error. 0.15 _RFPE_ Root Final Prediction Error. 0.4 _RMSE_ Root Mean Squared Error. 0.39 _AVERR_ Average Error Function. 0.44 _ERR_ Error Function. 720.71 _MISC_ Misclassification Rate. 0.18 _WRONG_ Number of Wrong Classifications. 151

382
CLASSIFICATION SUMMARY (YEAR 2 TO 5)
TARGET PREDICT
PERCENT OF TARGET
PERCENT OF PREDICT COUNT
PERCENT OF TOTAL
BANKRUPT BANKRUPT 81.6273 79.3367 311 37.7427 NONBANKRUPT BANKRUPT 18.3727 16.2037 70 8.4951 BANKRUPT NONBANKRUPT 18.2844 20.6633 81 9.8301 NONBANKRUPT NONBANKRUPT 81.7156 83.7963 362 43.932
CLASSIFICATION SUMMARY FOR TEST DATA (YEAR 1)
Actual Predicted Total
Bankrupt Nonbankrupt
Bankrupt 94 68.12
44 31.88
138
Nonbankrupt 20 17.09
97 82.91
117
Total 114 141 255

383
4.6 Summary and Conclusions
Traditional models have been extensively used in bankruptcy prediction for over
four decades. However, over time, the underlying assumptions of these models have been
called into question; many papers in the literature have shown that the distributional
assumptions, along with other assumptions, are often violated. This has led to the use of
more complex models, namely neural networks.
This has been a fruitful area of research, both because of the importance of early
detection of financial distress and the improvement of technology. There is always a
trade-off when deciding on using more complex models: practical efficiency versus
precision. However, over time the complexity in using these models has subdued.
We test the predictive ability of two neural network models (multi-layer
perceptron and radial basis function) on accounting ratios, market variables, and different
mixes of both. While market variables alone have high predictive power, we find that the
best predictions in terms of both classifying bankrupt firms and overall precision are
made with a mix of market variables and accounting ratios. The market variables
included in this subset are price, standard deviation of price, and bid-ask spread, and the
accounting ratios are net income to sales, working capital to total assets, and current
liabilities to total assets.

384
CHAPTER 5: EVALUATION, COMPARISON OF MODELS, AND CONCLUSION
5.1 Evaluation and comparison of models
Since the goal of this dissertation is to evaluate the predictive ability of different
bankruptcy prediction models using different variables, in this chapter we compare the
out-of-sample performance of different models, using different sets of variables. We
focus on the set of market variables versus the mixed set of market variables and
accounting ratios, which are price, standard deviation, bid-ask spread, net income to
sales, working capital to total assets, and current liabilities to total assets.
The univariate analysis demonstrates that the best discriminating market variables
are the price, standard deviation, and bid-ask spread, while the bid-ask spread is the best
at discriminating in the long term. The cash flow ratios display misclassification rates of
20 to 30%, and the net income ratios have misclassification rates of 20 to 40%.
Specifically, net income to sales ratio shows 25-33% misclassification rates.
Using the discriminant analysis, the market variables misclassify 29% of bankrupt
firms and 17% of nonbankrupt firms. The set, price, standard deviation, bid-ask spread,
net income to sales, working capital to total assets, and current liabilities to total assets,
misclassify 38% of the bankrupt firms and 15% of nonbankrupt firms.
Employing neural networks, namely the multi-layer perceptron, market variables
correctly classify 70% of bankrupt firms and 83% of nonbankrupt firms. The set of six
market variables and accounting ratios correctly classify 68% of bankrupt firms and 83%
of nonbankrupt firms.

385
5.2 Conclusion
This dissertation is a comprehensive study of bankruptcy prediction. Traditional
approaches such as univariate analysis multivariate discriminant analysis are employed.
From the univariate analysis in Chapter 2, market variables, such as price, standard
deviation of return, and bid-ask spread, and certain accounting ratios, namely net income
to sales, working capital to total assets, and current liabilities to total assets, show the
highest ability to distinguish between bankrupt and nonbankrupt firms in a dichotomous
classification test. However, since financial distress is a complex process, individual
ratios and variables do not tell the whole story.
Multivariate discriminant analysis is employed in chapter 3. After testing for
univariate and multivariate normality and finding that the variables and sets of variables
are nonnormal, three different forms of discriminant analysis are used: linear, quadratic,
and nonparametric analysis. Different combinations of variables and ratios are used in
each discriminant analysis: all accounting ratios, all market variables, and different
combinations of both. While market variables alone perform well, the combinations
perform better at discriminating between bankrupt and nonbankrupt firms. The most
important findings are that the nonparametric discriminant analysis is the most accurate
and the most accurate set of variables consists of price, standard deviation of return, bid-
ask spread, net income to sales, working capital to total assets, and current liabilities to
total assets. This is important because the nonparametric discriminant analysis has not
been heavily used in the literature, yet it is the most appropriate since the assumptions are
often violated. Furthermore, the use of a combination of accounting ratios and market and

386
microstructure variables shows the need for forward-looking variables in bankruptcy
prediction. These findings indicate the need for more complex techniques.
Chapter 4 utilizes neural networks for bankruptcy prediction. Multi-layer
perceptron and radial basis function are the two forms of neural networks employed. The
use of neural networks has grown in the literature and it is more useful now that the
technology needed is available. Multi-layer perceptron is the most accurate technique
according to the results, which is consistent with non-linearly related data, and the
combination of accounting ratios and market and microstructure variables is found to be
the most accurate predictor. The misclassification rates, and more importantly, the ability
of the model to correctly classify bankrupt firms, are higher than found using univariate
analysis and multivariate discriminant analysis.

387
REFERENCES
Altman, E. 1968. Financial ratios, discriminant analysis and the prediction of corporate bankruptcy. Journal of Finance 23: 589-609. Aziz, A, Emanuel, D., and Lawson, G. 1988. Bankruptcy prediction – An investigation of cash flow based models. Journal of Management Studies 25: 5. Beaver, W. 1966. Financial ratios as predictors of failure. Empirical Research in Accounting: Selected Studies, Supplement to Journal of Accounting Research 4. Beaver, W. 1968. The information content of annual earnings announcements. Journal of Accounting Research 6: 67-92. Blum, M. Failing company discriminant analysis. Journal of Accounting Research 12: 1-25. Booth, P. 1983. Decomposition measures and the prediction of financial failure. Journal of Business Finance & Accounting 10: 67-82. Boritz, J. and Kennedy, D. 1995. Effectiveness of neural network types for prediction of business failure. Brockman, P. and Turtle, H.J. 2003. A barrier option framework for corporate security valuation. Journal of Financial Economics 67: 511-529. Casey, C.J. and Bartczak, N.J. 1984. Cash flow – it’s not the bottom line. Harvard Business Review July-August: 61-66. Coats, P. 1993. Recognizing financial distress patterns using a neural network tool. Financial Management 22: 142-155. Deakin, E. 1972. A discriminant analysis of predictors of business failure. Journal of Accounting Research 10: 167-179. Dimitras, A.I., Slowinski, R., Susmaga, R., and Zopounidis, C. 1999. Business failure prediction using rough sets. European Journal of Operational Research 114: 263-280. Eisenbeis, R. 1977. Pitfalls in the application of discriminant analysis in business, finance, and economics. Journal of Finance 32: 875-900. El Hennawy, R.H.A. and Morris, R.C. 1983. The significance of base year in developing failure prediction models. Journal of Business Finance and Accounting 10: 209-223.

388
Frino, A., Jones, S., and Wong, J. 2007. Market Behaviour around Bankruptcy Announcements: Evidence from the Australian Stock Exchange. Account & Finance 47: 713-730. Frydman, H., Altman, E., and Kao, D. 1985. Introducing recursive partitioning for financial classification: the case of financial distress. The Journal of Finance 50: 269-291. Gombola, M.J., Haskins, M.E., Ketz, J.E., and Williams, D.D. 1987. Cash flow in bankruptcy prediction. Financial Management Winter: 55-65. Gonedes, NJ. 1973. Properties of Accounting Numbers: Models and Tests. Journal of Accounting Research 11: 212-237. Jardin, P. 2010. Predicting bankruptcy using neural networks and other classification methods: The influence of variable selection techniques on model accuracy. Neurocomputing 73: 2047-2060. Jo, H., Han, I., and Lee, H. 1997. Bankruptcy prediction using case-based reasoning, neural networks, and discriminant analysis. Expert Systems with Applications 13: 97-108. Ketz, F. 1978. The effect of general price-level adjustments on the predictive ability of financial ratios. Journal of Accounting Research 16: 273-284. Kothari, S.P. 2001. Capital markets research in accounting. Journal of Accounting and Economics 31: 105-231. Leshno, M. and Spector, Y. 1996. Neural-network prediction analysis – the bankruptcy case. Neurocomputing 10: 125-147. Lin, L. and Piesse, J. 2001. The identification of corporate distress: a conditional probability analysis approach. Documents, Department of Management, Birbeck, University of London, London. McGurr, P.T. and DeVaney, S.A. 1998. Predicting business failure of retail firms: an analysis using mixed industry models. Journal of Business Research 43: 169-176. Moyer, R.C. 1977. Forecasting financial failure: a re-examination. Financial Management Spring: 11-17. Neophytou, R.C., Charitou, A., and Cahralambous, C. 2001. Predicting corporate failure: empirical evidence in the U.K. Discussion Paper No. 01-73, March, School of Management, University of Southampton, Southampton.

389
Norton, C. and Smith, R. 1979. A comparison of general price level and historical cost financial statements in the prediction of bankruptcy. The Accounting Review 54: 72-87. Ohlson, J. 1980. Financial ratios and the probabilistic prediction of bankruptcy. Journal of Accounting Research 18: 109-131. Prakash, A & Karels, G. 1987. Multivariate Normality and Forecasting of Business Bankruptcy. Journal of Business Finance & Accounting 14: 573-593. Salchenberger, L.M., Cinar, E.M., and Lash, N.A. 1992. Neural networks: a new tool for predicting thrift failures. Decision Sciences 23: 899-916. Shumway, T. 2001. Forecasting bankruptcy more accurately: A simple hazard model. Journal of Business 74: 101-124. Yang, Z. R., Platt, M. B., and Platt, H.D. 1999. Probabilistic neural networks in bankruptcy prediction. Journal of Business Research 44: 67-74. Zavgren, C. 1983. The Prediction of Corporate Failure: The State of the Art. Journal of Accounting Literature 2: 1–38.

390
VITA
GIOVANNI FERNANDEZ
August 18, 1985 Born, Miami Beach, Florida
2007 B.S., Finance Florida International University Miami, Florida
2007-2011 Graduate Teaching and
Research Assistant Florida International University Miami, Florida
PUBLICATIONS AND PRESENTATIONS
"Alpha: Empirical Evidence of Mutual Fund Performance under Different Economic Cycles and over Fund Objectives," Eastern Finance Association Meeting, Savannah, Georgia 2011.