Embed Size (px)
Citation preview

A COMPREHENSIVE REVIEW
OF SCIENCE-BASED METHODS AND PROCESSES
OF THE
WILDLIFE AND PARKS DIVISIONS
OF THE
TEXAS PARKS AND WILDLIFE DEPARTMENT
A Report to the Executive Director of Texas Parks and Wildlife Department
By the
Wildlife Management Institute
January 2005

CONTENTS
INTRODUCTION 1 REVIEW METHODS 5 FINDINGS 9 OBJECTIVE 1: REVIEW OF METHODS 9
Overarching Themes 9
Spotlight Surveys 13
Aerial Counts: Game Animals 23
Herd Composition Counts 37
Call Counts: Upland Game Birds 45
Roadside Observation Surveys 60
Turkey Hen-Poult Counts and Surveys 68
Lek Surveys 73
Dove Production Survey 79
Colonial Waterbird Nest Survey 82
Eagle Wintering and Nesting Survey 85
River Otter Survey 87
Harvest Surveys 90
Age/Condition of Hunter-Harvested Game Animals 100
ii
CONTENTS continued
Disease Monitoring 108
Browse Survey: MLDP Properties 110
Baseline Inventory and Monitoring 112
Human Dimensions Surveys 118
OBJECTIVE 2: EMPLOYEE KNOWLEDGE AND USE OF SCIENCE 121
Wildlife Division Questionnaire 121
Parks Division Questionnaire 133 OBJECTIVE 3: EVALUATION OF EXISTING SCIENCE PROCESSES 137
Existing Processes 137
Recommendations 141 CONCLUSIONS 146 LITERATURE CITED 149 APPENDIX A: Methodology Survey 154 APPENDIX B: Wildlife Division Questionnaire 156 APPENDIX C: Parks Division Questionnaire 161 APPENDIX D: Distance Sampling References 166
iii

EXECUTIVE SUMMARY
The Wildlife Management Institute (WMI) was chosen in late 2003 as the organization to
evaluate science-based processes within Texas Parks and Wildlife Department (TPWD)
Wildlife and Parks Divisions. WMI was asked to conduct a review to determine 1)
whether the agency is using the best science available for monitoring and managing
wildlife resources in Texas and 2) whether there are critical data gaps to address that will
improve the ability of the agency to manage wildlife resources in Texas.
There were 4 basic objectives for the review as follows:
Objective 1: Obtain, review, and evaluate the scientific basis and application of all key
activities and methodologies that are employed to obtain scientific information for
management decisions by TPWD.
Objective 2: Ascertain opinions and insights of selected TPWD staff on use of, and gaps
in, science available for monitoring and managing wildlife resources to determine how
well science is integrated into management decision processes.
Objective 3: Evaluate existing TPWD processes for on-going evaluation of their
science-based activities and propose modifications as needed to improve this evaluation
and allow for the most effective use of data in management decision-making.
Objective 4: Summarize findings and make recommendations based on those findings.
The review was conducted in chronological order of the 4 objectives, from April 1, 2004
to January 31, 2005. Information for objective 1 was first obtained from selected oral
interviews of agency leadership, staff members from the Austin headquarters, and from
regional and field employees. Next, following oral interviews, WMI identified 10
program staff members interviewed previously to fill out a questionnaire on 25 specific
methodologies covering several wildlife species. This questionnaire requested detailed
iv
written information on basis of each method, statistical and sampling design, how the
method is implemented in the field, and data acquisition, analysis, interpretation and use.
Results of these surveys were used to supplement information obtained from the oral
interviews.
Objective 2 was addressed with the development and mailing of a 30-question written
survey to 188 selected employees within the Wildlife Division. Employees receiving a
survey represented job titles of Program Specialist VI and below in field and
headquarters positions, which deal with science-based activities on a continual basis.
Specifically, the position classifications were Managers IIs, Program Specialists III-VI,
and Natural Resource Scientists III-V. Not all grades for each position were represented
in the survey.
The questionnaire format was the basic Likert-scale with 5 categories of response
(strongly agree, agree, disagree, strongly disagree, and no opinion) divided into 5
sections: data gathering, summary, and analysis procedures, scientific basis of land
management decisions, employee training, culturing and rewarding of scientists,
integration of science into the management decision process of the agency and additional
written comments the respondent felt important to help WMI evaluate science activities
within the agency. Of 188 questionnaires mailed to Wildlife Division employees, a total
of 145 were returned to WMI. Individual respondents were not identified and were
guaranteed all responses were confidential. No follow-up surveys to non-respondents
were done.
To ascertain opinions of Parks Division employees, WMI developed a questionnaire with
27 questions designed to be relevant to science issues in the state parks. Twenty-four
employees received questionnaires, including state park managers, regional resource
coordinators and regional directors. Eighteen surveys were completed and returned to
WMI. No follow-up surveys to non-respondents were done.
v
During the course of this review, we identified a number of broad issues or “overarching
themes” that needed to be addressed for many, if not most, of the methodologies
examined. They included: determination of data need, consideration of scale, sampling
design, efforts to reduce bias and improve methodology, distance sampling, written
protocols and standardized data reporting forms, training, use of statistical parameters to
describe data, reporting limitations of data, data storage, coordination, supervision and
standardization, and harvest surveys.
Numerous individual inventory methods were evaluated in depth with recommendations
for improvement made for many. A common criticism was the absence of a sound
statistical design for allocation of sampling efforts and lack of statistical analyses for the
data obtained. One of the major findings was that the type and number of surveys
conducted needs to be driven more closely by management objectives, and that greater
attention should be paid to the quality, rather than the quantity, of the surveys conducted.
WMI found repeated themes in staff member descriptions of problems associated with
harvest surveys. The first problem was the necessary constraint of the sampling universe
to those hunters who actually intend to hunt for the species being sampled. Another
common overarching problem with harvest surveys identified by TPWD staff members
was declining response rate. Regardless of the reason for the decline, low response rates
are indicative of vulnerability in making scientifically sound estimates.
Among TPWD employees, WMI found broad interest and participation in efforts to
improve the science foundation of agency operations. Employees generally demonstrated
a solid understanding of the scientific process and a commitment to practice sound
science. Employees commonly are seeking opportunities to learn more, to receive better
training, and/or to gain additional access to science materials. Employees clearly
appreciate agency programs to provide training, access and outside consultation on
science, and they requested agency leaders increase availability of these efforts wherever
possible.
vi

Many employees also expressed concern about the design of studies or the reliability of
interpretations that they were asked to make regarding data collected. Unique to the Parks
Division, we noted concerns about the absence of natural resource stewardship plans, and
where plans were in place, the slow implementation of plan recommendations. A need
was found for all science applications in the agency to be better coordinated and elevated
in key decision-making processes.
The third objective of the WMI review was to evaluate existing TPWD processes for on-
going evaluation of their science-based activities and propose modifications as needed to
improve this evaluation and allow for the most effective use of data in management
decision-making. Key science processes identified included: strategic planning,
operational planning, research selection process, program staff, field supervisory leaders,
management, research and inventory on WMAs and state parks, statistical services,
hunting regulation changes, electronic databases, and ad hoc research and science. WMI
presented a schematic diagram representing 1 potential organizational approach aimed at
improving the coordination or management of science activities within the agency was
presented. A key recommendation was that a Science Standards Committee made up by
program leaders formally conduct ongoing evaluation of agency science standards and
processes and work to make sure science training for employees is a priority.
TPWD clearly understands that agency actions must be grounded in science, and the
agency has made it a priority to obtain an independent science review of the agency’s
programs. However, the review concluded that TPWD must now determine whether
there is a need for the type and scale of data currently being collected, and whether that
need is sufficiently important to require reliable information. Collection of reliable
information will require the agency to do a better job of designing sampling strategies
prior to data collection and making greater use of other science-based methods to
improve accuracy and precision of estimates. The ability to retrieve, use and understand
information gathered in these inventories depends heavily on a well-supported home for
electronic data storage.
vii

INTRODUCTION
On July 24, 2003, Texas Parks and Wildlife Department (TPWD) leadership contacted
the President of the Wildlife Management Institute (WMI) inquiring if WMI was
interested in conducting a comprehensive review of all science and management-based
processes used by the Wildlife and Parks Divisions of TPWD to ensure the quality of
management of Texas’ natural resources.
Following development of a formal proposal, WMI was chosen in late 2003 as the
organization to evaluate selected science-based processes within TPWD Wildlife and
Parks Divisions. WMI was asked to conduct a review to determine 1) whether the
agency is using the best science available for monitoring and managing wildlife resources
in Texas and 2) whether there are critical data gaps to address that will improve the
ability of the agency to manage wildlife and habitat resources in Texas. WMI conducted
a previous study for TPWD in 1988, when organization and administration of the agency
were reviewed.
Basis for the agency to conduct scientific activities is provided in several chapters of the
Texas Parks and Wildlife Code including 1) Subchapter C. SPECIAL ACCOUNTS
11.033 (8), which states that the Game, Fish, and Water Safety Account may be used for
“research, management, and protection of the fish and wildlife resources of this state,
including alligators and furbearing animals;” 2) Subchapter D. SPECIAL NONGAME
AND ENDANGERED SPECIES CONSERVATION ACCOUNT 11.054 (2) and (4),
which state that the Special Nongame and Endangered Species Conservation Account
may be used for “scientific investigation and survey of nongame and endangered species
for better protection of conservation” and “research and management of nongame and
endangered species;” 3) Subchapter H. LAND AND WATER RESOURCES
CONSERVATION PLAN 11.103(a), which states that “the department shall inventory
all land and water associated with historical, natural, recreational, and wildlife resources
in this state that are owned by governmental entities or nonprofit entities that offer access

to the land or water to the public;” 4) Subchapter B. REGULATIONS GOVERNING
PARKS AND OTHER RECREATIONAL AREAS 13.101 and 13.102, which state “the
commission may promulgate regulations governing the health, safety, and protection of
persons and property in state parks, historic sites, scientific areas, or forts under the
control of the department, including public water within those areas’ and ‘ the regulations
may govern the conservation, preservation, and use of state property whether natural
features or constructed facilities;” 5) Subchapter B. WHITE-WINGED DOVE STAMPS
43.014 (b), which states “white-winged dove stamp sale receipts may be spent only for
research and management for the protection of white-winged dove and ..;” 6) Subchapter
J. TURKEY STAMP 45.254 (b), which states “turkey stamp sale net receipts may be
spent only for research, management, and protection of turkeys and ..;” 7) Subchapter K.
WATERFOWL STAMP 43.305 (b), which states “waterfowl stamp sale net receipts may
be spent only for research, management, and protection of waterfowl and ..;” and 8)
Subchapter C. REGULATORY DUTIES 61.051 (a), which states “The department shall
conduct scientific studies and investigations of all species of game animals, game birds,
and aquatic animal life to determine supply, economic value, environments, breeding
habits, sex ratios, and effects of any factors or conditions causing increases or decreases
in supply.”
For purposes of this review, WMI used the following basic attributes of science and data
gathering as we evaluated the various methodologies and processes within the agency.
When studying natural systems (biological populations) truth or absolute facts about that
system is hardly ever known. Therefore, to study natural systems, some element of
sampling is needed to extract information from the biological population under study to
which the investigator wants to make inferences. It is hoped that the sample extracted
truly represents the biological population under study. How well this is done is the
primary element of this review.
There are 2 basic descriptors of data—accuracy and precision. Both help interpret “truth”.
Accuracy refers to presence or absence of bias in the sample. Precision is a measure of
2
variability of the data. Obviously, the most desirable situation is when the outcome is
both accurate and precise.
The only measure of the “goodness” of the data resulting from most sampling efforts is a
measure of variability or precision of those data. Accuracy or truth is rarely known. The
fields of mathematics and statistics have provided tools to describe and quantify the
measure of variance and to help interpret when and if bias exists. These tools help
scientists evaluate “goodness” of their data.
There are basic assumptions and requirements about how data are obtained that must be
followed before it is legitimate to apply those tools. If those assumptions are not met and
appropriate measures of variance are not calculated, it becomes difficult, if not
impossible, to judge objectively relative merits of data presented. Without variance
measures, only subjective evaluations of data can be made. However, only having a
measure of precision without a measure of accuracy (bias) can be very misleading.
Highly precise, but inaccurate measures are dangerous if the observer does not
understand the effects of existing biases in methodologies employed.
Without appropriate attention to bias, conclusions can be off target and the user of the
data faces the risks of inappropriate decision-making. Even though it is difficult to assess
“truth” in most sampling problems, there are approaches that can and should be taken to
improve likelihood of accurate results. It is first important to identify sources,
magnitude, and direction of the bias. Bias can result in either under or over estimates of
the parameter under study. For instance, in estimating numbers of animals it is well
known that most estimates derived via observers are under estimates. This results
because observers tend to miss more animals than they double count. Degree or extent of
bias is complex as it has also been widely observed that number of animals missed varies
among observers. Thus, it is important that efforts be made to elucidate source, direction,
and extent of bias of the method being evaluated.
3

The most direct way to determine bias in animal detection is to have known number of
animals in a controlled environment (e.g., large pasture) and then conduct a series of
inventories employing the method of choice to determine number of animals detected.
This produces a sighting or detection value that can be used as a correction factor for
measures made by those observers where accuracy is unknown. Obviously, other causes
of bias beyond detection exist in inventory methodologies and it is important for
observers to recognize these biases exist, and when possible take steps to learn the extent
and direction of those biases and then correct as necessary. One other approach to assess
bias is to perform a completely independent and separate measure using a different
methodology and then compare results. Unfortunately, if the 2 methods differ, it is not
possible to determine which is the most accurate. If it is not practical to estimate sources,
direction and extent of bias in a method, then efforts should be made to use alternative
methods that provide meaningful parameter estimates, measures of their precision, and
other forms of reliable information.
It is these basic tenets and premises of science and data gathering that WMI considered in
its evaluation of the relative soundness or validity of data obtained from various
inventory methodologies employed by TPWD.
4
REVIEW METHODS
WMI in consultation with TPWD developed 4 basic objectives for the review:
Objective 1: Obtain, review, and evaluate the scientific basis and application of all key
activities and methodologies that are employed to obtain scientific information for
management decisions by TPWD.
Objective 2: Ascertain opinions and insights of selected TPWD staff on use of, and gaps
in, science available for monitoring and managing wildlife resources to determine how
well science is integrated into management decision processes.
Objective 3: Evaluate existing TPWD processes for on-going evaluation of their
science-based activities and propose modifications as needed to improve this evaluation
and allow for the most effective use of data in management decision-making.
Objective 4: Summarize findings and make recommendations based on those findings.
The review was conducted in chronological order of the 4 objectives. Objectives 1 and 2
were accomplished by the following steps: All pertinent written documents, including
strategic plans, operation plans, training manuals, method protocols, Federal Aid reports,
brochures, and other materials dealing with science activities in the agency were
assembled and provided to WMI. These documents provided a broad overview of science
activities in the agency and identified responsible staff members.
After review of the documents, WMI interviewed approximately 21 staff members during
the week of April 19, 2004. Employees from both the Wildlife and Parks Divisions were
interviewed, but central focus of the interviews was placed on Wildlife Division Program
staff members in the headquarters office. Purposes of the Phase I interviews were 3-fold:
1) meet key staff members and identify specific methodologies to be evaluated, 2)
5

determine staff members responsible for further information on each method and 3) learn
about science activities within the agency. Following these interviews requests for
additional documents identified in the oral interviews were forwarded to appropriate
contacts.
The second phase of interviews occurred after all documents had been read and the first
set of interviews summarized. Phase II interviews focused on Area Managers, Technical
Guidance Biologists, District Biologists, and Wildlife Diversity Biologists. In addition,
selected staff members from the quail, turkey, and big game programs were interviewed
or re-interviewed. Main purpose was to fill in knowledge gaps identified from Phase I
interviews and to broaden understanding of field application of various methods. Twenty
staff members were interviewed.
Following the second round of interviews, WMI identified 10 program staff members
interviewed previously to fill out a questionnaire on 25 specific methodologies covering
several wildlife species (Appendix A, sent by e-mail). This questionnaire requested
detailed written information on basis of each method, including key literature citations.
Information was requested on statistical and sampling design, how the method is
implemented in the field, including identification of written protocols and training
necessary for implementation. Information also was requested on data acquisition,
analysis, interpretation and use. Finally information on how results are documented and
reported was requested. Questionnaires were requested to be completed by July 15.
Results of these surveys were used to supplement information obtained from the oral
interviews.
The next step was development and mailing of a 30-question written survey to 188
selected employees within the Wildlife Division (Appendix B). Employees receiving a
survey represented job titles of Program Specialist VI and below in field and
headquarters positions, which deal with science-based activities on a continual basis.
Specifically, the position classifications were Managers IIs, Program Specialists III-VI,
and Natural Resource Scientists III-V. Not all grades for each position were represented
6
in the survey. Employees were asked to indicate their duty assignment as either field or
headquarters and to identify their position title and classification.
The questionnaire format was the basic Likert-scale with 5 categories of response
(strongly agree, agree, disagree, strongly disagree, and no opinion) divided into 5 sections
(Appendix B). Strongly agree responses were recorded as 1 and no opinion responses
were assigned a 5. The 5 sections of the survey focused on data gathering, summary, and
analysis procedures, scientific basis of land management decisions, employee training,
culturing and rewarding of scientists, integration of science into the management decision
process of the agency and finally any additional written comments the respondent felt
important to help WMI evaluate science activities within the agency.
A total of 188 questionnaires was delivered via U.S. Postal Service and included a self-
addressed and stamped envelope for return to WMI. Individual respondents were not
identified and were guaranteed all responses were confidential. The survey was mailed
on July 14 and respondents were asked to complete it by August 13. A total of 145
surveys were returned. No follow-up surveys to non-respondents were done.
To ascertain opinions of Parks Division employees, WMI developed a questionnaire with
27 questions designed to be relevant to science issues in the state parks (Appendix C).
Twenty-four employees received questionnaires, including state park managers, regional
resource coordinators and regional directors. The survey was mailed on October 18 and
respondents were asked to complete it by November 5. Eighteen surveys were completed
and returned to WMI. No follow-up surveys to non-respondents were done.
Statistical analysis of questionnaire responses was conducted within the Statistix software
program. The mean response for each question was calculated for the total data set, and
for the data set following exclusion of employees who stated no opinion. For the
Wildlife Division, analysis of variance tests were conducted to determine if there were
differences in mean response between employee’s duty station, position or position
7

grade. Because of the small size of the Park Divison’s sample, no attempt was made to
break down responses by duty station, position, or position grade.
All review activities were coordinated by Wildlife Division Deputy Director Ron George.
8

FINDINGS
OBJECTIVE 1: REVIEW OF METHODS Overarching Themes During the course of this review, we have identified a number of broad issues common to
many, if not most, of the methodologies examined. We present these overarching themes
as a means of summarizing and highlighting those findings that are repeated frequently in
our review of methods.
Determination of data needs: Many of the findings and recommendations of this review
are conditioned by a suggestion to determine first whether the type of data being
collected are important and necessary for adjusting harvest regulations, providing
information to hunters, or other purposes. If TPWD determines that data based on sound
science are needed, then we recommend that any weaknesses in current approaches be
recognized and corrected by means of a number of measures. The report by the
Coordinated Bird Monitoring Working Group (2004) is a useful reference concerning
evaluation and monitoring of migratory birds and other species and determination of data
needs. Observational data from surveys of appropriate temporal and spatial scale need to
evaluate a management objective or action in order to provide the greatest information on
how any ecological system works. Critical data gaps are only apparent in the context of
the agency’s management objectives.
Consideration of scale: One of the first measures that needs to be taken for many of the
reviewed methodologies is determination of the scale (i.e., ranch, county, ecoregion) that
is appropriate for measurements and needed for management decisions. We caution that
sampling designed for statewide or ecoregional scales should not be extrapolated to finer
scales, such as counties.
9
Sampling design: A commonly identified need in this review is implementation of
sampling protocols that incorporate sound statistical design and clearly specify sample
sizes required to achieve the precision and power needed by decision-makers. We
emphasize the need for sampling methods that employ probability theory and make
possible valid inferences to biological populations of interest and assessments of
precision or accuracy of estimated parameters. Probabilistic sampling strategies include:
1) simple random sampling, 2) stratified random sampling, 3) systematic sampling, and
4) stratified systematic sampling. Our suggestions frequently call for survey efforts to be
allocated on the basis of optimum allocation procedures to reduce variance of estimates
for the biological population of interest. Taken together, these sampling design
recommendations would significantly strengthen results and allow for much stronger data
analyses. Greater reliance should be placed on TPWD statisticians for guidance on
experimental design and sampling considerations. We recommend further that TPWD
place additional research emphasis on addressing the problems of convenience sampling,
in which the selection of units from the population is based on easy availability and/or
accessibility.
Efforts to address bias and improve methods: WMI found that more attention should be
paid to biases inherent in methodologies used by TPWD. Annual collection of data based
on a sound sampling design should be accompanied by routine collection of data
designed to estimate detection probability and to identify sources of variation.
Probability of detection is known to be affected by weather, changing land use patterns
and habitat conditions, level of vehicle traffic, reproductive status, season of the year,
time of day, observer performance, biological and behavioral aspects of detectability, and
a number of other variables. We note the need for greater efforts to estimate detection
probabilities for observers and to conduct tests with known numbers of marked animals
within a variety of vegetation types to establish sightability values.
In a number of instances, we point out the need for tests designed to ascertain ability of
observers to accurately identify or estimate the parameter of interest, such as
classification of sex and age cohorts or identification of tracks. We also found repeated
10

cases in which current non-response bias needs to be assessed in harvest and public hunt
surveys.
Distance sampling: For many reviewed methodologies we recommend that TPWD seek
more robust estimates through use of distance sampling. These techniques make it
possible to develop a probability of detection function by observer and to address the
effects on detectability of variation in habitat and various biological and behavioral traits.
Recommended readings on use of distance sampling are provided in Appendix D.
Written protocols and standardized data reporting forms: Although many methods
employed by TPWD use written protocols and standardized data reporting forms, we
found other methods for which these materials have not been developed, distributed or
used consistently. For these latter methods additional efforts should be made to remove
some of the variation associated with observers and counting methodology by requiring
and monitoring the use of written protocols and standardized data reporting forms. We
also note the need in some instances to ensure that protocols outline details of the
method, including procedures for any allowed modifications in sampling. Entire survey
teams (new and experienced observers) should be briefed periodically on the protocols.
Training: A common theme identified in this review is the need for increased training to
develop more accurate and consistent determinations by observers. We suggest use of
videos and photos, marked animals of known sex and age (unknown to the observer),
sessions at which multiple observers classify the same animals and compare notes, and
annual testing of observers as means of improving training of new and experienced
observers.
Use of statistical parameters to describe data: Almost universally we found that greater
use should be made of common statistical parameters to describe reported data. While
response to our methodology questionnaire indicated that means and regression are used
often to describe reported data, we found little evidence of their use in reports and
material provided to us. We recommend that no estimate be made and printed without a
11
corresponding confidence interval. If the confidence intervals are larger than the agency
can accept, the estimate should not be made.
Reporting limitations of data: Reports presenting data should clearly highlight and
inform readers of limitations of the data, especially noting any absence of scientific basis
for their acquisition. A forthright statement should accompany any report of results that
indicates the scale to which the data apply, the potential sources of bias that could affect
the accuracy of the data, the precision of the data (confidence intervals), and the
importance of interpreting it cautiously. TPWD must instill the discipline to never report
data without the corresponding confidence interval, and to resist reporting of data from
scales for which the sampling is inappropriate.
Data storage: Efforts to centralize data storage and facilitate access to data should be
expedited.
Coordination, supervision and standardization: Overall, we found a need for better
coordination among TPWD science-based activities, increased statistical and scientific
supervision in establishment and implementation of experimental designs, and greater
standardization of data collection methods and formats.
Harvest surveys: In general, WMI found repeated themes in staff member descriptions of
problems associated with harvest surveys. The first problem is the necessary constraint
of the sampling universe to those hunters who actually intend to hunt for the species
being sampled. Widespread issuance of certain stamps and permits to the public at large
is seriously diluting the sampling procedure designed to assess harvest. Some of the
estimates are so affected by artificial sampling pools to render them useless to the
manager. TPWD has the authority to constrain who receives certain hunting permits.
Agency action is needed to correct these problems associated with sample dilution.
The second overarching problem identified by TPWD staff members is declining
response rate. Regardless of the reason for the decline, low response rates are indicative
12

of vulnerability in making scientifically sound estimates. Without sound procedures to
assess non-response bias, agency decision-makers should not place confidence on
estimates produced by a sample with low response rate. TPWD is not alone in this
dilemma, and WMI recommends dialogue with other state agencies to evaluate
alternative methods.
Spotlight Surveys
Background: Spotlight surveys are a key methodology for estimates of abundance of
white-tailed deer, mule deer, and alligators in Texas. In addition, spotlight surveys are
used to produce occurrence information for various furbearers and javelina on surveys
being conducted for deer.
Peer-reviewed literature citations documenting validity of the method are few. Several
agency publications are used as primary citations for basis of the method. Methodology
employed in Texas has evolved over time. The fundamental element for the
measurements is a strip transect of known width determined by frequent assessments of
visibility using a hand held spotlight at night to detect eye shine of individuals. Observers
ride in a moving vehicle traveling 7-10 miles per hour. Data are recorded on standard
forms or on portable tape recorders to be transformed to data sheets later.
Written protocols exist and are distributed. New observers are mentored by experienced
employees and in general, spotlight surveys are relatively rapid and easy to apply (Young
et al. 1995).
Analysis: Basic assumptions for the spotlight technique are: 1) animals are evenly
distributed; 2) only animals within the calculated visibility are counted; 3) all animals are
equally visible; and 4) animals are counted only once (Young et al. 1995). Most of these
assumptions are difficult or impossible to achieve. Application of the method involves
use of a moving vehicle and land-based applications require presence of a road. Location
and characteristics of the road itself introduces additional biases that are difficult to
13
ascertain. A huge limitation of the road-based sample is dependence upon accessible and
suitable roads. Water-based applications provide greater opportunity for allocation of
randomly based survey lines, and thus offer more potential for producing sound data.
Ability to determine number of animals missed on the survey line is also a limitation, and
is a common weakness of many estimators. The widespread and long-term use of this
method requires that it be applied with consistent and rigorous attention to details. It is
easy for observers to develop their own variations of the methodology and over time
application of the method becomes considerably different than originally intended and/or
designed. Individual units of the agency need to be diligent in monitoring use of all
methodologies, but spotlight counts are especially susceptible to this need.
Spotlight Surveys: White-tailed deer
Background: Spotlight surveys for white-tailed deer were begun during the 1960’s and
1970’s. The desire for a rapid and affordable assessment tool for deer led to
implementation of the technique throughout the state (Harwell et al. 1979). In 1993, a
total of 308 spotlight surveys were conducted for white-tailed deer (Young and Richards
1994). In 2003, 503 spotlight surveys were conducted in the state, with an average of 2.5
routes per county surveyed (Lockwood personal communication). Use of spotlight
surveys has increased while use of the Hahn survey lines (walking) has decreased. Data
obtained are used for harvest regulation changes.
Survey routes for white-tailed deer were originally 20 miles in length. Cook and Harwel
(1979) recommended lengths of 15 miles. That is the standard today. Original survey
routes for deer were chosen primarily depending upon accessibility with a goal of having
at least 2 per county. Over time some routes have changed because of urban
development or other loss of habitat. White-tailed deer spotlight surveys were mostly
designed to be summarized at the ecoregion level as opposed to the county level.
However, use of the data is common at the county level.
14
Spotlight surveys for deer are to be made from July 15 to October 15 each year and
started 45 minutes to 1 hour after official sunset. Due to time constraints, replicate
measurements on individual surveys are not done. Written protocols exist and are
followed for the most part. New observers are mentored by experienced employees.
Visibility of the area in which a deer can be observed is calculated either beforehand or
during the survey (Young et al. 1995). Observers with hand-held spotlights estimate
distance at which a deer can be observed at right angles from the path of the vehicle on
both the left and right. Distances are either estimated by the observers or measured by a
range finder. Visibility distance estimating procedures have varied from 0.1 to 0.5 miles
over time and among ecoregions.
Today, estimates at 0.1 mile are the standard. Once visibility distances are determined,
number of square yards on the survey is determined by multiplying length of the survey
by the average visibility width to determine number of visible acres. Total acreage of
visibility is divided by the total observed animals to provide a density estimate of
acres/deer (or other species).
Deer (or other species) sightings are called out to the recorder (usually the driver) who
either records the data on a form or on a hand-held tape recorder. When only a deer’s eye
shine is detected, binoculars are used to verify the species and/or sex and age. Numbers
of bucks, does, and fawns are recorded when the deer in a group can be differentiated.
When sex and age cannot be distinguished, the observation is recorded as undetermined.
Means are calculated but no variance parameters are computed. Data are stored
electronically in a centralized database with scheduled backups. Data are reported
primarily in Federal Aid reports but some districts report county data when providing
harvest recommendations in their local newspapers. The data are also reported on the
TPWD website.
15
Analysis: Basic assumptions for the spotlight technique are: 1) deer are evenly
distributed; 2) only deer within the calculated visibility are counted; 3) deer are equally
visible; and 4) deer are counted only once (Young et al. 1995). Most of these
assumptions are difficult or impossible to achieve.
Location of survey lines in the absence of sound sampling principles is one of the key
limitations to the method. In the case of deer surveys, bedded animals result in visibility
biases. Obviously, identification of species at night can be problematic. Number of
surveys for the scale of management need is an issue. Roads per se may be biased
sampling units because of attractiveness of vegetation in rights of way. In addition, the
assumption that deer are evenly distributed is more fiction than fact. Consequently, the
need for a sound sampling scheme is obvious.
During this review it was mentioned by employees often that several of the survey lines
have degraded significantly due to encroachment or habitat alteration. It was not clear in
the interviews if standard protocols exist or are communicated to survey teams when a
survey line should be abandoned.
Interviews also revealed that in some cases employees have become “blasé” regarding
conduct of these surveys (especially for white-tailed deer) and as a result attention to
standard protocols may be lacking. Other interviewees expressed concern that adequate
annual training was not being done. We also detected considerable variation in rigor of
data scrutiny before being entered into databases. Employees also indicated concerns
about validity and value of the data, especially at the county level and opinions of validity
of the measures vary considerably from region to region.
We detected variability in how visibility is measured and tested. Some reported visibility
distance of a white handkerchief in the back pocket of an observer as the standard. There
is also variation in how distances are estimated. Many of the more experienced observers
seemed to indicate they did so mostly from experience. Other survey teams are
consistently using range finders.
16

Considerable human and fiscal resources are expended annually to conduct these surveys.
In 2003, a total of 436,103 visible acres were surveyed by spotlight (Lockwood personal
communication). The agency is currently conducting a “Deer Survey Reduction
Analysis.” Use and validity of data from spotlight counts are a key part of this review.
The desire to be more efficient in use of fiscal and human resources is clearly understood
and appreciated.
Given advent of the Managed Lands Deer Program and the conduct of spotlight counts by
various private landowners within each county, legitimate questions regarding potential
for use of these data for measures of white-tailed deer densities by county are also being
asked.
Absence of a sampling basis for location of the original routes results in the inability to
determine relative “goodness” of the data generated. As with most sampling procedures,
there are only 2 ways to measure validity and that is precision and accuracy. In absence
of complete counts and absolute truth, it is impossible to measure accuracy, so precision
remains as the only valid measure of methodology performance.
Measures of precision for routes, counties, and ecoregions would be most helpful in
judging adequacy of the sampling methodology. Even in recognizing statistical limits of
the data, we were disappointed that little to no analyses of variability among spotlight
survey routes are done. These analyses would assist decision-makers in determining the
future of spotlight counts.
Recommendations: We believe the spotlight count method applied on a sound sampling
basis with strong written protocols could be an adequate estimator. Achieving this
however, would be difficult, if not impossible due to availability of potential survey lines
and available resources to conduct the surveys.
17
We recognize value of the long-term data set these surveys provide but users must fully
understand limits of the data produced and appreciate the scale at which they are most
applicable. Specific and detailed written instructions on what to do when a survey route
is lost due to human encroachment or other habitat fragmentation is needed and should be
provided to all survey teams.
We suggest the most appropriate question should be to determine what is the primary
need (use) of the data to be gathered? Once this need is identified, then it should be
determined what scale of application (ranch, county, ecoregion, state) is desired and the
level of precision needed to allow decision-makers to feel comfortable using those data.
Answers to these questions would greatly aid in developing an appropriate deer density
estimator.
If it is determined that deer density data based upon sound science and a sampling base is
needed, it would be first necessary to reallocate survey routes based on a sampling design
with sample routes allocated on the basis of optimum allocation procedures for various
expected densities of deer (i.e., low, medium, high). This process would reduce expected
variances and improve estimates generated. This design would also allow calculation of
confidence intervals, needed sample sizes to reach some level of precision, and power of
the test. These statistics would improve the scientific basis of the spotlight counts
immeasurably.
The method appears to be reasonably applicable across varying vegetation types and in
comparison to other potential methods is relatively easy to apply. There is an obvious
need to “tighten” protocols for estimating visibility and distances by survey teams. We
feel the use of a training video highlighting all aspects of spotlight surveys is needed and
would do much to improve consistency of the method. The potential for use of modern
technology such as GPS mapping, use of laser rangefinders to estimate distances, and
GPS units to document locations should be investigated and incorporated into the
methodology as appropriate.
18
Tests of the method as done by Harwell et al. (1979) and Progulski and Duerre (1964) are
needed and should be encouraged. We also suggest there is opportunity for additional
analyses of existing data with the goal of better understanding how variable or repeatable
these data are. A thorough look at some of the databases by a competent statistician
would be revealing and useful.
However, given conservative deer seasons, precise estimates of deer density may not be
necessary and cost and expense to obtain such may not be justified. This is a question
beyond the scope of this review and must be addressed in another forum.
Spotlight Surveys: Mule deer
Background: Spotlight counts for mule deer were first attempted during the 1970’s
(Litton 1972). Basic methodology follows that described for white-tailed deer. In 2003,
approximately 49 spotlight survey lines for mule deer were conducted (Brewer, personal
communication). Literature cited for basis of the method is mostly internal TPWD
documents. Training on use of the method is provided by experienced personnel.
Data are taken to determine trend in number of animals in sample areas, Data are
gathered at various scales but primarily aimed at management compartments with similar
habitat types. There are standardized data sheets and the data are stored in electronic
format in a centralized database. The only statistical parameter calculated to describe the
data is a mean. Data are reported in Federal Aid reports and in local newspapers.
Young et al. (1995) concluded that spotlight counts for mule deer did not provide a
means for predicting future events nor objective evaluation of management decisions.
They concluded that modeling tools provided a better approach to mule deer
management.
Availability of suitable roads for spotlight surveys is more limited in mule deer range
than for white-tailed deer. Access to private land is more difficult and some private roads
19
in the Trans-Pecos follow water sources resulting in overestimating biases (Brewer,
personal communication).
Analysis: Basic assumptions for the spotlight technique are: 1) deer are evenly
distributed; 2) only deer within the calculated visibility are counted; 3) deer are equally
visible; and 4) deer are counted only once (Young et al. 1995). Most of these
assumptions are difficult or impossible to achieve.
As discussed with spotlight surveys for white-tailed deer, absence of a sampling basis for
the survey routes is a major weakness. Undoubtedly, opportunity for biases from survey
roads are higher than experienced for white-tailed deer since some of the roads in mule
deer habitat follow water sources and those would bias estimates higher. As discussed
with white-tailed deer, inability to calculate variances from survey routes prohibits any
meaningful analyses of the scientific validity of the method.
Recommendations: Spotlight surveys for mule deer seem to provide little valid data for
mule deer management decisions. Aerial surveys, applied under a sampling protocol
would provide much better data. We recommend that resources expended for spotlight
counts for mule deer be transferred to helicopter surveys if possible.
Spotlight Surveys: American Alligator
Background: In 1971, 98 spotlight lines statewide were chosen according to accessibility
and possible presence of the American alligator. Now, approximately 50 lines varying
from approximately 10 to 20 miles in length are surveyed annually in select areas of
alligator habitat. Counts are conducted via motorized boat by at least 2 persons, an
observer and a driver. Speed is maintained from 5 to 10 mph and all counts are made at
air temperatures of 70 degrees or warmer. All observed alligators are categorized into
size classes. Total alligators observed are recorded. No estimate of distance to the
sighted animal is recorded. Often, total acreage of a water body is surveyed. Visual
sightings of alligators are categorized along the route into size classes. The observer
20
estimates a head length from the nostril to the eye. These estimates are translated into
total body estimated lengths (up to 7 feet). If the observer is unsure of the length, the
observation is to be recorded as an unknown.
Data are taken in areas where alligators exist and samples are allocated for each area as
resources allow. Written protocols exist and memos are sent out annually by the alligator
program to all personnel conducting the counts highlighting key aspects of the inventory.
New employees are trained by more experienced employees at the regional or district
level. Standardized data sheets are used in both hard copy and electronic formats. Data
are entered into Excel spreadsheets and updated annually. The alligator program staff
maintain, store, and back up the data. Data are reported in a CITES document.
The data are analyzed using regression techniques following (Taylor and Neal 1984). In
addition, a size frequency model is used (Taylor 1980) to determine minimal estimates by
multiplying adult alligators observed per linear mile by the adult multiplier.
Data from these surveys along with data from aerial nest surveys are used to determine
trend and abundance, as well as to document presence. These data are also used to
establish annual harvest recommendations within surveyed areas.
Analysis: Basic assumptions for the alligator spotlight technique are: 1) alligators are
evenly distributed; 2) all alligators are seen; 3) all alligators are equally visible; and 4)
alligators are counted only once. Most of these assumptions are difficult or impossible to
achieve. Basis for the methodology is established via several literature citations. The
method has been modified to fit varying ecosystem types and agency needs. Several
known biases are recognized including a lack of randomness for line locations, an under
estimate of approximately 75%, varying weather conditions and vegetation densities for
counts. Standard written protocols are followed and the same observers for individual
areas are used year after year. Scale of the measurements seems appropriate.
21

Recommendations: The greatest weakness of the method is lack of randomness for
survey lines. Establishing transect lines based on a sound sampling basis would
significantly strengthen results and allow for much stronger data analyses. It is also
suggested that opportunities to employ distance sampling methodologies be investigated
for alligator measurements, especially estimates of alligator nests.
The reader is referred to Appendix D for key literature citations describing distance
sampling techniques.
Spotlight Surveys: Furbearers and Javelina
Background: Numbers of furbearers and javelina encountered on spotlight surveys for
deer are routinely recorded, summarized, and reported. This is done to provide some
measure of relative abundance of these species over time. It was ascertained by the
review team that a main purpose for this effort is found in subchapter C (61.051) of
Texas Parks and Wildlife Laws which states “The department shall conduct scientific
studies and investigations of all species of game animals, game birds, and aquatic animal
line to determine …” No specific literature citations related to these surveys were
produced.
Since these data are taken secondarily on other inventory efforts such as deer spotlight
counts there is essentially no sampling design or designated scale for the data other than
those in place for the deer spotlight counts. Standard protocols do not exist for data
recording, storage, or retrieval. Little training on conduct of these surveys is done. Data
are reported in Federal Aid reports.
Analysis: For the method to be scientifically valid for any of the furbearers or for javelina
all of the previous assumptions discussed for the spotlight method would apply. In the
case of furbearers and javelina, potential for assumptions to be met is less than for species
such as white-tailed deer where a basis of white-tailed deer habitat was used to locate
22
survey lines. Little to nothing is known about sightability of the various species nor of
their distribution relative to roads etc.
Obviously, all limitations described for this methodology previously apply here. At the
very best, these data are no more than frequency of occurrence from which inferences of
abundance cannot be made.
It was also found that protocols for recording, summarizing, and reporting data for these
species were inconsistent among agency units. Little training in species identification,
standard protocols, or purpose of these measures was identified in this review. Issues of
scale relative to these surveys were not identified.
Recommendations: If it is determined need of occurrence data is sufficient to justify
efforts required to obtain them, it is recommended that all survey teams be periodically
briefed on standard protocols for data gathering, recording, summary, and reporting.
Reports presenting the data should clearly highlight and inform readers of limitations of
the data, especially noting absence of scientific basis for their acquisition.
Aerial Counts: Game Animals
Background: Various aerial counts are flown by the agency. Aerial counts are done for
white-tailed deer, mule deer, pronghorn, bighorn sheep, American alligators nests, and
waterfowl. Both helicopter and fixed-wing surveys are conducted, however fixed-wing
counts are more common. Helicopters are used for bighorn sheep, alligator nest surveys,
and occasionally for white-tailed deer.
Aerial counts were done for white-tailed deer as early as the 1950’s. Aerial surveys are
primarily used to count numbers of individuals or to determine sex and age composition.
A key advantage of aerial counts is that access to private land for application of the
method is much improved (Young et al. 1995). Aerial counts are expensive but Harwell
et al. (1979) found them the most cost-effective technique for estimating deer numbers in
23

Texas. Obviously, density of vegetation is a key factor in determining observability of
white-tailed deer from an aircraft.
Surveys are typically flown via transects using a standard width of visibility. One
hundred yards on each side of the aircraft is common (Young and Richards 1994).
However, depending upon species and vegetation types, width of transects can vary
widely.
Two observers are normal and flights are flown as close to the ground as practical (100-
150 feet) and at approximately 65 miles per hour. Flights are normally flown beginning
at sunrise and terminating approximately 1.5 hours later, and in the evening from 1.5
hours before sunset to sunset. Experience of observers and position of the sun relative to
flight direction are key factors in sightability of targeted species.
Analysis: Basic assumptions of aerial counts include 1) animals are evenly distributed;
2) only animals within the calculated visibility are counted; 3) all animals are equally
visible; 4) animal behavior is not affected by the noise or sight of the aircraft; and 5)
animals are counted only once. If surveys are conducted on a sampling basis (i.e., not a
total count or total coverage) it is also assumed that the individual sample units
(transects) are randomly located and that sample sizes are adequate to provide estimates
of suitable precision.
Aerial Counts: White-tailed Deer
Background: The most routine use for aerial surveys in Texas has been to determine
white-tailed deer trends using fixed-wing aircraft (Young et al. 1995). However, aerial
flights have also been used to determine effects of specific management practices such as
buck permits on deer densities (Gore et al. 1983).
Transects are surveyed from a fixed-wing aircraft traveling approximately 65 miles per
hour at an altitude of approximately 150 feet. Typically 2 observers count deer within
24
100 yards of the aircraft resulting in a total of 73 acres being surveyed for each mile of
transect flown (Young and Richards 1994). Aerial deer surveys are conducted annually
from August 15 through October 15. Herd composition (sex and age) is also frequently
determined from these surveys. Written protocols for the method exist. They were
distributed annually in the 1970s, and much less frequently since. Plans call for annual
distribution of written protocols in the future. (Lockwood personal communication).
Sample size is primarily determined by budget. In 1993, there were 622 aerial surveys
for white-tailed deer conducted. In 2003, 478 aerial surveys (547,008 acres) were flown
in Texas, with an average of 12 transects per county surveyed (Lockwood personal
communication).
Data are summarized at the county, reporting unit, ecoregion, and state-wide level.
Standard data recording forms are used. Most data are entered electronically and
maintained in a central database. The primary statistical parameter calculated is a mean.
Training of observers is primarily done during their first survey. Data are reported in
Federal Aid reports
Analysis: Basic assumptions for aerial surveys are: 1) deer are evenly distributed; 2) only
deer within the calculated visibility are counted; 3) deer are equally visible; and 4) deer
are counted only once (Young et al. 1995). It is also assumed that sample sizes are
adequate to achieve suitable levels of precision. For determination of precision levels it
is also assumed that data are generated from a statistically sound sampling basis. It is
also assumed for annual counts to be comparable there is no difference in observers.
Most of these assumptions are difficult or impossible to achieve.
Accuracy of aerial counts for white-tailed deer in Texas using a helicopter has been tested
(DeYoung 1985). Approximately 65 percent of marked animals were counted on the
Zachry Ranch and 36 percent of marked animals were sighted on the Chaparrral Wildlife
Management Area (DeYoung 1985). Fafarman and DeYoung (1986) concluded that
repeated spotlight surveys were more reliable than a single helicopter survey to determine
25

deer numbers. Since most white-tailed deer surveys in Texas are conducted from a fixed-
wing aircraft, information from this study is not directly applicable, but numerous other
investigators have found that typically about 66 percent or two thirds of known numbers
of animals are observed from aerial surveys (Bear et al. 1989). It is much less common
to produce over estimates of animals from aerial counts than underestimates. However,
clumped distributions of animals with inadequate sampling intensities can produce
overestimates (Cooke 1993, 1997).
Obviously, there are several factors that impact reliability of aerial counts such as animal
distribution (i.e., degree of “clumping” or aggregation of animals, independence of
individual animals, vegetative cover, scale of the individual observations relative to the
projected estimates, weather and observer competence). Investigators must be cognizant
of these factors in evaluating bias of aerial counts.
The agency recognizes violations of many of the assumptions for the method but little is
done to minimize or account for these biases. Consequently, valid use of the acquired
data is limited.
Recommendations: First the scale (i.e., ranch, county, ecoregion) needed for
management decisions should be determined and then all potential sampling areas within
that geographical unit should be determined. Transect lines sampling those areas should
then be allocated using a sound sampling design. This would allow calculation of valid
statistical parameters and allow users to determine the relative “goodness” of their data
and would produce data needed at the appropriate scale.
Density of vegetation is the key factor determining applicability of the method. More
tests with known numbers of marked deer within a variety of vegetation types would be
helpful in establishing sightability values for deer from aircraft. These data could then be
used to “correct” for under sighting biases of the method. Marked deer would also
provide valuable information on sightability biases of various sex and age classes to aid
in interpretation of herd composition measures.
26
Increased training of observers in application of aerial surveys is also needed. It is
recognized that differences between observers is common. Experienced observers are
much better at detecting deer from the air and steps should be taken to improve
consistency among observers. Finally, cost efficiency values should be calculated
comparing aerial surveys to spotlight surveys. This information would be useful in
evaluating the current agency study on “deer survey reduction analysis.” WMI
Recommendations: Staff members reported in our method evaluation questionnaire, “No
standardized data sheet is necessary. The use of pencil and note pad is sufficient. Some
observers like to use digital voice recorders as well.” Nevertheless, staff members
reported in comments on the draft of this report that standardized data sheets do exist. It
is recognized that annual counts are typically completed by the same experienced
observers each year but it is recommended that basic protocols of the method be
highlighted and distributed each year. Standard data forms must be used, and filed for
historical and verification purposes. WMI suggests TPWD concentrate more on
“quality” of surveys as opposed to “quantity” of surveys.
Aerial Counts: Mule Deer
Background: In 2003, 39 fixed-wing aerial transects were conducted for mule deer
(Brewer personal communication). Transects are flown during the first and last 2 hours
of daylight in September and October. Transects are allocated to mostly mule deer
habitats but it is recognized that there is a problem with co-occupation by white-tailed
deer resulting in a potential problem for species identification (Brewer personal
communication).
Data are collected at the management compartment level. Means are the only statistical
parameter calculated. Data are used to determine trends, make harvest recommendations,
and for decisions regarding regulation changes. Standardized and written protocols exist
and new observers are trained in the use of the method by experienced personnel. Data
are reported in Federal Aid reports and newspapers.
27

Analysis: Basic assumptions for aerial surveys are: 1) deer are evenly distributed; 2) only
deer within the calculated visibility are counted; 3) deer are equally visible; and 4) deer
are counted only once (Young et al. 1995). It is also assumed that sample sizes are
adequate to achieve suitable levels of precision. For determination of precision levels it
is assumed that data are generated from a statistically sound sampling basis. It is also
assumed for annual counts to be comparable there is no difference in observers. Most of
these assumptions are difficult or impossible to achieve.
Lack of a sound sampling basis for location of survey transects is a serious limitation to
the mule deer aerial surveys. Another concern is that trend data for mule deer are
calculated by combining data from 49 spotlight lines and 39 aerial transects. It is
doubtful these data are sufficiently similar to be combined. Again, in absence of a
sampling design it is not possible to calculate the necessary statistical parameters to make
this determination.
Little or no information is known about sightability biases for mule deer in the habitats
surveyed. Mule deer are classified to appropriate sex and age classes when possible. No
information is available on accuracy of observers in classifying sex and age classes and
the issue of species identification is a concern in some habitats. Inconsistencies exist
between scale of measurement and use of data.
Recommendations: We recommend the scale (i.e., ranch, county, ecoregion) needed for
management decisions be determined. We also recommend all potential sampling areas
within that geographical unit be determined and transect lines sampling those areas be
allocated using a sound sampling design. This would allow calculation of valid statistical
parameters and allow users to determine the relative “goodness” of their data and would
produce data needed at the appropriate scale.
Tests with known numbers of marked deer within mule deer habitats would be helpful in
establishing sightability values for deer from aircraft. These data could then be used to
28
“correct” for under sighting biases of the method. Marked deer would also provide
valuable information on sightability biases of various sex and age classes to aid in
interpretation of herd composition measures. We therefore recommend use of known
numbers of marked deer in various habitats to verify sightability values.
It is also recommended until it can be determined that data from mule deer spotlight
surveys and aerial surveys are similar, that combining the data sets not be done. It is
likely that this practice simply compounds and increases biases known to exist in the 2
methods and results in poorer data than would be realized if the databases were kept
separate.
Finally, modeling techniques commonly used by other mule deer investigators should be
utilized to assess biological population status. More emphasis would then be made on
obtaining valid herd composition and survival data as opposed to density data. This
recommendation was previously made by Young et al. (1995) and is still valid.
Aerial Counts: Pronghorn
Background: Estimates of pronghorn numbers and herd compositions are obtained by
aerial strip surveys of selected ranches and farms in the Panhandle, Tran-Pecos, and
Possum Kingdom Districts. Surveys are conducted annually during mid-June through
July. In 2003, approximately 243 total hours of flight time were expended.
Pronghorn are counted on transects spaced to achieve full coverage of units and transect
width is 0.25 miles or about 250 yards either side of the aircraft. Pronghorn are counted
from fixed-wing aircraft on strips spaced to achieve total coverage of selected ranches or
management units. All animals within that strip are counted. Total coverage of selected
ranches or management units is the objective. Lengths of transect vary according to
ranch or habitat boundaries. Observed pronghorn are classified into sex and age
categories as feasible. Data obtained from the surveys are used to determine trends,
permit issuance, and for decisions regarding regulation changes.
29

Data are gathered at the herd unit level. Written protocols exist and employees are
provided with instructions on how to conduct the count. Standardized data forms are
used and data are stored electronically in a centralized database. Experienced observers
provide training to new observers. Means are the statistical parameters calculated. Data
are reported in Federal Aid reports and in local newspapers.
Analysis: Basic assumptions for aerial surveys are: 1) total coverage is achieved with no
overlap or missed areas; 2) only pronghorn within the calculated visibility are counted; 3)
pronghorn are equally visible no matter direction of flight; and 4) pronghorn are counted
only once. It is also assumed for annual counts to be comparable there is no difference in
observers. Most of these assumptions are difficult or impossible to achieve.
It is not clear from information provided on this method if total coverage is achieved or
how this determination is made. Also no documentation exists on how observers are
trained to ascertain the 0.25 mile on each side of the aircraft. Accuracy of this method is
dependent upon consistent determinations of transect width so total coverage without
overlap or gaps is achieved. No information on sightability of pronghorn is available so
it is not possible to estimate under-estimating biases. Inconsistencies exist between scale
of measurement and use of data.
Recommendations: Little is known about accuracy or efficacy of this method with regard
to achieving total coverage of the areas surveyed. More rigid written protocols are
needed to guide observers in conduct of these surveys. In addition, information on
sightability biases is needed. It is recommended that tests with known numbers of
marked animals be conducted to address this lack of knowledge. Helicopters are
recommended over fixed-wing aircraft for pronghorn surveys because of improved
sightability values. However, fixed-wing aircraft have been used successfully elsewhere
for pronghorn surveys and will be less expensive. It is also recommended that the
agency seriously consider application of distance sampling techniques as an alternative
method for estimating pronghorn numbers. Distance sampling approaches could be done
30
from fixed-wing aircraft. Pertinent literature citations for distance sampling are presented
in Appendix D.
Aerial Counts: Bighorn Sheep
Background: Bighorn sheep in Texas are restricted to the Trans-Pecos region.
Helicopter surveys have been determined to be the most effective aerial platform for
bighorn surveys (Simmons and Hansen 1980). A complete count of each bighorn herd is
attempted and individuals are recorded by sex and 4 horn classes (males). Two observers
perform the counts. Timing of the surveys (late summer-early fall) is done to coincide
with the peak of rut reducing bias in measurements of ram to ewe ratios.
Areas to be surveyed are broken into square miles and flown 1 at a time. Typically a
square mile can be searched in about 5 minutes (Fisher and Humphreys 1990). Surveys
are done to determine numbers of animals for issuing hunting permits, and for decisions
regarding regulation changes
The scale for the measurements is at the management unit (individual herd) level.
Standardized data sheets are used and data are in electronic format and stored in a central
database. Observers are provided written protocols and training is provided by
experienced observers. Data are reported in Federal Aid reports and newspapers.
Analysis: Key assumptions include: 1) total coverage is achieved with no overlap or
missed areas; 2) bighorns are equally visible no matter direction of flight; and 3) bighorn
are counted only once and 4) all bighorns are seen without bias to sex and/or age. It is
also assumed for annual counts to be comparable there is no difference in observers.
Most of these assumptions are difficult or impossible to achieve.
It is not clear from information provided on this method if total coverage is achieved or
how this determination is made. Also no documentation exists on how observers are
trained to identify or mark boundaries of the individual square miles searched to achieve
31
complete coverage without overlap. Sightability values for bighorns in these habitats are
also unknown and if they existed would be useful in correcting for under estimates.
However, given the relatively conservative harvest rates for bighorn sheep, these biases
are probably not a big problem.
Recommendations: Given the limited distribution of bighorns in Texas it appears that the
method as applied is effective for purposes of the survey. It would be enlightening to
determine sightability values via known numbers of marked bighorns. Marked animals
would also help determine if total coverage of bighorn habitats is achieved. As with all
methods, development and issuance of standard protocols and training is a must and must
be consistently monitored. We recommend tests designed to measure detectability of
marked bighorns to add validity to these surveys.
Aerial Counts: American Alligator Nests
Background: Approximately 74 aerial nest transects of alligator habitat in the counties of
Jefferson, Chambers, Galveston, Orange, and Liberty along with total area surveys in
select portions of Harris, Fort Bend, Brazoria, and Matagorda counties are conducted
annually. Counts are made with a helicopter flying selected transect lines in coastal
habitats. Transects are 1 mile apart. Counts are made from approximately 300 feet
elevation and at speeds of 60 miles per hour. Two observers are used in the survey, 1
spots and records alligator nests within a certain distance from the centerline. In written
materials provided to the review team the distance was reported as 0.25 mi. In review of
the draft report, staff members indicated the survey distance as 100 meters. The second
observer documents nest locations using a GPS and directs course of travel of the
helicopter. Counts are done at the same time each year.
Data obtained from the survey are used to determine the breeding potential of a given
area, determine alligator trend and abundance, and are used to set harvest quotas. Scale of
the measurement is basically each management area where alligators are found. A nest
multiplier (60) is used to determine minimum numbers (Taylor 1980).
32
Regression techniques are used to analyze the data. Data are stored in electronic format
and the Alligator Program Staff maintains the data. Efforts are being made to store this
information suitable for use by GPS, Arc View, and GIS software. Data are reported in a
CITES document.
Analysis: Basic assumptions for this method are: 1) all nests within the transect
boundaries are detected and recorded; 2) 0.25-mile widths of transects are accurately
determined; 3) transects are allocated based upon a valid sampling scheme; observers are
consistent in recognizing nests; and 4) transects are accurately located and flown each
year.
Once again there is no sound sampling basis for location of transects. Consequently, it is
not possible to calculate various statistical parameters that would be useful in evaluating
this method. It is also unknown if nest detection tests are done to verify accuracy of
observers and to determine factors most important in next detection.
Written protocols exist and are made available to observers. Observers are mostly
experienced and are the same from year to year. These precautions are helpful in
reducing some biases of the method. No information was provided on how observers are
trained to estimate the 0.25 mile width of transects.
Recommendations: This method is especially suitable for distance sampling
methodology. Distance sampling would allow for more accurate and precise estimates of
alligator nests and would not involve a tremendous cost to implement. It would be best if
all potential transects were identified and then a portion of these randomly selected for
sampling to allow for valid calculation of statistical parameters. It is recommended that
distance sampling be investigated and implemented for estimating numbers of alligator
nests. Pertinent literature citations for distance sampling are provided in Appendix D.
33

Aerial Counts: Goose Regulatory Survey
Background: According to written materials provided to the review team this survey is
an annual effort to obtain a total count for all goose species and their subspecies that over
winter in Texas. Comments by staff members in review of the draft of this report
indicated that the only species or subspecies considered in this survey are Canada geese
and that total counts of geese are obtained only in certain areas. Given that this survey is
basically a total count, there is no sampling involved. All areas where geese are located
are surveyed via fixed-wing aircraft by the same pilots and observers each year. Annual
training is provided to observers each year by the most experienced observers and a
software program named “Wildlife Counts” is used as a training tool for each observer.
The literature basis for this methodology is Trost et al. (1990).
No standardized data forms or written protocols for this technique were provided during
the review. Data are recorded via paper and pencil or with portable tape recorders. After
the survey, each observer sends their data to the Waterfowl Program Staff where it is
entered into a spread sheet. Recently, each observer enters their data into their own
spread sheet and then sends the information to the Program Staff.
The scale of the data is at the ecoregion level and totals for ecoregions are summarized to
arrive at estimates for the state. Data obtained from this survey are used to determine
numbers of geese in Texas each winter so trends over years and from ecoregion to
ecoregion can be calculated. These data help serve as the main source of information for
some goose populations in North America. Management plans for Tall Grass Prairie and
Short Grass Prairie Canada geese are driven by the midwinter counts. The data are
reported to the appropriate flyway representatives and are published in the Central
Flyway Data Book. Thus, they are used by the Fish and Wildlife Service and the
Flyways on an annual basis to set hunting seasons and bag limits. Data are also used by
the agency to provide information to the public on goose numbers and distribution.
34
Analysis: The method assumes: 1) counts by observers are consistent from area to area
and from year to year; 2) pilots are consistent in flight protocols each year; 3) observers
are consistent in species identification over years and among areas; and 4) total coverage
is achieved each year. Since this survey is aimed at a total count, assumptions related to
sampling protocols do not apply. However, for counts to be comparable from year to
year it is critical that observers and protocols are consistent. Importance of these data to
other states and to the Fish and Wildlife Service has resulted in consistent and rigorous
implementation of this method. These characteristics have strengthened validity of the
method. Standardized data sheets or recording methods are not used.
Various statistical parameters such as mean, variance, and regression coefficients are
used to compare data. Data are stored electronically and available for prompt recall.
Recommendations: Staff members reported in our method evaluation questionnaire, “No
standardized data sheet is necessary. The use of pencil and note pad is sufficient. Some
observers like to use digital voice recorders as well.” Nevertheless, staff members
reported in comments on the draft of this report that standardized data sheets do exist. It
is recognized that annual counts are typically completed by the same experienced
observers each year but it is recommended that basic protocols of the method be
highlighted and distributed each year. Standard data forms must be used and filed for
historical and verification purposes.
Aerial Counts: Midwinter Waterfowl Survey
Background: Estimates of wintering ducks are used to monitor changes in distribution
and abundance and to guide hunting recommendations. These surveys are part of the
nationwide coordinated estimate of ducks and are done in conjunction with the Fish and
Wildlife Service. Texas is divided into 7 ecoregions (Brush Country, Sand Plains,
Coastal, Pineywoods, Oak woodlands/Blackland prairie, Rolling Plains, and High Plains)
for duck surveys. Counts are normally done during January. No supporting literature for
the method was provided.
35

Surveys are made from 99 permanently established transects allocated across ecoregions.
Total transect numbers vary, but in most ecoregions a 1% sample of each is surveyed. All
waterfowl observed in a quarter mile wide transect are counted. Linear distance of
survey lines is approximately 60 miles. In addition to total waterfowl observed,
unoccupied habitat is also recorded for use in developing density estimates.
In the High Plains ecoregion, playa lakes are the primary habitat and are sampled by a
random 2 percent of the playas (approximately 220). Playas are located via GPS
coordinates and all waterfowl on the playa are counted. Upon completion of the surveys
data are submitted to agency statisticians to compute estimates of waterfowl by ecoregion
and on a statewide basis. Density estimates are also calculated for each species in each
ecoregion accompanied by standard errors, coefficients of variation, and confidence
levels for each ecoregion and statewide. These scales are appropriate for the data
obtained. Experienced observers conduct the counts. Data are reported in Federal Aid
reports and provided to the U.S. Fish and Wildlife Service for use in the nationwide
coordinated waterfowl surveys.
Analysis: Basic assumptions for this method include: 1) observers are consistent from
area to area and from year to year; 2) pilots are consistent from area to area and from year
to year; 3) transect widths are estimated accurately and consistently; 4) species
identification are consistent between areas and among years; 4) sample sizes are
adequate; and 5) random basis for transect and playa locations are valid.
Involvement in the design and application of this survey by agency statisticians
strengthens this method. Calculation of confidence intervals by ecoregion and statewide
allow users to understand limits of the data. Use of GPS technology further strengthens
application of this technique. No written protocols or standardized guidelines for this
method were provided to the review team.
36

Recommendations: Standard procedures outlining details of the method, including how
transect widths are to be determined, should be prepared and distributed to all observers.
Overall, the midwinter waterfowl survey is a good example of use of sampling design
and survey rigor. Consultation and involvement of agency statisticians is beneficial and
adds much to the scientific validity of the data. We recommend other agency units
follow this example.
Herd Composition Counts
Herd Composition Counts: White-tailed Deer
Background: Herd composition counts are done to determine makeup of white-tailed
deer herds by sex and age categories. These data are used to determine trends, to
establish annual hunting seasons, and for making regulatory changes. Bucks are
differentiated from does and fawns are recorded separate from adults. Typically herd
composition measurements are made from either ground or aerial counts. The most
common ground counts where herd composition data are taken are spotlight counts and
mobile surveys. However, composition data are also taken as possible from various
incidental observations.
The review team was not given any specific protocols for herd composition measures
beyond those presented in the 1995 Federal Aid report (Young et al. 1995). Absence of
updated, written protocols limits our ability to fully evaluate the measurements. They
seem to be mostly “by-products” of other surveys. However, their use in harvest
regulation setting is important and thus a key inventory method for the agency.
Information on methodologies for herd composition counts mainly came from Federal
Aid reports and individual employee interviews. No specific training was identified.
The 1995 Federal Aid report (Young et al. 1995) provided the following guidelines for
herd composition measures while investigators are conducting mobile white-tailed deer
surveys: “Surveys should be driven at a speed of 7 to 8 mph. In addition to recording
37
total deer seen, record the age and sex of observed deer when possible. When a group (2
or more) is observed, the entire group should be classified as unknown unless all deer in
the group were identified. Binoculars should be used only to identify sex and age classes
of deer.”
In some ecological regions such as the Pineywoods, herd composition estimates are
derived from spotlight surveys due to inadequate incidental observations (Wolf 2003).
However, there is concern by biologists that fawns are underestimated on spotlight counts
(Wolf 2003).
Where feasible, aerial counts as described elsewhere in this report, are also used to obtain
herd composition data. Observers attempt to classify all deer seen as to the appropriate
sex and age category. In general, aerial counts provide the largest sample sizes and
potentially the best distribution coverage.
Incidental sightings of does, fawns, and bucks are also made in some districts in August,
September and October (Wolf 2003). Herd composition data are tabulated and reported
to the White-tailed Deer Program Coordinator by November 15 each year. Data are
stored electronically in a central database. Percent fawns, bucks, and does are calculated
as are does per buck, fawns per doe and fawns per adult. Federal Aid reports annually
present herd composition data and deer density data for each ecological area in Texas
(Wolf 2003).
Analysis: Key assumptions include: 1) deer seen and classified are representative of the
biological population; 2) observers accurately classify deer; 3) adequate sample sizes for
each sex and age category are obtained; and 4) unclassified deer do not bias the estimates.
Once again there is no sound sampling basis for acquisition of these data. Consequently,
it is not possible to calculate various statistical parameters that would be useful in
evaluating this method. There is also a real need to clearly define the scale where the
data will be used (i.e., ranch, county, ecoregion, state) and then design a sampling scheme
to meet this scale. There is a definite need for the agency to determine importance of
38

these data in management decisions. If they are important, then efforts should be made to
develop sampling methods that will produce reliable data at the scale specified.
The assumption that deer observed (statistical population) are representative of the
biological population is very difficult to achieve without thorough coverage of the area to
be estimated. Incidental counts, mobile counts, and spotlight counts restricted to limited
roads are by design likely to not adequately sample the intended biological population.
Aerial counts address this concern much better than do limited ground counts.
Observer errors are another concern. All people are not created equal with regard to
visual acuity. Factors like changing animal size and vegetative cover require scheduling
of measurements by the same experienced observers at approximately the same time of
the year. Observers need training on techniques of determining age and sex categories.
The practice of combining data from incidental counts with aerial or mobile counts is
questionable and results in data with unknown and undoubtedly mixed biases. There is no
basis for evaluating data from incidental counts and unless it is demonstrated statistically
that data are similar from separate surveys, they should not be combined. Sex and age
parameters are variable and difficult to measure even when specific surveys are designed
to do so. In some ecological areas number of deer identified “incidental” to other surveys
greatly exceeds the number of deer seen on surveys (Wolf 2003).
In absence of statistical data it is not possible to determine necessary sample sizes but
from experience elsewhere, herd composition measures require large samples before
differences could be detected. Sample sizes of deer classified as to specific sex and age
class for the various estimates are not readily available but it is suspected that sample
sizes for many estimates across Texas are grossly inadequate.
Herd composition parameters are difficult to measure accurately. The problem of
unclassified deer is a significant problem. It is impossible to know if there is a consistent
bias in those deer classified as unknowns. For instance, it is easier to classify certain
39

animals (i.e., antlered) than it is for others. The problem of distinguishing fawns from
adults is a difficult problem, especially under poor visibility such as on spotlight counts.
There is no evidence that the guidelines of Young et al. (1995) stating, “When a group (2
or more) is observed, the entire group should be classified as unknown unless all deer in
the group were identified” are followed. Absence of close scrutiny to this problem by
observers is troubling.
Recommendations: First, it should be determined if herd composition data are important
and necessary for regulatory purposes. If they are then it is recommended that the agency
recognize weaknesses in their current approach and identify the appropriate scale for the
measurements.
The current approach of taking herd composition data as possible while doing other
surveys is not advisable and the practice of combining herd composition data from
incidental counts and from surveys should be discontinued unless and until it is clearly
demonstrated that data are representative and of adequate quality to justify the
combination. Attention must be given to sampling protocols specifically designed to
measure herd composition that will ensure broader coverage of the biological populations
from which inferences are being made. Once these sampling protocols are in place, then
various statistical calculations will facilitate further design modifications.
Herd composition data taken from spotlight surveys need special scrutiny. Tests need to
be designed to ascertain ability of observers to accurately classify sex and age cohorts
under reduced visibility that occurs in these surveys. In absence of knowing these biases,
or without correction factors, it is probable that fawn abundance is under estimated. The
potential to use marked animals of known sex and age (unknown to the observer) should
also be examined as a way to train observers.
Minimum sample sizes required for each sex and age category that would produce
detectable differences need to be determined. Utilizing sample size recommendations in
the published literature from other states would be a logical starting point.
40

Written specific protocols for making herd composition measurements need to be
developed and distributed to all observers. Specifically, the problem of unclassified deer
in a group needs attention and protocols for handling unclassified deer needs to be spelled
out. Efforts to develop more accurate and consistent determinations by observers are
needed. Training sessions where multiple observers classify the same animals and then
compare notes are useful and should be encouraged. Development and use of videos and
photos demonstrating key factors that observers should focus on when classifying deer
are recommended.
Herd Composition Counts: Mule Deer
Background: Herd composition counts are done to determine makeup of mule deer herds
by sex and age categories. These data are used to determine trends in herd structure, to
establish annual hunting seasons, and for making regulatory changes. Bucks are
differentiated from does and fawns are recorded separate from adults. Typically herd
composition measurements are made from either ground or aerial counts. The most
common ground counts where herd composition data are taken are spotlight counts and
mobile surveys. However, composition data are also taken as possible from various
incidental observations. Data are stored electronically in a central database. Percent
fawns, bucks, and does are calculated as are does per buck, fawns per doe and fawns per
adult. Data are reported annually in Federal Aid reports.
Much of the specific information presented in the write up on herd composition counts
for white-tailed deer apply for mule deer as well and will not be repeated here. Again,
the review team was not provided specific written protocols for herd composition
measurements for mule deer and they too seem to be generally “by-products” of other
survey efforts. Most of our information on methodology was found in annual Federal
Aid reports. No specific training was identified.
41

In a 2003 Federal Aid report (Bone 2003) wrote that “mule deer herd composition counts
(incidentals) of buck, does, and fawns will be made throughout all habitat types to
provide a representative sample for each identifiable subpopulation or antlerless deer
harvest compartment.” Bone went on to write that “the desired samples from each unit
shall be 100 does and accompanying bucks and fawns.” He further explained “herd
composition data includes all identified deer observed during aerial and spotlight
surveys.” Herd composition counts are to be conducted during September to October
annually (Bone 2003).
Analysis: Basic assumptions of the method are 1) deer seen and classified are
representative of the biological population; 2) observers accurately classify deer; 3)
adequate sample sizes for each sex and age category are obtained; and 4) unclassified
deer do not bias the estimates.
Most of the analysis presented for herd composition measurements for white-tailed deer
apply for mule deer and will not be repeated. Once again, absence of any sampling
designs greatly limits value of the measurements. Many of the other concerns discussed
for white-tailed deer are even greater for mule deer. Due to lower densities of mule deer,
sample sizes are greatly restricted and inadequate. As discussed previously, many
survey lines for estimating densities of mule deer that frequently follow water sources
bring special biases to the measurements and further challenge the assumption of
obtaining data that are representative of the biological population to which inferences will
be made.
Samples for mule deer herd composition measures are hard to obtain for several
management compartments (Bone 2003). A total of 11 compartments had 10 or fewer
deer classified in 2002 (Bone 2003).
There is also a need to clearly define the scale where the data will be used (i.e., ranch,
county, ecoregion, state) and then design the sampling to meet this scale. There is a
definite need for the agency to determine importance of these data in mule deer
42
management decisions. If they are important, then efforts should be made to develop
sampling methods that will produce reliable data at the scale specified.
Absence of written and widely distributed protocols detailing sample size requirements
and instructions for observers on how to handle unclassified deer limits continuity of the
measurements. The review team found no evidence that the sample size requirement of
100 for each management unit specified by Bone (2003) is known or expected to be
achieved. Aerial surveys have the best potential for obtaining desired sample sizes and
needed sample distribution. In general, mule deer habitats are better suited for aerial
surveys than white-tailed deer habitats.
Formalized training for observers is lacking and would improve data gathering processes
considerably. Efforts to determine necessary sample sizes to achieve a stated level of
precision for the various sex and age components are not done.
Recommendations: First, it is important for the agency to determine if mule deer herd
composition data are important and necessary for regulatory purposes. Secondly, if
composition data are needed, a proper scale for those measurements must be determined.
The current approach, of taking herd composition data as possible while doing other
surveys, is a basic weakness. Attention must be given to sampling protocols specifically
designed to measure herd composition that ensure broader coverage of the biological
populations from which inferences are being made. Once these sampling protocols are in
place, then various statistical calculations will facilitate further design modifications. The
publication by Bowden et al. (1984) would be a good reference for suggestions on design
of herd composition measures.
Herd composition data taken from spotlight surveys need special scrutiny. Tests need to
be designed to ascertain ability of observers to accurately classify sex and age cohorts
under reduced visibility that occurs in these surveys. Potential to use marked animals of
43

known sex and age (unknown to the observer) should be examined as a way to train
observers.
Minimum sample sizes required for each sex and age category that would produce
detectable differences need to be determined. Utilizing sample size recommendations in
the published literature from other states would be a logical starting point. The current
practice of combining herd composition data from incidental counts and from other
surveys should be discontinued unless it is clearly demonstrated that data are
representative and of adequate quality to justify the combination.
Written specific protocols for herd composition measurements need to be developed and
distributed to all observers. Specifically, the problem of unclassified deer in a group
needs attention and protocols for handling unclassified deer should be spelled out.
Training efforts to develop more accurate and consistent determinations by observers
should be developed and made available to pertinent employees. Development and use of
videos and photos demonstrating key factors that observers should focus on when
classifying deer are recommended.
44
Call Counts: Upland Game Birds Background: Call-count surveys are used by TPWD to monitor numbers of pheasant,
chachalaca, mourning doves, and white-winged doves and establish harvest regulations
for these species. Vocalizations are counted over a fixed period of time and used as an
index to abundance. The pheasant crow count is reportedly similar to the methodology
used by Kimball (1949). The chachalaca call counts reportedly are a modification of
methods used by Marion (1974) to index plain chachalaca abundance in South Texas.
Analysis: A basic assumption for call-count surveys is that vocalization rates and other
factors affecting the probability of detecting calls are constant across lines and across
years. Probability of detection is known or believed to vary in response to many factors,
including weather, habitat conditions, season of the year, time of day, and observer
performance. Some sources of variation in detection probability can be overcome by
standardizing data collection procedures, but it often is not possible to address or even
identify other factors that cause variability in this probability. Consequently, unless data
to test the assumption of constant detection probability are collected routinely as part of a
standard data collection, “a large degree of caution and skepticism” is recommended
when these surveys are used and interpreted (Lancia et al. 1994, Anderson 2001).
Call Counts: Ring-necked Pheasant
Background: Call-count survey activities were initiated in the Coastal Prairie to monitor
the status of pheasants and the impact of releases or pen-reared and wild-trapped birds.
Dense vegetation in this region limits visibility and prevents use of pheasant roadside
counts.
Call counts are conducted once each year during April along 17, 20-mile along historical
routes. No information was found on calculation of this sample size. Replicate
measurements on individual survey lines are not done. Each survey begins 40 minutes
before sunrise. Observers stop at 1-mile intervals and listen for 3 minutes. At each stop,
45
the observer records all pheasant crows heard, and the total number of pheasants heard
crowing. All pheasants observed during the survey are recorded by sex. Cloud cover,
temperature, and wind velocity and direction are recorded at the beginning and end of
each survey route. Counts are not conducted when wind velocities are greater than 10
mph.
The pheasant call-count survey data are used to determine distributions, relative densities
and trends. This information, in turn, is used in conjunction with harvest estimates from
the small game harvest survey in making harvest recommendations.
Analysis: Use of pheasant call-count survey data to make valid comparisons of
abundance over time or across areas requires that the number of vocalizations counted
during a fixed period of time must be proportional to abundance. This, in turn, requires
that vocalization rates, listening time length, and effective area sampled are constant
(Luukkonen et al. 1997). These factors are known to vary in response to weather, habitat
conditions, interfering noise, reproductive status, season of the year, time of day, and
observer performance. TPWD has adopted a number of standardized data collection
procedures to address sources of variation in detection probability. For instance, to
minimize known factors that can cause variation in detection probabilities, the survey line
protocol requires that lines be conducted 1) beginning 40 minutes before sunrise, 2)
during April each year, and 3) when wind velocities are less than 10 mph. We did not
find evidence of measures that would reduce variation among observers, such as
standardized forms for recording data, written observer protocols, or uniform training
programs. The absence of these materials likely contributes to variation in detection
probabilities.
In contrast to Kimball (1949), Luukkonen et al. (1997) found in Michigan that there were
rapid temporal changes in crowing rates and emphasized the importance of maintaining
consistency in the timing of surveys. They suggested beginning surveys 30 minutes
before sunrise and ending 30 minutes after sunrise. This interval bracketed the morning
peak in crowing and eliminated the early period of the survey when crowing rates are low
46

and count variation is relatively high. These results suggest that it could be important to
determine the relationship of crowing activity to time of day over the course of the
morning in the Coastal Prairie. In addition, it often is not possible to address or even
identify sources of variation in detection probability. These problems can result in
seriously erroneous interpretations of data (Anderson 2001). Slight differences in
detection probabilities (due to differences in vegetation, observers, etc.) can lead to
completely opposite conclusions about differences in numbers. Probability of detection
needs to be measured (empirical estimate) to allow the incomplete count of an index
value to have meaning.
As with other surveys, location of survey lines in the absence of sound sampling
principles is 1 of the key limitations to the method. Pheasant call-count survey lines are
conducted from roads located along historic routes. Roads per se may be biased
sampling units because of attractiveness of vegetation in rights of way. In addition, the
method of locating survey lines assumes that pheasants are evenly distributed across the
ecoregion being sampled, which is unlikely.
Absence of a sampling basis for location of call-count survey lines results in the inability
to determine relative “goodness” of the data generated. As with most sampling
procedures, precision and accuracy are the only 2 ways to measure validity. In absence
of known biological populations, it is impossible to measure accuracy, so precision
remains as the only valid measure of methodology performance. Measures of precision
for routes, counties, and ecoregions would be most helpful in judging adequacy of the
sampling methodology.
We do not agree with the TPWD’s Federal Aid reports (e.g., DeMaso et al. 2001) that
there currently is sufficient basis on which to conclude that the data from pheasant call-
count surveys are drawn from adequate sample sizes or that they provide the necessary
information on distributions, relative densities, and trends for use in management.
47
Recommendations: Given that numbers of pheasants in the Coastal Prairie have
experienced a steady decline since the initial releases of birds and that there is a
corresponding decline in hunter interest, a determination should be made as to whether
continued trend count data for pheasants is needed to adjust harvest regulations or
provide information to hunters. Consideration should be given to alternate means of
achieving these goals, such as use of information on changes in habitat condition. If it is
determined that trend count data is necessary to achieve TPWD’s objectives, then a
second determination should be made concerning the scale of desired application (county,
ecoregion, state) and the level of precision needed to allow decision-makers to feel
comfortable using those data. Following these decisions, a number of changes to the
current protocol should be made to place it on a more sound scientific footing.
First, survey routes should be reallocated based on a sound sampling design with sample
routes allocated on the basis of optimum allocation procedures for various expected
densities of pheasant (i.e., low, medium, high). This process would reduce expected
variances and improve estimates generated. This design would also allow calculation of
confidence intervals, needed sample sizes to reach some level of precision, and power of
the test. These statistics would improve the scientific basis of the call counts
immeasurably.
Second, the annual collection of call counts based on a sound sampling design should be
accompanied by routine collection of data designed to test the assumption of constant
detection probability and identify sources of variation. As noted above, absent this
second effort, a large degree of caution and skepticism should be exercised in using and
interpreting these surveys, particularly in interpreting changes in counts from 1 year to
the next.
Third, additional efforts should be made to remove some of the remaining variation
associated with observers and counting methodology by requiring uniform training for
observers, written protocols and standardized data reporting forms, if these do not already
exist.
48
Finally, a forthright statement should accompany any report of the results of the pheasant
call-count survey that indicates the scale to which the data apply, the potential sources of
bias that could affect the accuracy of the data, the imprecision of the data, and the
importance of interpreting it cautiously.
Call Counts: Chachalaca
Background: Chachalaca are surveyed on a representative sample of hunted and non-
hunted tracts of native brush within the species’ occupied range in Cameron, Hidalgo,
Staff, and Willacy Counties. No information was found on sampling design or
calculation of sample size, although DeMaso et al. (2001) report that sample size is
adequate. The design of the survey appears to have changed in 2003. Prior to that date,
it was reported that surveys were conducted once each year during the first week of May.
The survey consisted of “about 40 stops” at least 0.5 miles apart in suitable habitat. The
number of chachalaca duets heard per stop was recorded for 2 hours beginning at local
sunrise. In 2003, it was reported that the surveys would be conducted during the last
week of May in conjunction with white-winged dove breeding surveys, and that the
survey would consist of approximately 300 stops in suitable habitat. We did not find
information on the listening time length at each stop either prior to 2003 or subsequent to
that time.
Data from the surveys are used to estimate chachalaca distribution, relative abundance,
and trends in the Lower Rio Grande Valley. This information reportedly is used in
decisions about harvest regulations and for presentation to the public prior to hunting
season.
Analysis: Use of chachalaca call-count survey data to make valid comparisons of
abundance over time or across areas requires that the number of vocalizations counted
during a fixed period of time must be proportional to abundance. This, in turn, requires
that vocalization rates, listening time length, and effective area sampled are constant
(Luukkonen et al. 1997). These factors are known to vary in response to weather, habitat
49
conditions, interfering noise, season of the year, time of day, observer performance,
amount of vehicle traffic, and intrinsic species-specific factors such as matedness.
TPWD has adopted a number of standardized data collection procedures to address
sources of variation in detection probability. For instance, to minimize known factors
that can cause variation in detection probabilities, the survey line protocol requires that
lines be conducted during May for 2 hours beginning at sunrise, although there appears to
have been a recent change in the number of stops and period during May in which the
survey is conducted.
We did not find evidence of measures that would reduce variation among observers, such
as standardized forms for recording data, written observer protocols, or uniform training
programs. The absence of these materials likely contributes to variation in detection
probabilities. In addition, as noted elsewhere, it often is not possible to address or even
identify sources of variation in detection probability. These problems can result in
seriously erroneous interpretations of data (Anderson 2001). Slight differences in
detection probabilities (due to differences in vegetation, observers, etc.) can lead to
completely opposite conclusions about differences in numbers of birds. Probability of
detection needs to be measured (empirical estimate) to allow the incomplete count of an
index value to have meaning.
As with other surveys, location of survey lines in the absence of sound sampling
principles is one of the key limitations to the method. Non-random location of sample
units is an important source of bias. Chachalaca call counts are conducted from roads
and roads per se may be biased sampling units because of attractiveness of vegetation in
rights of way. In addition, the method of locating survey lines assumes that chachalacas
are evenly distributed across the ecoregion being sampled, which is unlikely.
Absence of a sampling basis for location of call-count survey stops results in the inability
to determine relative “goodness” of the data generated. As with most sampling
procedures, precision and accuracy are the only 2 ways to measure validity. In absence
of known biological populations, it is impossible to measure accuracy, so precision
50
remains the only valid measure of methodology performance. Measures of precision for
would be most helpful in judging adequacy of the sampling methodology.
We do not agree with TPWD’s Federal Aid reports (e.g., DeMaso et al. 2001) that there
currently is sufficient basis on which to conclude that the data from chachalaca call-count
surveys are drawn from adequate sample sizes or that they provide the necessary
information on distributions, relative densities, and trends for use in management.
Recommendations: Because there is “very little hunting for chachalacas on private land
in Cameron, Hidalgo, and Starr Counties, and most of the existing native brush which
comprises Plain Chachalaca habitat is owned by either the U.S. Fish and Wildlife Service
or TPWD,” a determination should be made as to whether the current survey is needed to
adjust harvest regulations or provide information to hunters. If it is determined that trend
count data is necessary to achieve TPWD’s objectives, then consideration should be
given to re-design of the chachalaca call-count survey. It currently appears to be
conducted in conjunction with the white-winged dove call-count survey, which itself is in
the process of being re-designed. Attention should be paid to whether a common
sampling design and methodology is appropriate to simultaneously count white-winged
doves and chachalacas. In any design, a determination should be made concerning the
level of precision needed to allow decision-makers to feel comfortable using data on
chachalacas. Following these decisions, a number of changes to the current protocol
should be made to place it on a more sound scientific footing.
First, listening stations should be reallocated based on a sound sampling design with
sample routes allocated on the basis of optimum allocation procedures for various habitat
strata or expected densities of chachalaca (i.e., low, medium, high). This process would
reduce expected variances and improve estimates generated. This design would also
allow calculation of confidence intervals, needed sample sizes to reach some level of
precision, and power of the test. These statistics would improve the scientific basis of
the call counts immeasurably.
51
Second, the annual collection of call counts based on a sound sampling design should be
accompanied by routine collection of data designed to test the assumption of constant
detection probability and identify sources of variation. As noted above, absent this
second effort, a large degree of caution and skepticism should be exercised in using and
interpreting these surveys, particularly in interpreting changes in counts from 1 year to
the next.
Third, additional efforts should be made to remove some of the remaining variation
associated with observers and counting methodology by requiring uniform training for
observers, written protocols and standardized data reporting forms, if these do not already
exist.
Finally, a forthright statement should accompany any report of the results of the
chachalaca call-count survey that indicates the scale to which the data apply, the potential
sources of bias that could affect the accuracy of the data, the imprecision of the data, and
the importance of interpreting it cautiously.
Call Counts: Mourning Dove
Background: The mourning dove call-count survey was developed to provide an annual
index to bird numbers (Dolton 1993). In the United States, the survey currently includes
more than 1,000 randomly selected routes stratified by physiographic region. The total
number of doves heard on each route is used to determine trends and provides the basis
for determining an index to numbers of breeding birds during the breeding season. Each
call-count route is usually located on secondary roads and has 20 listening stations spaced
at 1-mile intervals. Current call-count procedures (Dolton and Rau 2004) provide that at
each stop, the number of doves heard calling during a 3-minute period, the number seen,
and the level of disturbance (noise) that impairs the observer's ability to hear doves are
recorded. The number of doves seen while driving between stops is also noted. Counts
begin 1/2- hour before sunrise and continue for about 2 hours. Routes are run once
between 20 May and 31 May. Surveys are not made when wind velocities exceed 12
52
miles per hour or when it is raining. In addition, GPS coordinates have been established
for all listening stations to reduce the likelihood that new observers stop at different
locations and reduce the variance between habitat variables associated with counts of
doves heard at that stop. In 2003, counts were completed on 127 of the 133 routes due to
budget cuts and hiring freezes.
Written protocols are provided on the back of a standardized form and in a cover memo
to all observers sent every year prior to the survey. Training is provided when there is a
change of observer. The previous observer accompanies the new observer to identify the
route, stopping points and general procedures, and answer questions.
Data are provided to the U.S. Fish and Wildlife Service for use in the coordinated
Nationwide Mourning Dove Breeding Population Survey to provide spatially explicit
information on trends in numbers of mourning doves nationwide.
The mourning dove call-count breeding trend data is used at the Management Unit scale.
The Service records trends by state even though the survey was not designed at that scale.
Federal hunting regulation frameworks in Texas and elsewhere frequently are set at finer
scales than this. Data also are used by TPWD to develop harvest recommendations and
management programs in Texas by hunting zone, ecological area and county. Data are
reported in Federal Aid reports, to sports writers and hunters for hunt forecasts, and on
request to TPWD administrators, advisory board members and Commissioners.
Analysis: The mourning dove call-count survey is conducted in accordance with
experimental design and statistical procedures established by the Service. Others who
have looked at this nationwide survey have concluded that it is adequate for estimating
long-term trends over large areas (Baskett 1993). Evaluation of the scientific basis of the
mourning dove call-count survey is not within the scope of this review.
Texas observers follow Service procedures so that collection of data is standardized using
statistically consistent methods. As noted above, the survey consists of 133 randomly
53
selected 20-mile routes. Staff members report that Gates et al. (1975) conducted the only
work on sample size determination based upon anticipated variance in indices by various
scales within Texas from 1 year to the next. They reportedly recommended 4 replications
(or repeated surveys per route in 4 different weeks), increasing the number of routes to
169 (36 more than current) but reducing the number of stops from 20 to 5. These
measures were not adopted due to the practical difficulties in carrying them out.
According to staff, over the history of the survey in Texas routes have been moved
gradually from encroaching urban areas to rural areas to reduce the effect of noise due to
human activity on the ability of observers to hear calls. As a result, they note that dove
trends in urban areas have systematically been excluded because the survey is not
conducted in larger metropolitan areas. Habitat type can affect hearing distance.
The Service uses a route regression method for determining long-term trends, which 1)
allows annual indices to be estimated when some routes are not run every year; 2)
removes route-to-route variability; 3) uses co-variables to control variation due to
observers and environmental effects; and 4) allows calculation of variation among routes.
Route regression analyses for Texas by hunt zone and ecological areas for various
important time series have been completed sporadically. TPWD, however, currently does
not use this methodology in making decisions about regulations prior to hunting season
because the Service has not published or otherwise made available this program for its
use. Consequently, TPWD uses untransformed index data, which do not have the
benefits of the route regression analysis, to inform these decisions. In addition, TPWD
uses data from only the first 15 of the 20 stops on each route because Gates et al. (1975)
found that call-count variability increased with addition of the last 5 stops.
Staff members report that, “based upon an unpublished power analysis completed in
1994, an additional 840 20-mile routes would be needed to be completed each year
(based upon trend from 1966-94) in Texas to determine that a 20% change in regression
coefficient from zero over 10 years was real (a = 0.1, ß = 0.2) and not an artifact of the
survey method.”
54

To reduce variation in detection probabilities, efforts have been made to standardize
procedures and timing by prescribing the following concerning the conduct of the survey:
time of day (0.5 hour before sunrise), season (May 20-31), weather (<12mph wind, no
rain), and effort (1 observer 3-minutes per stop at designated times per stop).
TPWD publications and responses to our inquiries clearly recognize the limitations of the
mourning dove call-count survey in providing meaningful information for management
decisions. As with other indices discussed in this review, the recognized limitations stem
from problems of convenience sampling along roadsides (inability to make a valid
inference to the biological population of interest and to assess the precision or accuracy
of estimated parameters) and from not being able to assume that index values are a
surrogate for total numbers or density (Anderson 2001). As TPWD staff members
recognize fully in discussion of the mourning dove call-count survey, index values can be
affected by variables related to observers (hearing ability, experience, interest, training,
etc), survey method, and species specific intrinsic factors, such as effects of mating status
on calling rate.
To monitor the effects of Texas decisions on the number of hunting zones taken and
season lengths and bag limits in each zone and effects of land use changes, accurate and
reasonably precise breeding trend information is needed at the scale of hunting zone.
Recommendations: We agree with the recommendations of Roberson et al. (2003)
concerning the route regression method of analysis and the need to make it accessible to
Texas and other states in a manner that will allow its use in making decisions about
hunting season regulations.
We also agree that a follow-up power analysis should be conducted with benefit of the
additional 10 years of call-count data since 1994. The number of additional routes
needed to detect the same percentage change given the same probability levels would be
reduced, but according to staff, it is unlikely that the number of routes would be reduced
55

sufficiently to make it feasible for them to be run. We understand that the limited
number of existing field staff and the short survey period of 12 days (May 20-31)
preclude completion of any replication (i.e., conducting survey route more than once per
season). However, current mourning dove call-count survey data does not provide
sufficiently precise enough data to detect a 20% change in the index over 10 years with
reasonable power. Therefore, as staff members recognize, the current data are inadequate
to measure the effects of changes in either hunting regulations or habitats. TPWD should
increase its efforts to obtain accurate and reasonably precise information on numbers of
breeding birds at the scale of hunting zones, at a minimum.
We recommend that TPWD continue its efforts to obtain more robust estimates of
mourning dove breeding density through use of distance sampling to address the effects
of variation in habitat and matedness. Distance sampling is an effective means of
standardizing the effects of these variables and addressing the uncertain relationship
between indices and biological population demographics of interest. Pertinent literature
citations for distance sampling are provided in Appendix D.
Given the importance of mourning doves in Texas, we recommend further that TPWD
place additional research emphasis on addressing the problems of convenience sampling.
We are aware that there is interest in pursuing these issues through research to determine
what proportion of each ecological area is outside the range sampled by the roadside
routes and whether density of breeding birds varies in relation to distance from roads.
This research effort should be supported.
TPWD should continue its effort to counter the trend of urban areas becoming
progressively under-represented in the call-count survey by conducting an urban survey
of doves seen as well as heard during early mornings on weekends by volunteers.
56
Call Counts: White-winged Dove
Background: White-winged dove call-count surveys are conducted each year on
approximately 55 routes in Central, South and West Texas to derive annual indices of
numbers of breeding birds. The basic procedure of standardized survey period (May 15
to May 31), time of day (within 2.5 hours from sunrise), listening period duration (3
minutes), and weather thresholds (not conducted when winds are ≥ 15 mph or rainy
conditions exist) have remained unchanged since the 1940’s.
Our understanding is that the survey now consists of a combination of systematic point
counts along transects within riverine systems and cities and along roadsides adjacent to
all known historical breeding colonies in native brush and citrus groves. A random
sample was not selected because an attempt was made to survey all brush tracts and citrus
groves in the LRGV. As surveys in West Texas along the Rio Grande and urban areas
were added, different procedures besides roadside stops or points counts were added.
These included transects and a 9-square block urban grid system. The relation of the
number of white-winged doves heard to actual nest density is based upon nesting studies
in the 1950’s. However, more recent evidence suggested that nest-count estimates were
correlated poorly with call-count estimates (Rappole and Waggerman 1986).
The breeding bird trend information is used at the statewide and major geographic area
(Lower Rio Grande Valley (LRGV), West Texas, Upper South Texas, Central Texas)
scales.
There are written protocols on instructions sheets that observers can download from the
TPWD intranet. We did not find any indication of listening period duration on the 2003
count instructions. New observers were trained by the white-winged dove project leader.
We understand that this position has been eliminated. There has been 1 standard data
sheet form used in rural and urban areas whether the survey procedure was auditory point
count, transect or urban grid survey method.
57
Means, variance and simple linear regression are calculated for trends in white-winged
dove density estimates by state and broad geographic areas. In addition, trends are
estimated by habitat type (brush, citrus, urban). Density estimates are expanded to
abundance estimates using estimated size of brush and citrus tracts and occupied area of
cities.
Breeding bird trend data are collected, analyzed and reported in Federal Aid reports and
provided to the media for hunt forecasts. We understand that in the past the data were
used to close hunting season (latest in 1985) when severe freezes occurred in the LRGV
that destroyed critical nesting habitat.
Analysis: There are a number of limitations to the current white-winged dove call-count
survey. Samples are not randomly distributed and survey routes involve some
convenience sampling along roadsides. These survey attributes preclude valid inferences
concerning the number of breeding white-winged doves and limit the ability to assess the
precision of estimates. As with other indices, these call-count survey estimates can be
affected by variables related to observers, environmental effects on the number of birds
detected, and biological and behavioral aspects of detectability.
TPWD’s protocol for conducting the white-winged dove call counts incorporates a
number of standardized data collection procedures to address these sources of variation in
detection probability. In addition, density derived from auditory cues can be verified by
estimates of actual nest densities at peak of the nesting season provided by production
surveys. Efforts to correlate current breeding density estimates with actual active nests at
the peak of breeding make it possible to evaluate whether observers assign density
categories consistent with earlier results. Nevertheless, it should not be assumed that the
survey index values are a surrogate for numbers of breeding birds. We found that staff
members are fully aware of these issues and working to address them.
It is our understanding that no estimation of optimum sample size has been made for the
current survey.
58

Staff members have identified that the different survey procedures used to obtain call
counts across sampling units do not allow standardized methods of determining variance
and have different inherent biases. Although estimates of variance reportedly are
calculated for trends in white-winged dove density estimates by state and broad
geographic areas, we did not find any reporting of these estimates in Federal Aid reports.
In addition, we understand that the different survey procedures have created some
confusion of interpretation and inconsistent entry of the data.
The scale at which the current survey data are applied may not be appropriate because
TPWD reports the sum of the index values for the LRGV, West Texas, and selected
urban areas (using different methodologies) to indicate statewide population size. Staff
members report that there was too much variability in the breeding density index to
determine whether hunting closures in the 1980’s had any impact on subsequent number
of spring breeders.
Recommendations: TPWD is in the process of converting its white-winged dove breeding
survey methods and analyses to a single method applied probabilistically statewide. This
effort to establish random point counts of doves seen and heard using distance sampling
within all known occupied brush, citrus, riverine or urban habitats should continue and
should be used as model for how other indices might be placed on a scientific footing.
Specifically, the efforts should be continued with Texas A&M University in Kingsville to
develop a representative sampling scheme that is uniformly applicable statewide and to
test distance sampling to reduce observer and environmental detection bias. Research on
identifying sources and degree of bias is important to establishment of valid breeding
surveys.
Establishment of any new method should be accompanied by standardized training for all
observers.
59

Roadside Observation Surveys Background: Roadside observation surveys are used by TPWD to monitor numbers of
bobwhite quail and pheasant and establish harvest regulations (DeMaso et al. 2001).
Peer-reviewed literature citations documenting validity of roadside observation surveys
for pheasant date from 1947 to 1955, while those for quail are more recent (1969 to
2000). In either case the method reportedly has not been modified from that described in
cited literature. The fundamental element for the measurements is a 20-mile strip transect
along rural roads. Counts of birds are made by observers riding in a moving vehicle
traveling 20 miles per hour and are recorded at 1-mile intervals on standard forms.
Written protocols exist and are made available to observers. New observers normally are
accompanied by experienced employees on the first run of a transect.
Analysis: A basic assumption for the road observation survey is that probabilities of
detection are constant across lines and across years. Probability of detection is known to
vary in response to many factors, including weather, habitat conditions, reproductive
status, season of the year, time of day, and observer performance. Some sources of
variation in detection probability can be overcome by standardizing data collection
procedures, but it often is not possible to address or even identify other factors that cause
variability in this probability. Consequently, unless data to test the assumption of
constant detection probability are collected routinely as part of a standard data collection,
“a large degree of caution and skepticism” is recommended when these surveys are used
and interpreted (Lancia et al. 1994, Anderson 2001).
Roadside Observation Survey: Ring-necked Pheasant
Background: Pheasant survey activities were initiated in the Texas Panhandle in 1959.
Crow counts were used until 1975, at which point it was decided that roadside counts
provided a better indication of annual changes. Since 1976, numbers of ring-necked
pheasants in the Texas Panhandle have been monitored solely by means of roadside
counts in the manner generally described by Stiles and Hendrickson (1946), Fisher et al.
60

(1947), Kozicky (1952), and Klonglan (1955). Survey lines were set up initially to
monitor releases of birds or in counties that wanted a season. No information is available
on the original design of the survey or on any calculation of necessary sample size.
Roadside counts are conducted once between October 15 and November 15 each year
along 44, 20-mile lengths of road in suitable pheasant habitat. Replicate measurements
on individual survey lines are not done. Each survey begins 15 minutes after sunrise and
all pheasants observed are recorded at 1-mile intervals. The age of broods is recorded as
1/4, 1/2, 3/4, or full grown. The route number, county, date, starting time, beginning and
ending temperature, beginning and ending wind velocity, extent of dew, and name of the
observer are recorded. If necessary, the vehicle is stopped and the observer may flush
broods to obtain complete counts. Over time, some routes have had to be deleted and
new ones established due to changes in agricultural practices and implementation of the
Conservation Reserve Program. New routes are not located randomly; rather, an effort is
made to locate them in suitable pheasant habitat.
The pheasant roadside observation survey lines were set up initially to monitor releases
or in counties that wanted season. They now are used by staff members “to try to make
regulation changes.” In addition, although pheasant roadside observation surveys are
intended for use at the ecoregion level, data is used at the county level to provide
information to hunters. The only statistical parameter used to describe data is the mean
of index values. Data are stored in electronic format but are not stored centrally. Results
are reported in Federal Aid reports and in hunting season forecasts.
Analysis: A basic assumption for the road observation survey (and the mourning dove
call-count survey discussed above) is that probabilities of detection are constant across
lines, years and observers. Probability of detection is known to vary in response to many
factors, including weather, habitat conditions, reproductive status, season of the year,
time of day, and observer performance. TPWD has adopted a number of standardized
data collection procedures to address sources of variation in detection probability. For
instance, to minimize known factors that can cause variation in detection probabilities,
the survey line protocol requires that lines be conducted 1) beginning 15 minutes after
61
sunrise, 2) between October 15 and November 15 each year, and 3) when wind velocities
are less than18 mph and when no rain or snow is falling. In addition, there is a
standardized form for recording data, and written protocols for the survey are provided to
observers on the back of the data sheet.
The absence of training in the use of the method, which increases the chances of
differences in observer performance and compliance with the written protocol, is a factor
that likely contributes to variation in detection probabilities. We also understand from
staff members that conversion of habitat to cotton is occurring in the area of the survey
lines, which is altering detection probabilities across lines and over time. There are other
factors that cause variability in this probability. The literature indicates that the amount
of vehicle traffic, presence of dew, extent of cloud cover, and low temperatures also may
affect the probability of seeing birds. In addition, it often is not possible to address or
even identify sources of variation in detection probability. These problems can result in
seriously erroneous interpretations of data (Anderson 2001). Slight differences in
detection probabilities (due to differences in vegetation, observers, etc.) can lead to
completely opposite conclusions about differences in biological population size.
Probability of detection needs to be measured (empirical estimate) to allow the
incomplete count of an index value to have meaning.
As with other surveys, location of survey lines in the absence of sound sampling
principles is 1 of the key limitations to the method. Pheasant observation survey lines are
located along roads in areas subjectively determined to be good pheasant habitat. Roads
per se may be biased sampling units because of attractiveness of vegetation in rights of
way. In addition, the method of locating survey lines assumes that pheasants are evenly
distributed across the ecoregion being sampled, which is unlikely.
Absence of a sampling basis for location of pheasant survey lines results in the inability
to determine relative “goodness” of the data generated. As with most sampling
procedures, precision and accuracy are the only 2 ways to measure validity. In absence
of known biological populations, it is impossible to measure accuracy, so precision
62
remains as the only valid measure of methodology performance. Measures of precision
for routes, counties, and ecoregions would be most helpful in judging adequacy of the
sampling methodology.
We do not agree with TPWD’s Federal Aid reports (e.g., DeMaso et al. 2001) that there
currently is sufficient basis on which to conclude that the data from pheasant roadside
observation surveys are drawn from adequate sample sizes or that they provide the
necessary information on distributions, relative densities, and trends for use in
management.
Recommendations: A determination should be made as to whether trend count data for
pheasants is needed to adjust harvest regulations or provide information to hunters.
Consideration should be given to alternate means of achieving these goals, such as use of
information on changes in habitat condition and environmental variables such as rainfall.
If it is determined that trend count data is necessary to achieve TPWD’s objectives, then a
second determination should be made concerning the scale of desired application (county,
ecoregion, state) and the level of precision needed to allow decision-makers to feel
comfortable using those data. Following these decisions, a number of changes to the
current roadside observation protocol should be made to place it on a more sound
scientific footing.
First, survey routes should be reallocated based on a sound sampling design with sample
routes allocated on the basis of optimum allocation procedures for various expected
densities of pheasant (i.e., low, medium, high). This process would reduce expected
variances and improve estimates generated. This design would also allow calculation of
confidence intervals, needed sample sizes to reach some level of precision, and power of
the test. These statistics would improve the scientific basis of the roadside observation
counts immeasurably.
Second, the annual collection of roadside counts based on a sound sampling design
should be accompanied by routine collection of data designed to test the assumption of
63

constant detection probability. As noted above, absent this second effort, a large degree
of caution and skepticism should be exercised in using and interpreting these surveys,
particularly in interpreting changes in counts from 1 year to the next.
Third, additional efforts should be made to remove some of the remaining variation
associated with observers and counting methodology by requiring training for observers
through use of a CD training video or other standardized approach.
Finally, a statement should accompany any report of the results of the pheasant roadside
observation survey that indicates the scale to which the data apply, the potential sources
of bias that could affect the accuracy of the data, the imprecision of the data, and the
importance of interpreting it cautiously.
Roadside Observation Survey: Quail
Background: In 1976 133, 20-mile routes were randomly selected throughout the state.
No information was found on calculation of this sample size. To qualify, a route is
required to be along an all weather road having minimal vehicular disturbance and
minimal human habitation. Initially, each route was counted 4 times, twice in mid-July
and twice during the first 2 weeks of August. After the first 2 years of the survey, an
analysis of the methodology was conducted. According to staff, only the
recommendations of that analysis remain. Those recommendations were 1) to
discontinue the July counts (fewer quail observed compared to August); 2) allow lines to
be counted either morning or afternoon (no significant difference); 3) allow each line to
be counted once (no significant difference was found in ecoregion means when lines
were counted once vs. twice); and 4) increase the number of routes from 133 to 266,
which presumably was based on a calculation of sample size. Due to legislatively
mandated budget cuts, all routes were discontinued in the Pineywoods, Post Oak
Savannah, Blackland Prairies, and High Plains ecological areas in 1988. Certain routes in
other ecological areas also were discontinued at this time. In 1993, many High Plains
routes were reinitiated. The current total number of routes is 164.
64
Counts by a single observer on the quail survey lines are to begin exactly at local sunrise
or 1 hour before local sunset. Lines run in the evening lines are run west to east, and
those run during the morning from east to west. Survey lines are driven at 20 miles per
hour. All quail observed are recorded by 1-mile intervals. Quail are recorded by species
as singles, pairs, or broods. Coveys are recorded separately by number and age class.
The age of broods is recorded as 1/4, 1/2, 3/4, or full grown. The route number, county,
date, starting time, ending time, beginning and ending odometer reading, temperature,
wind, percent of cloud cover, and name of the observer are recorded.
There are written protocols that are provided via TPWD’s employee intranet. Training
normally is accomplished by having an experienced biologist accompany new observers
on their first run. All data are sent to the gamebird program database analyst.
Data are used to monitor quail numbers statewide and by ecological region, forecast the
quail hunting season for the public, and formulate harvest and management
recommendations. The mean number of quail observed per route per year is used as
index to compare relative quail numbers among the ecological regions of the state and to
compare quail numbers relative to the long-term mean statewide and within an ecological
region. This information is presented in Federal Aid reports and made available to the
public on TPWD’s web site as a “quail forecast” for a particular hunting season to help
hunters maximize utilization of the resource. Staff members report that in areas of the
state where landscape scale changes have reduced available quail habitat, the data
provide valuable information of significantly declining numbers at the ecoregion scale
and are useful as case-building information in regional, statewide, and national quail/bird
recovery initiatives (Northern Bobwhite Conservation Initiative, Texas Quail
Conservation Initiative, Playa Lakes Joint Venture, Partners in Flight, etc.).
Analysis: A basic assumption for the quail roadside observation survey is that
probabilities of detection are constant across survey lines and across years. Probability of
detection is known to vary in response to many factors, including weather, changing land
use patterns and habitat conditions, reproductive status, season of the year, time of day,
65
and observer performance. According to staff members, the survey may underestimate
quail when spring rainfall is below average and July rainfall is above average. This
usually results in a late hatch and lush roadside conditions when the survey is conducted,
making it difficult to see birds. Lusk et al. (2002) identified a potential bias associated
with the survey in which increased counts were associated with increased maximum
temperatures in July. They suggest “one might want to temper predictions of bobwhite
quail abundance during the next hunting season after a particularly hot summer.”
TPWD has adopted a number of standardized data collection procedures to address
sources of variation in detection probability. For instance, to minimize known factors
that can cause variation in detection probabilities, the survey line protocol requires that
lines be conducted 1) beginning either at sunrise or 1 hour before sunset in a consistent
direction that maximizes visibility and 2) during the first 2 weeks of August. To
minimize bias due to observer performance, there is a standardized form for recording
data, written protocols for the survey are provided to observers via TPWD’s employee
intranet, and training is accomplished by normally having an experienced biologist
accompany new observers on their first run. Staff members report that routes are not
conducted during adverse weather conditions to minimize this known bias. However, we
did not find any guidance concerning adverse weather conditions in TPWD’s quail
roadside count instructions.
In addition to the known sources of variation in detection probability that the survey
methodology attempts to address, there are likely other sources that are not possible to
address or even identify. These problems can result in seriously erroneous
interpretations of data (Anderson 2001). Slight differences in detection probabilities (due
to differences in vegetation, observers, etc.) can lead to completely opposite conclusions
about differences in biological population size. Probability of detection needs to be
measured (empirical estimate) to allow the incomplete count of an index value to have
meaning.
66
Nevertheless, findings of DeMaso et al. (2002) and others suggest that hunting success at
local scales and harvest at state scales may be expressed as a linear function of the Texas
quail abundance index. These findings suggest that a linear relation exists between quail
numbers and the quail roadside observation survey counts. Approximately 90% of the
variation in the number of northern bobwhite and scaled quail bagged annually can be
explained by the mean number of quail observed per survey route in a given ecological
area.
It is noteworthy that the quail roadside observation survey lines are distributed randomly.
The presence of a sound sampling design should reduce expected variances and improve
the reliability of the estimates generated. The statistical power of the technique has not
been calculated, and it is not known what percentage change the technique is designed to
detect. Power analyses conducted by Bridges et al. (2001) on TPWD survey data
collected from 1978 to 1998 found that a doubling in mean quail abundance could be
detected in all ecological regions at the 1-β ≥ 0.80 probability level (α = 0.05). We
understand that means and regression are used to describe the data, and that probability
values are calculated for regressions but not for the means. Use of regression and
associated probability values appears limited to external publications by TPWD staff
members and others.
TPWD’s quail forecast web pages clearly discuss the limitations of the roadside survey
data and the scale to which the data apply.
Recommendations: TPWD has taken most of the key steps needed to ensure that the
quail roadside observation survey is scientifically sound. The survey is based on a
sampling design, efforts have been made to reduce variation in detection probability, and
there is evidence that the index probably is correlated with abundance. In addition,
TPWD has done an excellent job of explaining to the public and its employees some of
the important limitations of the data and the scale to which the data apply.
67

Greater effort, however, should be made to calculate confidence intervals, needed sample
sizes to reach some level of precision, and power of the test. These statistics would
improve the scientific basis of the roadside observation counts immeasurably. For
instance, confidence intervals should be calculated for the mean number of quail seen per
route at the state and ecological region scales. These confidence intervals should
accompany the mean values reported in Federal Aid documents and in the quail forecast
tables and graphs on the TPWD web site.
Increased efforts to estimate potential bias due to variation in detection probabilities may
not be warranted given that there have been little if any changes over time in quail
hunting season regulations.
Turkey Hen-Poult Counts and Surveys
Background: Turkey hen-poult counts and brood card surveys are incidental observations
of turkeys observed during a designated period of time. These surveys seek to provide an
index to reproductive success, sex ratios, and density. Hen-poult counts are used to
survey habitats of Rio Grande turkey. The brood card survey is used to survey habitats of
eastern turkey.
Hen-Poult Counts: Rio Grande Turkey
Background: Summer Rio Grande turkey hen-poult surveys are conducted from June 1
to August 31 each year within the Trans Pecos, Rolling Plains, South Texas Plains,
Edwards Plateau, Post Oak Savannah, and Cross Timbers and Prairies. Survey guidelines
call for a minimum of 25 hens to be observed during each 2-week period in major turkey
counties and a minimum of 10 hens should be observed per 2-week period in marginal
turkey counties.
Written protocols are provided to observers with standardized data collection forms on
which are recorded the number of hens, poults, hens with poults, poults per brood,
68

gobblers, and unidentified turkeys. Also recorded on the forms are the county, date, time,
habitat type, and the location by 10-minute latitude-longitude blocks. No training in the
method is provided. The counts are conducted incidental to other duties.
Data reported in Federal Aid reports statewide and by ecological region are total numbers
observed of gobblers, hens, hens with poults, poults, unidentified adults, and all turkeys
and total number of observations. Derived from this data are percent gobblers, percent
hens with poults, the ratio of total poults to total hens, and poults per broody hen.
Data are stored in an electronic format within a centralized location No information is
available on the original design or sample size calculations. Sampling is not randomly
distributed. According to staff, means and regressions are calculated. The data are used
as an index of Rio Grande turkey production in Texas and to provide supplemental data
to assess Rio Grande turkey trends at the statewide scale. Data storage is electronic and
centralized. Data are reported in Federal Aid documents and reportedly in other
unspecified venues.
Analysis: Because there is no estimate of effort in this survey, the total numbers reported
of gobblers, hens, hens with poults, poults, unidentified adults, and all turkeys only
provide information when used in ratios. Reportedly, the ratio of total number of poults
to total number of hens has provided the most reliable index to production. For this ratio
to perform as a useful index to production, probabilities of detection must be relatively
constant across ecological regions and across years. Probability of detection is known to
be affected by weather, changing land use patterns and habitat conditions, level of vehicle
traffic, reproductive status, season of the year, time of day, observer performance,
biological and behavioral aspects of detectability and a number of other variables.
As far as we are able to determine, relatively minimal measures have been taken to
address these sources of variation in detection probability through standardization of data
collection procedures. Survey protocol requires that the survey be conducted between
June 1 and August 31 and that data be recorded on standardized forms. However, in any
69
given year or ecological region, counts may be made at different times of the day, along
roads of varying traffic level, in varying weather and habitat conditions, and with no
training of observers. As a result, it is quite likely that detection probabilities differ from
year to year or from ecological region to ecological region, which can result in seriously
erroneous interpretations of data and provides little confidence that observed trends are
real. Slight differences in detection probabilities (due to differences in vegetation,
observers, etc.) can lead to completely opposite conclusions about differences in
biological population size. Probability of detection needs to be measured (empirical
estimate) to allow the incomplete count of an index value to have meaning.
Sampling effort is not randomly distributed and survey routes involve convenience
sampling along roadsides. Because of these survey attributes, no valid inferences can be
made from the index to Rio Grande turkey production, and the ability to assess the
precision of production index estimates is limited.
Although it was reported to us that means and regressions are used to describe the data,
we did not find any examples of their use in Federal Aid reports.
Recommendations: To be a useful index to trends in production of Rio Grande turkeys,
the current hen-poult counts would require substantial revision. Hen-poult count
protocols would need to be amended to establish a true survey methodology, such as the
one employed for quail or mourning doves. Route location and length, time of day
survey is conducted, weather conditions under which the survey is not conducted, and
observer training would all need to be standardized. Survey routes would have to be
distributed randomly. Absent these changes, we do not agree with conclusions in recent
Federal Aid reports that the data provide reliable production trend information (DeMaso
et al. 2001, Burk 2003). We, therefore, do not recommend continuation of the Rio
Grande hen-poult counts in their present form.
If hen-poult counts continue in their present form, at a minimum TPWD should cease its
reporting of changes in total numbers from 1 year to the next, such as decreases in total
number of poults observed from 2001 to 2002 (Burk 2003). Also, any display of total
70
numbers should note expressly that changes in total numbers do not provide trend
information. As noted above, absent information on effort, these total numbers are
meaningless.
We are aware that TPWD is funding outside research efforts to develop a valid means of
estimating numbers of Rio Grande turkeys in Texas. We applaud that effort and urge that
it continue to receive support.
Brood Card Survey: Eastern Turkey
Background: The brood card survey is used to obtain an index to eastern turkey
reproductive success and to provide information on flock expansion. A list of 4,000
cooperating landowners in northeast Texas was mailed a brood card survey form during
the second week of July in 2001 to survey a period from September 2001 through August
2002. The survey consists of 2 observation periods: May 1 to August 31 and September
1 to April 30. For each period, cooperators are asked to record the number of males and
females that they or others have seen in their area and the largest number of turkeys that
they or others observed in 1 group in their area. They also are asked to record the
number of poults that they or others observed in their area from May 1 to August 31. A
standardized, postage-paid data form (brood card) is provided to cooperators, along with
a letter, which apparently serves as a written protocol for the survey. There is no training
of observers.
Selection of cooperators in the survey is based on their identification by TPWD staff
members and the willingness of the cooperator to participate. No sampling of
landowners is involved.
The results of the method are said to apply to ecological regions and the State. Mean
values are used to describe the data, but no other statistical parameters are employed.
Data are kept in electronic form but storage is not centralized. Reporting of data takes
place in Federal Aid reports, at professional meetings and to the general public.
71
Analysis: Because there is no estimate of effort in this survey, the total numbers reported
of gobblers, hens, hens with poults, poults, unidentified adults, and all turkeys only
provide information when used in ratios. Reportedly, the ratio of total number of poults
to total number of hens has provided the most reliable index to production. For this ratio
to perform as a useful index to production, probabilities of detection must be relatively
constant across ecological regions and across years. Probability of detection is known to
be affected by weather, changing land use patterns and habitat conditions, level of vehicle
traffic, reproductive status, season of the year, time of day, observer performance,
biological and behavioral aspects of detectability, and a number of other variables.
As far as we are able to determine, few measures have been taken to address these
sources of variation in detection probability through standardization of data collection
procedures. Survey protocol requires that data be recorded on standardized forms.
However, in any given year or ecological region, counts may be made in different months
of the year and at different times of the day, along roads of varying traffic level, in
varying weather and habitat conditions, and with no training of observers. In addition, it
appears that guidance given cooperators by the survey protocol letter allows much room
to interpret what constitutes their “area,” and how and whether to record what others have
seen. As a result, it is quite likely that detection probabilities differ from year-to-year or
from ecological region to ecological region, which can result in seriously erroneous
interpretations of data and provides little confidence that observed trends are real.
There is no sampling effort designed to obtain a representative sample of eastern turkey
habitats within ecological regions or for the state as a whole. Because landowners were
not selected randomly to achieve an adequate sample of habitats within ecological
regions and the state, no valid inferences can be made from the index to eastern turkey
production in any region or at the state level, and the ability to assess the precision of
production index estimates is limited.
Recommendations: To be a useful index to trends in production of eastern turkeys, the
current eastern turkey brood card survey would require substantial revision. We do not
72
agree with conclusions in recent Federal Aid reports that the survey is a useful or
acceptable method for evaluating annual production and sex ratios of eastern turkeys
(DeMaso et al. 2001, Burk 2003). We, therefore, do not recommend continuation of the
Rio Grande hen-poult counts in their present form. We understand that TPWD staff
members are conducting a gobbler count on 15-mile transects, combined with cursory
habitat evaluation. We also are aware of a proposal, which was not funded, that would
use motion detection cameras to develop an index correlated with gobbling counts. We
encourage TPWD to continue its efforts to develop a valid means of estimating eastern
turkey abundance and production.
Lek Surveys Lek Count Survey: Lesser Prairie Chicken Background: Lesser prairie chickens (LPC) in the Texas Panhandle are sampled using lek
count surveys conducted on delineated study areas on private lands in Gaines, Yoakum,
Bailey, Hemphill, Gray, and Wheeler counties. In 1997, TPWD adopted a methodology
it developed with other states in the LPC Working Group in which annual and
comprehensive surveys are conducted on 6 study areas (e.g., leks per unit area, males per
lek, total number of birds per lek). Three of the study areas are in the northeast
Panhandle, with 1 in each of Hemphill (67,298 acres), Wheeler (6,720 acres), and Gray
(6,540 acres) counties. The other 3 study areas are in the Permian Basin, with 1 in each
of Gaines (13,440 acres), Bailey (9,221 acres) and Yoakum (12,378 acres) counties.
Demographic data are collected intensively in an area as a sub-sample of the larger
regional area. Effort is consistent each year. Time required to completely survey 1 study
area varies from 1 to several days, depending on weather, number of observers and size
of the study area.
All active leks on each study area are counted for males, females, and unknown-sex
birds; in addition, lek location coordinates are taken with a GPS unit. Survey instructions
call for the survey to be conducted during the first 2 weeks of April and for counts to be
73

completed in approximately 10 days. Counts are to begin as soon after daybreak as birds
can be seen and continue for about 2 hours. Counts in the afternoon are to be avoided.
Observers are instructed to get a count of males using binoculars prior to moving in and
flushing birds. After the count is concluded, the protocol directs observers to listen for
new grounds. Counts are to be conducted only when the wind is less than 15 mph and
when the sky is clear and/or partly cloudy. Counting is to be avoided when the sky is
overcast. Data are collected and recorded on a standardized survey form.
In addition to surveying all known leks on each study area, efforts are made to search for
new leks within the study area. Local biologists may commit up to 25% of their time
during the survey period to the search of new leks. If time and resources allow each year
and study area surveys are completed, staff members attempt to visit historical and/or
known lek locations outside the 6 study areas and collect comparable data to those
collected at study areas.
Staff members are trained in survey methodology, although we are uncertain of the
method of that training. Means and regressions are used to describe the data, which are
stored centrally in electronic format. Data are used to monitor LPC trends and implement
regulatory changes if necessary. In addition, data are presented in Federal Aid reports
and at annual LPC interstate working group meetings. They also are used in research
projects.
The scale for this method is reported as the study areas, ecological region, state, and
multi-state.
Analysis: Leks counts are the product of the number of birds observed on leks and the
probability of detecting birds on leks. Consequently, fluctuations in lek counts may be
the result of changes in this detection probability rather than true variations in size of the
biological population. A basic assumption for the LPC lek count survey is that
probabilities of detection are constant across study areas and across years. Probability of
detection is known to be affected by weather, changing land use patterns and habitat
74
conditions, level of vehicle traffic, reproductive status, season of the year, time of day,
observer performance, biological and behavioral aspects of detectability, and a number of
other variables. Slight differences in detection probabilities (due to differences in
vegetation, observers, etc.) can lead to completely opposite conclusions about differences
in biological population size.
TPWD has addressed sources of variation associated with the LPC lek survey through
use of a standardized protocol that seeks to control some of those due to environmental
conditions (cloud cover and wind velocity), LPC biology and behavior (time of day and
season), and observers (method of counting and training). These standardization efforts
to minimize sources of variation improve lek counts and provide more accurate
comparisons across study areas and years. Standardization, however, cannot address all
variables that affect detection probabilities, and it often is not possible or practical in any
case to address or even identify sources of variation in detection probability. Walsh et al.
(2004) therefore conclude, “Until lek counts are calibrated to actual population
parameters by estimating detection probability, managers must realize the limitations of
lek-count data and should be cautious when reporting trend data based on them.”
Sampling of leks on which to conduct counts is not conducted in a probabilistic manner.
Consequently, it is not possible to make valid inferences from the statistical samples to
the biological population from which the samples were drawn and to make assessments
of the precision or accuracy of estimated parameters. Absence of a sampling basis for the
LPC lek survey results in the inability to determine relative “goodness” of the data
generated. As with most sampling procedures, precision and accuracy are the only 2
ways to measure validity. In absence of known biological populations, it is impossible
to measure accuracy, so precision remains as the only valid measure of methodology
performance. Measures of precision for study area and region (Permian Basin and
Panhandle) would be most helpful in judging adequacy of the sampling methodology.
Important issues identified by staff members regarding these surveys are 1) the inability
of study area data to be applied to LPC range in the state because of habitat fragmentation
75
and land-use patterns, and 2) the inability of the study area design to provide data on LPC
distribution in the state.
Recommendations: We recommend that TPWD conduct or sponsor research to identify
additional means of minimizing sources of variation in the LPC lek survey detection
probabilities, such as more precisely identifying dates and times of peak attendance and
developing a means of estimating the number of leks in an area. For example Walsh et
al. (2004) found that peak attendance of sage grouse at leks occurred during a narrow 1-
hour window around sunrise, and recommended against counting multiple leks for that
species unless they can be completed within 0.5 hour after sunrise. Efforts also need to
be made to estimate probability of detection in order to allow the LPC lek survey index
value to have meaning.
We recommend that TPWD consider some means of probabilistic sampling of leks on
which to conduct counts or to estimate the number of active leks within an area so that it
becomes possible to make valid inferences from the samples to the biological population
from which the samples were drawn and to make assessments of the precision or
accuracy of estimated parameters. For instance, consideration should be given to
replacing the current LPC lek survey with one that estimates the total number of active
leks through repeated line transect sampling of leks in spring or by other means.
Finally, we strongly recommend that any report of the results of the LPC lek survey
indicate the scale to which the data apply, the potential sources of bias that could affect
the accuracy of the data, the imprecision of the data, and the importance of interpreting it
cautiously.
Lek Distribution Survey: Lesser Prairie Chicken
Background: According to staff, this survey, which is not based on a published
methodology, is in place as a cursory investigation of LPC distribution. TPWD has
contracted with Texas A&M University to conduct a more detailed investigation of
76
methodologies (including use of FLIR and aerial line transects) to determine LPC
distribution in the state. Driving routes are surveyed from April 1 to April 30. Routes
are started approximately 20 minutes before sunrise and completed around 9:00-9:30
AM; they are not surveyed after 9:30 AM. Survey routes are located on roads and are
arranged in an east to west fashion as much as possible and driven from east to west.
Surveys are not conducted when winds exceed 20 mph or if it is raining (light drizzle is
acceptable). The survey protocol calls for observers to drive 1 mile, stop and shut off the
vehicle, get out of the vehicle and listen for 3 minutes. If LPC booming is detected (or
booming LPCs are observed on a lek), their presence is noted on a field survey form and
the location recorded. Other data collected include direction the booming was coming
from, time, number and sex of birds (if observed), and location (UTM) using GPS
information. If the observer marks the positive locations with waypoints (preferred), then
the observer also records the waypoint number on the form. After 3 minutes, the
observer drives another mile, stops, turns off the vehicle, and listens for 3 minutes. This
methodology is continued until the survey route is completed. If the observers hear or
see LPCs between stops, they record the observation in the “comments” section of the
survey form. In addition, if there is any other information such as heavy background
noise (e.g., traffic, oil field activity, irrigation motors, tractors), the observer records that
information. The data collected are used to create general distribution maps.
Scale of the method is described as county management (i.e., survey) area, ecoregion,
state, and multi-state. Training of observers reportedly occurs, but we were provided no
information concerning methods employed. Means and regressions are used to describe
the data. No probability values are calculated. Data are stored electronically and
centrally.
Analysis: This cursory method makes possible identification of active leks that might
otherwise not be identified. However, this methodology is not useful in estimating the
number of active leks in an area or changes in the number of leks over time because
sampling of areas to find active leks is not conducted in a probabilistic manner.
Consequently, it is not possible to make valid inferences from the statistical samples to
77
the biological population from which the samples were drawn and to make assessments
of the precision or accuracy of estimated parameters. Absence of a sampling basis for the
LPC lek distribution survey results in the inability to determine relative “goodness” of the
data generated.
Estimates of lek presence and distribution are the product of the number of leks observed
or instances of booming detected and the probability of detecting leks or booming.
Consequently, fluctuations in the number and distribution of leks counted may be the
result of changes in this detection probability rather than true variations in the number of
leks. A basic assumption for the LPC lek count survey is that probabilities of detection
are constant across study areas and across years. Probability of detection is known to be
affected by weather, changing land use patterns and habitat conditions, level of vehicle
traffic, reproductive status, season of the year, time of day, observer performance,
biological and behavioral aspects of detectability, and a number of other variables. Slight
differences in detection probabilities (due to differences in vegetation, observers, etc.)
can lead to completely opposite conclusions about differences in biological population
size. Staff members note that bias likely occurs because of limited access to potentially
occupied LPC habitats (i.e., searching only on public roads), variation in sightability, and
differences in inherent observer traits and observer performance.
Recommendations: We recommend that TPWD consider some means of probabilistic
sampling of leks on which to conduct counts or to estimate the number of active leks
within an area so that it becomes possible to make valid inferences from the statistical
samples to the biological population from which the samples were drawn and to make
assessments of the precision or accuracy of estimated parameters. For instance,
consideration should be given to replacing the current LPC lek survey with one that
estimates the total number of active leks through repeated line transect sampling of leks
in spring or by other means.
78

Dove Production Survey Background: The purposes of the white-winged dove production survey have evolved
over time and include 1) understanding changes that take place in the biological
population and evaluating its status and vigor; 2) providing long-term recruitment
information to corroborate the white-winged dove call-count survey index and hunting
statistics; and 3) providing information on reproductive activity that can be used in
formulating and evaluating hunting regulations. In the future we understand that staff
members hope to use this information to corroborate or correct for bias in wing age ratios
of harvested white-winged doves and to corroborate recruitment rates for an adaptive
harvest management model.
To determine nesting success and density, counts of number of nests and number of
young fledged are made weekly from the last week in April through the third week in
August each year on selected brush tracts in the LRGV. No more than 10 tracts have been
selected in which no more than 15 permanent transects are located. Transects located in
brush are each 0.25 acre in size (121 yards long by 10 yards wide). Each transect located in
citrus is 0.5 acre in size. All nests found on transects are marked individually, mapped on a
plat of the transect, and recorded on prepared data sheets. A production index is calculated
for each transect as the ratio of total number fledged on each transect during the breeding
season to total number of active nests counted at the peak of nesting activity. The technique
has not been modified since its establishment.
As best we can determine, the tracts sampled were systematically selected based upon
historic white-winged dove nesting densities. Within those tracts, transect starting points
were randomly selected. Inference from the survey is made only to the citrus and brush
tracts surveyed in the LRGV.
There are written protocols and verbal instruction provided to observers by the area
manager of the Las Palomas Wildlife Management Area (WMA) who is in charge of
79

conducting these nesting surveys. This individual also provides the necessary training to
cross check compliance by his staff of observers.
The raw data currently are stored only in written format while an electronic (Excel
spreadsheet) summary is developed and stored. We understand that the intention is to
enter these data into an ACCESS database so queries can be run relating nest substrate
and nest height to nest success and various other demographic parameters. There is no
centralized data storage. Data have been stored on the Las Palomas WMA manager’s
and white-winged dove project leader’s computers. Now that the project leader position
has been eliminated, staff members report that the data will be stored on Mike Frisbie’s
computer in San Marcos.
Analysis: Because tracts were not randomly selected, inference cannot and is not made to
the current range of white-winged doves in Texas or even to all citrus and brush in the
LRGV. To make those broader inferences would require randomly selecting an adequate
sample of all brush and citrus tracts in the LRGV or of all habitats statewide. In addition,
the survey assumes all nests are located 5 yards on either side of the transect. Staff
members note previous study in Mexico has found that average nest detection on
transects was 75%. Other sources of bias include observer disturbance during nest
checks, avoidance by white-winged doves, and nest abandonment (Roberson et al.
(2001).
Efforts have been made to reduce the effects of known sources of bias. Frequency of nest
searches is limited to once per week to minimize sources of known bias caused by
disturbance, white-winged dove avoidance and nest abandonment or predator cuing.
Staff members report that representative sampling of all brush and citrus tracts in the
LRGV has not been addressed because it is anticipated there will be a switch to using
wing age ratios to determine recruitment. Nest transect results are expected to provide 1
form of evaluation of age ratios derived from wings, which may provide an estimate of
bias due to differential juvenile vulnerability and early migration.
80

We agree with Roberson et al. (2001) that on multiple successful nesting species with
small clutch sizes and high egg loss, such as doves, the percent of initiated nests that
fledge at least 1 young might be a better estimate of recruitment rate and warrants further
investigation.
Although it is reported that most basic descriptive statistics are computed for the survey,
we did not find any such statistics in the Federal Aid reports examined. No probability
values are calculated. No power analysis has been completed to verify that the sample size
of tracts and transects are adequate to verify breeding density estimates from the call-count
survey.
Because survey results are not extrapolated to all brush and citrus tracts in the LRGV, the
data appears to be used at the appropriate scale.
Data are reported occasionally in peer-reviewed journals as justification for habitat
studies and to hunters and media as part of a hunt forecast. Otherwise reporting of data is
limited to Federal Aid reports.
Recommendations: If use of transects to count nests and related information continues,
we recommend probabilistic sampling with stratification of transects to reduce variance
of estimates and use of distance sampling to develop a probability of detection function
by observer.
Common statistical parameters (mean, coefficient of variation, variation, regression)
should be used to a greater extent to describe data in Federal Aid reports and in delivery
of information to the media and hunters.
Efforts to centralize data storage and facilitate access to data should be expedited.
Efforts to ensure standardized training through instructional CDs or other means should
be explored to provide greater continuity in the event of personnel changes at the Las
Palomas WMA.
81

As we understand it, however, the TPWD may wish to adopt an adaptive harvest
management strategy for white-winged doves that is similar to one for mourning doves,
which will require an annual estimate of recruitment rate. It reportedly is proposed to
obtain this estimate using age ratios from wings (hunter collected parts) adjusted for bias
due to differential vulnerability of juveniles to the gun and migration of early-hatched
juveniles before the hunting season begins. If nest transects are then used as 1 means of
evaluating the bias of such a hunter collected parts survey, our recommendations above
are still applicable.
Colonial Waterbird Nest Survey Background: The colonial waterbird nest survey is used to track trends of a highly
visible public resource that is dependent on wetlands and is viewed as an indicator of
wetland health. From 1974 until 1992, TPWD conducted aerial surveys of nesting
colonial waterbirds near the coast in areas not accessible to volunteers on the ground.
From the mid-1980’s until 1992, TPWD also surveyed inland sites on the ground. In
1992, TPWD discontinued these ground surveys and only conducted aerial surveys near
the coast on even-numbered years. In 2002-2003, aerial surveys were expanded to
historical nest sites inland in Region 3 to fill data gaps needed to address national
colonial waterbird conservation planning efforts.
The survey follows the methods described by Portnoy (1977) with some modification.
The original aerial survey method averaged the values of 2 observers. The current survey
utilizes 1 observer to estimate number of pairs of white birds and a second observer to
estimate number of pairs of dark birds. Dark birds are totally counted with smaller
colonies and are given as a percentage in very large colonies; except that in great blue
heron and neotropic cormorant colonies they are totally counted regardless of size. Each
observer also breaks down the tally into a ratio of different species in their respective
color regime. In addition, species composition of flight lines going to and from colonies
82
is estimated for consistency with estimated ratios of species. If they differ “drastically,”
another flyover is made to re-estimate numbers.
For sites at which nests are scattered across reservoirs on snags, each observer counts the
occasional nest from their side of the aircraft. While the original survey technique
employed flushing nesting birds from dense vegetation to view all nesters, efforts are
made currently to avoid flushing birds. Species mixtures in flight lines are used as an
indicator of relative species diversity for use with observed birds nesting on top of
vegetation.
With 1 observer conducting the TPWD portion of the survey, there are no longer written
protocols. Co-observers are trained on the job. According to staff, to simplify data
recording in aircraft, a standardized data sheet is not used. Instead, observations are
written by colony on a tablet and transcribed to electronic data sets. Data are compiled by
county, river drainage and regulatory district and used at those scales. Means, but no
probability values, are calculated to describe the data. Data are stored by the biologist
conducting the survey. Results are reported in Federal Aid reports and unspecified other
places.
Analysis: Although ground surveys may provide the most accurate counts of nesting
adults, aerial surveys usually are the most cost-effective means of surveying colonial
waterbird colonies. Nevertheless, dark birds and those that nest within or under
vegetation typically are poorly detected by aerial surveys. For these reasons, aerial
surveys provide biased estimates of numbers for many species.
Variability in observer performance also is another key source of bias in aerial surveys.
Staff members confirm that in a test of the survey there was a high degree of variation
between observers.
83

Recommendations: The measures described below should be adopted, if they are not
already in place, to provide a reliable means of estimating changes in colonial waterbird
numbers.
First, aerial surveys should be supplemented periodically by counts conducted on the
ground. These ground counts should be made very close to the date of the aerial surveys,
and should use an appropriate ground survey method (Steinkamp et al. 2003). Totals
obtained from the ground surveys can then be used to develop appropriate visibility
correction factors for species that are under-sampled by the aerial surveys, so that
appropriate adjustments can be made during years when only aerial surveys can be
conducted at a colony.
Second, because of the issues associated with observer variability, the use of methods to
estimate detection probabilities for each observer is essential. Even slight differences in
probabilities of detection by observers can lead to completely opposite conclusions about
differences in numbers of pairs and biological population trends. Therefore, probability
of detection needs to be estimated empirically to ensure the survey results are reliable.
Third, the survey should be based on a sound sampling design with sampling allocated on
the basis of optimum allocation procedures for various expected waterbird nest and
colony densities and distribution in the landscape. This process would reduce expected
variances and improve estimates generated, and also allow calculation of confidence
intervals, needed sample sizes to reach some level of precision, and power of the test.
Finally, before conducting aerial surveys, observers should receive training in estimating
large numbers of birds and in detecting and identifying species from the air (Steinkamp et
al. 2003).
84
Eagle Wintering and Nesting Surveys Background: The mid-winter eagle survey is a cooperative national survey that follows
the protocol established by the U.S. Fish and Wildlife Service, which coordinates the
survey. TPWD participates by coordinating volunteers and managing its data. Staff
members report, “the winter survey reportedly originated with the National Wildlife
Federation and basically surveyed lakes that wintered eagles that volunteers had interest
and access.” We understand that the efforts have been to repeat surveys as they have
been conducted in the past for trend data. However, because this survey follows a
nationally-established protocol, it is outside the scope of this review.
The nest survey is a Texas survey that was developed independently of other state
surveys. Staff members were not aware of any publication describing the nesting survey.
The method consists of landowners and land managers contacting TPWD staff members
with information on the location of nests and aerial surveys to locate new nests and
replacement nests.
There are no written protocols or written guidelines provided to those participating in the
nest survey. However, nest survey staff members (2) apprenticed under the surveyor for
their region before taking over. There is a standardized data sheet. Data are stored in
electronic format by 1 person. Survey staff members retain their own records.
Nest survey data are used at the state scale to identify and track bald eagle nest locations
for regulatory purposes to avoid damage to eagles, and are used to track status of
biological populations. Means, but no probability values, are calculated to describe the
data. Results are reported in Federal Aid reports and unspecified other places.
Analysis: The nest survey depends on obtaining information from landowners and land
managers about nest location and on the ability to locate nests from the air. Many nests
are positioned in the trees that are difficult to view. Staff members note that they
85

obviously do not locate every nest, but believe they are tracking an increase in number of
nesting eagles of about 10% per year.
From the little information we were able to obtain on the nesting survey, it appears as
though it is a reasonable means of locating and tracking bald eagle nests for purposes of
informing regulatory decisions and avoiding adverse effects to nesting eagles.
We saw no evidence of any methodology that would lead us to believe that the nesting
survey provides reliable information on the status of nesting eagle numbers or trends.
Efforts to minimize sources of known bias consist of regional coordinators for the nest
survey frequently discussing what is observed and how to ensure that each observation is
handled consistently.
Recommendations: If TPWD wishes to utilize the bald eagle survey as a means of
estimating trends in the status of nesting bald eagles in Texas, then a number of measures
need to be taken.
First, the survey routes should be based on a sound sampling design with sampling
allocated on the basis of optimum allocation procedures for various expected bald eagle
nest densities. This process would reduce expected variances and improve estimates
generated. This design would also allow calculation of confidence intervals, needed
sample sizes to reach some level of precision, and power of the test.
Second, consideration should be given to conducting aerial line transect surveys to
estimate abundance or density of bald eagle nests (Burnham et al. 1980).
86
River Otter Survey Background: Data are collected to demonstrate presence/absence of river otter sign at a
county and district level in the Pineywoods ecological region of the State. The stated
needs are to demonstrate a sustainable resource for the issuance of CITES tags for river
otter and to provide a baseline for ecosystem health in the Pineywoods.
Otter sign, along with other furbearer sign, is observed under designated bridges in
District 6. Generally, there are 10 bridges per county. In 2003, 253 bridge locations
were surveyed in 27 counties. Bridges are visited during January or February every third
year. Survey areas must be undisturbed (wash-out, etc.) for at least 1 week prior to the
survey. All surveyed areas are within state or county ownership. All suitable substrate
under the bridge and within the right-of-way is surveyed. Bridges surveyed are limited to
those for which there is sufficient space under the bridge for human access and a suitable,
exposed substrate for tracking. Presence or absence of otter or other furbearer tracks are
recorded. No attempt is made to determine number of unique individuals. If a survey
point is no longer suitable, observers may survey an alternate point as close as possible
along the same waterway.
Written protocols are supplied to staff members each time the surveys are conducted.
Training was held for the entire staff the first 2 years the surveys were implemented.
Reportedly, each time a new observer is hired 1 of the established employees will
accompany the new employee on all of the bridges in areas of responsibility and provide
training on identification of otter sign. A standardized data sheet is used, which is in
digital form for ease of dissemination to staff. No statistical parameters are calculated to
describe the data. Data are stored in electronic format in an Excel spreadsheet on the
District Leaders computer for District 6. Reporting of data is limited to Federal Aid
reports.
Analysis: Recorded data are used to calculate the percentage of bridges with otter sign
and provide trend information. Evidence of otter presence at a survey location provides
87

information on otter distribution. The percentage of bridges with otter sign is used as an
index to otter abundance.
Searches for sign are a common method of monitoring and estimating abundance of
furbearers. Standardized otter survey techniques in Europe and elsewhere have involved
searches for otter sign in set lengths of riverbank in good habitat and utilizing bridges as
access points. These standardized techniques do not appear to have been utilized in the
TPWD survey. Efforts also have been made by others to estimate probability of
detection through use of radio telemetry data. No such estimates have been made or
utilized by TPWD in this survey. For the percentage of bridges with otter sign to perform
as a reliable index to relative otter abundance, probabilities of detecting otter tracks must
be relatively constant across counties and across years. Probability of detection is known
to be affected by observer performance (e.g., ability to accurately identify otter tracks),
quality of substrate for reading tracks, level of other animal and human activity under the
bridge eradicating tracks, flood or drought events, biological and behavioral aspects of
detectability, and a number of other variables.
Efforts are made to minimize variability in detection probabilities through use of a
standard protocol, limiting observations to a 3-month period, on-site training, relocation
of bridges to obtain satisfactory substrate, and standardized waiting periods after
environmental events that may hamper reading of otter tracks. These efforts to minimize
sources of variation improve the river otter survey and provide more accurate
comparisons across study areas and years. There appear to be additional opportunities to
reduce variation by requiring more formal training in identification of otter tracks and
other aspects of the method and shortening the duration of the survey period.
Standardization, however, cannot address all variables that affect detection probabilities,
and it often is not possible or practical in any case to address or even identify sources of
variation in detection probability. As a result, it is quite likely that detection probabilities
differ from year to year or from county to county, which can result in seriously erroneous
interpretations of data and provides little confidence that observed trends are real. Slight
88
differences in detection probabilities (due to differences in substrate, observers, etc.) can
lead to completely opposite conclusions about changes in numbers of river otters.
Sampling of substrates on which to look for river otter tracks is not conducted in a
probabilistic manner, and survey locations involve convenience sampling under bridges.
Because of these survey attributes, no valid inferences can be made from the percentage
of bridges with otter sign to relative abundance of river otter, and the ability to assess the
precision of the river otter index estimates is limited.
Recommendations: The percentage of bridges with otter sign needs to be calibrated to
otter abundance by empirically estimating probability of detection. Because observers
are a likely source of variability, use of methods to estimate detection probabilities for
each observer is essential. Absent such effort, great caution should be used when
reporting trend data that is based on the river otter survey. We do not agree, for example,
that there is sufficiently reliable information available to support the statement in the
most recent Federal Aid report (McGinty and Young 2003), “When compared with
previous survey results, river otter populations appear stable.”
The survey of substrates under bridges should be based on a sound sampling design with
sampling allocated on the basis of optimum allocation procedures. This process would
reduce expected variances and improve estimates generated, and also allow calculation of
confidence intervals, needed sample sizes to reach some level of precision, and power of
the test.
Finally, before conducting river otter surveys, observers should receive formal training in
identifying otter tracks in the presence of other animal tracks.
89
Harvest Surveys Background: Estimation of hunter harvest is 1 of the primary functions of a state fish and
wildlife agency. Hunter harvest can be estimated in a variety of ways including mail
questionnaires, mandatory registration stations, check stations that sample hunter harvest,
telephone surveys, hunter diaries and hunter/landowner report cards. Each method has
tradeoffs between precision and cost, accuracy and bias. TPWD is 1 of 26 state fish and
wildlife agencies that use mail questionnaire surveys to estimate some types of hunter
harvest (Rupp et al. 2000). The Wildlife Division conducts 5 different harvest mail
questionnaire surveys: Small Game, Big Game, White-winged Dove, Lesser Prairie
Chicken and Public Hunt Harvest. TPWD Wildlife Division also operates mandatory
registration stations to monitor eastern wild turkey harvest and hunter/landowner report
cards for enumerating alligator harvest. TPWD also cooperates within the flyway system
with other states and the U.S. Fish and Wildlife Service on surveys intended to estimate
sandhill crane, waterfowl, dove and other migratory bird harvests.
Harvest Survey: Small Game
Background: The small game harvest survey was first completed after the 1981-82
hunting season. Various iterations since the inception have included other species with
the most recent survey amendment adding prairie dog. As of 2003, the list of species
surveyed through the small game harvest survey included mourning dove, scaled quail,
rabbit, fall turkey, combined turkey, woodcock, rail, sport bobcat, sale bobcat, bobwhite
quail, combined quail, squirrel, spring turkey, pheasant, snipe and gallinule. The
purpose of the survey is to track hunter and harvest trends at the statewide level.
Analysis is also done at the eco-region, county, administrative region, resident status and
month level. For dove and turkey, analysis is also completed at the zone level. A
random sample of 15,000 license buyers is drawn from all valid licenses in February.
With the incorporation of point-of-sale licensing, the sample is drawn from current
license holders. A standardized questionnaire is provided to each hunter sampled. Non-
respondents are sent 2 repeat mailings, at 1 month and 2 months post survey respectively.
90

Analysis: TPWD recognizes that the small game harvest survey was designed to provide
estimates at the statewide level. Precision at smaller levels is not optimal and the results
for some species may be unusable, especially at the county level and for all levels for
those species with a small number of hunters. Return rate is currently around 40%, but
historically ranged 55-60%. For each species and geographical unit combination, means
and 95% confidence intervals are calculated for number of hunters, successful hunters,
success rate, hunter days, successful hunter days, days per hunter, days per successful
hunter, kill, kill per hunter, kill per successful hunters, kill per day per hunter and kill per
day per successful hunter. The data form a negative binomial distribution because of the
large number of zero values. All estimates except for turkey and bobcat have the kill
transformed using an arc hyperbole sine transformation to normalize the data and reduce
the effect of a few large harvest or day values.
Non-response bias is addressed via 3 mailings. Previous analysis has shown that
participation and harvest rates decrease with subsequent mailings. A regression equation
has been developed to predict the cumulative estimate if all hunters returned the small
game survey. TPWD recognizes the statistical vulnerability of basing the regression on 3
data points with an assumption of linearity.
Data and results of analysis are stored at TPWD headquarters. Data are published in
Federal Aid reports.
Recommendations: While WMI applauds the logical approach to estimation of non-
response bias in the small game harvest survey, we cannot overlook that the “cure” is the
same method as the “disease”. While it may seem logical that subsequent mailings result
in lower estimates of participation and harvest, extrapolation to the larger sampling
universe based on a straight line defined by 3 data points is not sound science. An
alternate form of survey is necessary to independently establish trends of non-
respondents.
91
Both the small game and the big game harvest survey estimate fall turkey season harvest.
TPWD believes that the big game harvest survey is more accurate. Because the 2 surveys
are correlated, a correction factor was added to the small game harvest survey in 1999 so
that the estimates in the small game survey are close to the estimates of the big game
survey. TPWD warns the public to only use 1 source for turkey harvest data and to be
sure to state the source of the estimate. WMI recommends that this potential source of
confusion be eliminated by removing the species from 1 of the 2 harvest surveys.
TPWD recognizes the problems of estimating from small sample sizes, but appears from
the documentation received by WMI to include such estimates nonetheless: “if there is
even one hunter the estimates are made and printed” (Small Game Harvest Survey
Results 1986-87 thru 2002-03. TPWD 10 July 2003). WMI recommends that no
estimate be made and printed without a corresponding confidence interval. If the
confidence intervals are larger than the agency can accept, the estimate should not be
made.
TPWD also recognizes the inherent problems with samples generated by hunters who
hunt more than 1 county or month and by the aggregation of counties into ecological
regions based upon deer distribution. Both procedural problems can be corrected by
amending the survey or analysis. WMI recommends that TPWD initiate solutions to the
problems identified by staff.
Harvest Survey: Big Game
Background: TPWD uses the Big Game Harvest Survey to track big game harvest and
hunter trends. Prior to 1972-73, big game harvest estimates were derived from
landowner surveys, game warden estimates, shooting preserve record books and
antlerless permit utilization rates. Only the landowner surveys used a statistical approach
and the survey was based on interviews of randomly selected landowners who provided
harvest estimates for their property. Beginning in 1973-74, big game harvest estimates
for white-tailed deer, mule deer and fall turkey were derived from a mail questionnaire to
92
a random sample of approximately 2.5% of all licensed hunters. Non-respondents were
mailed a second questionnaire. In 1978, javelina was added to the survey. The purpose
of the survey is to track hunter and harvest trends at the statewide and eco-regional level.
A power analysis determined 25,000 samples were adequate for estimates at the eco-
region level and above. Analysis is also done at lower levels (e.g., county and reporting
unit), but TPWD recognizes that the precision is lower and the results are only provided
as “references”.
Analysis: Implementation of the point-of-sale licensing system allows the 25,000 random
samples to be drawn from current license holders. Each license holder is provided a
standardized questionnaire that asks for estimates of harvest and time spent hunting.
Return rate is currently about 37% but traditionally ranged between 50-60%. To correct
for non-response bias, telephone surveys were conducted in 4 years during the mid-
1970’s. Correction factors were determined from analysis of the phone interviews.
Statistical parameters used to describe the data include means, standard deviations and
95% confidence intervals. Data are stored in Austin and reported in annual Federal Aid
reports.
Recommendations: The 25,000 sample size was chosen based upon higher return rates
than currently achieved. Precision and power are believed by TPWD to be dropping.
WMI recommends that TPWD increase sample sizes to levels that allow acceptable limits
of precision and power. As with the small game survey, WMI recommends that no
estimate be made and printed without a corresponding confidence interval. If the
confidence intervals are larger than the agency can accept, the estimate should not be
made.
Estimates should not be produced as “references” without corresponding confidence
intervals. Sampling designed for statewide or eco-regional levels should not be
extrapolated to lower levels.
93
The correction factors for non-response bias are now 30 years old. Prudence would
suggest a repetition of phone interviews, or other methods, to assess current non-response
bias.
Harvest Survey: White-winged Dove
Background: The purpose of the white-winged dove harvest survey is to provide
estimates of white-winged dove harvest, hunters, hunter days and success by county,
hunting zone, ecological area and statewide. Texas white-winged dove hunters are
required to purchase a Texas white-winged dove stamp. Stamps may be purchased
separately, or are included automatically within combination hunting/fishing licenses.
The survey is broken into 2 components to assess the September white-winged dove
special season and the regular mourning dove season which ends in early January. A 2-
stratum sampling scheme is used to partition the sample between stamp holders and
combination license holders. A random sample of 1,000 stamp and 2,000 combination
license holders (4.3% and 1.6% of the sampling populations, respectively) is drawn for
the survey of the special 4-day white-winged dove season. Another random sample of
1,000 stamp and 2,000 combination license holders (2.2% and 0.6% of the sampling
populations, respectively) is drawn to survey the 5-month regular dove season.
Analysis: Statistical parameters used to describe the data include mean and standard
deviation. Hunting activity and harvest parameters are expanded by stamp and combo
license sales to produce estimates of hunter numbers, days hunted and harvest on an area
and statewide basis. The sample size of 3,000 for each part of the survey was chosen
when return rate was much higher. Because return rate is dropping steadily, precision
and power of the estimate are dropping. Bias related to memory and prestige normally
associated with post-harvest sampling is recognized by TPWD. Data are stored in Austin
and reported within Federal Aid reports.
Recommendations: As response rate declines, the corresponding declines in precision and
power become problematic. WMI recommends that the white-winged dove stamp be
94
removed as an automatic component of combination licenses. Other forms of sampling
that are not based on mail questionnaires should be investigated.
Harvest Survey: Lesser Prairie Chicken
Background: The LPC Harvest Survey is used to determine a statewide estimate of LPC
hunters, harvest, cripples lost and hunter days. The survey is mailed to all holders of the
free prairie chicken permit after the end of the season. No follow-up mailing is
conducted, so no corrections are made to address non-response bias. Data are stored in
Austin and provided to the regional and district offices in LPC range. Data are reported
within Federal Aid reports.
Analysis: Besides the statewide harvest and effort parameters, the survey also provides
means and 95% confidence intervals on birds seen, group size, years hunting and hunter
age. Hunter numbers is calculated from the binomial distribution formula, while all other
statistics are normally distributed.
Starting in 1998, LPC harvest permits were made available through the electronic point-
of-sale system. License clerks, apparently because the permit was free, encouraged
hunters to take the permit, even though they had no intention of hunting LPC. Because
the survey is mailed to all hunters, sample size increased dramatically, but response rate
decreased. TPWD recognizes that giving the permit to hunters that do not request it has
caused great problems. Sample size for the survey has grown from 1,795 in 1997 to
14,677 in 2001. Return rate has subsequently fallen from >60% to <30%.
Recommendations: As noted in the write-up on the white-winged dove survey, any
artificial expansion of the sampling frame lowers precision and decreases power. In the
case of the LPC harvest survey, the fact that the permit is free and available to those with
no intention of hunting LPC artificially increases the sampling universe. The resulting
statistics are less precise, a condition not conducive to management of a species in the
95

conservation status of LPC. WMI recommends that permit availability be constrained to
only those hunters intending to hunt for LPC.
Harvest Survey: Public Hunt
Background: Texas hunters who purchase the Annual Public Hunting Permit are entitled
to hunt for a variety of species on the 1.2 million acres of lands owned or leased by
TPWD. The Public Hunt Survey is designed to collect data on usage and harvest from
those hunters participating in the Public Hunt Program. The primary purpose of the
survey is to quantify lease payments made to the private landowner whose lands are
leased as public hunting lands by TPWD. The survey also generates estimates of hunting
interest and harvest for 10 different species or species groupings within each public
hunting unit and generates estimates of days hunted and the number of trips. These
estimates of the hunting unit are used as indices to evaluate its hunting conditions. The
survey is conducted by using a mail questionnaire administered to a random sample of
20,000 of the approximately 40,000 Annual Public Hunt Permit purchasers. A second
mailing is made to non-respondents 1 month following the survey mailing. Survey
response is approximately 32-35%. Statistics are generated at the statewide, hunting unit
and landowner level and include the mean and a measure of variation. Data are stored in
Austin.
Analysis: Total hunting days are summed from the respondents to the survey. An
individual private landowner receives a percentage of the total revenue from the annual
permit sales equal to the percentage of hunting use occurring on his land(s). The
percentage of hunting use for the land owned by a landowner within the Public Hunt
Program is equal to the proportion of the total hunter days that occurs on his land.
TPWD recognizes that a 60% non-response rate may introduce non-response bias.
Because the Public Hunt Survey is not used to estimate game harvest, however, TPWD
believes the bias is negligible.
96
Recommendations: For several reasons, the public hunt survey is collecting information
that does not meet a scientific standard. First, the recognized non-response bias inherent
in the public hunt survey invalidates it use as a harvest estimator. Unless the non-
response bias is corrected, harvest information should not be queried within the survey.
Second, the design of the survey does not allow hunters who pursue multiple game
species to distribute their time spent in pursuit of each. Statistics on the number of days
of hunting and the number of trips cannot be broken out for those hunters who pursue
multiple game species, which therefore invalidates the summation over all participants.
Finally, the process of monetizing lease opportunities based on the percentage use
indicated through the survey may itself be subject to response biases. A 15% response
(6,000 out of 40,000) appears on the surface to be too imprecise to allocate lease revenue.
Unless these biases are corrected, the distribution of lease payments to private
landowners may be invalid.
Harvest Survey: Eastern Wild Turkey
Background: TPWD used harvest registration of eastern wild turkey to track trends in
harvest and hunter effort. Registration stations are established in counties with an eastern
wild turkey season. Registration station agents record data on harvested turkey brought
to the registration station. Agents are provided standardized data forms and instructions.
WMI was made aware of no other training of agents. Data collected by registration
agents describe harvest and hunter effort by county. Data are used by TPWD to refine
seasons. Data have been stored by the project leader, but are now being transferred to
Austin. Data are reported in Federal Aid reports.
Analysis: Annual harvest is the summation of registration forms returned by station
operators to TPWD.
Recommendations: None
97
Harvest Survey: American Alligator
Background: TPWD collects harvest data on alligator to track trends in harvest,
commercial demand and alligator distribution. Texas’ most recent seasons on alligator
began in 1984, after protection was afforded the species following major declines in the
1900s. Harvest has stabilized, but is somewhat affected by market prices for alligator
hides. Alligator hunts are available on selected TPWD wildlife management areas,
several U.S. Fish and Wildlife Service National Wildlife Refuges, and on private lands.
To take alligators, hunters are required to have a wild harvest CITES alligator tag as well
as a Texas alligator hunting license. License allotments are established through a formula
that establishes quotas for important alligator habitat types.
Analysis: Managers and/or landowners of properties with alligator hunters report alligator
harvest. Reports provide an estimate of harvest by property. Annual harvest is the
summation of report cards received by TPWD. No other statistical parameters are
generated. Data are stored at a WMA and reported in Federal Aid reports.
Recommendations: None
Harvest Survey: Sandhill Crane
Background: Texas is one of the cooperating states in the mid-continent sandhill crane
harvest survey. The survey is conducted by the Harvest Survey Section of the U. S. Fish
and Wildlife Service, but the Service relies upon the states to provide hunter sampling
data. The Office of Management and Budget has notified the Service that it will
recommend eliminating the survey unless hunter response rates improve significantly.
Analysis: TPWD assessed non-response bias in the sandhill crane harvest mail survey
through a special telephone survey conducted by the University of Texas. The
assessment found that 80% of non-respondents did not hunt sandhill crane and that 44%
of non-respondents did not remember requesting a sandhill crane hunting permit.
98

Apparently vendors under the new point of sale system are encouraging hunters to take
all available permits. While there are likely other sources of non-response, the dilution to
the sampling pool caused by non-sandhill crane hunters accepting sandhill crane permits
is a contributing factor to the non-response, and probably significantly affects the
precision of the estimate. The Office of Management and Budget has recommended that
the Service improve response by including a cover letter with the survey and by
increasing the number of follow-up letters to 3. If these methods do not increase the
response rate to >75%, the Service has been instructed to conduct follow-up phone
surveys to analyze whether non-response bias exists.
Recommendations: The dilution of the sampling pool caused by hunters taking sandhill
crane harvest permits even though they have no intention of hunting sandhill cranes
lowers the utility of the survey substantially. WMI recommends that TPWD constrain
the availability of sandhill crane hunting permits only to those hunters who intend to hunt
sandhill crane. Further steps, including follow-up phone surveys, may be necessary if
response rates to the mail questionnaire continue to decline.
Harvest Survey: Waterfowl, Doves and Other Webless Migratory Game Birds
Background: Texas cooperates with other states and the U.S. Fish and Wildlife Service in
the national Harvest Information Program (HIP). To hunt migratory birds in Texas,
hunters must be HIP certified. TPWD certifies hunters for HIP through the point-of-sale
license system. License venders are required to ask hunters if they intend to hunt for
migratory birds. If they respond in the affirmative, hunters are asked about harvest levels
and species hunted. The Texas HIP data is combined with other states HIP data to form a
national database on harvest of migratory birds.
Analysis: For several reasons, the numbers of HIP certified hunters are artificially high in
Texas. When hunters are HIP certified, but do not intend to hunt migratory birds, the
sampling frame for evaluation of migratory bird harvest is diluted. TPWD estimates
there are approximately 500,000 migratory bird hunters in Texas, yet there are 800,000
99

HIP certifications. One reason for overcertification is the automatic issuance of
waterfowl and white-winged dove stamps within the Super Combination license. There
are approximately 320,000 Super Combination licenses sold in Texas annually. While a
percentage of Super Combination license buyers likely hunt migratory birds, TPWD
cannot segregate those that do not hunt from receiving migratory bird stamps. Thus the
sampling frame is diluted and estimates of harvest made less precise. A second problem
likely lies with the license vender’s understanding of and compliance with HIP
procedures.
Recommendations: The agency needs to increase the validity of HIP harvest estimates
by constraining migratory bird permits only to those hunters who intend to hunt
mourning dove, waterfowl or other migratory birds. WMI understands that the agency
benefits from an attractive, cost-effective combination license package, but licensing
packages should not add additional levels of uncertainty to the management of migratory
birds and their harvest.
WMI also recommends that TPWD improve the reliability of HIP estimates by improving
awareness and understanding among license venders. Other states are dealing with this
issue and TPWD would benefit from dialogue with those states.
Age/Condition Of Hunter-Harvested Game Animals Background: Age and condition of game animals taken by hunters provides insight into
age structure, health and condition and hunter harvest rate. Age data are also frequently
required for estimation procedures. TPWD Wildlife Division staff members collect age
and condition data from hunter harvested eastern wild turkey, white-tailed deer, mule
deer and alligator.
Data are collected to monitor trends in eastern wild turkey. For mule deer, data are meant
to monitor animal condition and antler development, create harvest age structure
100

comparisons (local, compartment and county levels) and support harvest
recommendations and decisions regarding regulation changes. For white-tailed deer,
TPWD regulatory staff members use age and antler information to determine regional
and county differences in deer condition, antler development, and the age and sex ratios
of deer harvested. The data are believed to be useful in helping demonstrate the effects of
various regulations on white-tailed deer age structure and sex ratios in the harvest. Age
and sex ratios are also believed to help determine progress or lack thereof in managing
white-tailed deer.
The techniques are also designed to measure the effect of biotic and abiotic variation on
animal condition. Eastern wild turkey data, for example, are believed to reflect weather
conditions, annual turkey breeding chronology, hunting conditions and mast crop.
White-tailed deer and mule deer data are believed to represent the interaction between
hunter density and selection, habitat quality, herbivore density and environmental
(especially rainfall) conditions. Depending upon the sampling, the interaction sampled
may be at the ranch, county, reporting unit and/or the ecoregional level.
All surveys collect data on age and sex. White-tailed deer surveys also collect
information on dressed weight, antler beam circumference, antler spread and the number
of antler points. Mule deer surveys are similar to white-tailed deer surveys. Eastern wild
turkey check station data includes spur length, weight and beard length.
TPWD staff members are responsible for data collection in the white-tailed deer, mule
deer and alligator surveys. Hunters make the measurements and report data in the eastern
wild turkey survey.
Analysis: All surveys are bounded by the assumption that samples of hunter-harvested
animals represent biological population age or condition values. Although bias is
expected in some surveys, TPWD staff members assume that bias does not contort the
results.
101
The white-tailed deer survey assumes that sample distribution is randomized within
subpopulations of deer exposed to “average” management for the county or reporting
unit. This is a difficult sampling threshold. Biological age and condition sampling must
be predicated on a cause-and-effect basis (Steidl et al. 2000). Harvest regulations
intended for the county as a whole must be assessed by deer harvested under those
specific regulatory constraints, so that the adequacy of regulations can be influenced by
the data collected on age and condition. Deer herds managed under a different set of
harvest regulations on intensively managed properties do not represent the “average”.
TPWD programs accentuate the ability for private landowners, who desire, to manage the
deer herds on their property and create regulatory flexibility to allow landowners the
ability to achieve their management goals. County-specific regulations are not intended
for these intensively managed properties, and should not be affected by the deer sampling
therein. TPWD is correct in asking biologists to segregate data collection, but the process
used is open to misinterpretation and/or misapplication by well-intentioned field staff.
All surveys assume that sample size is adequate. Sampling adequacy may be assessed by
analyzing variation in measurements at different sampling intensities. As Steidl et al.
(2000) state: “Virtually no 2 biological entities are identical, and even small,
meaningless differences can be detected with large sample sizes and high precision of
measurement.” “The genuine question is whether 2 populations differ by a biologically
meaningful quantity” (Steidl et al. 2000). In other words, TPWD must interpret the
interface between statistical significance and biological significance.
All surveys are built around the assumption that they are representative of some
predetermined geographical area. For the assumption that certain measurements are
reliable at a specific geographical sampling frame, a stepwise analysis of variances
obtainable at different sampling intensities would be required to frame the power of
sampling at one frame versus another. No such analysis has been accomplished for
eastern wild turkey, white-tailed deer, alligator or mule deer age and condition surveys.
All surveys assume that the aging technique is valid. For deer, TPWD relies upon tooth
102

eruption and wear. The tooth eruption and wear technique, however, was documented to
be an accurate age estimator for only 42.9% of samples of known-aged white-tailed deer
when compared to cementum annuli (Hamlin et al. 2000). The tooth eruption and wear
technique tended to overestimate young animals and underestimate ages of older animals,
a measurement error likely to skew interpretations of age structure important to
management of harvest. For eastern wild turkey, station operators judge a harvested
turkey as juvenile (jake) or adult. Biologists also interpret beard and spur measurements
to classify the sample as juvenile, second year or adult. No study has confirmed the
reliability of turkey ages obtained through this procedure.
Deer surveys assume that condition variables (antler measurements and dressed carcass
weights) are reflective of either deer density or a specific known environmental variable.
No assessment has determined the degree to which condition measurements vary on a
county- or reporting unit-wide basis. Some regions report conflicting relationships where
both density and condition are positively correlated.
Eastern wild turkey surveys assume that information collected by citizen check station
operators is valid and accurate and that biologists are consistently able to translate
weight, beard length and spur length into an accurate age category.
Data analysis is rudimentary. No probability values are calculated for any dataset.
Depending upon the species, data are reported as mean values, frequencies or counts.
Confidence intervals on mean values are in some instances not calculated, or if
calculated, are not reported.
The geographical area represented as a significant unit in sampling scale varies from
species to species, ranging from the ecoregion to a subsection of a county. Eastern wild
turkey data are believed to be representative of the ecoregion. White-tailed deer data are
representative of the reporting unit (aggregation of counties) or county. Mule deer data
are representative of the county or the management compartment (subsection of county).
Even when the representative scale may be larger than the county, data in all instances
103

are still reported by county.
Age and condition data are collected from hunter-harvested game at locations where there
is a high probability of TPWD Wildlife Division staff members encountering a high
number of animals to sample. The single exception is for eastern wild turkey, where
unmanned biological check stations are located at gas stations and stores that serve as a
turkey harvest registration stations in counties with an eastern turkey spring hunting
season. White-tailed deer are sampled at cold storage facilities and hunting camps within
counties where there is a predetermined need for intensive harvest information and the
perceived ability to obtain data. Mule deer condition and age data are also collected
from cold storage facilities and hunting camps, but sampling is conducted throughout the
hunted mule deer range. Alligators are sampled at some coastal WMAs.
Sampling intensity varies. For white-tailed deer, the sampling goal is to measure 100
bucks and 100 does from within each of approximately 60 counties per year. In some
locales where it is difficult to obtain samples, data from groups of counties are lumped.
White-tailed deer weight samples are only collected every 5 years. For eastern wild
turkey and mule deer, the desired sampling intensity has not been estimated. Mule deer
are collected “whenever available”.
No sampling scheme for any species has been designed to yield random samples, nor has
the power of any sampling scheme been determined. Staff members collecting data on
white-tailed deer are instructed to only collect data representative of biological
populations affected by county harvest regulations. For example, data from “Managed
Lands Deer Permit” properties may contribute towards a county-wide mean value as long
as the data are not significantly different from the county-wide mean value, in the opinion
of the biologist.
All schemes are susceptible to observer bias, observer training and inaccuracies in the
application of standard methodology. TPWD recognizes that white-tailed deer data are
limited by the accuracy of the aging technique. Mule deer age data may also be limited
104

to the same extent, since the tooth replacement and wear techniques used to age both
species are similar. Locker plant checks may also be susceptible to skewed age ratios
because of selective use of locker plants by hunters. Age ratios, especially of males, may
be skewed by hunter selectivity.
Written protocols are available for the white-tailed deer survey but have not been
distributed frequently on an annual basis since the 1970’s. Project staff members indicate
that regular annual distribution of protocols will begin in 2004. Written instructions are
provided to citizens manning eastern turkey check stations.
Training is variable. Observers collecting white-tailed and mule deer data receive their
training during their first surveys with another (experienced) employee. “A Guide to Age
Determination of White-tailed Deer” has been developed to help new employees (learn
the technique) and perhaps serve as a reference for experienced employees. Other than
the instruction sheet, reviewers were not made aware of any training provided to eastern
wild turkey check station operators.
Data collection for all species appears to be standardized but access is variable. There is
a standardized data sheet for all species. Both mule and white-tailed deer data are stored
in an electronic format available to both program and field staff in TPWD headquarters.
Eastern wild turkey and alligator data are stored by field staff and are not maintained in a
centralized location available to all.
Recommendations: The issue of randomness is problematic in age/condition surveys.
First, hunters do not kill randomly, and hunter selectivity will vary tremendously on
several different scales. Second, if TPWD sampling of hunter harvest was randomized, it
likely would make representative sample sizes much more difficult to obtain. So, like
spotlight surveys, the lack of randomness in sampling must be accepted as reality. To
somewhat offset the lack of randomness, much more attention needs to be paid to the
inherent biases that affect the sampling frame.
105

To quantify the assumption that harvest samples of age represent biological population
values, an independent sample of age structure must be obtained. For white-tailed deer,
the strategy of comparing antlerless age structure to buck age structure may yield
important insight into the biases of buck age sampling. Selectivity of hunters for certain
ages of antlerless deer is assumed to be less than selectivity for hunters for certain ages of
bucks. Selectivity by hunters for adult does when accompanied by fawns or yearlings,
however, is an unquantified bias in antlerless age structure. For mule deer, because
antlerless harvest is low, no independent harvest-based samples are available. If age
structure is deemed to be valuable to management, then the biases of harvest age
structure need to be determined. Other jurisdictions have used age structure of road kills
and hunter surveys to provide additional insight into age structure.
To quantify the assumption that harvest samples precisely represent the true age structure
of the harvest, statistical confidence intervals must be calculated and reported. WMI
recommends that all mean values that are reported be accompanied by a confidence
interval. In addition, statistical power must be calculated for all tests. What percentage
change in age structure or condition does TPWD recognize that it needs to detect in order
to trigger a regulatory change?
To quantify the assumption that harvest samples are representative of the geographical
area they are intended to represent, WMI recommends that sampling be aggregated at
different geographic scales, and coefficients of variation used to determine when
sampling is representative. Mean values and confidence intervals should only be
reported for the geographical unit for which TPWD believes to be representative.
Reporting of values at smaller scales should cease.
Inaccuracies and biases in aging techniques must be known. WMI recommends that
TPWD increase training of both new and experienced observers in aging. Annual testing
of observers should be initiated. WMI also recommends that alternative aging techniques
be used to compare with current techniques used to estimate age.
106

Using check stations to assess harvest sex ratio is less efficient than the standard harvest
survey. WMI recommends that harvest sex ratio not be reported from age/condition
surveys.
Cause-and-effect needs to be determined before measures of weight and antler
dimensions are utilized in regulation setting. Changes in condition that are believed to
represent density effects will mislead decision-making if the changes in condition are
artifacts of inadequate sampling or reflect an environmental condition. There are several
correlated recommendations to address this issue. Standardized measures of density-
independent factors that influence weight and antler dimensions (rainfall, winter severity,
summer severity, mast availability) must be developed and used to assess cause-and-
effect relationships. Second, the responsiveness of weight and antler dimensions to both
biotic and abiotic factors must be shown at the scale at which the data are collected.
Extrapolation of studies conducted on WMAs and/or single ownerships to county-,
reporting unit, or ecoregion scale is not adequate. Regulatory units must be used as
experimental units to assess the true cause-and-effect of regulations on condition and age
structure. WMI recommends that condition data not be collected unless accurate cause-
and-effect relationships are shown at the regulatory unit level.
Hunting pressure (hunter density) and harvest rate (harvest per hunter) may not be
correlated and both measures may affect harvest age structure. If TPWD values accurate
assessments of annual variation within a unit, then some measure of hunting pressure and
harvest rate must accompany age structure. If TPWD is more interested in long-term
trends, 3- or 5-year moving averages may screen out annual variation in hunting pressure
or harvest rate. WMI recommends that TPWD sample hunting pressure and harvest rate
if annual fluctuations in age structure are deemed important, or if comparisons are made
between regulatory units.
107

Disease Monitoring
Background: Various wildlife diseases may pose a threat to wildlife and/or human health.
Historically, the Wildlife Division had a “Disease Project” (Fed. Aid Proj. W-93-R) that
coordinated disease activities. Upon termination of that project in 1967, Wildlife
Division program staff members were given responsibility for handling wildlife disease
issues. During the 1980s, the “kills and spills” team of the Resource Protection Division
(later Inland Fisheries) assisted the Wildlife Division with investigating major wildlife
die offs. Wildlife Division staff members are provided operational protocols on
collection of dead animals when a large-scale die-off is occurring. Recent examples
include collection of dead waterfowl, sandhill cranes and doves. Jurisdictional authority
varies, and TPWD cooperates with Texas Animal Health Commission (TAHC) and
Texas Department of Health (TDH) in sampling of wildlife for diseases. TAHC has
authority for reporting and tracking for diseases in alternative livestock (including elk)
and white-tailed deer and mule deer held under authority of Scientific Breeder Permits.
TDH has authority to report and track diseases that pose a risk to human health and
safety. TPWD has authority over free-ranging wildlife and deer held under authority of
Scientific Breeder Permits. TPWD has authority to report and track diseases that pose a
risk to human health and safety. The only currently active pre-mortality monitoring
program assigned to the Wildlife Division is implementation of the Texas Chronic
Wasting Disease (CWD) Management Plan.
The CWD Management Plan established collection procedures for clinical, free-ranging
cervids beginning in late summer 2002. The collection of clinical deer has been reported
by researchers in other states to be particularly useful in detecting the presence/absence
of CWD in local areas statewide. TPWD will continue testing clinical free-ranging deer
for CWD as they are encountered.
A geographically-focused free-ranging cervid monitoring program was implemented
during the fall 2002 deer-hunting season. Brain stem samples from hunter-killed deer
108
were obtained from TPWD WMAs, state parks, and private land. Employees were
trained in sampling procedures and provided standardized data sheets. Sampling was
predicated on USDA recommendations that 148 samples would be sufficient to detect
disease at 2% prevalence, regardless of the biological population size. TPWD’s goals
were to obtain representative samples from each of the State's 10 ecoregions. The 5-year
2002 -2006, goal is to cumulatively collect 459 samples from each of the 10 ecoregions.
The cumulative sample would be used statistically to detect CWD at 1% prevalence level
with 99% confidence. Since CWD could potentially occur anywhere in Texas,
monitoring efforts would be focused to achieve a stratified sampling scheme across each
ecoregion of the State.
The grand total of all samples collected and known April 1, 2003 is 2043 of which 2020
deer and 23 exotics were found CWD negative. Samples were collected from 143 of 254
counties in Texas, and 7 counties had 50 or more samples collected. Five ecoregions had
160 or more samples collected (150 samples from each ecoregion was the goal). The
geographic distribution of sampling is currently not considered adequate for determining
whether or not CWD exists in Texas. The goal is to improve upon distribution of samples
collected within ecoregions and within counties. The goal of 2003-2004 and the next 3 to
5 years is to collect 5000 samples (500 from each ecoregion) each sample year. The
increased sampling is to have a 99% confidence level in detecting CWD if only 1% of the
biological population is infected. Long-term surveillance sampling for CWD is required,
as little is known about the incubation and infectious periods of the disease.
Analysis: Sampling results provide a presence/absence measure of CWD in Texas. The
statistical foundation of the CWD sampling should give decision-makers confidence in
reporting that no CWD has been found to date in Texas. Sampling data are stored in
Austin and reported in Federal Aid reports.
Recommendations: WMI applauds TPWD for the scientific approach to CWD
monitoring. Increased sampling to achieve 99% confidence in detecting CWD if 1% of
the biological population is infected is recommended.
109
Browse Survey: MLDP Properties
Background: The basis for browse surveys in Texas originated with the publication by
Lay (1967). Original intent of the method was to provide a method to appraise deer
range and was designed primarily for deer ranges in eastern Texas.
Since publication of the original method, various modifications and applications of the
methodology have been tried. A key premise of the methodology is that trained observers
through various sampling protocols can ascertain the foraging use on key deer browse
species. It is further surmised that degree of use over a variety of species reveals
information on balance of the deer herd with regard to the forage base and thus
information on overall range condition.
Application of the method in habitats outside of eastern Texas has been problematic
primarily because of limited number of stems available to deer and the resulting difficulty
in achieving necessary stem counts. These problems have led biologists to modify the
technique in a variety of ways to accommodate various range sites, browse availabilities,
rainfall, etc. As a result, there is no one standard protocol statewide and efforts are
continuing today to modify the methodology further to meet specific conditions.
Applications in south Texas seem to be feasible. Some biologists have concluded that
simple cursory surveys of deer range are preferable to the more formal browse stem count
method.
Individual ranches are the most common scale for the data. Varying habitat conditions
have resulted in very little standard sampling design for the method. In addition, because
of this variability standardized data forms and or databases are not used. Training on use
of the method is done primarily by experienced observers but lacks continuity with other
users of the method elsewhere in the state. Data storage and data reporting for this
method appear to be highly variable.
110

For purposes of this review, we will concentrate on application of browse surveys on deer
ranges on cooperator lands within the Managed Lands Deer Permit Program (MLDP). A
measure of deer range condition is needed for these lands prior to initiating management
and at intervals afterward to see if prescribed management is improving overall land
conditions. For these lands, a stated objective for the technique is to be able to detect a
10% change in use in 2 years. Use of the methodology seems to help landowners
understand impact of browsing animals, and more cooperators are including habitat-
based goals in their wildlife management plans.
Analysis: Assumptions of this methodology are many: 1) a measure of browse use is a
telling indicator of overall range condition; 2) a change in browse use relates to a change
in deer numbers; 3) multiple observers are consistent in their use of the methodology; 4)
sampling strategies are based on a sound statistical design; and 5) sample sizes for key
species of browse are adequate to detect desired changes in use.
Lack of a standard protocol for the method makes evaluation difficult. This technique is
a prime example of how a basic methodology developed for certain ecological conditions
is modified and applied elsewhere without sufficient testing to verify its validity. It will
be difficult to successfully apply the method on small ranches because of needed sample
sizes.
During our review, we heard a wide variety of opinions and histories regarding this
method and had a hard time securing documentation of how the method is applied.
Unfortunately, very little testing and formal evaluation of the method has been done since
it was first applied. An analysis by Jim Yantis in 2000 is most notable. In addition, a
recent evaluation by Mike Janis concerning a power analysis of the stem count index to
achieve measures of stated change is helpful, long overdue, and justifies recognition.
Janis was able to present needed sample sizes for managers to detect changes in 1st, 2nd,
and 3rd choice plants. Because of the importance of these results to resulting
management strategies and the high cost of human and fiscal resources to secure these
data, further tests are called for.
111

In the arena of wildlife habitat analyses there is a universal desire (hope) that a fast,
accurate, cheap, and easy to apply method will be found. In our opinion, this is
comparable to the potential of discovering gold at the end of the rainbow.
Recommendations: Basic research studies applying the technique in pastures with known
and varying densities of browsing animals should be done to verify validity of the
assumption that degree of browsing use indeed is related to densities of browsers.
Sampling protocols must be designed that incorporate sound statistical design and clearly
specify sample sizes required for stated degrees of precision. Differences by ecoregion
will make development of these protocols difficult.
Standard written protocols (by ecoregion) are needed and should be developed. The on-
going tolerance of unstructured modification and application of the technique must be
stopped. Once protocols are adopted, formal training in application of the methodology
should be implemented for all users. Finally, for this method to be scientifically valid in
making management recommendations, analyses of resulting data as performed by Janis
are needed. Importance of these studies is such that additional expertise from statisticians
in Austin should be sought and used.
Baseline Inventory and Monitoring Baseline Inventory and Monitoring: Wildlife Division Lands Background: The objectives of the Baseline Inventory and Monitoring Project are to
obtain complete floral and faunal surveys, collect essential ecological data on selected
species, and investigate effects of habitat-altering occurrences on plant and animal
species found on lands managed by TPWD’s Wildlife Division. Surveys to determine
species absence or presence, as well as responses to habitat changes are conducted
annually utilizing TPWD personnel, volunteers, and cooperative agreements with
university personnel. Baseline inventory and monitoring activities on Wildlife Division
112

lands are coordinated and performed by staff members assigned to those lands. Methods
used to conduct these activities follow the procedures outlined in Simpson et al. (1996).
Of the 53 WMAs managed by the Wildlife Division, 7 areas reported active baseline
inventory and monitoring programs, 39 reported no such activities, and 7 submitted no
report (Ruthven 2003). Findings are intended to result in development of management
recommendations for specific species or habitats and species lists for individual
properties. Results of baseline inventory and monitoring are documented in Federal Aid
reports. New species accounts and results of species ecology and habitat management
studies reportedly are published in professional journals and disseminated to the general
public.
Analysis: Our review of Simpson et al. (1996) is that it provides a sound basis from
which baseline inventory and monitoring can proceed. It presents a variety of accepted
techniques that could be used to inventory and monitor floral and faunal species based on
site objectives. Importantly, the manual recommends that site managers first review
pertinent literature about the techniques to improve understanding of their use and
limitations. There are a number of important attributes of the manual that contribute to
rigorous, scientific surveys. It stresses the importance of first determining objectives of
any survey prior to selecting techniques or conducting surveys by making it clear that the
objectives and purpose of an inventory will determine the required level of detail needed
and the methods that should be implemented. It recommends that a statistician be
consulted in developing monitoring projects that have as an objective using abundance
data to compare different management practices, and emphasizes that objectives must be
pre-determined and proper sampling methods must be used to achieve those objectives.
We are concerned that at least 73% of the WMAs managed by the Division have no
active baseline inventory and monitory program, and that there appears to be no clear
policy on conducting such efforts. Instead, our understanding is that inventory and
monitoring is conducted on a catch-as-catch can basis and often depends on interest by
university researchers.
113

A further concern is that use of baseline inventories to determine effects of habitat
treatments on wildlife management areas apparently tends to utilize ad hoc experimental
designs.
Recommendations: We recommend the following measures to improve the scientific
basis of Wildlife Division baseline inventory and monitoring:
First, baseline inventory and monitoring activities are long-term endeavors that should be
planned for and funded accordingly.
Second, the manual describing procedures for baseline inventory and monitoring
(Simpson et al. 1996) needs to be updated on a regular basis. Efforts should be made to
incorporate changes based on experience in using the manual and its described
procedures. It is approaching 10 years since it was last compiled, and it likely would
benefit from such revision at this time.
Third, greater effort is needed to put in place active baseline inventory and monitory
programs on WMAs managed by the Division. Policy and priorities should be
established and carried out to achieve this goal.
Fourth, use of baseline inventories on WMAs to determine effects of habitat treatments
should, as Simpson et al. (1996) recommend, be contingent upon receipt of guidance on
experimental design and sampling considerations by TPWD statisticians. Consideration
also should be given to putting such baseline inventory efforts through the research
project review committee process.
Baseline Inventory and Monitoring: State Parks Background: Qualitative and quantitative studies pertaining to flora and fauna within
state parks are conducted to record baseline data, establish a basis for long-term
114
monitoring, change detection, restoration, and provide guidance for natural resource
planning and management.
Baseline data collection for characterization of vegetation or habitat type on state parks
consists of Ecosystem Surveys, 2 levels of Department Lands Inventory (DLI), and Fire
Monitoring Handbook (FMH) permanent vegetation monitoring. Ecosystem survey is a
broad, Series-level characterization of plant community acreage on conservation lands
that shows and rates condition by acres. DLI Level 1 is a standardized characterization of
representative plant communities at the Series level. DLI Level 2 includes mapping and
ground-truthing to provide the baseline for long-term ecological research and monitoring.
FMH permanent vegetation monitoring is used to accumulate a statewide database for
developing baseline information and for monitoring vegetation response to management
practices.
TPWD has prepared a written document to prescribe the scope, guidelines and protocols
that govern baseline vegetation studies on state parks. The document sets forth the
responsibilities of project managers and investigators with respect to vegetation inventory
of all vascular plants, collection of voucher specimens, noting and locating rare species,
vegetation characterization, vegetation mapping, sampling locations, GIS data collection
and use, and reporting of results and recommendations for additional inventory/survey
work. The document also describes required actions to be undertaken in conducting
FMH permanent vegetation monitoring, including specification of sampling protocol,
establishment of plots or transects to characterize vegetation at a minimum significant
sampling level, digital photograph documentation, and coordination with other surveys.
Required procedures are laid out for archiving inventories and databases from state parks.
To the extent possible and depending on the standards called for in the resources
management plan for the site or that may be required by the U.S. Fish and Wildlife
Service for listed taxa (plants, vertebrates, cave/karst invertebrates, etc.), priority is given
to nesting plots into existing FMH vegetation monitoring/fire effects permanent plots.
115
Floral inventories are conducted to maximize sampling for state and/or federal species of
concern. Ecological data/collection labels/literature/specimens/WWW databases are
reviewed and then search images are generated based upon rapid assessments of the
subject tracts. Vegetation polygons are developed a priori based upon geology, soils,
landform, and aspect as well as historical or aerial images. Rare or unusual/noteworthy
communities are field mapped and then sampled during the appropriate season(s).
Follow-up assessments are fine-tuned in the field and the polygons are sampled as
repeatedly as practicable during different seasons and wet-dry cycles. DLI are developed
accordingly.
Fauna and flora are inventoried by habitat and association by competent observers and
documented according to established collection and curation, and in some cases federal
permit protocols. Avifauna are observed and, if appropriate, point counts are installed
following Ralph et al. (1993). Documentation of observations of unusual/rare birds
reported is requested and follows the standards of the Texas Bird Records Committee
(TBRC).
Baseline inventory and monitoring on TPWD lands, at a minimum, follows procedures
set forth in a Departmental manual (see discussion in review of Wildlife Division
methods). Baseline inventories of mammals follow Wilson et al. (1996). Specific project
needs and PhD or MS thesis research require specific methodology, which are reviewed,
permitted and tracked by TPWD Natural Resources Program (NRP) staff. Sampling for
taxa listed under the Endangered Species Act, such as cave and karst faunal investigation
in the Balcones escarpment zone, follows protocols established by the Service. Geology
mapping follows the standards of the University of Texas Bureau of Economic Geology
and the STATEMAP geological mapping agency. Soil sampling relies on the NRCS Soil
Survey Geographic database.
Sampling of biota generally is weighted by habitat. Within habitats, quantitative
sampling is governed by standard methodologies. Where habitat is more extensive or
where habitats are characterized by patchiness (e.g. grasslands, bogs), random samples
116
are taken. In some limited habitats, such as xeroriparian corridors, a sampling interval of
a set length suitable to the size of the habitat patch (e.g., 50m) is utilized. Insects are
sampled by habitat and then within habitats by means of standard sampling protocols
depending on taxa, such as malaise, blacklight, CO2, sweep nets, pitfalls, etc.
Analysis: From the information made available to us, TPWD’s NRP appears to have
adopted a rigorous approach to inventory and monitoring of flora and fauna of state
parks. In part this approach is demonstrated by the document prescribing the scope of
work, guidelines and protocols to be used for NRP baseline vegetation projects
undertaken. In addition, protocols for permanent vegetation monitoring adhere to the
National Park Service’s well-established, standardized data collection procedures (USDI
2003). A similar approach is taken with respect to requiring use of established, accepted
protocols for monitoring of faunal species, such as those of the Service for ESA-listed
cave and karst species. Uniformly-gathered data facilitates information exchange among
parks and training and movement of staff, and provides databases useful to evaluate
management practices and inform park management programs.
We reviewed several baseline assessments of fauna and flora at state parks and found that
they provided explicit methodologies and used statistical parameters to describe the data
where appropriate. We understand that many baseline assessments are graduate student
research projects, which likely assures a rigorous approach to data collection, reporting
and analysis and helps cultivate and foster good relationships with universities to the
benefit of the NRP and state park management.
We are concerned about the practice of year-to-year NRP contracts for mammalogists,
herpetologists, geologists, hydrologists, and other specialists needed to carry out
monitoring plans. The funding uncertainty created by this practice appears to make it
difficult to plan and carry out monitoring efforts over a sufficiently long period of time
(at least 5 years) to provide useful information.
117
At present, it appears that the NRP is not able to access information electronically in
TPWD’s Biological Conservation Database and input that information in the State Park
Resources Information System (SPRIS) or the Resources Information System (RIS).
Most elemental occurrences on state parks in the BCD come from the parks. Use of the
same scaling among databases is essential to allow import of overlays.
Finally, we were informed of a number of shortfalls that present challenges to TPWD’s
park programs. We understand, for instance, that only about 45% of sites have good,
solid information. The absence of dedicated research or project funds and lack of success
in competing in the research project review process are likely significant contributors to
this situation.
Recommendations: First, monitoring plans should be developed and funded for a 5-year
period. Second, efforts need to be made to ensure that the NRP and state parks are able
to access information in TPWD’s Biological Conservation Database and input that
information in SPRIS or RIS. Use of the same scaling among databases is essential to
allow import of overlays. Third, greater effort is needed to ensure that solid baseline
information is obtained on all state parks. Although some sites may not be appropriate for
baseline or natural history surveys, changes should be considered to make accessible
research or project funds for state park efforts.
Human Dimension Surveys
Background: The agency acquires information on opinions and desires of interested
publics through several methodologies. The review team found human dimension
information was obtained through 2 basic approaches: 1) formal contracts with other
agencies, organizations, or universities where specific human dimension studies (surveys)
are designed and implemented and 2) various inquiries designed and implemented by the
agency. For the most part, human dimension studies carried out through formal
contracts are designed, analyzed, and reported on by entities beyond the agency. A good
example of this process is the cooperative agreement with the Western Association and
118

Colorado State University investigating “Wildlife Values in the West.” For purposes of
this review we will concentrate on those surveys designed and implemented by the
agency.
Surveys to determine opinions, desires, and success rates of hunters were the most
common example of agency designed and implemented human dimension investigations.
Harvest surveys to measure success of hunters and hunting seasons are discussed
elsewhere in this review. One example of TPWD human dimension investigations are
surveys used by the waterfowl program to help guide management decisions regarding
waterfowl hunting seasons. Other examples include the use of regulatory hearings to
receive input on proposed regulatory changes and the on-going Deer Advisory
Committee to reach out to interested publics.
Analysis: Basic assumptions of human dimension investigations are 1) the survey is
based upon a scientifically designed protocol; 2) the human population to be sampled is
properly identified and a random sample is obtained for query; 3) adequate sample sizes
to achieve stated confidence considering non-respondents are taken; and 4) properly
designed questionnaires with unambiguous questions are developed. We found the
surveys conducted by the waterfowl program to be good examples of appropriate use of
human dimension surveys. These surveys are based on random samples of hunters and
designed and analyzed with help from the statistical lab in Austin. As discussed
elsewhere, a declining response rate is hindering results of all surveys (especially mailed
surveys) and special efforts must be taken to achieve necessary sample sizes.
Information received on regulatory hearings is primarily obtained from those that attend
the forums. Typically, those attending do not represent the broader interests of the
public. The review team appreciates the long time-honored approach to regulatory
hearings (i.e., public input for the Commission prior to decision-making) but cautions the
agency on relying too heavily on this input with regard to obtaining sound and unbiased
input.
119

Finally, the review team learned about the Deer Advisory Committee that has been
established to provide recommendations to the agency and Commission on topics related
to deer management. Even though the membership of this Committee may be broad-
based, it does not reflect opinions of all interested publics and their recommendations
should be considered with this limitation.
Recommendations: Human dimension investigations are becoming important tools for
agencies to secure valid and scientific public input (Decker et al. 2001). We recommend
the agency strengthen its internal ability to design, conduct, and analyze human
dimension surveys. Statistical expertise in the Austin office should be used for all
surveys. Analytical procedures and hypotheses to test with the resulting data should be
identified prior to obtaining data. Outside expertise should be sought in designing survey
instruments.
We further recommend the agency increase use of human dimension inquiries to
supplement other information gathering forums like regulatory hearings and the Deer
Advisory Committee to ensure a broader-based input for important decision-making
processes.
120

OBJECTIVE 2: EMPLOYEE KNOWLEDGE AND USE OF
SCIENCE
Wildlife Division Questionnaire
Background: Objective 2 of the WMI Science Review was to ascertain opinions and
insights of selected TPWD staff members on use of, and gaps in, science available for
monitoring and managing wildlife resources to determine how well science is integrated
into management decision processes. This objective was investigated through a mail
questionnaire that contained 30 statements. Each statement described a different science-
based condition, attitude or process. If employees strongly agreed with the statement,
WMI inferred that there was strong agreement that sound science was being practiced. If
employees strongly disagreed with the statement, WMI inferred that sound science was
absent. The percentage of employees in disagreement with a survey statement was
deemed the most informative method to organize results. Agency leaders should be most
aware of statements with which employees most strongly disagree that sound science is a
foundation of agency actions.
The 163 mail questionnaires returned to WMI were tabulated and summary statistics
calculated. For the Wildlife Division, differences in response between duty station,
position type and position grade were tested through analysis of variance. Probability
thresholds were set at < 0.01.
Questionnaire responses were distributed on the Likert scale which ranged from 1 for
strongly agree to 4 for strongly disagree. Values greater than 2.5 indicated some level of
disagreement with the questionnaire statement. Values less than 2.5 indicated a general
level of agreement with the questionnaire statement. In the section that follows
questionnaire statements are aggregated by the percentage of employees in disagreement.
Statements receiving the highest percentage of disagreement are discussed first.
121

A. > 60% of Wildlife Division Employees With an Opinion Disagree with the
Following Statements:
1. Statement: Science training is a priority of the agency for continuing
education of employees (Mean Score = 2.76).
a. The response of employees differed by position type with Program
Specialists most strongly disagreeing with the level of science training.
Position Type Mean N Std Dev Manager 2.74 25 0.523 NRS 2.64 70 0.762 Program Spec. 3.00 35 0.676
Degrees of Freedom F Value from AOV P Value 2 3.11 0.0480
b. The response of employees also differed by position grade among
employees with grade 5 employees disagreeing most strongly with the
statement.
Position Grade Mean N Std Dev
2 2.76 19 0.54 3 2.74 31 0.63 4 2.51 43 0.80 5 3.08 36 0.65 6 2.50 2 0.71
Degrees of Freedom F Value from AOV P Value
4 3.50 0.0096
c. The response of employees suggests that they perceive agency leaders
place a low priority on science training. There was a relatively high
number of “strongly disagree” responses indicating that opinions are
strongly held.
d. Agency leaders should note that the degree of disagreement is strongest
in the senior levels of the Division.
2. Statement: There is a well-defined and effective process for integrating
science information into decision-making (Mean Score = 2.71).
122

a. There were no differences in response detected among employee’s duty
station, position or position grade.
b. The general level of disagreement with the statement implies that
employees assigned to both headquarters and field, and at all grades,
believe that science information could be better integrated into decision-
making.
B. 50-60% of Wildlife Division Employees With an Opinion Disagree with the
Following Statements:
1. Statement: Science recommendations are considered adequately by
decision-makers in the agency (Mean Score = 2.62).
a. The response of employees to this statement differed at the p<0.1 level by
position type. Managers had the highest level of disagreement with the
statement that science recommendations are considered adequately by
decision-makers.
Position Type Mean N Std Dev Manager 2.88 26 0.77 NRS 2.52 60 0.65 Program Spec. 2.56 31 0.76
Degrees of Freedom F Value from AOV P Value
2 2.47 0.0894
b. The general level of response to this question suggests that there is
widespread belief that science decisions are not considered adequately.
c. A relatively high number of responses (19%) were “no opinion”.
2. Statement: Data from survey efforts are frequently compromised at the
district or regional level for considerations beyond biology (Mean Score =
2.58).
a. No differences were detected in the response of employees to this
statement among duty stations, position or position grade.
123

b. The mean score indicates that the majority of employees believe that
survey data are not being compromised at the district or regional level.
c. This statement had the highest number of responses coded strongly
disagree.
d. This is the only statement in the questionnaire where a disagree response
indicates a better adherence to science than an agree response.
e. This statement also had a high (22.4%) response of “no opinion”.
C. 40-50% of Wildlife Division Employees With an Opinion Disagree with the Following Statements: 1. Statement: A competent biostatistician is consulted routinely before data
are analyzed (Mean Score = 2.52).
a. There were no differences detected in response to this statement between
duty station, position or position grade.
b. Responses suggest that many employees either do not themselves consult
with a competent biostatistician, or do not believe that others do, before
data are analyzed.
c. A high percentage of responses (31%) were “no opinion”.
2. Statement: Scientifically sound evaluations of land management
practices are conducted to determine the outcomes of management (Mean
Score = 2.53).
a. Responses to the statement differed by duty station among employees with
headquarters personnel in stronger disagreement than field personnel.
Degrees of Freedom F Value from AOV P Value
1 5.31 0.0228
DUTY STATION
Mean N Std Dev
Field 2.47 109 0.739 Headquarters 2.94 16 0.854
124
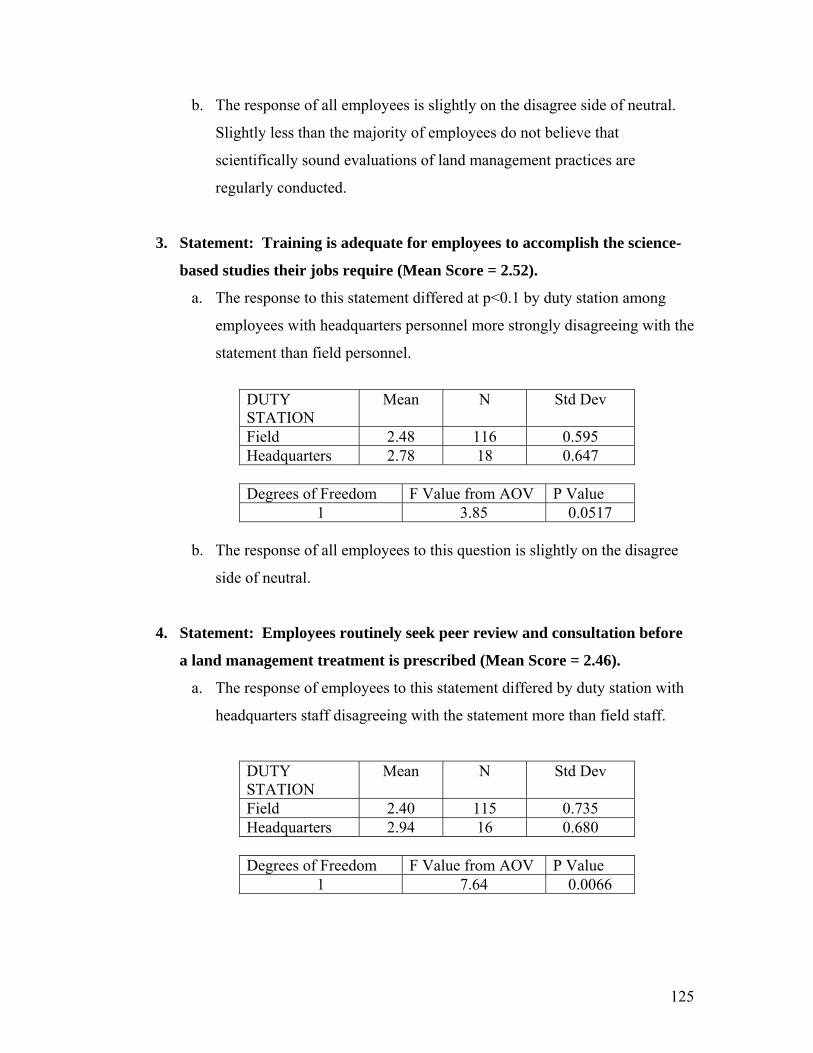
b. The response of all employees is slightly on the disagree side of neutral.
Slightly less than the majority of employees do not believe that
scientifically sound evaluations of land management practices are
regularly conducted.
3. Statement: Training is adequate for employees to accomplish the science-
based studies their jobs require (Mean Score = 2.52).
a. The response to this statement differed at p<0.1 by duty station among
employees with headquarters personnel more strongly disagreeing with the
statement than field personnel.
DUTY STATION
Mean N Std Dev
Field 2.48 116 0.595 Headquarters 2.78 18 0.647
Degrees of Freedom F Value from AOV P Value
1 3.85 0.0517
b. The response of all employees to this question is slightly on the disagree
side of neutral.
4. Statement: Employees routinely seek peer review and consultation before
a land management treatment is prescribed (Mean Score = 2.46).
a. The response of employees to this statement differed by duty station with
headquarters staff disagreeing with the statement more than field staff.
DUTY STATION
Mean N Std Dev
Field 2.40 115 0.735 Headquarters 2.94 16 0.680
Degrees of Freedom F Value from AOV P Value
1 7.64 0.0066
125

b. Most employees believe that peer review and consultation is sought before
a land management treatment is prescribed.
5. Statement: Data from survey efforts are easily accessible by all
appropriate personnel (Mean Score = 2.50).
a. There were no differences detected in response to this statement between
duty station, position or position grade.
b. The numerical mean score to this question is exactly midway between
disagree and agree.
c. That at least 40% of employees disagree that survey efforts are easily
accessible implies that different employees have either different levels of
access or different levels of understanding of how to access survey data.
The response may also suggest that different surveys have different levels
of accessibility.
6. Statement: Survey methods are designed, tested, and applied adequately
(Mean Score = 2.48).
a. There were no differences detected in response to this statement between
duty station, position or position grade.
b. The mean numerical score suggests that on the average, most employees
agree with the statement.
7. Statement: Access to library materials, internet resources, and abstract
services is facilitated (Mean Score = 2.47).
a. There were no differences detected in response to this statement between
duty station, position or position grade.
b. This statement generated the second highest level (14%) of responses
coded to strongly disagree.
c. Given that there are no differences in grade or position, the numerical
mean score is on the agree side of neutral, but a large percentage of
employees strongly disagree, implies that there is a differentiation among
employees that cannot be characterized by the coding employed to
126

segregate employees. Speculation would suggest that perhaps there is 1
district, program or region with substantially less access than its
counterparts.
8. Statement: Survey methods are applied in the same manner across
districts and regions (Mean Score = 2.38).
a. There were no differences detected in response to this statement between
duty station, position or position grade.
b. The numerical mean score suggests that most employees agree with the
statement and believe that survey methods are consistently applied across
districts or region.
c. Of note to agency leaders, however, is the relatively large percentage
(40%) of employees with an opinion who disagree with the statement.
D. 30-40% of Wildlife Division Employees With an Opinion Disagree with the
Following Statements:
1. Statement: Data from routine survey activities are pertinent and directly
applicable for decision-making (Mean Score = 2.40).
a. There were no differences detected in response to this statement between
duty station, position or position grade.
b. The majority of employees agree that survey activities are relevant to
decision-making.
2. Statement: Inherent biases in survey methods are well understood (Mean
Score = 2.38).
a. There were no differences detected in response to this statement between
duty station, position or position grade.
b. The majority of employees believe that biases are well understood, but the
split is approximately 60:40 between agree and disagree.
127
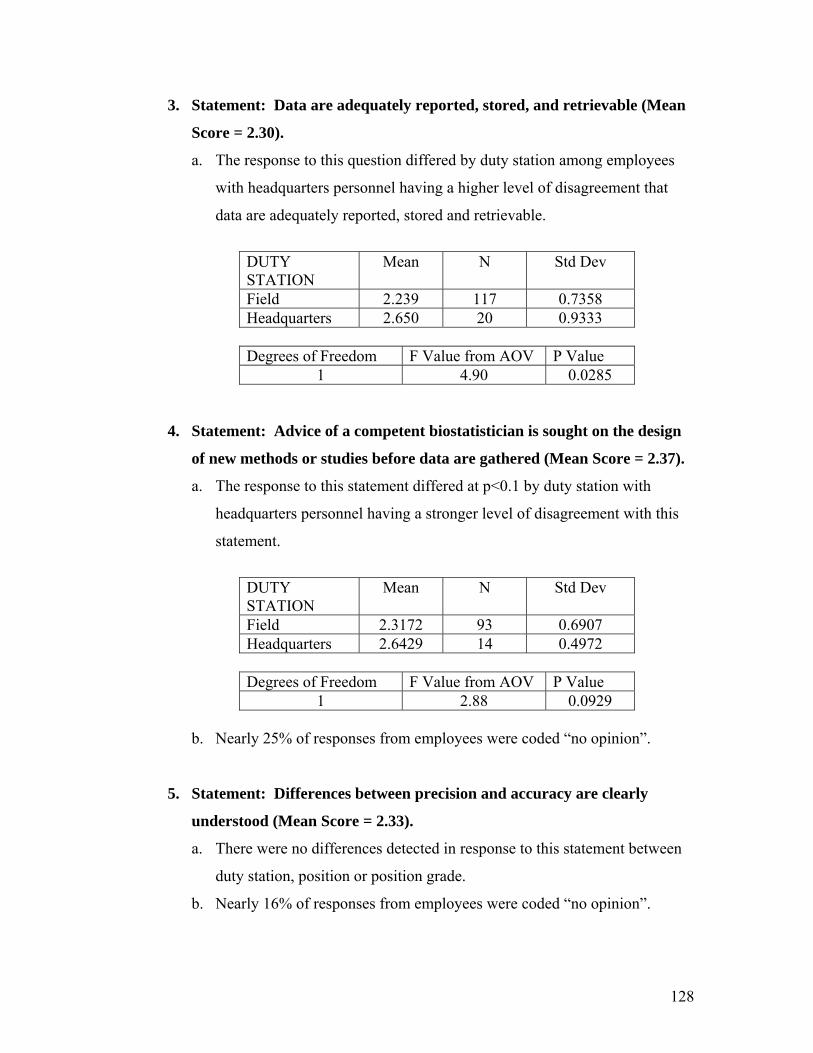
3. Statement: Data are adequately reported, stored, and retrievable (Mean
Score = 2.30).
a. The response to this question differed by duty station among employees
with headquarters personnel having a higher level of disagreement that
data are adequately reported, stored and retrievable.
DUTY STATION
Mean N Std Dev
Field 2.239 117 0.7358 Headquarters 2.650 20 0.9333
Degrees of Freedom F Value from AOV P Value
1 4.90 0.0285
4. Statement: Advice of a competent biostatistician is sought on the design
of new methods or studies before data are gathered (Mean Score = 2.37).
a. The response to this statement differed at p<0.1 by duty station with
headquarters personnel having a stronger level of disagreement with this
statement.
DUTY STATION
Mean N Std Dev
Field 2.3172 93 0.6907 Headquarters 2.6429 14 0.4972
Degrees of Freedom F Value from AOV P Value
1 2.88 0.0929 b. Nearly 25% of responses from employees were coded “no opinion”.
5. Statement: Differences between precision and accuracy are clearly
understood (Mean Score = 2.33).
a. There were no differences detected in response to this statement between
duty station, position or position grade.
b. Nearly 16% of responses from employees were coded “no opinion”.
128

6. Statement: Routinely collected data are used at the correct scale (Mean
Score = 2.39).
a. There were no differences detected in response to this statement between
duty station, position or position grade.
b. Nearly 20% of responses from employees were coded “no opinion”.
7. Statement: Strengths and weaknesses of data are communicated
effectively to decision-makers by those individuals responsible for
presenting science information (Mean Score = 2.40).
a. There were no differences detected in response to this statement between
duty station, position or position grade.
b. Nearly 16% of responses from employees were coded “no opinion”.
8. Statement: Survey methods are based on a sound sampling design (Mean
Score = 2.32).
a. There were no differences detected in response to this statement between
duty station, position or position grade.
b. The split between agree and disagree is approximately 65:35% for this
statement.
9. Statement: Adequate opportunities are provided to advance science
training through attendance at workshops and symposia (Mean Score =
2.32).
a. The response to this statement differed by duty station with headquarters
employees having a strong level of disagreement with the statement.
DUTY STATION
Mean N Std Dev
Field 2.23 117 0.75 Headquarters 2.75 24 0.91
Degrees of Freedom F Value from AOV P Value
1 9.50 0.0025
129
b. Several interpretations of the response are possible. First, headquarters
staff may believe that attendance at workshops and symposia are more
important to their job responsibilities than field staff, and they therefore
are more aware of attendance issues. Second, field staff may believe they
have adequate opportunities to attend workshops and symposia given their
job responsibilities, or conversely, they may not be aware of missed
opportunities.
10. Statement: Appropriate data analysis techniques are used routinely
(Mean Score = 2.30).
a. There were no differences detected in response to this statement between
duty station, position or position grade.
b. The split between agree and disagree is approximately 70:30% for this
statement for employees with an opinion.
E. 20-30% of Wildlife Division Employees With an Opinion Disagree with the
Following Statements:
1. Statement: The wildlife research project selection process selects
research studies applicable to agency needs (Mean Score = 2.18).
a. There were no differences detected in response to this statement between
duty station, position or position grade.
b. A relatively high percentage of employees coded their response as “no
opinion” (17.4%).
2. Statement: Written protocols are followed as data are gathered (Mean
Score = 2.15).
a. There were no differences detected in response to this statement between
duty station, position or position grade.
130
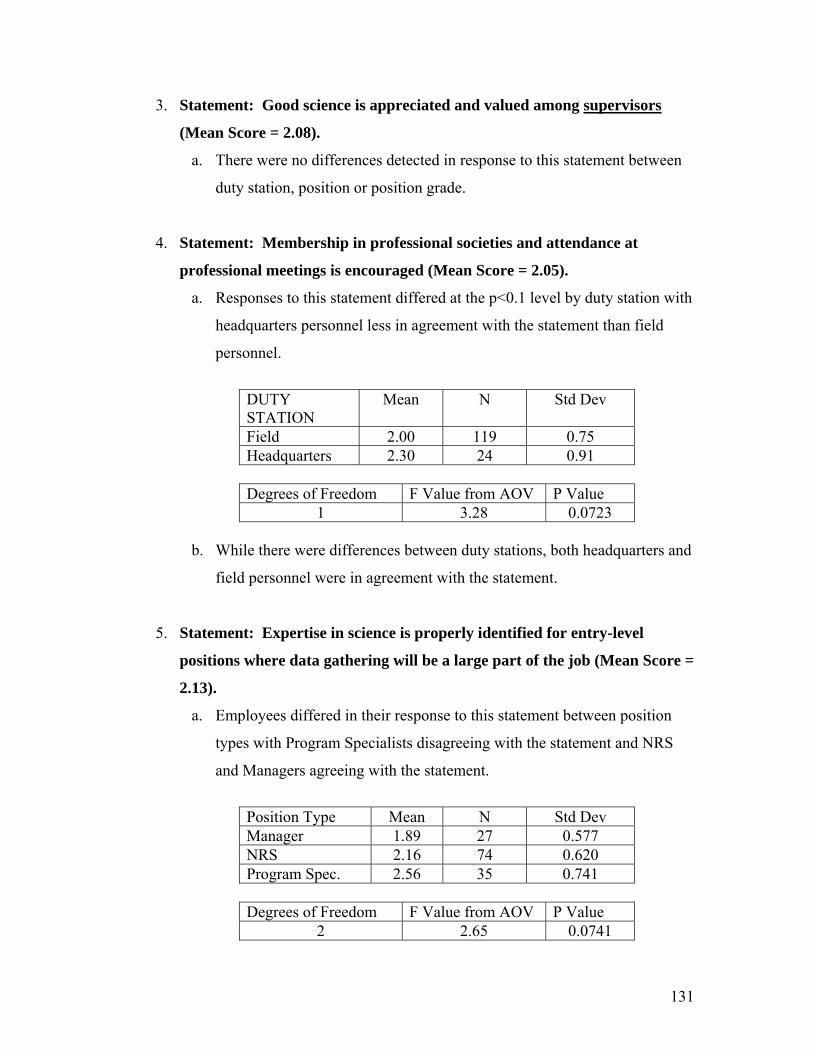
3. Statement: Good science is appreciated and valued among supervisors
(Mean Score = 2.08).
a. There were no differences detected in response to this statement between
duty station, position or position grade.
4. Statement: Membership in professional societies and attendance at
professional meetings is encouraged (Mean Score = 2.05).
a. Responses to this statement differed at the p<0.1 level by duty station with
headquarters personnel less in agreement with the statement than field
personnel.
DUTY STATION
Mean N Std Dev
Field 2.00 119 0.75 Headquarters 2.30 24 0.91
Degrees of Freedom F Value from AOV P Value
1 3.28 0.0723 b. While there were differences between duty stations, both headquarters and
field personnel were in agreement with the statement.
5. Statement: Expertise in science is properly identified for entry-level
positions where data gathering will be a large part of the job (Mean Score =
2.13).
a. Employees differed in their response to this statement between position
types with Program Specialists disagreeing with the statement and NRS
and Managers agreeing with the statement.
Position Type Mean N Std Dev Manager 1.89 27 0.577 NRS 2.16 74 0.620 Program Spec. 2.56 35 0.741
Degrees of Freedom F Value from AOV P Value
2 2.65 0.0741
131

F. 10-20% of Wildlife Division Employees With an Opinion Disagree with the
Following Statements:
1. Statement: Good science is appreciated and valued among employees
(Mean Score = 1.98).
a. Employee responses to this statement were different among position
grades with grade 5 employees being less in agreement than other grades.
Position Grade Mean N Std Dev
2 1.75 20 0.55 3 1.86 37 0.86 4 1.95 44 0.78 5 2.28 36 0.66 6 1.67 3 0.58
Degrees of Freedom F Value from AOV P Value
4 2.31 0.0607
b. Even with differences among grades, all grades were in general agreement
with the statement.
2. Statement: Standard data forms are used routinely (Mean Score = 1.91).
a. There were no differences detected in response to this statement between
duty station, position or position grade.
b. This statement generated the highest percentage of strongly agree
responses (25%).
3. Statement: Routinely prescribed land management practices are
scientifically founded (Mean Score = 1.90).
a. Responses to this statement differed by duty station with headquarters
personnel less likely to agree than field personnel with the statement.
132

DUTY STATION
Mean N Std Dev
Field 1.8087 115 0.5603 Headquarters 2.4000 20 0.7539
Degrees of Freedom F Value from AOV P Value
1 0.0001
b. Responses to this statement also differed by position type with Program
Specialists and Managers in less agreement with the statement than NRS
employees.
Position Type Mean N Std Dev Manager 1.96 28 0.637 NRS 1.77 71 0.512 Program Spec. 2.08 37 0.759
Degrees of Freedom F Value from AOV P Value
2 3.24 0.0422
c. This statement generated the highest mean agreement score of all
questions.
Parks Division Questionnaire
The State Parks Division employee questionnaire was sent to 24 employees, including
state park managers with a completed natural resource management plan, regional
resource coordinators and regional directors. Because of small sample sizes, no attempt
was made to break down responses by duty station, position or position grade. Eighteen
completed surveys were returned to WMI. Summary statistics were run and response
was ranked by the degree of disagreement with the science-based statements.
133

A. > 75% of State Parks Division Employees With an Opinion Disagree with the
Following Statements:
a. Statement: A competent biostatistician is consulted
routinely before data are analyzed. (Mean Score = 3.10).
b. Statement: Advice of a competent biostatistician is sought on the
design of new methods or studies before data are gathered. (Mean
Score = 3.0).
B .60-75% of State Parks Division Employees With an Opinion Disagree with the
Following Statements:
a. Statement: Data from flora and fauna inventory efforts are
easily accessible by all appropriate personnel. (Mean Score =
2.90).
b. Statement: Appropriate data analysis techniques are used
routinely (Mean Score = 2.70).
c. Data are adequately reported, stored, and retrievable (Mean
Score = 2.60).
d. Science training is a priority of the agency for continuing
education of employees (Mean Score = 2.60).
C. 50-60% of State Parks Division Employees With an Opinion Disagree with the
Following Statements:
a. Statement: Training is adequate for employees to accomplish
the science-based studies their jobs require (Mean Score =
2.70).
D. 40-50% of State Parks Division Employees With an Opinion Disagree with the
Following Statements:
a. Statement: Standard data forms are used routinely (Mean
Score = 2.50).
b. Statement: Adequate opportunities are provided to advance
science training through attendance at workshops and
symposia (Mean Score = 2.50).
134

c. Statement: There is a well-defined and effective process for
integrating science information into decision-making (Mean
Score = 2.40).
d. Statement: Written protocols are followed as data are
gathered (Mean Score = 2.50).
e. Statement: Membership in professional societies and
attendance at professional meetings is encouraged (Mean Score
= 2.50).
E. 30-40% of State Parks Division Employees With an Opinion Disagree with the
Following Statements:
a. Statement: Flora and fauna inventory methods are applied in
the same manner across Parks regions. (Mean Score = 2.50).
b. Statement: There is an adequate process within the Parks
Division to select research projects applicable to agency needs
(Mean Score = 2.50).
c. Statement: Science recommendations are considered
adequately by decision-makers in the agency (Mean Score =
2.40).
d. Statement: Strengths and weaknesses of data are
communicated effectively to decision-makers by those
individuals responsible for presenting science information
(Mean Score = 2.40).
e. Statement: Inherent biases in flora and fauna inventory
methods are well understood (Mean Score = 2.30).
f. Statement: Access to library materials, internet resources, and
abstract services is facilitated. (Mean Score = 2.20).
g. Statement: Scientifically sound evaluations of land
management practices are conducted to determine the
outcomes of management. (Mean Score = 2.20).
135

F. 20-30% of State Parks Division Employees With an Opinion Disagree with the
Following Statements:
a. Statement: Flora and fauna inventory methods are designed, tested,
and applied adequately (Mean Score = 2.30).
b. Statement: Expertise in science is properly identified for entry-level
positions where data gathering will be a large part of the job. (Mean
Score = 2.20).
c. Statement: Differences between precision and accuracy are clearly
understood. (Mean Score = 2.10).
G. 10-20% of State Parks Division Employees With an Opinion Disagree with the
Following Statements:
a. Statement: Routinely prescribed land management practices within
state parks natural resource management plans are scientifically
founded (Mean Score = 2.00).
b. Statement: Good science is appreciated and valued among employees.
(Mean Score = 2.00).
c. Statement: Flora and fauna inventory methods are based on a sound
sampling design (Mean Score = 2.00).
d. Statement: Good science is appreciated and valued among
supervisors (Mean Score = 2.00).
e. Statement: Employees routinely seek peer review and consultation
before implementing a land management treatment is prescribed
within the state park natural resource management plan (Mean Score
= 1.80).
State park employees indicated strongest disagreement with statements that referred to
the design and analysis of science-based activities, access to results of science-based
activities, and training of park employees in the use and interpretation of science.
Employees were largely in agreement with statements that referred to the appreciation of
science, the design of flora and faunal inventories, and the degree to which land
management decisions were influenced by peer review and consultation.
136

OBJECTIVE 3: EVALUATION OF EXISTING SCIENCE PROCESSES Existing Processes The third objective of the WMI review was to evaluate existing TPWD processes for on-
going evaluation of their science-based activities and propose modifications as needed to
improve this evaluation and allow for the most effective use of data in management
decision-making. The review team used information from all aspects of the review to
fulfill this objective, including interviews, questionnaires, and written documents.
Individual employee interviews were most helpful in familiarizing the team with existing
processes. For this review we considered TPWD processes to be “sets of actions,
changes, or operations occurring or performed in a special order toward some result.”
We then identified those existing elements or institutional operations that were aimed at
carrying out, improving, or evaluating science-based activities.
The review team found a limited number of science processes in place that met our
definition. TPWD is a large and complex organization spread across many ecological
zones. As a result, standard agency-wide operating procedures and processes are hard to
develop and maintain. Following are the existing processes we identified.
Strategic Planning: The TPWD Strategic Plan for fiscal years 2003-2007 and Land and
Water Resources Conservation and Recreation Plan reflect processes that established
strategies, and objectives, and goals for science-based activities. The Strategic Plan uses
number of endangered resource research studies completed, number of fish and wildlife
management research studies underway, and number of biological population and harvest
surveys conducted as some of the measures to evaluate efforts to conserve and manage
Texas’ fish, wildlife and plant resources. The Land and Water Plan establishes as a goal
improvement of science and data collection by undertaking a complete review of all
scientific and conservation programs and developing an integrated GIS database of fish,
wildlife and water data. This review is one of the measures taken to achieve that goal. In
137

general, the broad priorities set by these documents should be evident in the additional
processes described below.
Operational Planning: The most basic process in place appears to be the annual
operational planning discussions. It is during this process that limited agency fiscal and
human resources are allocated to priority tasks. With regard to science-based activities, it
is this process that determines those activities that are to be funded and accomplished in
the budget year. During the review, the team consistently heard about logistical
difficulties for employees to accomplish all that is identified in the annual Operations
Plan. We learned that typically employees have greater than 100% of their time allocated.
We further learned that often science-based activities are activities likely to not be
prioritized in these planning deliberations. As a result, many employees make sure their
“special” activities are identified as they consider them important to their jobs. A result
of this process is many employees feel overworked and pressed to get their annual work
completed. This results in many science-based activities being done as “add on” work.
When this happens a common result is poorer quality outcomes with less attention given
to such things as written protocols and standard operating procedures. The leadership of
the agency understands this conundrum and has attempted to address it. The review team
considers this process critical and very much related to ability of the agency to
accomplish and evaluate science.
Research Selection Process: Another on-going science related process is the annual
research selection process. This process is in place to identify and select the most
effective research studies that are needed to improve management decision-making. The
process identifies research to be done internally by the agency as well as research to be
contracted to outside groups like universities. Other key objectives for agency research
are to train staff members and inform the public. The process is well known by
employees and appears to be supported and recognized as a valuable process. During the
review we heard some consider the process to be too “inner agency” limited and could be
benefited by more outside review. Concerns also were expressed that Parks Division
projects did not compete successfully for limited research funds. A publication entitled
138

“Wildlife Research Highlights” is published biennially that provides an excellent
summary of ongoing and completed research work This publication is part of the
science process in the agency and does serve to communicate information about science
activities.
Program Staff: Organizationally, the most obvious process in place is role of the program
staff in Austin in carrying out science activities. During the review we learned that a key
responsibility of the program staff is to identify key management needs, develop
programs to address those needs, and in general demonstrate leadership to make sure
those programs are successful. Program leaders must be well versed in the science
behind their programs and dedicated to making sure the science developed and used is as
good as it can be. They must continually monitor inventory processes and provide
necessary guidelines and direction to field staff regarding science processes. They also
must demonstrate leadership in evaluating accuracy and precision of existing methods
and identifying means of gathering more reliable information in an efficient and effective
manner. Consequently, program leaders play a large role in science activities in the
agency.
Field Supervisory Leaders: TPWD is organized to facilitate development of science
standards by program staff. For that function to be productive, district leaders and
regional directors in the Wildlife Division are tasked with implementing science studies
through the actions of field staff. Actions by field supervisory leaders to maintain
consistent adherence to science-based protocols are critical to the science mission of the
Division.
Management, Research and Inventory on WMAs and State Parks: Key stated purposes
and objectives of WMAs and, to a lesser extent, state parks are to provide a place for 1)
demonstration and evaluation of management techniques and approaches in various
ecoregions and 2) establishment of long-term monitoring to make possible detection of
ecoregional changes, restoration, and guidance for natural resource planning and
management. However, we did not note an effective, integrated, and consistent approach
139
to using WMAs as the Wildlife Division’s science demonstration area. Most of the
WMAs managed by the Wildlife Division have no active baseline inventory and
monitoring program, and use of baseline inventories to determine effects of habitat
treatments on WMAs relies too much on ad hoc experimental design. Less than 50% of
state parks have sufficient monitoring information to make possible achievement of
management, research and inventory and protection/conservation goals on these lands.
Many parks and historic sites do not have sufficient lands or natural resources to warrant
baseline ecological monitoring. The Parks Division reports that it has initiated baseline
monitoring efforts for most state parks with significant natural resources.
Statistical Services: One organizational unit in place that could play an important role in
evaluating science in the Wildlife Division is the statistical services unit housed in the
Austin headquarters. Quality of data is basic to any science program. It is important that
all data gathering processes within the agency be based upon sound statistical principles
and designed to be most efficient in selecting the most effective methodologies.
Hunting Regulation Changes: The review team identified procedures that the agency uses
for making proposed hunting regulation changes as an important on-going science
process. Before a change in regulations can be made the agency requires documentation
of the existing regulation and justification for the proposed change. The proposed change
must be signed by the pertinent regulatory biologists, district leader, regional director,
program leader, public hunt director, director of wildlife, and chief operating officer.
Justification in regulatory proposals is highly dependent upon biological data. As a
consequence it is important that the information be reliable and in support of the
proposal.
Electronic Databases: An emerging and important process is the role and use of the TWIS
or RIS electronic databases. Efficient data storage and retrieval is a key component of
any modern science activity. The review team found that awareness and use of this
system is inconsistent among employees in the agency. We also heard numerous
questions asking how and where this process should be housed and supervised. Written
140
standard operating procedures describing how and what data should be entered into the
system are lacking and needed.
Ad Hoc Research and Science: During the review the team noted a number of “research”
studies that have been initiated and conducted by individual employees working to solve
a problem or gain information. Examples include cow bird trapping, black bear and
mountain lion databases, eastern turkey investigations, and browse measurement
analyses. These efforts all demonstrated significant creativity, dedication, and most have
lead to better management by the agency. As far as we could tell most of these ad hoc
investigations seem to develop without much guidance, interaction, or control by agency
leadership or other science processes.
Recommendations
Strategic Planning: WMI recommends that TPWD utilize changes in the processes
described below to inform future revisions of the Strategic Plan and Land and Water
Resources Conservation and Recreation Plan. Based on our review, for example, we
suggest that the number of biological population and harvest surveys conducted is not an
appropriate metric to measure the outcome of TPWD conservation and management
efforts. A reduction in the number of those surveys may be necessary to improve the
scientific basis of others.
Operational Planning: WMI recommends that the Wildlife Division better integrate
science into operational planning. Quality science cannot be done as “add on” to a full
plate of other duties. Those employees most responsible for gathering inventory data and
conducting other science investigations must be provided work time necessary to do the
work. In addition, we have identified elsewhere in this review opportunities to terminate
some surveys that are not providing reliable information. Division leadership should
adjust the annual operations plans so that priority science work is properly budgeted and
planned. The Division should consider establishment of specific goals and objectives for
science within the agency.
141

Science Standards Process: WMI recommends that TPWD institute a well-defined
process that coordinates and integrates science into agency actions. There are numerous
ways to define the process, and WMI holds no method higher than another. We
recommend that agency personnel may be the most knowledgeable at how to structure
the process. The following schematic represents 1 potential organizational approach that
may have merit.
Science Support Team: The function of the Science Support Team is to interpret which
agency goals and objectives require science-based activities and then how best to conduct
science-based activities. The research team recognized a prevalent lack of coordination,
integration, awareness, and rigor of agency science efforts. There is need in the agency
to highlight the role of science in all its programs and take steps to help all employees
recognize this importance.
Operational Plan
Science Support Team
Statistical Services Unit
Program Staff
Research Project Selection
Survey Regulation Changes
WMAs State Parks
TPWD Strategic Plan
Electronic Data Bases
Evaluation and Monitoring
142
Statistical Services: The review team found this is potentially the most important aspect
of the entire agency science program but at the same time found it to be unlinked to most
science activities in the agency. Professional statistical expertise is basic to any quality
science program. As our review points out, absence of sound sampling designs is a major
weakness for most inventories conducted by the agency. Statistical services must be
accessible to all employees and divisions. Existing staffing of this unit is insufficient to
properly address statistical needs in the agency. There is a trade-off in where statistical
expertise is housed in the agency. On one hand, it is good to have this service housed in
a central and coordinated office such as the Austin headquarters. On the other hand, the
team found that when statistical expertise was directly available to field employees,
quality of the investigations was improved. It is recommended the agency immediately
assess this need and take steps to increase effectiveness of the statistical services.
Availability of statistical expertise is basic to any effective science program.
Research Selection Process: To broaden the perspective on agency research it is
recommended that the research selection process include at least 2 qualified external
reviewers who have weight equal to internal reviewers in selection decisions. These
reviewers could come from universities in the state or from other state and federal
agencies. The research process should clearly be linked to and support research efforts
that are occurring on state wildlife and park areas.
Program Staff: It is recommended that leadership of the agency once again affirm that a
key role of the program leaders is to chart the course for all key program initiatives
within the agency, including and especially science-based initiatives. Program leaders
must take a larger role in monitoring, oversight and evaluation of all inventory methods.
They must be sure that written and consistent methodologies are provided to all
employees conducting science work. They must also take a leadership role in designing
and carrying out appropriate training sessions and in developing training videos and CDs.
They must play a major role in getting all inventory databases into electronic format (i.e.,
RIS), so they can be easily retrieved and used. Finally, they must demonstrate leadership
143
in evaluating accuracy and precision of existing methods and identifying modifications or
alternatives to those methods that will improve the reliability and efficiency of data
gathered. Our review identifies many inventory methods that have not been evaluated or
revised in decades.
Management, Research and Inventory on WMAs and State Parks: Science ought to be
included on department lands including state parks. WMAs and state parks could be a
key part of the science process in the agency but management, research and inventory on
these lands must be linked and coordinated to a broader science vision for the agency. It
is recommended agency leadership immediately address this issue and clearly articulate
the role that management, research and inventory on WMAs and state parks will play
with regard to the agency science programs. These efforts on the WMAs and state parks
must be integrated into all science programs in the agency.
Hunting Regulation Changes: The review team recommends the regulation change
process be recognized by the agency as a key science process and steps be taken to
develop a more formal approach to the science used in the justifications for regulation
change. Once a regulation is changed, it should be the responsibility for 1 or more people
to follow through with a sufficiently detailed evaluation so that results of the regulation
change can be documented. It is through this evaluation that science used for regulations
would improve.
Electronic Databases: The review team recommends the agency determine priority data
sets that should be entered into these electronic systems and then make sure that data
quality review systems are in place to “filter” the data before they are entered. Once they
are up and running, the agency should strongly promote and use the databases.
Ad Hoc Research and Science: The ad hoc examples mentioned previously point out an
overriding observation by the review team related to the overall problem of lack of
coordination, integration, and information exchange about science programs in the
agency. In most of these situations the work being done was significant and important
144

but seemingly not connected to other more “mainstream” science processes or programs.
It is recommended the agency develop a more coordinated and integrated research study
approach and make sure all science “investigations” are integrated into the agency
science process and leading directly to achievement of agency goals and objectives.
Communication: From our interviews and questionnaires it was also apparent that
Wildlife Division field and program staff members have different opinions on existing
agency science programs. Given the different perspectives of the 2 responsibilities this is
not surprising. It does suggest, however, that there is a need for better communication
and dialog between the 2 groups. If program staff does have lead responsibility for
conduct of science programs, then they have a larger responsibility in this dialog. The
review team recommends TPWD reaffirm the role of program staff in science efforts and
make sure this responsibility is clearly communicated to the entire agency. It is also
recommended that a Science Standards Committee made up by program leaders formally
conduct ongoing evaluation of agency science standards and processes and work to make
sure science training for employees is a priority.
145

CONCLUSIONS
TPWD clearly understands that agency actions must be grounded in science. The agency
has made it a priority to obtain an independent science review of the agency’s programs
and has allocated the funding and staff resources to make the review possible. TPWD
has a long tradition of employing numerous surveys, techniques and methods of
collecting data to improve the quality and reliability of agency decision-making. Some of
these data collection methods have been in place for decades.
Among TPWD employees, WMI found broad interest and participation in efforts to
improve the science foundation of agency operations. Employees generally demonstrated
a solid understanding of the scientific process and a commitment to practice sound
science. Staff members are engaged in a number of ongoing reviews that seek to improve
the reliability of survey methodologies, including those for deer, turkeys, and doves.
Employees commonly are seeking opportunities to learn more, to receive better training,
and/or to gain additional access to science materials. Employees clearly appreciate
agency programs to provide training, access and outside consultation on science, and they
requested agency leaders increase availability of these efforts wherever possible.
Many employees used the questionnaires and interviews to express concerns about
agency programs and priorities. Some common themes emerged. WMI found a level of
concern among employees about science results being disregarded in decision-making
and recommends that this topic be a special focus of agency leaders. While the solution
may involve improvements to both communications and the decision-making process, we
also sense that employees are looking for strong leadership to maintain what they believe
to be the agency’s historic science-based mission. Many employees also expressed
concern about the design of studies or the reliability of interpretations that they were
asked to make regarding data collected. The review team concluded that employees were
indirectly echoing one of WMI’s major findings – much time is spent on data collection,
but if the data are not worthy of interpretation, employees could better serve the resource
146

by rededicating those hours in the operational plans towards better stewardship activities.
Unique to the Parks Division, we noted concerns about the absence of natural resource
stewardship plans, and where plans were in place, the slow implementation of plan
recommendations. There is a need for all science applications in the agency to be better
coordinated and elevated in key decision-making processes.
As the agency’s mission has evolved to include additional issues, constituents,
responsibilities, expectations and initiatives, the tried-and-true methods for data
collection and science support for decision-making have had to compete with other
agency demands. At the same time, the bar establishing the threshold for good science
has been raised. Challenges to agency action are now more prevalent, a trend that will
likely continue, and those challenges will, more often than not, be on the science the
agency is using to justify decisions. Credibility of the agency largely depends upon
quality of its science programs.
It is time for the agency to stop doing more with less. In the review, WMI recommends
that TPWD determine whether there is a need for the type and scale of data currently
being collected, and whether that need is sufficiently important to require reliable
information. Collection of reliable information will require the agency to do a better job
of designing sampling strategies prior to data collection and making greater use of other
science-based methods to improve accuracy and precision of estimates. Many survey
methodologies the review team examined will need to be revised substantially to meet
established scientific standards and provide reliable information. Other methodologies
may be able to be replaced by less expensive modeling techniques or use of existing
correlative information on habitat or meteorological conditions. Still other surveys may
not be needed sufficiently to warrant the cost. These efforts will do much to improve
reliability and confidence in the agency science inventories. The ability to retrieve, use
and understand information gathered in these inventories depends heavily on a well-
supported home for RIS electronic data storage.
147

While we believe all of our recommendations are feasible, we conclude our review with 2
expectations: first, that the agency will be conducting far fewer survey activities and
second, that any science-based activity that the agency retains in the future will be more
expensive, better founded in the scientific method, and defendable in a court of law or the
arena of public opinion.
148

LITERATURE CITED Anderson, D.R. 2001. The need to get the basics right in wildlife field studies. Wildlife
Society Bulletin 29(4):1294-1297. Baskett, T.S. 1993. Biological evaluation of the call-count survey. Pages 253-268 in
T.S. Baskett, M.W. Sayre, R.E. Tomlinson, and R.E. Mirarchi, eds. Ecology and management of the mourning dove. Stackpole Books, Harrisburg, Pennsylvania.
Bear, G.D., G.C. White, L.H. Carpenter, R. B. Gill, and D. J. Essex. 1989. Evaluation of
aerial mark-resighting estimates of elk populations. Journal of Wildlife Management 53: 908-915.
Bone, T.L. 2003. Big game research and surveys. Mule deer harvest recommendations. Fed Aid in Wildl. Rest. Proj. W-127-R-11. Texas Parks and Wildlife Dept. Austin. 22 pp. Bowden, D.C., A. E. Anderson, and D.E. Medin. 1984. Sampling plans for mule deer sex and age ratios. Journal Wildlife Management 48:500-509. Burnham, K.P., D.R. Anderson, and J.L. Laake. 1980. Estimation of density from line
transect sampling of biological populations. Wildlife Monograph 72. The Wildlife Society. 202pp.
Bridges, A.S., M.J. Peterson, N.J. Silvy, F.E. Smeins, and X.B. Wu. 2001. Differential
influence of weather on regional quail abundance in Texas. Journal Wildlife Management 65:10-18.
Burk, J.D. 2003. Turkey harvest recommendations. Fed. Aid in Wildl. Rest. Proj. W-
126-R11. Upland Game Bird Research and Surveys. Texas Parks and Wildlife Dept. Austin. 10 pp.
Cook, R. L. and W. F. Harwell. 1979. Refinements of white-tailed deer census techniques. Fed. Aid in Wildl. Rest. Proj. W-109-R-2. Texas Parks and Wildlife Dept. Austin. 25 pp. Cooke, J.L. 1993. Assessing populations in complex systems. PhD. Dissertation. Texas A&M University. College Station. 142 pp. Cooke, J.L.. 1997. A spatial view of population dynamics, pages 288-309 in J. Bissonette ed., Wildlife and Landscape Ecology: Effects of Pattern and Scale. Springer-Verlag. New York, N.Y. Coordinated Bird Monitoring Working Group. 2004. Monitoring avian conservation:
rationale, design, and coordination. International Association of Fish and Wildlife Agencies, Washington, D.C. 28pp.
149

Decker, D.J., T. L. Brown, and W. F. Siemer. 2001. Human dimensions of wildlife management in North America. The Wildlife Society. 447 pp. DeMaso, S.J., J.D. Burk, R.M. Perez, and J.R. Purvis. 2001. A review of Texas upland
game bird survey techniques, 1995-1999. Fed. Aid in Wildl. Rest. Proj. W-126-R. Upland Game Bird Research and Surveys. Texas Parks and Wildlife Dept. Austin. 22 pp.
DeMaso, S.J., M.J. Peterson, J.R. Purvis, N.J. Silvy, and J.L. Cooke. 2002. A
comparison of two quail abundance indices and their relationship to quail harvest in Texas. Pages 206-212 in S. J. DeMaso, W.P. Kuvelsky, Jr., F. Hernandez, and M.E. Berger, eds. Quail V: Proceedings of the Fifth National Quail Symposium. Texas Parks and Wildlife, Austin, TX.
DeYoung, C. A. 1985. Accuracy of helicopter surveys of deer in south Texas. Wildlife Society. Bulletin 13 (2):146-149. Dolton, D. D. 1993. The call-count survey: Historic development and current
procedures. Pages 233-252 in T.S. Baskett, M.W. Sayre, R. E. Tomlinson and R. E. Mirarchi, ed. Ecology and Management of the Mourning Dove. Stackpole Books, Harrisburg, PA.
Dolton, D. D. and R. D. Rau. 2004. Mourning dove breeding population status, 2004.
U.S. Fish and Wildlife Service, Laurel, MD. 30pp. Fafarman, K. R. and C. A. DeYoung. 1986. Evaluation of spotlight counts of deer in south Texas. Wildlife Society Bulletin 14 (2):180-185. Fisher, A. S., and I. D. Humphreys. 1990. Surveys. Big Game Survey Workshop. New Mexico Department of Game and Fish. Santa Fe. Unpublished. Fisher, M., R. Hiatt, and W. Bergeson. 1947. The validity of the roadside census as
applied to pheasants. Journal of Wildlife Management 11:205-226. Gates, C.E., T.L. Clark, and K.E. Gamble. 1975. Optimizing mourning dove breeding
population surveys in Texas. Journal of Wildlife Management 39(2):237-242. Gore, H.G., W. F. Harwell, M.D. Hobson, and W. J. Williams. 1983. Buck permits as a management tool in south Texas. Pp 149-163 in S. L. Beasom and S. F. Roberson. Game Harvest Management. Caesar Kleberg Wildlife Foundation. Kingsville, Texas
150
Hamlin, K. L., D. F. Pac, C. A. Sime, R. M. DeSimone and G. L. Dusek. 2000. Evaluating the accuracy of ages obtained by two methods for Montana ungulates. Journal of Wildlife Management 64(2):441-449.
Harwell, W. F., R. L. Cook, and J. C. Barron. 1979. The spotlight count method for surveying white-tailed deer in Texas. Fed. Aid Rept. Ser. 21. Texas Parks and Wildlife Department. Austin. 25 pp. Kimball, J.W. 1949. The crow count pheasant census. Journal of Wildlife Management
13:101-120. Klonglan, E. D. 1955. Factors influencing the fall roadside pheasant census in Iowa.
Journal of Wildlife Management 19:254-262. Kozicky, E. L. 1952. Variation in two spring indices of male ring-necked pheasant
populations. Journal of Wildlife Management 16:429-437. Lancia, R.A., J.D. Nichols, and K.H. Pollock. 1994. Estimating the number of animals
in wildlife populations. Pages 215-253 in T.A. Bookhout, ed. Research and management techniques for wildlife and habitats. Fifth ed. The Wildlife Society, Bethesda, Md.
Lay, D. W. 1967. Deer range appraisal in eastern Texas. Journal of Wildlife Management 31(3):426-432. Litton, G. 1972. Spotlight deer census technique. Texas Parks and Wildlife Department. Annual Staff Meeting Rep. Austin. 8 pp. Lusk, J.L., F.S. Guthery, R.R. George, M.J. Peterson, and S.J. DeMaso. 2002. Relative
abundance of bobwhites in relation to weather and land use. Journal of Wildlife Management 66:1040-1051.
Luukkonen, D.R., H.H. Prince, and I.L. Mao. 1997. Evaluation of pheasant crowing
rates as a population index. Journal of Wildlife Management 61:1338-1344. Marion, W.R. 1974. Ecology of the plain chachalaca in the Lower Rio Grande Valley of
Texas. Dissertation, Texas A&M University, College Station. 172pp. McGinty, K.D and J. Young. 2003. Fur-bearing animal recommendations. Fed. Aid in
Wildl. Rest. Proj. W-134-2. Small Game and Furbearer Research and Surveys. Texas Parks and Wildlife Department. Austin. 26 pp.
Portnoy, John W. 1977. Nesting colonies of seabirds and wading birds—coastal
Louisiana, Mississippi, and Alabama. U.S. Fish & Wildlife Service, Biological Service Program. FWS/OBS-77/07. 126 pp.
151

Progulski, D. R. and D. C. Duerre. 1964. Factors influencing spotlighting counts of deer. Journal of Wildlife Management 28 (1):27-34. Ralph, J. C., G. R. Geupel, P. Pyle, T.E. Martin and D. F. DeSante. 1993. Handbook of
Field Methods for Monitoring Landbirds. USDA, Forest Service. PSW GTR-144. Albany, CA.
Rappole, J. H., and G. L. Waggerman. 1986. Calling males as an index of density for
breeding white-winged doves. Wildlife Society Bulletin 14:151-155. Roberson, J., G. Waggerman, D. Morrison, and J. Purvis. 2001. A review of Texas game
bird survey techniques, 1996-2000. Fed. Aid in Wildl. Rest. Proj. W-128-R. Migratory Bird Research and Surveys. Texas Parks and Wildlife Department. Austin. 77 pp.
Roberson, J., G. Waggerman, and J. Purvis. 2003. Migratory shore and upland game bird
density, distribution, and harvest. Fed. Aid in Wildl. Rest. Proj. W-128-R-11. Migratory Bird Research and Surveys. Texas Parks and Wildlife Department. Austin. 38 pp.
Rupp, S. P., W. B. Ballard and M. C. Wallace. 2000. A nationwide evaluation of deer
hunter harvest survey techniques. Wildlife Society Bulletin 28(3):570-578. Ruthven, C. 2003. Baseline inventory and monitoring. Wildlife Research. Fed. Aid
Grant No. W-132-R-3. Austin, TX. 19pp. Simmons, N.M., and C. G. Hansen. 1980. Population survey methods. Pp 260-272 in G. Monson and L. Summer eds. The Desert Bighorn: Its Life History, Ecology and Management. University of Arizona Press. Tucson. 370 pp. Simpson, B., D. Frels, T. Lawyer, T. Merendino, E. Meyers, C. Ruthven, S. Sorola, and
M. Wagner. 1996. Baseline inventory and monitoring procedures on Texas Parks and Wildlife Department lands. Miscellaneous Publication Austin, TX. 82pp.
Steidl, R. J., S. DeStefano and W. J. Matter. 2000. On increasing the quality, reliability,
and rigor of wildlife science. The Wildlife Society Bulletin 28(3):518-521. Steinkamp, M., B. Peterjohn, V. Byrd, H. Carter, and R. Lowe. 2003. Breeding season survey techniques for seabirds and colonial waterbirds throughout North America (draft). U.S. Geological Survey, Patuxent Wildlife Research Center. 81 pp. Stiles, B. F., and G. O. Hendrickson. 1946. Ten years of roadside pheasant censuses in
Iowa. Journal of Wildlife Management 10:277-280.
152
Taylor, D. 1980. An alligator population model and associated minimum population estimate from non-marsh habitat in Louisiana. Louisiana Department Wildlife and Fish. Monroe. Mimeo Report. 32 pp. Taylor, D., and W. Neal. 1984. Management implications of size-class frequency distribution in Louisiana alligator populations. Wildlife Society Bulletin 12:312- 319. Trost, R.E., K.E. Gamble, and D. J. Nieman. 1990. Goose surveys in North America: current procedures and suggested improvements. Transactions of North American Wildlife and Natural Resources Conference 55:338-349. USDI National Park Service. 2003. Fire Monitoring Handbook. Boise (ID): Fire Management Program Center, National Interagency Fire Center. 274p Walsh, D.P., G.C. White, T.E. Remington, and D.C. Bowden. 2004. Evaluation of the
lek-count index for greater sage-grouse. Wildlife Society Bulletin 32(1):56-58. Wilson, D. E., F. R. Cole, J. D. Nichols, R. Rudran, and M. S. Foster. 1996. Measuring
and Monitoring Biological Diversity: Standard Methods for Mammals. Smithsonian Institution Press. Washington and London. 409 pp.
Wolf, C.R. 2003. Big game research and surveys. Proj. 1. White-tailed deer population trends. Fed. Aid in Wildl. Rest. Proj. W-127-R-11. Texas Parks and Wildlife Department. Austin. 80 pp. Young, E. L., and B. Richards. 1994. White-tailed deer population trends. Fed. Aid in Wildl. Rest. Proj. W-127-R-2. Texas Parks and Wildlife Department. Austin. 60 pp.
Young, E.L., I.D. Humphries, and J. Cooke. 1995. Big game survey techniques in Texas. Fed. Aid in Wildl. Rest. Proj. W-109-R-2. Texas Parks and Wildlife Department. Austin. 24 pp.
153
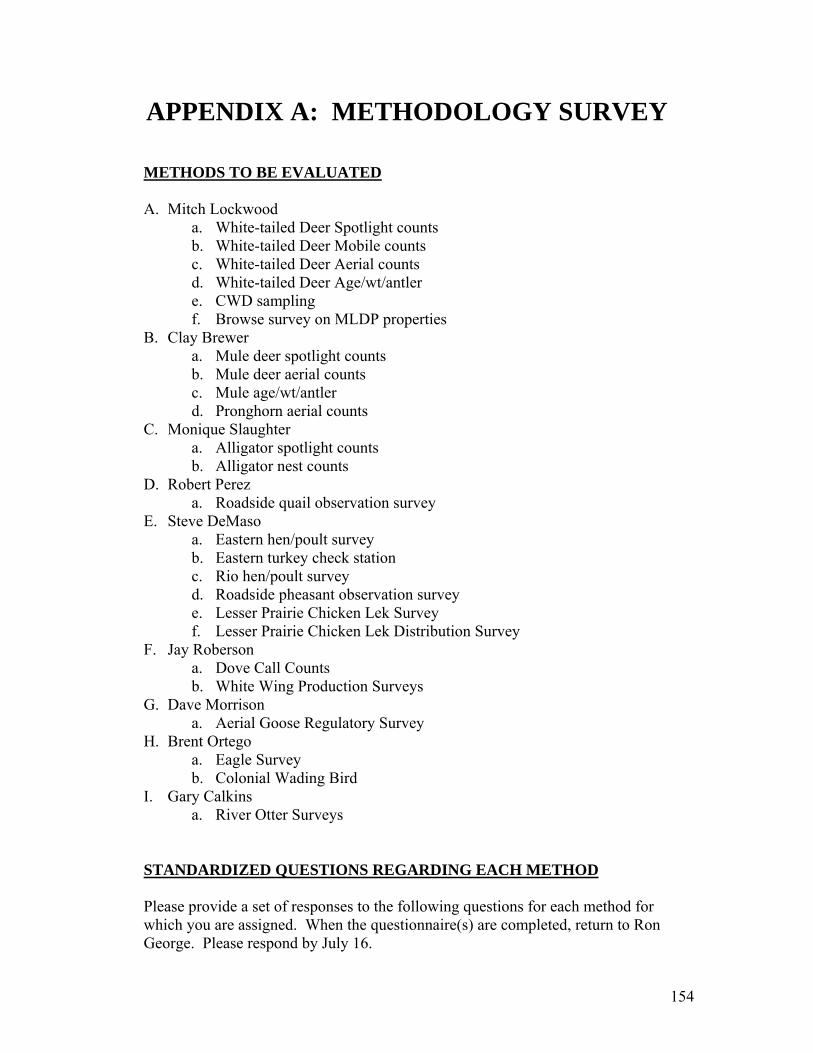
APPENDIX A: METHODOLOGY SURVEY
METHODS TO BE EVALUATED A. Mitch Lockwood
a. White-tailed Deer Spotlight counts b. White-tailed Deer Mobile counts c. White-tailed Deer Aerial counts d. White-tailed Deer Age/wt/antler e. CWD sampling f. Browse survey on MLDP properties
B. Clay Brewer a. Mule deer spotlight counts b. Mule deer aerial counts c. Mule age/wt/antler d. Pronghorn aerial counts
C. Monique Slaughter a. Alligator spotlight counts b. Alligator nest counts
D. Robert Perez a. Roadside quail observation survey
E. Steve DeMaso a. Eastern hen/poult survey b. Eastern turkey check station c. Rio hen/poult survey d. Roadside pheasant observation survey e. Lesser Prairie Chicken Lek Survey f. Lesser Prairie Chicken Lek Distribution Survey
F. Jay Roberson a. Dove Call Counts b. White Wing Production Surveys
G. Dave Morrison a. Aerial Goose Regulatory Survey
H. Brent Ortego a. Eagle Survey b. Colonial Wading Bird
I. Gary Calkins a. River Otter Surveys
STANDARDIZED QUESTIONS REGARDING EACH METHOD Please provide a set of responses to the following questions for each method for which you are assigned. When the questionnaire(s) are completed, return to Ron George. Please respond by July 16.
154

A. Establish the Basis of the Method –
• Provide full citations for the key literature references that support the use of this technique?
• Has the technique been modified since the original reference was published? If so, how.
B. Statistical Design: • Describe the sampling frame including information on original design and
sample size calculation. • Are samples randomly distributed? • What is the statistical power of the technique? • What percentage change is the technique designed to detect? • Note any obvious sources of bias? • What is the scale for this method (management unit, county, eco region,
state, multi-state, multi-national). C. Implementation of method
• Are there written protocols? • Are observers provided with the written protocols? • Is there training in the use of the method? • Are there efforts made to minimize sources of known bias?
D. Data Acquisition • Is there a standardized data sheet? • Are the data stored in electronic format? • Is there centralized data storage?
E. Data Analysis • Which of the following statistical parameters are used to describe the data
(Mean, Coefficient of Variation, Variation, Regression) • Are probability values calculated?
F. Interpretation and Use of Data • Why are these data collected and how are they used? • Is the data used at the appropriate scale?
G. Documentation and Reporting • Are these data reported outside of the PR report?
155
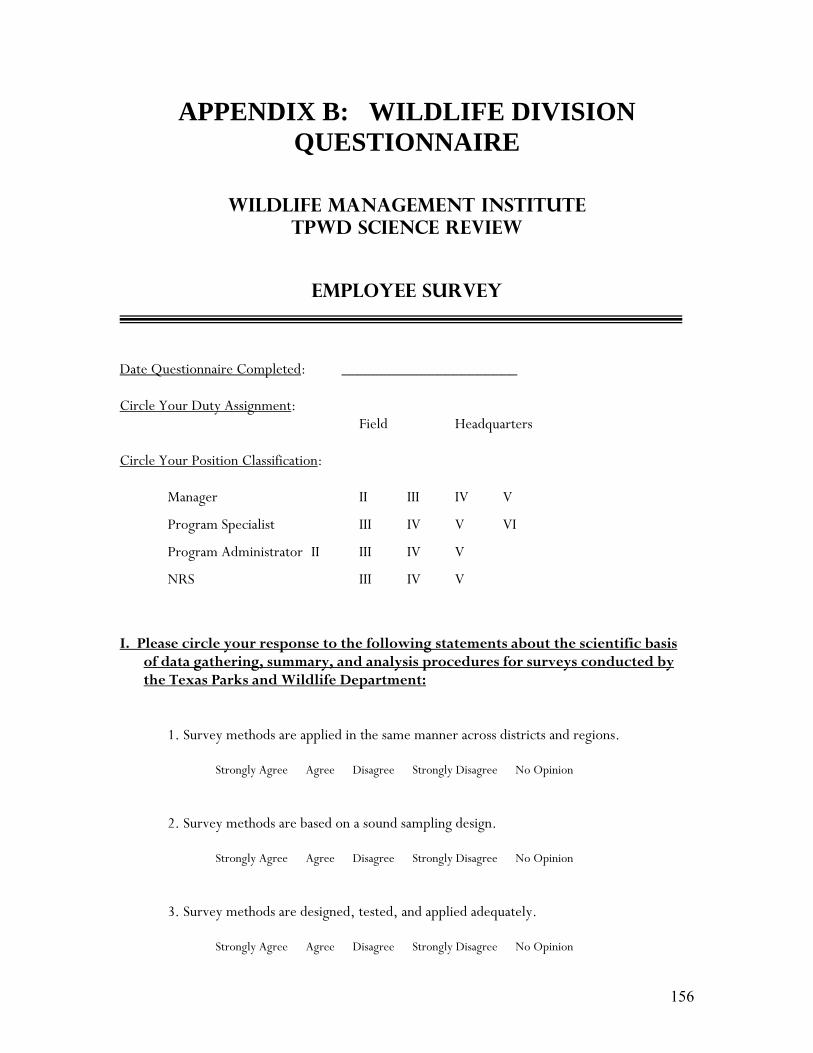
APPENDIX B: WILDLIFE DIVISION QUESTIONNAIRE
WILDLIFE MANAGEMENT INSTITUTE Tpwd SCIENCE REVIEW
EMPLOYEE SURVEY
Date Questionnaire Completed: ______________________ Circle Your Duty Assignment: Field Headquarters Circle Your Position Classification: Manager II III IV V
Program Specialist III IV V VI
Program Administrator II III IV V
NRS III IV V
I. Please circle your response to the following statements about the scientific basis
of data gathering, summary, and analysis procedures for surveys conducted by the Texas Parks and Wildlife Department:
1. Survey methods are applied in the same manner across districts and regions. Strongly Agree Agree Disagree Strongly Disagree No Opinion 2. Survey methods are based on a sound sampling design. Strongly Agree Agree Disagree Strongly Disagree No Opinion 3. Survey methods are designed, tested, and applied adequately. Strongly Agree Agree Disagree Strongly Disagree No Opinion
156

4. Inherent biases in survey methods are well understood. Strongly Agree Agree Disagree Strongly Disagree No Opinion 5. Appropriate data analysis techniques are used routinely. Strongly Agree Agree Disagree Strongly Disagree No Opinion 6. Data are adequately reported, stored, and retrievable. Strongly Agree Agree Disagree Strongly Disagree No Opinion 7. Advice of a competent biostatistician is sought on the design of new methods or studies
before data are gathered. Strongly Agree Agree Disagree Strongly Disagree No Opinion 8. A competent biostatistician is consulted routinely before data are analyzed. Strongly Agree Agree Disagree Strongly Disagree No Opinion 9. Differences between precision and accuracy are clearly understood. Strongly Agree Agree Disagree Strongly Disagree No Opinion 10. Standard data forms are used routinely. Strongly Agree Agree Disagree Strongly Disagree No Opinion 11. Written protocols are followed as data are gathered. Strongly Agree Agree Disagree Strongly Disagree No Opinion 12. The wildlife research project selection process selects research studies applicable to
agency needs. Strongly Agree Agree Disagree Strongly Disagree No Opinion
157
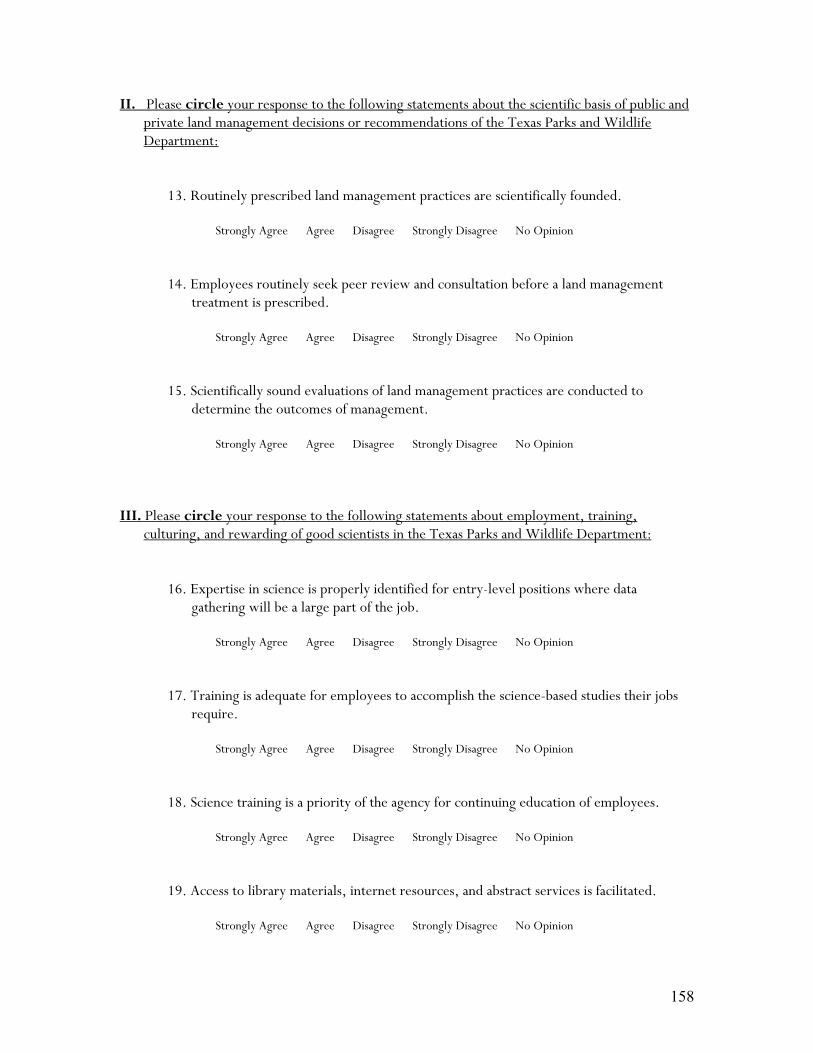
II. Please circle your response to the following statements about the scientific basis of public and private land management decisions or recommendations of the Texas Parks and Wildlife Department:
13. Routinely prescribed land management practices are scientifically founded. Strongly Agree Agree Disagree Strongly Disagree No Opinion 14. Employees routinely seek peer review and consultation before a land management
treatment is prescribed. Strongly Agree Agree Disagree Strongly Disagree No Opinion 15. Scientifically sound evaluations of land management practices are conducted to
determine the outcomes of management. Strongly Agree Agree Disagree Strongly Disagree No Opinion
III. Please circle your response to the following statements about employment, training, culturing, and rewarding of good scientists in the Texas Parks and Wildlife Department:
16. Expertise in science is properly identified for entry-level positions where data gathering will be a large part of the job.
Strongly Agree Agree Disagree Strongly Disagree No Opinion 17. Training is adequate for employees to accomplish the science-based studies their jobs
require. Strongly Agree Agree Disagree Strongly Disagree No Opinion 18. Science training is a priority of the agency for continuing education of employees. Strongly Agree Agree Disagree Strongly Disagree No Opinion 19. Access to library materials, internet resources, and abstract services is facilitated. Strongly Agree Agree Disagree Strongly Disagree No Opinion
158

20. Membership in professional societies and attendance at professional meetings is
encouraged. Strongly Agree Agree Disagree Strongly Disagree No Opinion 21. Adequate opportunities are provided to advance science training through attendance at
workshops and symposia. Strongly Agree Agree Disagree Strongly Disagree No Opinion 22. Good science is appreciated and valued among employees. Strongly Agree Agree Disagree Strongly Disagree No Opinion 23. Good science is appreciated and valued among supervisors. Strongly Agree Agree Disagree Strongly Disagree No Opinion
IV. Please circle your response to the following statements about the integration of science into the management decision process of the Texas Parks and Wildlife Department:
24. Routinely collected data are used at the correct scale. Strongly Agree Agree Disagree Strongly Disagree No Opinion 25. There is a well-defined and effective process for integrating science information into
decision making. Strongly Agree Agree Disagree Strongly Disagree No Opinion 26. Data from survey efforts are easily accessible by all appropriate personnel. Strongly Agree Agree Disagree Strongly Disagree No Opinion 27. Data from routine survey activities are pertinent and directly applicable for decision
making. Strongly Agree Agree Disagree Strongly Disagree No Opinion
159

28. Science recommendations are considered adequately by decision makers in the agency. Strongly Agree Agree Disagree Strongly Disagree No Opinion 29. Data from survey efforts are frequently compromised at the district or regional level
for considerations beyond biology. Strongly Agree Agree Disagree Strongly Disagree No Opinion 30. Strengths and weaknesses of data are communicated effectively to decision makers by
those individuals responsible for presenting science information. Strongly Agree Agree Disagree Strongly Disagree No Opinion
V. In this section please provide any additional comments you feel important in helping WMI evaluate Texas Parks and Wildlife science programs. If possible, please reference your comments by providing the number(s) of the question(s) most related to your comments. Attach another page if necessary. ________________________________________________________________________________________________________________________________________________________________________________________________________________________________________________________________________________________________________________________________________________________________________________________________________________________________________________________________________________________________________________________________________________________________________________________________________________________________________________________________________________________________________________________________________________________________________________________________________________________________________________________________________________________________________________________________________________________________________________________________________________________________________________________________________________________________________________________________________________________________________________________________________________________________________________________________________ Upon completion of the questionnaire place it into the addressed and stamped envelope provided and mail it by: AUGUST 13, 2004. Thanks for your participation in this review.
Wildlife Management Institute
160

APPENDIX C: PARKS DIVISION QUESTIONNAIRE
WILDLIFE MANAGEMENT INSTITUTE Tpwd SCIENCE REVIEW
EMPLOYEE SURVEY
Circle Your Position Classification: Natural Resource Specialist
State Park Manager
I. Please circle your response to the following statements about the scientific basis of data gathering, summary, and analysis procedures for flora and fauna inventories conducted by the Texas Parks and Wildlife Department:
1. Flora and fauna inventory methods are applied in the same manner across Parks regions. Strongly Agree Agree Disagree Strongly Disagree No Opinion 2. Flora and fauna inventory methods are based on a sound sampling design. Strongly Agree Agree Disagree Strongly Disagree No Opinion 3. Flora and fauna inventory methods are designed, tested, and applied adequately. Strongly Agree Agree Disagree Strongly Disagree No Opinion 4. Inherent biases in flora and fauna inventory methods are well understood. Strongly Agree Agree Disagree Strongly Disagree No Opinion 5. Appropriate data analysis techniques are used routinely. Strongly Agree Agree Disagree Strongly Disagree No Opinion
161

6. Data are adequately reported, stored, and retrievable. Strongly Agree Agree Disagree Strongly Disagree No Opinion 7. Advice of a competent biostatistician is sought on the design of new methods or studies
before data are gathered. Strongly Agree Agree Disagree Strongly Disagree No Opinion 8. A competent biostatistician is consulted routinely before data are analyzed. Strongly Agree Agree Disagree Strongly Disagree No Opinion 9. Differences between precision and accuracy are clearly understood. Strongly Agree Agree Disagree Strongly Disagree No Opinion 10. Standard data forms are used routinely. Strongly Agree Agree Disagree Strongly Disagree No Opinion 11. Written protocols are followed as data are gathered. Strongly Agree Agree Disagree Strongly Disagree No Opinion 12. There is an adequate process within the Parks Division to select research projects
applicable to agency needs. Strongly Agree Agree Disagree Strongly Disagree No Opinion
II. Please circle your response to the following statements about the scientific basis of land
management decisions for Texas State Parks:
13. Routinely prescribed land management practices within state parks natural resource management plans are scientifically founded.
Strongly Agree Agree Disagree Strongly Disagree No Opinion
162

14. Employees routinely seek peer review and consultation before implementing a land
management treatment is prescribed within the state park natural resource management plan.
Strongly Agree Agree Disagree Strongly Disagree No Opinion 15. Scientifically sound evaluations of land management practices are conducted to
determine the outcomes of management. Strongly Agree Agree Disagree Strongly Disagree No Opinion
III. Please circle your response to the following statements about employment, training, culturing, and rewarding of good scientists in the Texas Parks and Wildlife Department:
16. Expertise in science is properly identified for entry-level positions where data gathering will be a large part of the job.
Strongly Agree Agree Disagree Strongly Disagree No Opinion 17. Training is adequate for employees to accomplish the science-based studies their jobs
require. Strongly Agree Agree Disagree Strongly Disagree No Opinion 18. Science training is a priority of the agency for continuing education of employees. Strongly Agree Agree Disagree Strongly Disagree No Opinion 19. Access to library materials, internet resources, and abstract services is facilitated. Strongly Agree Agree Disagree Strongly Disagree No Opinion 20. Membership in professional societies and attendance at professional meetings is
encouraged. Strongly Agree Agree Disagree Strongly Disagree No Opinion
163

21. Adequate opportunities are provided to advance science training through attendance at workshops and symposia.
Strongly Agree Agree Disagree Strongly Disagree No Opinion 22. Good science is appreciated and valued among employees. Strongly Agree Agree Disagree Strongly Disagree No Opinion 23. Good science is appreciated and valued among supervisors. Strongly Agree Agree Disagree Strongly Disagree No Opinion
IV. Please circle your response to the following statements about the integration of science into the management decision process of the Texas Parks and Wildlife Department:
24. There is a well-defined and effective process for integrating science information into decision-making.
Strongly Agree Agree Disagree Strongly Disagree No Opinion 25. Data from flora and fauna inventory efforts are easily accessible by all appropriate
personnel. Strongly Agree Agree Disagree Strongly Disagree No Opinion 26. Science recommendations are considered adequately by decision makers in the agency. Strongly Agree Agree Disagree Strongly Disagree No Opinion 27. Strengths and weaknesses of data are communicated effectively to decision makers by
those individuals responsible for presenting science information. Strongly Agree Agree Disagree Strongly Disagree No Opinion
164

V. In this section please provide any additional comments you feel important in helping WMI evaluate Texas Parks and Wildlife science programs. If possible, please reference your comments by providing the number(s) of the question(s) most related to your comments. Attach another page if necessary. ________________________________________________________________________________________________________________________________________________________________________________________________________________________________________________________________________________________________________________________________________________________________________________________________________________________________________________________________________________________________________________________________________________________________________________________________________________________________________________________________________________________________________________________________________________________________________________________________________________________________________________________________________________________________________________________________________________________________________________________________________________________________________________________________________________________________________________________________________________________________________________________________________________________________________________________________________ Upon completion of the questionnaire place it into the addressed and stamped envelope provided and mail it by: November 5, 2004. Thanks for your participation in this review.
Wildlife Management Institute
165
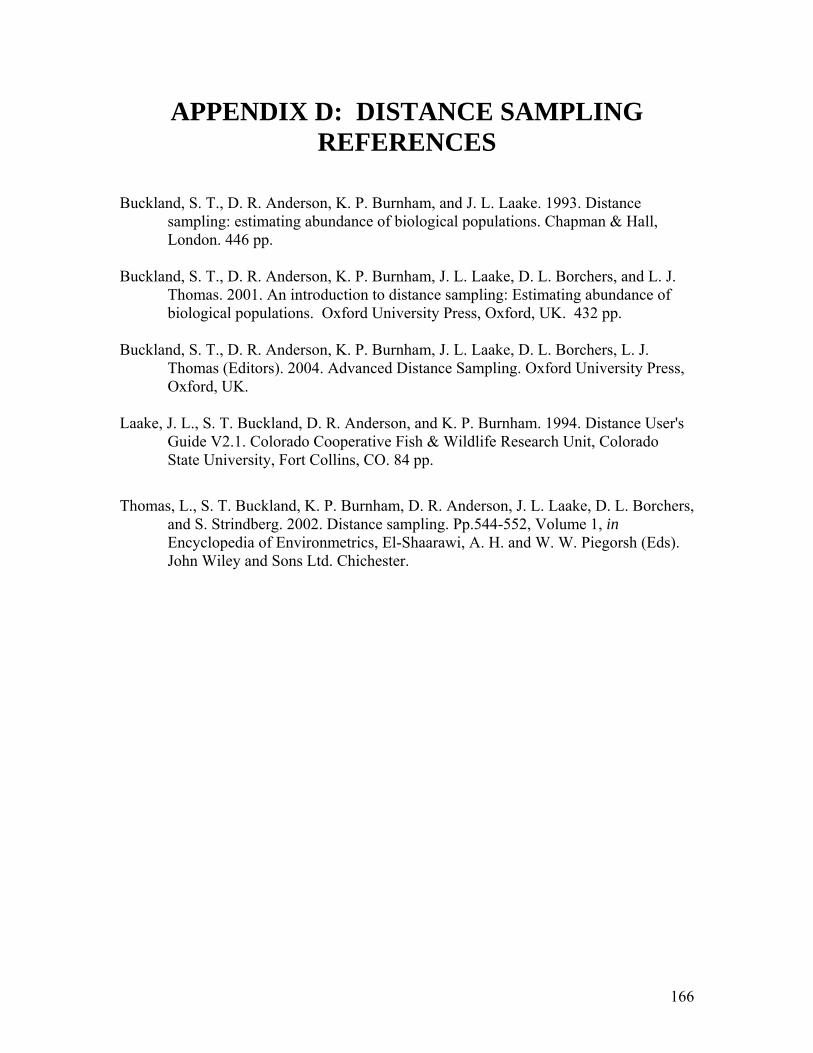
APPENDIX D: DISTANCE SAMPLING REFERENCES
Buckland, S. T., D. R. Anderson, K. P. Burnham, and J. L. Laake. 1993. Distance sampling: estimating abundance of biological populations. Chapman & Hall, London. 446 pp. Buckland, S. T., D. R. Anderson, K. P. Burnham, J. L. Laake, D. L. Borchers, and L. J. Thomas. 2001. An introduction to distance sampling: Estimating abundance of biological populations. Oxford University Press, Oxford, UK. 432 pp. Buckland, S. T., D. R. Anderson, K. P. Burnham, J. L. Laake, D. L. Borchers, L. J. Thomas (Editors). 2004. Advanced Distance Sampling. Oxford University Press, Oxford, UK. Laake, J. L., S. T. Buckland, D. R. Anderson, and K. P. Burnham. 1994. Distance User's Guide V2.1. Colorado Cooperative Fish & Wildlife Research Unit, Colorado State University, Fort Collins, CO. 84 pp.
Thomas, L., S. T. Buckland, K. P. Burnham, D. R. Anderson, J. L. Laake, D. L. Borchers, and S. Strindberg. 2002. Distance sampling. Pp.544-552, Volume 1, in Encyclopedia of Environmetrics, El-Shaarawi, A. H. and W. W. Piegorsh (Eds). John Wiley and Sons Ltd. Chichester.
166