Embed Size (px)
Citation preview

REVIEWpublished: 23 August 2018
doi: 10.3389/fncom.2018.00060
Frontiers in Computational Neuroscience | www.frontiersin.org 1 August 2018 | Volume 12 | Article 60
Edited by:
Anke Meyer-Baese,
Florida State University, United States
Reviewed by:
Stavros I. Dimitriadis,
Cardiff University, United Kingdom
Seppo P. Ahlfors,
Harvard Medical School,
United States
*Correspondence:
Pravat K. Mandal
Received: 17 March 2018
Accepted: 09 July 2018
Published: 23 August 2018
Citation:
Mandal PK, Banerjee A, Tripathi M and
Sharma A (2018) A Comprehensive
Review of Magnetoencephalography
(MEG) Studies for Brain Functionality
in Healthy Aging and Alzheimer’s
Disease (AD).
Front. Comput. Neurosci. 12:60.
doi: 10.3389/fncom.2018.00060
A Comprehensive Review ofMagnetoencephalography (MEG)Studies for Brain Functionality inHealthy Aging and Alzheimer’sDisease (AD)Pravat K. Mandal 1,2*, Anwesha Banerjee 1, Manjari Tripathi 3 and Ankita Sharma 1
1Neuroimaging and Neurospectroscopy Lab, National Brain Research Centre, Gurgaon, India, 2Department of
Neurodegeneration, Florey Institute of Neuroscience and Mental Health, Melbourne, VIC, Australia, 3Department of
Neurology, All Indian Institute of Medical Sciences, New Delhi, India
Neural oscillations were established with their association with neurophysiological
activities and the altered rhythmic patterns are believed to be linked directly to the
progression of cognitive decline. Magnetoencephalography (MEG) is a non-invasive
technique to record such neuronal activity due to excellent temporal and fair amount of
spatial resolution. Single channel, connectivity as well as brain network analysis using
MEG data in resting state and task-based experiments were analyzed from existing
literature. Single channel analysis studies reported a less complex, more regular and
predictable oscillations in Alzheimer’s disease (AD) primarily in the left parietal, temporal
and occipital regions. Investigations on both functional connectivity (FC) and effective
(EC) connectivity analysis demonstrated a loss of connectivity in AD compared to healthy
control (HC) subjects found in higher frequency bands. It has been reported from
multiplex network of MEG study in AD in the affected regions of hippocampus, posterior
default mode network (DMN) and occipital areas, however, conclusions cannot be drawn
due to limited availability of clinical literature. Potential utilization of high spatial resolution
in MEG likely to provide information related to in-depth brain functioning and underlying
factors responsible for changes in neuronal waves in AD. This review is a comprehensive
report to investigate diagnostic biomarkers for AD may be identified by from MEG data.
It is also important to note that MEG data can also be utilized for the same pursuit in
combination with other imaging modalities.
Keywords: magnetoencephalography, mild cognitive impairment, Alzheimer’s disease, functional connectivity,
effective connectivity, network analysis, machine learning, multimodal imaging
INTRODUCTION
Magnetoencephalography is a non-invasive technique that measures oscillatory magnetic fieldsproduced in the brain due to neuronal activity with excellent temporal and reasonable amount ofspatial resolution (Cohen, 1968). At the cellular level, neurons have electrochemical properties thatlead to the flow of electrically charged ions and subsequently generation of electromagnetic fields.The magnetic field generated by an individual neuron is very weak, but multiple neurons combined

Mandal et al. MEG and Brain Connectivity
in a specific area produce a field that is measurable outsidethe head. This neuromagnetic field is in the range of 10–15 T(femtotesla, fT) for cortical activities. Magnetic field followsAmpere’s “right-hand rule,” with the field directed outwardon one side and inward on the other side of a tangentiallyoriented source current, forming a characteristic dipolar patternin magnetic field sensors near the scalp. Radially oriented(with respect to the skull surface) source currents generatenegligible magnetic field outside the head. Therefore, MEGis mainly sensitive to tangentially oriented sources in sulcalwalls. Neuromagnetic fields are captured using highly sensitivesuperconducting sensors, called SQUIDs (SuperconductingQuantum Interference Device). Activity from deeper corticaland subcortical areas is difficult to detect as they exist atlonger distance from the sensors. SQUID systems are typicallycomposed of two types sensors, called as magnetometer andgradiometer. Magnetometers measure magnetic field directly,and gradiometers as pairs of magnetometers positioned at asmall distance form one another, calculate the difference inthe magnetic field between their two locations, are used inMEG data acquisition (Cohen, 1972; Hämäläinen et al., 1993).Thesemagnetic fields are produced simultaneously with electricalactivity, MEG captures same millisecond resolution as EEG(Electroencephalography), allowing to examine neural activityat its natural temporal resolution. Thus, MEG provides a moredirect measure of neuronal activity than functional magneticresonance imaging (fMRI), which records blood-oxygen-leveldependent (BOLD) responses.
Various MEG systems are available commercially suchas (a) Elekta/Neuromag: 306 channel, (b) MAGNES: 148channel, (c) CTF/VSM System: 275 channel (MISL), (d) TristanTechnologies, BabySQUID (for pre- and full-term infants), (e)MEGSCAN: 320 channel, (f) Mecurer, portable MEG system, (g)Yokogawa MEG: 160 channel (originally designed by KanazawaInstitute of Technology). Among all these systems, ElecktaNeuromag (Cichy et al., 2016b; Engels et al., 2016a; López et al.,2017a; López-Sanz et al., 2017), MAGNES Fernández et al., 2002,2013; Maestú et al., 2003; Bajo et al., 2012; Poza et al., 2014;Gómez et al., 2017; Juan-Cruz et al., 2017, and CTF systems(de Haan et al., 2012c; Ranasinghe et al., 2014; Brookes et al.,2016a; Tewarie et al., 2016; Josef Golubic et al., 2017; Koelewijnet al., 2017) are mostly used. However, for clinical setting ElektaNeuromag and CTF/VSM systems are the popular ones.
Oscillatory brain signals are commonly categorized into fivefrequency bands: Delta (0.2–3Hz), Theta (4–7Hz), Alpha (8–13Hz), Beta (14–31Hz), and Gamma (32–100Hz). Each bandis associated with different physiological information involvingbrain activities. Delta (δ) waves are accompanied with deeplevels of relaxation and restorative sleep. It has been foundthat δ waves are associated with unconscious tasks of the body.Irregular δ waves have been connected to awareness as well aslearning difficulties (Gloor et al., 1977). Theta (θ) waves aremostly linked with sleep and it may occur during deepmeditationalso and it is the associated to memory, intuition, and learning(Klimesch, 1999). Alpha (α) waves are associated with restingstate oscillations and awaken brain and it aids overall mentalcoordination, calmness, alertness, intelligence and cognitive
abilities (Klimesch et al., 1998). Beta (β) waves are dominantduring attentive cognitive task in normal conscious state. “Fast”activities of β waves are observed in concentration, decisionmaking, anxiety and excitement (Teplan, 2002). Gamma (γ)waves are interrelated to simultaneous processing of informationflow from various brain regions. γ frequency is above theneuronal firing range. Presence of γ is associated to cognizance(Tallon-Baudry and Bertrand, 1999). Among these existingband waves certain bands are associated with cognitive decline.MEG plays an important role for detecting early changes inthese rhythms and provides prodromal features of AD. Earlysymptoms of AD includes progressive loss of cognitive functions.One of the major histopathological hallmarks of this disease isthe formation of amyloid-beta plaques. Neurological changes inneurogenesis are evident already before plaque deposition andmight contribute to well-known early dysfunctions in prodromalAD (Borroni et al., 2002; Ito et al., 2015; Unger et al., 2016).
Millions of people are affected worldwide by AD and thisnumber is increasing every day (Wortmann, 2012). AD affectsnot only the individual but also it has serious impact theentire family of the patient as well as on society and economy.The actual cause of AD is not known yet, however, bothclinical and laboratory research have revealed oxidative stressis related to AD. It is believed from available clinical data thathippocampal as well as frontal cortex regions, the glutathionelevel depletion is linked to the conversion from a healthyaged subject to MCI (Mandal et al., 2015). There are otherassociated features with hippocampal and frontal cortex texture,which also change in AD (Drachman, 2006). At present, MCIor AD are detected symptomatically by the clinicians andvarious neuropsychological tests like Clinical Dementia Rating(CDR) (Morris, 1993), Mini–Mental State Examination (MMSE)(Folstein et al., 1975). Seven minute screen (7MS) that consistedof four individual tests (orientation, memory, clock drawing,verbal fluency) (Solomon and Pendlebury, 1998), functionalassessment staging (FAST) (Auer and Reisberg, 1997) andMontreal Cognitive Assessment (MoCA) test (Nasreddine et al.,2005) are used for screening of AD.
This review focuses on the MEG analysis techniques andmodulation of neuronal rhythms in AD brain. Motivation ofthe review is to provide an outline for the application of MEGfor connectivity analysis and its application combining otherneuroimaging modalities that can help for the identification ofearly diagnostic biomarker for AD.
The manuscript is divided into seven sections. Afterintroduction, in section The Schematic for MEG SignalAcquisition and Analysis, the comprehensive flow diagramof MEG data acquisition and analysis is presented. SectionResting State and Event-Related Response Studies describesabout resting state and evoked studies followed by descriptionof source reconstruction (section Source Reconstruction). Thecutting-edge research of MEG analysis for AD involving singlechannel, connectivity and network analysis is scrutinized fromexisting literature in section MEG Data Analysis. SectionMachine Learning Approach for MEG Based Analysis gives abrief idea about the application of machine learning algorithmson MEG data in AD population. Various methods of statistical
Frontiers in Computational Neuroscience | www.frontiersin.org 2 August 2018 | Volume 12 | Article 60

Mandal et al. MEG and Brain Connectivity
analysis performed with MEG data is discussed in sectionStatistical Analysis of MEG Data. Section Discussion outlinesthe overall implementation and experimental outcomes ofMEG studies. Section Conclusions summarized all the generallyapplicable procedures and points onto the scope for futureresearch.
THE SCHEMATIC FOR MEG SIGNALACQUISITION AND ANALYSIS
The complex analysis procedure for MEG signals consistsof various stages including co-registration with MRI images,forward and inverse problem as well as applicable steps for dataanalysis (Figure 1). Subjects participating in MEG study; alsoundergo MRI for 3D anatomical images.
The information related to MEG coordinate system(Figure 1A1) is registered by following two steps: (i) fiducialmarking, where three anatomical landmarks, the nasion, theleft preauricular point (LPA) and the right preauricular point(RPA), are indicated on the patient’s head, and (ii) surfacemodeling, where head digitization is performed with a 3Dtracker prior to the MEG examination (Hämäläinen et al., 1993).The fiducial points need to be determined accurately to minimizeco-registration errors leading to point to point variation withinthe brain. Incorporation of new techniques can improve theprecision and robustness of the co-registration process (Towleet al., 1993).
MEG co-ordinate system is computed before MEG signalacquisition with above explained digitization process. On theother hand, MRI co-ordinate system (Figure 1D) is generatedafter the MRI image acquisition. Raw MEG data (Figure 1A2)is acquired from the subjects in a magnetically shielded roomeither in resting condition (no task) or during certain tasks as perthe study requirement. Processing scheme of MEG data are thesame for resting state as well as with evoked potential conditions,however, only the execution scheme will vary. In resting statecategory, the subject needs to be fully awake as drowsinessmay introduce noise. For event-related studies, the subject isasked to perform certain tasks in reaction to a given stimulus(e.g., visual, auditory, or somatosensory). Simultaneously withthe recording of MEG signals, brain’s electrical activity, heart’selectrical activity and eye movements of the subject are capturedby means of electroencephalogram (EEG), electrocardiogram(ECG), and electrooculogram (EOG), respectively.
The acquired MEG signal is visually observed and thenprocessed for head movement correction and compensationis accomplished with built-in software for example Max filterin ELEKTA/Neuromag system, and commercially availableother software like Brain Electrical source analysis (BESA),ASA, Curry, EMSE. The environmental interference andconstant or periodic artifact correlation is performed byapplying Single Space Separation (“SSS”) or temporal SingleSource Separation (“t-SSS”). Single Space Separation is anew method for compensation of external interference andsensor artifacts by decomposing the MEG signal into innersource signal and outer noise. Independent ComponentAnalysis (ICA) or template can also be used for rest of the
biological artifacts like eye blinks. Pre-processing (Figure 1B)includes the following steps: Identifying nonfunctional(defective) channels followed by correction in headmovement followed by Software interference suppression[Signal- space projection (SSP), Signal-space separation (SSS),T-Signal space separation (t-SSS)] and later artifact identificationand rejection of environmental interferences and subjectinterference (cardiac activity, muscular activity; Velmuruganet al., 2014).
Moreover, at this stage of preprocessing of MEG data, filteringmay also be applied to segment the MEG data into differentband waves (δ, θ, α, β, and γ). Subsequently, the exclusive sensorspace time series MEG data (Figure 1C) distributed over allthe brain regions, which is processed further for single channelanalysis (Figure 1I) and for connectivity estimation (Figure 1J)is generated.
Co-registration of MEG data with anatomical 3D MRIimage (Figure 1E) enables source localization of the MEG data(Figure 1G). This source reconstructed MEG data, which iscalled source space data (Figure 1H), is used for connectivityestimation among the different selected regions of interests(ROI) as well as single channel analysis. Source reconstructionis performed for all the MEG sensors/broadband activity.Afterwards, source space time series is separated into differentfrequency bands.
Parcellation is implemented to divide the brain in differentROIs (Figure 1F). ROI selection is performed by parcellatingthe cortex using either source-sensor geometry approach or withnative MRIs or utilizing various available atlases (Dickie et al.,2017). In MEG based studies automatic anatomical labeling(AAL) (Brookes et al., 2016; Engels et al., 2016a,b, 2017b;Hillebrand et al., 2016; Tewarie et al., 2016; Koelewijn et al.,2017; López et al., 2017a; Yu et al., 2017), Harvard Oxford(López et al., 2014a; López-Sanz et al., 2017) and Destrieux andDesikan-Killiany atlases have been implemented. Tools such asMarsBar in SPM, Featquery function in FSL, MRIcroN software,and ROInets are developed for ROI based analysis. The analysisfor voxel time series within each ROI is achieved in variousways. In some studies, the voxel with maximum power withinROI represents the time series for corresponding ROI (Lópezet al., 2017a). Researches also generate time series by calculatingthe weighted distance from center of mass of the respectiveregion (Brookes et al., 2016). For specific representation of voxel,the centroid voxel was reported in some studies (Engels et al.,2017b; Yu et al., 2017). Maximum pseudoZ voxel is also usedas alternative method to represent time series for specific ROI(Engels et al., 2016a).
Single channel data analysis (Figure 1I) includes variousmethods (e.g., spectral analysis, signal complexity etc.). For singlechannel analysis, sensor space data denotes data per sensor but insource space, it represents the analysis of data from a particularbrain region. Keeping out anatomical links, brain connectivitycan be divided into two classes: functional connectivity (FC)and effective connectivity (EC). For connectivity evaluation,MEG data is analyzed using time domain (nonlinear forecasting,cross mutual information etc.) as well as frequency domainparameters (coherence, phase locking value etc.) (Figure 1J).This analysis provides a correlation or adjacency matrix and the
Frontiers in Computational Neuroscience | www.frontiersin.org 3 August 2018 | Volume 12 | Article 60

Mandal et al. MEG and Brain Connectivity
FIGURE 1 | Diagrammatic representation of the work flow for MEG data analysis: MEG data acquired from subjects (A2) is preprocessed (B) to a filter noise from
sensor space data (C). Information of MEG co-ordinate (A1) is required with the MRI image (D) of the same subject for co-registration (E). Source reconstruction of
MEG data is performed thereafter (G). Then the source space data (H), time series generated for each ROI, is further processed for single channel (I), and connectivity
analysis (J). To select ROIs parcellation is conducted using atlases (F). After evaluating the network (K) using the connectivity information, graph theoretical network
analysis is performed (L). Statistical analysis is accomplished along with the information of neuropsychological assessment (M).
Frontiers in Computational Neuroscience | www.frontiersin.org 4 August 2018 | Volume 12 | Article 60
Mandal et al. MEG and Brain Connectivity
off-diagonal elements of that matrix represent different weightsof connectivity between the corresponding ROIs. For sourcespace MEG data, FC is the measure of co-modulation of separatesources (selected by ROIs) but for sensor space connectivityinterpretation is difficult as it is not linked with a specificbrain location. The data related to connectivity is utilized tobuild a linked brain network (Figure 1K). The different brainregions associated functionally or causally are visualized asconnectivity patterns (Figure 1Ko). Various graph theoreticalalgorithms (Figure 1L) like clustering coefficient, path lengthetc. are applied for a global analysis of the brain network(Figure 1Lo).
Moreover, statistical analysis is performed for each methodof analysis (single channel, FC, or network) along with theresults from neuropsychological battery to evaluate the accuracy,sensitivity and specificity of the final outcome of the study(Figure 1M). The steps and related terminologies are explainedlater in this manuscript.
Various open source software and toolboxes are availablefor MEG data analysis. Brainstorm (Tadel et al., 2011), EEGlab(Delorme and Makeig, 2004), FieldTrip (Oostenveld et al., 2011),MNE (Gramfort et al., 2014), NutMEG (Dalal et al., 2004),OpenMEEG (Gramfort et al., 2010), SPM (Friston et al., 1994),EMEGS (electromagnetic encephalography software) (Peyk et al.,2011) etc. are commonly used. Commercial software packages arealso available DANA and CURRY (NeuroScan, 2017). Thoughthese tools keep updating on a regular basis but there remainsome complications associated with MEG data processing andanalysis.
RESTING STATE AND EVENT-RELATEDRESPONSE STUDIES
Resting state is defined as the stage when a subject is awake butnot performing any task. MEG has been implemented for restingstate network as well as evoked study in AD. Extra care must betaken to make sure that the AD patients are awake and alert asdrowsiness affects activities of the resting state brain (Verdoornet al., 2011).
It has been observed that the parts of brain responsible inthe activation differs from resting state to task based conditions(Raichle et al., 2001). Brain regions that correlate in resting stateare found to be involved in co-activation during tasks howevertheir roles are likely to get shifted in evoked study (Daianu et al.,2013).
In evoked studies, association of any specific brain regionwith the task was correlated for probable AD and HC group(Berendse et al., 2000). The instant reduction of the signalamplitude after opening the eyes was found to be diminishedin AD, but functional connectivity (FC) remained unaltered foreye opening or closing (Berendse et al., 2000). Multiple regionsof brain activity are localized and also their time courses arecharacterized from somatosensory and visual activity task usingmultistart analysis of MEG data (Aine et al., 2000).
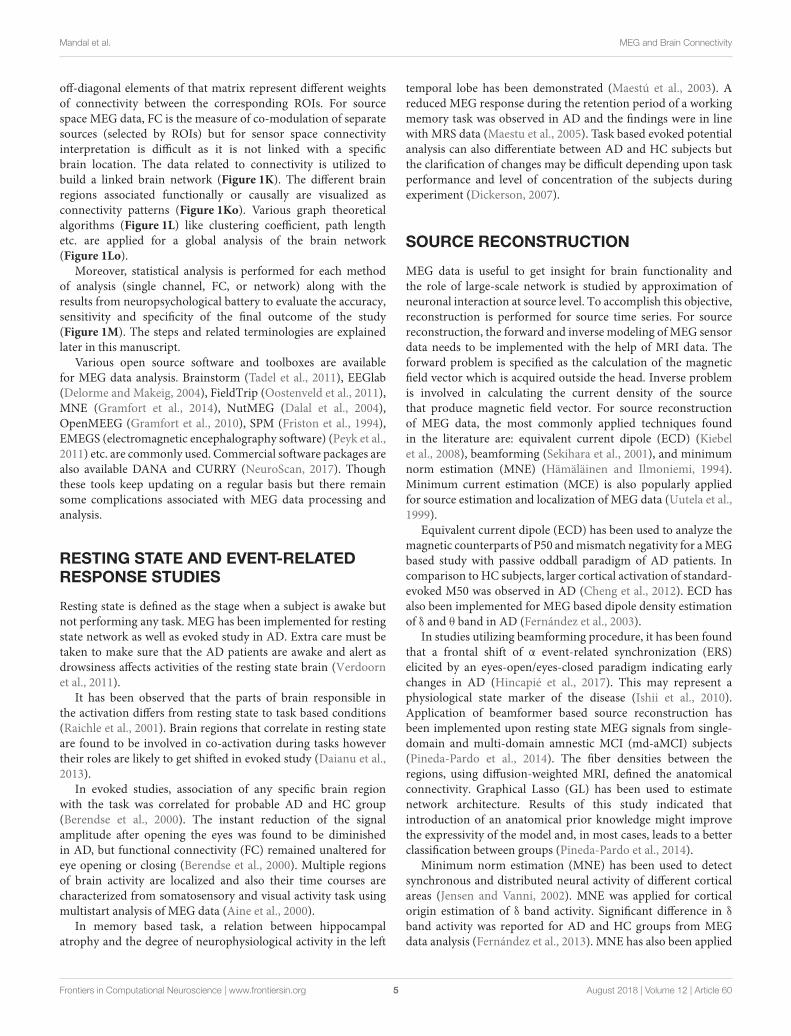
In memory based task, a relation between hippocampalatrophy and the degree of neurophysiological activity in the left
temporal lobe has been demonstrated (Maestú et al., 2003). Areduced MEG response during the retention period of a workingmemory task was observed in AD and the findings were in linewith MRS data (Maestu et al., 2005). Task based evoked potentialanalysis can also differentiate between AD and HC subjects butthe clarification of changes may be difficult depending upon taskperformance and level of concentration of the subjects duringexperiment (Dickerson, 2007).
SOURCE RECONSTRUCTION
MEG data is useful to get insight for brain functionality andthe role of large-scale network is studied by approximation ofneuronal interaction at source level. To accomplish this objective,reconstruction is performed for source time series. For sourcereconstruction, the forward and inverse modeling of MEG sensordata needs to be implemented with the help of MRI data. Theforward problem is specified as the calculation of the magneticfield vector which is acquired outside the head. Inverse problemis involved in calculating the current density of the sourcethat produce magnetic field vector. For source reconstructionof MEG data, the most commonly applied techniques foundin the literature are: equivalent current dipole (ECD) (Kiebelet al., 2008), beamforming (Sekihara et al., 2001), and minimumnorm estimation (MNE) (Hämäläinen and Ilmoniemi, 1994).Minimum current estimation (MCE) is also popularly appliedfor source estimation and localization of MEG data (Uutela et al.,1999).
Equivalent current dipole (ECD) has been used to analyze themagnetic counterparts of P50 andmismatch negativity for aMEGbased study with passive oddball paradigm of AD patients. Incomparison to HC subjects, larger cortical activation of standard-evoked M50 was observed in AD (Cheng et al., 2012). ECD hasalso been implemented for MEG based dipole density estimationof δ and θ band in AD (Fernández et al., 2003).
In studies utilizing beamforming procedure, it has been foundthat a frontal shift of α event-related synchronization (ERS)elicited by an eyes-open/eyes-closed paradigm indicating earlychanges in AD (Hincapié et al., 2017). This may represent aphysiological state marker of the disease (Ishii et al., 2010).Application of beamformer based source reconstruction hasbeen implemented upon resting state MEG signals from single-domain and multi-domain amnestic MCI (md-aMCI) subjects(Pineda-Pardo et al., 2014). The fiber densities between theregions, using diffusion-weighted MRI, defined the anatomicalconnectivity. Graphical Lasso (GL) has been used to estimatenetwork architecture. Results of this study indicated thatintroduction of an anatomical prior knowledge might improvethe expressivity of the model and, in most cases, leads to a betterclassification between groups (Pineda-Pardo et al., 2014).
Minimum norm estimation (MNE) has been used to detectsynchronous and distributed neural activity of different corticalareas (Jensen and Vanni, 2002). MNE was applied for corticalorigin estimation of δ band activity. Significant difference in δ
band activity was reported for AD and HC groups from MEGdata analysis (Fernández et al., 2013). MNE has also been applied
Frontiers in Computational Neuroscience | www.frontiersin.org 5 August 2018 | Volume 12 | Article 60

Mandal et al. MEG and Brain Connectivity
for source reconstruction of MEG data in dementia and healthyindividuals with subjective memory loss (Maestú et al., 2008).
Minimum current estimation (MCE) has been utilized toidentify cortical sources of spontaneous brain oscillation fromMEG data for MCI and AD. In comparison to HC group,oscillatory abnormalities in the alpha source distribution wereclearly visible in AD whereas for MCI significant changes werenot observed (Osipova et al., 2006).
MEG DATA ANALYSIS
The MEG signal analysis is a complex procedure and ischaracterized in three categories: single channel analysis,connectivity analysis, network analysis (Engels et al., 2017a).
Single Channel Data AnalysisSingle channel analysis is based on per channel local analysisand studies have been performed for the assessment of AD andcontrol subjects from individual time series MEG data.
Single channel analysis studies have been executed to observea distinction between healthy individuals and AD by time-frequency analysis ofMEGdata. Parameters reported in literaturerelated to single channel analysis is classified into four groups: (i)spectral analysis, (ii) signal complexity, (iii) signal regularity, and(iv) signal predictability.
In comparison to healthy individuals, increase in absolute aswell as relative power was perceived in slow frequency bands of δand θ in AD, but decrease in these power values was observedin high frequency bands of α, β, and γ for AD. These resultsare observed in the parietal, temporo-parietal, posterior parietalareas as well as precuneus cortices and hippocampus (Fernándezet al., 2002, 2003, 2006b, 2013).
Frequency analysis of MEG data has also been performed invarious studies (Escudero et al., 2008, 2009). Peak frequency,mean frequency and median frequency were reported lower forAD compared to HC subjects (van Walsum et al., 2003; Pozaet al., 2007b; Montez et al., 2009). It has been found that in AD,lower α band sources are predominant in the temporal regions,whereas in the controls, robust α sources were found near theparieto-occipital sulcus (Osipova et al., 2005). The activationwithin the parieto-occipital region was significantly weaker, andactivation in the right temporal area was significantly enhancedin the AD (Osipova et al., 2005). Studies reported less complexityin AD by evaluating Lempel-Ziv complexity, fractal dimensionand also correlation dimension (Gómez et al., 2009a,b; Horneroet al., 2009).
Nonlinear analysis has also been reported in MEG basedstudies (Abatzoglou et al., 2007; Escudero et al., 2009). Spectralentropy and ratio have also been examined from MEG data(Poza et al., 2007a, 2008b; Bruña et al., 2012). Approximateentropy, sample entropy as well as multiscale entropy values havebeen found to be lower in AD than HC subjects from MEGdata analysis (Hornero et al., 2009). These results are consistentwith the findings of MRI studies where reduction in entropy ofhippocampus have been reported (Drachman, 2006).
Stationarity and equilibrium of signals from AD were foundto be disrupted (Gómez et al., 2009b; Bruña et al., 2012) similar
to complexity studies. Abnormal and predictable dynamics wasreported in AD by observing low decrease rate of auto mutualinformation from MEG data (Gomez et al., 2006b; Gómezet al., 2007b; Hornero et al., 2009). Indication of more regularoscillations in AD than controls was found by high spectralcrest factor and spectral turbulence and wavelet turbulence (Pozaet al., 2008a, 2014). Comparatively high power in the lowerfrequency bands and low power in the higher frequency bandsconfirmed this information and relates to the studies involvingEEG (Micanovic and Pal, 2014).
The changes observed in single channel analysis of MEGdata using different parameters are represented in Figure 2. Theincreasing and decreasing measures of all the parameters, e.g.,absolute power, approximate entropy etc., (listed in the verticalaxis) for all the frequency bands (δ, θ, α, β, γ) have beenshown in chronological order. Most of the studies have reportedresults common for all the frequencies in AD whereas someinvestigations informed significant difference in specific bandwaves. For example, relative power (RP) was reported increasedexplicitly in δ band but decreased in β band. Majority of theparameters implemented for single channel analysis of MEGdata were reported reduced in AD compared to HC subjectsthough in few cases, metrics were found increased. The synthesisof single channel analysis of MEG studies, it is inferred that aslowing pattern of oscillations is visible in AD and MCI patientsin frontal, parietal, temporal, and occipital brain regions.
Connectivity AnalysisThe functionally connected areas of brain are explained with thehelp of connectivity analysis. This review discusses two types ofconnectivity analysis, FC and EC, for MEG data. FC is temporalcorrelation between remote neurophysiological events, and EC isdefined as the influence one neural system exerts over another(Friston, 1994, 2011).
Functional Connectivity AssessmentFunctional Connectivity (FC) is estimated in time as well asfrequency domain using linear (e.g., correlation) and nonlinear(e.g., mutual information) methods (Sakkalis, 2011). MEGtime series data of different brain areas that are functionallyconnected, are assumed to show a statistical relationship(Bastos and Schoffelen, 2016). MEG data analysis demonstratesthe relationship between neural oscillations and functionalconnectivity of brain (Brookes et al., 2011). Path of informationflow within the brain is understandable with the help of directionprovided by FC (Blinowska, 2011).
Coherence is one of the widely used for FC estimation.Coherence is the degree of similarity of frequency componentsof two time series (of simultaneous values or leading and laggingrelationships). Mathematically, coherence is the frequencydomain equivalent to the time domain cross-correlationfunction. Its squared value quantifies, as a function of frequency,the amount of variance in one of the signals that canbe explained by the other signal, or vice-versa, in analogyto the squared correlation coefficient in the time domain.
Frontiers in Computational Neuroscience | www.frontiersin.org 6 August 2018 | Volume 12 | Article 60

Mandal et al. MEG and Brain Connectivity
FIGURE 2 | Presentation of various measures (e.g., mean frequency, relative power etc.) used in MEG single channel analysis, mentioned in the vertical axis, in
chronological order. The horizontal axis represents the year of study. Changes to the parameters in the frequency bands (δ, θ α, β, and γ) are indicated using different
color codes. AP, Absolute Power; PF, Peak Frequency; CD, Correlation Dimension; RP, Relative Power; AMI, Auto Mutual Information. LZC, Lempel-Ziv Complexity;
MF, Mean Frequency; TF, Transition Frequency; SpecEn, Spectral Entropy; SEF95, 95% Spectral Edge Frequency; SampEn, Sample Entropy; SCF, Spectral Crest
Factor; ST, Spectral Turbulence; MedF, Median Frequency; FD, Fractal Dimension; DFA, Detrended Fluctuation Analysis; BDMA, Backwards Detrended Moving
Average; ApprEn, Approximate Entropy; ED, Euclidean Distance; LRMC, Lopez Ruis-Mancini-Calbet; DCD, Delta Current Density; WT, Wavelet Turbulence.
The coherence coefficient is a normalized quantity boundedbetween 0 and 1.
cohxy () =
∣
∣
∣
1n
∑nk=1 Ax
(
ω, k)
Ay
(
ω, k)
ei(ϕx(ω,k)−ϕy(ω,k))∣
∣
∣
√
( 1n
∑nk=1 A
2x
(
ω, k))
(
1n
∑nk=1 A
2y
(
ω, k)
)
(1)
where, coherence of two signals x and y at frequency ω
represented as cohxy (ω) is computed using Equation (1), whereAx, Ay are amplitude and ϕx, ϕy are phase of signals x and y,respectively and n is the total number of data points. High valueof coherence indicates strong functional connectivity.
Increase in coherence is reported in the δ band (Alonsoet al., 2011; Escudero et al., 2011). On the other hand, loss ofconnectivity indicated by decreased coherence is found to be
restricted in high frequency bands (Franciotti et al., 2006; Alonsoet al., 2011). However, some studies reported no significancedifference between AD and HC subjects by the evaluationcoherence (Stam et al., 2002).
From coherence analysis, decreased neural connectivity ofmultiple brain regions including the right posterior perisylvianregion and left middle frontal cortex correlated with a higherdegree of disease severity has been reported (Ranasinghe et al.,2014). Insufficiency in executive control and episodic memoryis correlated with reduced FC of the left frontal cortex, whereasvisuospatial impairments is correlated with reduced FC of theleft inferior parietal cortex (Ranasinghe et al., 2014). These resultssuggested that reductions in region-specific α-band resting stateFC are strongly correlated with specific cognitive deficits in ADspectrum (Ranasinghe et al., 2014).
Frontiers in Computational Neuroscience | www.frontiersin.org 7 August 2018 | Volume 12 | Article 60

Mandal et al. MEG and Brain Connectivity
From the parameter named synchronization likelihood (SL),the strength of synchronization of two time series is evaluatedbased on state space embedding. Nonlinear forecasting (NF) andcross mutual information functions (CMIF) are measures for thepredictability of one time series when a second series is known,have been implemented for FC analysis. Predictability based onsimilarity (based on the amplitude of two time series) has alsobeen evaluated from MEG data using cross approximate entropy(Cr-appEn).
FC from MEG data was found to be lower in α, β, and γ
bands but higher in θ band for AD (Stam et al., 2002, 2006)using SL. Increase in inter-hemispheric connections, decreasein anteroposterior FC was detected in MCI (Bajo et al., 2010).The inter-hemispheric increased synchronization values reflecta compensatory mechanism for the lack of efficiency of thememory networks (Bajo et al., 2010). Hence, these connectivityprofiles support the idea of calling MCI as a “disconnectionsyndrome” partially (Bajo et al., 2010).
MEG study with a memory task has been performed on MCIgroup to characterize patients who would eventually go on todevelop the disease (Bajo et al., 2012). It has been reported thatprogressive patients showed a differential profile of FC valuescompared with those patients who remained stable over time(Bajo et al., 2012). Time series was found more predictablefor AD by the nonlinear forecasting approach (Gómez et al.,2008). While cross mutual information values were reportedincreased in AD (Alonso et al., 2011), cross-approximate entropywas observed decreased indicating synchronization better thanHC subjects (Gómez et al., 2012). For the analysis of FC,variance information in source space projected Hilbert envelopetime series has been extracted that has given important spatialinformation about functional relevance (Hall et al., 2013).
Another measure of connectivity is phase locking value (PLV).It is calculated using the instantaneous phase difference betweena pair of signals. PLV for each data segment is calculated as thenorm of the average vector for the pair of signals k and l fromEquation (2)
PLVk,l =
∣
∣
∣
∣
∣
1
T
∑
t
e−j(ϕk(t)−ϕl(t))
∣
∣
∣
∣
∣
(2)
where, ϕk(t) is the instantaneous phase of signal k at instant t, andT is the number of temporal points per segment.
Another metric used for FC estimation from MEG data isphase lag index (PLI), which evaluates the distribution of phasedifferences across observations. In terms of PLI, FC was observedlower in AD in α and β band (Stam et al., 2009). FC alterationsbased on PLV were found in both subjective cognitive decline(SCD) and MCI groups compared to HC subjects (López-Sanzet al., 2016, 2017). A hyper synchronized anterior and posteriornetwork, characterized by a decrease in FC, was spotted inAD (López-Sanz et al., 2016, 2017). This decrease was morepronounced in the MCI group. These results indicate that SCDcan be considered as a preclinical stage of AD (López-Sanzet al., 2016, 2017). FC was assessed using the amplitude envelopecorrelation was significantly lower in all-to-β cross-frequencycoupling (CFC) in AD in the left hippocampus and several
regions of the DMN (Engels et al., 2016b). Virtual electrodes havebeen used to correlate functional interactions with the slowingactivity of hippocampi and cortical areas (Engels et al., 2016a).A virtual electrode is an estimate of the time-series of neuronalactivity at a particular location in the brain. Estimating neuronalactivity at the source level requires solving the inverse problem,i.e., the estimation of activity on the basis of the extracranialsensor recordings (Hillebrand and Barnes, 2005). In this studybeamforming technique is used to solve this inverse problem.A decreased connectivity in AD, specifically in parieto-temporalareas in the α and β band in whole brain during resting state(Koelewijn et al., 2017).
The interfering factors to be considered in MEG data analysisare field spread (FS) and volume conduction (VC). Because ofthe topographical representation of magnetic field beyond thesource, signal can be picked up at some distance and it is termedas field spread (Silva Pereira et al., 2017). Due to FS, a signal fromone underlying source can be present in multiple time series.This creates error in the estimation of statistical dependenciesbetween time series data which in turn hamper the evaluation ofFC (Bastos and Schoffelen, 2016).
Posterior-to-anterior information flow over the cortex inhigher frequency bands in HC subjects with a reversed patternin the θ band has been reported (Engels et al., 2017b). Theinformation flow from the precuneus and the visual cortex,toward frontal and subcortical structures, was found to bedecreased prominently in AD (Engels et al., 2017b). MEG basedmultiplex brain network yields to an effective structure for theintegration of the frequency specific networks (Yu et al., 2017).
Effective Connectivity AssessmentRecent studies have been performed onMEG data for the analysisof EC in AD and MCI (Gómez et al., 2017). Granger Causality(GC) was implemented for the estimation of EC. According toGC, if a signal P “Granger-causes” (or “G-causes”) a signal Q,then past values of P should contain information that helps topredict Q, above and beyond the information contained in pastvalues of Q alone (Granger, 1969). For all the five conventionalfrequency bands, connectivity values were lower for MCI incomparison to HC subjects. Interhemispheric GC was found tobe decreased between frontal areas (both directions) in θ, α,and β, from left central to right central in θ, between posteriorbrain regions in α and β, and finally between temporal areas(from right to left in θ, and in both directions in α, β, and γ;Gómez et al., 2017). On the other hand, statistically significantdifferences in intra-hemispheric couplings were found mainlybetween frontal, lateral, and posterior areas, but also from theseaforementioned areas to central regions, and between posteriorand frontal regions (Gómez et al., 2017). In θ, β, and γ bands,decrements in EC patterns was observed, whereas increments inEC was found in the δ band in AD using GC (Juan-Cruz et al.,2017).
After analyzing all the findings reported for MEG basedconnectivity studies, a decrease in MEG based functionalconnectivity in the higher frequency bands are observed. Increasein connectivity has mainly been observed in the parietal andtemporal regions as well as between the parietal and occipital
Frontiers in Computational Neuroscience | www.frontiersin.org 8 August 2018 | Volume 12 | Article 60
Mandal et al. MEG and Brain Connectivity
regions and here FCwas not frequency dependent. It is concludedfrom all these connectivity analyses that parietal areas along withleft frontal and occipital areas are associated with the decrease inlong term connection and for short term connection involvementof the frontal and parietal regions of right hemisphere wasreported.
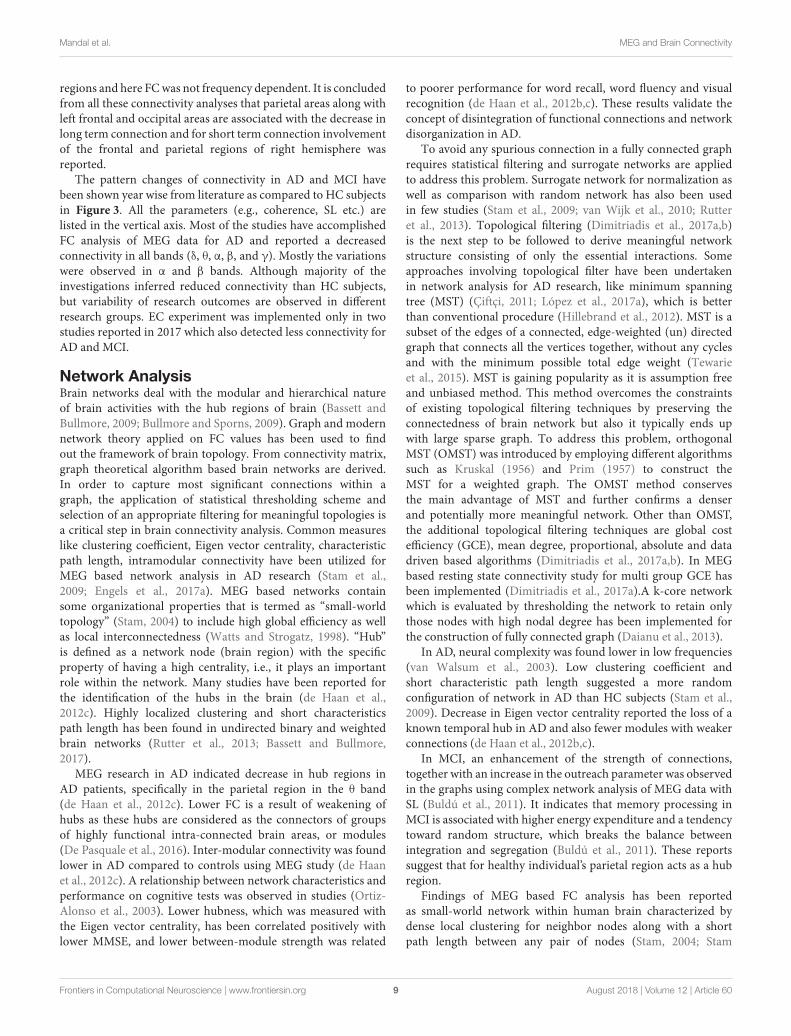
The pattern changes of connectivity in AD and MCI havebeen shown year wise from literature as compared to HC subjectsin Figure 3. All the parameters (e.g., coherence, SL etc.) arelisted in the vertical axis. Most of the studies have accomplishedFC analysis of MEG data for AD and reported a decreasedconnectivity in all bands (δ, θ, α, β, and γ). Mostly the variationswere observed in α and β bands. Although majority of theinvestigations inferred reduced connectivity than HC subjects,but variability of research outcomes are observed in differentresearch groups. EC experiment was implemented only in twostudies reported in 2017 which also detected less connectivity forAD and MCI.
Network AnalysisBrain networks deal with the modular and hierarchical natureof brain activities with the hub regions of brain (Bassett andBullmore, 2009; Bullmore and Sporns, 2009). Graph and modernnetwork theory applied on FC values has been used to findout the framework of brain topology. From connectivity matrix,graph theoretical algorithm based brain networks are derived.In order to capture most significant connections within agraph, the application of statistical thresholding scheme andselection of an appropriate filtering for meaningful topologies isa critical step in brain connectivity analysis. Common measureslike clustering coefficient, Eigen vector centrality, characteristicpath length, intramodular connectivity have been utilized forMEG based network analysis in AD research (Stam et al.,2009; Engels et al., 2017a). MEG based networks containsome organizational properties that is termed as “small-worldtopology” (Stam, 2004) to include high global efficiency as wellas local interconnectedness (Watts and Strogatz, 1998). “Hub”is defined as a network node (brain region) with the specificproperty of having a high centrality, i.e., it plays an importantrole within the network. Many studies have been reported forthe identification of the hubs in the brain (de Haan et al.,2012c). Highly localized clustering and short characteristicspath length has been found in undirected binary and weightedbrain networks (Rutter et al., 2013; Bassett and Bullmore,2017).
MEG research in AD indicated decrease in hub regions inAD patients, specifically in the parietal region in the θ band(de Haan et al., 2012c). Lower FC is a result of weakening ofhubs as these hubs are considered as the connectors of groupsof highly functional intra-connected brain areas, or modules(De Pasquale et al., 2016). Inter-modular connectivity was foundlower in AD compared to controls using MEG study (de Haanet al., 2012c). A relationship between network characteristics andperformance on cognitive tests was observed in studies (Ortiz-Alonso et al., 2003). Lower hubness, which was measured withthe Eigen vector centrality, has been correlated positively withlower MMSE, and lower between-module strength was related
to poorer performance for word recall, word fluency and visualrecognition (de Haan et al., 2012b,c). These results validate theconcept of disintegration of functional connections and networkdisorganization in AD.
To avoid any spurious connection in a fully connected graphrequires statistical filtering and surrogate networks are appliedto address this problem. Surrogate network for normalization aswell as comparison with random network has also been usedin few studies (Stam et al., 2009; van Wijk et al., 2010; Rutteret al., 2013). Topological filtering (Dimitriadis et al., 2017a,b)is the next step to be followed to derive meaningful networkstructure consisting of only the essential interactions. Someapproaches involving topological filter have been undertakenin network analysis for AD research, like minimum spanningtree (MST) (Çiftçi, 2011; López et al., 2017a), which is betterthan conventional procedure (Hillebrand et al., 2012). MST is asubset of the edges of a connected, edge-weighted (un) directedgraph that connects all the vertices together, without any cyclesand with the minimum possible total edge weight (Tewarieet al., 2015). MST is gaining popularity as it is assumption freeand unbiased method. This method overcomes the constraintsof existing topological filtering techniques by preserving theconnectedness of brain network but also it typically ends upwith large sparse graph. To address this problem, orthogonalMST (OMST) was introduced by employing different algorithmssuch as Kruskal (1956) and Prim (1957) to construct theMST for a weighted graph. The OMST method conservesthe main advantage of MST and further confirms a denserand potentially more meaningful network. Other than OMST,the additional topological filtering techniques are global costefficiency (GCE), mean degree, proportional, absolute and datadriven based algorithms (Dimitriadis et al., 2017a,b). In MEGbased resting state connectivity study for multi group GCE hasbeen implemented (Dimitriadis et al., 2017a).A k-core networkwhich is evaluated by thresholding the network to retain onlythose nodes with high nodal degree has been implemented forthe construction of fully connected graph (Daianu et al., 2013).
In AD, neural complexity was found lower in low frequencies(van Walsum et al., 2003). Low clustering coefficient andshort characteristic path length suggested a more randomconfiguration of network in AD than HC subjects (Stam et al.,2009). Decrease in Eigen vector centrality reported the loss of aknown temporal hub in AD and also fewer modules with weakerconnections (de Haan et al., 2012b,c).
In MCI, an enhancement of the strength of connections,together with an increase in the outreach parameter was observedin the graphs using complex network analysis of MEG data withSL (Buldú et al., 2011). It indicates that memory processing inMCI is associated with higher energy expenditure and a tendencytoward random structure, which breaks the balance betweenintegration and segregation (Buldú et al., 2011). These reportssuggest that for healthy individual’s parietal region acts as a hubregion.
Findings of MEG based FC analysis has been reportedas small-world network within human brain characterized bydense local clustering for neighbor nodes along with a shortpath length between any pair of nodes (Stam, 2004; Stam
Frontiers in Computational Neuroscience | www.frontiersin.org 9 August 2018 | Volume 12 | Article 60

Mandal et al. MEG and Brain Connectivity
FIGURE 3 | Presentation of various measures (e.g., coherence, SL etc.) used in connectivity analysis from MEG data, mentioned in the vertical axis, in chronological
order. The horizontal axis represents the year of study. Changes to the parameters in the frequency bands (δ, θ α, β, and γ) are indicated using different color codes.
GC: Granger Causality, Coherence; SL, Synchronization Likelihood; NF, Nonlinear Forecasting; PLI, Phase Lag Index; CMIF, Cross Mutual Information Function;
Cr-appEn, Cross-Approximate Entropy; AEC, Amplitude Envelope Correlation; CFC, Cross Frequency Coupling; NAmp, Node based Amplitude; dPTE, Directed
Phase Transfer Entropy; PLV, Phase Locking Value.
et al., 2009). Source-space weighted functional networks werecharacterized with graph theoretical measures in event-relatednetwork analysis (ERNA) for a MEG based cognitive study.Dense and clustered connectivity between the hubs belongingto different modules is reported as the “network fingerprint” ofcognition (Bola and Sabel, 2015). Recently, a new approach forMEG analysis is introduced and named as “multiplex networkanalysis” (Yu et al., 2017). Diagrammatic representation of theresults reported for global brain network analysis performedusing MEG data in a successive year-wise manner in Figure 4.
MACHINE LEARNING APPROACH FORMEG BASED ANALYSIS
The developments and availability of various feature extractionand classification techniques based on machine learning havebeen growing for MEG signal analysis (Deo, 2015). Incombination with network analysis studies, implementation ofmachine learning algorithms like random forest, support vectormachine (SVM) could easily distinguish the two clinical groups(Cichy et al., 2016b; Zanin et al., 2016). In a group studyconsisting subjects of multiple sclerosis, AD, schizophrenia,Sjogren’s syndrome, chronic alcoholism, facial pain as well asHCs (Georgopoulos et al., 2007), MEG data was classified using
Genetic algorithm-linear discriminant analysis (GA-LDA) withautoregressive integrated moving average (ARIMA) features.They reported results by dividing subjects into three samplegroups, (1) 52 subjects, 6 groups, (2) 46 subjects, 5 groups,and (3) 142 subjects, 7 groups. Another study reported toclassify AD and control group 70.73 and 78.05% accurately usingfeatures of SampEn and LZC, respectively with leave-one-out-cross validation method (Gómez et al., 2009a). However, theywere able to achieve 85.37% accuracy by implementing adaptivenetwork based fuzzy inference system classifier for distinguishingAD and control subjects. In a combined MEG and fMRI study,multivariate analysis of MEG data with linear SVM was used toselect MEG sensors that contain discriminative information innoisy data without human intervention (Cichy et al., 2016a).
In a recent study (Maestú et al., 2015), a new approachof classification called Clinical Data Partitioning (CliDaPa)algorithm has been incorporated to distinguish MCI fromcontrols. They proposed CliDaPa process that includes ChiSquare filtering feature selection andmachine learning classifiers.Random Forest (Breiman, 2001), Bayesian Network (Buntine,1991), C4.5 induction tree (Quinlan, 1993), K-nearest Neighbor(Cover and Hart, 1967), Logistic Regression (Ng and Jordan,2002), and SVM (Suykens and Vandewalle, 1999) classificationalgorithms are included in their proposed method. They appliedbootstrap validation to measure the robustness and accuracy of
Frontiers in Computational Neuroscience | www.frontiersin.org 10 August 2018 | Volume 12 | Article 60

Mandal et al. MEG and Brain Connectivity
FIGURE 4 | Presentation of various measures (e.g., node modularity, path length etc.) used in brain network analysis from MEG data, mentioned in the vertical axis, in
chronological order. The horizontal axis represents the year of study. Changes to the parameters in the frequency bands (δ, θ α, β, and γ) are indicated using different
color codes. NC, Neural Complexity; PL, Path Length; CC, Clustering Coefficient; AC, Algebraic Connectivity; ER, Eigen Ratio; Mod, Modularity; NM, Number of
Modules; PC, Participation Coefficient; SG, Spectral Gap; SR, Spectral Radius; MD, Within Module Degree; MST, Minimum Spanning Tree; BC, Betweenness
Centrality; ND, Node Degree.
proposed pipeline. High accuracy up to 86% was achieved byusing 10-fold cross validation based Linear discriminant analysis(LDA) and radial basis function SVM (rbf-SVM) classifier forsingle domain and multi domain MCI patients. LDA was utilizedfor the classification of with leave-one-out cross validation(Bruña et al., 2012). Discriminant analysis has also been used forAD and HC classification (Fernández et al., 2003).
STATISTICAL ANALYSIS OF MEG DATA
Parametric, e.g., students t-test, analysis of variance (ANOVA),Chi-Squared tests (Franciotti et al., 2006; Stam et al., 2006; Gómez
et al., 2007b; Poza et al., 2007b, 2008a; Ishii et al., 2010; Engelset al., 2017b; López et al., 2017a; López-Sanz et al., 2017) as wellas non-parametric, e.g., Wilcoxon–Mann–Whitney tests (Alonsoet al., 2011) statistics has been applied for MEG data analysis(Kiebel et al., 2005). Parametric tests are performed dependingupon specific assumptions.
Analysis of variance (ANOVA) and two-tailed t-test wereapplied to test the group differences. Spearman’s bivariatecorrelation test were used to access the connection betweencognitive status and network derived measures (Stam et al.,2009). Use of Systat software for windows has been reported tocalculate Huynh-Feldt-corrected P values for MEG data (Stamet al., 2002). They stated application of a two-way repeated
Frontiers in Computational Neuroscience | www.frontiersin.org 11 August 2018 | Volume 12 | Article 60

Mandal et al. MEG and Brain Connectivity
FIGURE 5 | Average relative power spectra for all MEG channels in HC
subjects (green line), the amnestic single domain (a-sd) MCI patients (blue
dashed line) and the amnestic multi domain (a-md) MCI patients (red dotted
line). This Figure is taken from literature (López et al., 2014b) with due
permission of the American Aging Association and modified.
measure analysis of variance with AD and HC group as aninter subject factor and 117 MEG channels as intra subjectfactor. Pearson correlation coefficient has been used to correlateMEG and MRI volumetric variables (relative left and righthippocampal volume) to distinguish AD and HC group (Maestúet al., 2003). The AD vs. HC analysis has also been done usingMultivariate analysis of variance (MANOVA) where they chooseparameters correlation dimension and neural complexity (vanWalsum et al., 2003). A three-way repeated measures ANOVAwas used to compare power values between groups. To compareactivation within ROIs and peak frequencies also t-test wascarried out (Osipova et al., 2005). ANOVA with Greenhouse-Geisser correction has been utilized for the qualitative statisticalclassification among AD, MCI, and control groups (Escuderoet al., 2011).
Non-parametric test, on the other hand, does not makeany such assumption and can be performed even without anyinformation regarding population or have a small population.Non-parametric two-tailed Mann–Whitney U-test was carriedout using SPSS software for evaluation of statistical significanceof classification between AD and normal individuals (Poza et al.,2007a). Mann–Whitney U-test has also been used with leave-out cross-validation to measure the ability of median frequencyand spectral entropy to differentiate AD from HCs (Escuderoet al., 2008). Kruskal–Wallis test was performed for each channelpair between MCI and HC (Bajo et al., 2010). For evaluation ofstatistical significance Wilcoxon signed rank test was performedon simulated data (Brookes et al., 2011).
The advantage of non-parametric statistical test is that it givescomplete freedom of choosing the experimental conditions forcomparison. This independence delivers an up-front approachto explain the Multiple Comparisons Problem (MCP) (Marisand Oostenveld, 2007). MCP is a commonly found problem instatistical analysis of MEG. This problem initiates since MEG-data are multidimensional. The signal is sampled at multiplechannels and multiple time points; hence MEG-data becomesmultidimensional. Moreover, duringMEG data analysis the effectof interest (i.e., a difference between experimental conditions) isevaluated at an extremely large number of (channel, time)-pairswhich in turn gives rise to MCP.
For correction of MCP, Bonferroni correlation was used whilestatistically validatingMEG-MRS combined study using ANOVAfor AD and HC (Maestu et al., 2005). In a comparative study ofprogressive MCI, stable MCI and controls using synchronizationlikelihood parameter Kruskal–Wallis (KW) test was performed.To correct for MCP, they applied non-parametric permutationtesting followed by surrogate t-maps (Bajo et al., 2012). Onestudy has done correction for MCP by taking maximum meanPLI values over ROIs (Hillebrand et al., 2012). Distributionfor t-test was derived from permutation to avoid family wiseerror occurring due to MCP in the classification of healthy agedpersons fromMCI and AD (Fernández et al., 2013) and similarlyto distinguish among sd-aMCI, md-aMCI, and HCs (Lópezet al., 2014b). Implementation of false discovery rate (FDR) formultiple comparisons correction was not found significant in at-test based classification of single domain amnestic MCI andHC group (Pineda-Pardo et al., 2014) whereas in other studiesFDR showed robustness in correcting MCP (Ranasinghe et al.,2014; Engels et al., 2016b; Gómez et al., 2017). Mann–WhitneyU-tests modified for multiple comparisons by a Bonferronicorrection were performed in the statistical analysis of MEGbased study of HC, MCI, and AD (Poza et al., 2014). Significantdifferences in FC between progressive MCI, stable MCI, andHCs was calculated using Mann–Whitney U-test to correctMCP using non-parametric permutation test (López et al.,2014a). Maximum t-value across ROIs of each permutation wasutilized to build a distribution of maximum t-values to addressMCP problem in a study of AD and HCs using MEG (Engelset al., 2016a). Permutation tests for random-effects inferenceand MCP correction has been performed with a cluster-levelin MEG data analysis (Cichy et al., 2016b). Tukey’s HonestlySignificant Difference (HSD) MCP correction was implementedfor neuropsychological scores inMEGbased classification of agedHCs, SCD and MCI group (López-Sanz et al., 2016).
Although, in some studies both parametric as well as non-parametric statistics have implemented for comparison, but theyhave not applied MCP correction (de Haan et al., 2012c; JosefGolubic et al., 2017; Juan-Cruz et al., 2017).
DISCUSSION
MEG provide means to uncover AD related deviations in brainoscillations. In-depth analysis of MEG application in AD can beuseful to identify plausible biomarkers to detect the early stagesof this disease. This section entails thorough explanation aboutthe outcomes of single channel, connectivity, network analysis ofMEG data in AD and MCI.
The neuropsychological studies involving MMSE and FASTresults of AD patients have been related to slowing of brainoscillations and cognitive declined indicated byMEG (Fernándezet al., 2006a, 2013). Studies also found that low MMSE score inAD was related to slowing in parietal and central regions of brain(de Haan et al., 2008).
From the analysis of all the research reporting single channelanalysis, it is evident that AD patients have less complex,more regular and predictable brain oscillations. It is theindication of the slowing oscillatory activities (Stam, 2005).Word
Frontiers in Computational Neuroscience | www.frontiersin.org 12 August 2018 | Volume 12 | Article 60

Mandal et al. MEG and Brain Connectivity
FIGURE 6 | Links (connection among various brain regions) with significantly different FC values have been shown for comparative analysis. Left: Posterior, superior,
left and right views of the brain. Right Circle plot shows a schematic view of the significant links. Comparison between healthy control (HC) subjects and mild cognitive
impairment (MCI) group. Red lines indicate an increased FC value in MCI with respect to HC subjects. Blue lines indicate a decreased FC value in MCI with respect to
HC subjects. This Figure is taken from literature (López-Sanz et al., 2017) with permission.
processing in AD has also been examined using MEG data(Walla et al., 2005). Moreover, studies performing evaluationof wavelet turbulence and entropy analysis demonstrated anincrease in the average degree of similarity within time series withthe progress of AD (Poza et al., 2007b). Basically it indicates thatin AD brain signals have a less uniform spectral control (Pozaet al., 2007b). Nonlinear findings suggested that the decreasein complexity of brain signals in AD might be simply due tothe altered spectrum reported in AD (Stam, 2005). Studies alsopointed out that the complexity, regularity and predictabilitymeasures of the single channel MEG analysis are not entirelydependent on the spectral component of the data. Presence ofnonlinear structures has been found from surrogate data of EEGand MEG in AD and HC subjects (Pereda et al., 2005; Gómezet al., 2009a). The effect of randomization was different in ADcompared to controls which is an indication that complexityand regularity measures in AD studies cannot be completelyattributed to the slowing of the signal. This aspect was also foundin non-overlapping spectral and complexity study of MEG data(van Walsum et al., 2003). The actual reason for the decreasein complexity is not clear yet. However, loss of neurons andsynapses and reduction in neurotransmitters might be involvedin this process (Gómez et al., 2009a). It has also been reportedthat FC and brain network changes due to the changes in synapticlevels (de Haan et al., 2012b).
To properly describe the fact that most active regions havebeen observed with the most abundant changes in AD, an activity
dependent degeneration hypothesis has been proposed (de Haanet al., 2012a). In a recent MEG study, changes in the activation ofprefrontal brain area has been observed in early stage AD (Songet al., 2014).
Minimum-variance pseudo-unbiased reduced-rankestimation (MV-PURE) framework has been proposed forbetter reconstruction of source activity from MEG data(Piotrowski et al., 2017). In addition, multilayer network analysisapproach has also been applied to integrate multiple frequencybands in a single framework and results reported disruption ofhub regions in AD (Brookes et al., 2016).
MEG studies suggest that the parietal and temporal regionsof the brain play an important role in brain functioning. AMEG based study of progressive MCI patients predicted thatthe increase in phase synchronization between the right anteriorcingulate and temporo-occipital areas, is useful to understand theconversion fromMCI to AD (López et al., 2014a).
Reports suggest that in MCI and AD difference in theseregions are observed as compared to healthy subjects. In case offrequency as well as FC analysis, these regions have shown slowbrain activity and decreased connectivity, respectively.
In a study administered by López et al. (2014b), oscillatorybrain activities of subtypes of amnestic MCI have been comparedby the relative power values of theirMEG data. Total 105 subjects’data has been recorded in eyes closed resting state condition.Among all the subjects 36 were HC subjects, 33 were singledomain amnestic mild cognitive impairment (sd-aMCI) and the
Frontiers in Computational Neuroscience | www.frontiersin.org 13 August 2018 | Volume 12 | Article 60

Mandal et al. MEG and Brain Connectivity
FIGURE 7 | Links (connection among various brain regions) with significantly different FC values have been shown for comparative analysis. Left: Posterior, superior,
left and right views of the brain. Right Circle plot shows a schematic view of the significant links. Comparison between healthy control (HC) subjects and subjective
cognitive decline (SCD) group. Red lines indicate an increased FC value in SCD respect to HC subjects. Blue lines indicate a decreased FC value in SCD respect to
HC subjects. This Figure is taken from literature (López-Sanz et al., 2017) with permission.
FIGURE 8 | Links (connection among various brain regions) with significantly different FC values have been shown for comparative analysis. Left: Posterior, superior,
left and right views of the brain. Right Circle plot shows a schematic view of the significant links. Comparison between subjective cognitive decline (SCD) and mild
cognitive impairment (MCI) groups where Blue lines indicate a decreased FC-value in MCI respect to SCD. This Figure is taken from literature (López-Sanz et al., 2017)
with permission.
Frontiers in Computational Neuroscience | www.frontiersin.org 14 August 2018 | Volume 12 | Article 60

Mandal et al. MEG and Brain Connectivity
rest 36 were multi-domain amnestic mild cognitive impairment(md-aMCI) patients. The average relative power in the frequencyrange of 1–30Hz for each group has been calculated. Increase inrelative power in lower frequency bands and decrease in powervalues in higher frequency bands has been observed in both MCIgroups in comparison to control group. Prominent difference hasbeen seen between two subtypes of MCI, the md-aMCI groupshowed a significant power increase within δ and θ ranges andreduced relative power within α and β ranges. In HC subjects amaximum value has been observed at 10Hz whereas frequencypeak for sd-aMCI and md-aMCI patients were found at 9.5and 8.5Hz, respectively (as shown in Figure 5). In addition tothat different spectral distribution was visible among the groups.Indicating lower variability, a comparatively narrower band wasfound for HC subjects. A broader spectrum has been found forboth the MCI groups. It might be a sign of higher variabilityand tendency to lower frequency peaks across subjects. Theserelative power values were correlated with neuropsychologicaltests scores and hippocampal volumes.
Changes in FC have been found in elders with SCD as well asMCI patients compared to healthy individuals in an investigation(López-Sanz et al., 2017). MEG data has been collected inresting state from 39 healthy control elders, 41 elders with SCD,and 51 MCI patients. FC has been evaluated based on sourcereconstructed MEG data using PLV.
The anterior network presented higher FC in the MCI groupcompared to HC subjects in three links connecting anteriorregions, including left inferior temporal gyrus, left paracingulate,and left anterior cingulate. The posterior network exhibitedlower FC in the MCI group, and comprised 14 links betweenconnecting posterior cortical structures such as: temporal medialstructures (both hippocampi and right parahippocampus),parietal (left postcentral gyrus, both supramarginal gyri), andoccipital areas (left frontal pole, both superior occipital cortices,right inferior occipital cortex, right lingual cortex) (Figure 6).
SCD subjects showed increased FC values respect to HCsubjects in the same regions described in the previouscomparison. SCD subjects also showed decreased FC in 11 links.Those links connected both intra and inter-hemispherical areasbetween posterior regions (as shown in Figure 7). Interestingly,all the links affected in the SCD group, were also disrupted in theMCI group in a similar manner.
MCI patients showed a network comprising four links whereFC values were significantly lower compared to SCD FC values.This network with reduced FC connected temporal, parietal andoccipital regions of the brain, and comprised both intra andinter-hemispheric links (Figure 8).
Both SCD and MCI groups exhibited a very similar spatialpattern of altered links: a hyper-synchronized anterior networkand a posterior network characterized by a decrease in FC. Thisdecrease was more pronounced in the MCI group. These types ofFC alterations may work as a key feature to provide a useful toolto characterize the early stage and predict the course of AD.
In Table 1, we have listed some of the MEG studies, togather information regarding the efficacy of MEG data analysismethodologies statistically. Accuracy, sensitivity, specificity andarea under the region of convergence (ROC) curve (AURC) are
briefed in this Table. Different studies have implemented differentparameters for MEG data analysis. It is global analysis in most ofthe cases and not region specific. In addition, frequency bandsare also varying in the experiments. AURC values reported inliterature within 0.529 and 0.912 range for different studies. Fromoverall observation we noticed that some common parameterslike mean frequency (MF), sample entropy (SampEn), andLempel–Ziv complexity (LZC) have exhibited accuracy rangingbetween approximately 77–85, 58–70, and 61–83%, respectively.Although high sensitivity and specificity have been accomplishedin most of the studies, but it is difficult to draw any exactconclusion from these results due to the heterogeneity anddiversity of the metrics. Hence, more region specific, frequencyband specific studies are required to be executed to infer moreuseful information fromMEG data analysis.
As observed from Figure 5, α band frequency inMCI changes,similarly in case of FC we observe the reduction in connectivitypattern for SCD and MCI from HC subjects. Also, from Table 1,it is clear that all these alterations in every parameter take placein AD as well as MCI. Henceforth, further research hit is requiredto unhide the concrete cause behind these variations. ThoughMEG studies found slowing down of brain rhythms in AD, butthese findings cannot specify AD as majority of brain diseasesshow similar pattern of brain oscillations. Therefore, from singlechannel analysis studies it is inferred that a pattern is seen in ADirrespective of applied method. However, uniform distribution ofslowing throughout the brain is not seen. These alterations inbrain oscillations, the left parietal, occipital and temporal areaswere found to be most frequently affected.
Multimodal Approach: MEG in CombinationWith Other Imaging ModalitiesMEGfindings reported a lower FC inAD than normal supportingthe concept of AD as a ‘disconnection syndrome’ (Delbeucket al., 2003; Koelewijn et al., 2017). These observations coincidewith the results of PET, EEG, or fMRI studies (Leuchter et al.,1992; Besthorn et al., 1994; Desgranges et al., 1998; Adler et al.,2003; Greicius et al., 2007; Wang et al., 2007). Combiningdifferent modalities [e.g., EEG, PET, fMRI, magnetic resonancespectroscopy (MRS)] with MEG will be interesting (Langevinand Vachey, 1995; Horwitz and Poeppel, 2002; Rajapakse andCichocki, 2002; Babiloni et al., 2004; Liu et al., 2006; Hall et al.,2014). It has been reported that integrated approach of EEGand MEG gives more accurate connectivity estimation thanindividually (Muthuraman et al., 2015).
It is observed that the integrated implementation of the high(millisecond) temporal resolution of MEG and EEG can givebetter accuracy than fMRI localization in measuring neuronaldynamics within well-defined brain regions and assessing thesource localizing ability for identical stimuli (Sharon et al., 2007).
These methods are in fact independent of signal models and itmakes them attractive for application in MEG analysis for rapidevaluation of data (Deo, 2015). Such approaches were utilized tojoint multimodal processing of MEG and fMRI data. Processingof MEG data with the outputs of a deep neural networkobtained from and trained on the same visual categorization task
Frontiers in Computational Neuroscience | www.frontiersin.org 15 August 2018 | Volume 12 | Article 60

Mandal et al. MEG and Brain Connectivity
TABLE1|Compilatio
nofMEG
data
analysisusingvario
usmethods(e.g.,sa
mpleentropy,cross
mutualinform
atio
nfunctio
netc.)alongwith
specificfrequencybands(δ,θ
α,β,and
γ),areaofanalysis(globaland
local),targetedpopulatio
nandcorresp
ondingstatisticalanalysisvalues(e.g.,accuracy,se
nsitivity
etc.)isreprese
ntedin
thistable.
S.No
Type
of
analysis
Frequency
band
Areaof
analysis
(Global/Local)
Accuracy
%
Sensitivity
%
Specificity
%
AURC
Population
of
Study
References
1Lempel-ZivComplexity
(LZC)
All
Global
83.33
80.95
85.71
0.9002
AD
Gómezetal.,
2006a
2MedianFrequency(M
F)
All
Global
85.37
85
85.17
0.912
AD
Poza
etal.,
2007b
IndividualA
lphaFrequency
(IAF)
80.49
80
80.95
0.821
Transitio
nFrequency(TF)
73.17
70
76.19
0.760
SpectralE
ntropy(SE)
65.85
65
66.67
0.698
95%
SpectralE
dge
Frequency(SEF95)
82.93
90
76.19
0.888
3RelativePower(RP)
βGlobal
–94%
67%
0.864
AD
deHaanetal.,
2008
Roccipital
–94%
78%
0.867
4NonlinearForecasting(NLF)
All
Global
76.7
80.0
73.3
–AD
Gómezetal.,
2008
5MeanFrequency(M
F)
All
Global
77.4
88.9
53.9
0.855
AD
Esc
udero
etal.,
2009
SpectralE
ntropy(SpenEn)
61.3
55.6
69.2
0.727
Lempel-ZivComplexity
(LZC)
61.3
55.6
69.2
0.786
SpectralE
ntropy(SampEn)
58.1
72.2
38.5
0.645
6SpectralE
ntropy(SampEn)
All
Global
70.73
80
61.90
–AD
Gómezetal.,
2009a
Lempel-ZivComplexity
(LZC)
78.05
80
76.19
–
7DetrendedFluctuatio
n
Analysis(DFA
)
α1
Global
63.33
60.00
66.67
0.5511
AD
Gómezetal.,
2009b
α2
83.33
86.67
80
0.8400
Backw
ard
Detrended
MovingAverage(BDMA)
α1
80
80
80
0.8667
α2
73.33
60
86.67
0.6711
8Higuchi’s
FractalD
imension
(HFD)
All
Global
80
95.24
87.8
0.90
AD
Gómezetal.,
2009c
Local
Anterio
r85
76.19
80.49
0.86
Central
70
90.48
80.49
0.87
Posterio
r70
80.95
75.61
0.89
RLateral
85
80.95
82.93
0.89
LLateral
75
76.19
75.61
0.89
9Syn
chronizatio
nLikelihood
(SL)
β1
Global
––
–0.82
MCI
Bajo
etal.,
2010
β2
0.72
γ0.77
(Continued)
Frontiers in Computational Neuroscience | www.frontiersin.org 16 August 2018 | Volume 12 | Article 60

Mandal et al. MEG and Brain Connectivity
TABLE1|Contin
ued
S.No
Type
of
analysis
Frequency
band
Areaof
analysis
(Global/Local)
Accuracy
%
Sensitivity
%
Specificity
%
AURC
Population
of
Study
References
10
Magnitu
deSquared
Coherence(M
SC)
Cross
MutualInform
atio
n
Functio
n(CMIFMA)
All
Local
Anterio
r52.9
67.7
41.2
64.7
64.7
70.6
0.640
0.775
AD
Alonso
etal.,
2011
MSC
CMIFMA
LLateral
55.9
76.5
58.8
82.4
52.9
70.6
0.512
0.813
MSC
CMIFMA
Central
55.9
67.7
58.8
64.7
52.9
70.6
.536
0.771
MSC
CMIFMA
RLateral
52.9
76.5
58.9
76.5
47.1
76.5
0.529
0.903
MSC
CMIFMA
Posterio
r64.7
76.5
58.8
76.5
70.6
76.5
0.702
0.782
11
Relativepower
θGlobal
–82
81
0.83
AD
Engelsetal.,
2016a
has been performed (Cichy et al., 2016a,b). With the help ofthese multimodal approaches, new principles of brain function,generalized to functional systems and patient population, aremodeled (Cichy et al., 2016a,b).
There are certain neurochemicals (N-acetyl-aspartate (NAA)and myoinositol (mI)) alterations in AD. Concentration ofNAA decreases and mI increases with the progression of AD.Integrated study of MEG with MRS has been performed toassociate altered brain oscillations with neurochemical changes(Maestu et al., 2005). For a working memory task, the ADgroup showed a reduced number of activity sources over lefttemporoparietal areas in MEG analysis. In another MRS studyincrease in creatine, mI, and in the mI/NAA ratio was observedin bilateral temporoparietal region. These results were correlatedwith MMSE score and 65% of the variance was found (Maestuet al., 2005).
Modulation of gamma oscillations is a widely establishedmechanism in a variety of neurobiological processes, but itsneurochemical basis is not fully known yet. In addition,research reports suggest that γ oscillation properties dependon GABAergic (gamma-Aminobutyric acid) inhibition (Kujalaet al., 2015). The link between GABA concentration and gammaoscillations is a thrust area of research. A direct relationshipbetween the density of GABA receptors and γ oscillations inhuman primary visual cortex (V1) has been established by aninvestigation by combining Flumazenil-PET (to measure resting-levels of GABA receptor density) and MEG (to measure visuallyinduced gamma oscillations; Kujala et al., 2015).
Involving various neurotransmitters with altering brainoscillations will open a new research domain for clinicalapplication and it is an important thrust area in our laboratory.
CONCLUSIONS
MEG is a powerful technique for the recording of changingactivities of brain functions. From single channel analysis, apatterned and consistent slowing of brain oscillations has beenobserved in AD. FC studies revealed decreased connectivity inAD than controls. EC studies must be implemented furtherto conclude anything. As a whole, association of parietal andtemporal areas has been reported with the advancement of ADin comparison to HC subjects. Involvement of the hippocampushas also been demonstrated but more investigation is required.
The MEG is useful to bridge other electrophysiologicalmeasures like EEG, local field potential (LFP), fMRI, PET,and brain stimulation. It opens opportunities for the crossvalidation of the research findings from various modalities.Moreover, MEG in combination with appropriate modalitiescan be helpful to understand the nature of changes of theneurotransmitters like gamma-Aminobutyric acid (GABA),glutamate etc. (Muthukumaraswamy, 2014; Kujala et al., 2015).MEG has the capability to open up new avenue for clinicalresearch in AD.
MEG data is usually recorded in altered investigationalenvironments, having a spatiotemporal configuration, sampledat several sensors and multiple time points. Researchers aim
Frontiers in Computational Neuroscience | www.frontiersin.org 17 August 2018 | Volume 12 | Article 60

Mandal et al. MEG and Brain Connectivity
to recognize the alteration among the data observed in theseconditions. The processing and analysis procedure varies inresearch studies as can be observed from Figures 3, 4. Somestudies work on sensor space data and some on source spacewhich introduce the major alteration in processing pipeline andalso the frequency bands considered for the study differs asper requirements and anticipated outcomes. Moreover, in moststudies the conditions vary with respect to the configuration ofstimulus being presented instantaneously before or during theregistration of the signal. In other studies, the conditions changewith respect to the type of response given by the experimentsubjects. Another aspect in this regard is that AD populationis diverse with respect to gender, age, demography, diseaseprogression etc. are difficult to be found similar among studies.Modality Integration also plays an important role in experimentaldesign for AD research. Various modalities such as EEG, fMRI,PET, DTI have been integrated withMEG to gain complementaryinformation. Data availability for AD research is also anothermajor research avenue to investigate for AD research.
Hence, majority of the MEG based brain connectivity studiesusing same experimental pipeline in AD research cannot directlybe compared. It necessitates the demand for open science inMEG research by generalizing a specific pipeline for MEGdata acquisition, processing and analysis in clinical setting.Research groups should be interested in making researchaccessible for all to share their materials and data, others can
use and analyze them in new ways, potentially leading to newdiscoveries. This will reduce the so-called “reproducibility crisis.”MEG data being available will be scientifically beneficial forresearchers that can open new avenue in this realm of ADresearch.
AUTHOR CONTRIBUTIONS
PKM conceptualize the idea, literature search, and manuscriptwriting. AB literature search, writing, and figure preparation. MTliterature search and writingmanuscript. AS literature search andwriting.
FUNDING
Funding is provided by Tata innovation Award (to PKM).
ACKNOWLEDGMENTS
PKM (Principal Investigator) thanks for financial support fromTATA innovation fellowship from Ministry of Science andTechnology, Government of India. Sincere thanks to Prof.Partha Raghunathan (NBRC), Dr. Deepika Shukla, (Scientist)for suggestions and comments. Ms. Khushboo Punjabi (R&Dengineer) and Saurav Roy (R&D engineer) are appreciated forproof reading.
REFERENCES
Abatzoglou, I., Anninos, P., Adamopoulos, A., and Koukourakis, M. (2007).Nonlinear analysis of brain magnetoencephalographic activity in Alzheimerdisease patients. Acta Neurol. Belg. 107, 34–39.
Adler, G., Brassen, S., and Jajcevic, A. (2003). EEG coherence in Alzheimer’sdementia. J. Neural Trans. 110, 1051–1058. doi: 10.1007/s00702-003-0024-8
Aine, C., Huang,M., Stephen, J., and Christner, R. (2000). Multistart algorithms forMEG empirical data analysis reliably characterize locations and time courses ofmultiple sources. Neuroimage 12, 159–172. doi: 10.1006/nimg.2000.0616
Alonso, J. F., Poza, J., Mañanas, M. A., Romero, S., Fernández, A., and Hornero,R. (2011). MEG connectivity analysis in patients with Alzheimer’s diseaseusing cross mutual information and spectral coherence. Ann. Biomed. Eng. 39,524–536. doi: 10.1007/s10439-010-0155-7
Auer, S., and Reisberg, B. (1997). The GDS/FAST staging system. Int. Psychogeriatr.9(Suppl. 1), 167–171. doi: 10.1017/S1041610297004869
Babiloni, F., Mattia, D., Babiloni, C., Astolfi, L., Salinari, S., Basilisco, A.,et al. (2004). Multimodal integration of EEG, MEG and fMRI data for thesolution of the neuroimage puzzle. Magn. Reson. Imaging 22, 1471–1476.doi: 10.1016/j.mri.2004.10.007
Bajo, R., Castellanos, N. P., Cuesta, P., Aurtenetxe, S., Garcia-Prieto, J.,Gil-Gregorio, P., et al. (2012). Differential patterns of connectivityin progressive mild cognitive impairment. Brain Connect. 2, 21–24.doi: 10.1089/brain.2011.0069
Bajo, R., Maestú, F., Nevado, A., Sancho, M., Gutiérrez, R., Campo, P., et al. (2010).Functional connectivity in mild cognitive impairment during a memory task:implications for the disconnection hypothesis. J. Alzheimers Dis. 22, 183–193.doi: 10.3233/JAD-2010-100177
Bassett, D. S., and Bullmore, E. T. (2009). Human brain networksin health and disease. Curr. Opin. Neurol. 22, 340–347.doi: 10.1097/WCO.0b013e32832d93dd
Bassett, D. S., and Bullmore, E. T. (2017). Small-world brain networks revisited.Neuroscientist 23, 499–516. doi: 10.1177/1073858416667720
Bastos, A. M., and Schoffelen, J.-M. (2016). A tutorial review of functionalconnectivity analysis methods and their interpretational pitfalls. Front. Syst.Neurosci. 9:175. doi: 10.3389/fnsys.2015.00175
Berendse, H., Verbunt, J., Scheltens, P., Van Dijk, B., and Jonkman,E. (2000). Magnetoencephalographic analysis of cortical activity inAlzheimer’s disease: a pilot study. Clin. Neurophysiol. 111, 604–612.doi: 10.1016/S1388-2457(99)00309-0
Besthorn, C., Förstl, H., Geiger-Kabisch, C., Sattel, H., Gasser, T., and Schreiter-Gasser, U. (1994). EEG coherence in Alzheimer disease. Electroencephalogr.Clin. Neurophysiol. 90, 242–245. doi: 10.1016/0013-4694(94)90095-7
Blinowska, K. J. (2011). Review of the methods of determination of directedconnectivity from multichannel data. Med. Biol. Eng. Comput. 49, 521–529.doi: 10.1007/s11517-011-0739-x
Bola, M., and Sabel, B. A. (2015). Dynamic reorganization of brainfunctional networks during cognition. Neuroimage 114, 398–413.doi: 10.1016/j.neuroimage.2015.03.057
Borroni, B., Colciaghi, F., Corsini, P., Akkawi, N., Rozzini, L., Del Zotto, E.,et al. (2002). Early stages of probable Alzheimer disease are associated withchanges in platelet amyloid precursor protein forms. Neurol. Sci. 23, 207–210.doi: 10.1007/s100720200042
Breiman, L. (2001). Random forests. Mach. Learn. 45, 5–32.doi: 10.1023/A:1010933404324
Brookes, M. J., Hale, J. R., Zumer, J. M., Stevenson, C. M., Francis, S.T., Barnes, G. R., et al. (2011). Measuring functional connectivity usingMEG: methodology and comparison with fcMRI. Neuroimage 56, 1082–1104.doi: 10.1016/j.neuroimage.2011.02.054
Brookes, M. J., Tewarie, P. K., Hunt, B. A. E., Robson, S. E., Gascoyne, L. E.,Liddle, E. B., et al. (2016). Amulti-layer network approach toMEG connectivityanalysis. Neuroimage 132, 425–438. doi: 10.1016/j.neuroimage.2016.02.045
Bruña, R., Poza, J., Gómez, C., García, M., Fernández, A., and Hornero, R.(2012). Analysis of spontaneous MEG activity in mild cognitive impairmentand Alzheimer’s disease using spectral entropies and statistical complexitymeasures. J. Neural. Eng. 9:036007. doi: 10.1088/1741-2560/9/3/036007
Frontiers in Computational Neuroscience | www.frontiersin.org 18 August 2018 | Volume 12 | Article 60

Mandal et al. MEG and Brain Connectivity
Buldú, J. M., Bajo, R., Maestú, F., Castellanos, N., Leyva, I., Gil, P., et al. (2011).Reorganization of functional networks in mild cognitive impairment. PLoSONE 6:e19584. doi: 10.1371/journal.pone.0019584
Bullmore, E., and Sporns, O. (2009). Complex brain networks: graph theoreticalanalysis of structural and functional systems. Nat. Rev. Neurosci. 10, 186–198.doi: 10.1038/nrn2575
Buntine, W. (1991). “Theory refinement on Bayesian networks,” in Uncertainty
Proceedings 1991 (Moffet Field, CA: Elsevier), 52–60.Cheng, C. H.,Wang, P. N., Hsu,W. Y., and Lin, Y. Y. (2012). Inadequate inhibition
of redundant auditory inputs in Alzheimer’s disease: an MEG study. Biol.Psychol. 89, 365–373. doi: 10.1016/j.biopsycho.2011.11.010
Cichy, R. M., Khosla, A., Pantazis, D., Torralba, A., and Oliva, A. (2016a).Comparison of deep neural networks to spatio-temporal cortical dynamics ofhuman visual object recognition reveals hierarchical correspondence. Sci. Rep.6:27755. doi: 10.1038/srep27755.
Cichy, R. M., Pantazis, D., and Oliva, A. (2016b). Similarity-based fusion of MEGand fMRI reveals spatio-temporal dynamics in human cortex during visualobject recognition. Cereb. Cortex 26, 3563–3579.
Çiftçi, K. (2011). Minimum spanning tree reflects the alterations of the defaultmode network during Alzheimer’s disease. Ann. Biomed. Eng. 39, 1493–1504.doi: 10.1007/s10439-011-0258-9
Cohen, D. (1968). Magnetoencephalography: evidence of magnetic fields producedby alpha-rhythm currents. Science 161, 784–786.
Cohen, D. (1972). Magnetoencephalography: detection of the brain’s electricalactivity with a superconducting magnetometer. Science 175, 664–666.
Cover, T., and Hart, P. (1967). Nearest neighbor pattern classification. IEEE Trans.
Inf. Theor. 13, 21–27. doi: 10.1109/TIT.1967.1053964Daianu, M., Jahanshad, N., Nir, T. M., Toga, A. W., Jack, C. R., Weiner, M. W.,
et al. (2013). Breakdown of brain connectivity between normal aging andAlzheimer’s disease: a structural k-Core network analysis. Brain Connect. 3,407–422. doi: 10.1089/brain.2012.0137
Dalal, S. S., Zumer, J., Agrawal, V., Hild, K., Sekihara, K., and Nagarajan, S.(2004). NUTMEG: a neuromagnetic source reconstruction toolbox. Neurol.Clin. Neurophysiol. 2004:52.
de Haan, W., Mott, K., van Straaten, E.C., Scheltens, P., and Stam, C.J.(2012a). Activity dependent degeneration explains hub vulnerability inAlzheimer’s disease. PLoS Comput. Biol. 8:e1002582. doi: 10.1371/journal.pcbi.1002582.
de Haan, W., Stam, C. J., Jones, B. F., Zuiderwijk, I. M., van Dijk, B. W., andScheltens, P. (2008). Resting-state oscillatory brain dynamics in Alzheimerdisease. J. Clin. Neurophysiol. 25, 187–193. doi: 10.1097/wnp.0b013e31817da184
de Haan, W., van der Flier, W. M., Koene, T., Smits, L. L., Scheltens,P., and Stam, C. J. (2012b). Disrupted modular brain dynamics reflectcognitive dysfunction in Alzheimer’s disease. Neuroimage 59, 3085–3093.doi: 10.1016/j.neuroimage.2011.11.055
de Haan, W., van der Flier, W. M., Wang, H., Van Mieghem, P. F.,Scheltens, P., and Stam, C. J. (2012c). Disruption of functional brainnetworks in Alzheimer’s disease: what can we learn from graph spectralanalysis of resting-state magnetoencephalography? Brain Connect. 2, 45–55.doi: 10.1089/brain.2011.0043.
De Pasquale, F., Della Penna, S., Sporns, O., Romani, G., and Corbetta,M. (2016). Adynamic core network and global efficiency in the resting human brain. Cereb.Cortex 26, 4015–4033. doi: 10.1093/cercor/bhv185
Delbeuck, X., Van der Linden, M., and Collette, F. (2003). Alzheimer’diseaseas a disconnection syndrome? Neuropsychol. Rev. 13, 79–92.doi: 10.1023/A:1023832305702
Delorme, A., and Makeig, S. (2004). EEGLAB: an open source toolbox foranalysis of single-trial EEG dynamics including independent componentanalysis. J. Neurosci. Methods 134, 9–21. doi: 10.1016/j.jneumeth.2003.10.009
Deo, R. C. (2015). Machine learning in medicine. Circulation 132, 1920–1930.doi: 10.1161/circulationaha.115.001593
Desgranges, B., Baron, J. C., and Eustache, F. (1998). The functional neuroanatomyof episodic memory: the role of the frontal lobes, the hippocampalformation, and other areas. Neuroimage 8, 198–213. doi: 10.1006/nimg.1998.0359
Dickerson, B. C. (2007). Advances in functional magnetic resonance imaging:technology and clinical applications. Neurotherapeutics 4, 360–370.doi: 10.1016/j.nurt.2007.05.007
Dickie, D. A., Shenkin, S. D., Anblagan, D., Lee, J., Blesa Cabez, M., Rodriguez,D., et al. (2017). Whole brain magnetic resonance image atlases: A systematicreview of existing atlases and caveats for use in population imaging. Front.Neuroinform. 11:1. doi: 10.3389/fninf.2017.00001
Dimitriadis, S. I., Antonakakis, M., Simos, P., Fletcher, J. M., and Papanicolaou,A. C. (2017a). Data-driven topological filtering based on orthogonal minimalspanning trees: application to multigroup magnetoencephalography resting-state connectivity. Brain Connect. 7, 661–670. doi: 10.1089/brain.2017.0512
Dimitriadis, S. I., Salis, C., Tarnanas, I., and Linden, D. E. (2017b). Topologicalfiltering of dynamic functional brain networks unfolds informativechronnectomics: a novel data-driven thresholding scheme based onOrthogonal Minimal Spanning Trees (OMSTs). Front. Neuroinform. 11:28.doi: 10.3389/fninf.2017.00028
Drachman, D. A. (2006). Aging of the brain, entropy, and Alzheimer disease.Neurology 67, 1340–1352. doi: 10.1212/01.wnl.0000240127.89601.83
Engels, M. M. A., Hillebrand, A., van der Flier, W. M., Stam, C. J., Scheltens, P.,and van Straaten, E. C. (2016a). Slowing of hippocampal activity correlates withcognitive decline in early onset alzheimer’s disease. an meg study with virtualelectrodes. Front. Hum. Neurosci. 10:238. doi: 10.3389/fnhum.2016.00238
Engels, M. M. A., van der Flier, W. M., Stam, C. J., Hillebrand, A., Scheltens, P.,and van Straaten, E. C. W. (2017a). Alzheimer’s disease: the state of the artin resting-state magnetoencephalography. Clin. Neurophysiol. 128, 1426–1437.doi: 10.1016/j.clinph.2017.05.012
Engels, M. M. A., Yu, M., Arjan, H., Scheltens, P., van der Flier, W. M.,van Straaten, E. C. W., et al. (2016b). Meg Cross-Frequency Analysis inPatients with Alzheimer’s Disease. Alzheimers Dement. 12, P1087–P1088.doi: 10.1016/j.jalz.2016.06.2271
Engels, M. M. A., Yu, M., Stam, C. J., Gouw, A. A., van der Flier, W. M.,Scheltens, P., et al. (2017b). Directional information flow in patients withAlzheimer’s disease. a source-space resting-state MEG study. Neuroimage Clin.
15, 673–681. doi: 10.1016/j.nicl.2017.06.025Escudero, J., Hornero, R., Abásolo, D., and Fernández, A. (2009). Blind
source separation to enhance spectral and non-linear features ofmagnetoencephalogram recordings. Application to Alzheimer’s disease.Med. Eng. Phys. 31, 872–879. doi: 10.1016/j.medengphy.2009.04.003
Escudero, J., Hornero, R., Poza, J., Abásolo, D., and Fernández, A. (2008).Assessment of classification improvement in patients with Alzheimer’s diseasebased onmagnetoencephalogram blind source separation.Artif. Intell. Med. 43,75–85. doi: 10.1016/j.artmed.2008.01.001
Escudero, J., Sanei, S., Jarchi, D., Abásolo, D., and Hornero, R. (2011). Regionalcoherence evaluation in mild cognitive impairment and Alzheimer’s diseasebased on adaptively extracted magnetoencephalogram rhythms. Physiol. Meas.
32, 1163–1180. doi: 10.1088/0967-3334/32/8/011Fernández, A., Arrazola, J., Maestú, F., Amo, C., Gil-Gregorio, P., Wienbruch, C.,
et al. (2003). Correlations of hippocampal atrophy and focal low-frequency magnetic activity in Alzheimer disease: volumetric MRimaging-magnetoencephalographic study. Am. J. Neuroradiol. 24, 481–487.
Fernández, A., Hornero, R., Mayo, A., Poza, J., Gil-Gregorio, P.,and Ortiz, T. (2006a). MEG spectral profile in Alzheimer’sdisease and mild cognitive impairment. Clin. Neurophysiol. 117,306–314.doi: 10.1016/j.clinph.2005.10.017
Fernández, A., Maestú, F., Amo, C., Gil, P., Fehr, T., Wienbruch, C.,et al. (2002). Focal temporoparietal slow activity in Alzheimer’sdisease revealed by magnetoencephalography. Biol. Psychiatry 52,764–770.doi: 10.1016/S0006-3223(02)01366-5
Fernández, A., Turrero, A., Zuluaga, P., Gil, P., Maestú, F., Campo, P.,et al. (2006b). Magnetoencephalographic parietal delta dipole density inmild cognitive impairment: preliminary results of a method to estimatethe risk of developing Alzheimer disease. Arch. Neurol. 63, 427–430.doi: 10.1001/archneur.63.3.427
Fernández, A., Turrero, A., Zuluaga, P., Gil-Gregorio, P., del Pozo, F., Maestu,F., et al. (2013). MEG delta mapping along the healthy aging-Alzheimer’sdisease continuum: diagnostic implications. J. Alzheimers Dis. 35, 495–507.doi: 10.3233/JAD-121912
Frontiers in Computational Neuroscience | www.frontiersin.org 19 August 2018 | Volume 12 | Article 60

Mandal et al. MEG and Brain Connectivity
Folstein, M. F., Folstein, S. E., and McHugh, P .R. (1975). “Mini-mental state”: apractical method for grading the cognitive state of patients for the clinician. J.Psychiatric. Res. 12, 189–198.
Franciotti, R., Iacono, D., Della Penna, S., Pizzella, V., Torquati, K., Onofrj, M.,et al. (2006). Cortical rhythms reactivity in AD, LBD and normalsubjects: a quantitative MEG study. Neurobiol. Aging 27, 1100–1109.doi: 10.1016/j.neurobiolaging.2005.05.027
Friston, K.J. (1994). Functional and effective connectivity in neuroimaging: asynthesis. Hum. Brain Mapp. 2, 56–78. doi: 10.1002/hbm.460020107
Friston, K. J. (2011). Functional and effective connectivity: a review. Brain Connect.1, 13–36. doi: 10.1089/brain.2011.0008
Friston, K. J., Holmes, A. P., Worsley, K. J., Poline, J. P., Frith, C. D.,and Frackowiak, R. S. (1994). Statistical parametric maps in functionalimaging: a general linear approach. Hum. Brain Mapp. 2, 189–210.doi: 10.1002/hbm.460020402
Georgopoulos, A. P., Karageorgiou, E., Leuthold, A. C., Lewis, S. M., Lynch, J.K., Alonso, A. A., et al. (2007). Synchronous neural interactions assessed bymagnetoencephalography: a functional biomarker for brain disorders. J. NeuralEng. 4, 349–355. doi: 10.1088/1741-2560/4/4/001
Gloor, P., Ball, G., and Schaul, N. (1977). Brain lesions that produce delta waves inthe EEG. Neurology 27, 326–326. doi: 10.1212/WNL.27.4.326
Gómez, C., Hornero, R., Abásolo, D., Fernández, A., and Escudero, J. (2007b).Analysis of the magnetoencephalogram background activity in Alzheimer’sdisease patients with auto-mutual information. Comput. Methods Programs
Biomed. 87, 239–247. doi: 10.1016/j.cmpb.2007.07.001Gómez, C., Hornero, R., Abásolo, D., Fernández, A., and Escudero, J.
(2009a). Analysis of MEG background activity in Alzheimer’s diseaseusing nonlinear methods and ANFIS. Ann. Biomed. Eng. 37, 586–594.doi: 10.1007/s10439-008-9633-6
Gómez, C., Hornero, R., Abásolo, D., Fernández, A., and López, M.(2006a). Complexity analysis of the magnetoencephalogram backgroundactivity in Alzheimer’s disease patients. Med. Eng. Phys. 28, 851–859.doi: 10.1016/j.medengphy.2006.01.003
Gómez, C., Hornero, R., Abásolo, D., Fernandez, A., and Poza, J. (2009b). “Studyof the MEG background activity in Alzheimer’s disease patients with scalinganalysis methods,” in Annual International Conference of the IEEE Engineering
in Medicine and Biology Society, EMBC 2009 (Minneapolis, MN).Gomez, C., Hornero, R., Fernandez, A., Abasolo, D., Escudero, J., and Lopez, M.
(2006b). “Magnetoencephalogram background activity analysis in Alzheimer’sdisease patients using auto mutual information,” in 28th Annual International
Conference of the IEEE Engineering in Medicine and Biology Society, EMBS’06.
(New York, NY).Gómez, C., Hornero, R., Mediavilla, Á., Fernández, A., and Abásolo, D. (2008).
“Nonlinear forecasting measurement of magnetoencephalogram recordingsfrom Alzheimer’s disease patients,” in EMBS 2008, 30th Annual International
Conference of the IEEE Engineering in Medicine and Biology Society.Gómez, C., Juan-Cruz, C., Poza, J., Ruiz-Gómez, S. J., Gomez-Pilar, J., Núñez,
P., et al. (2017). Alterations of effective connectivity patterns in mildcognitive impairment: an meg study. J. Alzheimers Dis. doi: 10.3233/JAD-170475. [Epub ahead of print].
Gómez, C., Martínez-Zarzuela, M., Poza, J., Díaz-Pernas, F. J., Fernández, A.,and Hornero, R. (2012). “Synchrony analysis of spontaneous MEG activity inAlzheimer’s disease patients,” in 2012 Annual International Conference of the
IEEE Engineering in Medicine and Biology Society (EMBC) (San Diego, CA).Gómez, C., Mediavilla, A., Hornero, R., Abásolo, D., and Fernández, A.
(2009c). Use of the Higuchi’s fractal dimension for the analysis of MEGrecordings from Alzheimer’s disease patients. Med. Eng. Phys. 31, 306–313.doi: 10.1016/j.medengphy.2008.06.010
Gramfort, A., Luessi, M., Larson, E., Engemann, D. A., Strohmeier, D., Brodbeck,C., et al. (2014). MNE software for processing MEG and EEG data. Neuroimage
86, 446–460. doi: 10.1016/j.neuroimage.2013.10.027Gramfort, A., Papadopoulo, T., Olivi, E., and Clerc, M. (2010). OpenMEEG:
opensource software for quasistatic bioelectromagnetics. Biomed. Eng. Online
9:45. doi: 10.1186/1475-925X-9-45Granger, C.W. (1969). Investigating causal relations by econometric models and
cross-spectral methods. Econometrica 37, 424–438. doi: 10.2307/1912791Greicius, M. D., Flores, B. H., Menon, V., Glover, G. H., Solvason, H. B., Kenna,
H., et al. (2007). Resting-state functional connectivity in major depression:
abnormally increased contributions from subgenual cingulate cortex andthalamus. Biol. Psychiatry 62, 429–437. doi: 10.1016/j.biopsych.2006.09.020
Hall, E. L., Robson, S. E., Morris, P. G., and Brookes, M. J. (2014).The relationship between MEG and fMRI. Neuroimage 102, 80–91.doi: 10.1016/j.neuroimage.2013.11.005
Hall, E. L., Woolrich, M. W., Thomaz, C. E., Morris, P. G., and Brookes,M. J. (2013). Using variance information in magnetoencephalographymeasures of functional connectivity. Neuroimage 67, 203–212.doi: 10.1016/j.neuroimage.2012.11.011
Hämäläinen, M., Hari, R., Ilmoniemi, R. J., Knuutila, J., and Lounasmaa, O. V.(1993). Magnetoencephalography—theory, instrumentation, and applicationsto noninvasive studies of the working human brain. Rev. Modern Phys. 65:413.doi: 10.1103/RevModPhys.65.413
Hämäläinen, M. S., and Ilmoniemi, R. J. (1994). Interpreting magnetic fields ofthe brain: minimum norm estimates.Med. Biological. Eng. Comput. 32, 35–42.doi: 10.1007/BF02512476
Hillebrand, A., and Barnes, G. R. (2005). Beamformer analysis of MEG data. Int.Rev. Neurobiol. 68, 149–171. doi: 10.1016/S0074-7742(05)68006-3
Hillebrand, A., Barnes, G. R., Bosboom, J. L., Berendse, H. W., and Stam,C. J. (2012). Frequency-dependent functional connectivity within resting-state networks: an atlas-based MEG beamformer solution. Neuroimage 59,3909–3921. doi: 10.1016/j.neuroimage.2011.11.005
Hillebrand, A., Tewarie, P., van Dellen, E., Yu, M., Carbo, E. W., Douw, L.,et al. (2016). Direction of information flow in large-scale resting-statenetworks is frequency-dependent. Proc. Natl. Acad. Sci. U.S.A. 113, 3867–3872.doi: 10.1073/pnas.1515657113
Hincapié, A. S., Kujala, J., Mattout, J., Pascarella, A., Daligault, S.,Delpuech, C., et al. (2017). The impact of MEG source reconstructionmethod on source-space connectivity estimation: a comparison betweenminimum-norm solution and beamforming. Neuroimage 156, 29–42.doi: 10.1016/j.neuroimage.2017.04.038
Hornero, R., Abasolo, D., Escudero, J., and Gomez, C. (2009). Nonlinear analysisof electroencephalogram and magnetoencephalogram recordings in patientswith Alzheimer’s disease. Philos. Trans. A Math. Phys. Eng. Sci. 367, 317–336.doi: 10.1098/rsta.2008.0197
Horwitz, B., and Poeppel, D. (2002). How can EEG/MEG and fMRI/PET data becombined? Hum. Brain Mapp. 17, 1–3. doi: 10.1002/hbm.10057
Ishii, R., Canuet, L., Kurimoto, R., Ikezawa, K., Aoki, Y., Azechi, M., et al. (2010).Frontal shift of posterior alpha activity is correlated with cognitive impairmentin early Alzheimer’s disease: a magnetoencephalography-beamformer study.Psychogeriatrics 10, 138–143. doi: 10.1111/j.1479-8301.2010.00326.x
Ito, K., Sasaki, M., Takahashi, J., Uwano, I., Yamashita, F., Higuchi, S., et al.(2015). Detection of early changes in the parahippocampal and posteriorcingulum bundles during mild cognitive impairment by using high-resolutionmulti-parametric diffusion tensor imaging. Psychiatry Res. Neuroimaging 231,346–352. doi: 10.1016/j.pscychresns.2015.01.020
Jensen, O., and Vanni, S. (2002). A new method to identify multiple sourcesof oscillatory activity from magnetoencephalographic data. Neuroimage 15,568–574. doi: 10.1006/nimg.2001.1020
Josef Golubic, S., Aine, C. J., Stephen, J. M., Adair, J. C., Knoefel, J. E., andSupek, S. (2017).MEG biomarker of Alzheimer’s disease: absence of a prefrontalgenerator during auditory sensory gating. Hum. Brain Mapp. 38, 5180–5194.doi: 10.1002/hbm.23724
Juan-Cruz, C., Gómez, C., Poza, J., Fernández, A., and Hornero, R. (2017).“Assessment of effective connectivity in alzheimer’s disease usinggranger causality,” in Converging Clinical and Engineering Research on
Neurorehabilitation, Vol. II, eds J. Ibanez, J. Gonzalez-Vargas, J. M. Azorin,M. Akay, and J. Luis Pons (Segovia: Springer), 763–767.
Kiebel, S. J., Daunizeau, J., Phillips, C., and Friston, K. J. (2008).Variational Bayesian inversion of the equivalent current dipole modelin EEG/MEG. Neuroimage 39, 728–741. doi: 10.1016/j.neuroimage.2007.09.005
Kiebel, S. J., Tallon-Baudry, C., and Friston, K. J. (2005). Parametric analysisof oscillatory activity as measured with EEG/MEG. Hum. Brain Mapp. 26,170–177. doi: 10.1002/hbm.20153
Klimesch, W. (1999). EEG alpha and theta oscillations reflect cognitive andmemory performance: a review and analysis. Brain Res. Rev. 29, 169–195.doi: 10.1016/S0165-0173(98)00056-3
Frontiers in Computational Neuroscience | www.frontiersin.org 20 August 2018 | Volume 12 | Article 60

Mandal et al. MEG and Brain Connectivity
Klimesch, W., Doppelmayr, M., Russegger, H., Pachinger, T., and Schwaiger, J.(1998). Induced alpha band power changes in the human EEG and attention.Neurosci. Lett. 244, 73–76. doi: 10.1016/S0304-3940(98)00122-0
Koelewijn, L., Bompas, A., Tales, A., Brookes, M. J., Muthukumaraswamy,S. D., Bayer, A., et al. (2017). Alzheimer’s disease disrupts alpha and beta-band resting-state oscillatory network connectivity. Clin. Neurophysiol. 128,2347–2357. doi: 10.1016/j.clinph.2017.04.018
Kruskal, J. B. (1956). On the shortest spanning subtree of a graphand the traveling salesman problem. Proc. Am. Math. Soc. 7, 48–50.doi: 10.1090/S0002-9939-1956-0078686-7
Kujala, J., Jung, J., Bouvard, S., Lecaignard, F., Lothe, A., Bouet, R., et al.(2015). Gamma oscillations in V1 are correlated with GABA(A) receptordensity: A multi-modal MEG and Flumazenil-PET study. Sci. Rep. 5:16347.doi: 10.1038/srep16347
Langevin, F., and Vachey, C. (1995). Imaging of cerebral function: new trends inPET, MEG and MRI. J. Radiol. 76, 45–48.
Leuchter, A. F., Newton, T. F., Cook, I. A., Walter, D. O., Rosenberg-Thompson, S., and Lachenbruch, P. A. (1992). Changes in brain functionalconnectivity in Alzheimer-type and multi-infarct dementia. Brain 115,1543–1561. doi: 10.1093/brain/115.5.1543
Liu, Z., Ding, L., and He, B. (2006). Integration of EEG/MEG with MRI and fMRI.IEEE Eng. Med. Biol. Mag. 25, 46–53. doi: 10.1109/MEMB.2006.1657787
López,M. E., Bruna, R., Aurtenetxe, S., Pineda-Pardo, J. Á., Marcos, A., Arrazola, J.,et al. (2014a). Alpha-band hypersynchronization in progressive mild cognitiveimpairment: a magnetoencephalography study. J. Neurosci. 34, 14551–14559.doi: 10.1523/JNEUROSCI.0964-14.2014
López, M. E., Cuesta, P., Garcés, P., Castellanos, P. N., Aurtenetxe, S., Bajo, R., et al.(2014b). MEG spectral analysis in subtypes of mild cognitive impairment. Age36:9624. doi: 10.1007/s11357-014-9624-5
López, M. E., Engels, M. M. A., van Straaten, E. C. W., Bajo, R., Delgado, M.L., Scheltens, P., et al. (2017a). MEG beamformer-based reconstructions offunctional networks in mild cognitive impairment. Front. Aging Neurosci.
9:107. doi: 10.3389/fnagi.2017.00107López-Sanz, D., Bruña, R., Garcés, P., Camara, C., Serrano, N., Rodríguez-
Rojo, I., et al. (2016). Alpha band disruption in the AD-continuum startsin the Subjective Cognitive Decline stage: a MEG study. Sci. Rep. 6:37685.doi: 10.1038/srep37685
López-Sanz, D., Bruña, R., Garcés, P., Martín-Buro, M. C., Walter, S., Delgado,M. L., et al. (2017). Functional connectivity disruption in subjective cognitivedecline andmild cognitive impairment: a common pattern of alterations. Front.Aging Neurosci. 9:109. doi: 10.3389/fnagi.2017.00109
Maestú, F., Arrazola, J., Fernández, A., Simos, P. G., Amo, C., Gil-Gregorio, P.,et al. (2003). Do cognitive patterns of brain magnetic activity correlate withhippocampal atrophy in Alzheimer’s disease? J. Neurol. Neurosurg. Psychiatry74, 208–212. doi: 10.1136/jnnp.74.2.208
Maestú, F., Campo, P., Del Río, D., Moratti, S., Gil-Gregorio, P., Fernández,A., et al. (2008). Increased biomagnetic activity in the ventral pathwayin mild cognitive impairment. Clin. Neurophysiol. 119, 1320–1327.doi: 10.1016/j.clinph.2008.01.105
Maestu, F., Garcia-Segura, J., Ortiz, T., Montoya, J., Fernandez, A., Gil-Gregorio,P., et al. (2005). Evidence of biochemical and biomagnetic interactions inAlzheimer’s disease: an MEG and MR spectroscopy study. Dement. Geriatr.
Cogn. Disord. 20, 145–152. doi: 10.1159/000087062Maestú, F., Peña, J.-M., Garcés, P., González, S., Bajo, R., Bagic, A., et al. (2015).
A multicenter study of the early detection of synaptic dysfunction in MildCognitive Impairment using Magnetoencephalography-derived functionalconnectivity. Neuroimage Clin. 9, 103–109. doi: 10.1016/j.nicl.2015.07.011
Mandal, P. K., Saharan, S., Tripathi, M., and Murari, G. (2015). Brain glutathionelevels – a novel biomarker for Mild Cognitive Impairment and Alzheimer’sDisease. Biol. Psychiatry 78, 702–710. doi: 10.1016/j.biopsych.2015.04.005
Maris, E., and Oostenveld, R. (2007). Nonparametric statistical testingof EEG- and MEG-data. J. Neurosci. Methods 164, 177–190.doi: 10.1016/j.jneumeth.2007.03.024
Micanovic, C., and Pal, S. (2014). The diagnostic utility of EEG in early-onsetdementia: a systematic review of the literature with narrative analysis. J. NeuralTrans. 121, 59–69. doi: 10.1007/s00702-013-1070-5
Montez, T., Poil, S. S., Jones, B. F., Manshanden, I., Verbunt, J. P., van Dijk, B.W., et al. (2009). Altered temporal correlations in parietal alpha and prefrontal
theta oscillations in early-stage Alzheimer disease. Proc. Natl. Acad. Sci. U.S.A.106, 1614–1619. doi: 10.1073/pnas.0811699106
Morris, J. C. (1993). The Clinical Dementia Rating (CDR): current version andscoring rules. Neurology 43, 2412–2414. doi: 10.1212/WNL.43.11.2412-a
Muthukumaraswamy, S. D. (2014). The use of magnetoencephalography inthe study of psychopharmacology (pharmaco-MEG). J. Psychopharmacol. 28,815–829. doi: 10.1177/0269881114536790
Muthuraman, M., Moliadze, V., Mideksa, K. G., Anwar, A. R., Stephani, U.,Deuschl, G., et al. (2015). EEG-MEG integration enhances the characterizationof functional and effective connectivity in the resting state network. PLoS ONE10:e0140832. doi: 10.1371/journal.pone.0140832
Nasreddine, Z. S., Phillips, N. A., Bédirian, V., Charbonneau, S., Whitehead, V.,Collin, I., et al. (2005). The Montreal Cognitive Assessment, MoCA: a briefscreening tool for mild cognitive impairment. J. Am. Geriatr. Soc. 53, 695–699.doi: 10.1111/j.1532-5415.2005.53221.x
NeuroScan, C. (2017). Curry 7 – Signal Processing, Basic & Advanced Source
Analysis. VIC: Compumedics Limited.Ng, A. Y., and Jordan, M. I. (2002). “On discriminative vs. generative classifiers:
a comparison of logistic regression and naive bayes,” in Advances in Neural
Information Processing Systems (Berkeley, CA: University of California)841–848.
Oostenveld, R., Fries, P., Maris, E., and Schoffelen, J.-M. (2011). FieldTrip:open source software for advanced analysis of MEG, EEG, andinvasive electrophysiological data. Comput. Intell. Neurosci. 2011:156869.doi: 10.1155/2011/156869
Ortiz-Alonso, T., Amo, C., Martin-Llorente, C., Maestu, F., and Fernandez-Lucas, A. (2003). Magnetoencephalographic study in patients with cognitiveimpairment. Rev. Neurol. 36, 307–310.
Osipova, D., Ahveninen, J., Jensen, O., Ylikoski, A., and Pekkonen, E.(2005). Altered generation of spontaneous oscillations in Alzheimer’s disease.Neuroimage 27, 835–841. doi: 10.1016/j.neuroimage.2005.05.011
Osipova, D., Rantanen, K., Ahveninen, J., Ylikoski, R., Häppölä, O.,Strandberg, T., et al. (2006). Source estimation of spontaneous MEGoscillations in mild cognitive impairment. Neurosci. Lett. 405, 57–61.doi: 10.1016/j.neulet.2006.06.045
Pereda, E., Quiroga, R. Q., and Bhattacharya, J. (2005). Nonlinear multivariateanalysis of neurophysiological signals. Prog. Neurobiol. 77, 1–37.doi: 10.1016/j.pneurobio.2005.10.003
Peyk, P., De Cesarei, A., and Junghöfer, M. (2011).ElectroMagnetoEncephalography software: overview and integrationwith other EEG/MEG toolboxes. Comput. Intell. Neurosci. 2011:861705.doi: 10.1155/2011/861705
Pineda-Pardo, J. A., Bruña, R., Woolrich, M., Marcos, A., Nobre, A. C.,Maestú, F., et al. (2014). Guiding functional connectivity estimationby structural connectivity in MEG: an application to discriminationof conditions of mild cognitive impairment. Neuroimage 101, 765–777.doi: 10.1016/j.neuroimage.2014.08.002
Piotrowski, T., Nikadon, J., and Gutierrez, D. (2017). Reconstruction ofbrain activity from EEG/MEG using MV-PURE framework. arXiv preprint
arXiv:1712.02997.Poza, J., Gómez, C., García, M., Corralejo, R., Fernández, A., and Hornero,
R. (2014). Analysis of neural dynamics in mild cognitive impairment andAlzheimer’s disease using wavelet turbulence. J. Neural Eng. 11:026010.doi: 10.1088/1741-2560/11/2/026010
Poza, J., Hornero, R., Abásolo, D., Fernandez, A., and Escudero, J. (2007a).“Analysis of spontaneous MEG activity in patients with Alzheimer’s diseaseusing spectral entropies,” in 29th Annual International Conference of the, IEEE
Engineering in Medicine and Biology Society, EMBS 2007 (Lyon).Poza, J., Hornero, R., Abásolo, D., Fernández, A., and García, M. (2007b).
Extraction of spectral based measures from MEG background oscillationsin Alzheimer’s disease. Med. Eng. Phys. Valladolid, 29, 1073–1083.doi: 10.1016/j.medengphy.2006.11.006
Poza, J., Hornero, R., Escudero, J., Fernandez, A., andGomez, C. (2008a). “Analysisof spontaneous MEG activity in Alzheimer’s disease using time-frequencyparameters,” in 30th Annual International Conference of the IEEE Engineering
in Medicine and Biology Society, EMBS 2008 (Vancouver, BC).Poza, J., Hornero, R., Escudero, J., Fernández, A., and Sánchez, C. I.
(2008b). Regional analysis of spontaneous MEG rhythms in patients with
Frontiers in Computational Neuroscience | www.frontiersin.org 21 August 2018 | Volume 12 | Article 60

Mandal et al. MEG and Brain Connectivity
Alzheimer’s disease using spectral entropies. Ann. Biomed. Eng. 36, 141–152.doi:10.1007/s10439-007-9402-y
Prim, R. C. (1957). Shortest connection networks and some generalizations. BellLabs Tech. J. 36, 1389–1401. doi: 10.1002/j.1538-7305.1957.tb01515.x
Quinlan, J. R. (1993). Constructing decision tree. C4 5, 17–26.doi: 10.1016/B978-0-08-050058-4.50007-3
Raichle, M. E., MacLeod, A. M., Snyder, A. Z., Powers, W. J., Gusnard, D. A., andShulman, G. L. (2001). A default mode of brain function. Proc. Nat. Acad. Sci.98, 676–682. doi: 10.1073/pnas.98.2.676
Rajapakse, J. C., and Cichocki, A. (2002). “Independent component analysis andbeyond in brain imaging: EEG, MEG, fMRI, and PET,” in Neural Information
Processing, (2002). ICONIP’02. Proceedings of the 9th International Conference
on: IEEE (Singapore).Ranasinghe, K. G., Hinkley, L. B., Beagle, A. J., Mizuiri, D., Dowling, A. F., Honma,
S. M., et al. (2014). Regional functional connectivity predicts distinct cognitiveimpairments in Alzheimer’s disease spectrum. Neuroimage Clin. 5, 385–395.doi: 10.1016/j.nicl.2014.07.006
Rutter, L., Nadar, S. R., Holroyd, T., Carver, F. W., Apud, J., Weinberger, D. R.,et al. (2013). Graph theoretical analysis of resting magnetoencephalographicfunctional connectivity networks. Front. Comput. Neurosci. 7:93.doi: 10.3389/fncom.2013.00093
Sakkalis, V. (2011). Review of advanced techniques for the estimation of brainconnectivity measured with EEG/MEG. Comput. Biol. Med. 41, 1110–1117.doi: 10.1016/j.compbiomed.2011.06.020
Sekihara, K., Nagarajan, S. S., Poeppel, D., Marantz, A., and Miyashita, Y.(2001). Reconstructing spatio-temporal activities of neural sources using anMEG vector beamformer technique. IEEE Trans. Biomed. Eng. 48, 760–771.doi: 10.1109/10.930901
Sharon, D., Hämäläinen, M. S., Tootell, R. B., Halgren, E., and Belliveau,J. W. (2007). The advantage of combining MEG and EEG: comparisonto fMRI in focally stimulated visual cortex. Neuroimage 36, 1225–1235.doi: 10.1016/j.neuroimage.2007.03.066
Silva Pereira, S., Hindriks, R., Mühlberg, S., Maris, E., van Ede, F.,Griffa, A., et al. (2017). Effect of field spread on resting-statemagneto encephalography functional network analysis: a computationalmodeling study. Brain Connect. 7, 541–557. doi: 10.1089/brain.2017.0525
Solomon, P. R., and Pendlebury,W.W. (1998). Recognition of Alzheimer’s disease:the 7 Minute Screen. Fam. Med. 30, 265–271.
Song, X., Clarke, M., Bardouille, T., Darvesh, S., Fisk, J., Beyea, S., et al.(2014). Changes in prefrontal activation in early Alzheimer’s Disease: amagnetoencephalography (Meg) study. Alzheimer’s Dement. 10, P403–P404.doi: 10.1016/j.jalz.2014.05.501
Stam, C. J. (2004). Functional connectivity patterns of humanmagnetoencephalographic recordings: a ‘small-world’network? Neurosci.
Lett. 355, 25–28. doi: 10.1016/j.neulet.2003.10.063Stam, C. J. (2005). Nonlinear dynamical analysis of EEG and MEG:
review of an emerging field. Clin. Neurophysiol. 116, 2266–2301.doi: 10.1016/j.clinph.2005.06.011
Stam, C. J., de Haan, W., Daffertshofer, A., Jones, B. F., Manshanden, I., vanCappellen van Walsum, A. M., et al. (2009). Graph theoretical analysis ofmagnetoencephalographic functional connectivity in Alzheimer’s disease. Brain132, 213–224. doi: 10.1093/brain/awn262
Stam, C. J., Jones, B. F., Manshanden, I., van Cappellen van Walsum, A.M., Montez, T., Verbunt, J. P., et al. (2006). Magnetoencephalographicevaluation of resting-state functional connectivity in Alzheimer’sdisease. Neuroimage 32, 1335–1344. doi: 10.1016/j.neuroimage.2006.05.033
Stam, C. J., vanWalsum, A.M. C., Pijnenburg, Y. A., Berendse, H.W., deMunck, J.C., Scheltens, P., et al. (2002). Generalized synchronization of MEG recordingsin Alzheimer’s disease: evidence for involvement of the gamma band. J. Clin.Neurophysiol. 19, 562–574.
Suykens, J. A., and Vandewalle, J. (1999). Least squares support vector machineclassifiers. Neural Process. Lett. 9, 293–300. doi: 10.1023/A:1018628609742
Tadel, F., Baillet, S., Mosher, J. C., Pantazis, D., and Leahy, R. M. (2011).Brainstorm: a user-friendly application for MEG/EEG analysis. Comput. Intell.
Neurosci. 2011:879716. doi: 10.1155/2011/879716
Tallon-Baudry, C., and Bertrand, O. (1999). Oscillatory gamma activity inhumans and its role in object representation. Trends Cogn. Sci. 3, 151–162.doi: 10.1016/S1364-6613(99)01299-1
Teplan, M. (2002). Fundamentals of EEG measurement.Meas. Sci. Rev. 2, 1–11.Tewarie, P., Hillebrand, A., van Dijk, B. W., Stam, C. J., O’Neill, G. C., Van
Mieghem, P., et al. (2016). Integrating cross-frequency and within bandfunctional networks in resting-state MEG: a multi-layer network approach.Neuroimage 142, 324–336. doi: 10.1016/j.neuroimage.2016.07.057
Tewarie, P., van Dellen, E., Hillebrand, A., and Stam, C. J. (2015). The minimumspanning tree: an unbiasedmethod for brain network analysis.Neuroimage 104,177–188. doi: 10.1016/j.neuroimage.2014.10.015
Towle, V. L., Bolaños, J., Suarez, D., Tan, K., Grzeszczuk, R., Levin, D. N., et al.(1993). The spatial location of EEG electrodes: locating the best-fitting sphererelative to cortical anatomy. Electroencephalogr. Clin. Neurophysiol. 86, 1–6.doi: 10.1016/0013-4694(93)90061-Y
Unger, M., Marschallinger, J., Kaindl, J., Höfling, C., Rossner, S., Heneka, M.T., et al. (2016). Early changes in hippocampal neurogenesis in transgenicmouse models for Alzheimer’s Disease. Mol. Neurobiol. 53, 5796–5806.doi: 10.1007/s12035-016-0018-9
Uutela, K., Hämäläinen, M., and Somersalo, E. (1999). Visualization ofmagnetoencephalographic data usingminimum current estimates.NeuroImage
10, 173–180. doi: 10.1006/nimg.1999.0454van Walsum, A.-M. v. C., Pijnenburg, Y., Berendse, H., van Dijk, B., Knol,
D., Scheltens, P., et al. (2003). A neural complexity measure appliedto MEG data in Alzheimer’s disease. Clin. Neurophysiol. 114, 1034–1040.doi: 10.1016/S1388-2457(03)00072-5
van Wijk, B. C. M., Stam, C. J., and Daffertshofer, A. (2010). Comparing brainnetworks of different size and connectivity density using graph theory. PLOSONE 5:e13701. doi: 10.1371/journal.pone.0013701
Velmurugan, J., Sinha, S., and Satishchandra, P. (2014). Magnetoencephalographyrecording and analysis. Ann. Indian Acad. Neurol. 17, S113–119.doi: 10.4103/0972-2327.128678
Verdoorn, T. A., McCarten, J. R., Arciniegas, D. B., Golden, R., Moldauer, L.,Georgopoulos, A., et al. (2011). Evaluation and tracking of Alzheimer’s diseaseseverity using resting-state magnetoencephalography. J. Alzheimers Dis. 26
Suppl. 3, 239–255. doi: 10.3233/JAD-2011-0056Walla, P., Püregger, E., Lehrner, J., Mayer, D., Deecke, L., and Dal Bianco, P.
(2005). Depth of word processing in Alzheimer patients and normal controls:a magnetoencephalographic (MEG) study. J. Neural Transm. 112, 713–730.doi: 10.1007/s00702-004-0215-y
Wang, K., Liang, M., Wang, L., Tian, L., Zhang, X., Li, K., et al. (2007). Alteredfunctional connectivity in early Alzheimer’s disease: a resting-state fMRI study.Hum. Brain Mapp. 28, 967–978. doi: 10.1002/hbm.20324
Watts, D. J., and Strogatz, S. H. (1998). Collective dynamics of ‘small-world’networks. Nature 393, 440–442.
Wortmann, M. (2012). Dementia: a global health priority-highlights from anADI and World Health Organization report. Alzheimers Res. Ther. 4:40.doi: 10.1186/alzrt143
Yu, M., Engels, M. M. A., Hillebrand, A., van Straaten, E. C. W., Gouw, A. A.,Teunissen, C., et al. (2017). Selective impairment of hippocampus and posteriorhub areas in Alzheimer’s disease: anMEG-basedmultiplex network study. Brain140, 1466–1485. doi: 10.1093/brain/awx050
Zanin, M., Papo, D., Sousa, P. A., Menasalvas, E., Nicchi, A., Kubik, E., et al. (2016).Combining complex networks and data mining: why and how. Phys. Rep. 635,1–44. doi: 10.1016/j.physrep.2016.04.005
Conflict of Interest Statement: The authors declare that the research wasconducted in the absence of any commercial or financial relationships that couldbe construed as a potential conflict of interest.
Copyright © 2018 Mandal, Banerjee, Tripathi and Sharma. This is an open-access
article distributed under the terms of the Creative Commons Attribution License (CC
BY). The use, distribution or reproduction in other forums is permitted, provided
the original author(s) and the copyright owner(s) are credited and that the original
publication in this journal is cited, in accordance with accepted academic practice.
No use, distribution or reproduction is permitted which does not comply with these
terms.
Frontiers in Computational Neuroscience | www.frontiersin.org 22 August 2018 | Volume 12 | Article 60