Embed Size (px)
Citation preview
San FranciscoHuman Services Network
A Comprehensive Profile of San Francisco’s Nonprofit Human Service Providers
San Francisco Urban Institute • San Francisco State University
SF Human Services Network — A Comprehensive Profile of San Francisco’s Nonprofit Human Service Providers
San Francisco Urban Institute/San Francisco State University
SF Urban Institute
A Comprehensive Profile of San Francisco’s Nonprofit Human Service Providers
San Francisco State University
Prepared for the SF Human Services NetworkMarch 2002
By M. Brian Murphy, Principal InvestigatorSF Urban Institute
Survey Design and Research: Lisel Blash, Senior Researcher
Public Research Institute
San Francisco Urban InstituteSan Francisco State UniversityLakeview Center 1311600 Holloway AvenueSan Francisco, CA 94132-4027(415)[email protected] www.sfsu.edu/~urbins
SF Human Services Network — A Comprehensive Profile of San Francisco’s Nonprofit Human Service Providers
San Francisco Urban Institute/San Francisco State University
About the San Francisco Human Services Network
The San Francisco Human Services Network (HSN) is a public policy association of over 70 community-based nonprofit agencies dedicated toimproving the delivery of health and human services to disadvantaged San Franciscans. Since 1998, HSN has worked to strengthen the partnership between nonprofit agencies and the City to promote a moreeffective voice for community organizations in public policymaking.HSN has played a leadership role on such issues as Sunshine Ordinancerequirements for nonprofits, Living Wage and Living Health legislation,cost-of-living adjustments in nonprofit contracts with the City, andstreamlining the contracting and monitoring process. HSN hosts monthly general membership meetings, which include briefings and dialogues between member agencies and City policymakers. HSN alsoco-sponsors the annual “New Realities” public policy conference.
San Francisco Human Services Network3310 Geary Blvd.San Francisco, CA 94118
Telephone: (415) 668-0433Fax: (415) 668-0631E-mail: [email protected]
The San Francisco Human Services Network wishes to thank the following funders for their support of A Comprehensive Profile of San Francisco’s Nonprofit Human Service Providers:
California Wellness FoundationCandelaria FundWallace Alexander Gerbode FoundationEvelyn and Walter Haas, Jr. FundWalter and Elise Haas FundMcKesson FoundationNorthern California GrantmakersVan Loben Sels FoundationZellerbach Family Fund
Report designed by Fox Parlor, www.foxparlor.com
SF Human Services Network — A Comprehensive Profile of San Francisco’s Nonprofit Human Service Providers
Page iSan Francisco Urban Institute/San Francisco State University
Executive SummarySan Francisco’s Nonprofit Human Service Providers
San Francisco Urban Institute San Francisco State Universityprepared for the San Francisco Human Services Network
Introduction:
San Francisco’s nonprofit health and human service organizations offer support and assistance to the young, the elderly, the poor, displaced or unemployed families, andthose at risk from drugs, homelessness, violence, or HIV/AIDS. Often under contractwith City and County agencies, nonprofit providers leverage substantial additional funding from state, federal, corporate, foundation and private sources. In a city whosecommitment to human services is nationally recognized, the nonprofit providers areessential to a community-based strategy, one sensitive to the city’s ethnic, cultural, linguistic and social diversity.
The San Francisco Urban Institute, in collaboration with the Public Research Institute at San Francisco State University, and on behalf of the San Francisco Human ServicesNetwork, conducted a survey of San Francisco’s nonprofit human service providers inSummer, 2001. Survey questionnaires were mailed to 272 nonprofit service providerscontracting with the City and County and completed by 169 eligible organizations, aresponse rate of 62%. This survey provides the first comprehensive overview of the non-profit human service sector in San Francisco.
The nonprofit human service providers are located throughout the city, with sites reaching into every neighborhood and community. Often serving the most vulnerableSan Franciscans, nonprofits operate community health and mental health clinics, offerHIV counseling and referrals, provide shelter and counseling for homeless youth andadults, offer in-home health services, job training, childcare, nutrition, and after-schooleducation programs, critical services to the elderly and immigrants, and access to affordable housing.
Budget and Clients:
The Executive Summary for A Comprehensive Profile of San Francisco’s NonprofitHuman Service Providers highlights key principles and findings of the study, whichwere presented at the SF Human Services Network 3rd Annual Nonprofit PublicPolicy Conference, New Realities 3: Building a Healthy Human Service Partnershipfor San Franciscans, October 24, 2001.
Based on the survey, we estimate that nonprofit human service providers had anaggregate budget of over $773,000,000 in fiscal year 2000 – 2001. San Francisco nonprofit human service agencies received over $314,000,000 from the City andCounty of San Francisco during the 2000 – 2001 fiscal year, from the City’s estimated total expenditure of $1.45 billion for health and human services.
Nonprofit providers matched the City and County’s contribution with over$459,000,000 in additional funds—from federal and state grants, donations anddues, and corporate and foundation funding. The nonprofit human service providersmatched every city dollar they received with an additional $1.50 in non-city funds.
Individual contributions alone totaled over $81,000,000 during the reportingperiod, equaling 26% of the City and County funding. Corporate and Foundationgrants provided an additional $105,000,000 while federal and state grants provided $130,000,000.
Based on survey responses, the nonprofit providers reach over 970,000 clients eachyear. The survey revealed a wide variety of clients and kinds of service. Some client “contacts” were one-time telephone hot-line calls; others were unemployed persons taking six-week training programs. The 970,000 reported client “contacts” do not represent that many individuals, of course, as thousands of San Franciscans receive multiple services from multiple agencies (and are reported by each). Someone with HIV may receive crucial services from five or six agencies; a homeless youth may be seenby three agencies for quite different services, ranging from shelter care to medical care.
By far the largest budget expenditure in the nonprofit sector is in personnel—salariesand benefits for the skilled men and women providing professional and para-professionalservices that reach clients. The nonprofit human service providers employ over15,000 staff, and enroll an additional 1,007 “client trainees” in the provision of services. This number does not include the estimated 7,200 persons who provide in-home support services through the In-Home Supportive Services Consortium, a quasi-public nonprofit agency. Annual staff salaries and benefits for San Francisco’snonprofit service providers total over $463,500,000. 95.6% of the human servicenonprofits offer health benefits to all of their full-time employees. 44% of all non-profits with 100 or more employees are unionized, while 16% of those respondingwho had 51 to 99 employees are unionized.
San Francisco’s nonprofit service providers face a common set of challenges, particularlyin a period of economic downturn. 49.7% reported that their largest single problemwas adequate funding, especially in light of escalating caseloads and the need for skilled
SF Human Services Network — A Comprehensive Profile of San Francisco’s Nonprofit Human Service Providers
Page iiSan Francisco Urban Institute/San Francisco State University
Staffing:
Challenges:
SF Human Services Network — A Comprehensive Profile of San Francisco’s Nonprofit Human Service Providers
Page iiiSan Francisco Urban Institute/San Francisco State University
staff. 42.9% of organizations surveyed reported serious problems in finding andretaining trained staff, particularly given the cost of living in San Francisco.
Over 20% reported serious difficulty in securing and keeping affordable facilities,even though the nonprofit service providers are among the most stable nonprofit organizations in San Francisco. Over 45% of human service organizations own one or more of their own facilities, 49% (1,665,439 square feet) of the total3,370,842 square feet utilized, giving important security to a sizable share of the sector. (This compares for example, with CompassPoint’s estimate that 13% of allSan Francisco nonprofit agencies—including arts, environmental, research and advocacyorganizations—own their own facilities). This relatively greater stability issues from thesector’s longevity; the majority of these agencies came into being during two periods: the anti-poverty struggles of the seventies and the HIV/AIDS crisis of the 80s.
Another 8% report significant difficulties in negotiating the contract process with theCity and County of San Francisco. 6.3% cited the cost of doing business with the city as a critical challenge. Some nonprofits reported a level of frustration serious enough tocause them to question continuing to contract with the City and County, while otherssimply wished for a common set of contracting procedures across city agency lines.
Even before September 11, 2001, the survey revealed widespread anxiety about the adequacy of public and private funding for human services in San Francisco. Theannouncement of serious budget shortfalls in the City and County, combined with an anticipated diversion of federal funds from human services to the war on terrorism,increases the sector’s fear that funding cuts will mean significant reductions in services to the poor and vulnerable.
Conclusion:
SF Human Services Network — A Comprehensive Profile of San Francisco’s Nonprofit Human Service Providers
Page 1San Francisco Urban Institute/San Francisco State University
San Francisco’s nonprofit health and human service organizations offer supportand assistance to the young, the elderly, the poor, displaced or unemployed families, or those at risk from drugs, homelessness, violence, or HIV/AIDS.
Often under contract with City and County agencies, nonprofit providers leveragesubstantial additional funding from state, federal, corporate, foundation and privatesources. In a city whose commitment to human services is nationally recognized, thenonprofit providers are essential to a community-based strategy, one sensitive to thecity’s ethnic, cultural, linguistic and social diversity.
The San Francisco Urban Institute, in collaboration with the Public Research Instituteat San Francisco State University, and on behalf of the San Francisco Human ServicesNetwork (HSN), conducted a survey of San Francisco’s nonprofit human serviceproviders in summer, 2001. Survey questionnaires were mailed to 272 nonprofit service providers contracting with the City and County of San Francisco and complet-ed by 169 eligible organizations, a response rate of 62%. This is a very significantresponse rate, and forms the basis for reasonable extrapolations from survey responsesto the entire sector. Most critically, the response rate for large organizations was over85%, and gave us very reliable numbers on several critical issues.
The survey questionnaire was developed through discussions between university analysts and representatives of the San Francisco Human Services Network, andsought to illuminate several critical dimensions of the nonprofit human services in San Francisco. Principal among these issues was the basic dimensions of the sector: its size (measured by budgets, clients, employees), and the degree to which these organizations generated non-city monies while they contracted with the city toprovide services. The survey also sought information on the demographics of clientsand staff, and on those issues deemed most critical for the future of the organizationssurveyed. Finally, the survey provided data on the spatial distribution of services acrossSan Francisco’s many neighborhoods.
While our aim was to explore a broad range of critical issues, the survey was notexhaustive, and there are many issues that will require further analysis—either acrosstime, or in greater detail. But as a preliminary instrument, the survey provided thefirst comprehensive overview of a group of organizations long called upon and
San Francisco Human Services Network
A Comprehensive Profile of San Francisco’s Nonprofit Human Service Providers
San Francisco Urban Institute/San Francisco State University
Introduction:
SF Human Services Network — A Comprehensive Profile of San Francisco’s Nonprofit Human Service Providers
Page 2San Francisco Urban Institute/San Francisco State University
admired for their services, their creativity, and their responsiveness to the needs of San Franciscans.
At first glance it is surprising that no such work was previously undertaken, particularly in light of the magnitude and variety of services, the number of clients,and the budgets of these agencies. But the absence of aggregate data about the sectorsimply reflects a political and historical fact about those agencies that form it. It wasnot until recently that San Francisco’s human service providers understood themselvesto be a “sector,” or understood that they might share interests across the boundaries ofdifferent service areas (the homeless, mental health, youth services, etc.). Different agencies developed at different times, often serving different communities, or serving the same community through a different methodological or political lens. Or, while some agencies servingsimilar clients or communities might have developed concurrently (e.g., the variety of organizations which emerged to fight HIV/AIDS,or the organizations who work on homelessness),they may have quite different funding sources, citycontracts, or ideological perspectives.
The survey represents, then, a particular “moment” in the development of the nonprofit human services as a sector, and in the development of the relationshipbetween nonprofit human service providers and the City and County of SanFrancisco. Most critically, the survey reveals that many of these agencies share quitecommon dilemmas, and face a common crisis in funding, staffing, facilities, and contracting. Moreover, these agencies increasingly understand that answers to thesedilemmas and crises are not likely to be found in the actions of individual agenciesdivorced from one another.
This understanding is also prompted, paradoxically, by the particularly robust economic period through which San Francisco has just come. During a time of rapideconomic expansion, the development of new industries and new modes of work, and the consequent expansion of city budgets and services, San Francisco’s nonprofithuman service providers found themselves caught in two fundamental contradictions.First, even in the midst of growth and high employment, the need for services stayedhigh, or grew. The new markets for technology and business services did not mean lessdemand for those human services not traditionally reached through markets. Indeed,some of the side effects of economic development increased the need for certain services, particularly in housing, job preparation, and family health.
Second, the sudden rise in the cost of living and doing business in San Franciscomeant a host of new pressures for nonprofits. The cost of leasing or renting space escalated for agencies that did not own their facilities or enjoy long-term lease stability.(One of the happier findings in the survey was that a sizeable number of these agencies do, in fact, own their own facilities; that is, however, cold comfort to thosewho do not). And the rapid rise in the cost of housing meant sudden new pressures onagencies unable to attract or keep staff, or keep salaries in line with escalating costs.This was especially critical insofar as many agencies depend on staff who live in andknow particular neighborhoods and communities.
...the survey reveals that many of these agencies share quite common dilemmas,and face a common crisis in funding,staffing, facilities, and contracting.
SF Human Services Network — A Comprehensive Profile of San Francisco’s Nonprofit Human Service Providers
Page 3San Francisco Urban Institute/San Francisco State University
In this context, then, the Human Services Network became a forum within whichagencies could share experiences, seek some common ground, and look for answers.HSN had been organized to facilitate the development of collective strategies amonghuman service providers. Similarly, within the clusters of organizations groupedaround particular city agencies—already sharing some common histories—there was discussion over ways the crisis of funding and facilities could be addressed. And as the housing/facilities crisis grew, particularly between 1997 and 2001, many organizations concluded that answers might only be found in public policies, not inindividual organizations scrambling for separate solutions.
There was a movement, then, from crisis to public policy, in a setting where thehuman service providers had never acted together, had little experience in craftingcommon answers to organizational difficulties, and did not have a unified approach to the one thing they all shared: contracting with the City and County of SanFrancisco. The Human Services Network crafted “New Realities”—in the midst ofthis passage, and actively sought common ground by focusing on shared issues (initially, the issues of unionization and contracting with the city and county).
However good the public discussion, or pointed the search for a new kind of “partnership” with the City and County, there was an analytic piece missing: documentation of the full dimensions of the nonprofit human service sector. Whilethere was an anecdotal basis for believing the nonprofit services generated significantnon-city funds in matching city support, there was no analysis to support it. Andwhile even a cursory look at services provided bynonprofits showed their critical role in SanFrancisco’s safety net, there was no account of theaggregate numbers of clients, staff, or budgets.
This report provides that account. It suggeststhat the nonprofit human service agencies play asignificant, indeed critical, role in the provisionof services to an astonishing number of clients.They also provide employment for over 15,000staff, and leverage a dollar and a half in non-city funds for every dollar they receivefrom the City and County. Their client loads and budgets demonstrate that they arefar from marginal adjuncts to city-provided services.
At the same time, no survey answers the policy questions faced by agencies: what policies and processes can secure better funding for services, more security for staffand facilities-challenged organizations, better coordination across the boundaries ofpublic and private services, easier contracting procedures and protocols? What the survey tells us is that these are issues common to most organizations, and that answersto these questions will affect huge numbers of San Franciscans.
San Francisco’s nonprofit human service providers are located throughout the city,serving the poorest and most vulnerable neighborhoods. The survey upon whichthis report is based was sent to every nonprofit human service organization
contracting with the City and County of San Francisco in the 2000-2001 fiscal
[the nonprofits] also provide employmentfor over 15,000 staff, and leverage a dollarand a half in non-city funds for every dollarthey receive from the City and County.
I. A Critical Sector: Clients, Services, and the Neighborhoods
SF Human Services Network — A Comprehensive Profile of San Francisco’s Nonprofit Human Service Providers
Page 4San Francisco Urban Institute/San Francisco State University
year. There are additional agencies not contracting with the City, but—with someexceptions—most are relatively small, and our focus was on those nonprofits whosecontractual relationship with the City makes them effective partners in an integratedsystem of services. After eliminating those agencies not providing direct services, 272 organizations received follow-up calls, and completed surveys were submitted by169—a very high “return rate” for such surveys (62%). In the analysis that follows, we will differentiate between conclusions about the entire universe of serviceproviders, extrapolated from the survey respondents, and conclusions made onlyabout the organizations who responded to the survey.
Budgets: A First Look At Big Numbers
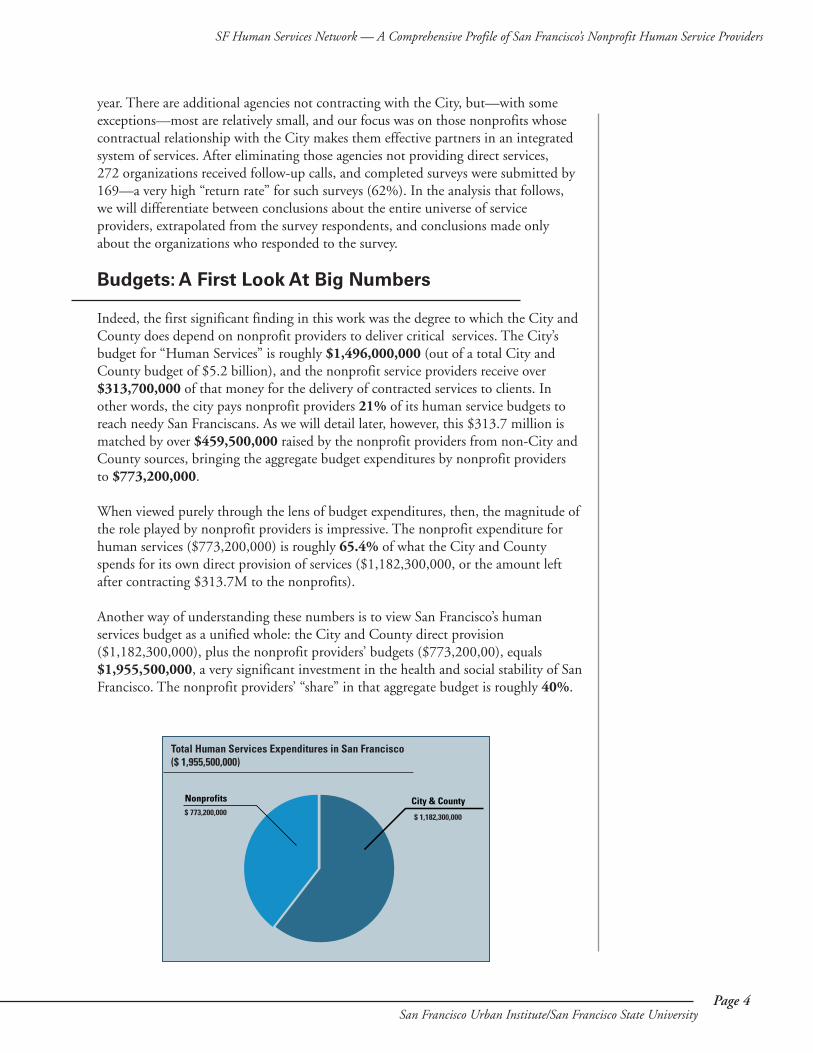
Indeed, the first significant finding in this work was the degree to which the City andCounty does depend on nonprofit providers to deliver critical services. The City’sbudget for “Human Services” is roughly $1,496,000,000 (out of a total City andCounty budget of $5.2 billion), and the nonprofit service providers receive over$313,700,000 of that money for the delivery of contracted services to clients. In other words, the city pays nonprofit providers 21% of its human service budgets toreach needy San Franciscans. As we will detail later, however, this $313.7 million ismatched by over $459,500,000 raised by the nonprofit providers from non-City andCounty sources, bringing the aggregate budget expenditures by nonprofit providers to $773,200,000.
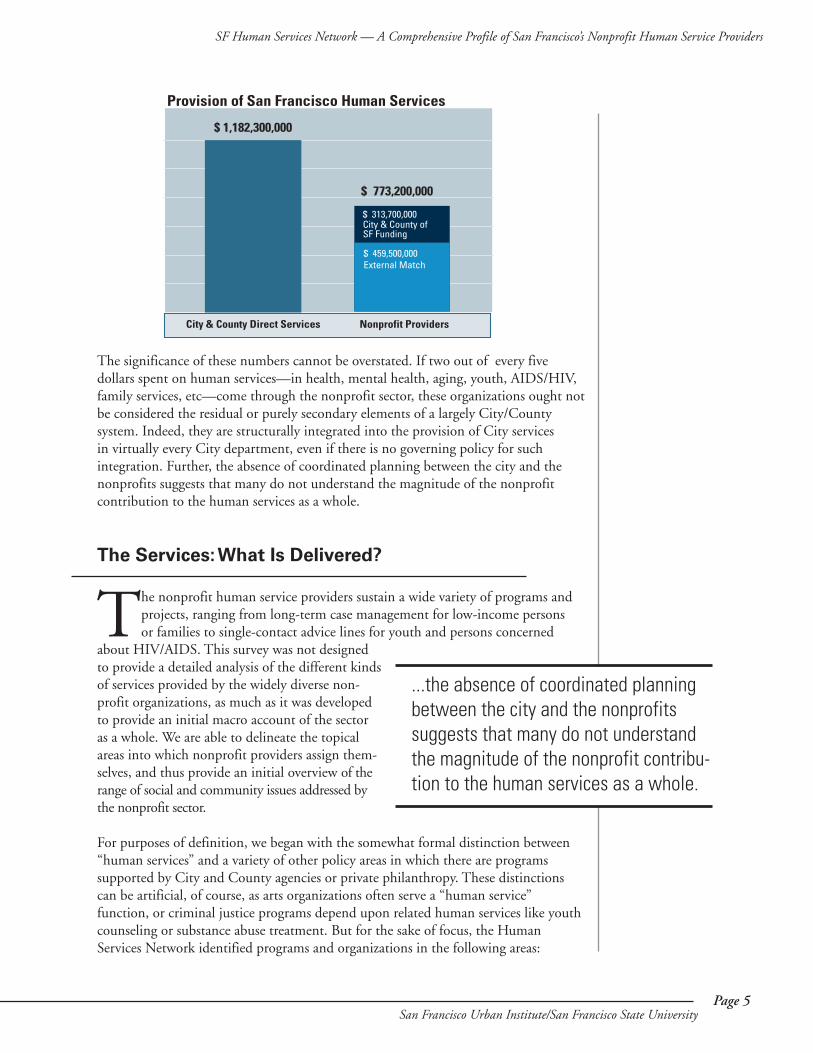
When viewed purely through the lens of budget expenditures, then, the magnitude ofthe role played by nonprofit providers is impressive. The nonprofit expenditure forhuman services ($773,200,000) is roughly 65.4% of what the City and Countyspends for its own direct provision of services ($1,182,300,000, or the amount leftafter contracting $313.7M to the nonprofits).
Another way of understanding these numbers is to view San Francisco’s human services budget as a unified whole: the City and County direct provision($1,182,300,000), plus the nonprofit providers’ budgets ($773,200,00), equals$1,955,500,000, a very significant investment in the health and social stability of SanFrancisco. The nonprofit providers’ “share” in that aggregate budget is roughly 40%.
Total Human Services Expenditures in San Francisco($ 1,955,500,000)
City & CountyNonprofits$ 773,200,000 $ 1,182,300,000
SF Human Services Network — A Comprehensive Profile of San Francisco’s Nonprofit Human Service Providers
Page 5San Francisco Urban Institute/San Francisco State University
The significance of these numbers cannot be overstated. If two out of every five dollars spent on human services—in health, mental health, aging, youth, AIDS/HIV,family services, etc—come through the nonprofit sector, these organizations ought notbe considered the residual or purely secondary elements of a largely City/County system. Indeed, they are structurally integrated into the provision of City services in virtually every City department, even if there is no governing policy for such integration. Further, the absence of coordinated planning between the city and thenonprofits suggests that many do not understand the magnitude of the nonprofit contribution to the human services as a whole.
The Services:What Is Delivered?
The nonprofit human service providers sustain a wide variety of programs andprojects, ranging from long-term case management for low-income personsor families to single-contact advice lines for youth and persons concerned
about HIV/AIDS. This survey was not designedto provide a detailed analysis of the different kindsof services provided by the widely diverse non-profit organizations, as much as it was developedto provide an initial macro account of the sectoras a whole. We are able to delineate the topicalareas into which nonprofit providers assign them-selves, and thus provide an initial overview of therange of social and community issues addressed bythe nonprofit sector.
For purposes of definition, we began with the somewhat formal distinction between“human services” and a variety of other policy areas in which there are programs supported by City and County agencies or private philanthropy. These distinctionscan be artificial, of course, as arts organizations often serve a “human service” function, or criminal justice programs depend upon related human services like youthcounseling or substance abuse treatment. But for the sake of focus, the HumanServices Network identified programs and organizations in the following areas:
City & County Direct Services Nonprofit Providers
$ 1,182,300,000
$ 773,200,000
$ 313,700,000
$ 459,500,000External Match
Provision of San Francisco Human Services
City & County of SF Funding
...the absence of coordinated planningbetween the city and the nonprofits suggests that many do not understandthe magnitude of the nonprofit contribu-tion to the human services as a whole.
SF Human Services Network — A Comprehensive Profile of San Francisco’s Nonprofit Human Service Providers
Page 6San Francisco Urban Institute/San Francisco State University
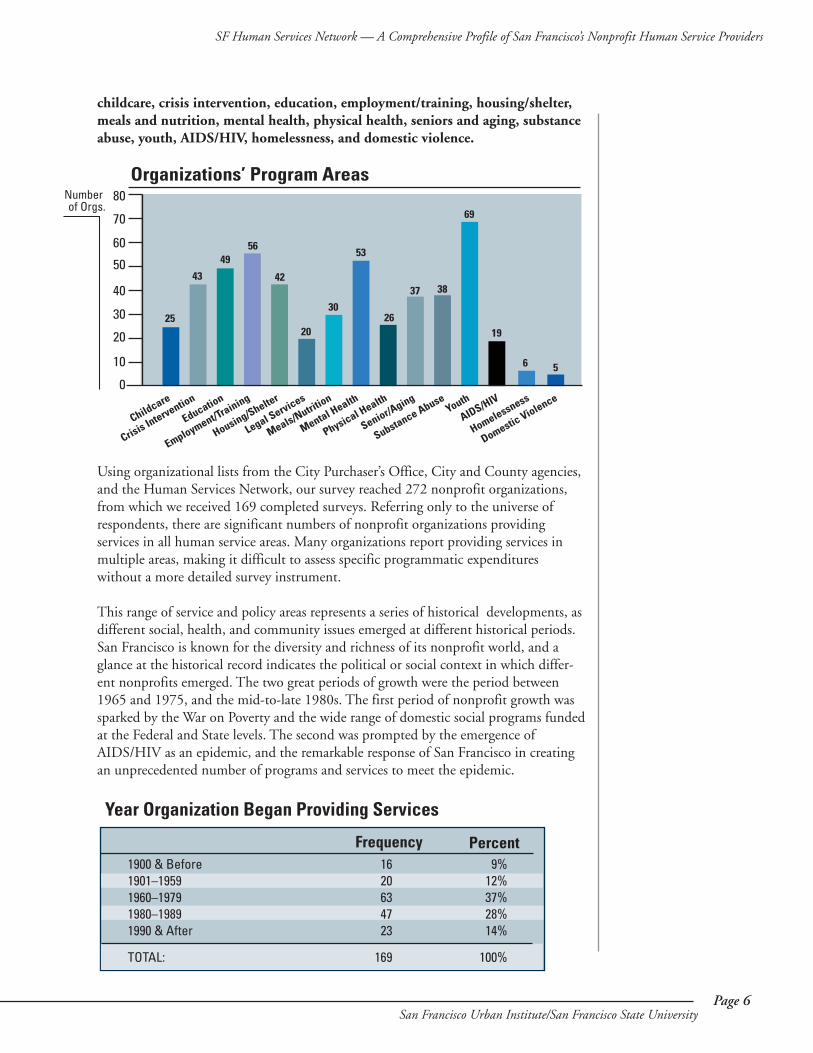
childcare, crisis intervention, education, employment/training, housing/shelter,meals and nutrition, mental health, physical health, seniors and aging, substanceabuse, youth, AIDS/HIV, homelessness, and domestic violence.
Using organizational lists from the City Purchaser’s Office, City and County agencies,and the Human Services Network, our survey reached 272 nonprofit organizations,from which we received 169 completed surveys. Referring only to the universe ofrespondents, there are significant numbers of nonprofit organizations providing services in all human service areas. Many organizations report providing services inmultiple areas, making it difficult to assess specific programmatic expenditures without a more detailed survey instrument.
This range of service and policy areas represents a series of historical developments, asdifferent social, health, and community issues emerged at different historical periods.San Francisco is known for the diversity and richness of its nonprofit world, and aglance at the historical record indicates the political or social context in which differ-ent nonprofits emerged. The two great periods of growth were the period between1965 and 1975, and the mid-to-late 1980s. The first period of nonprofit growth wassparked by the War on Poverty and the wide range of domestic social programs fundedat the Federal and State levels. The second was prompted by the emergence ofAIDS/HIV as an epidemic, and the remarkable response of San Francisco in creatingan unprecedented number of programs and services to meet the epidemic.
Childcare
Crisis Intervention
Education
Employment/Training
Housing/Shelter
Legal Services
Meals/Nutrition
Mental Health
Physical Health
Senior/Aging
Substance AbuseYouth
AIDS/HIV
Domestic Violence
Homelessness
10
20
30
40
50
60
70
80
0
43 42
4956
2520
26
37 38
30
53
69
19
6 5
Organizations’ Program AreasNumber of Orgs.
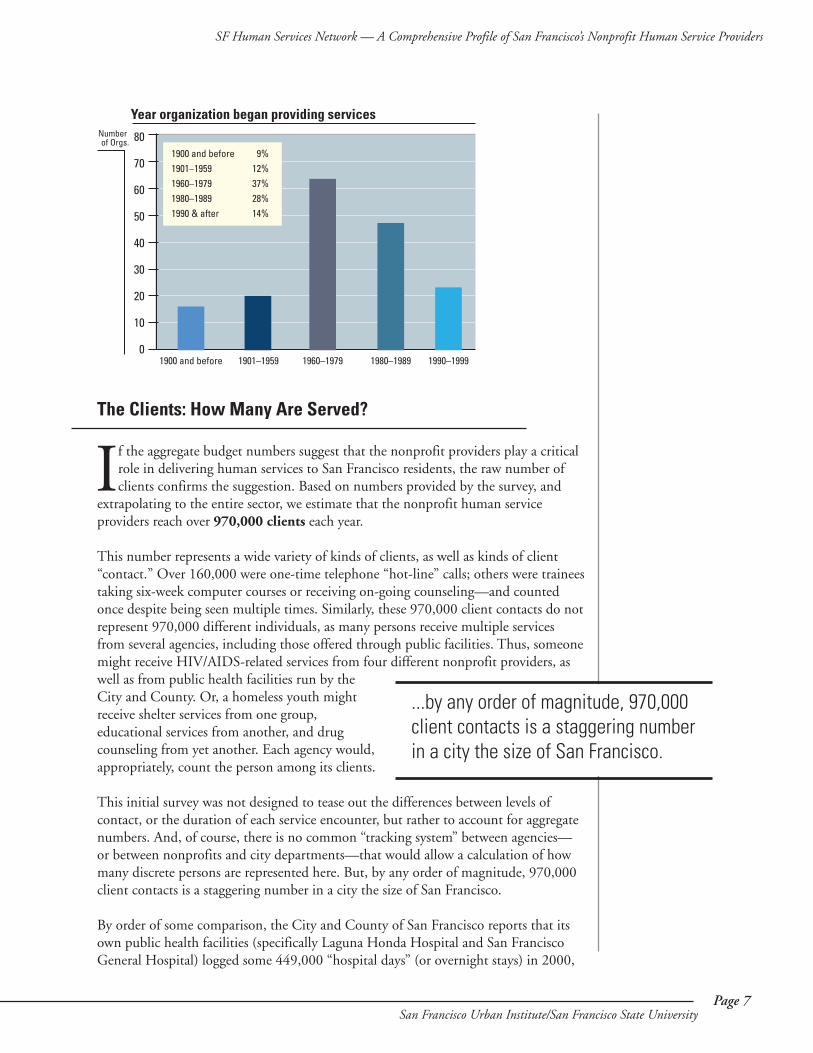
1900 & Before1901–19591960–19791980–19891990 & After
TOTAL:
Frequency Percent1620634723
169
9%12%37%28%14%
100%
Year Organization Began Providing Services
SF Human Services Network — A Comprehensive Profile of San Francisco’s Nonprofit Human Service Providers
Page 7San Francisco Urban Institute/San Francisco State University
The Clients: How Many Are Served?
If the aggregate budget numbers suggest that the nonprofit providers play a criticalrole in delivering human services to San Francisco residents, the raw number ofclients confirms the suggestion. Based on numbers provided by the survey, and
extrapolating to the entire sector, we estimate that the nonprofit human serviceproviders reach over 970,000 clients each year.
This number represents a wide variety of kinds of clients, as well as kinds of client“contact.” Over 160,000 were one-time telephone “hot-line” calls; others were traineestaking six-week computer courses or receiving on-going counseling—and countedonce despite being seen multiple times. Similarly, these 970,000 client contacts do notrepresent 970,000 different individuals, as many persons receive multiple servicesfrom several agencies, including those offered through public facilities. Thus, someonemight receive HIV/AIDS-related services from four different nonprofit providers, aswell as from public health facilities run by theCity and County. Or, a homeless youth mightreceive shelter services from one group, educational services from another, and drugcounseling from yet another. Each agency would,appropriately, count the person among its clients.
This initial survey was not designed to tease out the differences between levels of contact, or the duration of each service encounter, but rather to account for aggregatenumbers. And, of course, there is no common “tracking system” between agencies—or between nonprofits and city departments—that would allow a calculation of howmany discrete persons are represented here. But, by any order of magnitude, 970,000client contacts is a staggering number in a city the size of San Francisco.
By order of some comparison, the City and County of San Francisco reports that itsown public health facilities (specifically Laguna Honda Hospital and San FranciscoGeneral Hospital) logged some 449,000 “hospital days” (or overnight stays) in 2000,
Year organization began providing services
80
70
60
50
40
30
20
10
01900 and before 1901–1959 1960–1979 1980–1989
1900 and before 9%1901–1959 12%1960–1979 37%1980–1989 28%1990 & after 14%
Number of Orgs.
1990–1999
...by any order of magnitude, 970,000client contacts is a staggering number in a city the size of San Francisco.
SF Human Services Network — A Comprehensive Profile of San Francisco’s Nonprofit Human Service Providers
Page 8San Francisco Urban Institute/San Francisco State University
and an additional 623,000 visits to primary and urgent care facilities (presumably notrequiring an overnight stay), for a total of 1,072,000 patient “contacts.” (Again, thesenumbers do not represent that many individual persons; indeed, 1,000 Laguna Hondapatients staying for one year would account for 365,000 “hospital days”). The Cityand County counts an additional 23,000 clients at their Mental Health Clinics, someof whom are seen weekly, others monthly.1
To these numbers we could add those served byRecreation and Park programs and other City andCounty departments providing direct services. Butthe Health Department numbers—by far thelargest—give some order of magnitude to the970,000 client contacts reported by the nonprofitproviders. They also raise the question of strategiclinkages between and among services, and potential duplication between services offered by the nonprofit and public sectors. We will return to these issues later.
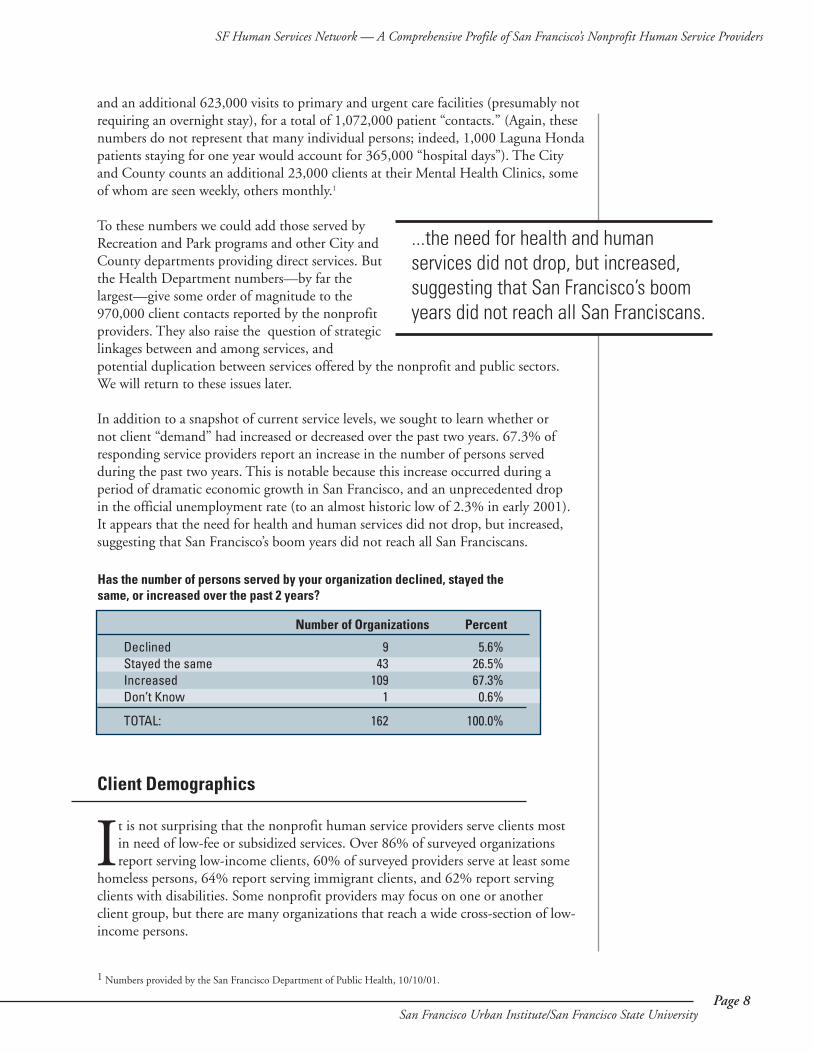
In addition to a snapshot of current service levels, we sought to learn whether or not client “demand” had increased or decreased over the past two years. 67.3% ofresponding service providers report an increase in the number of persons served during the past two years. This is notable because this increase occurred during a period of dramatic economic growth in San Francisco, and an unprecedented drop in the official unemployment rate (to an almost historic low of 2.3% in early 2001). It appears that the need for health and human services did not drop, but increased,suggesting that San Francisco’s boom years did not reach all San Franciscans.
Client Demographics
It is not surprising that the nonprofit human service providers serve clients most in need of low-fee or subsidized services. Over 86% of surveyed organizationsreport serving low-income clients, 60% of surveyed providers serve at least some
homeless persons, 64% report serving immigrant clients, and 62% report servingclients with disabilities. Some nonprofit providers may focus on one or another client group, but there are many organizations that reach a wide cross-section of low-income persons.
1 Numbers provided by the San Francisco Department of Public Health, 10/10/01.
...the need for health and human services did not drop, but increased,suggesting that San Francisco’s boomyears did not reach all San Franciscans.
DeclinedStayed the sameIncreasedDon’t Know
TOTAL:
Number of Organizations Percent
943
1091
162
5.6%26.5%67.3%
0.6%
100.0%
Has the number of persons served by your organization declined, stayed the same, or increased over the past 2 years?
SF Human Services Network — A Comprehensive Profile of San Francisco’s Nonprofit Human Service Providers
Page 9San Francisco Urban Institute/San Francisco State University
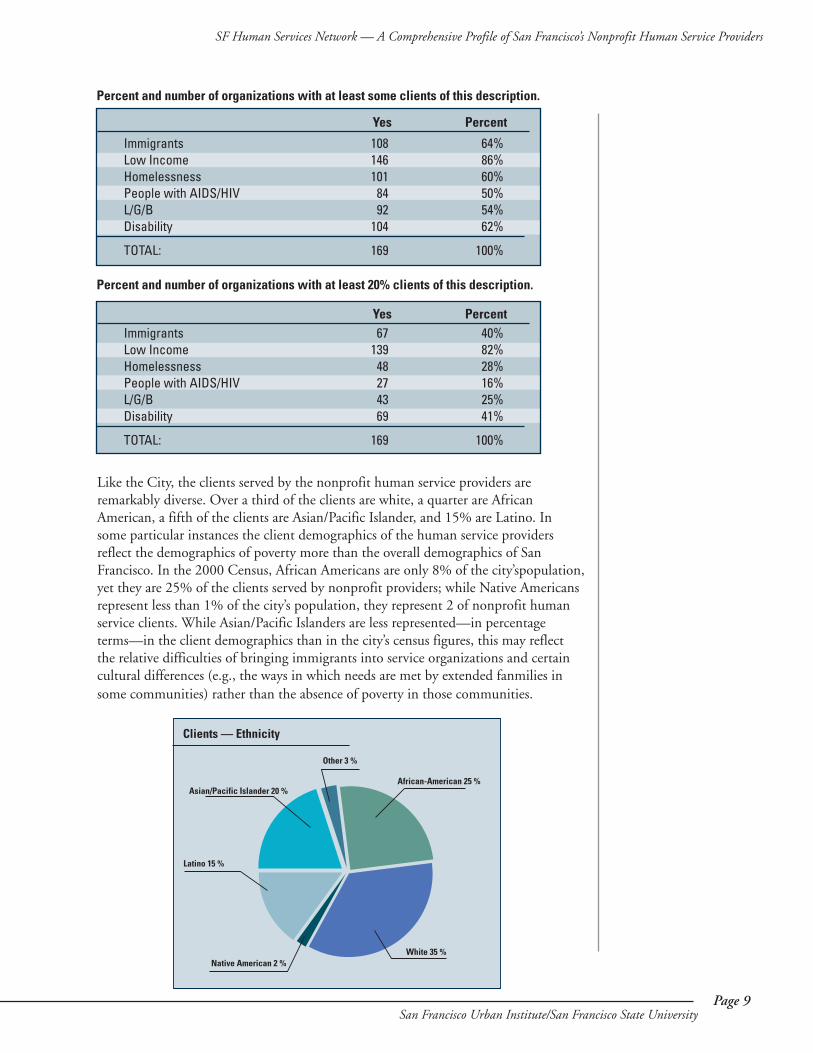
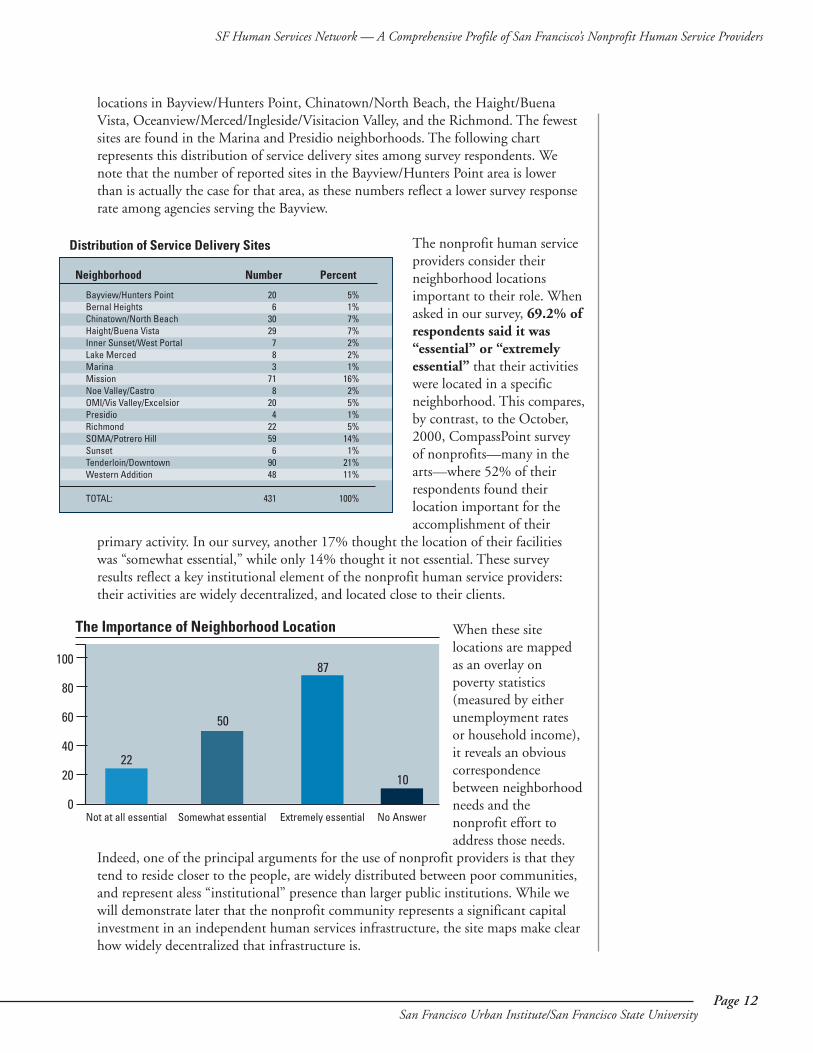
Like the City, the clients served by the nonprofit human service providers are remarkably diverse. Over a third of the clients are white, a quarter are AfricanAmerican, a fifth of the clients are Asian/Pacific Islander, and 15% are Latino. In some particular instances the client demographics of the human service providersreflect the demographics of poverty more than the overall demographics of SanFrancisco. In the 2000 Census, African Americans are only 8% of the city’spopulation,yet they are 25% of the clients served by nonprofit providers; while Native Americansrepresent less than 1% of the city’s population, they represent 2 of nonprofit humanservice clients. While Asian/Pacific Islanders are less represented—in percentageterms—in the client demographics than in the city’s census figures, this may reflectthe relative difficulties of bringing immigrants into service organizations and certaincultural differences (e.g., the ways in which needs are met by extended fanmilies insome communities) rather than the absence of poverty in those communities.
ImmigrantsLow IncomeHomelessnessPeople with AIDS/HIVL/G/BDisability
TOTAL:
Yes Percent
108146101
8492
104
169
64%86%60%50%54%62%
100%
Percent and number of organizations with at least some clients of this description.
ImmigrantsLow IncomeHomelessnessPeople with AIDS/HIVL/G/BDisability
TOTAL:
Yes Percent67
13948274369
169
40%82%28%16%25%41%
100%
Percent and number of organizations with at least 20% clients of this description.
Clients — Ethnicity
White 35 %Native American 2 %
Other 3 %
African-American 25 %
Latino 15 %
Asian/Pacific Islander 20 %
SF Human Services Network — A Comprehensive Profile of San Francisco’s Nonprofit Human Service Providers
Page 10San Francisco Urban Institute/San Francisco State University
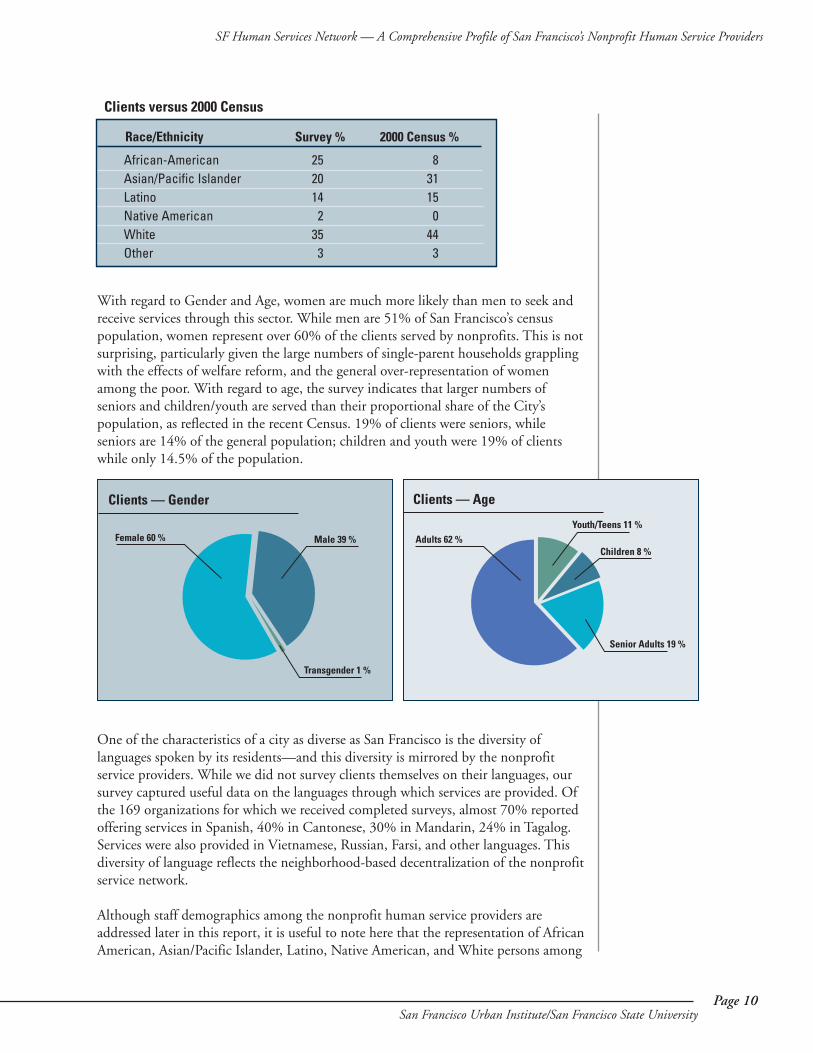
With regard to Gender and Age, women are much more likely than men to seek andreceive services through this sector. While men are 51% of San Francisco’s census population, women represent over 60% of the clients served by nonprofits. This is notsurprising, particularly given the large numbers of single-parent households grapplingwith the effects of welfare reform, and the general over-representation of womenamong the poor. With regard to age, the survey indicates that larger numbers ofseniors and children/youth are served than their proportional share of the City’s population, as reflected in the recent Census. 19% of clients were seniors, whileseniors are 14% of the general population; children and youth were 19% of clientswhile only 14.5% of the population.
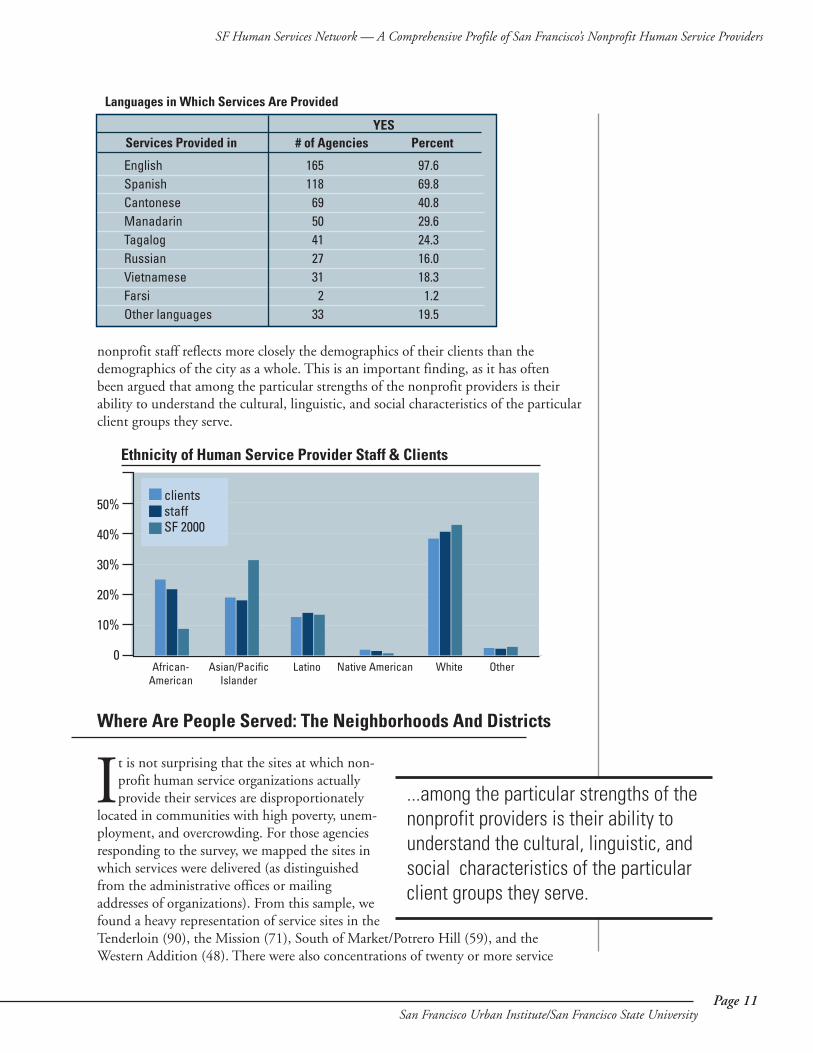
One of the characteristics of a city as diverse as San Francisco is the diversity oflanguages spoken by its residents—and this diversity is mirrored by the nonprofit service providers. While we did not survey clients themselves on their languages, oursurvey captured useful data on the languages through which services are provided. Ofthe 169 organizations for which we received completed surveys, almost 70% reportedoffering services in Spanish, 40% in Cantonese, 30% in Mandarin, 24% in Tagalog.Services were also provided in Vietnamese, Russian, Farsi, and other languages. Thisdiversity of language reflects the neighborhood-based decentralization of the nonprofitservice network.
Although staff demographics among the nonprofit human service providers areaddressed later in this report, it is useful to note here that the representation of AfricanAmerican, Asian/Pacific Islander, Latino, Native American, and White persons among
African-AmericanAsian/Pacific IslanderLatinoNative AmericanWhiteOther
Survey % 2000 Census %
252014
235
3
83115
044
3
Race/Ethnicity
Clients versus 2000 Census
Clients — Gender
Transgender 1 %
Male 39 %Female 60 %
Clients — Age
Senior Adults 19 %
Children 8 %Adults 62 %
Youth/Teens 11 %
SF Human Services Network — A Comprehensive Profile of San Francisco’s Nonprofit Human Service Providers
Page 11San Francisco Urban Institute/San Francisco State University
nonprofit staff reflects more closely the demographics of their clients than the demographics of the city as a whole. This is an important finding, as it has often been argued that among the particular strengths of the nonprofit providers is their ability to understand the cultural, linguistic, and social characteristics of the particularclient groups they serve.
Where Are People Served: The Neighborhoods And Districts
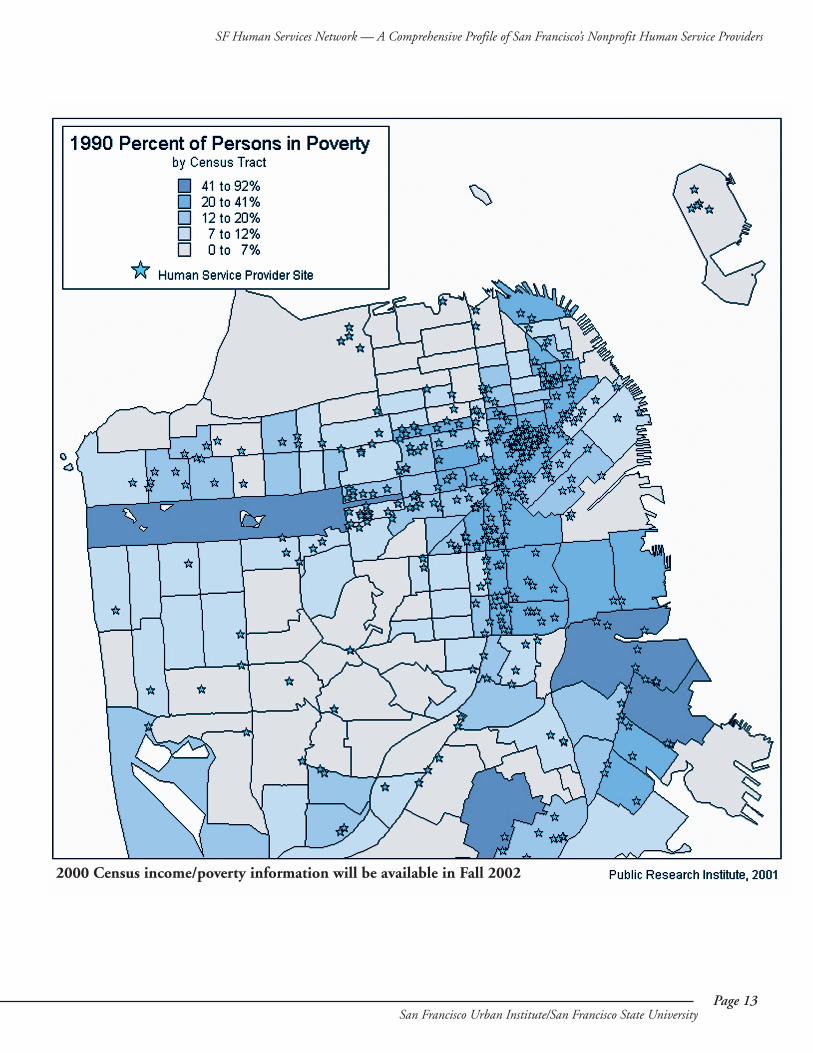
It is not surprising that the sites at which non-profit human service organizations actuallyprovide their services are disproportionately
located in communities with high poverty, unem-ployment, and overcrowding. For those agenciesresponding to the survey, we mapped the sites inwhich services were delivered (as distinguishedfrom the administrative offices or mailingaddresses of organizations). From this sample, wefound a heavy representation of service sites in theTenderloin (90), the Mission (71), South of Market/Potrero Hill (59), and theWestern Addition (48). There were also concentrations of twenty or more service
EnglishSpanishCantoneseManadarinTagalogRussianVietnameseFarsiOther languages
# of Agencies PercentYES
165118
6950412731
233
97.669.840.829.624.316.018.3
1.219.5
Services Provided in
Languages in Which Services Are Provided
Ethnicity of Human Service Provider Staff & Clients
50%
40%
30%
20%
10%
0African-
AmericanAsian/Pacific
IslanderNative American White OtherLatino
clientsstaffSF 2000
...among the particular strengths of thenonprofit providers is their ability tounderstand the cultural, linguistic, andsocial characteristics of the particularclient groups they serve.
SF Human Services Network — A Comprehensive Profile of San Francisco’s Nonprofit Human Service Providers
Page 12San Francisco Urban Institute/San Francisco State University
locations in Bayview/Hunters Point, Chinatown/North Beach, the Haight/BuenaVista, Oceanview/Merced/Ingleside/Visitacion Valley, and the Richmond. The fewestsites are found in the Marina and Presidio neighborhoods. The following chart represents this distribution of service delivery sites among survey respondents. Wenote that the number of reported sites in the Bayview/Hunters Point area is lowerthan is actually the case for that area, as these numbers reflect a lower survey responserate among agencies serving the Bayview.
The nonprofit human serviceproviders consider their neighborhood locationsimportant to their role. Whenasked in our survey, 69.2% ofrespondents said it was“essential” or “extremelyessential” that their activitieswere located in a specificneighborhood. This compares,by contrast, to the October,2000, CompassPoint surveyof nonprofits—many in thearts—where 52% of theirrespondents found theirlocation important for theaccomplishment of their
primary activity. In our survey, another 17% thought the location of their facilitieswas “somewhat essential,” while only 14% thought it not essential. These surveyresults reflect a key institutional element of the nonprofit human service providers:their activities are widely decentralized, and located close to their clients.
When these site locations are mappedas an overlay on poverty statistics (measured by eitherunemployment rates or household income),it reveals an obviouscorrespondencebetween neighborhoodneeds and the nonprofit effort toaddress those needs.
Indeed, one of the principal arguments for the use of nonprofit providers is that theytend to reside closer to the people, are widely distributed between poor communities,and represent aless “institutional” presence than larger public institutions. While wewill demonstrate later that the nonprofit community represents a significant capitalinvestment in an independent human services infrastructure, the site maps make clearhow widely decentralized that infrastructure is.
Neighborhood
Bayview/Hunters PointBernal HeightsChinatown/North BeachHaight/Buena VistaInner Sunset/West PortalLake MercedMarinaMissionNoe Valley/CastroOMI/Vis Valley/Excelsior PresidioRichmondSOMA/Potrero HillSunsetTenderloin/DowntownWestern Addition
TOTAL:
Number Percent
206
3029783
718
204
22596
9048
431
5%1% 7%7%2%2%1%
16%2%5%1%5%
14%1%
21%11%
100%
Distribution of Service Delivery Sites
The Importance of Neighborhood Location
100
80
60
40
20
0Not at all essential Somewhat essential Extremely essential No Answer
22
50
87
10
SF Human Services Network — A Comprehensive Profile of San Francisco’s Nonprofit Human Service Providers
Page 13San Francisco Urban Institute/San Francisco State University
2000 Census income/poverty information will be available in Fall 2002
SF Human Services Network — A Comprehensive Profile of San Francisco’s Nonprofit Human Service Providers
Page 14San Francisco Urban Institute/San Francisco State University
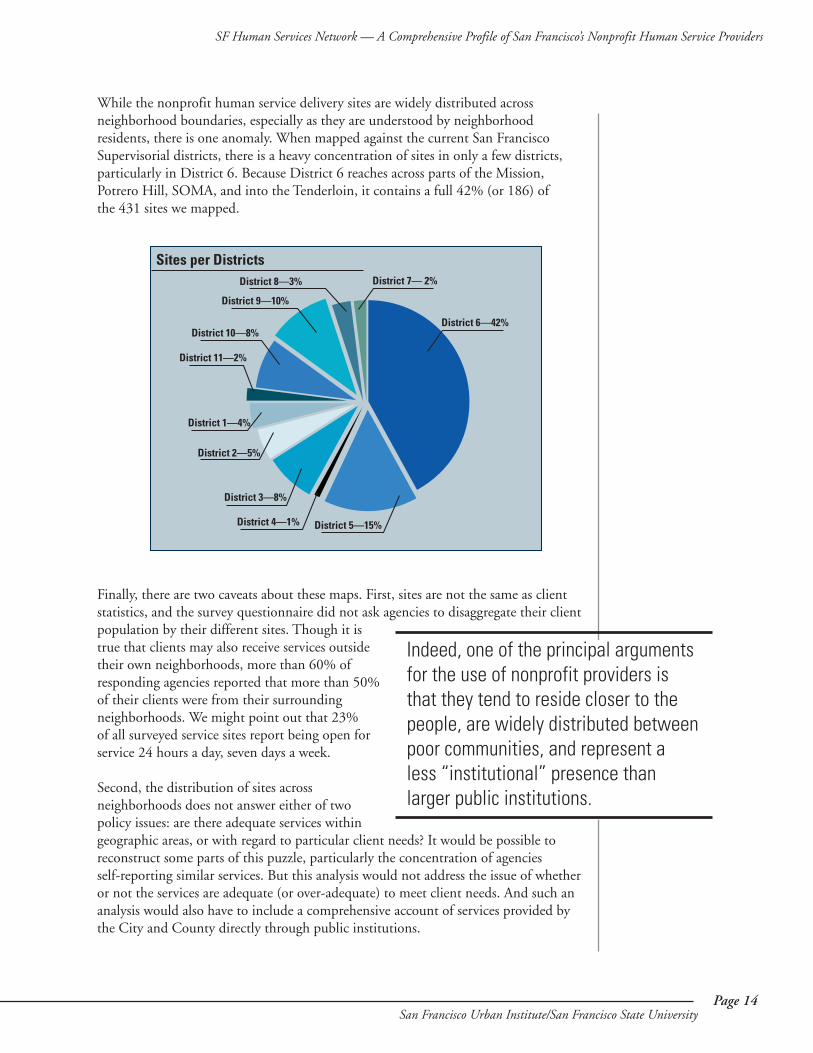
While the nonprofit human service delivery sites are widely distributed across neighborhood boundaries, especially as they are understood by neighborhood residents, there is one anomaly. When mapped against the current San FranciscoSupervisorial districts, there is a heavy concentration of sites in only a few districts,particularly in District 6. Because District 6 reaches across parts of the Mission,Potrero Hill, SOMA, and into the Tenderloin, it contains a full 42% (or 186) of the 431 sites we mapped.
Finally, there are two caveats about these maps. First, sites are not the same as clientstatistics, and the survey questionnaire did not ask agencies to disaggregate their clientpopulation by their different sites. Though it istrue that clients may also receive services outsidetheir own neighborhoods, more than 60% ofresponding agencies reported that more than 50%of their clients were from their surroundingneighborhoods. We might point out that 23% of all surveyed service sites report being open forservice 24 hours a day, seven days a week.
Second, the distribution of sites across neighborhoods does not answer either of two policy issues: are there adequate services within geographic areas, or with regard to particular client needs? It would be possible toreconstruct some parts of this puzzle, particularly the concentration of agencies self-reporting similar services. But this analysis would not address the issue of whetheror not the services are adequate (or over-adequate) to meet client needs. And such ananalysis would also have to include a comprehensive account of services provided bythe City and County directly through public institutions.
District 6—42%
District 5—15%
District 9—10%
Sites per DistrictsDistrict 7— 2%District 8—3%
District 10—8%
District 3—8%
District 11—2%
District 4—1%
District 2—5%
District 1—4%
Indeed, one of the principal argumentsfor the use of nonprofit providers is that they tend to reside closer to thepeople, are widely distributed betweenpoor communities, and represent a less “institutional” presence thanlarger public institutions.
SF Human Services Network — A Comprehensive Profile of San Francisco’s Nonprofit Human Service Providers
Page 15San Francisco Urban Institute/San Francisco State University
We have already indicated the aggregate budget numbers for the nonprofit human service providers, in an effort to understand the magnitude of their contribution to San Francisco. We now turn
to two issues: the sources of their budgets and the nature of their expenditures.
Funding Sources: Leveraging Public Resources
All of the nonprofit human service providers surveyed for this study rely on contractswith the City and County of San Francisco to generate a share of their operatingresources. With the exception of very few large organizations, most nonprofit organizations depend in some way upon City and County contracts for a core part oftheir annual operating and program budgets. This is the reciprocal side of the city’sdependence upon the nonprofits for the delivery of critical services. As we indicatedabove, however, the nonprofit service providers bring significant additional resourcesto their programs, matching and exceeding theirCity dollars with individual donations, foundation,corporate, state, and federal monies.
To recall the earlier numbers, we estimate that thenonprofit human service providers receive$313,739,000 from the City and County. Thisnumber includes both City General Fund dollarsand various State and Federal “pass-through” dollarsthat are administered through City and Countyagencies. While our survey asked nonprofit organizations to detail the sources of their City and County funds, many did notbreak out the percentage shares of their city funding provided by the General Fund,State, and Federal pass-throughs. Many organizations simply do not know the preciseorigins of their City and County funding. As a result, we do not tease apart theseshares, but simply count together the different sources from which the City andCounty draws.
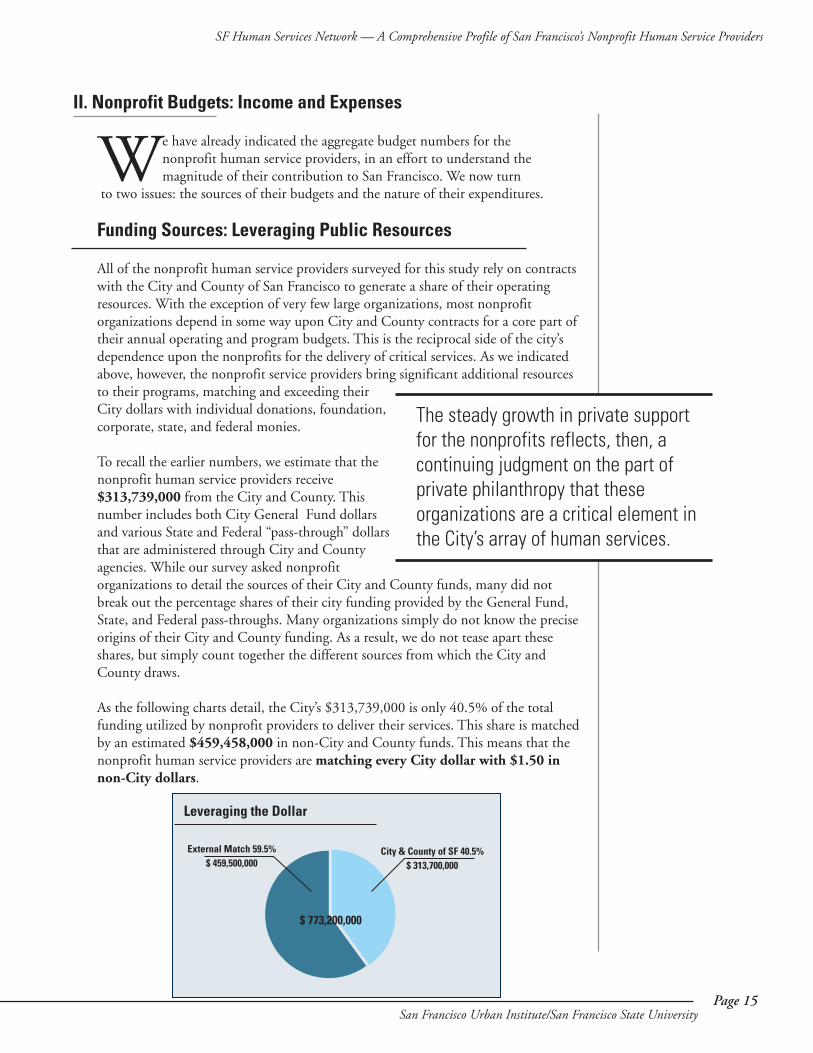
As the following charts detail, the City’s $313,739,000 is only 40.5% of the totalfunding utilized by nonprofit providers to deliver their services. This share is matchedby an estimated $459,458,000 in non-City and County funds. This means that thenonprofit human service providers are matching every City dollar with $1.50 innon-City dollars.
II. Nonprofit Budgets: Income and Expenses
The steady growth in private support for the nonprofits reflects, then, a continuing judgment on the part of private philanthropy that these organizations are a critical element inthe City’s array of human services.
Leveraging the Dollar
City & County of SF 40.5%$ 313,700,000
External Match 59.5%$ 459,500,000
$ 773,200,000
SF Human Services Network — A Comprehensive Profile of San Francisco’s Nonprofit Human Service Providers
Page 16San Francisco Urban Institute/San Francisco State University
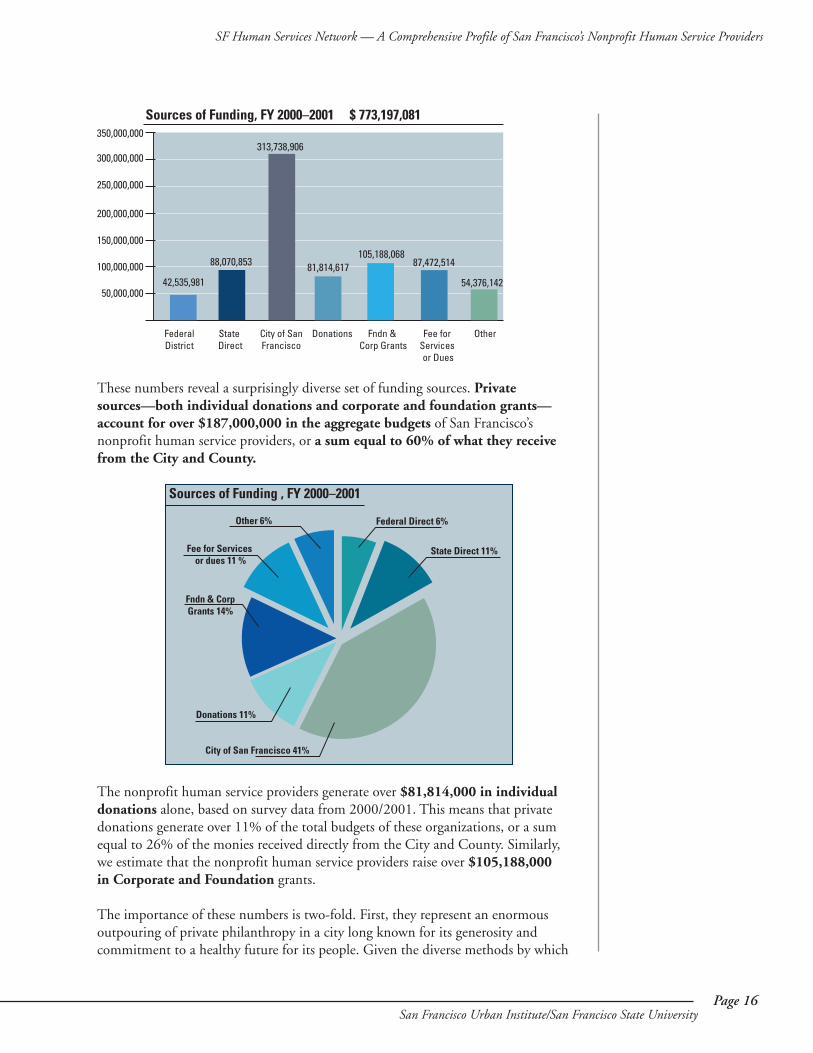
These numbers reveal a surprisingly diverse set of funding sources. Private sources—both individual donations and corporate and foundation grants—account for over $187,000,000 in the aggregate budgets of San Francisco’s nonprofit human service providers, or a sum equal to 60% of what they receivefrom the City and County.
The nonprofit human service providers generate over $81,814,000 in individualdonations alone, based on survey data from 2000/2001. This means that privatedonations generate over 11% of the total budgets of these organizations, or a sumequal to 26% of the monies received directly from the City and County. Similarly, we estimate that the nonprofit human service providers raise over $105,188,000 in Corporate and Foundation grants.
The importance of these numbers is two-fold. First, they represent an enormousoutpouring of private philanthropy in a city long known for its generosity and commitment to a healthy future for its people. Given the diverse methods by which
Sources of Funding, FY 2000–2001 $ 773,197,081
FederalDistrict
State Direct
City of SanFrancisco
Fndn & Corp Grants
Fee for Services or Dues
Donations Other
42,535,98150,000,000
88,070,853100,000,000
200,000,000
300,000,000313,738,906
81,814,617105,188,068
87,472,514
54,376,142
150,000,000
250,000,000
350,000,000
State Direct 11%
City of San Francisco 41%
Fee for Services or dues 11 %
Sources of Funding , FY 2000–2001
Federal Direct 6%Other 6%
Fndn & CorpGrants 14%
Donations 11%
SF Human Services Network — A Comprehensive Profile of San Francisco’s Nonprofit Human Service Providers
Page 17San Francisco Urban Institute/San Francisco State University
foundations, corporations, and private individuals assess the continuing impact oftheir private giving, this magnitude of support indicates the fiscal and programmaticlegitimacy of the nonprofit providers in the eyes of private philanthropy. This level ofsupport also suggests an enduring set of relationships between private financial sourcesand the nonprofit organizations. The steady growth in private support for the non-profits reflects, then, a continuing judgment on the part of private philanthropy thatthese organizations are a critical element in the City’s array of human services.
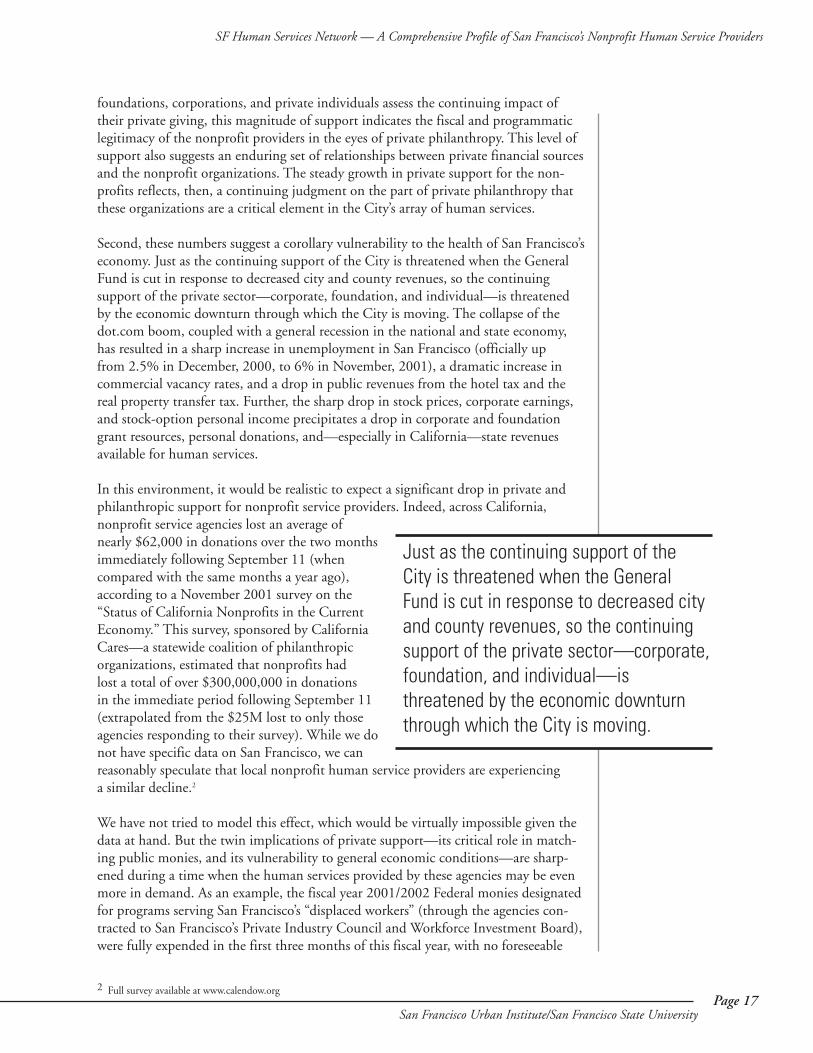
Second, these numbers suggest a corollary vulnerability to the health of San Francisco’seconomy. Just as the continuing support of the City is threatened when the GeneralFund is cut in response to decreased city and county revenues, so the continuing support of the private sector—corporate, foundation, and individual—is threatenedby the economic downturn through which the City is moving. The collapse of thedot.com boom, coupled with a general recession in the national and state economy,has resulted in a sharp increase in unemployment in San Francisco (officially up from 2.5% in December, 2000, to 6% in November, 2001), a dramatic increase incommercial vacancy rates, and a drop in public revenues from the hotel tax and thereal property transfer tax. Further, the sharp drop in stock prices, corporate earnings,and stock-option personal income precipitates a drop in corporate and foundationgrant resources, personal donations, and—especially in California—state revenuesavailable for human services.
In this environment, it would be realistic to expect a significant drop in private andphilanthropic support for nonprofit service providers. Indeed, across California, nonprofit service agencies lost an average of nearly $62,000 in donations over the two monthsimmediately following September 11 (when compared with the same months a year ago),according to a November 2001 survey on the“Status of California Nonprofits in the CurrentEconomy.” This survey, sponsored by CaliforniaCares—a statewide coalition of philanthropicorganizations, estimated that nonprofits had lost a total of over $300,000,000 in donations in the immediate period following September 11(extrapolated from the $25M lost to only thoseagencies responding to their survey). While we donot have specific data on San Francisco, we can reasonably speculate that local nonprofit human service providers are experiencing a similar decline.2
We have not tried to model this effect, which would be virtually impossible given thedata at hand. But the twin implications of private support—its critical role in match-ing public monies, and its vulnerability to general economic conditions—are sharp-ened during a time when the human services provided by these agencies may be evenmore in demand. As an example, the fiscal year 2001/2002 Federal monies designatedfor programs serving San Francisco’s “displaced workers” (through the agencies con-tracted to San Francisco’s Private Industry Council and Workforce Investment Board),were fully expended in the first three months of this fiscal year, with no foreseeable
2 Full survey available at www.calendow.org
Just as the continuing support of the City is threatened when the GeneralFund is cut in response to decreased cityand county revenues, so the continuingsupport of the private sector—corporate,foundation, and individual—is threatened by the economic downturnthrough which the City is moving.
SF Human Services Network — A Comprehensive Profile of San Francisco’s Nonprofit Human Service Providers
Page 18San Francisco Urban Institute/San Francisco State University
drop in the numbers of persons seeking services. Those same displaced workers will be seeking support from community health clinics, family support services, and otherpublic and nonprofit agencies—at precisely the time when private support may bemore constrained than ever. The same statewide survey conducted by California Caresfound that 61% of all safety-net organizations saw an increase in demand for their services between September and November of 2001.
Beyond individual, foundation, and corporate donations, the other major sources ofnon-City and County funding for the nonprofit human service providers are directState and Federal grants, fees for services, and a catch-all category of “other” whichrepresents sources like rents, interest earned on accounts, and the like. Direct Stategrants totaled $88,070,853 in fiscal 2000/2001, while direct Federal grants wereestimated to be $42,535,981. These are state and federal monies not otherwise available through the City and County, most often generated through competitivegrant applications to state and federal agencies. Taken together, these public sourcestotaled over $130,606,834 in annual revenues in fiscal 2000/2001, or 17% of theaggregate budgets of the nonprofit human service agencies.
These are funding sources vulnerable to both political and fiscal shifts at the state andfederal level. Especially during a recession, and more especially during a period of significant state and federal funding increases for security and war, these sources arevulnerable to both rescission and diversion. At a fundamental policy level, such diversions are counter-intuitive; it might be more sensible that during periods of recession, government funding might increase for needed human services, education,and social welfare. These expenditures might be considered reasonable investments inthe human “capital” required to pull the country, state, or region out of recession. Butthe politically imposed limits on local, state, and federal revenues (namely, a bipartisanaversion to tax increases), threatens these investments. And San Francisco’s nonprofithuman service providers are most immediately threatened.
Expenses
Using the same methodological tools we employed for calculating aggregatebudgets for the nonprofit human service providers, our survey resultsprovided aggregate estimates of annualized costs. Using the 2000/2001
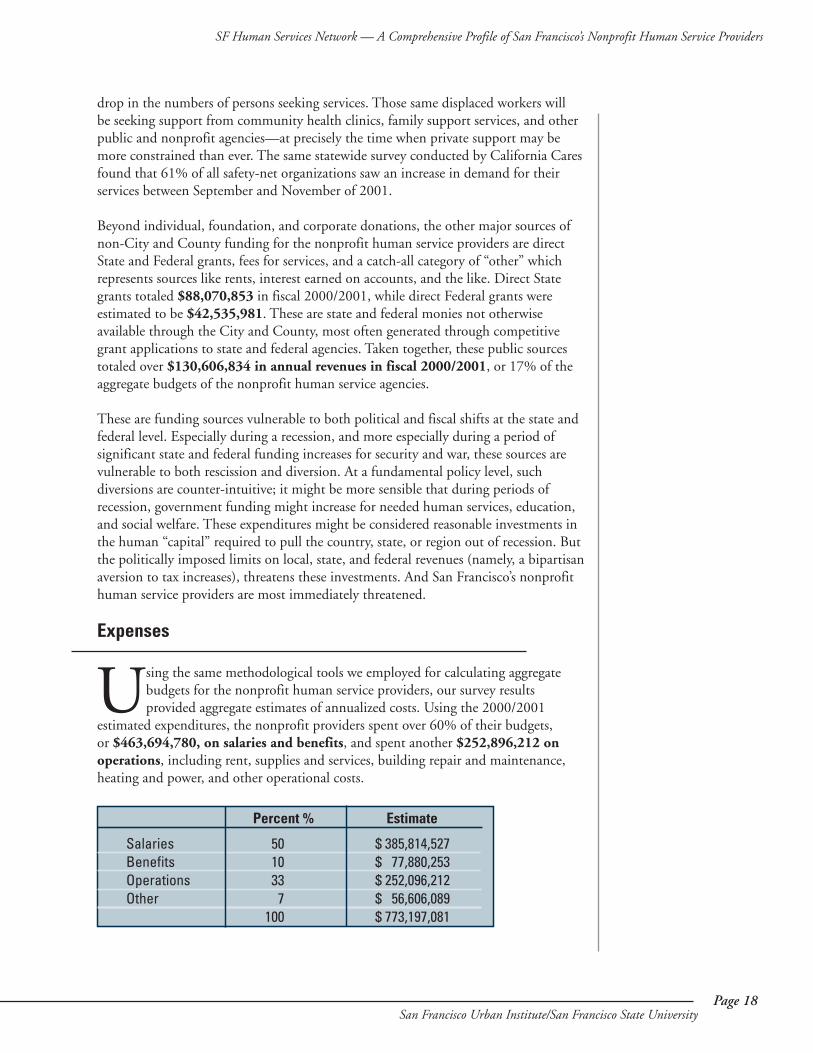
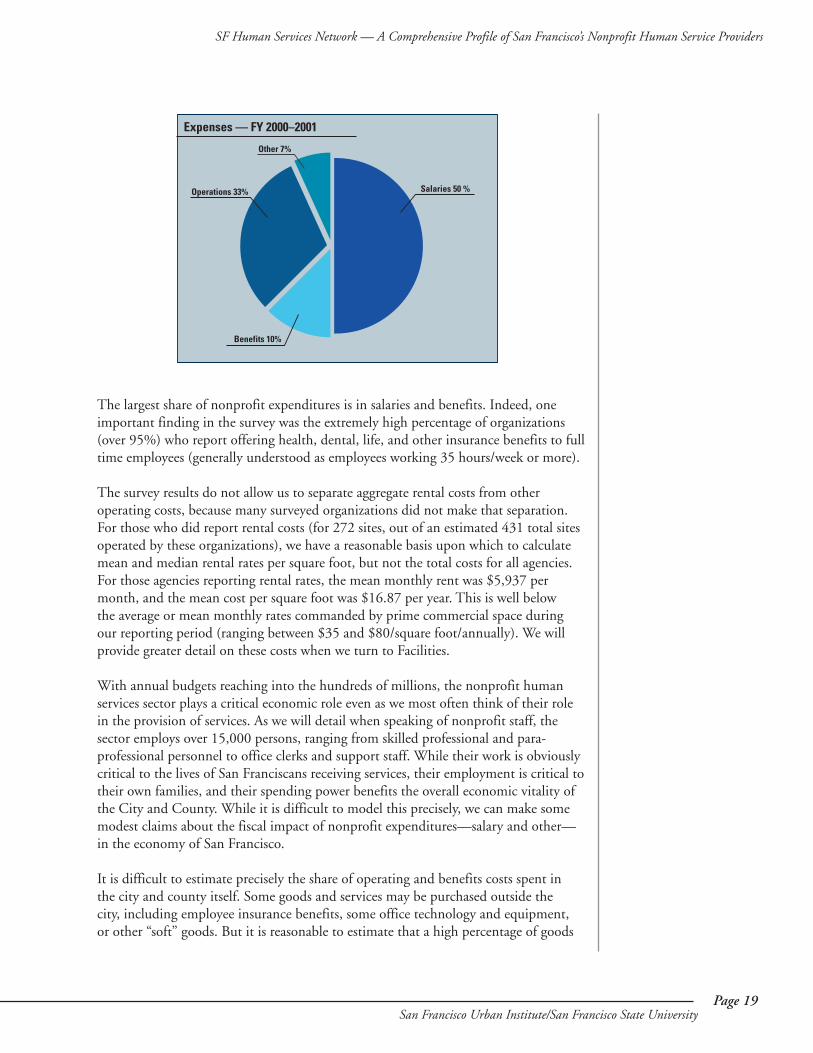
estimated expenditures, the nonprofit providers spent over 60% of their budgets, or $463,694,780, on salaries and benefits, and spent another $252,896,212 onoperations, including rent, supplies and services, building repair and maintenance,heating and power, and other operational costs.
SalariesBenefitsOperationsOther
Percent % Estimate
501033
7100
$ 385,814,527$ 77,880,253$ 252,096,212$ 56,606,089$ 773,197,081
SF Human Services Network — A Comprehensive Profile of San Francisco’s Nonprofit Human Service Providers
Page 19San Francisco Urban Institute/San Francisco State University
The largest share of nonprofit expenditures is in salaries and benefits. Indeed, oneimportant finding in the survey was the extremely high percentage of organizations(over 95%) who report offering health, dental, life, and other insurance benefits to fulltime employees (generally understood as employees working 35 hours/week or more).
The survey results do not allow us to separate aggregate rental costs from other operating costs, because many surveyed organizations did not make that separation.For those who did report rental costs (for 272 sites, out of an estimated 431 total sitesoperated by these organizations), we have a reasonable basis upon which to calculatemean and median rental rates per square foot, but not the total costs for all agencies.For those agencies reporting rental rates, the mean monthly rent was $5,937 permonth, and the mean cost per square foot was $16.87 per year. This is well below the average or mean monthly rates commanded by prime commercial space duringour reporting period (ranging between $35 and $80/square foot/annually). We willprovide greater detail on these costs when we turn to Facilities.
With annual budgets reaching into the hundreds of millions, the nonprofit humanservices sector plays a critical economic role even as we most often think of their rolein the provision of services. As we will detail when speaking of nonprofit staff, the sector employs over 15,000 persons, ranging from skilled professional and para-professional personnel to office clerks and support staff. While their work is obviouslycritical to the lives of San Franciscans receiving services, their employment is critical totheir own families, and their spending power benefits the overall economic vitality ofthe City and County. While it is difficult to model this precisely, we can make somemodest claims about the fiscal impact of nonprofit expenditures—salary and other—in the economy of San Francisco.
It is difficult to estimate precisely the share of operating and benefits costs spent in the city and county itself. Some goods and services may be purchased outside the city, including employee insurance benefits, some office technology and equipment, or other “soft” goods. But it is reasonable to estimate that a high percentage of goods
Other 7%
Salaries 50 %
Benefits 10%
Operations 33%
Expenses — FY 2000–2001
SF Human Services Network — A Comprehensive Profile of San Francisco’s Nonprofit Human Service Providers
Page 20San Francisco Urban Institute/San Francisco State University
and services is purchased locally, including—obviously—rent for neighborhood-based facilities, maintenance, and tools and equipment. Even with a discount of 20%, the nonprofit operations budgets alone release over $200,000,000 into the local economy.
By far the largest economic impact is in salaries. While we did not make inquiry inthis survey regarding the residency status of nonprofit staff, we know from previousanalysis of occupational and residency data that roughly 70% of employees in the categories most prevalent in nonprofit service providers are resident San Franciscans.Even discounting for expenditures made by these employees outside the city, we couldestimate that over $216,000,000 is released into the local purchasing stream bynonprofit staff.
Beyond simply accounting for the immediate economic impact of salaries, and thepurchase of goods, economists speak of the “multiplier” effect when trying to accountfor classic circulation effects when increased purchasing power is introduced into alocal economy. The multiplier effect tries to model the added value of new resources,as those resources increase the purchasing power of local buyers of goods, whose purchase of goods in turn increases the purchasing power of local vendors. In general,two conditions must occur if a multiplier effect is calculable: first, there must be newmoney introduced into a regional or local economy; second, goods and services arepurchased locally.
It could be argued that if the nonprofit human service providers did not exist theywould have to be invented, and the City and County dollars spent through themwould be spent in any event. In that sense the uniquely local dollars should not beused to calculate a multiplier effect. In the case of the nonprofit human serviceproviders, they introduce significant new resources into the economy—especiallyfunds from corporate, foundation, state, and federal grants. Discounting the localfoundation, corporate, and individual giving by half (under the proposition that theymight donate those resources through other local entities), and adding the remainderto the State and Federal grants, we estimate the nonprofit providers introduce roughly$224,000,000 in new resources into the local economy. Further discounting thisnumber by a share expected to be spent outside the city (let’s say 25%), the local multiplier effect in San Francisco’s economy would be over $285,600,000[($224x.75)x1.7]. By way of comparison, our estimates of the multiplier effect of raising the “Living Wage” of those providing services under contract to the City andCounty, or operating under leases with public agencies, was a modest $18,000,000.
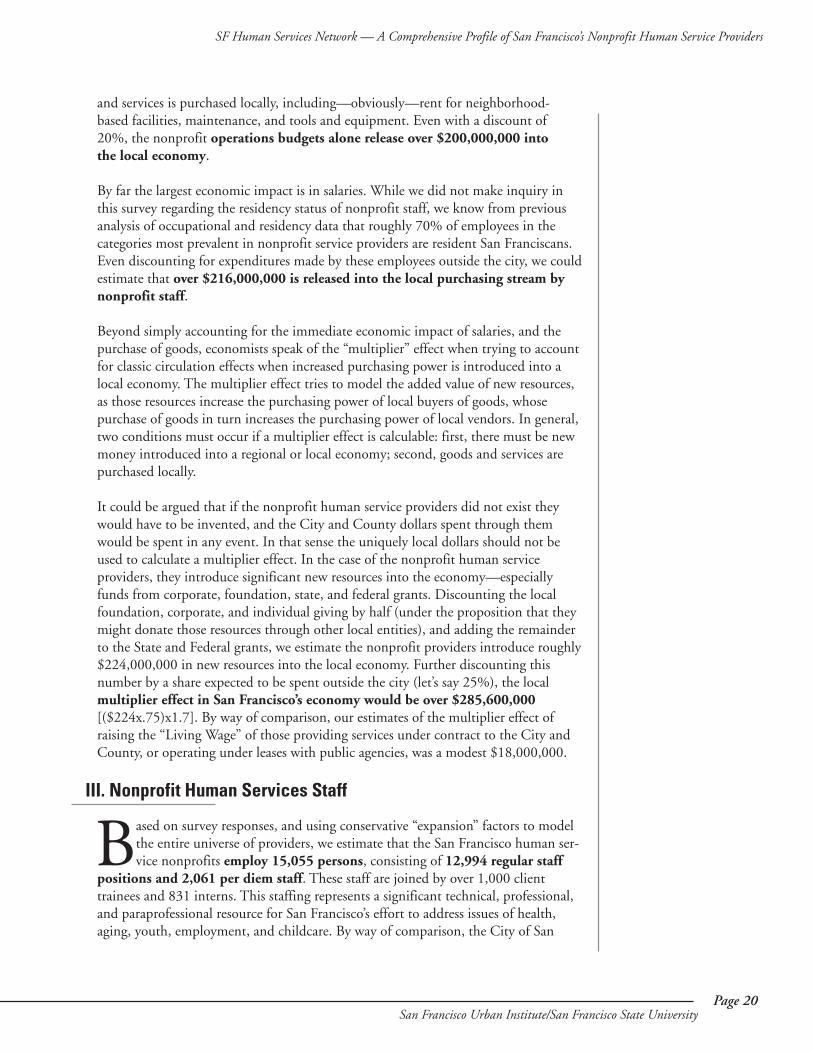
Based on survey responses, and using conservative “expansion” factors to modelthe entire universe of providers, we estimate that the San Francisco human ser-vice nonprofits employ 15,055 persons, consisting of 12,994 regular staff
positions and 2,061 per diem staff. These staff are joined by over 1,000 clienttrainees and 831 interns. This staffing represents a significant technical, professional,and paraprofessional resource for San Francisco’s effort to address issues of health,aging, youth, employment, and childcare. By way of comparison, the City of San
III. Nonprofit Human Services Staff
SF Human Services Network — A Comprehensive Profile of San Francisco’s Nonprofit Human Service Providers
Page 21San Francisco Urban Institute/San Francisco State University
Francisco currently (2001) employs just over 28,400 persons (in all categories, includ-ing public safety, MUNI, the trades, clerical, managerial, and professional).
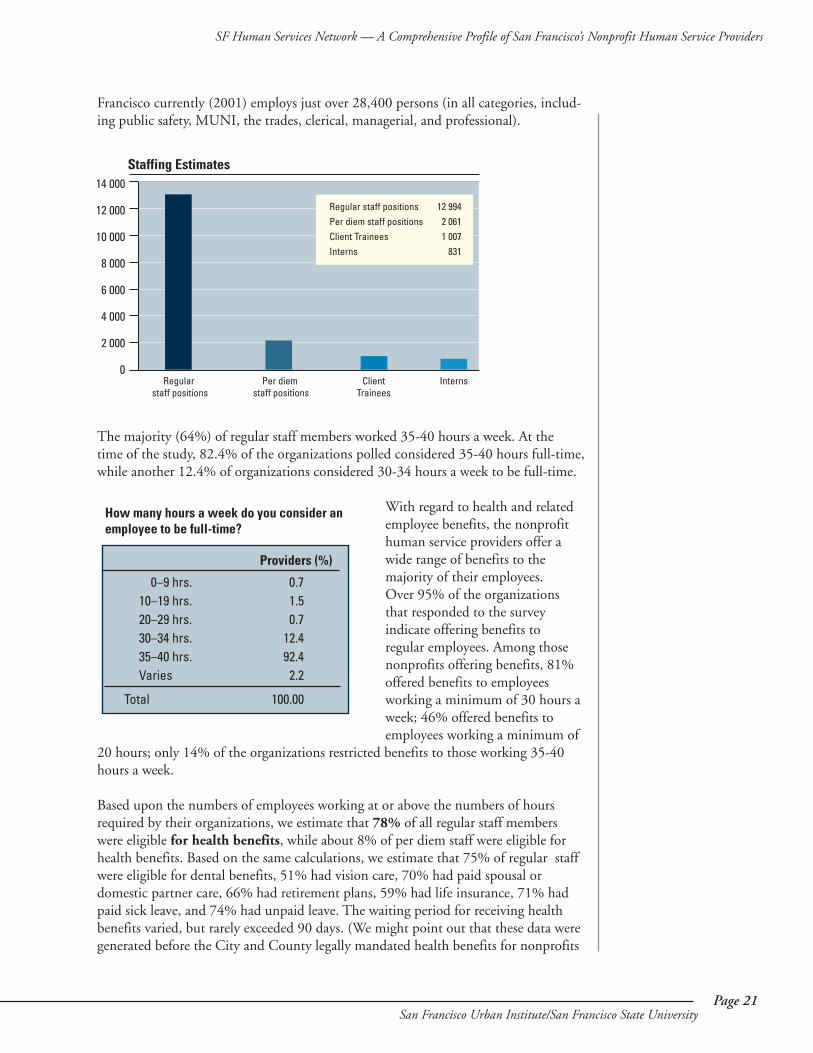
The majority (64%) of regular staff members worked 35-40 hours a week. At the time of the study, 82.4% of the organizations polled considered 35-40 hours full-time,while another 12.4% of organizations considered 30-34 hours a week to be full-time.
With regard to health and relatedemployee benefits, the nonprofithuman service providers offer awide range of benefits to themajority of their employees. Over 95% of the organizationsthat responded to the survey indicate offering benefits to regular employees. Among thosenonprofits offering benefits, 81%offered benefits to employeesworking a minimum of 30 hours aweek; 46% offered benefits toemployees working a minimum of
20 hours; only 14% of the organizations restricted benefits to those working 35-40hours a week.
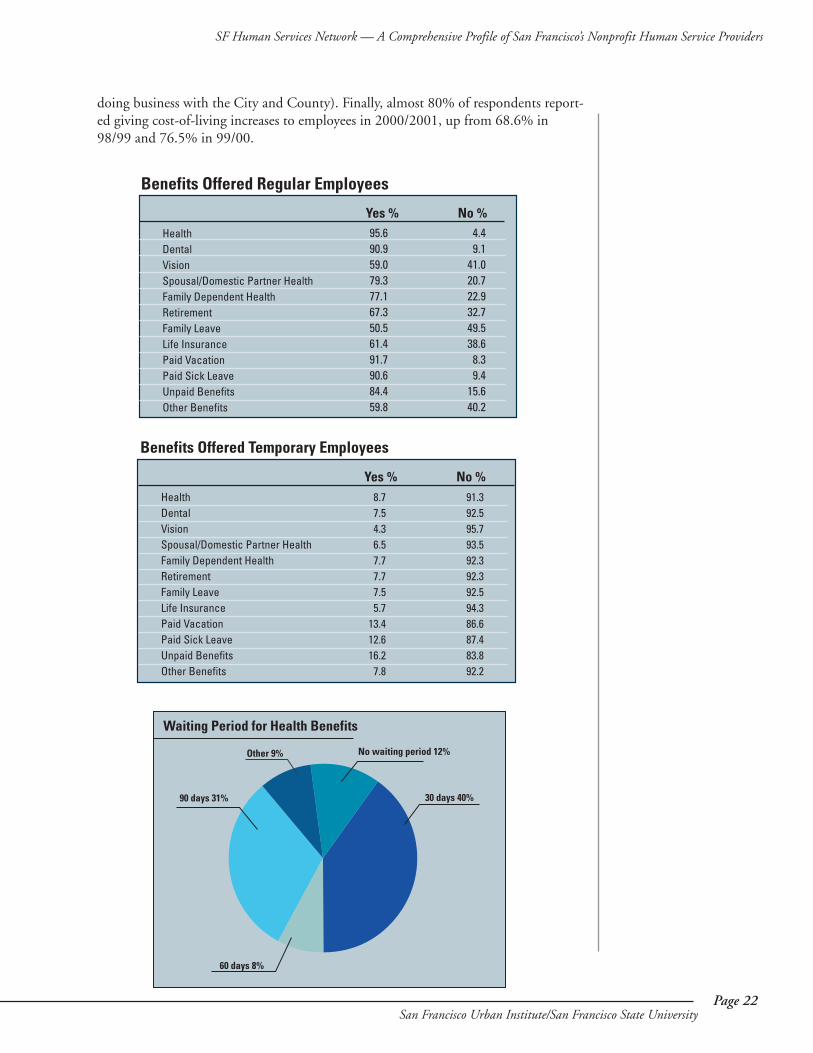
Based upon the numbers of employees working at or above the numbers of hoursrequired by their organizations, we estimate that 78% of all regular staff memberswere eligible for health benefits, while about 8% of per diem staff were eligible forhealth benefits. Based on the same calculations, we estimate that 75% of regular staffwere eligible for dental benefits, 51% had vision care, 70% had paid spousal ordomestic partner care, 66% had retirement plans, 59% had life insurance, 71% hadpaid sick leave, and 74% had unpaid leave. The waiting period for receiving healthbenefits varied, but rarely exceeded 90 days. (We might point out that these data weregenerated before the City and County legally mandated health benefits for nonprofits
Staffing Estimates14 000
12 000
10 000
8 000
6 000
4 000
2 000
0Regular
staff positionsPer diem
staff positionsClient
TraineesInterns
Regular staff positions 12 994Per diem staff positions 2 061Client Trainees 1 007Interns 831
0–9 hrs. 10–19 hrs. 20–29 hrs. 30–34 hrs. 35–40 hrs. Varies
Total
Providers (%)
0.71.50.7
12.492.4
2.2
100.00
How many hours a week do you consider an employee to be full-time?
SF Human Services Network — A Comprehensive Profile of San Francisco’s Nonprofit Human Service Providers
Page 22San Francisco Urban Institute/San Francisco State University
doing business with the City and County). Finally, almost 80% of respondents report-ed giving cost-of-living increases to employees in 2000/2001, up from 68.6% in98/99 and 76.5% in 99/00.
95.690.959.079.377.167.350.561.491.790.684.459.8
4.49.1
41.020.722.932.749.538.68.39.4
15.640.2
Benefits Offered Regular Employees
HealthDentalVisionSpousal/Domestic Partner HealthFamily Dependent HealthRetirementFamily LeaveLife InsurancePaid VacationPaid Sick LeaveUnpaid BenefitsOther Benefits
Yes % No %
Benefits Offered Temporary Employees
HealthDentalVisionSpousal/Domestic Partner HealthFamily Dependent HealthRetirementFamily LeaveLife InsurancePaid VacationPaid Sick LeaveUnpaid BenefitsOther Benefits
Yes % No %8.77.54.36.57.77.77.55.7
13.412.616.27.8
91.392.595.793.592.392.392.594.386.687.483.892.2
Other 9%
30 days 40%
60 days 8%
90 days 31%
Waiting Period for Health Benefits
No waiting period 12%
SF Human Services Network — A Comprehensive Profile of San Francisco’s Nonprofit Human Service Providers
Page 23San Francisco Urban Institute/San Francisco State University
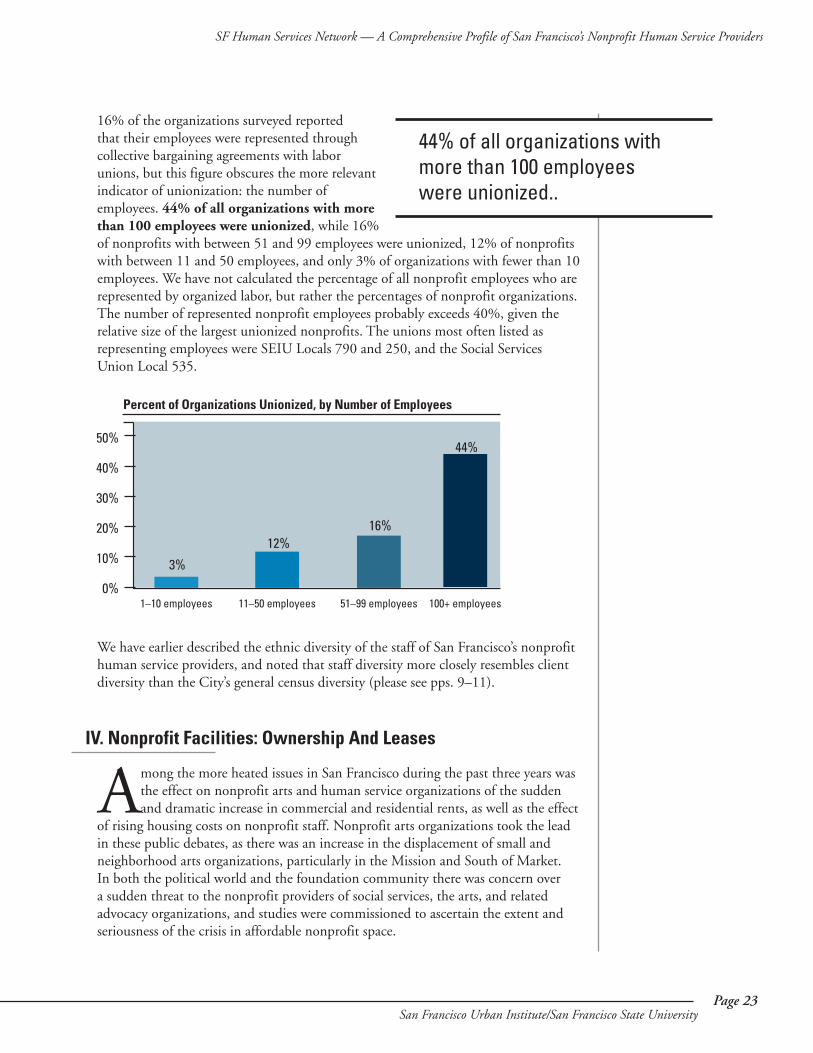
16% of the organizations surveyed reported that their employees were represented throughcollective bargaining agreements with laborunions, but this figure obscures the more relevantindicator of unionization: the number of employees. 44% of all organizations with morethan 100 employees were unionized, while 16%of nonprofits with between 51 and 99 employees were unionized, 12% of nonprofitswith between 11 and 50 employees, and only 3% of organizations with fewer than 10employees. We have not calculated the percentage of all nonprofit employees who arerepresented by organized labor, but rather the percentages of nonprofit organizations.The number of represented nonprofit employees probably exceeds 40%, given the relative size of the largest unionized nonprofits. The unions most often listed as representing employees were SEIU Locals 790 and 250, and the Social Services Union Local 535.
We have earlier described the ethnic diversity of the staff of San Francisco’s nonprofithuman service providers, and noted that staff diversity more closely resembles clientdiversity than the City’s general census diversity (please see pps. 9–11).
Among the more heated issues in San Francisco during the past three years wasthe effect on nonprofit arts and human service organizations of the suddenand dramatic increase in commercial and residential rents, as well as the effect
of rising housing costs on nonprofit staff. Nonprofit arts organizations took the leadin these public debates, as there was an increase in the displacement of small andneighborhood arts organizations, particularly in the Mission and South of Market. In both the political world and the foundation community there was concern over a sudden threat to the nonprofit providers of social services, the arts, and related advocacy organizations, and studies were commissioned to ascertain the extent andseriousness of the crisis in affordable nonprofit space.
44% of all organizations with more than 100 employees were unionized..
Percent of Organizations Unionized, by Number of Employees
50%
40%
30%
20%
10%
0%1–10 employees
3%
12%16%
44%
11–50 employees 51–99 employees 100+ employees
IV. Nonprofit Facilities: Ownership And Leases
SF Human Services Network — A Comprehensive Profile of San Francisco’s Nonprofit Human Service Providers
Page 24San Francisco Urban Institute/San Francisco State University
The most thorough of these studies was conducted by CompassPoint NonprofitServices, sponsored by a wide range of public agencies and philanthropicfoundations. Completed in October, 2000, a little less than a year before our survey,the CompassPoint analysis revealed a deep threat to nonprofit providers in the city.They reported that 58% of sites rented and leased by nonprofits were at risk within anear fifteen month period, though these sites were disproportionately shared by thesmaller organizations, and represented only 20% of all nonprofit leased space. Still, byany measure, this constituted a serious threat to a large group of nonprofits offering avariety of services.3
Our survey did not replicate the analysis conducted by CompassPoint, but did ask some of the samequestions. We found a greater degree of site ownershipthan had CompassPoint, and somewhat less anxietyabout potential displacement. We were surprised initially by the degree to which our results reflectedgreater stability and security for nonprofits than didthe CompassPoint analysis, but a careful comparisonof the survey respondents suggests some obvious explanations. Ours was an older and more establisheduniverse of nonprofits, included a couple of organizations of great size and resources, and did not include the most vulnerable of the smallernonprofits—in the arts and advocacy areas. And bothgroups of nonprofits did share a fundamental fear that rising rents would push nonprofits out of several neighborhoods in which many human service recipients reside.
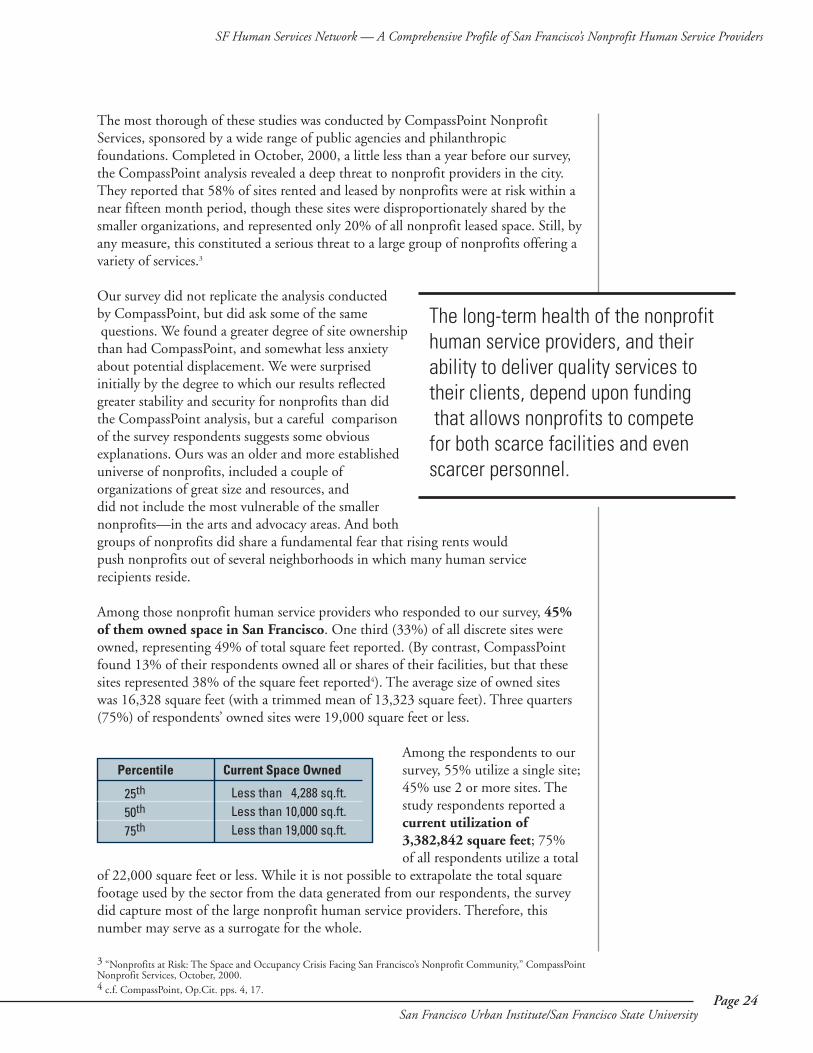
Among those nonprofit human service providers who responded to our survey, 45%of them owned space in San Francisco. One third (33%) of all discrete sites wereowned, representing 49% of total square feet reported. (By contrast, CompassPointfound 13% of their respondents owned all or shares of their facilities, but that thesesites represented 38% of the square feet reported4). The average size of owned sites was 16,328 square feet (with a trimmed mean of 13,323 square feet). Three quarters(75%) of respondents’ owned sites were 19,000 square feet or less.
Among the respondents to oursurvey, 55% utilize a single site;45% use 2 or more sites. Thestudy respondents reported acurrent utilization of3,382,842 square feet; 75% of all respondents utilize a total
of 22,000 square feet or less. While it is not possible to extrapolate the total squarefootage used by the sector from the data generated from our respondents, the surveydid capture most of the large nonprofit human service providers. Therefore, this number may serve as a surrogate for the whole.
3 “Nonprofits at Risk: The Space and Occupancy Crisis Facing San Francisco’s Nonprofit Community,” CompassPoint Nonprofit Services, October, 2000.4 c.f. CompassPoint, Op.Cit. pps. 4, 17.
Percentile Current Space Owned
Less than 4,288 sq.ft.Less than 10,000 sq.ft.Less than 19,000 sq.ft.
25th
50th
75th
The long-term health of the nonprofithuman service providers, and their ability to deliver quality services to their clients, depend upon fundingthat allows nonprofits to compete for both scarce facilities and evenscarcer personnel.
SF Human Services Network — A Comprehensive Profile of San Francisco’s Nonprofit Human Service Providers
Page 25San Francisco Urban Institute/San Francisco State University
Sixty-six percent (66%) of our respondents’ sites were rented, representing 51% (or1,725,249 square feet) of nonprofit human services space. For this particular group of nonprofits, nearly half of the space reported is protected from escalating rents byleases (compared to only 38% in the CompassPoint survey). This may account for therelatively low percentage of respondents (about 20%) citing affordable facility rent as amajor challenge they faced. Again, we need to point out that a significant number ofour respondents did not give figures for their facilities.
Of those who did report rental rates, the total monthly rent expenditure on 272 siteswas $1,454,600 (or $17,455,200 per year). (This compares to the CompassPointreport that found monthly rents of $1,466,456 on 337 sites, in October 2000). 14%of those who responded with specific rental information reported no rental costs, dueto donated space or facilities.
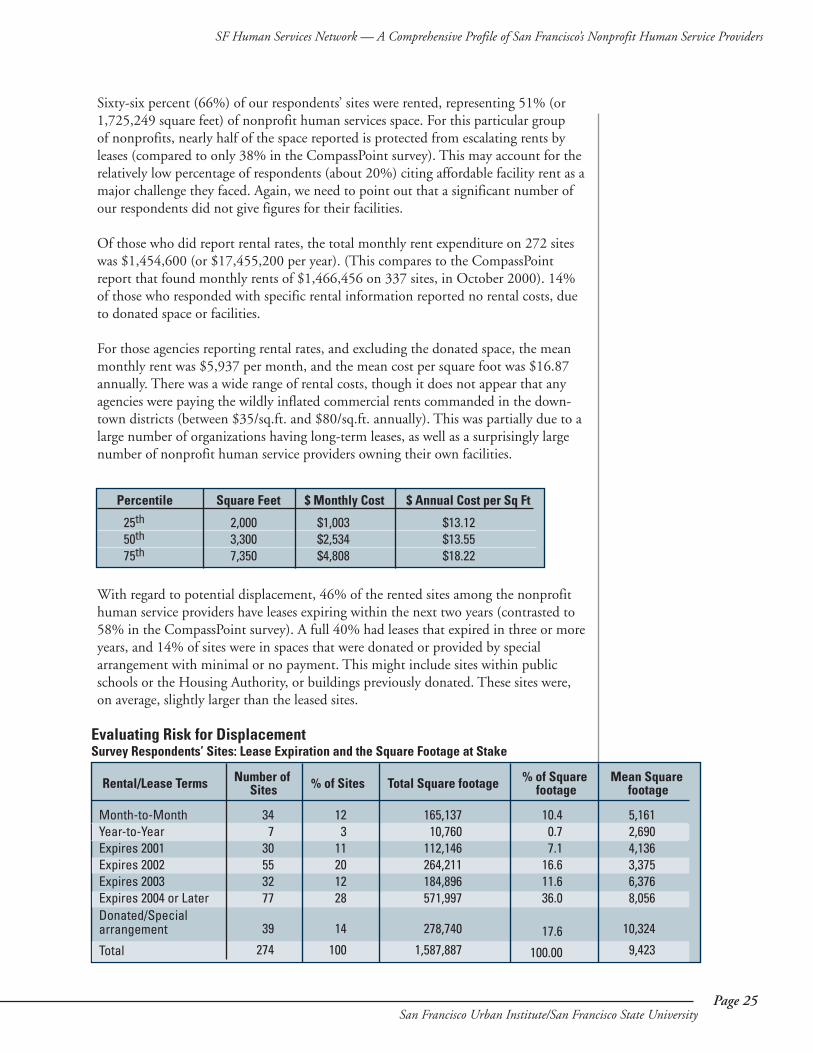
For those agencies reporting rental rates, and excluding the donated space, the meanmonthly rent was $5,937 per month, and the mean cost per square foot was $16.87annually. There was a wide range of rental costs, though it does not appear that anyagencies were paying the wildly inflated commercial rents commanded in the down-town districts (between $35/sq.ft. and $80/sq.ft. annually). This was partially due to alarge number of organizations having long-term leases, as well as a surprisingly largenumber of nonprofit human service providers owning their own facilities.
With regard to potential displacement, 46% of the rented sites among the nonprofithuman service providers have leases expiring within the next two years (contrasted to58% in the CompassPoint survey). A full 40% had leases that expired in three or moreyears, and 14% of sites were in spaces that were donated or provided by specialarrangement with minimal or no payment. This might include sites within publicschools or the Housing Authority, or buildings previously donated. These sites were,on average, slightly larger than the leased sites.
Percentile Square Feet
2,0003,3007,350
25th
50th
75th
$ Monthly Cost $ Annual Cost per Sq Ft
$1,003$2,534$4,808
$13.12$13.55$18.22
% of Square footage
Mean Square footage
10.40.77.1
16.611.636.0
17.6
100.00
5,1612,6904,1363,3756,3768,056
10,324
9,423
Rental/Lease Terms Number of Sites
Month-to-MonthYear-to-YearExpires 2001Expires 2002Expires 2003Expires 2004 or LaterDonated/Special arrangement
Total
% of Sites Total Square footage
347
30553277
39
274
123
11201228
14
100
165,13710,760
112,146264,211184,896571,997
278,740
1,587,887
Evaluating Risk for DisplacementSurvey Respondents’ Sites: Lease Expiration and the Square Footage at Stake
SF Human Services Network — A Comprehensive Profile of San Francisco’s Nonprofit Human Service Providers
Page 26San Francisco Urban Institute/San Francisco State University
If anxiety over the cost of facilities was a dominant theme among nonprofits—andin the press—during the past three years, our survey revealed a wider group ofpotential threats to the nonprofit human service providers. We asked nonprofit
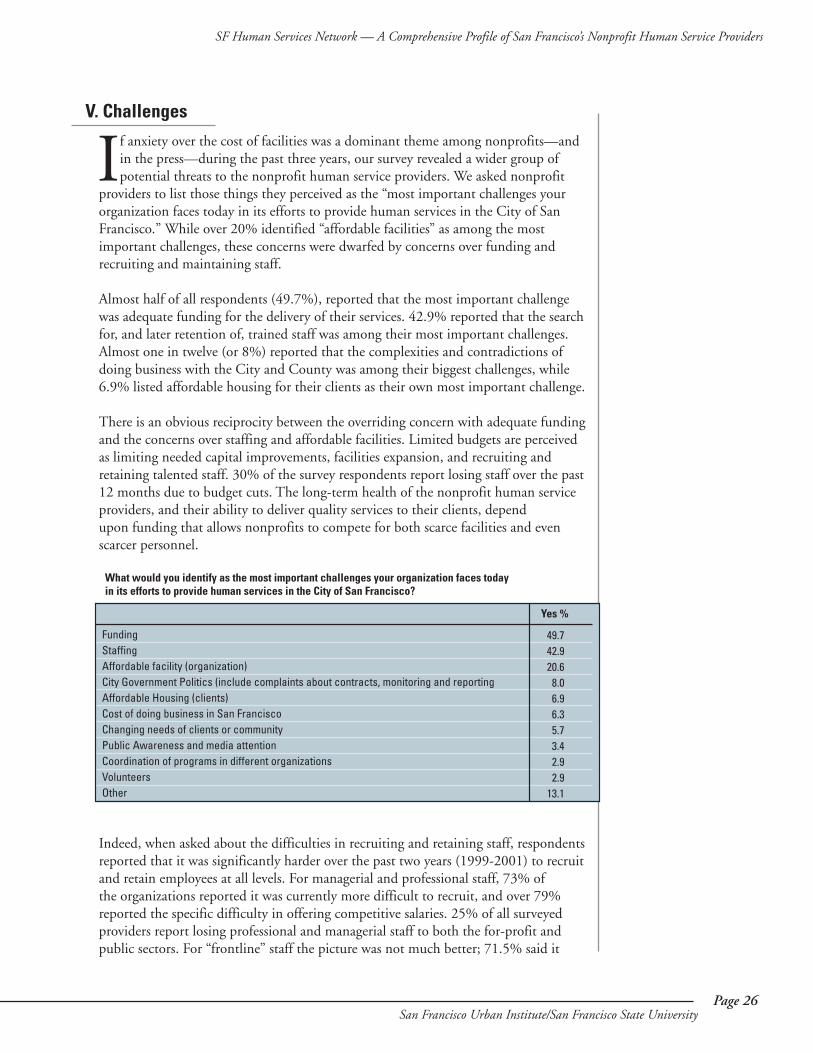
providers to list those things they perceived as the “most important challenges yourorganization faces today in its efforts to provide human services in the City of SanFrancisco.” While over 20% identified “affordable facilities” as among the mostimportant challenges, these concerns were dwarfed by concerns over funding andrecruiting and maintaining staff.
Almost half of all respondents (49.7%), reported that the most important challengewas adequate funding for the delivery of their services. 42.9% reported that the searchfor, and later retention of, trained staff was among their most important challenges.Almost one in twelve (or 8%) reported that the complexities and contradictions ofdoing business with the City and County was among their biggest challenges, while6.9% listed affordable housing for their clients as their own most important challenge.
There is an obvious reciprocity between the overriding concern with adequate fundingand the concerns over staffing and affordable facilities. Limited budgets are perceivedas limiting needed capital improvements, facilities expansion, and recruiting andretaining talented staff. 30% of the survey respondents report losing staff over the past12 months due to budget cuts. The long-term health of the nonprofit human serviceproviders, and their ability to deliver quality services to their clients, depend upon funding that allows nonprofits to compete for both scarce facilities and evenscarcer personnel.
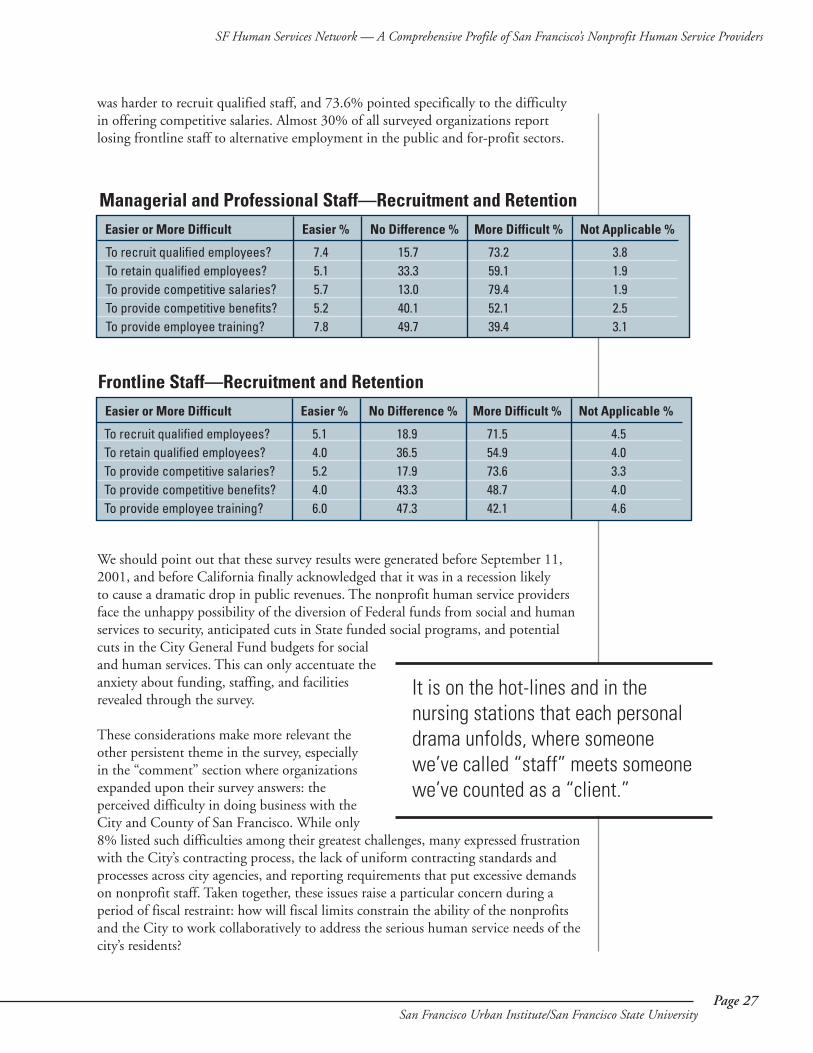
Indeed, when asked about the difficulties in recruiting and retaining staff, respondentsreported that it was significantly harder over the past two years (1999-2001) to recruitand retain employees at all levels. For managerial and professional staff, 73% of the organizations reported it was currently more difficult to recruit, and over 79%reported the specific difficulty in offering competitive salaries. 25% of all surveyedproviders report losing professional and managerial staff to both the for-profit andpublic sectors. For “frontline” staff the picture was not much better; 71.5% said it
Yes %
49.742.920.68.06.96.35.73.42.92.9
13.1
FundingStaffingAffordable facility (organization)City Government Politics (include complaints about contracts, monitoring and reportingAffordable Housing (clients)Cost of doing business in San FranciscoChanging needs of clients or communityPublic Awareness and media attentionCoordination of programs in different organizationsVolunteersOther
What would you identify as the most important challenges your organization faces today in its efforts to provide human services in the City of San Francisco?
V. Challenges
SF Human Services Network — A Comprehensive Profile of San Francisco’s Nonprofit Human Service Providers
Page 27San Francisco Urban Institute/San Francisco State University
was harder to recruit qualified staff, and 73.6% pointed specifically to the difficulty in offering competitive salaries. Almost 30% of all surveyed organizations report losing frontline staff to alternative employment in the public and for-profit sectors.
We should point out that these survey results were generated before September 11,2001, and before California finally acknowledged that it was in a recession likely to cause a dramatic drop in public revenues. The nonprofit human service providersface the unhappy possibility of the diversion of Federal funds from social and humanservices to security, anticipated cuts in State funded social programs, and potentialcuts in the City General Fund budgets for socialand human services. This can only accentuate theanxiety about funding, staffing, and facilitiesrevealed through the survey.
These considerations make more relevant the other persistent theme in the survey, especially in the “comment” section where organizationsexpanded upon their survey answers: the perceived difficulty in doing business with theCity and County of San Francisco. While only8% listed such difficulties among their greatest challenges, many expressed frustrationwith the City’s contracting process, the lack of uniform contracting standards andprocesses across city agencies, and reporting requirements that put excessive demandson nonprofit staff. Taken together, these issues raise a particular concern during a period of fiscal restraint: how will fiscal limits constrain the ability of the nonprofitsand the City to work collaboratively to address the serious human service needs of thecity’s residents?
More Difficult % Not Applicable %Easier or More Difficult Easier % No Difference %
Managerial and Professional Staff—Recruitment and Retention
73.259.179.452.139.4
3.81.91.92.53.1
To recruit qualified employees?To retain qualified employees?To provide competitive salaries?To provide competitive benefits?To provide employee training?
7.45.15.75.27.8
15.733.313.040.149.7
More Difficult % Not Applicable %Easier or More Difficult Easier % No Difference %
Frontline Staff—Recruitment and Retention
71.554.973.648.742.1
4.54.03.34.04.6
To recruit qualified employees?To retain qualified employees?To provide competitive salaries?To provide competitive benefits?To provide employee training?
5.14.05.24.06.0
18.936.517.943.347.3
It is on the hot-lines and in the nursing stations that each personaldrama unfolds, where someonewe’ve called “staff” meets someonewe’ve counted as a “client.”
SF Human Services Network — A Comprehensive Profile of San Francisco’s Nonprofit Human Service Providers
Page 28San Francisco Urban Institute/San Francisco State University
San Francisco’s nonprofit human service providers form an institutional networkof remarkable breadth, depth and strength. The numbers tell only one part ofthe story, of course, at an abstract and aggregate level. The real significance of
these organizations lies in each of the 431 sites they operate throughout San Francisco,in the person-to-person connection that results in a homeless child finding shelter, afrightened teen getting tested for HIV or another STD, a battered mother findingcomfort for her children and safety for herself. It is on the hot-lines and in the nursingstations that each personal drama unfolds, where someone we’ve called “staff ” meetssomeone we’ve counted as a “client.”
Despite the critical contribution this institutionalnetwork makes to vulnerable San Francisco individuals and families, the nonprofit humanservice providers have too often stayed at this personal level, and not understood their aggregatesignificance in the life of San Francisco. Eachorganization faces the threat of budget cuts, rent hikes, or the end of a long-term lease, largelyalone. They make funding appeals on their own,in the name of the individuals and the communities they serve. They negotiate their contracts with the City and County alone, often in competition with each other. And even as they operate in a dense web of client referrals and mutual assistance agreements around individual clients, they do not often plan together forlong-term survival.
This focus on the immediate, and on the particular organization, reflects the historical specificity with which each organization emerged, and the specific commitments each organization makes to serve a particular community or need. Butthese commitments are also political in the broadest sense; they reflect a commitmentto the poor and to those left out, as well as a commitment to provide public services ina community-based manner. And as each organization reflects on the current fundingcrisis, or on the affordability of housing and facilities, or on the difficulty of retainingqualified staffing, each is pulled towards a broader appreciation that they are not alonein these crises.
The numbers tell a sobering story: this is a network of organizations reaching a hugenumber of persons in need, managing an enormous aggregate budget for human services. If fully 40% of all dollars spent on human services in San Francisco isthrough the nonprofit providers, then a crisis among these providers is a crisis for the City and County. If the budget numbers suggest the magnitude of the share ofclients served by the nonprofits, then a crisis that threatens their clients threatens avery large number of San Franciscans.
How, then, to frame the policy issues suggested by this study? First, the study itselfreflects a growing awareness of the nonprofit human service providers as a “Sector,”sharing common problems, possessing the capacity to frame a common future. Theirability to plan together depends on the further development of this awareness, and
VI. Conclusion: To Partner or Not To Partner
...the share of services provided by the nonprofit human serviceproviders is so large that they cannot afford to continue to act independently...
SF Human Services Network — A Comprehensive Profile of San Francisco’s Nonprofit Human Service Providers
Page 29San Francisco Urban Institute/San Francisco State University
of mechanisms of mutual assistance and consultation as each faces their dilemmas and challenges otherwise alone. There are several institutional factors mitigatingagainst the nonprofits’ capacity to plan together: they are often in implicit or explicitcompetition with each other for scarce funding, and each cluster of organizationsrelates to different City, County, State or Federal bureaucracies, and responds to different funding timelines, different accountability expectations, and differentbureaucratic politics.
At the same time, more and more organizations are realizing that they share certainfundamental issues across bureaucratic or topical lines: they share a common interestin maintaining a tradition of community-based services, they share a common frustration with public bureaucracies and the often-shifting agendas of private foundations, they share a common commitment to ensuring that their clients receive full array of services.
These common interests are reflected in the data on “most significant challenges,” andin the specific data on facilities and staffing. They also reflect a larger awareness: thatthe share of services provided by the nonprofit human service providers is so large thatthey cannot afford to continue to act independently, that they constitute a significantinstitutional partner with public agencies, and that they need to be seen—and seethemselves—as such.
But what kind of partnership? This study is a preliminary analysis, providing a profile,the bare outline of magnitude, and characteristics and major issues—but not detailingthe relationships between public and nonprofit agencies. There is mutual distrustalong with mutual need, and a lack of clarity over who can or ought to provideservices. There is an on-going dispute between public sector unions, who seek an endto “contracting out,” and the nonprofits who see themselves as critical elements of acommunity-based strategy. There are on-going disputes over accountability, with public sector officials sometimes claiming a lack of accountability among nonprofitproviders, and nonprofit providers believing they are held more accountable than public agencies. And—most critically—there is an absence of sustained planning thatintegrates the services provided by the two sectors—public and nonprofit—in a waythat maximizes both their effectiveness and efficiency.
Indeed, there exists an on-going question regarding both the duplication (or redundancies) of service, and the efficiencies of modes of service. There are those whoquestion the richness of the array of services provided San Franciscans, and believethere are nonprofits providing services that could be better provided through publicagencies. There is a widespread belief among nonprofit providers that they serve moreclients for scarcer dollars, and that they do not have the administrative or bureaucraticoverhead required in public agencies. They do this under duress, in one regard, asmany nonprofit agencies believe they are underfunded in their administrative costsand salaries. They also believe that even if they were adequately funded for administration they would still be more efficient in delivering services.
These are arguments without immediate resolution—partly because no one has everdone a comparative analysis of service duplication, much less a study of efficiencies inthe different services offered by public and private sector agencies. More to the point,people may be talking past each other; it may be that the different kinds of services
SF Human Services Network — A Comprehensive Profile of San Francisco’s Nonprofit Human Service Providers
Page 30San Francisco Urban Institute/San Francisco State University
offered at the community-based and decentralizednonprofit sites are by definition different thanthose offered through more centralized, capitaland technology-intensive public institutions. If that is the case, then the costs associated withthem might vary enormously. It is hard to make judgements on these matters, absent any sustained comparative analysis.
In the end, however, it is in the political worldthat these issues will be resolved. There is noputative rational perspective from which onecould adjudicate the issues of efficiency, unionization, contracting out, duplication of services. The critical issue may be thedegree to which the nonprofit human service providers have the ability to organizethemselves into a coherent sector, represent themselves and their clients, and seekcommunity support for the services they offer. Such organizing may bring theminto an alliance with public sector unions and government leaders, as all share a common interest in maintaining a healthy and rich array of human services for SanFrancisco’s residents. Given this collective interest, the distance between these criticalplayers in San Francisco may be shorter and easier to bridge than the chasm betweenlocal human service providers—both nonprofit and public—and those national andstate forces who will seek cutbacks in public funding, the restriction of service programs, and a retreat from even modest supports for the poor.
The critical issue may be the degreeto which the nonprofit human service providers have the ability toorganize themselves into a coherentsector, represent themselves andtheir clients, and seek communitysupport for the services they offer.
SF Human Services Network — A Comprehensive Profile of San Francisco’s Nonprofit Human Service Providers
Page 31San Francisco Urban Institute/San Francisco State University
Questionnaire
In order to gather qualitative and quantitative data on the population of non-profithuman services providers contracting with the City and County of San Francisco, San Francisco State University’s Public Research Institute (PRI) and Urban Institute(SFUI) worked with members of the Human Services Network (HSN) to develop acomprehensive questionnaire. Questionnaire development was informed by recentsurveys developed by CompassPoint1, The Management Center2, and The New YorkCity Nonprofits Project3.
The questionnaire was organized into six sections as follows4:
• Background questions: This section included a question about the organization’s tax status, the year the organization began providing services in San Francisco, and primary and secondary service areas.
• Clients: This section included eight questions about the organization’s clientsincluding general demographics of clients, language in which services are provided, and possible change in the number of persons served by the agency.
• Space and Services: This section was comprised of a series of matrix questionsabout each space the organization owned or rented in San Francisco.Information requested included location of sites, square footage, mortgage/rent, lease/rental terms, services provided at site, hours in operation, numberof employees, and number of clients served at this site in the course of a year.
• Staff: This section comprised 13 matrix and multiple choice questions relatedto staffing. Information requested included number of staff and weekly hours,hours required to obtain benefits, types of benefits offered, ease of recruitment of management and frontline staff, whether or not staff had received COLA’srecently, whether or not the organization was unionized, ethnicity of staff, andsome information about client trainees and interns.
• Financial Resources: In this section, respondents were asked about their organization’s annual budget, organizational expenses and the source of funds, and city departments with which the organization contracts.
• Identifying Information: Respondents were asked to provide contact information so that they could be contacted with further questions and so theycould indicate whether or not they wanted a copy of the final report or moreinformation about joining the Human Services Network.
Respondents were also asked to identify the most important challenges facing themin their effort to provide human services in the City of San Francisco. The question-naire was mailed to 329 organizations in San Francisco April 18, 2001.
1 CompassPoint Nonprofit Services. Nonprofits at Risk: The Space and Occupancy Crisis Facing San Francisco’s NonprofitCommunity. October 2000, SanFrancisco. Authors: Jeanne Peters, Mike Allison, Christina Chan, Anushka. 2 The Management Center. The Management Center’s 2001 Wage & Benefit Survey of Northern California NonprofitOrganizations. 2001, San Francisco.3 The New York City Nonprofits Project, The 2000 Nonprofit Survey, 1999-2002. http://www.nycnonprofits.org/index.html4 A copy of the questionnaire is included in Appendix B.
Appendix A: Methodology
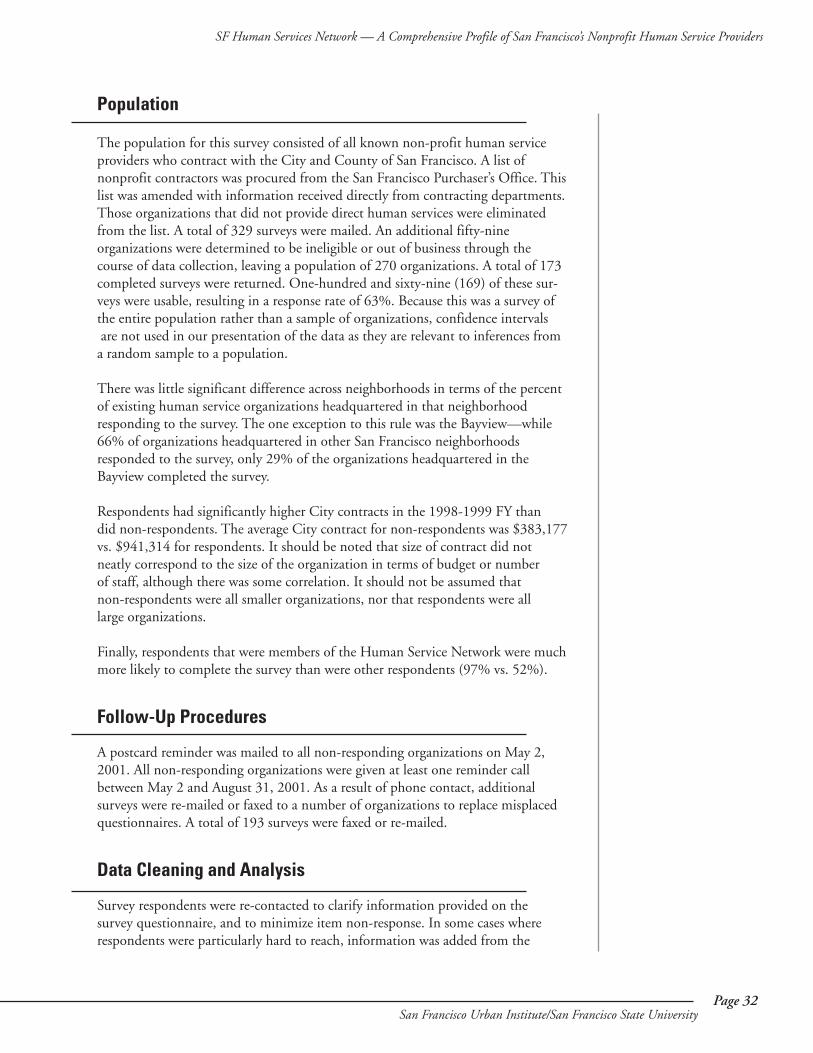
SF Human Services Network — A Comprehensive Profile of San Francisco’s Nonprofit Human Service Providers
Page 32San Francisco Urban Institute/San Francisco State University
Population
The population for this survey consisted of all known non-profit human serviceproviders who contract with the City and County of San Francisco. A list of nonprofit contractors was procured from the San Francisco Purchaser’s Office. Thislist was amended with information received directly from contracting departments.Those organizations that did not provide direct human services were eliminatedfrom the list. A total of 329 surveys were mailed. An additional fifty-nine organizations were determined to be ineligible or out of business through the course of data collection, leaving a population of 270 organizations. A total of 173completed surveys were returned. One-hundred and sixty-nine (169) of these sur-veys were usable, resulting in a response rate of 63%. Because this was a survey ofthe entire population rather than a sample of organizations, confidence intervalsare not used in our presentation of the data as they are relevant to inferences from a random sample to a population.
There was little significant difference across neighborhoods in terms of the percent of existing human service organizations headquartered in that neighborhood responding to the survey. The one exception to this rule was the Bayview—while 66% of organizations headquartered in other San Francisco neighborhoods responded to the survey, only 29% of the organizations headquartered in theBayview completed the survey.
Respondents had significantly higher City contracts in the 1998-1999 FY than did non-respondents. The average City contract for non-respondents was $383,177vs. $941,314 for respondents. It should be noted that size of contract did not neatly correspond to the size of the organization in terms of budget or number of staff, although there was some correlation. It should not be assumed that non-respondents were all smaller organizations, nor that respondents were all large organizations.
Finally, respondents that were members of the Human Service Network were muchmore likely to complete the survey than were other respondents (97% vs. 52%).
Follow-Up Procedures
A postcard reminder was mailed to all non-responding organizations on May 2,2001. All non-responding organizations were given at least one reminder callbetween May 2 and August 31, 2001. As a result of phone contact, additional surveys were re-mailed or faxed to a number of organizations to replace misplacedquestionnaires. A total of 193 surveys were faxed or re-mailed.
Data Cleaning and Analysis
Survey respondents were re-contacted to clarify information provided on the survey questionnaire, and to minimize item non-response. In some cases whererespondents were particularly hard to reach, information was added from the
SF Human Services Network — A Comprehensive Profile of San Francisco’s Nonprofit Human Service Providers
Page 33San Francisco Urban Institute/San Francisco State University
Guidestar Online Database of fiscal and operations information on IRS-recognizednonprofit organizations (http://www.guidestar.com/.)
Data were entered into three separate databases. One database was used to record data pertinent to the entire organization, another database was used to record datapertinent to organizations’ various sites, and one was used to record and analyze thequalitative answers to the question about significant challenges faced by nonprofitorganizations. Therefore, persons reading the report are cautioned to take note of differences between unit of analysis. It is important to be aware while reading thereport that the unit of analysis may be the organization as a whole, sites, clients,staff or budget dollars.
Nonprofit organizations providing direct human services under contract with theCity of San Francisco vary greatly in terms of size, with a small number of very large organizations and a large number of small to medium organizations. Becauseof the differences noted above between respondents and non-respondents, andbecause of the skew in the data on budget and staff size, caution was used in interpreting survey results. Estimation of the staffing levels, client contacts, expenses, budgets and funding by source were made from the survey population to the entire population of organizations (270). These estimates were made using medians rather than means or even 5% trimmed means in order to keep estimates conservative. Percents cited in the text of the report refer to the surveypopulation only.