Embed Size (px)
Citation preview
A Comprehensive Comparison of MANET Routing Protocols inSimulation, Emulation and the Real World
Erik Nordstrom, Per Gunningberg, Christian Rohner, Oskar WiblingUppsala University
AbstractThis paper presents a comprehensive comparison of the ad hocrouting protocols AODV, DSR and OLSR. We compare theprotocols in three predictable mobility scenarios using UDP, Pingand TCP traffic and we also study how their relative performancechange between simulation, emulation and the real world. Identicalprotocol implementations are used in all three environments. Thereal world experiments are done inside an office building withhighly variable radio signal strength. Laptops with MANETprotocols are carried around in the building according to scenariosin the form of instructions on the screens telling when and whereto go. The scenario approach makes the mobility pattern repeatablefrom one experiment to another and reproducible in the simulationand emulation. The approach allows us to do a relative side-by-sidecomparison of the routing protocols in all three environments andto compare results across the environments. We present an analysisof altogether 270 real world experiments with different scenarios,traffic characteristics on the three protocols. Our scenarios usefour nodes. Already at this scale, we find considerable andunexpected performance discrepancies between protocols in thedifferent evaluation environments.
We emphasize two important conclusions from our results.First, the relative real world performance between the protocolsis not consistent across scenarios and traffic types compared tosimulation. For example, between simulation and the real worldAODV experiences a reduction in UDP delivery ratio of around10% in one of our scenarios. The same figures for DSR and OLSRare 35% and 20%, respectively. Second, the real world performancevariance for some protocols is so large that it makes the comparisonless conclusive compared to simulation or emulation. The mostimportant factor to this observed variance is the large variance inradio channel quality.
1 Introduction
The mobile ad hoc network (MANET) routing protocols,AODV [19], DSR [13] and OLSR [8] have been researchedfor many years and are considered for standardization inthe IETF1. The research behind these protocols has mainlybeen performed using simulations and emulations. Most ofthem have been based on fairly simple radio models (e.g.,open space models), which have problems to capture signal
1Internet Engineering Task Force.
strength distributions of complex surroundings such as insidebuildings. Furthermore, synthetic mobility models that arenormally used, seldom incorporate structural layouts, suchas rooms, walls, and corridors. As a consequence there isa high uncertainty regarding how well simulated protocolscope with these more complex environments. Still, existingsimulation models are excellent tools to study scalabilityissues as well as sensitivity to variations in parameter values.They are also attractive since simulation experiments areperfectly repeatable.
Previous studies indicate considerable performancediscrepancies between real world and simulations [14], [16].These studies observe the difference but do not quantifythe impact on different routing protocols in comparison.Given this observation we formulated our problem with thefollowing question: If one protocol performs better thananother in simulation, is it possible to assume the same forthe real world? The big picture result of our study says: ”No- it is not the case. None of the protocols do consistentlybetter than the others when varying mobility and trafficscenarios. Instead, our results indicate that all have severeand protocol specific problems in our indoor surroundings,making their performance inconsistent between the realworld and simulation.”
The main contribution is our comprehensive performancecomparison of the MANET protocols AODV, DSR, andOLSR, using a set of real world scenarios, recreated insimulation and emulation. In our comparison we:
1. Compare and discuss, side-by-side, the performanceof the major MANET routing protocols to understandthe trade-offs in the design choices of the differentprotocols and whether these choices are affecteddifferently by simulation or emulation compared to thereal world.
2. Explore the utility of simulation and emulation inrelation to the real world. We study discrepancies inthe results that could either improve the confidence inprevious simulation models or that indicate the need forfurther exploration or a refinement of models.
The fact that we can study the relative performance ofrouting protocols and at the same time evaluate them in thereal world, simulation and emulation we consider as novel.
1
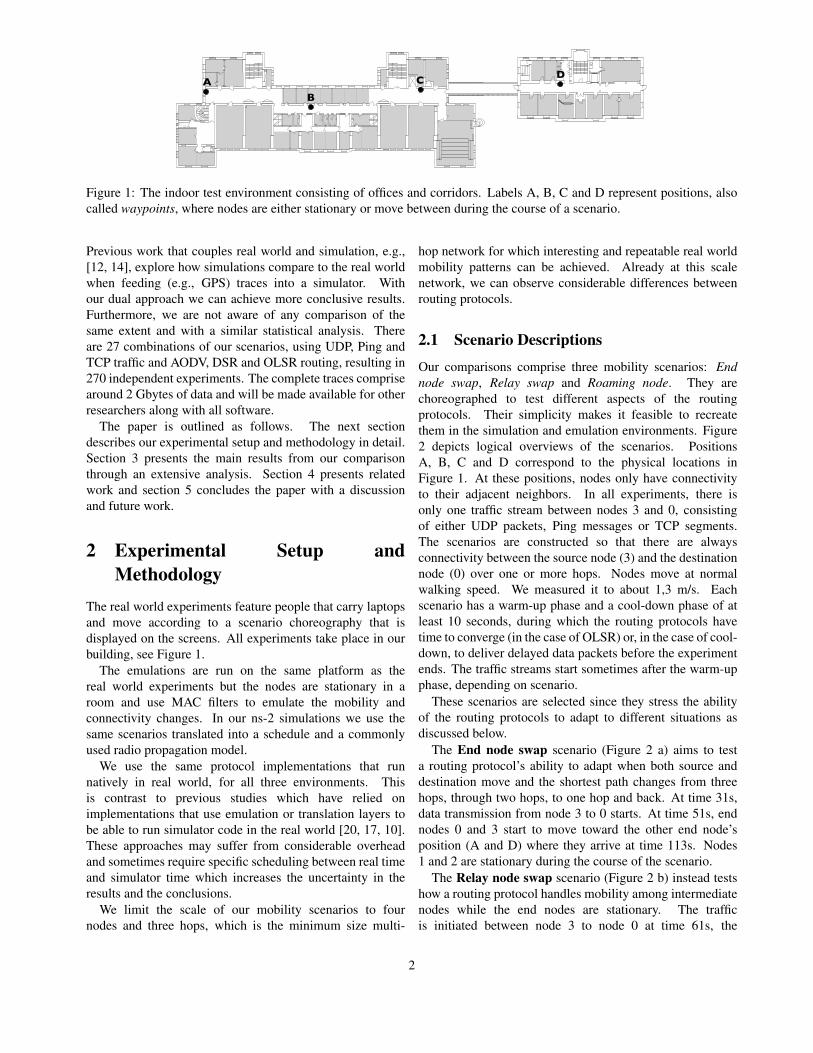
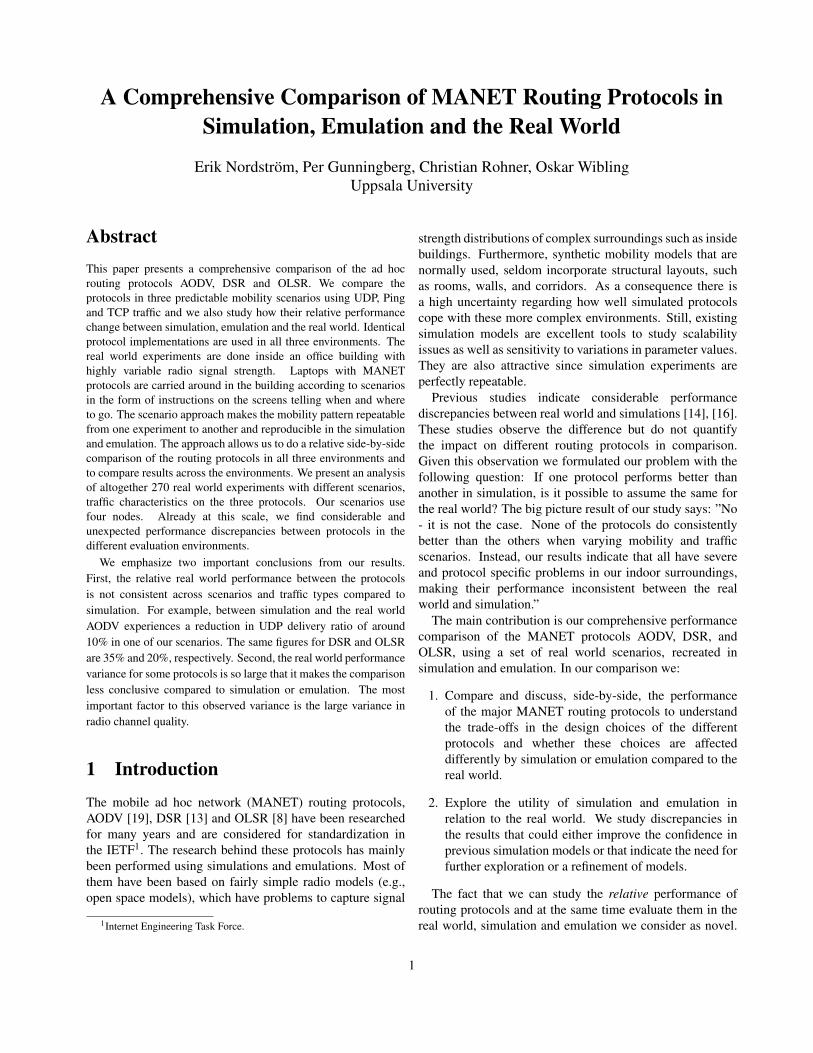
Figure 1: The indoor test environment consisting of offices and corridors. Labels A, B, C and D represent positions, alsocalled waypoints, where nodes are either stationary or move between during the course of a scenario.
Previous work that couples real world and simulation, e.g.,[12, 14], explore how simulations compare to the real worldwhen feeding (e.g., GPS) traces into a simulator. Withour dual approach we can achieve more conclusive results.Furthermore, we are not aware of any comparison of thesame extent and with a similar statistical analysis. Thereare 27 combinations of our scenarios, using UDP, Ping andTCP traffic and AODV, DSR and OLSR routing, resulting in270 independent experiments. The complete traces comprisearound 2 Gbytes of data and will be made available for otherresearchers along with all software.
The paper is outlined as follows. The next sectiondescribes our experimental setup and methodology in detail.Section 3 presents the main results from our comparisonthrough an extensive analysis. Section 4 presents relatedwork and section 5 concludes the paper with a discussionand future work.
2 Experimental Setup andMethodology
The real world experiments feature people that carry laptopsand move according to a scenario choreography that isdisplayed on the screens. All experiments take place in ourbuilding, see Figure 1.
The emulations are run on the same platform as thereal world experiments but the nodes are stationary in aroom and use MAC filters to emulate the mobility andconnectivity changes. In our ns-2 simulations we use thesame scenarios translated into a schedule and a commonlyused radio propagation model.
We use the same protocol implementations that runnatively in real world, for all three environments. Thisis contrast to previous studies which have relied onimplementations that use emulation or translation layers tobe able to run simulator code in the real world [20, 17, 10].These approaches may suffer from considerable overheadand sometimes require specific scheduling between real timeand simulator time which increases the uncertainty in theresults and the conclusions.
We limit the scale of our mobility scenarios to fournodes and three hops, which is the minimum size multi-
hop network for which interesting and repeatable real worldmobility patterns can be achieved. Already at this scalenetwork, we can observe considerable differences betweenrouting protocols.
2.1 Scenario Descriptions
Our comparisons comprise three mobility scenarios: Endnode swap, Relay swap and Roaming node. They arechoreographed to test different aspects of the routingprotocols. Their simplicity makes it feasible to recreatethem in the simulation and emulation environments. Figure2 depicts logical overviews of the scenarios. PositionsA, B, C and D correspond to the physical locations inFigure 1. At these positions, nodes only have connectivityto their adjacent neighbors. In all experiments, there isonly one traffic stream between nodes 3 and 0, consistingof either UDP packets, Ping messages or TCP segments.The scenarios are constructed so that there are alwaysconnectivity between the source node (3) and the destinationnode (0) over one or more hops. Nodes move at normalwalking speed. We measured it to about 1,3 m/s. Eachscenario has a warm-up phase and a cool-down phase of atleast 10 seconds, during which the routing protocols havetime to converge (in the case of OLSR) or, in the case of cool-down, to deliver delayed data packets before the experimentends. The traffic streams start sometimes after the warm-upphase, depending on scenario.
These scenarios are selected since they stress the abilityof the routing protocols to adapt to different situations asdiscussed below.
The End node swap scenario (Figure 2 a) aims to testa routing protocol’s ability to adapt when both source anddestination move and the shortest path changes from threehops, through two hops, to one hop and back. At time 31s,data transmission from node 3 to 0 starts. At time 51s, endnodes 0 and 3 start to move toward the other end node’sposition (A and D) where they arrive at time 113s. Nodes1 and 2 are stationary during the course of the scenario.
The Relay node swap scenario (Figure 2 b) instead testshow a routing protocol handles mobility among intermediatenodes while the end nodes are stationary. The trafficis initiated between node 3 to node 0 at time 61s, the
2
3210
A B
24 m 26 m 32 m
C D
1.3 m/s
89s
51s
51s 113s
95s113s 75s
69s
a)
3210
A B
24 m 26 m 32 m
C D
1.3 m/s
81s
101s 81s
101sb)
3
210
A B
24 m 26 m 32 m
D
1.3 m/s
C
26s 88s
150s 88s
44s 64s
112s132s
c)
Figure 2: Logical overview of the three scenarios: (a) Endnode swap, (b) Relay node swap and (c) Roaming node. Thedotted lines indicate movement and the times indicate whennodes start to move and when they pass the waypoints A, B,C and D.
relay nodes 1 and 2 start to change positions at time 81s.When they meet in the middle, our node placement allows,depending on the current connectivity, a two hop routebetween end nodes 0 and 3 using either one of the relaynodes as an intermediary. The relay nodes reach theirdestinations at time 101s.
The Roaming node scenario (Figure 2 c) starts with onehop between node pairs 0 and 3 in contrast to the otherscenarios. Also, there is no movement among potential relaynodes. Instead, node 3 “roams” the network, moving fromposition A to position D and back during the course of thescenario. All other nodes are stationary and only forwardtraffic. When initiating the traffic at time 26s, node 3 startsits movement from position A toward position D. At time88s, node 3 has reached position D and heads back towardposition A, which it reaches at time 150s. The Roamingnode scenario aims to mimic, for example, a mesh networkwhere a user (node 3) is mobile and communicates with agateway (node 0). Here we study the effect of increasingpath length and the route optimization behavior when node3 moves back.
2.2 Coupling the Real World, Emulation andSimulation
Table 1 lists a number of factors in which the real world,emulation and simulation differ for our experiments. Weknow from previous work that the radio is an importantfactor for explaining performance discrepancies between theplatforms [14]. In order to study its impact we try to controlthe other factors. Mobility is handled with choreography
and scenarios. Hardware and software are identical whileprotocol logic is varied with the routing protocols, butotherwise the same between the platforms. Through thisharmonization we can use simulation and emulation as abaseline for the protocols and gradually expose the radiofactors of the real world.
Environment Routing Logic HW Stack Mobility RadioReal World
√ √ √ √ √
Emulation√ √ √
Partial PartialSimulation
√× Model Model Model
Table 1: Relationship between the real world, emulation andsimulation in terms of Routing logic, Hardware, Networkingstack, Mobility and Radio environment. A
√means that
the element is genuine and not a model or, by restrictions,partial. A × indicates absence of an element.
The real world and the emulated experiments use theAd hoc Protocol Evaluation (APE) testbed [15], which ispublicly available. APE is driven by scenario descriptionsto ensure that the mobility pattern is repeatable fromone experiment to another, modulo the natural variancecaused by people moving around with laptops. We haverun complementary experiments to quantify this variance,by varying the mobility artificially and by having peopleinterfere. The results show that this variance is notsignificant for the experiments in this paper.
When an experiment is conducted, APE reads commandsfrom the scenario file and executes them at the specifiedtime. The scenarios schedule the traffic load and containinstructions to the persons carrying the laptops. As trafficwe use either synchronous UDP or Ping traffic (CBR) ora TCP file transfer. APE logs all traffic seen by all nodesduring the experiments. By matching the time stamps of alllogged packets from all nodes after the experiment, we geta complete global view of the whole experiment. The bulkof our post experiment analysis is based on this information.The logging adds overhead which has some effect on TCPthroughput. Our UDP and Ping measurements are notaffected by this logging.
All APE computers are identically configured IBMThinkpad X31 laptops. APE version 0.5, built with Linuxkernel 2.6.9 is used for all experiments. The WiFi interfacesare PC-card based Lucent (Orinoco) silver cards supportingthe IEEE 802.11b standard. The cards use the AgereSystems Linux driver version 7.18 (March 2004), which wehave updated to support Linux kernel 2.6 and an updatedwireless extension API. This driver comes with its ownfirmware that is dynamically loaded on to the card atinitialization. All our experiments are run with the driverset to 11Mbps fixed rate with RTS/CTS turned off [21].
3
2.2.1 Emulation
The emulations use the same HW/SW platform as the realworld experiments including the wireless cards. Nodes arestationary and in close proximity, e.g., in the same roomand their radios will intentionally interfere with each other.This type of emulation is relative simple, but also quitecommon and allows comparisons to previous work [10]. Theconnectivity changes, due to mobility, are emulated usingMAC filters by selectively filtering traffic between nodes.The times to enable and disable the filters are extractedfrom traces generated in the real world experiments. Aconnectivity change matches the time when the real worldsignal strengths causes a change of connectivity. We do notintroduce any variance in this connectivity time.
This filtering schedule is added to the APE scenarioschedule making the connectivity changes completelypredictable. The channel quality is high and stable until achange. Besides the predictability the approach eliminatesthe impact of, for example, gray zones [16] when the signalstrength is so weak that the connectivity fluctuate and thereare other radio propagation phenomena that degrade theradio channel. The emulation results can therefore, whencompared to the real world results, give an indication ofthe impact of these phenomena on the different routingprotocols. Although nodes are stationary in the emulation, itis important to observe that there are still some internal andexternal radio interferences that may impact the experiments.However, our measurements show that this variance isnegligible in our context.
2.2.2 Simulation
For the simulation we use ns-2 version 2.29. We recreatemobility in ns-2 to match the scenarios from APE. Nodesare configured in a chain topology with logical placementand distance matching real world measurements. The nodemovement speed is programmed to a speed between 1.33±0.0125 m/s. This gives a variance in the times when eachwaypoint is passed of up to two seconds. In the real worldexperiments, each waypoint is reached within 1-2 seconds ofthe scripted time.
Parameter ValuePt 0.031622777freq 2.472e9CSThresh 5.011872e-12RXThresh 1.45647e-09RTSThreshold 2000
Table 2: Simulation parameters to mimic an 802.11b WiFicard with a transmit radius of 45 meters (indoors) andRTS/CTS turned off.
The choice of a radio model to match the actualenvironment is delicate. We settled on using the standardns-2 TwoRayGround model to be comparable to othersimulation studies and to determine whether this commonly
used model can be used to predict the real world performanceof our routing protocols. However, to make this simplemodel match our experimental indoor set-up better, we tunedthe WiFi transmission range to 45m. It is slightly longer thanthe measured average value. The real values vary, of course,much more unpredictable with the actual building layout.We believe that the simulations still provide a convincingreference to the emulation and real world experiments. Thechosen parameters for the radio model are listed in Table 2.
2.3 Routing ProtocolsThe MANET working group [1] intends to standardize onereactive and one proactive protocol based on AODV, DSRand OLSR. Current candidates are DYMO [6] and OLSRv2[4]. There are two main reasons why these two protocols arenot in our comparison. First, they are not yet as mature,e.g., in terms of implementations. Second, DYMO andOLSRv2 are evolutionary steps from AODV and OLSR,mainly differing in packet header format. Therefore, weanticipated that by comparing AODV, DSR and OLSR2,there could be valuable input for the design choices of bothDYMO and OLSRv2. In the following sections we give abrief overview of AODV, DSR and OLSR focusing on thedifferentiating aspects and implementation specific details.For more complete descriptions we refer to the literature orrespective RFCs.
2.3.1 Ad hoc On-demand Distance Vector Routing
AODV only disseminates routing updates on-demand, whena route to a new destination is needed. The sourcenode floods the network with a broadcast route request(RREQ). Upon reception of this RREQ, the destination or anintermediate node with a route to the destination replies witha unicast route reply (RREP). Forwarding state is configuredon intermediate nodes as these request-reply messagestraverse the network. The routing tables are soft state andentries time out when packets are no longer forwarded ona route. Because routing updates are not periodic, AODVmust monitor links between neighbors to detect link failures,either with periodic HELLO beacons or using link layerfeedback. Link layer feedback is often the more efficient, butis only available in the ns-2 simulation. HELLO messagesare sent using broadcast and do not guarantee symmetriclink connectivity. The AODV implementation used in thisevaluation is AODV-UU v0.9.1 [3].
2.3.2 Dynamic Source Routing
DSR is also an on-demand protocol and features similarroute discovery as AODV. However, forwarding state isnot configured on intermediate nodes in the request-reply
2TBRPF [18] is also a MANET protocol, but it is excluded fromour comparison because there are no implementations due to intellectualproperty right (IPR) issues [5].
4
phase. Instead, routing information is accumulated incontrol messages as they traverse the network. Each nodecaches this information and builds its own local view ofthe network connectivity. End nodes use the informationto build complete source routes, listing all nodes fromsource to destination. A source route is appended to allpackets and intermediate nodes only use this source routeto forward data. DSR’s link monitoring is based on networklayer acknowledgements (nlACKs), which is a mechanismthat periodically exchanges ACK-request – ACK messagesover active links to monitor connectivity. The timeoutvalue for a link is dynamically determined from link RTTmeasurements, similarly to TCP timeouts. In contrast toAODV, DSR can support automatic route shortening. Usingpromiscuous mode a node can overhear packets and, byinspecting the source route, discern whether an optimizationcan be performed and then notify the sender. We use theDSR-UU implementation v0.2 [3]. DSR-UU implementslink monitoring using nlACKs and alternatively link layerfeedback in ns-2. DSR ACK requests are piggybacked ondata if possible, but ACKs require an extra transmission.DSR-UU reserves 50 bytes of space for the variable lengthDSR header in each data packet, effectively reducing theoptimal amount of data in each packet. This fixed sizereduces implementation complexity, but also reduces thecapacity.
2.3.3 Optimized Link State Routing
Unlike AODV and DSR, OLSR is a proactive link stateprotocol similar to OSPF, but with optimizations for ad hocnetworks that reduce control traffic overhead and increasereactivity to topological changes. OLSR minimizes controltraffic overhead in two ways. First, by using multi-pointrelays (MPRs) to transmit control messages through thenetwork. Second, by only requiring partial link stateinformation to be flooded.
OLSR relies on HELLO messages to maintain a neighborset. In a HELLO message, a node announces its link set,neighbor set and MPR set. These messages only reach directneighbors. In contrast to AODV, OLSR requires a symmetriclink to establish connectivity with a neighbor. Actual linkstates are only propagated throughout the network by MPRsin Topology Control (TC) messages. TC messages containsufficient link state to build the topology information baseand to perform route calculation. Because of the proactivenature of OLSR, the protocol needs time to converge andreacts more slowly to topological changes. We use theOOLSR implementation v0.99.15 in our experiments [2].
2.4 Traffic Configuration
All experiments have one data flow between a source node toa sink node consisting of either synchronous UDP packets,Ping or a TCP file transfer session. The CBR rate for UDP
and Ping is 20 packets per second while TCP transmits withthe highest achievable rate. UDP and Ping have no adaptivemechanisms such as congestion control. Therefore, UDP isused to sample the network connectivity and to measure theroute latency. Ping requests are sent to the sink node, whichthen generates a reply packet for each received request. Therequest-reply mechanism is used to examine bidirectionalconnectivity and to measure the round trip times (RTT). TCPis used to study the effect of congestion control and reliabledelivery.
We wanted to use the same packet size for all three trafficcases to minimize differences in size induced loss. Wesettled on 1378 bytes to allow for the DSR header in UDPand Ping. Still, DSR pays a performance penalty for TCPdue to this header overhead.
3 EvaluationIn this section we show that, using our approach to couplesimulation, emulation and the real world, we can single outthe radio modelling as the major contributor to performancediscrepancies between our experiment platforms. Ourresults also show that different routing logic will reactdifferently to times of reduced stability in the radio channel.These reactions are not visible in simulations with themodels we use and therefore those dissimilarities are evenedout between the protocols. We identify the importantrouting protocol design choices that account for most of thediscrepancies and study them in detail.
The rest of the section is organized as follows. First, wedescribe the measurements and the metrics we use in theanalysis. Then we give an overview of the basic performanceobservations and explain how they support our claims.Finally, we describe in detail the designs of each routingprotocol that explain their different their performance in thereal world compared to simulation. A discussion about ourfindings ends the section.
3.1 MeasurementsThe presented results for each protocol, scenario and trafficis the average of 10 runs. The variance and min/max valuesare also given. The same type of results are presented forsimulation. The emulation results, on the other hand, arefrom single experiments since the variance between testsusing UDP and Ping was negligible under the deterministicconnectivity. The emulation with TCP transfers suffersfrom contention limitations because nodes interfere. Westill provide the data here for completeness. The realworld experiments suffer from the overhead of logging.Therefore the TCP results should also only be comparedover the routing protocols. For AODV-UU and DSR-UUwe include link layer feedback in some of our simulationresults. The majority of simulations in related work use linklayer feedback.
5
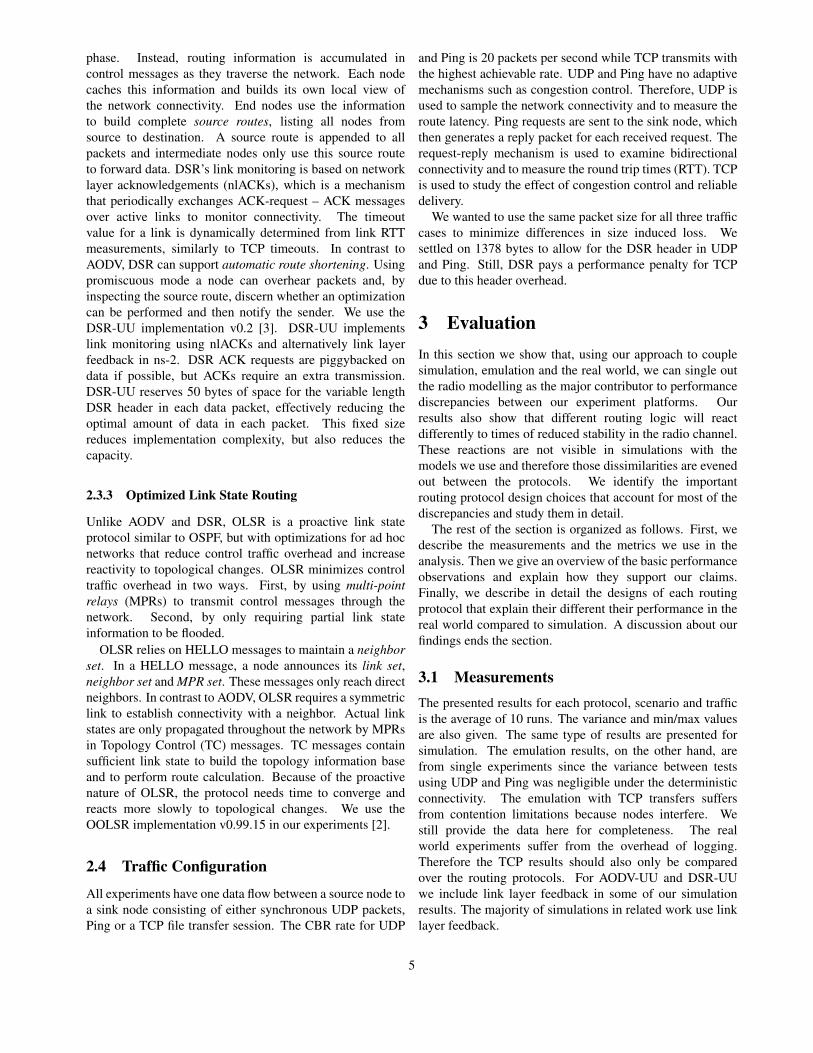
UDP Protocol Delivery Ratio Std. Dev. Min Max Latencyσ [ms]
Avg. Hopcount
Sim Emu RW Sim RW Sim RW Sim RW Sim RW Sim RW
Relay NodeSwap
AODV-UU 0.95 0.97 0.86 0.01 0.03 0.94 0.78 0.96 0.90 1.1 85.2 2.8 3.0DSR-UU 0.95 0.92 0.63 0.02 0.18 0.93 0.43 0.98 0.88 0.6 231.5 2.9 3.0OOLSR 0.83 0.84 0.67 0.03 0.04 0.81 0.63 0.89 0.73 0.7 60.1 2.9 2.9
End NodeSwap
AODV-UU 0.97 0.94 0.65 0.00 0.13 0.96 0.42 0.98 0.83 1.8 124.2 2.2 2.1DSR-UU 0.95 1.00 0.69 0.00 0.15 0.95 0.43 0.96 0.94 36.2 802.0 2.2 2.2OOLSR 0.83 0.88 0.63 0.01 0.14 0.80 0.40 0.85 0.84 1.7 69.1 2.1 2.2
RoamingNode
AODV-UU 0.97 0.98 0.91 0.00 0.02 0.97 0.88 0.98 0.93 1.7 80.8 1.7 1.9DSR-UU 0.98 1.00 0.91 0.00 0.01 0.97 0.90 0.98 0.93 1.4 52.1 1.6 1.8OOLSR 0.91 0.91 0.72 0.00 0.05 0.91 0.64 0.92 0.80 1.4 38.9 1.5 1.7
PING Protocol Delivery Ratio Std. Dev. Min Max Latencyσ [ms]
Avg. Hopcount
Sim Emu RW Sim RW Sim RW Sim RW Sim RW Sim RW
Relay NodeSwap
AODV-UU 0.95 0.94 0.55 0.01 0.10 0.94 0.45 0.96 0.69 1.3 193.1 5.7 6.0DSR-UU 0.92 0.97 0.46 0.00 0.06 0.91 0.39 0.92 0.57 74.3 3514.3 5.6 6.0OOLSR 0.83 0.85 0.50 0.03 0.11 0.81 0.37 0.88 0.70 1.3 311.6 5.7 6.0
End NodeSwap
AODV-UU 0.96 0.95 0.72 0.01 0.06 0.94 0.60 0.98 0.81 3.4 157.0 4.3 4.7DSR-UU 0.93 0.99 0.64 0.01 0.19 0.92 0.35 0.94 0.90 52.0 3296.6 3.8 4.5OOLSR 0.81 0.83 0.58 0.02 0.10 0.79 0.41 0.86 0.74 3.5 164.6 4.2 4.1
RoamingNode
AODV-UU 0.98 0.98 0.71 0.00 0.08 0.97 0.55 0.98 0.80 3.0 182.9 3.3 3.2DSR-UU 0.96 0.97 0.80 0.01 0.05 0.95 0.75 0.97 0.89 3.8 4621.2 2.8 3.2OOLSR 0.91 0.91 0.57 0.00 0.07 0.90 0.46 0.91 0.66 2.7 1959.0 3.0 3.0
TCP Protocol Throughput (Mbps) Std. Dev. Min Max Latencyσ [ms]
Avg. Hopcount
Sim Emu RW Sim RW Sim RW Sim RW Sim RW Sim RW
Relay NodeSwap
AODV-UU 1.65 0.61 0.14 0.04 0.12 1.59 0.01 1.70 0.38 42.1 356.3 5.7 6.0DSR-UU 1.63 0.62 0.18 0.02 0.04 1.59 0.10 1.66 0.23 49.3 249.1 5.5 6.0OOLSR 1.08 0.40 0.19 0.14 0.06 1.01 0.09 1.35 0.29 263.0 268.6 5.6 6.0
End NodeSwap
AODV-UU 2.77 1.33 0.40 0.05 0.23 2.70 0.08 2.82 0.68 51.6 515.1 3.4 2.4DSR-UU 2.40 1.07 0.39 0.24 0.09 2.21 0.29 2.68 0.60 53.3 338.9 3.0 2.8OOLSR 2.44 1.32 0.43 0.08 0.13 2.37 0.21 2.52 0.62 158.7 230.6 3.1 3.5
RoamingNode
AODV-UU 3.58 2.00 0.85 0.04 0.06 3.53 0.75 3.64 0.93 41.4 172.5 2.7 2.5DSR-UU 3.45 1.83 0.93 0.38 0.23 2.36 0.48 3.60 1.26 38.7 176.6 2.6 2.4OOLSR 3.44 1.78 0.47 0.03 0.24 3.37 0.19 3.46 0.94 68.8 364.8 2.5 2.1
Table 3: UDP, Ping and TCP results showing mean packet delivery ratio and throughput and their standard deviation,minimum and maximum. The performance results are complemented by latency standard deviation and average hop count.
3.2 MetricsThe following metrics are used in our analysis:
Delivery Ratio The number of packets received divided bythe number of packets generated during an experiment.
Throughput The number of bytes useful data delivereddivided by the time over which data is sent. This isalso refered to as Goodput.
Latency standard deviation (σ) The variation in time fora packet travelling from the sender to the receiver.For Ping and TCP we calculate the round trip latencystandard deviation. We calculate the standard deviationinstead of the mean for two reasons: First, the standarddeviation can measure the stability of routes. Second, inthe case of UDP, accurate calculation of the mean is notpossible due to the lack of good time synchronizationbetween the nodes.
Average Hop Count For UDP the average hop count iscalculated from the source node to the destination node.For Ping, the hop counts for the Ping request and thePing reply are added. Similarly, for TCP the sum of thehop counts for data packet and ACK is used.
3.3 Basic Performance Observations
Our results are summarized in Table 3. From the tables wecan make basic performance observations in the followingterms:
Protocol Logic Correctness. Because our scenarios areconstructed with a potential path between source anddestination at all times, the protocols should achieve highdelivery ratios under ideal circumstances. AODV-UU andDSR-UU consistently achieve over 90% packet deliveryratio for all scenarios in simulation and emulation. OOLSR
6
achieves slightly lower ratios at 80-90%, which is expecteddue to its slower convergence. Since the performance is goodin both environments we can, with some confidence, excludeany serious routing logic problems as a source of errors.
Mobility and Platform Impact. Despite mobilityvariations in the simulation, there is no considerabledifference in delivery ratios compared to the emulation’sclean and deterministic connectivity changes. Therefore, weexclude mobility as a major contributing factor to divergingresults between the real world, emulations and simulationsfor our setup. In the same way we exclude the hardware andthe protocol stack as having an impact.
Packet Delivery Ratio. The high delivery ratios of upto 100% in simulation and emulation indicate that theprotocols’ logic can, with little effort and low loss, handleperiods of connectivity changes and multi-hop routes underthe idealized circumstances. In the real world we find packetloss concentrated to those periods. Therefore, the radioenvironment’s gradual reduction in predictability passes athreshold at those periods and cause ambivalent feedbackto the routing protocols. Protocols may differ in how wellthey adapt and how much they suffer aftereffects from theseperiods.
TCP Throughput. For TCP we observe smallerdifferences between the protocols compared to UDPand Ping. This is because the real world numbers aredominated by the throughput achieved during periods oflow variance in link quality and stable routes, while inthe rest of the scenario TCP stalls. For UDP and Ping wedetermined that the discerning periods are concentratedto when links are fluctuating and immediately after. Theaverage hop count supports this claim, as it is much lowerfor TCP than Ping, i.e., the majority of the TCP packetsare sent over shorter routes. Therefore, any advantage of aparticular routing strategy never manifests itself. Roamingnode is the exception, where the frequent route updatesallow AODV-UU and DSR-UU to excerpt their convergenceadvantage over OOLSR.
Latency Variation. In the real world, many orders ofmagnitude higher latency variance is observed compared tosimulation.
Relative Performance. In simulation and emulation therelative performance between protocols is consistent.However, in the real world this is not the case. Therefore,it is not possible to draw any general conclusions about therouting protocols performance in the real world by using thesimple simulation models we use.
However, we want to understand the designs of eachprotocol that account for the different reactions to the
real world environment. In the following sections welook at the design choices of each protocol that, from theabove observations, might have a crucial impact on theperformance of the protocols.
3.4 Impact of Link MonitoringThe link monitoring strategies used by the different protocolsappear to work well in simulation and emulation wheresome stochastic elements are not present or are modeledin a simplified way. In the real world, however, thelink monitoring mechanisms are less accurate, leading tounnecessary link timeouts or increased channel contention.
3.4.1 Network Layer Acknowledgments
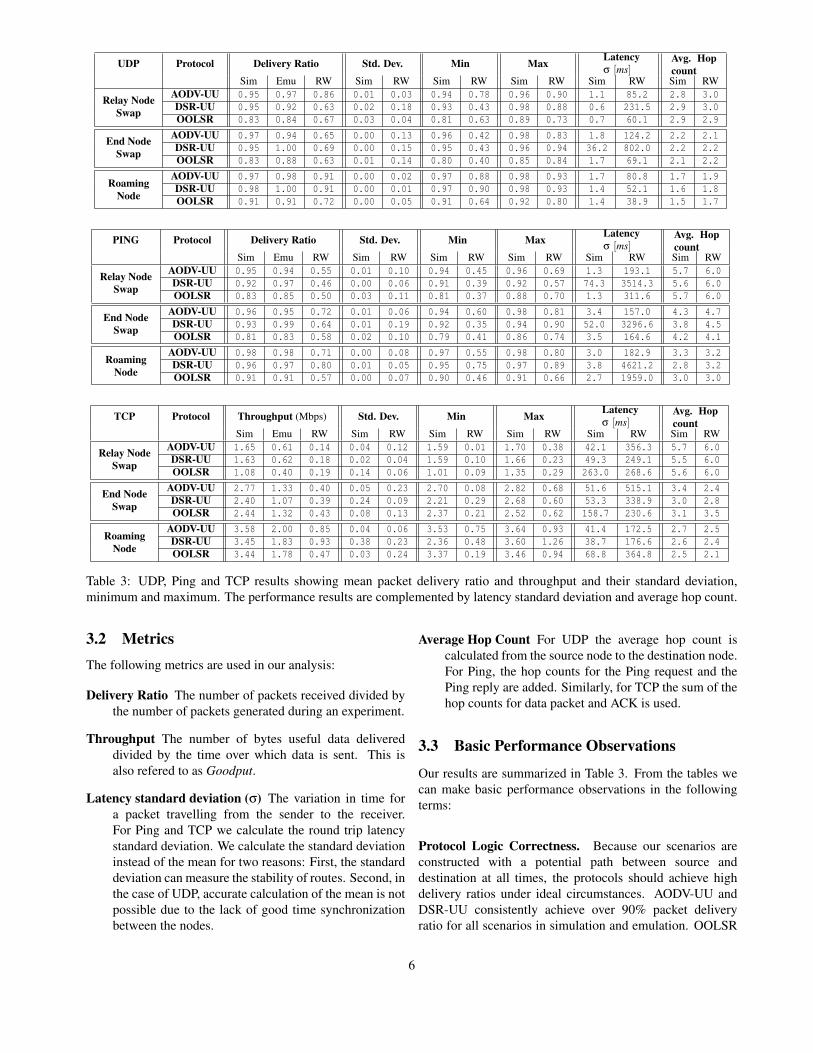
One reason for DSR-UU’s considerably higher latencystandard deviation compared to the other protocols is thatnlACKs increase channel contention. Such self-interferencehas been reported by Draves et al. [9], but in that casefor static multi-hop ad hoc networks. The interference ishigher for Ping and TCP compared to UDP, because nlACK-pairs are sent in both directions on each link. Whilst theACK request is piggybacked on data, the ACK is not. Theinterference could be reduced by also piggybacking theACK, but that is an optimization and only works in case thereis traffic in both directions.
The impact of self-interference on latency is evident inboth simulation and the real world, but is far more severein the latter case. Figure 3 illustrates the self-interference insimulation by comparing nlACKs to link layer feedback.
0
5
10
15
20
0 20 40 60 80 100 120 140
RT
T (
ms)
Time (s)
Roaming node (Simulation) - Ping
DSR-UU
0
5
10
15
20
0 20 40 60 80 100 120 140
RT
T (
ms)
Time (s)
Roaming node (Simulation) - Ping
DSR-UU (LLF)
Figure 3: Comparison of the DSR-UU link monitoring fromtwo simulation runs of the Roaming node scenario. Becauseof self-interference, DSR-UU with network layer ACKs hasa higher variance in Ping RTT compared to DSR-UU withlink layer feedback (LLF). The variance increases with hopcount.
The high variance affects DSR’s ability to derive a properretransmission timeout (RTO), leading to premature routetimeouts. Simulation and emulation are less affected by thisproblem due to a partial or modelled radio channel. Thereare two other factors that explain premature timeouts. First,by borrowing its RTO calculation from TCP, DSR inherits itsinability to derive optimal RTOs from RTT measurements inwireless networks. A difference is also that TCP estimatesan end-to-end RTT, whilst DSR estimates a per link RTT
7
that fluctuates more. Second, when a premature link timeoutoccurs, packets that are either salvaged or buffered duringroute discovery, will be sent more or less back-to-back whenthe link is re-established. This causes another type of self-interference, which also increases latency variance. Wediscuss this problem in detail in Section 3.5
3.4.2 HELLO Messages
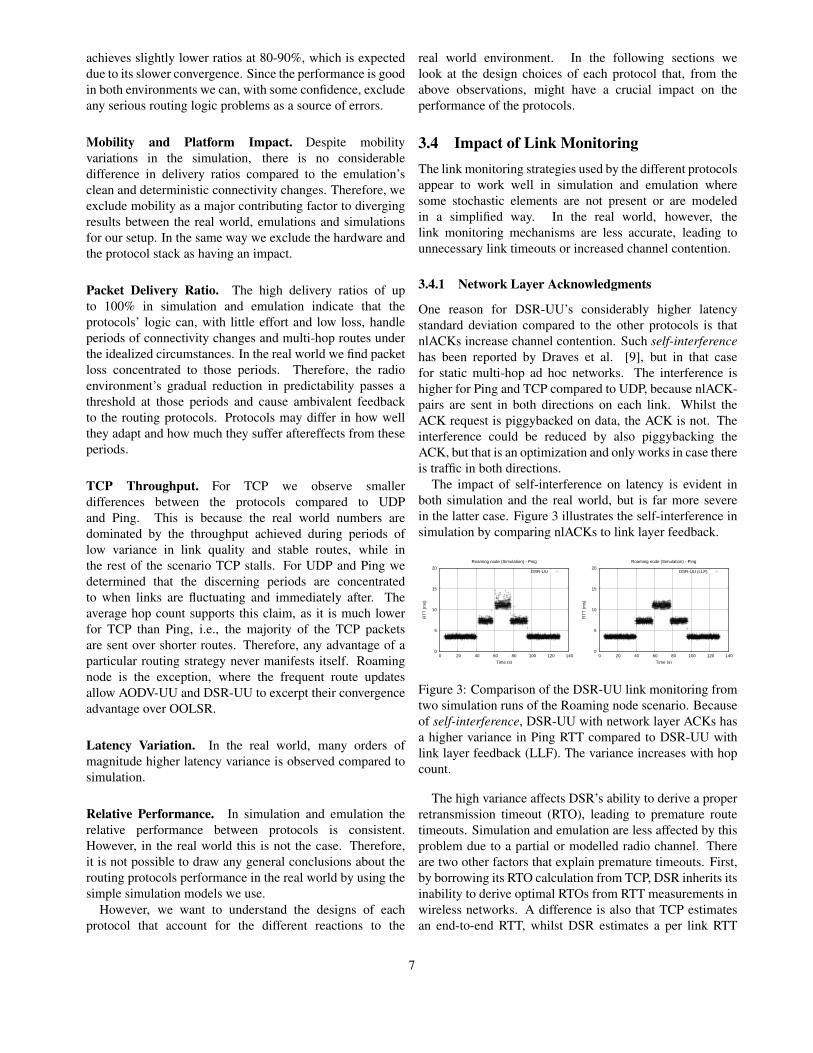
AODV and OLSR use broadcast HELLO messages toperform link monitoring. Previous work has reportedproblems with using HELLO messages to determining linkconnectivity [7, 16]. The main cause is the difference intransmission range between broadcast and unicast. Anotherconsequence of broadcast is that HELLO messages aresensitive to interference and hidden terminals, likely tobe frequently occurring during multi-hop configurations.Delayed or lost HELLO messages cause temporary routebreaks, leading to route discovery and increasing latency.Although this causes a slight increase in delay andoccasional loss for CBR traffic, TCP is affected moreseverely because it might go into a timeout. In Figure 4we see that AODV-UU achieves virtually no TCP progressin the beginning of the End node swap scenario. To explainthis we manually inspect our log files and find that in sevenout of ten runs there are lost HELLO messages between thenode pair 3 and 2, the seconds following the start of datatraffic at time 31s. The slow start in TCP builds contention,which is emphasized by the adjacent hops. Hello messagescollide with transmissions further down the path due to thehidden terminal effect. When TCP starts at one hop as inthe Roaming node scenario there is no such interference andTCP may proceed in slow start without interruptions. Wehave observed similar problems with HELLOs in OOLSR,but the effect is less prominent and OOLSR seems moreresilient, possibly due to its use of link hysteresis. Therefore,OOLSR makes steady TCP progress in the beginning of allscenarios.
3.5 Impact of Buffering
AODV and DSR buffer packets during route discovery.DSR also queues unacknowledged packets in a maintenancebuffer, so that it salvage those packets in case of a linkbreak. Buffering increases latency and may incur spikesin contention and queue build-up when the buffers areemptied. For some experiments using CBR traffic, weobserve latencies of up to 10 seconds for DSR-UU and avery high standard deviation. The default parameters forDSR allow 16 route requests using a back-off algorithmto calculate the timeout between each transmission. Themaximum timeout value is 10 seconds. This allows packetsto be buffered for very long times during route discovery.AODV-UU employs more modest buffering whilst OOLSRdoes not buffer at all.
0
1e+06
2e+06
3e+06
4e+06
5e+06
6e+06
20 40 60 80 100 120 140
Nor
mal
ized
TC
P s
eque
nce
num
ber
Time (s)
End Node Swap (Real World) - TCP
AODV-UUDSR-UUOOLSR
Figure 4: TCP time sequence number trace showing theperformance of the routing protocols in the End node swapscenario. AODV-UU struggles in the beginning due to lostHELLO messages. DSR-UU suffers from a too optimisticlink RTO. TCP consistently stalls for all protocols when theroute switches from one to three hops during a short timeperiod.
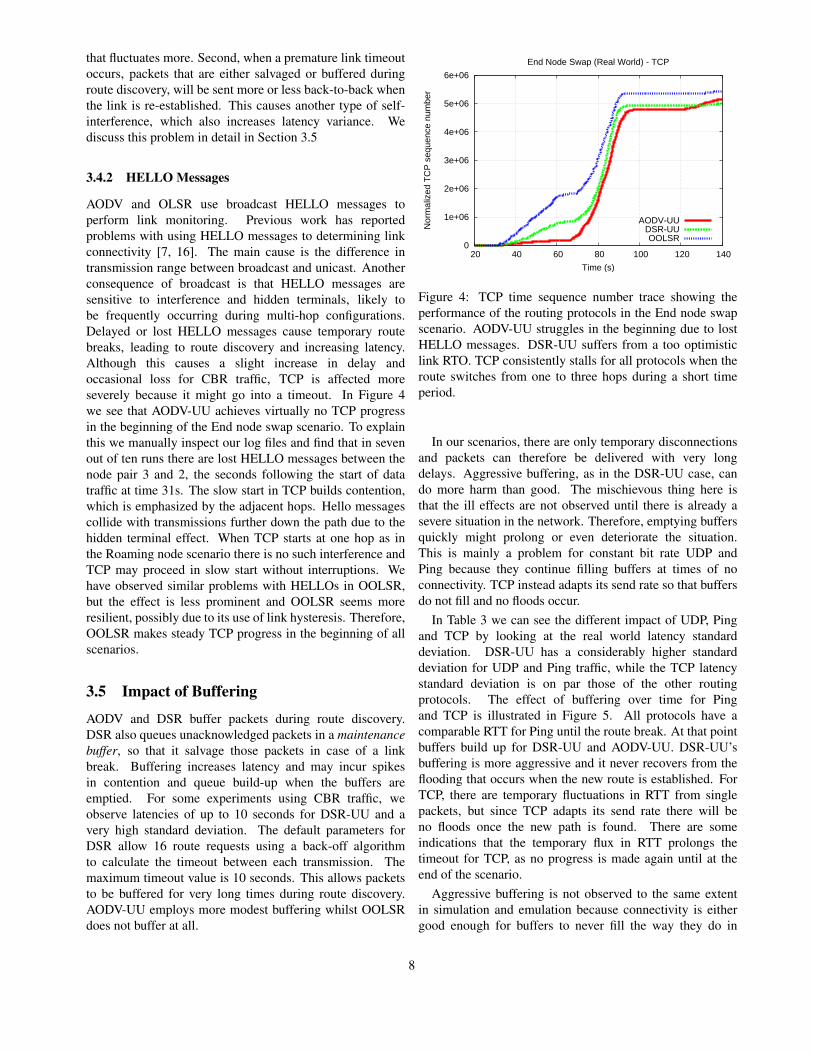
In our scenarios, there are only temporary disconnectionsand packets can therefore be delivered with very longdelays. Aggressive buffering, as in the DSR-UU case, cando more harm than good. The mischievous thing here isthat the ill effects are not observed until there is already asevere situation in the network. Therefore, emptying buffersquickly might prolong or even deteriorate the situation.This is mainly a problem for constant bit rate UDP andPing because they continue filling buffers at times of noconnectivity. TCP instead adapts its send rate so that buffersdo not fill and no floods occur.
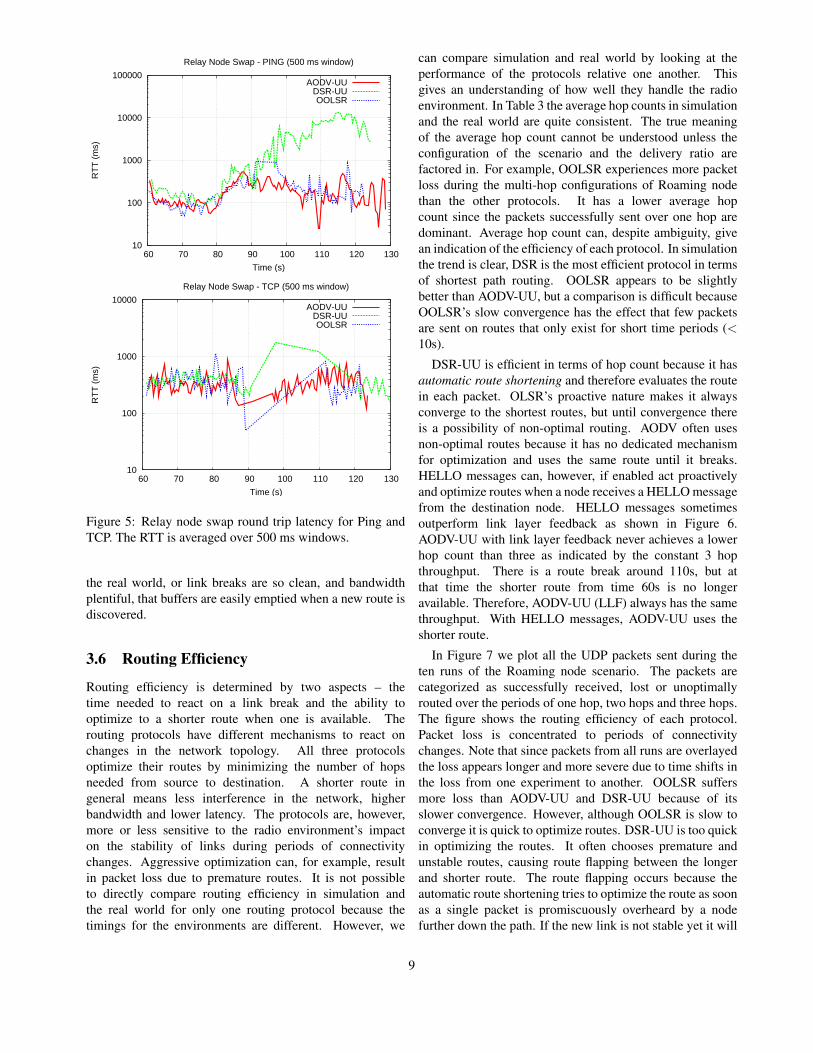
In Table 3 we can see the different impact of UDP, Pingand TCP by looking at the real world latency standarddeviation. DSR-UU has a considerably higher standarddeviation for UDP and Ping traffic, while the TCP latencystandard deviation is on par those of the other routingprotocols. The effect of buffering over time for Pingand TCP is illustrated in Figure 5. All protocols have acomparable RTT for Ping until the route break. At that pointbuffers build up for DSR-UU and AODV-UU. DSR-UU’sbuffering is more aggressive and it never recovers from theflooding that occurs when the new route is established. ForTCP, there are temporary fluctuations in RTT from singlepackets, but since TCP adapts its send rate there will beno floods once the new path is found. There are someindications that the temporary flux in RTT prolongs thetimeout for TCP, as no progress is made again until at theend of the scenario.
Aggressive buffering is not observed to the same extentin simulation and emulation because connectivity is eithergood enough for buffers to never fill the way they do in
8
10
100
1000
10000
100000
60 70 80 90 100 110 120 130
RT
T (
ms)
Time (s)
Relay Node Swap - PING (500 ms window)
AODV-UUDSR-UUOOLSR
10
100
1000
10000
60 70 80 90 100 110 120 130
RT
T (
ms)
Time (s)
Relay Node Swap - TCP (500 ms window)
AODV-UUDSR-UUOOLSR
Figure 5: Relay node swap round trip latency for Ping andTCP. The RTT is averaged over 500 ms windows.
the real world, or link breaks are so clean, and bandwidthplentiful, that buffers are easily emptied when a new route isdiscovered.
3.6 Routing Efficiency
Routing efficiency is determined by two aspects – thetime needed to react on a link break and the ability tooptimize to a shorter route when one is available. Therouting protocols have different mechanisms to react onchanges in the network topology. All three protocolsoptimize their routes by minimizing the number of hopsneeded from source to destination. A shorter route ingeneral means less interference in the network, higherbandwidth and lower latency. The protocols are, however,more or less sensitive to the radio environment’s impacton the stability of links during periods of connectivitychanges. Aggressive optimization can, for example, resultin packet loss due to premature routes. It is not possibleto directly compare routing efficiency in simulation andthe real world for only one routing protocol because thetimings for the environments are different. However, we
can compare simulation and real world by looking at theperformance of the protocols relative one another. Thisgives an understanding of how well they handle the radioenvironment. In Table 3 the average hop counts in simulationand the real world are quite consistent. The true meaningof the average hop count cannot be understood unless theconfiguration of the scenario and the delivery ratio arefactored in. For example, OOLSR experiences more packetloss during the multi-hop configurations of Roaming nodethan the other protocols. It has a lower average hopcount since the packets successfully sent over one hop aredominant. Average hop count can, despite ambiguity, givean indication of the efficiency of each protocol. In simulationthe trend is clear, DSR is the most efficient protocol in termsof shortest path routing. OOLSR appears to be slightlybetter than AODV-UU, but a comparison is difficult becauseOOLSR’s slow convergence has the effect that few packetsare sent on routes that only exist for short time periods (<10s).
DSR-UU is efficient in terms of hop count because it hasautomatic route shortening and therefore evaluates the routein each packet. OLSR’s proactive nature makes it alwaysconverge to the shortest routes, but until convergence thereis a possibility of non-optimal routing. AODV often usesnon-optimal routes because it has no dedicated mechanismfor optimization and uses the same route until it breaks.HELLO messages can, however, if enabled act proactivelyand optimize routes when a node receives a HELLO messagefrom the destination node. HELLO messages sometimesoutperform link layer feedback as shown in Figure 6.AODV-UU with link layer feedback never achieves a lowerhop count than three as indicated by the constant 3 hopthroughput. There is a route break around 110s, but atthat time the shorter route from time 60s is no longeravailable. Therefore, AODV-UU (LLF) always has the samethroughput. With HELLO messages, AODV-UU uses theshorter route.
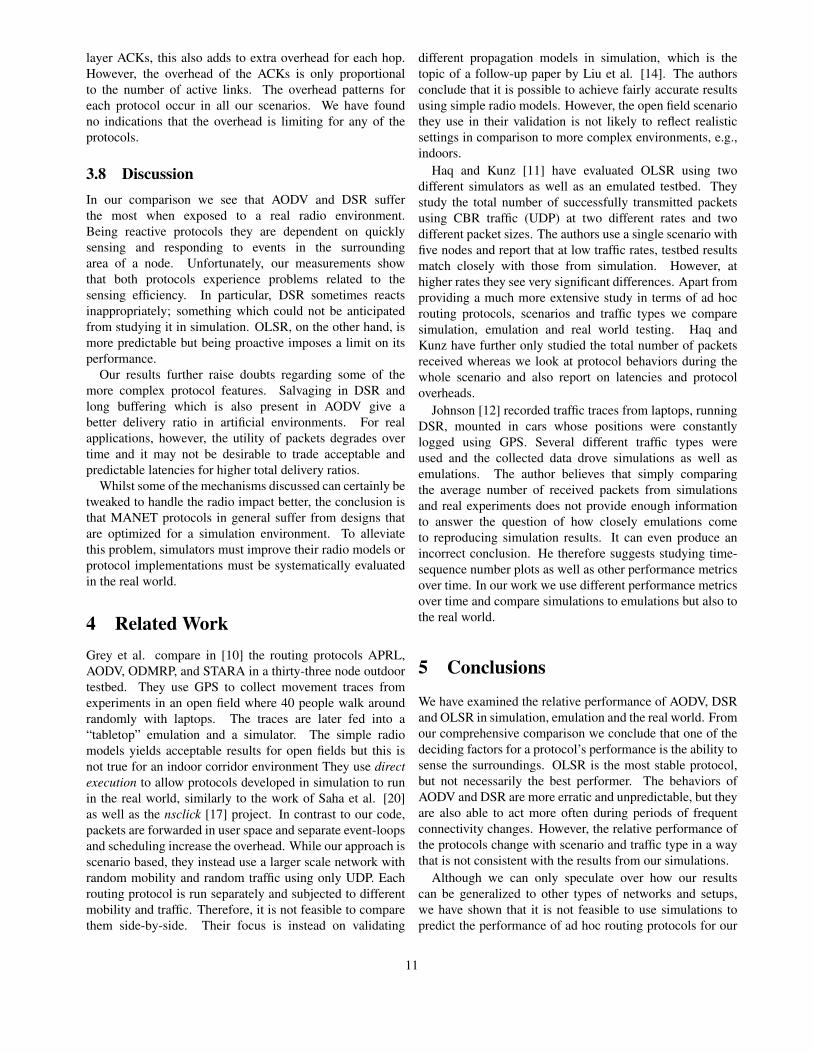
In Figure 7 we plot all the UDP packets sent during theten runs of the Roaming node scenario. The packets arecategorized as successfully received, lost or unoptimallyrouted over the periods of one hop, two hops and three hops.The figure shows the routing efficiency of each protocol.Packet loss is concentrated to periods of connectivitychanges. Note that since packets from all runs are overlayedthe loss appears longer and more severe due to time shifts inthe loss from one experiment to another. OOLSR suffersmore loss than AODV-UU and DSR-UU because of itsslower convergence. However, although OOLSR is slow toconverge it is quick to optimize routes. DSR-UU is too quickin optimizing the routes. It often chooses premature andunstable routes, causing route flapping between the longerand shorter route. The route flapping occurs because theautomatic route shortening tries to optimize the route as soonas a single packet is promiscuously overheard by a nodefurther down the path. If the new link is not stable yet it will
9
0
5e+06
1e+07
1.5e+07
2e+07
2.5e+07
3e+07
3.5e+07
20 40 60 80 100 120 140
Nor
mal
ized
TC
P s
eque
nce
num
ber
Time (s)
End Node Swap (Simulation) - TCP
AODV-UUDSR-UUOOLSR
AODV-UU (LLF)DSR-UU (LLF)
Figure 6: TCP time sequence number trace from simulationshowing the route optimization behavior in the End nodeswap scenario.
Figure 7: Routing behavior in the Roaming node scenariowith UDP traffic. Packets from all ten runs are overlayedand plotted according to their time and route they were senton (indicated by hop count). A � is a successfully receivedpacket, while a × is a lost packet. A + over a diamondindicates that connectivity allowed the packet to been sentover a shorter route.
soon time out and the longer route is discovered again. Thecycle then starts again. The route request flooding followingthe route flapping increases overhead and contention in thenetwork. Automatic route shortening sometimes works toDSR-UU’s disadvantage at times a longer but more stableroute is selected as shown at time 50 s in Figure 7. Theoptimization will cause route flapping when it switches backto the shorter but lower quality route. In simulation, theradio model works like a binary switch and proves perfect forDSR’s route shortening because as soon as an optimizationcan be made, connectivity is perfect.
AODV-UU’s route optimization behavior for Roaming
node is visible at time 110 s. The route between node3 and 0 is not optimized until node 3 receives a HELLOmessage from node 0, i.e., the destination. The reason somepackets take the shorter route is that during some of the tenexperiments fluctuations cause a timeout that triggers a routediscovery during the period between 110 s and 120 s. Theoptimal route is than discovered. This is actually a situationwhen the real world radio environment is an advantage overthe stable and predictable model in simulation. At least in aminimal hop count sense.
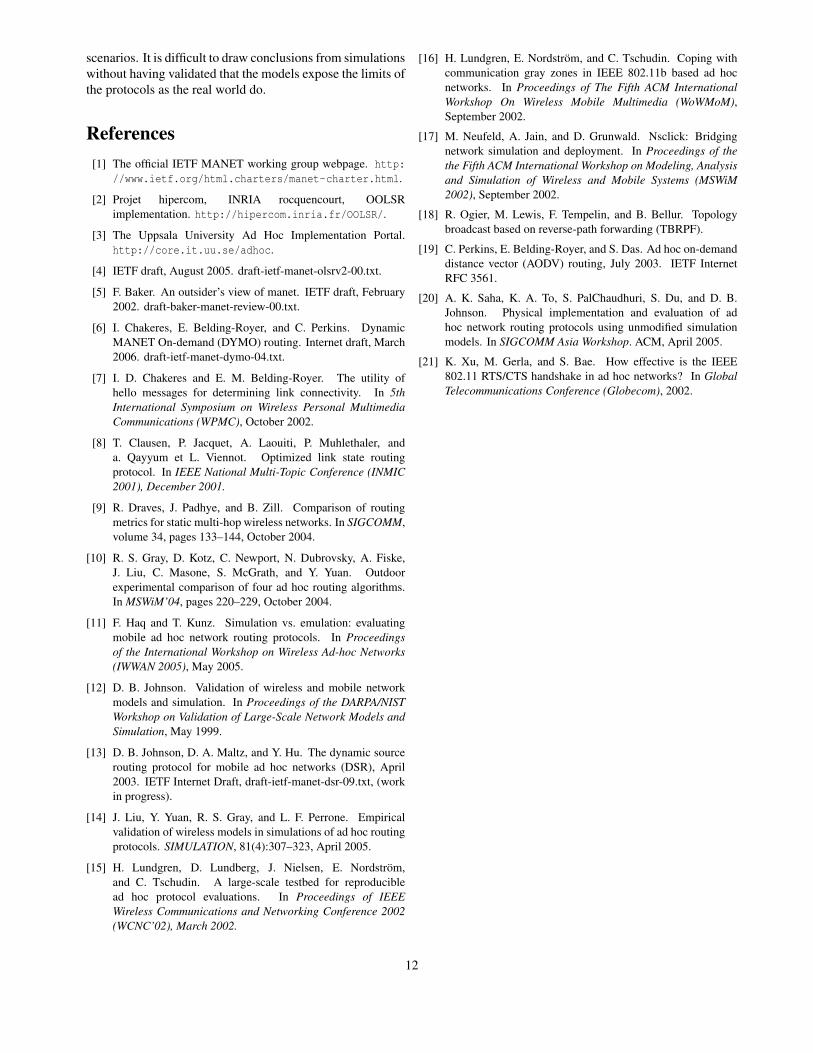
3.7 Routing Overhead
The overhead pattern for each protocol is very similar in allscenarios. We use the Roaming node scenario with UDPtraffic to illustrate the patterns. Figure 8 shows the overheadfor all three protocols in bytes. Note that the time axisis different than in the other graphs to show the overheadduring the warmup phase.
0
10000
20000
30000
40000
50000
60000
70000
80000
0 20 40 60 80 100 120 140 160
Rou
ting
prot
ocol
ove
rhea
d (b
ytes
)
Time (s)
Roaming Node (Real World) - UDP
AODV-UUDSR-UUOOLSR
Figure 8: The real world routing protocol overhead for theRoaming node scenario.
OOLSR has, as expected, a constant overhead. AODV-UUalso has nearly constant overhead because of the periodicHELLO messages, but the overhead is overall lower thanOOLSR. There are periods of increased overhead for AODV-UU caused by broadcast floods during route discovery. DSR-UU has the most deviating overhead pattern. At first glance,the overhead of DSR-UU is considerably larger than theother protocols. However, most of the overhead comesfrom control information that is piggy-backed on applicationdata frames. Hence, the DSR-UU overhead pattern is notdirectly comparable to the other protocols’ overhead asit is not proportional in the same way to the amount ofexcess transmissions. Another observation with DSR-UUis that overhead is proportional to hop count and numberof data packets, since for each hop, the full source routeis (re-)transmitted with each packet. When using network
10
layer ACKs, this also adds to extra overhead for each hop.However, the overhead of the ACKs is only proportionalto the number of active links. The overhead patterns foreach protocol occur in all our scenarios. We have foundno indications that the overhead is limiting for any of theprotocols.
3.8 DiscussionIn our comparison we see that AODV and DSR sufferthe most when exposed to a real radio environment.Being reactive protocols they are dependent on quicklysensing and responding to events in the surroundingarea of a node. Unfortunately, our measurements showthat both protocols experience problems related to thesensing efficiency. In particular, DSR sometimes reactsinappropriately; something which could not be anticipatedfrom studying it in simulation. OLSR, on the other hand, ismore predictable but being proactive imposes a limit on itsperformance.
Our results further raise doubts regarding some of themore complex protocol features. Salvaging in DSR andlong buffering which is also present in AODV give abetter delivery ratio in artificial environments. For realapplications, however, the utility of packets degrades overtime and it may not be desirable to trade acceptable andpredictable latencies for higher total delivery ratios.
Whilst some of the mechanisms discussed can certainly betweaked to handle the radio impact better, the conclusion isthat MANET protocols in general suffer from designs thatare optimized for a simulation environment. To alleviatethis problem, simulators must improve their radio models orprotocol implementations must be systematically evaluatedin the real world.
4 Related WorkGrey et al. compare in [10] the routing protocols APRL,AODV, ODMRP, and STARA in a thirty-three node outdoortestbed. They use GPS to collect movement traces fromexperiments in an open field where 40 people walk aroundrandomly with laptops. The traces are later fed into a“tabletop” emulation and a simulator. The simple radiomodels yields acceptable results for open fields but this isnot true for an indoor corridor environment They use directexecution to allow protocols developed in simulation to runin the real world, similarly to the work of Saha et al. [20]as well as the nsclick [17] project. In contrast to our code,packets are forwarded in user space and separate event-loopsand scheduling increase the overhead. While our approach isscenario based, they instead use a larger scale network withrandom mobility and random traffic using only UDP. Eachrouting protocol is run separately and subjected to differentmobility and traffic. Therefore, it is not feasible to comparethem side-by-side. Their focus is instead on validating
different propagation models in simulation, which is thetopic of a follow-up paper by Liu et al. [14]. The authorsconclude that it is possible to achieve fairly accurate resultsusing simple radio models. However, the open field scenariothey use in their validation is not likely to reflect realisticsettings in comparison to more complex environments, e.g.,indoors.
Haq and Kunz [11] have evaluated OLSR using twodifferent simulators as well as an emulated testbed. Theystudy the total number of successfully transmitted packetsusing CBR traffic (UDP) at two different rates and twodifferent packet sizes. The authors use a single scenario withfive nodes and report that at low traffic rates, testbed resultsmatch closely with those from simulation. However, athigher rates they see very significant differences. Apart fromproviding a much more extensive study in terms of ad hocrouting protocols, scenarios and traffic types we comparesimulation, emulation and real world testing. Haq andKunz have further only studied the total number of packetsreceived whereas we look at protocol behaviors during thewhole scenario and also report on latencies and protocoloverheads.
Johnson [12] recorded traffic traces from laptops, runningDSR, mounted in cars whose positions were constantlylogged using GPS. Several different traffic types wereused and the collected data drove simulations as well asemulations. The author believes that simply comparingthe average number of received packets from simulationsand real experiments does not provide enough informationto answer the question of how closely emulations cometo reproducing simulation results. It can even produce anincorrect conclusion. He therefore suggests studying time-sequence number plots as well as other performance metricsover time. In our work we use different performance metricsover time and compare simulations to emulations but also tothe real world.
5 Conclusions
We have examined the relative performance of AODV, DSRand OLSR in simulation, emulation and the real world. Fromour comprehensive comparison we conclude that one of thedeciding factors for a protocol’s performance is the ability tosense the surroundings. OLSR is the most stable protocol,but not necessarily the best performer. The behaviors ofAODV and DSR are more erratic and unpredictable, but theyare also able to act more often during periods of frequentconnectivity changes. However, the relative performance ofthe protocols change with scenario and traffic type in a waythat is not consistent with the results from our simulations.
Although we can only speculate over how our resultscan be generalized to other types of networks and setups,we have shown that it is not feasible to use simulations topredict the performance of ad hoc routing protocols for our
11
scenarios. It is difficult to draw conclusions from simulationswithout having validated that the models expose the limits ofthe protocols as the real world do.
References[1] The official IETF MANET working group webpage. http:
//www.ietf.org/html.charters/manet-charter.html.
[2] Projet hipercom, INRIA rocquencourt, OOLSRimplementation. http://hipercom.inria.fr/OOLSR/.
[3] The Uppsala University Ad Hoc Implementation Portal.http://core.it.uu.se/adhoc.
[4] IETF draft, August 2005. draft-ietf-manet-olsrv2-00.txt.
[5] F. Baker. An outsider’s view of manet. IETF draft, February2002. draft-baker-manet-review-00.txt.
[6] I. Chakeres, E. Belding-Royer, and C. Perkins. DynamicMANET On-demand (DYMO) routing. Internet draft, March2006. draft-ietf-manet-dymo-04.txt.
[7] I. D. Chakeres and E. M. Belding-Royer. The utility ofhello messages for determining link connectivity. In 5thInternational Symposium on Wireless Personal MultimediaCommunications (WPMC), October 2002.
[8] T. Clausen, P. Jacquet, A. Laouiti, P. Muhlethaler, anda. Qayyum et L. Viennot. Optimized link state routingprotocol. In IEEE National Multi-Topic Conference (INMIC2001), December 2001.
[9] R. Draves, J. Padhye, and B. Zill. Comparison of routingmetrics for static multi-hop wireless networks. In SIGCOMM,volume 34, pages 133–144, October 2004.
[10] R. S. Gray, D. Kotz, C. Newport, N. Dubrovsky, A. Fiske,J. Liu, C. Masone, S. McGrath, and Y. Yuan. Outdoorexperimental comparison of four ad hoc routing algorithms.In MSWiM’04, pages 220–229, October 2004.
[11] F. Haq and T. Kunz. Simulation vs. emulation: evaluatingmobile ad hoc network routing protocols. In Proceedingsof the International Workshop on Wireless Ad-hoc Networks(IWWAN 2005), May 2005.
[12] D. B. Johnson. Validation of wireless and mobile networkmodels and simulation. In Proceedings of the DARPA/NISTWorkshop on Validation of Large-Scale Network Models andSimulation, May 1999.
[13] D. B. Johnson, D. A. Maltz, and Y. Hu. The dynamic sourcerouting protocol for mobile ad hoc networks (DSR), April2003. IETF Internet Draft, draft-ietf-manet-dsr-09.txt, (workin progress).
[14] J. Liu, Y. Yuan, R. S. Gray, and L. F. Perrone. Empiricalvalidation of wireless models in simulations of ad hoc routingprotocols. SIMULATION, 81(4):307–323, April 2005.
[15] H. Lundgren, D. Lundberg, J. Nielsen, E. Nordstrom,and C. Tschudin. A large-scale testbed for reproduciblead hoc protocol evaluations. In Proceedings of IEEEWireless Communications and Networking Conference 2002(WCNC’02), March 2002.
[16] H. Lundgren, E. Nordstrom, and C. Tschudin. Coping withcommunication gray zones in IEEE 802.11b based ad hocnetworks. In Proceedings of The Fifth ACM InternationalWorkshop On Wireless Mobile Multimedia (WoWMoM),September 2002.
[17] M. Neufeld, A. Jain, and D. Grunwald. Nsclick: Bridgingnetwork simulation and deployment. In Proceedings of thethe Fifth ACM International Workshop on Modeling, Analysisand Simulation of Wireless and Mobile Systems (MSWiM2002), September 2002.
[18] R. Ogier, M. Lewis, F. Tempelin, and B. Bellur. Topologybroadcast based on reverse-path forwarding (TBRPF).
[19] C. Perkins, E. Belding-Royer, and S. Das. Ad hoc on-demanddistance vector (AODV) routing, July 2003. IETF InternetRFC 3561.
[20] A. K. Saha, K. A. To, S. PalChaudhuri, S. Du, and D. B.Johnson. Physical implementation and evaluation of adhoc network routing protocols using unmodified simulationmodels. In SIGCOMM Asia Workshop. ACM, April 2005.
[21] K. Xu, M. Gerla, and S. Bae. How effective is the IEEE802.11 RTS/CTS handshake in ad hoc networks? In GlobalTelecommunications Conference (Globecom), 2002.
12