Embed Size (px)
Citation preview

A COMPLEX SYSTEMS THEORY OF TECHNOLOGICAL CHANGE: A CASE
STUDY INVOLVING A MORPHOMETRICS ANALYSIS OF STONE AGE FLAKE DEBITAGE FROM THE HORN OF AFRICA
By
ERICH CHRISTOPHER FISHER
A THESIS PRESENTED TO THE GRADUATE SCHOOL OF THE UNIVERSITY OF FLORIDA IN PARTIAL FULFILLMENT
OF THE REQUIREMENTS FOR THE DEGREE OF MASTER OF ARTS
UNIVERSITY OF FLORIDA
2005

Copyright 2005
by
Erich Christopher Fisher

This document is dedicated to my family and friends for their continued support. Thank you all.
iv
ACKNOWLEDGMENTS
This thesis is the product of massive support from many wonderful individuals.
Most pertinent to this thesis is the support and guidance of my supervisory committee.
Steve Brandt introduced me to Ethiopia, and during each trip helped me develop the ideas
that eventually became the chapters within this thesis. He has provided unwavering
support for my myriad ideas and research opportunities. He has also become a wonderful
friend and colleague. Susan Gillespie has opened my eyes to avenues of knowledge I
never dreamt existed through her voluminous knowledge of archaeological theory. Her
critical comments about my research and ideas have pushed me to achieve more than I
knew possible for myself. She is a thoughtful and caring person whom I am proud to
know. Michael Binford has expanded my focus beyond the narrow confines of
archaeology and has provided invaluable comments on my research. I would also like to
thank my committee as a whole for enduring my successes and failings throughout this
process with extreme patience and understanding. I consider each of these individuals
true friends and I am indelibly honored that I was fortunate enough to work with each of
them. I want to thank each of my committee members very much, and I hope that I will
never let any of them down.
I also wish to acknowledge the unending support of my family and friends. This
thesis and degree would never have been possible without my parents. Words alone
cannot describe how indebted I am to them for their unending care, devotion, and
concern, even on those rare occasions when I know they have absolutely no interest in

v
what I am talking about. My brother has added that little bit of excitement in my life that
makes life worth living and I hope he has found his future as I have mine. I am also
equally indebted to my Grandmother and Grandfather Bunnell and Grandmother and
Grandfather Fisher. Not only did they bring me to my first archaeological site but their
enthusiasm and encouragement over the years have fueled my ambitions in life. And to
my friends, my life would have been so boring without them. Drew, Mike, Josh, Luke,
and Walker keep my boring personality in check. There is no better friend than Sarah.
And Jim, life is all about the peaches and tuna fish. I would also like to thank my many
friends within the Department of Anthropology who have given me reason to enjoy life
and debate all those inconsequential little details. Thank you everyone.

vi
TABLE OF CONTENTS page
ACKNOWLEDGMENTS ................................................................................................. iv
LIST OF TABLES........................................................................................................... viii
LIST OF FIGURES ........................................................................................................... ix
ABSTRACT....................................................................................................................... xi
CHAPTER
1 TECHNOLOGY, STONE TOOLS AND THE HORN OF AFRICA..........................1
Introduction...................................................................................................................1 Impetus for this Research .............................................................................................3 Problems Associated with the Study of Technological Change...................................6 Resolving the Problems of Prehistoric Technological Change in the Archaeology
of the Horn of Africa..............................................................................................10 Conclusion ..................................................................................................................11
2 COMPLEX SYSTEMS THEORY.............................................................................13
Introduction.................................................................................................................13 Complex Systems Theory, Chaos Theory, and Non-linear Theory: Relationships
and Characteristics .................................................................................................13 Characteristics of Complex Systems Theory ......................................................15 Context within Technological Systems ...............................................................17 Technological Change within Complex Systems................................................19 Ideal Types ..........................................................................................................20 Intentional and Unintentional Changes ...............................................................25
The Technological Life Cycle ....................................................................................30 The Trajectory of Long Term Technological Systems........................................31 Growth and Complexity of a Technological System ..........................................32 Peak .....................................................................................................................34 Decline.................................................................................................................34
Conclusion ..................................................................................................................35
vii
3 PUTTING A SHAPE ON TECHNOLOGY...............................................................39
Morphometrics............................................................................................................39 Standardization ....................................................................................................41 Measures of Shape and Dimension .....................................................................44 Flakes...................................................................................................................47
Conclusion ..................................................................................................................49
4 THE GILGEL GIBE AND GOGOSHIIS QABE MORPHOMETRICS ANALYSES ...............................................................................................................54
Introduction.................................................................................................................54 Liben Bore ..................................................................................................................55
Morphometrics Analysis .....................................................................................57 Understanding the Liben Bore Data ....................................................................60
Gogoshiis Qabe...........................................................................................................65 Morphometrics Analysis .....................................................................................65 Understanding the Gogoshiis Qabe Data ............................................................69
Conclusion ..................................................................................................................72
5 CONCLUSIONS ........................................................................................................88
APPENDIX
A AN EXPERIMENT ON TECHNOLOGICAL PROCESS USING STONE TOOLS .......................................................................................................................95
B MATHEMATICAL FORMULAE...........................................................................103
BIOGRAPHICAL SKETCH ...........................................................................................113

viii
LIST OF TABLES
Table page 4-1 T-test results of the inter-period differences in the mean values for formfactor,
roundness, aspect ratio, elongation, and X-feret and Y-feret...................................74
4-2 Averaged standard deviation of the formfactor, aspect ratio, and roundness values organized per excavation level time period. .................................................74
4-3 T-test results of the inter-period differences in the mean values for formfactor, roundness, aspect ratio, elongation, and X-feret and Y-feret...................................74

ix
LIST OF FIGURES
Figure page 2-1 The technological life cycle of three different technological systems .....................38
3-1 Measurement of flake “length” varies based on the methods used..........................50
3-2 The steps necessary to conduct a morphometrics analysis using computer-assisted shape software.............................................................................................51
3-3 X-Feret and Y-Feret represent measure the widest points of an object dependent upon an object’s orientation to the X and Y axis. ....................................................52
3-4 In contrast to X and Y-Feret (figure 2-4), Figure 3-5 illustrates how the Image Processing Toolkit represents “length” and “breadth” of an object.........................52
3-5 How different morphometrics statistics measure different shapes of objects ..........53
4-1 Morphometric formfactor values of the Liben Bore flakes organized by the level of excavation ............................................................................................................75
4-2 Morphometric roundness values of the Liben Bore flakes organized by the level of excavation ............................................................................................................76
4-3 Morphometric aspect ratio values of the Liben Bore flakes organized by the level of excavation ...................................................................................................77
4-4 Morphometric elongation values of the Liben Bore flakes organized by the level of excavation. ...........................................................................................................78
4-5 Morphometric X-Feret and Y-Feret ratio values of the Liben Bore flakes organized by the level of excavation........................................................................79
4-6 Irregularity (formfactor) divided by the roundness of the Liben Bore flakes organized by the level of excavation........................................................................80
4-7 A hierarchical cluster analysis using the mean and standard deviation values per excavation level for formfactor, roundness, and aspect ratio from Liben Bore.......81
4-8 Morphometric formfactor values of the Gogoshiis Qabe flakes organized by the level of excavation ...................................................................................................82

x
4-9 Morphometric roundness values of the Gogoshiis Qabe flakes organized by the level of excavation. ..................................................................................................83
4-10 Morphometric elongation values of the Gogoshiis Qabe flakes organized by the level of excavation ...................................................................................................84
4-11 Morphometric aspect ratio values of the Gogoshiis Qabe flakes organized by the level of excavation ...................................................................................................85
4-12 Morphometric X-Feret and Y-Feret ratio values of the Gogoshiis Qabe flakes organized by the level of excavation........................................................................86
4-13 A hierarchical cluster analysis using the standard deviation values per excavation level for formfactor, roundness, elongation, and aspect ratio from Gogoshiis Qabe. .......................................................................................................87

xi
Abstract of Thesis Presented to the Graduate School
of the University of Florida in Partial Fulfillment of the Requirements for the Degree of Master of Arts
A COMPLEX SYSTEMS THEORY OF TECHNOLOGICAL CHANGE: A CASE STUDY INVOLVING A MORPHOMETRICS ANALYSIS OF STONE AGE FLAKE
DEBITAGE FROM THE HORN OF AFRICA
By
Erich Christopher Fisher
May 2005
Chair: Steven Brandt Major Department: Anthropology
This thesis provides theoretical, archaeological and experimental archaeological
evidence to support a complex systems framework for identifying and explaining lithic
technological change within the Stone Age of the Horn of Africa. Complex systems
theory is used to provide an interpretation of the process of technological change by
describing the proximal effects of individuals on larger, longer-term technological
systems via multi-scalar spatial and temporal dynamics, temporal continuity, recognition
of material and non-material archaeological culture, and the intentional and un-
intentional actions of technological producers. Technological change is proposed here to
be found in the modification of “ideal types,” which describe how a technology is
produced and used by members of a technological system.
To support a complex systems theory approach to technological change, this thesis
presents the analysis of two Stone Age sites from the Horn of Africa. Each of the two
Stone Age sites was analyzed using computer-assisted morphometrics—the study of

xii
shape—to identify the changes in flake shape through time. Changes to flake shape are
correlated with modifications to the ideal type of the technology and are taken to
represent technological change through time.
The results of the morphometrics analysis suggest that this method is a useful
research tool. In particular, the morphometrics analyses are able to identify technological
changes and technological variations within the lithic technological systems at both Stone
Age study sites. Using complex systems theory to interpret these results, it appears that
there were several independent technological changes at each site that may correlate to
changes in the “ideal types” of these technological systems.

1
CHAPTER 1 TECHNOLOGY, STONE TOOLS AND THE HORN OF AFRICA
Introduction
Stone Age African archaeology research has held a long-standing relationship with
the cultural historical method since Wayland applied culture historical ideas to his
“pluvial sequence” in the early twentieth century (Robertshaw 1993:20, 79). Wayland
believed that the pluvial method was a way to examine the relationship between African
and European cultures by recording the localized pluvial episodes at an archaeological
site. Each African pluvial data was compared against European glacial sequences because
it was believed that this would provide a relative dating method for African archaeology
(for example, see Wayland 1930).
Louis Leakey also used a culture historic method through his application of the
pluvial method. Leakey’s use of the pluvial method is now referred to as the “organic
model” because of his general conception of cultures as organic forms (Robertshaw
1993:80). In particular, Leakey defined cultures based on highly specific artifact types,
disregarded functional explanations, considered change to be exogenous, believed that
variability was a product of temporal differences, and narrowly associated different
human types with specific cultures (Robertshaw 1993:81).
Perhaps the most prominent application of culture historicism in African
archaeology is the current rendition of the three-age sequence developed by A.J.H.
Goodwin and Clarence van Riet Lowe (1929). The development of their sequence was
contemporaneous with Wayland’s pluvial sequence but instead of relying on extra-

2
African data sources, such as European glacial sequences, Goodwin and Lowe’s
classification was based primarily on locally recovered (South African) technological
material culture (McBrearty and Brooks 2000:456).
However, the use of culture history today presents two major problems to
contemporary theories of technological change within African Stone Age archaeology:
interpretation and continuity. First, culture history does provide a useful methodology to
organize large bodies of data by using trait lists to create large scale typological classes.
This is especially useful in the Horn of Africa where the archaeological record of stone
tool use is temporally greater than anywhere else in the world and may span more than
2.5 million years (cf. Semaw 2000). And when compounded by an equally great spatial
area, the culture historical approach presents a useful system to manage an incredible
diverse (spatio-temporal) body of lithic archaeological data in the Horn of Africa (i.e., the
three-age sequence developed by Goodwin and Lowe 1929).
On the other hand, the culture historical method also limits the interpretations of
data and may also distort actual trends within a dataset. When an archaeological site is
studied, a culture historical approach creates massive potential for the misinterpretation
of archaeological data because it relies on over-generalized, large-scale
chronostratigraphic trait lists. McBrearty (1988) notes that the assignment of
connotation-laden chronostratigraphic periods (i.e., Early Stone Age, Middle Stone Age,
and Late Stone Age) to artifacts based on techno-typological characteristics is dangerous
and even misleading. Poorly studied data may be identified into a culture historical
typology that, by definition, has to have a substantial amount of referential meaning
attached to each typological class. As a result, these data are directly associated with the
3
particular meanings of the typological classification regardless if the typology is truly
accurate or not (cf. McBrearty 1988).
Second, culture history presents a non-dynamic and discontinuous conception of
time and change because the use of essentialism restricts any idea of change to a series of
distinct periods or phases without any leeway to consider continuity through time. The
essentialism of culture history requires that the traits used to create typologies are
considered real and unique, and are manifest in artifacts and representative of only a
single “cultural” or “technological” type or time period. Therefore, each trait must fall
into only one category. Due to this very problem, the Third Pan-African Congress (Clark
1957) introduced the use of “transitional periods” because certain Stone Age industries
(i.e., Sangoan) showed features characteristic of two different periods and thus proved
difficult to place into one specific classification (McBrearty and Brooks 2000).
Therefore, in order to model technological change as a continuous process through
time, and be able to measure these changes accurately, the preexisting application of
culture historical essentialism and methodology to study the African Stone Age must be
re-worked. Before this model can be developed, however, certain problems within
contemporary theories of technological change must also be addressed.
Impetus for this Research
The impetus for this thesis is a reaction to perceived deficiencies in the
predominant application of culture historical methodology in current African Stone Age
archaeological research and existing theories of technological change. This thesis
focuses on the application of complex systems theory (CST), which is a non-reductionist
theory to explain multi-scalar interaction within historically contingent systems (Bentley
and Maschner 2003) to interpret the process of technological change as it is observed in

4
the prehistoric archaeological record in the Horn of Africa. In particular, CST is used to
interpret the process of technological change identified using computer assisted shape
analysis (morphometrics) to identify lithic technological change through time with
specific focus on the Middle and Late Stone Age transition within Ethiopia and Somalia.
Complex systems theory is rooted in chaos and non-linear theory and has several
core principles (Bentley and Maschner 2003; see also McGlade and Van der Leeuw
1997; Van der Leeuw and Torrence 1989). These principles include the reliance on an
open systems model recognizing the free flow of energy into and out of the system
including the constant creation of diversity, non-equilibrium, and continuous systemic
fluctuations operating at different scales, multi-scalar interaction including agentive and
extra-agentive processes and influences, short and long term systemic dynamics,
historical contingency, and intentional and non-intentional technological changes.
Although genres of CST have been applied within archaeology (cf. Bentley and
Maschner 2003; McGlade and Van der Leeuw 1997; Roux 2003; Van der Leeuw and
Torrence 1989), the theory itself was not developed for the social sciences. As a result I
have associated new ideas with base principles of CST in order to account for the actions
and ideas of people within a theory of technological change. These ideas focus on my
assumption of an essentialist metaphysic underlying the process of technological change
as interpreted using CST. The adoption of an essentialist position may seem
contradictory to a reaction against culture historical research. However, the essentialist
position maintained within culture history research creates strict limitations on
interpreting change and variation because the normative characteristics underlying

5
typologies are knowable and unchanging throughout the entire spatial or temporal extent
of the typological class or period under question.
I assume that there are underlying essential ideas that direct our actions in creating
technological products, but I reject the ability to know the exact ideal characteristics of an
object now or in the past. This idea does condone a Cartesian mind-body dichotomy, but
only to differentiate between the ideas directing actions and the actions themselves.
Therefore, by rejecting the ability to ever observe or define the essential qualities of an
object I hope to measure instead the variation of many objects around a hypothesized
ideal type thereby creating a bridge between thoughts and actions.
In addition, I emphasize five primary theoretical and methodological aspects of
CST within this thesis. First, emphasis is placed on multi-scalar spatial and temporal
influences in order to account for the different scales of lithic technological change.
Second, emphasis is also given to multi-scalar individual and group level influences in
order to account for the creation of lithic technological change at all scales within a
technological system. These first two attributes are specifically addressed at moving
beyond seamless and linear sequences of time as well as the general inability of other
theoretical approaches to operate within different scales of research. Third, technological
change within a lithic technological system is conceived as a continuous process
operating at all scales of the system. By conceptualizing technological change as a
continuous process it resists the synchrony of the culture historical approach.
Furthermore, if technological change is recognized as a multi-scalar process this
equalizes the effects of both small and large scale systemic processes and introduces the
capability that both endogenous and exogenous influences can affect the technological

6
system. Fourth, the visible effects of prehistoric behaviors (i.e., material culture) must be
explored, but the fifth, and final, characteristic must be the equally important reliance on
the materially invisible cognitive and symbolic correlates of Stone Age lithic material
culture. These final two characteristics seek to move beyond the blinding reliance on
materialism inherent in prehistoric Stone Age archaeology, specifically studies of
prehistoric technological change. The following chapters, therefore, are an intellectual
journey as I play out this theoretical position in an attempt to measure the variation in
flake morphology assumed to be directly related by one or more ideas that underlay the
actions of individuals in the past that created the artifacts.
Problems Associated with the Study of Technological Change
“Change” is defined by the Oxford English Dictionary (2004) as “to become
different, undergo alteration, alter, vary.” The ontology of this definition suggests that
“change” is the mechanism for movement between multiple states of being within the
object under observation. The epistemological quality of “change,” however, is much
more important to the study of archaeology because it provides the contrast and
comparison between the multiple states of being within the study object. The
epistemological recognition of “change” compels us, as contemporarily situated
researchers creating and interpreting archaeological data in the present (cf. Hodder
1991:30, 1999:72; Thomas 2000:4; Tilley 1991:115) to differentiate between the
“current” state of the world and the interpretation of the state of the world as it existed at
some point in the past.
The study of “change”, though, is much too generic. Therefore, this thesis focuses
upon the phenomena of “change” as it is applied to the study of “technology”. The
American Heritage Dictionary (2000) provides a robust and delimited definition of

7
“technology” stating that technology is “the body of knowledge available to a society that
is of use in fashioning implements, practicing manual arts and skills, and extracting or
collecting materials.” This definition recognizes material products and their non-material
correlates, and it does not differentiate for western industrialism. From this definition of
“technology”, and that given above for “change”, the study of “technological change” can
be “variations and alterations in the body of knowledge available to a society that is of
use in fashioning implements, practicing manual arts and skills, and extracting or
collecting materials” (cf. American Heritage Dictionary 2000) However, this definition
of technological change still lacks recognition of technological knowledge and skills for
the symbolic and visual arts such as religious and other graphic representation including
body decoration. Therefore, within this thesis “technological change” is defined as the
study of the “variations and alterations in the body of knowledge available to a society
that is of use in fashioning implements, practicing manual, symbolic, and visual arts and
skills, and extracting or collecting materials” (cf. American Heritage Dictionary 2000).
Although the study of technological change in archaeology is not new, there is a
renewed interest in the mechanisms of the process of change within technological
systems (for example, Bentley and Maschner 2003; McGlade and Van der Leeuw 1997;
Roux 2003; Van der Leeuw and Torrence 1989). A technological system describes the
dynamic and open interrelations of the material and behavioral components that serve to
classify knowledge and techniques for the production of a specific technology. This
definition of “technological systems” incorporates specific elements utilized by French
cultural technologists (i.e., technological systems as a network of chaînes opératoires
practiced by a group) (Lemonnier 1992; Roux 2003) as well as other researchers who
8
employ a complex systems approach (i.e., open systems model and non-equilibrium)
(Bentley and Maschner 2003; Van der Leeuw and Torrence 1989).
The principle problem with current, and past, interests in technological systems is
an over-reliance on using discrete events to explain changes over time in a technological
system without adequately describing the actual processes involved (cf. Van der Leeuw
1989:3). According to McGlade (1999:141), the lack of study into the processes of
technological change is because time was considered to be self-evident. The linear
theories of the twentieth century objectified time, quantified it, and structured it in a way
to provide seamless historical narratives (Bailey 1983; Binford 1981; Fabian 1983;
McGlade 1999; Raper 2001). When an attempt was made to provide an explanation for
technological change, the answer commonly was a rather mundane and cursory
description of the (mostly exogenous) factors involved in technological change, and not
the actual process, with the inevitable outcome being something “better” than before. For
example, a common contemporary explanation of technological change is that it is the
product of fitness enhancing or goal-oriented solutions either at the society or individual
levels (see Fitzhugh 2001; Kim 2001; Mokyr 2000; Pfaffenberger 1992). But, these ideas
do little to explain the actual processes involved in the change itself and merely describe
the ability to increase energy efficiency or productivity.
Another noteworthy issue within technology studies is the scalar difference
between the myriad ideas of technological change. Evolutionary and evolutionary
ecological approaches take a broad view of technology with specific focus upon the
origins of a technology rather than look at technology systems as a whole over time (see;
Fitzhugh 2001; Mokyr 2000; O’Brian and Lymen 2000:ch.2; Ziman 2000a).

9
Functionalist approaches also view technology in a holistic fashion, but focus upon
technological change more as a disequilibrium effect to particular environmental
influences or stress rather than a continuous process of change through time (see Binford
1965; Kuhn and Stiner 1998:152; Pfaffenberger 1992:429-492, 508; Watson et al.
1971:74). As a result of scalar differences within these approaches, prior and
contemporary research into technological systems is nearly incompatible. And yet
without each scale of research together, the study of technology and technological change
would seem wholly incomplete.
A final issue within contemporary studies of technological change is the lack of
discussion concerning unintentional technological changes. The archaeological literature
that specifically addresses ideas of technological change consistently lacks any
substantial discussion of the effects or process of unintentional technological changes in
lieu of a reliance on intentionality to create technological change (for example see
Lemonnier 1992, 1993; McGlade and Van der Leeuw 1997; Roux 2003; Schiffer 2001;
Schiffer and Skibo 1987; Torrence and van der Leeuw 1989; Pfaffenberger 1992; Ziman
2000b). A research agenda that combines intentional and unintentional technological
changes, however, would provide a more robust conception of the nature of technological
change. Such an agenda would incorporate the punctuated events of directed and
purposeful action (i.e., intentional change) in association with the constant acquisition of
unanticipated techniques, tool characteristics, tool types, or technological knowledge in
general acquired during the directed and purposeful events of intentional technological
change (i.e., unintentional change).

10
Resolving the Problems of Prehistoric Technological Change in the Archaeology of the Horn of Africa
A solution to these deficiencies in culture history and theories of technological
change would be a theory of technological change that accounts for dynamic processes
rather than just origins or discreet periods and also integrates the small-scale events of
individuals (cf. Lemonnier 1992) with large-scale events operating over hundreds, if not
thousands of years or more (Allen 1997:40; cf. Braudel 1980:27; Roux 2003:12).
Although there have been previous attempts to move between different scales of
research (cf. Braudel 1980) these attempts have been more descriptive accounts of the
processes involved rather than operationalized methods, thus leaving the user still unable
to dynamically move between multiple scales of research. In order to overcome the
limitations of contemporary, mostly culture historical, archaeology in the Horn of Africa
and emplace it within a more diverse framework, a theoretical and methodological
approach must be employed that has the capabilities to: 1) maneuver between, and link
logically, individual and group level dynamics, 2) maneuver between, and link logically,
multi-scalar spatial and temporal extents, 3) rely on a model for continuous and dynamic
changes, and 4) employ both the visible effects of prehistoric behaviors (i.e., material
culture) as well as their materially invisible cognitive and symbolic correlates.
These ideas still do not resolve the initial dilemma that the spatio-temporal expanse
in African archaeology is too great and the number of researchers too small to afford each
and every archaeological site the requisite attention it deserves. Therefore, a fifth
criterion must be a methodology that brings control to the archaeological record using
particular data to identify the temporal extent of a site, and its particular characteristics
therein, without relying initially, or solely, on generalized trait lists. The explicit purpose
11
of this criterion should only address the expedient initial summation of a site, or region,
as a means for more accurately proceeding with more detailed methods of research in the
future and not simply as a standalone tool for archaeological data collecting.
The benefits these recommendations provide to prehistoric African archaeology
include the abilities to 1) quickly identify cultural and temporal characteristics of a site
for excavation, heritage protection, management, or salvage without relying on
generalized trait lists, 2) study regional/large scale trends while concurrently being able
to study 3) small scale trends such as individual or group actions including technological
variations, 4) mediate between large and small scale processes within a continuous
dynamic framework of change and not as a discontinuous series of time periods, and 5)
utilize material culture but also recognize and begin to interpret its non-material
behavioral, symbolic, and cognitive correlates. Effectively, this method would facilitate
a more holistic research agenda for the documentation of archaeological sites to enable
archaeologists to comprehend and manage better the prehistoric record and employ a
more expansive array of theoretical ideas and particular archaeological methodologies.
And as a further endeavor, the application of CST, in conjunction with the addition of an
essentialist metaphysic, may provide a more robust interpretive schema with which to
infer the development of modern human behavior in the late Pleistocene or early
Holocene. This, however, is outside the realm of discussion here and will only be
touched upon briefly in the concluding chapter.
Conclusion
This thesis will use CST in association with an essentialist metaphysic to explore
the process of lithic technological change during the Middle to Late Stone Age transition
within Ethiopia and Somalia. Changes in lithic technology will be identified using
12
morphometrics. The implementation of this particular theory and method should provide
a more robust conception of technological change that is multi-scalar, continuous, and
links ideas within people’s heads with materialized actions. In turn, this will provide an
avenue of research around perceived deficiencies within culture history and other theories
of technological change.
The thesis is structured as follows: Chapter 2 provides a succinct synopsis of
complex systems, chaos, and non-linear theories and further discusses their application
here within a theory of technological change. Chapter 3 introduces computer assisted
morphometry and discusses the methodology and techniques used to perform a
morphometrics analysis. Chapter 4 begins with a discussion of the Gilgel Gibe
morphometrics lithic analysis and draws upon the theoretical ideas discussed in chapter
two. It also introduces the Gogoshiis Qabe morphometrics analysis as a comparative
study with the Gilgel Gibe analysis to assess the morphometrics method. In the
conclusion of this thesis I summarize my ideas and provide direction for future research.

13
CHAPTER 2 COMPLEX SYSTEMS THEORY
Introduction
Complex systems theory (CST) is not applied by mainstream archaeology. The
reason for this may be due to an overall misrepresentation that the application of this
theory requires substantial high level mathematical knowledge. In fact, it is easy to reach
such an idea as many discussions using a CST, and its related concepts non-linearity and
chaos, in archaeology contain page after page of mathematical jargon not decipherable to
the non-mathematically specialized archaeologist. But, this is a fallacy as the concepts of
CST can be usefully applied to interpret archaeological problems without the need for
complex mathematical modeling. Therefore, the focus of this chapter is to discuss the
history of CST, its relationship with non-linear and chaos theory, and describe how the
concepts of CST will be applied to understand technological change within this thesis.
This chapter will also present the concepts of ideal types and unintentional technological
change in association with the basic framework of a complex systems theory.
Complex Systems Theory, Chaos Theory, and Non-linear Theory: Relationships and Characteristics
Complex systems theory is grounded in chaos and non-linear theory (Bentley and
Maschner 2003; see also McGlade and Van der Leeuw 1997; Van der Leeuw and
Torrence 1989). The foundation of chaos theory can be traced as far back as the late
nineteenth century to James Clerk Maxwell’s research on long-term unpredictability and
sensitivity to initial conditions (Williams 1997:17). During the early twentieth century

14
researchers developed other key components of chaos theory including the concept of
entropy. Much of the current interest in chaos can be traced to a 1963 paper written by
Edward Lorenz; however, it was the advent of affordable, high-power computers in the
1970s that brought about the wide-spread application of chaos theory to the physical and
social sciences (Williams 1997:18).
Chaos is a theoretical idea that seeks to explain changes over time within long-
term, naturally occurring systems. In particular, it is designed fundamentally to interpret
temporal changes strictly within deterministic, complex, nonlinear dynamic systems.
Characteristics of chaos include: 1) determinism (mathematical laws underlying systemic
processes), 2) sensitivity to initial conditions (two slightly different initial inputs can
create two vastly different results), 3) emergence (ability of the system to create new,
more complex levels of order over time) and self-organization (ability of the system to
create order from irregularity without external influences), 4) dynamics (changes through
time), and 5) non-linearity (definitions adapted from Williams 1997).
According to Williams (1997:14), the benefits of using chaos theory include 1) the
ability to identify randomness within a system and explore systemic determinism (see
also Bentley and Maschner 2003:2), 2) greater accuracy for short-term predictions, and 3)
the ability to identify time-limits for reliable predictions. However, chaos theory does
lack the ability to reveal particular details of any underlying physical laws in nature
(Williams 1997:15).
Non-linearity is a component of chaos theory that describes systemic dynamics—
movement and readjustment—through disproportional changes between variables and
reactions within a complex system. A non-linear equation does not plot a straight line on

15
a graph or take on the proportional, linear equation form y = mx + b where x and y are
variables and m and b are coefficients. Non-linearity is useful for describing systemic
fluctuations (Allen 1989:272; Allen 1997:42; McGlade 1999; see also Torrence and Van
der Leeuw 1989:8; Van der Leeuw and McGlade 1997:334) and non-equilibrium,
including the historical dependency of these fluctuations (McGlade and Van der Leeuw
1997:2), long-term systemic unpredictability via unaccountable or changing systemic
variables (McGlade 1999:151), and the capacity of the system to change (Allen 1997:40).
Complex systems theory, also known as “complexity theory”, is a recent term used
to describe multi-scalar intra-systemic interactions whose future trajectory is dependent
upon its history (Bentley and Maschner 2003) via the interactions of “particular-like units
or ‘agents’ ” (Williams 1997:234). In particular, CST focuses on the emergence of new
levels of order (self-organization) within systems that exhibit non-linear and chaotic
characteristics (Williams 1997:234).
Characteristics of Complex Systems Theory
Williams (1997:449 emphases original) defines complexity as “a type of dynamical
behavior in which many independent agents continually interact in novel ways,
spontaneously organizing and reorganizing themselves into larger and more complicated
patterns over time.” Based on this definition, a complex system relies on five basic
qualities:
1. An open systems model to describe the influx of new matter and energy into the system (i.e., births of children, creation of new artifacts) (Bentley 2003:9; Bentley and Maschner 2003:2).
2. Non-linearity to describe dynamics (movement) of the system via the continuous fluctuation of systemic energy (non-equilibrium) (Bentley and Maschner 2003:2). In association with an open systems model, long-term systemic prediction is unable to be made (Allen 1989:272; Allen 1997:42; McGlade 1999; Torrence and Van der Leeuw 1989:8). As a result, the focus changes to predicting the capacity to change

16
within the system through sensitivity dependence on initial conditions thereby introducing the ability for creativity, innovation, and multiple results (Allen 1997:40).
3. Determinism (governance by underlying laws). However, because of non-linear systemic dynamics and an open systems model, the history of the system, and the laws that regulate it, may be impossible to physically identify or predict (Bentley and Maschner 2003:2; Williams 1997:15)
4. Sensitivity to initial conditions (slight alterations in initial conditions creates two or more vastly different trajectories) (Williams 1997:466). Sensitivity to initial conditions is related to the concepts of the “critical path network” that Allen (1989:249) describes as “a scheduling technique for portraying a group of interrelated steps which make up a whole process” and “contingency”, which describes how similar events at different times can trigger vastly different reactions within a complex system because the current setting could not sustain the appropriate chain of events (Bentley and Maschner 2003:2; see also McGlade and Van der Leeuw 1997:2)
5. Emergence (ability of the system to create new, more complex levels of order over time) through self-organization (ability of the system to create order from irregularity without external influences) (McGlade 1999; Van der Leeuw and McGlade 1997:334; Williams 1997:234)
The most important aspect of CST, however, is the capability to maneuver between
numerous scales of reference when the theory is implemented (cf. McGlade 2003:116).
Multi-scalar analysis is vitally important to this approach because CST views systems as
highly complex, interlinked events occurringat any possible scale (Bentley and Maschner
2003; Williams 1997). And true to its non-linear and chaotic roots, CST posits that the
most microscopic event can generate disproportionately greater, or different, macroscopic
events (Bentley and Maschner 2003:5). In particular, Bentley and Maschner (2004:5)
note that one of the goals of CST research is to “discover how movements at a small
scale translate into emergent phenomena at a larger scale or at least what emergent
phenomena can be expected.”
The scale of analysis within CST is variable. CST attempts to bridge both
reductionist and constructionist methodologies (Bentley and Maschner 2003:1) by

17
observing how small scale events can create disproportionately larger macro-scale events
within complex dynamical systems (Allen 1997:40; Bentley and Maschner 2003:5). In
particular, Williams (1997:234) emphasizes a socially situated (micro) scale of analysis
by suggesting that complexity research focuses on the interaction of “particle-like agents”
including the “hierarchical progression in the evolution of rules and structures.” In this
thesis, the use of the term “agents” does connote individuals but refers more generally to
human and non-human agents of change including people, ideas, and objects.
Context within Technological Systems
Complex systems theorists describe context through “sensitivity to initial
conditions” and “contingency”. “Sensitivity to initial conditions” specifically refers to
the reliance of the system upon historical events such that a miniscule action in the past
can translate into disproportionately larger events in the future actions of the system
(Williams 1997). “Sensitivity to initial conditions” also refers to the particular trajectory
of a complex system due to its unique suite of initial conditions (ibid).
“Contingency” on the other hand, describes how similar events at different times
can trigger vastly different reactions within a complex system (Bentley and Maschner
2003:2; McGlade and Van der Leeuw 1997:2). “Contingency” also refers to the concept
of the “critical path network” that Allen (1989:249) describes as “a scheduling technique
for portraying a group of interrelated steps which make up a whole process.”
Relying strictly on the complex systems theory terminology described above,
“context” refers specifically to 1) historical actions, 2) contemporary setting, and 3)
sequences of events, both historical and current, within a complex system. However,
these concepts only describe the mechanical setting and processes of the system and do
18
little to discern the socially situated nature, or meaning, of a complex technological
system that is being investigated here.
A more meaningful approach to study past context within complex technological
systems can be found within the various themes of interpretive archaeology. The specific
epistemology of interpretive archaeology can provide explicit boundaries on what
meaning can or cannot be discerned from the archaeological record, especially
considering the meaning drawn from lithic debitage relating to underlying ideals.
Accordingly, these phenomenologically inclined ideas place a great deal of
responsibility upon the contemporary interpreter, and their actions, to understand past
social processes because it is assumed that only through the interpreter’s present and past
subjective experiences are possible any identifications of meaning (cf. Hodder 1991:30;
Hodder 1999:72; Knapp 1996:143; Shanks and Hodder 1995:5; Thomas 2000:4; Tilley
1991:115; Tilley 1993:3,7). As such, these positions are less concerned with the
explanation of events than with creating an understanding of the event, as a product of
contemporary subjective knowledge (cf. Whitley 1998:13).
Although not explicitly discussed throughout this thesis, the recognition of an
underlying essentialist metaphysic guiding a technological system ultimately is
concerned with meaning. The assumption of ideals guiding technological systems entails
the assumption that these ideals connote specific and subjective social meanings to the
individuals who employ them. However, it is beyond the scope of this thesis to address
these issues in great detail. Suffice to say, the conception of ideals (i.e., ideal types) here
is assumed to never be directly identifiable or materialized by those in the past who
employ them or those of us in the present who wish to study them. I assume instead an
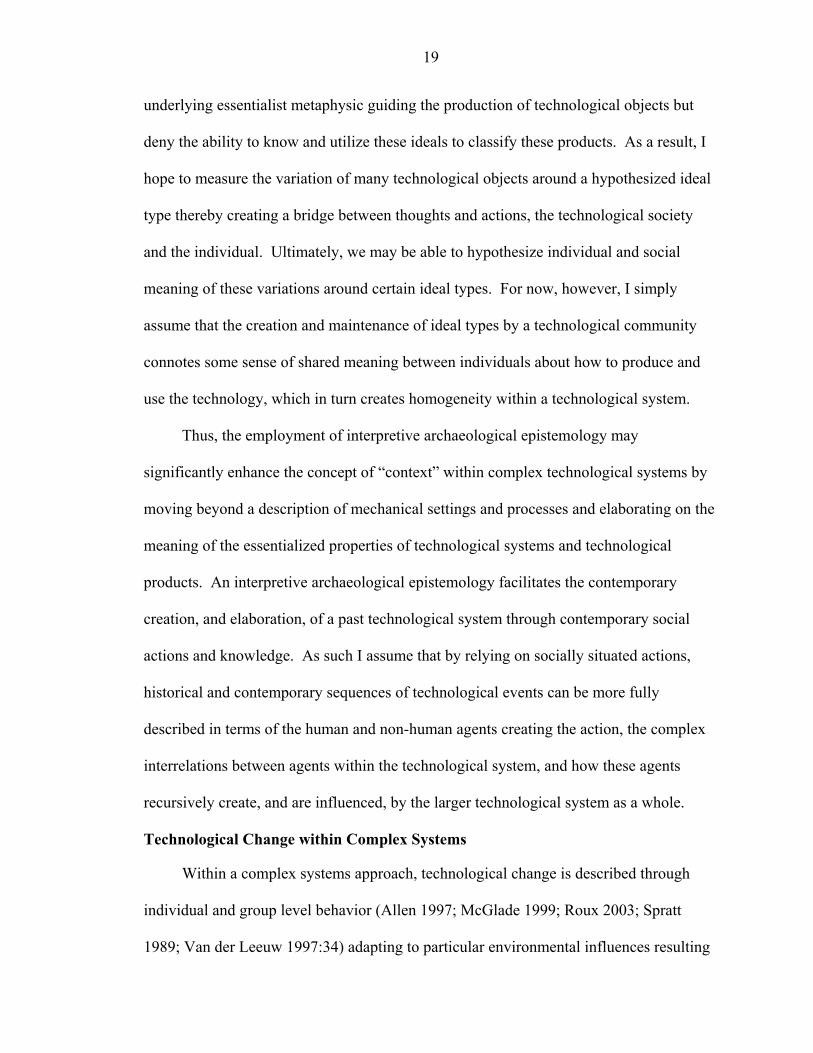
19
underlying essentialist metaphysic guiding the production of technological objects but
deny the ability to know and utilize these ideals to classify these products. As a result, I
hope to measure the variation of many technological objects around a hypothesized ideal
type thereby creating a bridge between thoughts and actions, the technological society
and the individual. Ultimately, we may be able to hypothesize individual and social
meaning of these variations around certain ideal types. For now, however, I simply
assume that the creation and maintenance of ideal types by a technological community
connotes some sense of shared meaning between individuals about how to produce and
use the technology, which in turn creates homogeneity within a technological system.
Thus, the employment of interpretive archaeological epistemology may
significantly enhance the concept of “context” within complex technological systems by
moving beyond a description of mechanical settings and processes and elaborating on the
meaning of the essentialized properties of technological systems and technological
products. An interpretive archaeological epistemology facilitates the contemporary
creation, and elaboration, of a past technological system through contemporary social
actions and knowledge. As such I assume that by relying on socially situated actions,
historical and contemporary sequences of technological events can be more fully
described in terms of the human and non-human agents creating the action, the complex
interrelations between agents within the technological system, and how these agents
recursively create, and are influenced, by the larger technological system as a whole.
Technological Change within Complex Systems
Within a complex systems approach, technological change is described through
individual and group level behavior (Allen 1997; McGlade 1999; Roux 2003; Spratt
1989; Van der Leeuw 1997:34) adapting to particular environmental influences resulting

20
in non-equilibrium systemic processes and subsequent re-organization of the system
(Allen 1989:273; McGlade 1999:150; Roux 2003:6; Torrence and Van der Leeuw
1989:7-8; Van der Leeuw and McGlade 1997:339). For example:
It is the existence of processes such as reproduction, cooperation and competition at the interface of individual and community levels which can, under specific conditions of amplification, generate unstable and potentially transformative behaviour. (McGlade 1999:150)
Adaptability and change come from the interplay of internal variability, system structure, and environmental conditions. (Allen 1989:273)
The non-linear coupling of a relatively structured, slow environmental dynamic and a more rapid and stochastic human one generates bifurcation behaviour. (Van der Leeuw and McGlade 1997:339)
This thesis, however, applies an essentialist position advocating ideal types to
describe technological change. This position suggests that ideas direct the actions of
active agents who manipulate their available resources and knowledge within a pre-
conceived (but not necessarily achieved) prediction of his/her consequences in order to
gauge the value in retaining or discarding technological elements for future use. As a
result changes in the ideal type affect changes in the technological system, but these
changes are instituted only through the discursive and contextualized choices of
technological agents.
Ideal Types
A “type” is nothing more than a “general character or structure held in common by
a number of people or things considered as a group or class” (American Heritage
Dictionary 2000). In particular, ideal types are mental representations an individual or
society has as to the appropriate form a technological product should have for a specific
function. This section discusses the use of ideal type within this thesis and other research

21
and suggests two reasons why the use of ideal types within technology studies is
important.
The use of types is essentialist and normative. However, the primary difference
between the uses of ideal types in this thesis compared to prior research is assumed
inability of past and current individuals to ever identify the ideal type or produce it
perfectly in material form. This is different from culture historical research where
normative values are used by a researcher to classify and compare one culture against
another through the use of trait lists (Trigger 1989). The use of types in culture historical
research suggests that any person is able to know, and materially express, their shared
normative values. In contrast, the employment of ideal types here is employed strictly as
a heuristic to describe general similarities in thinking among members of a technological
system, and it is the variation around ideal types with which we can infer change.
Many other theories allow for mental or cognitive contributions to technology, but
references to ideal types within technology studies seem to be highly variable.
Lemonnier (1993:3-4) suggests that there are underlying mental processes directing our
actions. Roux (2003), following Lemonnier and others, suggests that the compromise
between formal and ideal properties of artifacts advocated by the behaviorist approach
(cf. Schiffer and Skibo 1997; Skibo and Schiffer 2001) creates an over-simplified linear
sequence of change and unrealistic duality between technology and society. In addition,
through their recognition that choices can be used to improve an artifact’s performance
characteristics and that those creating a technological product have a conception of
optimum levels of performance, Schiffer and Skibo (1987), imply the existence of ideas
that direct actions, but not an explicit conception of ideal, shared form types:
22
ideally then, the tinkering artisan tries out different technical choices, attempting to optimize an artifact’s activity relevant performance characteristics. In practice, however, many performance characteristics fall short of optimal levels because of their complex causal relationships with technical choices and formal properties. (Schiffer and Skibo 1987:599)
Others recognize ideal types but misrepresent its use. For example, Rolland and
Dibble (1990:483) note that
any of the retouched tools found in Middle Paleolithic assemblages represent worn-out, discarded objects rather than intentional end products . . . in this case it would not be true that the lithic types represent deliberately shaped objects reflecting normative values
Rolland and Dibble are absolutely correct to state that the original “normative
value” may not be preserved in the final morphology of the tool. However, contra
Rolland and Dibble (1990:483), from a heuristic point of view there are normative ideal
types in the final morphology of a lithic tool; they are just different from the original
“normative value” of the tool. An idealist basis for technology requires that the ideas
must always precede actions. Even later modification events conform to some “ideal”
characterization.
This section has, up until this point, concentrated on a discussion of the infrequent
and implicit use of ideal types within other research. In spite of the lack of use within
contemporary technology studies, and a common opinion throughout the discipline of
archaeology that essentialist ideas are outdated and largely rejected, I still intend to argue
for two benefits that an essentialist conception of ideal types can offer a theory of
technological change. First, the ideal types privileges the mental conceptions of a
technology held within the minds of the technological agents. Second, the ideal type is
the foci of the technological system creating similarity within its materialized effects
(artifacts).
23
First, my use of ideal types only privileges the mental conceptions of a
technological form held within the minds of the technological agents. The materialized
effects of a technology (i.e., artifacts) are simply the by-products of the process that
attempts to recreate—but never attain—the “ideal tool” materially based on the mental
conceptions of the “ideal type.” Technological change, therefore, is found within
variations of materialized tool form around an ideal type as well as alterations of the ideal
type itself held within the minds of the technological agents and secondarily manifest in
the materialized by-products of that technological system. Precisely for this reason I
hope to move beyond prior conceptions, and use, of essentialist ideas and ally it more
closely with a materialist metaphysic that allows for measurable variation of change
through time.
Second, the ideal type becomes the foci of a technological system allowing for
similarity within its materialized effects (artifacts). Using CST terminology, the ideal
type can be likened to the convergence of a system towards an “attractor” (cf. Williams
1997:447). However, the state of systemic equilibrium also associated with the concept
of an attractor can never be achieved using my concept of ideal types because the type is
assumed to never be achievable. This presumption creates a constant and dynamic
locomotion of change within the technological system. The drive of innumerable
technological agents to invent the “ideal tool” creates a technological system that is
constantly in the processes of non-linear and seemingly chaotic action.
This action, what I see as a gravitational movement around the ideal type, is
perturbation. Perturbation is a “displacement in a trajectory or any difference between
two neighboring trajectories or observations at any given time” (Williams 1997:169). It
24
is a means for describing the movements of a technological system over time though self-
organizing fluctuations (cf. McGlade 1999; Torrence and Van der Leeuw 1989:8; Van
der Leeuw and McGlade 1997:334) that are essential to the survival of complex and non-
linear systems (Van der Leeuw and McGlade 1997:338).
Perturbation is directly associated with the sensitivity to initial conditions (cf.
Williams 1997:466), contingency (cf. Bentley and Maschner 2003:2; see also, McGlade
and Van der Leeuw 1997:2) and critical path (cf. Allen 1989:249) of a technological
system. Allen (1989:269) notes “because of fluctuations the real system is always, in
fact, probing the stability of the particular situation and, depending on which fluctuation
occurs at a critical moment, the system will move to one or another of the stable
behaviors which are possible.”
However, perturbation by itself is an incomplete concept to describe how
technological changes occur because perturbation only describes movement in a
trajectory. The origin of technological change is always with the technological producer.
In particular, within my model technological changes result from the recognition and
decision to implement intentional and unintentional changes through a technological
producer’s available knowledge base and conception of the ideal type for that particular
technological system. The next section introduces the concepts of intentional and
unintentional changes. Particular attention is focused on unintentional changes as the
primary catalyst for technological changes.
Ideal types are a critical component of this thesis’ interpretation and application of
CST as it pertains to technological systems. The ideal type is the foci of a technological
system providing continuity in form and function of what is produced and it is the locus

25
of technological change because as the ideal type changes so too does the technological
system as a whole. But, the ideal type is just the focus of technological change. The
actual means by which technological systems change is more precisely described through
the processes of intentional and unintentional changes incurred through the process of
technological production and the influence of technological agents.
Intentional and Unintentional Changes
The predominance of intentional technological change within archaeologically-
based research restricts the ability to conceive of technological changes in any other way
(however, see McGlade 1999:152; Schiffer and Skibo 1987:597; Torrence and Van der
Leeuw 1989:10). Equally important, however, is the idea of unintentional technological
change. This section describes the differences between intentional and unintentional
technological changes and advocates a research agenda that utilizes both concepts of
technological change. In addition, Appendix A presents the results of an experimental
archaeological project designed to investigate the process of intentional and unintentional
technological changes.
A research agenda that combines intentional and unintentional changes is useful for
two reasons. First, a combined research agenda incorporates the punctuated events of
directed and purposeful action (intentional change) in association with the acquisition of
unanticipated techniques, tool characteristics, tool types, or technological knowledge in
general acquired during the directed and purposeful events of technological change
(unintentional change). Second, intentional technological change facilitates an open
systems model of complex systems because unintentional changes are hypothesized to
occur constantly as a source of diversity but are only recognized infrequently. In
addition, the concepts of sensitivity to initial conditions, critical path, and contingency

26
describe the incorporation of unintentional changes into a technological system. The
adoption of unintentional changes requires first the recognition of the variation based on
the contingency of the situation and critical path of the person’s knowledge base, and
second the emergence of a qualitatively modified technological system through self-
organization in order to incorporate the new technique, tool characteristic, tool type, or
technological knowledge into the pre-existing conception of the ideal type.
The concept of “intentional change” describes the active and directed process of
technological creation and invention. This position, which I call “intentionalist,”
maintains that technological changes occur as the result of the purposeful and conscious
influence of directed individuals (for example see Fairtlough 2000; Lemonnier 1993;
Martin 2000:99; Schiffer 2001b; Schiffer and Skibo 1987:599), larger technological
systems (for example see Pfaffenberger 1992; Roux 2003), or even creativity (Boden
1998; Hodder 1998; Kuhn and Stiner 1998). In particular, the intentionalist position
relies on the direct reproduction of the forms and techniques that structure the creation of
technological products (cf. Roux 2003:5; Schiffer and Skibo 1987:597; Ziman 2000:5a).
Examples of the intentionalist position are found in Hodder (1998:62 emphasis added)
who notes that creativity is “associated with the more active process of problem solving,
imagination, and invention” and Schiffer (2001b:217) who succinctly sums up the
intentionalist position by suggesting simply “in the invention process, people create…”
On the other hand, unintentional technological change refers specifically to the
decision to implement unanticipated techniques, tool characteristics, or tool types
achieved during the intentional production of technological products that alter the ideal
type through its design strategy and use. The basis of unintentional technological change

27
is associated directly with the inability to create a perfect one-to-one relationship between
the mental conception and physical production of a technological product (cf. Ziman
2000:7a). The imperfect reproduction of a similar material product, or production of a
new idea, is a result of the inherent qualities in raw material and the influences of various
social, ideological, and physical contexts of both the technological product and producer.
As a result, the process of technological production can be more accurately described as
“production-in-kind” whereby the technological agent assesses any identifiable
unintended variations based on the current ideal type and reorganizes his or her
knowledge to accept or reject these variations.
Underlying the concept of unintentional technological change is the idea that
unintentional changes occur constantly during every act of technological production or
modification. However, a technological agent may not identify any constantly occurring
unintentional changes until some later date. The ability to identify, and assess the
potential of, unintentional changes is directly linked to the socially situated current
context of the technological agents including the critical path (cf. Allen 1989:249) and
contingency (Bentley and Maschner 2003:2) of their technological knowledge. The
critical path of the knowledge available to a technological agent is essential for
identifying potential in the unintended variation. A technological agent will discard an
unintended variation if they have no extant knowledge to identify any usefulness of a
technological variation into an existing technology or aid in the development of a new
technology.
A preliminary experimental archaeology project studying the ability of nine
volunteers with no knowledge of stone tool production or use to make and use stone tools
28
underlines the duality of intentional and unintentional technological change and the role
knowledge and context serves to identify and implement these changes (Appendix A).
The results of this experiment provide verbal and visual evidence that each group did rely
on pre-conceived ideas to direct their actions. Furthermore, during the course of
intentional, directed actions to make a specific stone tool, unintentional variations were
observed to occur frequently and when identified and adopted had the potential to change
the ideal conception of a certain tool for the group. Finally, direct observation of each of
nine participants as they adopted unintentional technological changes suggests that this
process is controlled by the individual’s knowledge critical path to see potential within
the variation as well as how the variation can be applied within the contingency of
current actions.
The contingency of a technological system concerns the social and historical
situation and knowledge base of a technological system and it is crucial to both
intentional and unintentional technological changes (Bentley and Maschner 2003:2; see
also McGlade and Van der Leeuw 1997:2). In particular, contingency is a tool to
describe how the context of a technological system must be capable to sustain sufficiently
an unintentional technological change because the incorporation of unintended variations
can initiate rapid and punctuated changes within a technological system.
A prime example of contingency within a technological system is the Fairbanks
Morse (FM) H-20-44 Trainmaster diesel locomotive. According to the foreman of the
machine shop at FM during the time the Trainmaster was unveiled (Kenneth Bunnell,
2004) and Ingles (1996), the Trainmaster was introduced on the market in 1953 and was
considered to be decades ahead of its time in terms of technological efficiency. The

29
Trainmaster was hailed as the single greatest improvement in diesel engines since World
War II. The 2400 HP Trainmaster was the first diesel locomotive to have six individual
traction motors operating each of its six axles, and it was also the first locomotive to have
an engine with aluminum bushings. But, the feature that has had the greatest impact on
the railroading industry was the automation built into the control of the locomotive. This
automation meant that one person could operate the engine instead of the standard three
persons on other types of locomotives.
From the Trainmaster’s technological superiority versus contemporary diesel
locomotives, it seems logical that the Trainmaster would have been readily accepted by
the railroading industry. Certainly, there would be more than just one of these engines
remaining today. However, efficiency and superior technological qualities are
meaningless unless the social context is receptive to the technology. Soon after
introducing the Trainmaster, FM entered into negotiations with the New York Central
(NYC) railroad for the purchase of 100 Trainmaster units. However, the NYC was
concurrently also in contract negotiations with the railroading unions. The unions, fearful
of the three-quarters job loss the Trainmaster would bring with it, offered to accept the
NYC contract proposals so long as the NYC did not accept the FM Trainmaster contract.
As an unintentional consequence of the efficiency of the Trainmaster, the NYC did not
buy any new Trainmasters. Three years later, the NYC filed for bankruptcy from having
to pay high personnel salaries and the chairman of the NYC railroad committed suicide.
In addition to this debacle of contingency, Fairbanks-Morse, a once grandiose company
among the railroading industry, was effectively cut out because they had hoped the
Trainmaster would save them from impending financial ruin. The railroading industry
30
eventually implemented many of the technological changes forecasted in the Trainmaster
once the context was receptive to these changes thereby transforming the technology of
railroading in the process.
Furthermore, the intentional development of the Trainmaster had specific
unintentional consequences as a result of the contingency of the then current social
context. It was not how the Trainmaster changed FM or the railroading industry directly,
but how the Trainmaster was unable to be maintained that was contingently important;
the Trainmaster was just too far ahead of its time for its social and technological context
and this caused radical unintentional change throughout the railroading community.
A technological system must qualitatively reorganize itself to accommodate the
changes incurred following the identification and adoption of both intentional and
unintentional technological changes. In particular, the ideal type of a technology must be
reconsidered and modified in order to institute the technological change. Often, the
qualitative shift in the ideal type is no more than a reconsideration of the creation and use
of a particular technological product since ideal types are no more than a concept held in
the minds of technological agents. As for the Trainmaster example above, there were
several scalar qualitative shifts in the enormously large railroading technological system.
At a proximate scale, Fairbanks-Morse stopped producing railroad locomotives and
focused on engines for marine or other applications. On a much larger scale, the
American railroading system saw the potential, and problems, of the Trainmaster and
eventually developed engines with greater personnel and mechanical efficiency.
The Technological Life Cycle
No discussion of technological change is complete without due consideration for
the macroscopic, long term changes affecting technological systems. In particular, when
31
discussing technological changes occurring over a long period of time there must be
some discussion as to how one particular technology ends and another begins in its stead.
Up until now, this discussion has focused on the explanation of proximate technological
events and processes. This section has one primary objective. By focusing on the long
term development and eventual end of technological systems as a whole entity, this
section presents a model to discuss the origin, development, peak, and decline of a
complex technological system over the long term.
The Trajectory of Long Term Technological Systems
Due to the sensitivity to initial conditions of any technological system (cf. Williams
1997:466), no two technological systems will follow the same trajectory. Though some
technological systems may appear more analogous than others, the underlying chaotic
principles of any complex technological system dictates that the slightest alterations in
initial conditions of any complex system create vastly different systemic trajectories.
Add to this that the critical path of knowledge (cf. Allen 1989:249) and contingency (cf.
Bentley and Maschner 2003:2) of any technological system creates a unique set of
influences and each technological system then, by definition, is exclusive.
All technological systems, however, do follow a very similar, though much
generalized, pathway from initial conception, growth, peak, decline, and abandonment.
This model describes the crucial relationship between two sequential technological
systems, one system succeeding the other. Furthermore, the application of complex
system theory to this model provides ample ability to maneuver between the large scale,
long-term processes of a technological system and the small scale, short-term dynamics
between a technological agent and a technological system.

32
Ideally, the generalized, long-term trajectory of a technological system is best
represented by a logistic curve. Logistic curves are capable of describing the origin and
development of a complex technological system over time, including the limitation of
systemic growth and eventual systemic decline. The natural growth pattern for a logistic
system is through the S-shaped logistic curve. According to Modis (2003), the beginning
of any log curve is exponential. This suggests that two users of a technology would pass
on the idea to two other users, and they would pass on the technology to two other users
each, and so on and so forth.
Exponential systems, however, require an equally exponential amount of resources
to sustain the rapid growth of the system. Therefore, exponential systems cannot last
indefinitely because of the limitations imposed by the availability of resources. Once a
technological system reaches its maximum capacity of resources, the growth rates begin
to slow down and eventually stabilize. McGlade and McGlade (1989:283) show that the
adoption of a technology in a society follows a logistic curve in response to the initial
adopters of a system, those that adopt after some delay, and the “laggards” adopting the
technology after much delay. The underlying mechanism to their model is diffusion
(ibid). Modis (2003) also discusses the potential of logistic curves in technological
systems although he relies upon competition as being the underlying factor in the model.
Growth and Complexity of a Technological System
In figure 2-1, ‘A’ is the genesis of technology ‘1’. The rise in the curve (B)
represents the exponentially based rate of adoption for a technology by technological
users. In the past, technological adoption has been perceived to be a product of the
effectiveness of a technology (Torrence and Van der Leeuw 1989:10), the representation
between technology and society (Pfaffenberger 1992; Roux 2003 following Lemonnier

33
1989, 1993), extra-technological factors (Schiffer and Skibo 1987), and the perceived
future benefits, costs, and risks of adopting the technology (Kim 2001). Technological
adoption is seen here as a product of each of these factors because these variables
establish the natural and social limitations with which to gauge any new technology.
Following adoption of a technology, the increase in technological users expands the
capability for variation within the technological system. The expansion of the possible
variation that can occur during production likewise increases the possibility of
introducing greater complexity into the technological system. Complexity is a contested
and speculative subject. Modis (2003:29) notes that complexity cannot be quantified.
Instead he argues that the relative amount of complexity can be calculated by determining
the importance of an event as directly proportional to the complexity it introduces into the
system, and also by the length of the stasis preceding the next event. According to
Modis’ (2003) formula, a more important event would then introduce more complexity
into the system, and also have a longer period of stasis following the event, than a less
important event.
However, Modis’ definition of technological complexity would be very difficult to
apply to the African Stone Age because neither the important event nor the resulting
stasis may be archaeologically visible. Therefore, instead of trying to quantify
“complexity” in this thesis (sensu Modis 2003), I suggest that it is more appropriate to
discuss the “approximation of the degree of complexity” as proportional to the frequency
of technological users sharing a similar ideal type for employing, creating, and modifying
a technology. As the number of users within a technological system increases, the
possibility for more variation within the system is likewise increased, thereby introducing

34
the likelihood for greater systemic and technological complexity. This idea of
complexity does assume a direct correlation between quantity of individuals within a
technological system and the quantity of variation within that system, but with future
research this premise could be tested archaeologically.
Peak
The peak in the technological life cycle (Figure 2-1 label C) is a direct result of the
introduction of a competing technology, and like the approximation of the degree of
complexity, the peak of the technological life cycle also refers to the frequency of use of
that technology. The assumption of this model is that this peak is brought on by a
competing technology that draws away users of the current technological system holding
other variables such as population or material resource availability constant. This limits
the amount of resources and energy available to the current technological system because
these resources are being redirected towards the competing system. A viable competing
technology must have significant qualities that make it more appealing to the
technological users, and also have the ability to operate within the users’ social contexts.
The new technological system must also possess enough similarity to the existing
technological system to be positively recognized and received by a society. The example
given earlier in this discussion of the Fairbanks-Morse corporations showed exactly this
concept; the Trainmaster was too far ahead of its time, therefore, it was ill-received and
greatly affected the railroading industry at that time.
Decline
If two technological systems are in direct competition then the adoption of a new
technological system causes the decline of the existing technological system (Figure 2-1
label D). The use of the term “decline” here does not suggest the immediate eradication
35
of the former technological system. The adoption and decline between two competing
technological systems is simply a shift in the predominant application of resources,
knowledge, and use from one system to another. As this shift occurs, the former
technological system becomes less and less utilized. The loss of users limits the amount
of variation (i.e., the approximation of the degree of complexity) within the technological
system thereby restricting the frequency of future intentional and unintentional systemic
changes.
Ideal types are assumed here to structure the process of decline. While in decline,
the innumerable variations and knowledge attributed into the technological system will
be lost (i.e., unable to be maintained) until all that remains is only enough knowledge to
accomplish the task set forth by the ideal type. The removal of technological attributes
during the decline of the technological life cycle is simply just another qualitative change
to the ideal type and nothing more. In essence, the ideal type has changed yet again
while the system is in decline, and it is in no way comparable in terms of quality,
quantity, or character to prior and future states of the ideal type because of the
contingency and critical path of the system’s history, and ever-changing contemporary
influences on the system which may seek to propel the system in new and unpredictable
directions.
Conclusion
This chapter has introduced several new concepts into CST and its application to a
theory of technological change. First, I have introduced an underlying essentialist
metaphysic of ideal types controlling the process of technological change. Second, I
redefined context using interpretive archaeological hermeneutic and phenomenological
theories in order to allow for the experiential and relativist recognition of meaning in past
36
technological systems. I assume that ideal types imply a shared sense of meaning about
how to produce and use a technological product and that this definition of context brings
together thoughts and actions, the technological society and the individual. Third, I have
introduced the conception of unintentional technological change drawing from the
assumed inability of a technological producer to ever identify and create a perfect copy of
the preconceived mental conception (i.e., ideal type) and physical production of a
technological product. Fourth, I have introduced a model of long-term growth, peak, and
decline of technological systems including the creation of complexity within a
technological system.
Therefore, using CST, as I have modified it here, I believe that human actions and
internal and external influences can be appropriately modeled through the device of a
system. In particular, this modified Complex Systems Approach is aptly suited for
modeling technological systems because it facilitates dynamic events that can abruptly
alter the trajectory of a technological system while also accounting for the contemporary
and historical context of the technological system. Furthermore, the multi-scalar
capability of CST easily allows for descriptions of technological influences and change
on both micro and macroscopic levels. By far the most advantageous quality of CST, as
it is applied within this thesis, is its ability to incorporate both material culture and non-
material cognitive ideas and behaviors of individuals to explain the changes within a
technological system.
Thus, I believe that the application of CST within studies of technological change
has the potential to provide significant improvements in the way technological change is
identified and described. The following chapters move beyond a purely theoretical

37
discussion of CST within technological change and provide a methodology for
operationalizing this theoretical approach within archaeological and ethnoarchaeological
research. To do this, chapter three introduces the application of computer assisted shape
analysis (morphometrics) to analyze morphological changes in archaeological flake
debitage. Finally, chapter four presents the results of a morphometrics analysis of two
Stone Age sites from the Horn of Africa and applies CST, as described in this chapter, to
interpret the results.

38
Figure 2-1 The technological life cycle of three different technological systems. Technology 1 is a complete life cycle representing the genesis, adoption, stasis, and decline of any technological system. Technology 2 represents a technological system in decline and Technology 3 represents the genesis of a technological system competing with Technology 1 and 2 for technological users and other resources.

39
CHAPTER 3 PUTTING A SHAPE ON TECHNOLOGY
Until now, this thesis has focused primarily on the theoretical background for a
complex systems approach to technological change. The task is now to show how a
complex technological system, relying on the assumed cognitive ideal types posited in
the theory, can be identified in the real world. This chapter seeks to find a method to
answer the following questions: 1) how can we observe technological change in the
archaeological record using computer-assisted shape analysis and interpret these changes
using a complex systems approach, 2) how can we identify the variations around
cognitively-based ideal types through an analysis of form in the archaeological record,
and 3) how can we observe the changes of ideal types through time?
Morphometrics
In my model I propose that the process of technological change is measured in
terms of the attempts to replicate the ideal conception of a particular tool based on a
specific function and context. However, because of deterring factors found in the
somatic actions of the technological agents, properties of the raw materials, and
extrasomatic influences such as the spatio-temporal environment, the ideal type can
actually never be materialized. Thus, according to this model technological change is
found in the shifts of the ideal type over time as evidenced by the always imperfect
materialization of the ideal type. Therefore, if the ideal type consists of a configuration of
specific fundamental formal properties of a technological product, as I have suggested,
then it is plausible that the morphometry of the materialized technological products

40
should provide an avenue to study the variations around an ideal type through time and
the change from one ideal type to another. The pursuit of this theoretical model further
requires methods that can identify the relative shapes of the ideal types and map their
changes over time.
Morphometrics is the study of the shape, or more general morphology, of an object.
The analysis of shape has been a research topic in anthropology for a great deal of time.
In particular, the use of shape to classify stone tools has existed since the early 20th
century. Black and Weer (1936) presented a lithic typology that identifies the basic form
of the object by classifying it either as “rectanguloid”, “trianguloid”, or “circuloid.”
Currently, many lithic analyses commonly categorize artifacts based on their cross-
section, profile, and plan-view. However, the problem with such terminology, and
application methodology, is the inherent subjectivity and ambiguity found in the
distinctions between one shape type and another (cf. Gero and Mazullo 1984:317; Rovner
1995). What is “sub-rectangular,” and how is it different from “rectangular” or “square,”
for example? The problem lies in the ordinal nature of this system. Shape is not based
on an objective and pre-defined reference point. Rather shape is defined based on the
degree of difference from another similar shape (Gero and Mazullo 1984:317). For
example, rectangular is more elongated than “sub-rectangular,” which is more elongated
than “square,” “sub-circular,” or “circular1.” Although the classes of shapes such as
“square,” “rectangular,” or “circular” may be used with explicit definition, the gradations
between these classes are ambiguous. Furthermore, shapes of actual artifacts rarely, if
1 Here, square refers to an object with four equidistant planes connected through rights angles. ‘Rectangular’ refers to an object with two pairs of equidistant planes connected through right triangles whereby one pair of planes is longer than the other. ‘Circle’ refers to a plane curve equidistant from a fixed point.
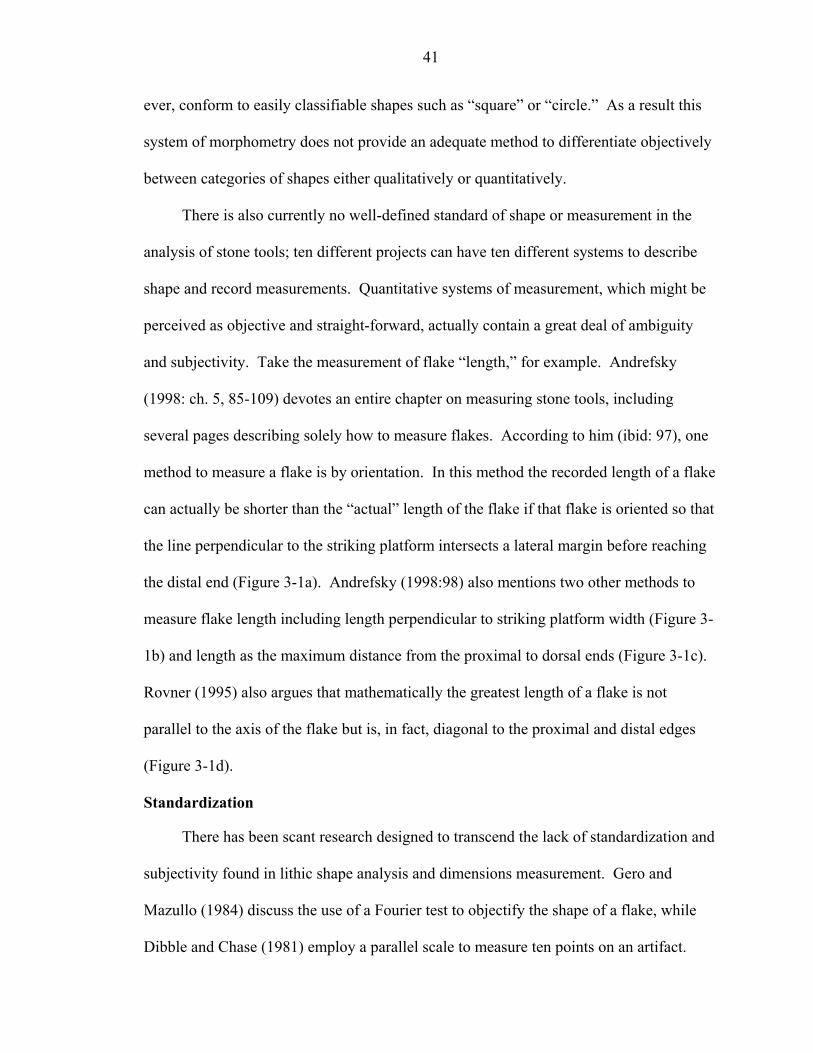
41
ever, conform to easily classifiable shapes such as “square” or “circle.” As a result this
system of morphometry does not provide an adequate method to differentiate objectively
between categories of shapes either qualitatively or quantitatively.
There is also currently no well-defined standard of shape or measurement in the
analysis of stone tools; ten different projects can have ten different systems to describe
shape and record measurements. Quantitative systems of measurement, which might be
perceived as objective and straight-forward, actually contain a great deal of ambiguity
and subjectivity. Take the measurement of flake “length,” for example. Andrefsky
(1998: ch. 5, 85-109) devotes an entire chapter on measuring stone tools, including
several pages describing solely how to measure flakes. According to him (ibid: 97), one
method to measure a flake is by orientation. In this method the recorded length of a flake
can actually be shorter than the “actual” length of the flake if that flake is oriented so that
the line perpendicular to the striking platform intersects a lateral margin before reaching
the distal end (Figure 3-1a). Andrefsky (1998:98) also mentions two other methods to
measure flake length including length perpendicular to striking platform width (Figure 3-
1b) and length as the maximum distance from the proximal to dorsal ends (Figure 3-1c).
Rovner (1995) also argues that mathematically the greatest length of a flake is not
parallel to the axis of the flake but is, in fact, diagonal to the proximal and distal edges
(Figure 3-1d).
Standardization
There has been scant research designed to transcend the lack of standardization and
subjectivity found in lithic shape analysis and dimensions measurement. Gero and
Mazullo (1984) discuss the use of a Fourier test to objectify the shape of a flake, while
Dibble and Chase (1981) employ a parallel scale to measure ten points on an artifact.

42
Yet, in spite of solutions such as these, contemporary lithic analysis still has not adopted
a less-subjective and standardized methodology to record the shape and dimensions of
stone artifacts. Therefore, to move beyond this perceived deficiency, I have employed
computer-assisted imagery analysis as a method to provide an objective measure for lithic
archaeological research.
Computer-assisted imagery analysis uses computers to measure the shapes of
objects using digitized raster images taken of the objects. Any object can be digitized,
and simple digitization can be achieved using a digital camera, scanner, or video
recorder. Digital images are recorded in a pixel-based Raster format. In this format each
pixel in the image has a particular value corresponding to its color displayed on the
screen. The Raster format is significant because it introduces the possibility of
mathematically analyzing and manipulating the pixels in an image. There is a primary
drawback to this method, however. Raster images are dependent on the pixel resolution
of the image. Therefore diagonal lines have to proceed over and down around the
borders of specific pixels. If the resolution of an image is set too low, then the pixelation
of the object could potentially alter an analysis.
The computer assisted imagery package used in this research was the Image
Processing Toolkit® version 5 (IPTK) developed by Reindeer Graphics, Inc. As shown
in figure 3-2, after digitizing an image, the necessary next step transforms this image into
binary raster format. Color images can contain millions of colors and thus an equally
great amount of values for its pixels. Programs such as the IPTK have the ability to
isolate each pixel value, but this does not identify the actual object in the image. In
essence, the program cannot sense the forest from the trees. Therefore, the user must first

43
select each object intended for analysis within an image (Figure 3-2a). Within Adobe
Photoshop®, objects within an image are selected using the Magic Wand tool. This tool
selects a range of pixels with similar digital number values based on the input pixel value.
The conversion to binary format isolates each selected feature within an image and
reclassifies the value of pixels contained within its area as '1'. All other pixel values are
reclassified as '0'. The end result of a binary transformation is a white image with a series
of black silhouettes of the objects that were selected (Figure 3-2b). Although this process
eliminates all other color information embedded within the image, by reclassifying pixels
as either '1' or '0' (i.e., “on” or “off”), it also provides the ability to accurately employ
mathematical calculations of shape and dimension on the silhouetted objects within the
image.
Morphometrics analysis has several primary benefits. First, hundreds of artifacts
can be digitized in an expedient manner providing more time for an analysis or the
collection of more data in the same amount of time. Second, morphometrics increases
the efficiency of data collection because more than one object can be represented within a
single image (for example see Figure 3-2a). Personal experience has shown that up to
sixty flakes can be included within one digital image without variations in morphometric
statistical results within four significant digits. However, as noted above the pixel
resolution of the image is a significant constraint in the ability to record many objects in
one image. Although pixel resolution can be increased, this also increases the size of the
computer file. Therefore, the researcher must first decide on the relation between pixel
resolution and image size versus recorded area and number of objects. Third, the entire
analysis process from image procurement, binary conversion, and tabular data output
44
rarely takes longer than a few minutes. For example, as will be discusses in chapter four,
in preparation for this thesis research, I was able to analyze morphometrically over 1800
flakes in two weeks’ time.
By far the most advantageous aspect in employing computer assisted
morphometrics is the ability to ensure a measure of objectivity and standardization within
lithic morphometry. Computer-assisted image analysis programs such as the IPTK come
with a pre-set suite of shape and dimension functions based on contemporary
morphometrics techniques. The only subjectivity within computer assisted shape
analysis is found in the relationship between the real world shape of the object and its
pixelized raster image. The techniques used to measure the shape and dimension of
objects quantitatively provided in morphometrics programs are not subjective.
Computer-assisted shape analysis is objective because the program does not analyze
shapes as “shapes” per se rather it simply quantifies the patterns of pixels with a value of
‘1’.
Measures of Shape and Dimension
The standardization and limited subjectivity of computer assisted shape analysis is
linked to the methods the program employs to measure the selected objects. Among the
many measures of shape and dimension that the IPTK records are area, perimeter, “x-
feret,” “y-feret,” length, and width. Unlike the ambiguity discussed earlier for measuring
the length and breadth of an object, computer-assisted analysis works around this issue by
relying on only two distinct and predefined measures of length and breadth. The first
measure of length and breadth, for example, is called “X-Feret” and “Y-Feret.” These
are measures of the widest points of an object on the x and y axes respectively. These
measures are dependent upon the orientation of the object relative to the x and y axes

45
(Figure 3-3). Values for “X-Feret” and “Y-Feret” are recorded in pixels. In contrast, the
measure for “Length” records the distance of the longest arc between two points within
an object (maximum caliper distance) whereas “Breadth” measures the minimum caliper
distance (Figure 3-4) (Russ 2002; Rovner 1995). Both “Length” and “Breadth” operate
independent of object orientation.
The IPTK software outputs a text file of over 20 different calculations of shape and
dimension. Not all of these values were used in this research. Therefore, this discussion
will be limited strictly to those measures used to analyze lithic flakes. In particular, I will
discuss the use of “formfactor,” “roundness,” “aspect ratio,” and “elongation” in
conjunction with a separate measure that records the ratio of the “formfactor” and
“roundness” values of an object.
Formfactor, roundness, aspect ratio, and elongation are dimensionless measures.
This means that they record similar values depending on the shape of an object
irregardless of size. The mathematical formulas for these measures are shown in
Appendix B. Formfactor measures the changes in the perimeter of an object irrespective
of the elongation of the object (Russ 2002; Rovner 1995). Essentially, the formfactor
measures the edge roughness of an object. Roundness, on the other hand, measures how
round an object is independent of the object’s perimeter roughness (ibid). Used together,
the formfactor and roundness indices provide a very descriptive analysis of the shape of
an object. Both of these measures are calibrated against a perfect circle which has a
value of ‘1’. Within both measures, greater values indicate the degree of departure from
a perfect circle. Figure 3-5a shows several “generic” shapes including a circle, square,
rectangle, and triangle and their corresponding formfactor, roundness, elongation, and

46
formfactor divided by roundness values for comparison. Figure 3-5b shows these same
morphometrics measures for more amorphous shapes. In particular, figures 3-5a and 3-
5b illustrate the differential change in formfactor and roundness values as the perimeter
(irregularity) and roundness (elongation) diverge more and more from a perfect circle.
The quantification of shape is certainly a benefit for objectivity and standardization
in analysis, but it is also a problem as well. If I told another person that an object is “sub-
circular” then that other person might have a rough indication of what shape I am
discussing albeit most likely with slight subjective differences from what I think is “sub-
circular.” However, if I were to tell this same person that a specific object had a
formfactor and roundness value of ‘0.89’ this most likely would not connote that I have
actually just described a very similar “sub-circular” shape because we do not use
numbers to classify shapes in everyday activities. The ability to use this quantitative
shape analysis, therefore, hinges on a firm understanding of how the measures operate
because the values themselves have little relevance to everyday activities.
The other two default measures of shape introduced earlier are elongation and
aspect ratio. Elongation measures the skeleton length of an object divided by the mean
fiber width (Russ 2002; Rovner 1995). Skeleton length is the length of the centerline of
the object. The skeleton is created by removing all pixels in an object except those that
make up the midline. Mean fiber width measures the mean distance from all pixels in the
object skeleton. Aspect ratio is essentially the same measure as cephalic index and it
measures the length of an object divided by its breadth (ibid). Figures 3-5a and 3-5b
illustrate the properties of elongation using similar shapes as formfactor and roundness.
47
Finally, the Formfactor divided by Roundness was used to provide a relative index
of the irregularity of an object versus its roundness. A perfect circle still has a value of
‘1’. However, as the perimeter increases relative to the elongation (greater irregularity in
the shape of the perimeter) the morphometry values will be lower. In contrast, an object
with a low perimeter irregularity and a high elongation will have a larger number (Figure
3-5a and 3-5b).
Flakes
The whole purpose of employing a morphometrics approach in this research is to
identify the relative patterns of the shape of stone tools over time and interpret the
process of these patterns using a Complex System Theory and cognitive ideal types. At
first it seems logical to analyze the actual tools that embody directly the thoughts and
actions of technological producers. Such shaped tools theoretically reference the ideal
type in their very shape; that is, their shape reflects the ideas people held about how to
produce the tool as best they can. Other researchers have also focused on the shape
analysis of formal tools as well (Rovner 1995). However, it is widely known that the
morphology of formal tools is modified over time through use, repair, and modification
(Frison 1968; Jelinek 1976; Rolland and Dibble 1990). If it could be reasonably
ascertained that a formally designed tool was not modified throughout its use life then
this would be an appropriate line of investigation. However, while formal tools approach
a direct one-plus representation of the ideal type of the technological agent, the debitage
produced to make these formal tools should in fact be an “inverse representation" of the
ideal type. To phrase this another way, stone tool production debitage reflects those
characteristics that are inversely associated with the ideal type. Essentially, this method
is akin to analyzing Michelangelo’s David by only studying the shapes of the bits of rock
48
that he chipped off the main block. Predominantly (because there are always mistakes
and unintended variations), the debitage produced during the sculpting of stone (i.e.,
flaking) was removed because the producer consciously seeks to remove characteristics
incompatible with their ideal end type conception.
During the analysis of the data for this research, I have relied on whole flakes as the
primary morphological data source. I believe that flakes are the by-products of an
intentional and predetermined process by the toolmaker and when analyzed together they
represent the generalized underlying intentions of the technological system referenced to
create that assemblage of artifacts. Primary, secondary, and tertiary flakes, as well as
stage of manufacture to produce flake debitage may prove morphometrically identifiable
with future research. However, this study group encompasses all of these groups into just
one category—flakes—as a representation of the overall inverse ideal type. The
incorporation of a statistically significant sample size of flakes should then represent an
average ideal type conception for the range of tools used during one specific time period.
Changes in the shapes of the flakes should then correspond with changes in the
conceptions of the ideal tool forms, intentionally or unintentionally. For example, if a
lithic technological system is modified to produce more elongated tool forms than were
produced prior, the flake debitage should show a related altered morphology to facilitate
these changes. If the changes in the conceptions of tool forms represent a gradual and
continuous process of technological change as I have suggested previously then the
application of morphometrics to a study of flakes should show trends of gradual
technological change within the archaeological record.

49
Conclusion
Computer-assisted shape analysis is a unique technique to study the morphometrics
of objects. It provides standardization within an analysis and a means to analyze large
datasets relatively quickly. Morphometrics is also relatively inexpensive. By applying a
morphometrics analysis to study flake debitage, and explaining this data using a Complex
Systems approach, the next chapter will explore how this method and theory combination
usefully identifies technological changes within two sets of data.

50
Figure 3-1 Measurement of flake “length” varies based on the methods used. In Figure 3-1A, flake length is the intersection with a lateral margin of the flake prior to reaching the distal edge of the flake. Figure 3-1B represents flake length perpendicular to striking platform width. Figure 3-1C represents how the flake shape of Figure 1A also can be measured as the maximum length from the proximal to dorsal flake ends irregardless of lateral margins. Figure 3-1D, however, shows that mathematically the greatest length of any rectangular flake is actually diagonal to the proximal and distal flake edges.

51
AFlake Selection
BConversion toBinary Format
COutput table ofMorphometrics
values
Figure 3-2 The steps necessary to conduct a morphometrics analysis using computer-assisted shape software. Flakes must first be positioned within a photograph and then selected using a graphics program. Next, the selected flakes are converted into binary format. Finally, after running the morphometrics software the program creates a table of morphometrics values.

52
Figure 3-3 X-Feret and Y-Feret represent measure the widest points of an object dependent upon an object’s orientation to the X and Y axis.
Figure 3-4 In contrast to X and Y-Feret (figure 2-4), Figure 3-5 illustrates how the Image Processing Toolkit represents “length” and “breadth” of an object. Here, length represents the distance of the longest arc within an object (maximum caliper distance) whereas the breadth measures the minimum caliper distance of an object.

53
Figure 3-5 How different morphometrics statistics measure different shapes of objects. Figure A illustrates how the formfactor, roundness, elongation and formfactor divided by roundness statistics characterize common shapes. Figure B represents the same morphometrics statistics applied to more amorphous shapes. Figure B adapted from Rovner 1995.
1.0110.7760.582FF / RR
21.81912.2369.909Elongation
0.1690.3890.631Roundness
0.1710.3020.368Formfactor
1.0431.4281.2211.5830.942FF / RR
5.1032.3341.0092.2941.007Elongation
0.5700.4640.6460.4850.986Roundness
0.5950.6620.7890.7670.929Formfactor
A
B
54
CHAPTER 4 THE GILGEL GIBE AND GOGOSHIIS QABE MORPHOMETRICS ANALYSES
Introduction
Computer-assisted morphometrics analysis was presented in the preceding chapter
as a means for identifying technological changes within the archaeological record using
flake debitage. Morphometrics analyzes the shapes of object, such as flakes, and can
provide a clear indication as to how shapes of objects change through time.
Flake debitage is especially useful to study within a morphometrics analysis for
three reasons. First, flakes are frequently found at archaeological sites, many times being
the most prevalent artifact type. Second, whole and unmodified flakes, unlike shaped
tools, do not change morphology during their use-life. There may or may not be a
correlation between flake debitage shape and stage of manufacture for the tool being
produced, between primary, secondary, tertiary, and retouch flakes, and even raw
material. However, this analysis assumes that grouping all whole, unmodified flakes into
one category, and measuring the total variation of flake shape within this generalized
group, will provide an overall measure of the flake shape per assemblage. Third, in spite
of being unable to determine reliably the exact stage of manufacture of a shaped tool, an
analysis of flakes provides an alternative window into the technological system. Instead
of looking directly at final tool forms, analyzing the debitage removed to create such
tools provides an inverse portrait of the ideas and intentions within the minds of
prehistoric technological producers using a reductionist process. As noted in chapter
four, a morphometrics analysis of flakes is akin to studying Michelangelo’s David by
55
studying only the debris removed from the final shaped form; the key element—the
sculpture itself—can not be clearly discerned, but by studying what was removed to make
that sculpture, we can acquire some idea of what it may have represented.
Therefore, the focus of this chapter is the application of morphometrics analysis on
flakes from the two Stone Age sites of Liben Bore in southwestern Ethiopia and
Gogoshiis Qabe, southern Somalia. Drawing upon CST, particular emphasis is given
towards identifying long term technological change within each dataset and describing
the perturbative actions of the lithic technological system around the assumed existence
of ideal types. At the conclusion of each section, each dataset is compared against
current culture historical sequences within each area in order to discern more particular
technological characteristics within the data and also provide some measure of
unification with currently employed chronological methods.
Liben Bore
Between 1999 and 2002, archaeologists from the Gilgel Gibe Archaeological
Project (GGAP) conducted a series of emergency surveys and site excavations in the
Gilgel Gibe River Basin of Southwestern Ethiopia in conjunction with the Ethiopian
government’s plan to construct a major hydroelectric dam and reservoir (Brandt 2000;
Kinahan 2004). GGAP identified and recorded many archaeological sites, including
GG35, an open air site situated 30 meters west of a small river that feeds into the Gilgel
Gibe River, but unfortunately directly in the path of a new road to be built around the
edge of the reservoir. First identified by a lithic and ceramic surface scatter, two 1m2 test
units were excavated at Liben Bore, followed by four 1x2 m units taken down in 10 cm
spits. These excavations exposed over two meters of stone and ceramic artifacts
embedded within silty clay deposits thereby revealing the deepest archaeological

56
sequence in southern and western Ethiopia and the second deepest sequence in all of
Ethiopia.
Since no faunal remains and only very small amounts of charcoal from the
uppermost levels were recovered from the homogeneous silty clay deposits, radiocarbon
dating of the sequence has not been possible. Furthermore, the homogenous clay
deposits of Liben Bore have not as yet lent themselves to OSL dating. Typologically,
occupation of the site appears to span more than 30,000 years from the late Middle Stone
Age/early Later Stone Age through the Iron Age, and may span the Pleistocene/Holocene
transition as there appears to be no evidence of a depositional hiatus or disconformity.
Excavations revealed three major litho-stratigraphic units from surface to bedrock:
• LSU1 occurs from the surface to 20cm below surface (surface to excavation level 1) and is a very dark brown clay encompassing Later Stone Age, Neolithic or Iron Age lithics and ceramics.
• LSU2 occurs from about 20cm to 60cm below surface (excavation level 1 to level 3). LSU2 is a reddish brown clay containing Later Stone Age/Neolithic lithics and ceramics. Lithics increase in quantity within this unit.
• LSU3 occurs from 60cm to 200cm below surface (excavation level 4 to level 18). This unit is a dark reddish brown clay. At approximately 100cm below surface pottery disappears and only lithics remain. At this time new elements in lithics appear including higher frequencies of blades and unifacial and bifacial points.
The analysis of the Liben Bore artifacts was undertaken at the National Museum in
Addis Ababa, Ethiopia. A. Negash (2004) recently completed an attribute analysis of
the Liben Bore shaped and unshaped tools and cores, while B. Kimura (2003) has
analyzed the Liben Bore ceramics. Due to time constraints, I focused largely upon the
morphometric and techno-typological analysis of flakes from two excavation units
(S14W1 and S23W1).

57
Prior to GGAP, very little was known about the Stone Age archaeology of the
Gilgel Gibe area, or for that matter Southwestern Ethiopia. It was this precise lack of
knowledge for this large area that provided the impetus to search for new and more
expedient methodologies (i.e., morphometrics) that might help resolve the
inadequacies of culture historical typologies.
Morphometrics Analysis
Morphometric analysis of the flakes included a series of measurements such as
formfactor, roundness, elongation, aspect ratio, and X-Feret and Y-Feret. Before any
descriptive statistics are generated from the data, the data are further represented
graphically by plotting the excavation levels of the entire dataset on the X-axis and the
particular morphometric value on the Y-axis (Figure 4-1 to 4-6a and b). Visual analysis
of these graphs is an essential first step in the analysis of this data because it provides the
analyst the opportunity to observe how the data changes and note any possible patterns
within the dataset. Within this analysis, initial pattern recognition was based on the
changes in the mean morphometrics value between excavation levels, changes in the
standard deviations of morphometrics values between excavation levels, and the changes
in the extreme upper and lower morphometrics values between excavation levels.
Particular emphasis was also given to rapid changes (i.e., between one or two contiguous
excavation levels) in the variance of morphometrics values between excavation levels.
There are two initial observations of the Liben Bore morphometrics data based only
on the visual analysis of the data. First, the flakes represented within the morphometrics
graphs appear to change shape through time. Since there appears to be no evidence of
disconformities in the depositional sequence, the Liben Bore flakes appear to change
shape gradually. Second, there appear to be three different patterns observable within the

58
Liben Bore sequence. These patterns correlate with excavation levels 1 to excavation
level 8 (pattern 1), excavation level 9 to excavation level 14 (pattern 2), and excavation
level 15 to excavation level 26 (pattern 3). Of the total flakes within the dataset, pattern
one contains 11.55%, pattern two contains 49.31%, and pattern three contains 39.14%.
The trends within and between patterns suggest that pattern three, the oldest and
lowermost pattern of the dataset, contains flakes that are distinctly ovate and lack much
elongation (Figure 4-4) or edge irregularity (Figure 4-1) than the rest of the dataset. By
comparison, in pattern two flake shape is much more elongated and has greater edge
irregularity. In pattern one the flake shape has transitioned back to a less elongated form
than in period two but does not appear as ovate as seen in period three. Because each
morphometrics measure is independent of other morphometrics measures, the patterns
noted visually within each morphometrics measure (n= 6) of the dataset are suggestive of
several lines of independent evidence of specific patterns within the data
Therefore, the inter-pattern differences and trends within the dataset were further
identified using quantitative statistical analysis including analysis of descriptive statistics,
t-test, and cluster analysis. In order to quantify each pattern, the mean, minimum,
maximum and standard deviation of each morphometrics measures per excavation level
was first calculated. These data were then used to calculate the average standard
deviation, minimum, maximum and mean values per pattern range within the data. The
results of this analysis suggest that pattern three has a mean aspect ratio of 1.5384, a
mean formfactor of 0.6895 and a mean roundness of 0.6104. The aspect ratio value
suggests a slightly elongated form, the roundness value also suggests a slightly elongated
59
shape but also fairly ovate, and the formfactor indicates a low level of edge irregularity
(refer to Figures 4-1, 4-2, and 4-3 comparison).
The values for pattern two, however, contrast markedly with pattern three values.
Pattern two has a greater mean aspect ratio value (1.760) indicating more elongation, a
lower formfactor value (0.655) indicating more edge irregularity, and a lower roundness
value (0.551) indicating these flakes are less round than flakes in pattern three. In
particular, the aspect ratio (Figure 4-3) in pattern two is greater than pattern three by a
value of 0.222. This suggests that the flakes in pattern two are much more elongated than
flakes in pattern three. When this value difference is compared to the mean aspect ratio
of flakes in pattern one (1.613) it indicates that the flakes in pattern two are the most
elongated of the entire dataset.
Pattern one is relatively similar to pattern three in terms of having a more ovate
flake shape with decreased edge irregularity. In particular, the mean aspect ratio value
(1.613) for flakes in pattern one indicates a more elongated form than the flakes in pattern
three (1.538) though by no means as elongated as flakes in pattern two (1.760).
A t-test was further conducted on this data to determine the statistical difference
between the inter-pattern mean values within the dataset (Table 4-1). According to this
test, there is no statistical difference between the mean values for pattern one or pattern
two, there is a small difference between mean values in pattern one and pattern three, and
the mean values for pattern two are statistically different than each of the other two
patterns. The alpha value for this test was set at 0.05.
A cluster analysis of the Liben Bore data using the standard deviation and mean
values per excavation level for the roundness, aspect ratio, and formfactor measures also

60
supports the differentiation of period two from periods one and three (Figure 4-7).
According to these results, most of the excavation levels identified earlier into pattern
two (excavation level 9 to level 14) as well as levels 6, 8, 17, and 18 cluster together at a
rescaled cluster case distance of 25. The remaining excavation levels cluster together
into another main group with small sub-clusters at differing scaled cluster distances. The
significance of these results will be discussed below.
Understanding the Liben Bore Data
Although it is still unknown when certain technological changes occurred precisely
at Liben Bore, the morphometrics analysis of the Liben Bore flakes suggests evidence for
technological change within the 26 excavation levels of units S14W1 and S23W1 at this
site.
The Liben Bore dataset represents three morphologically different technological
patterns during the times of occupation at this site. Theoretically speaking, and ignoring
other potential sources of variation, the analysis of the morphometrics data suggests that
pattern three (excavation levels 26 to level 15) is characterized by an ideal type
emphasizing the production of ovate flakes with little edge irregularity or tools requiring
the removal of ovate flakes for proper tool production. The flakes in pattern two
(excavation levels 14 to level 9) indicate a much different ideal type. Here, the
technological system emphasizes the production of more elongated flake forms, which
may be indicative of more elongated tool forms. In pattern one, however, the ideal type
changes yet again, this time back to a more ovate shape reminiscent of pattern three.
Drawing upon the theoretical discussion of the technological life cycle presented in
chapter two, the Liben Bore dataset could represent the peak and initial decline of the
lithic technological system within the Gilgel Gibe region of Ethiopia. If this is an

61
accurate assumption, pattern three would represent a still-developing lithic technological
system while pattern two represents the peak of the lithic technological system within this
area.
The end of pattern two (level 9) or the beginning of pattern one (level 8) may
further represent the introduction of a competing technological system as perceived from
the conception of complexity, which reflects the number of users of a technological
system and emphasizes the ability for more intentional and unintentional variations
within a technological system for greater technological variability. Technological
variability is identified within the Liben Bore dataset by calculating the standard
deviation of each morphometrics statistic per excavation level. Excavation levels with
less flake shape variability are assumed to correlate with less technological complexity,
and should exhibit a lower standard deviation than excavation levels with greater s
technological complexity.
Once the standard deviation values of each morphometrics statistic are calculated
and grouped into the three patterns, the mean of these values is taken and then used to
compare against each of the other two patterns. In comparison against the mean standard
deviation for the formfactor, aspect ratio, and roundness of pattern one and pattern three,
pattern two has a much greater standard deviation than either the other two patterns (table
4-2). If standard deviation is an accurate representation of the degree of perturbation due
to the complexity of a technological system, then it can be concluded that pattern two has
possibly the greatest technological variability and technological complexity of the entire
dataset.

62
Furthermore, a separate technological system, in the form of ceramics, may have
directly or indirectly influenced the local lithic technological system. Analysis of the
ceramics recovered at Liben Bore suggests that ceramics are first introduced to this site
around level 8. Negash (2004) has suggested that the introduction and adoption of
ceramics most likely also entailed the restructuring of food procurement strategies and
group mobility (Negash 2004). Therefore, the shift in procurement strategies and group
mobility may have inadvertently enacted changes to the predominant application of
certain technological resources including knowledge, technological producers, and users
from the lithic technological system. This does not deny that a lithic technological
system still occurred during and after the adoption of ceramics. However, based on the
model of complexity advocated within this thesis, the lithic technological system would
exhibit less variability following the adoption of a competing technological system and
would be in a state of decline because the shift in subsistence strategies and mobility
would re-direct the application of knowledge and resources to produce and maintain
certain technologies.
The possible loss of technological producers within pattern one also would create a
technological system incapable of maintaining existing technological variability or
creating new variability. Unnecessary variations were discarded leaving in place only
those variations necessary for the fundamental application of lithic technology. As a
result, the remaining vestige of the lithic technological system within trend one assumed
the appearance of a less complex and less variable technological system. Due to similar
levels of complexity, trend one and trend three should appear similar. The t-test and
cluster analysis results of the morphometrics values do suggest that pattern one and

63
pattern two are statistically similar to one another and cluster together when compared to
pattern two. However, any such similarities between pattern one and pattern three are
purely superficial as the essential character—that is the ideal type—in pattern one is
qualitatively different than the ideal type in pattern three; pattern one merely represents
the continuation of qualitative change to the ideal type and technological system via the
technological life cycle.
Thus far, the morphometrics analysis has been able to identify three patterns within
the Liben Bore dataset, statistically differentiate these patterns, and identify the
morphology of the flakes within each pattern that are indicative of the ideal types.
Furthermore, this analysis has suggested how to measure the perturbation around ideal
types and the technological changes between each pattern via alterations to underlying
ideal types. Given the limitations and restrictions of the model, this analysis has been
able to identify technological change through time based only on a shape analysis of
flakes.
Morphometrics analysis, however, is not a standalone method. If only a
morphometrics analysis on flakes was conducted for a site, this leaves out vast bodies of
data including shape tool analyses. Concurrent with the Liben Bore morphometrics
analysis, which analyzed 1,810 flakes, this author also conducted a techno-typological
analysis of the shaped tools (n > 1,900) recovered from excavation unit S14W1 at Liben
Bore. This analysis was followed with a similar analysis (n = 2,555) by A. Negash who
analyzed Liben Bore units S23W1 and S23E1 in conjunction with the prior analysis
results from S14W1.

64
From these analyses, a much more coherent picture can be made of the Liben Bore
data. As a whole, the dataset is scraper-dominated in all three excavation units with a
large quantity of points also at S14W1 (n = 19) (cf. Negash 2004). Negash (2004)
subdivides the Liben Bore data into two distinct time periods based on the introduction of
pottery in level 8 and the more apparent expedient nature of the lithic assemblage
between level 8 and level 1. The expedient nature of the lithic assemblage between level
8 and level 1 could indicate a more sedentary lifestyle as a result of changed
technological, economic, and associated mobility patterns. Furthermore, Negash (2004)
recognizes that the earliest levels in the Liben Bore sequence, which contain the Levallois
technique, may in fact also represent another separate time period.
Based on the very similar results from the morphometrics and techno-typological
analyses, it seems very likely that at least one, if not more, technological shifts did occur
during the time of occupation at Liben Bore. Regardless, both analyses identify a
technological shift in level 8 possibly due to the introduction of ceramics thereby issuing
more substance to the claim that level 8 represents the introduction of a competing
technological system (i.e., pottery) and subsequent decline of the lithic technological
system. In fact, the expediency of shaped tools that Negash notes between level 8 and
level 1 can be interpreted to reflect changing ideal types enacted by a shift in the
predominant application of technological knowledge, resources and users. According to
the model, these changes created less technological variation, loss of prior specific
technological characteristics, and resulted in the subsequent appearance of a lithic
technological system lacking any significant technological complexity at this time.

65
Gogoshiis Qabe
Gogoshiis Qabe (GQ) is a rockshelter located in the inter-riverine Buur Heybe
region of southern Somalia (Brandt 1988). The site was first excavated by P. Graziosi in
1935. Further excavations by the Buur Ecological and Archaeological Project (BEAP) in
1983 and 1985 found the burials of fourteen individuals providing the earliest evidence of
mortuary practice in the Horn of Africa. In total, the BEAP project excavated thirty-two
contiguous 1m2 units in 5cm levels (ibid).
The primary goal of the Gogoshiis Qabe morphometrics analysis was to test the
reliability of the morphometrics approach because of an overall concern that the Liben
Bore analysis could have been misleading due to previous knowledge of the site. Since
the Liben Bore morphometric analysis was conducted simultaneously with a techno-
typological lithics analysis, in spite of the persistent lack of information about the site in
particular, this nonetheless allowed for direct questioning of the reliability of the
morphometrics method itself. In particular, the question at hand was which analysis led
the other; the results of the morphometrics method might only have been reached through
a priori conclusions and observations based on the techno-typological lithics analysis.
Therefore, the Gogoshiis Qabe morphometrics analysis was conducted without any prior
knowledge of the technological characteristics or prior conclusions reached of the GQ
assemblage, temporal periods, or precise spatial distribution of the materials. For this
reason, more detailed background data for Gogoshiis Qabe will be given following the
discussion of the morphometrics analysis.
Morphometrics Analysis
The GQ dataset has been very difficult to explain in spite of being relatively easy to
interpret. The GQ dataset is composed of flakes spanning thirty-six 5cm excavation

66
levels. Unfortunately, at the time of this analysis several excavation levels were
unavailable for analysis because their storage bags had disintegrated allowing the
artifacts to mix together (e.g., excavation level 17 and level 18). Based on the formfactor
and roundness values, the GQ dataset does not exhibit any marked differences indicative
of technological changes when graphed against their excavation levels (Figures 4-8 and
4-9). There are some notable constrictions in the range of formfactor and roundness
values around level 7 and level 27 but this more likely represents poor sample size and
not actual restriction of technological variation.
However, a different picture emerges when the elongation values are graphed by
their excavation levels (Figure 4-10). This graph clearly shows a distinction between the
elongation of the flakes from level 1 to level 16 and the flakes in level 19 to level 36.
According to this graph, the flakes from level 19 to level 36 have a much greater range of
elongation, if not more elongated as a whole.
When the aspect ratio is similarly graphed (Figure 4-11), the trend noted in the
elongation graph again disappears. Though elongation and aspect ratio are both
dimensionless measures of the elongation of an object, they operate differently. Aspect
ratio measures the length of the object against its breadth. In particular, the “length”
measured in the aspect ratio is independent of orientation and is simply a measure of the
longest arc length within an object. Width conversely is the measure perpendicular to the
length. Therefore, if an object has a greater width than length (e.g., a side-struck flake)
the aspect ratio will be high because the length is actually measuring the widest point of
the flake, that which is often referred to as “breadth.”

67
Elongation, on the other hand, measures the skeleton length of the object against
the mean fiber width. Skeleton length is determined by removing all pixels in an object
except those that make up the midline. Mean fiber width measures the mean distance
from all pixels in the object skeleton. Therefore, when a flake is “triangular” in shape—a
shape very common to both the Liben Bore and Gogoshiis Qabe datasets—the skeleton
length actually splits and creates a main arm with two branches similar to a “peace”
symbol. As a result, triangular and even ovate shaped flakes can have high elongation
values whereas the aspect ratio value might suggest completely otherwise.
In order to circumvent this problem, the X-feret and Y-feret values were divided
similar to the aspect ratio. X-feret and Y-feret measures are useful in a situation such as
this because they do not just measure the longest arc length within an object (i.e.,
“length”). Rather X-feret and Y-feret are measures of the two widest points on the X and
Y axes and are thus sensitive to orientation. Since all flakes within the Gogoshiis Qabe
(and Liben Bore) analysis were oriented platform down, the X-Y Feret ratio should
indicate if the flakes from level 19 to level 36 are actually more elongated than the flakes
from level 1 to level 16.
When plotted against the excavation levels, the X-Y feret ratio values indicate a
pattern very similar to the aspect ratio suggesting that the elongation of flakes between
levels 1 to 16 and levels 19 to 36 are not greatly different (Figure 4-12). The flakes
between levels 19 to level 36 are actually slightly less elongated than flakes from level 1
to level 16 by an aspect ratio value difference of 0.128.
The distribution of values within the elongation graph, however, still suggests that
there are underlying patterns within this data that have not been recognized. According

68
to the elongation values, the flakes between levels 19 to level 36 are more triangular, or at
least have a slightly greater width versus length, thereby creating a greater skeleton
length and larger elongation value. Though the elongation measure may not be a good
measure of actual elongation per se, this measure is still an accurate indication of the
shape of these flakes. As a result, when the range and standard deviation of flake
elongation values are compared between level 1 to level 16 and level 19 to 36 the results
are striking.
According to these results, the range of elongation values between level 19 to level
36 (n = 26.399) is over twice as great as the range of elongation values between level 1 to
level 16 (n = 13.867). This ratio is further supported by averaging the mean range of
elongation values per excavation level. Furthermore, the standard deviation of elongation
values between level 19 to level 36 is 69% greater (n = 2.338) than the standard deviation
between level 1 to level 16 (n = 1.620). This suggests that there is greater variability in
the overall shape of flakes between level 19 to level 36 in spite of the slightly greater
roundness and less irregularity of shape compared from level 1 to level 16.
A t-test conducted on this data also shows that there is a statistical difference at a
0.05 confidence level between the inter-pattern mean values within the dataset in four out
of five morphometrics measures (Table 4-3). According to this test, there is a statistical
difference between the mean values between excavation level 1 to level 16 (pattern 1)
and excavation level 19 to level 36 (pattern 2).
Furthermore, the results of a cluster analysis on the GQ data using the standard
deviation values per excavation level for the formfactor, roundness, elongation, and
aspect ratio group the majority of levels from pattern two independent of pattern one at a

69
rescaled cluster case distance of 4 (Figure 4-13). Fourteen out of seventeen excavation
levels categorized morphometrically within pattern two do in fact group within cluster
two whereas eight out of thirteen levels classified morphometrically within group one
also group within cluster one. Only eight out of thirty morphometrically analyzed
excavation levels do not share similar morphometrics and cluster analysis results.
Finally, the shape of flakes between levels 19 to 36 suggests an ideal type
qualitatively different from the ideal type underlying the lithic technological system in
level 1 to level 16. Due to similarities in the formfactor, roundness and aspect ratios
between these two time periods, the ideal types must not have been greatly different.
However, there must have been a great enough change to the lithic technological system
around level 19 to create more solidarity within the shape of flakes between level 1 to
level 16.
Understanding the Gogoshiis Qabe Data
According to Brandt (1988), the Gogoshiis Qabe assemblage actually represents the
transition from the Eibian LSA to the Bardaale LSA-Neolithic industry. This shift occurs
with the environmental change from cool, hyperarid conditions of the Pleistocene to
warm and humid Holocene conditions (Brandt 1988). Brandt specifically identifies this
transition at Level 19.
The similar identification of two patterns separated at a similar excavation level
shows that the application of morphometrics was again able to determine technological
change within an archaeological site using only flake debitage even though
morphometrics on the Gogoshiis Qabe data was not as successful as the Liben Bore
analysis. For instance, technological changes within the Liben Bore dataset were much

70
more pronounced than those identified at Gogoshiis Qabe. This can be accepted
especially if technological changes are more gradual rather than punctuated.
Thus, the discussion of Gogoshiis Qabe is significant for two reasons. First, the
GQ analysis once again shows the validity of the morphometrics method for identifying
technological change within the archaeological record. Second, the unique nature of the
GQ data bring to bear certain deficiencies or assumptions within the morphometrics
method that warrant explanation. Specifically, a deficiency of the morphometrics method
rests on an underlying assumption that the archaeological deposits within a
morphometrics analysis represent a continuous deposition of archaeological and
geological materials over time. This assumption was noted in the Liben Bore analysis,
but warrants further discussion.
Gradual and punctuated technological changes can be obfuscated or created within
a morphometrics dataset by differing rates of archaeological and sedimentary deposition.
It is important to note here that the application of this type of morphometrics analysis
implies an archaeological sequence with a continuous rate of sedimentary and
archaeological deposition over time with few, if any, abrupt changes in the rates of
deposition. Keep in mind that this assumption does not preclude that differential rates of
cultural or sedimentary deposition do occur and can distort the distribution of a dataset.
It merely points out that abrupt changes in the sedimentary deposition at a site should be
clearly identifiable whereby a period of rapid sedimentary deposition should show an
equalized morphometrics distribution with few, if any abrupt changes.
On the other hand a period of slow sedimentary deposition should show a very
distinct demarcation between the morphometrics values of artifacts. This demarcation

71
corresponds to the much coarser temporal resolution, and collection of archaeological
materials, represented in the period with slow sedimentary deposition versus other
periods with more refined temporal resolution of archaeological materials.
At Liben Bore, there is no evident distinction in changes to the rate of
archaeological or geologic deposition at that site. Due to the consistently fluctuating
morphometrics values throughout the entire Liben Bore sequence, this suggests that there
was continuous sedimentary and archaeological deposition over the entirety of the Liben
Bore sequence creating uniformity in the frequency of archaeological materials and
temporal resolution.
Gogoshiis Qabe suggests otherwise. Although archaeological materials were
recovered in excavation level 17 and level 18, the abrupt nature of this division as shown
in the statistical analyses between pattern one and pattern two, which correlates with a
major sedimentary and environmental shift as noted by Brandt (1988), suggests the
possibility for either slow sedimentary depositions or dis-continuous archaeological
deposition during this restricted period of time. If there is a gap in the deposition of
archaeological materials then one can only expect to see significant technological
changes between the two patterns (i.e., level 1 to level 16 and level 19 to level 36)
separated by a large span of time and significant changes to the environment. However,
as the shape of flakes remain similar in many respects throughout the entire Gogoshiis
Qabe sequence, this suggests other, as yet unknown, factors homogenizing the
morphology of flakes within each lithic technological systems operating in this area
through time.
72
Conclusion
This chapter has been able to show that the morphometrics method is capable of
identifying technological changes and technological variations within the lithic
technological systems at Gilgel Gibe and Gogoshiis Qabe. It is hypothesized that these
shifts correlate to equivalent changes in the ideal types within the technological systems.
At Liben Bore, computer assisted morphometry has been able to identify three
statistically different morphological patterns within the dataset indicative of technological
change whereas at Gogoshiis Qabe, the results were similar and identified two
statistically different patterns within the dataset correlated with environmental and
sedimentary changes.
Thus not only does computer assisted morphometrics work when applied to flakes,
but it is also fast. The analysis of 1,810 flakes for the Gilgel Gibe analysis took less than
three weeks while the analysis of 1,809 flakes for the Gogoshiis Qabe analysis took less
than two weeks. Therefore, a morphometrics analysis could theoretically operate
concurrent with an excavation with minor extra expenditure of time. This would afford a
significant advantage towards understanding the nature of a site in the process of
excavation versus knowing these difference after excavation has finished and the artifacts
are being analyzed in a laboratory. Furthermore, the application of morphometrics is also
capable of providing significant insight into the character of archaeological deposits in
previously studied, or unstudied, archaeological sites and even regions. The point I must
stress here is that morphometrics is by no means a standalone method, but in conjunction
with CST, the application of this theoretical and methodological package provides
significant advantages towards understanding Stone Age archaeological sites in a timely,
cost-effective manner. In so doing, archaeologists may be able to better tackle the spatial

73
and temporal immensity of Stone Age archaeology within the Horn of Africa and impart
a much more firm foothold towards understanding the complex sequence of archaeology
within this region.

74
Table 4-1 T-test results of the inter-period differences in the mean values for formfactor, roundness, aspect ratio, elongation, and X-feret and Y-feret. Each trend was compared against the other two. The results of this test suggest that there is no statistical difference between the mean values for trend 1 and trend 2, there is a small difference between mean values in trend 1 and trend 3, and the mean values for trend 2 are statistically different than each of the other two trends. Bold values indicate statistical difference.
Roundness ElongationAspect Ratio Formfactor
X-Feret / Y- Feret
T1/T2 0.188 0.509 0.101 0.398 0.261
T2/T3 1.54E-05 0.520 9.75E-05 0.005 0.003
T1/T3 0.036 0.949 0.051 0.120 0.207 Alpha Value = 0.05 Null Hypothesis: No Statistically Significant Difference in mean value. Table 4-2 Averaged standard deviation of the formfactor, aspect ratio, and roundness
values organized per excavation level time period. Roundness Formfactor Aspect Ratio Period 1 0.112 0.060 0.387 Period 2 0.134 0.088 0.530 Period 3 0.111 0.067 0.335
Table 4-3 T-test results of the inter-period differences in the mean values for formfactor,
roundness, aspect ratio, elongation, and X-feret and Y-feret. The results of the test show that trend one (excavation level 1 to level 16) is statistically different from trend two (excavation level 19 to level 36) in four out of the five morphometric measure results.
T1/T2 X- Feret and Y-Feret 0.001 Formfactor 0.022 Roundness 0.002 Aspect Ratio 0.002 Elongation 0.423
Alpha Value = 0.05 Null Hypothesis: No Statistically Significant Difference in mean value

75
Figure 4-1 Morphometric formfactor values of the Liben Bore flakes organized by the level of excavation. According to these graphs, the flake shape at Liben Bore became more irregular between level 16 and level 8. Lower levels of excavation correspond with greater excavation level numbers. The top graph is a box-and-whisker plot representing the mean, standard deviation, first and third quartiles of the formfactor data. Circles in this graph correspond to outliers whereas asterisks represent extreme values. The lower graph represents the raw formfactor data points used to create the box-and-whisker graph.

76
Figure 4-2 Morphometric roundness values of the Liben Bore flakes organized by the level of excavation. According to these graphs, the flake shape at Liben Bore became less round between level 15 and level 8. Lower levels of excavation correspond with greater excavation level numbers. The top graph is a box-and-whisker plot representing the mean, standard deviation, first and third quartiles of the roundness data. Circles in this graph correspond to outliers whereas asterisks represent extreme values. The lower graph represents the raw roundness data points used to create the box-and-whisker graph.

77
Figure 4-3 Morphometric aspect ratio values of the Liben Bore flakes organized by the level of excavation. According to these graphs, flake shape between level 15 and level 8 became more elongated at Liben Bore. Lower levels of excavation correspond with greater excavation level numbers. The top graph is a box-and-whisker plot representing the mean, standard deviation, first and third quartiles of the aspect ratio data. Circles in this graph correspond to outliers whereas asterisks represent extreme values. The lower graph represents the raw aspect ratio data points used to create the box-and-whisker graph.

78
Figure 4-4 Morphometric elongation values of the Liben Bore flakes organized by the level of excavation. According to these graphs, flake shape between level 15 and level 8 became more elongated at Liben Bore. Lower levels of excavation correspond with greater excavation level numbers. The top graph is a box-and-whisker plot representing the mean, standard deviation, first and third quartiles of the elongation data. Circles in this graph correspond to outliers whereas asterisks represent extreme values. The lower graph represents the raw elongation data points used to create the box-and-whisker graph.
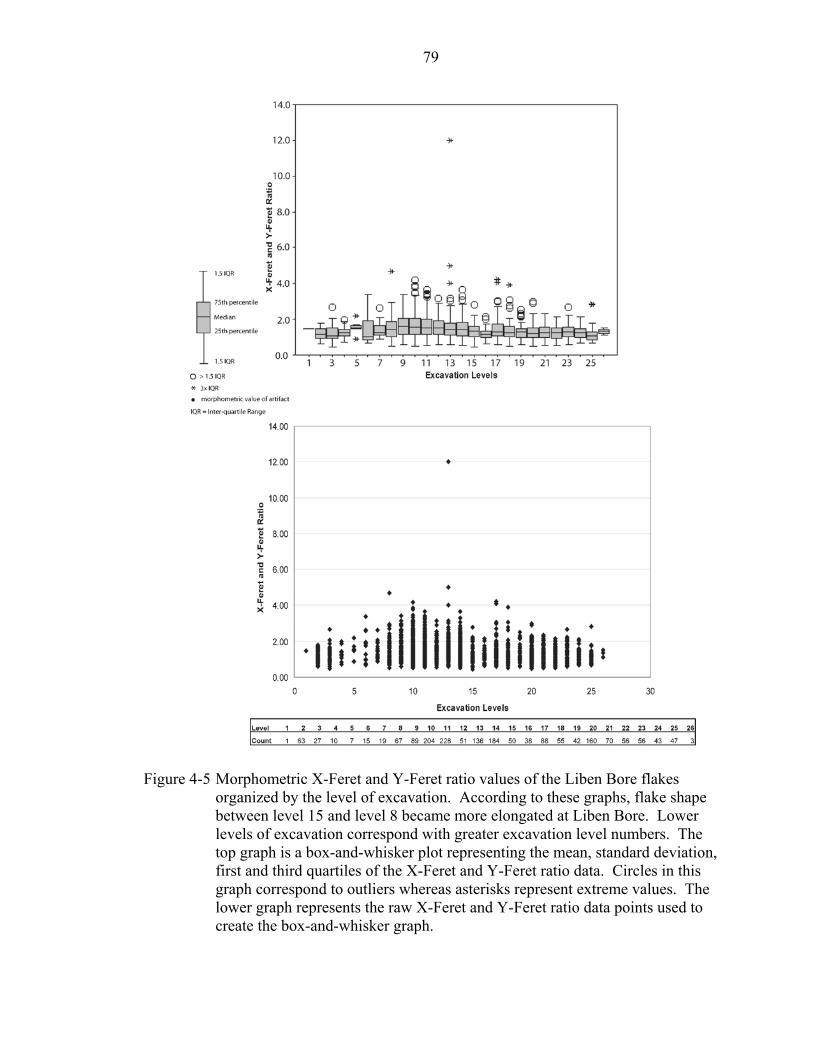
79
Figure 4-5 Morphometric X-Feret and Y-Feret ratio values of the Liben Bore flakes organized by the level of excavation. According to these graphs, flake shape between level 15 and level 8 became more elongated at Liben Bore. Lower levels of excavation correspond with greater excavation level numbers. The top graph is a box-and-whisker plot representing the mean, standard deviation, first and third quartiles of the X-Feret and Y-Feret ratio data. Circles in this graph correspond to outliers whereas asterisks represent extreme values. The lower graph represents the raw X-Feret and Y-Feret ratio data points used to create the box-and-whisker graph.

80
Figure 4-6 Irregularity (formfactor) divided by the roundness of the Liben Bore flakes organized by the level of excavation. These graphs suggest a trend towards more elongated and irregular flakes between level 15 to level 8. Lower levels of excavation correspond with greater excavation level numbers. The top graph is a box-and-whisker plot representing the mean, standard deviation, first and third quartiles of the Formfactor divided by Roundness ratio data. Circles in this graph correspond to outliers whereas asterisks represent extreme values. The lower graph represents the raw Formfactor divided by Roundness ratio data points used to create the box-and-whisker graph.

81
Figure 4-7 A hierarchical cluster analysis using the mean and standard deviation values per excavation level for formfactor, roundness, and aspect ratio from Liben Bore. The graph shows that excavation levels identified into pattern two (excavation level 9 to level 14) mostly group independently of excavation levels identified into pattern one and pattern three. In this graph “pattern” refers to the three identified patterns discussed in the text.
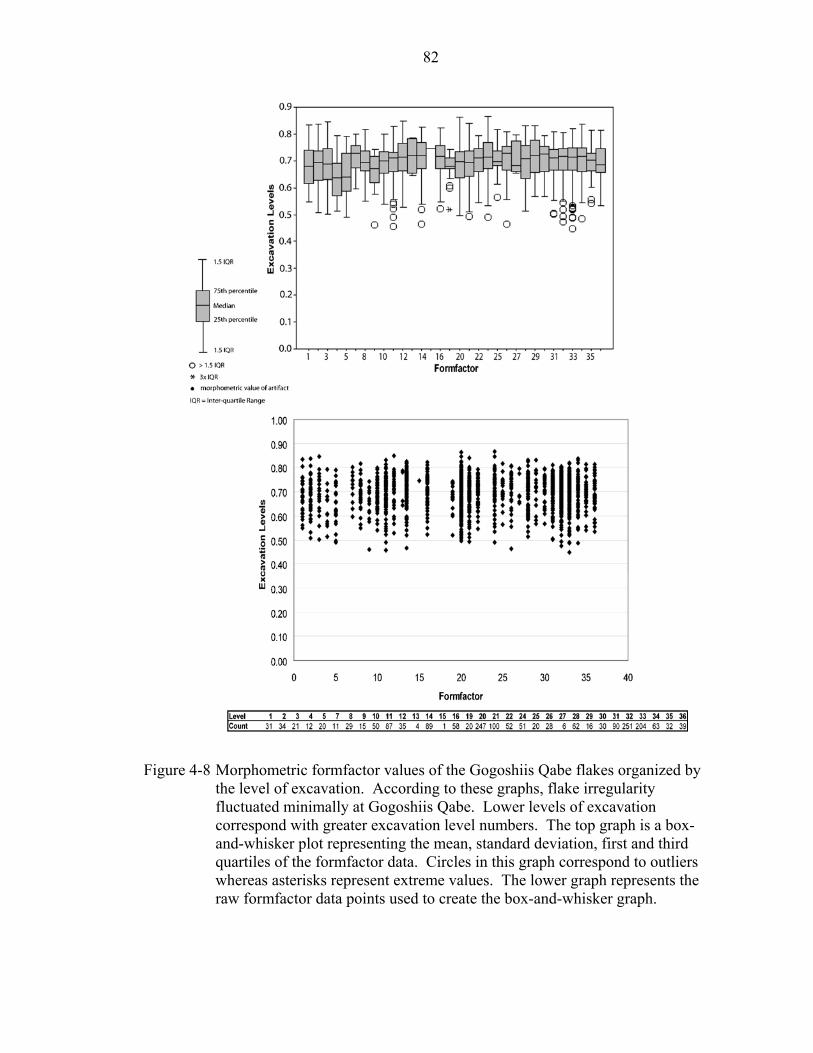
82
Figure 4-8 Morphometric formfactor values of the Gogoshiis Qabe flakes organized by the level of excavation. According to these graphs, flake irregularity fluctuated minimally at Gogoshiis Qabe. Lower levels of excavation correspond with greater excavation level numbers. The top graph is a box-and-whisker plot representing the mean, standard deviation, first and third quartiles of the formfactor data. Circles in this graph correspond to outliers whereas asterisks represent extreme values. The lower graph represents the raw formfactor data points used to create the box-and-whisker graph.

83
Figure 4-9 Morphometric roundness values of the Gogoshiis Qabe flakes organized by the level of excavation. According to these graphs, flake roundness fluctuated minimally at Gogoshiis Qabe. Lower levels of excavation correspond with greater excavation level numbers. The top graph is a box-and-whisker plot representing the mean, standard deviation, first and third quartiles of the roundness data. Circles in this graph correspond to outliers whereas asterisks represent extreme values. The lower graph represents the raw roundness data points used to create the box-and-whisker graph.

84
Figure 4-10 Morphometric elongation values of the Gogoshiis Qabe flakes organized by the level of excavation. According to these graphs, flake elongation appears to be greater between level 36 to level 19 at Gogoshiis Qabe. Lower levels of excavation correspond with greater excavation level numbers. The top graph is a box-and-whisker plot representing the mean, standard deviation, first and third quartiles of the elongation data. Circles in this graph correspond to outliers whereas asterisks represent extreme values. The lower graph represents the raw elongation data points used to create the box-and-whisker graph.

85
Figure 4-11 Morphometric aspect ratio values of the Gogoshiis Qabe flakes organized by the level of excavation. These graphs contradict the trend for greater elongation between level 36 to level 19 as shown in figure 15. Here, flake length appears to remain relatively constant throughout the entire Gogoshiis Qabe sequence. Lower levels of excavation correspond with greater excavation level numbers. The top graph is a box-and-whisker plot representing the mean, standard deviation, first and third quartiles of the aspect ratio data. Circles in this graph correspond to outliers whereas asterisks represent extreme values. The lower graph represents the raw aspect ratio data points used to create the box-and-whisker graph.

86
Figure 4-12 Morphometric X-Feret and Y-Feret ratio values of the Gogoshiis Qabe flakes organized by the level of excavation. These graphs support figure 16 by also showing that the elongation of flakes remained fairly constant over time at Gogoshiis Qabe. Lower levels of excavation correspond with greater excavation level numbers. The top graph is a box-and-whisker plot representing the mean, standard deviation, first and third quartiles of the X-Feret and Y-Feret ratio data. Circles in this graph correspond to outliers whereas asterisks represent extreme values. The lower graph represents the raw X-Feret and Y-Feret ratio data points used to create the box-and-whisker graph.

87
Figure 4-13 A hierarchical cluster analysis using the standard deviation values per excavation level for formfactor, roundness, elongation, and aspect ratio from Gogoshiis Qabe. The graph shows that excavation levels identified into pattern one (excavation level 1 to level 16) group independently of excavation levels identified into pattern two (excavation level 19 to level 36).

88
CHAPTER 5 CONCLUSIONS
This thesis focused on the application of Complex systems theory (CST) to
interpret the process of technological change as it is observed in the prehistoric
archaeological record of the Horn of Africa. The impetus for this thesis was based in
reaction to perceived deficiencies in the predominant application of culture historical
methodology in current African Stone Age archaeological research and existing theories
of technological change.
The recognized deficiencies in culture history include limitations to interpret data
within the culture historical framework and the non-dynamic and discontinuous
conception of time presented by culture historical typologies and essentialism.
Deficiencies noted within contemporary studies of technological change include an over-
reliance on using discrete events to explain changes over time in a technological system
without adequately describing the actual processes involved (cf. Van der Leeuw 1989:3),
scalar differences between the varied ideas of technological change, and a lack of
discussion concerning unintentional technological changes.
As a result, I have relied on eight primary theoretical aspects of CST within this
thesis to derive specific expectation regarding the identification and interpretation of
technological change in the African Stone Age archaeological record. These eight
theoretical aspects include an opens systems model, non-linearity, determinism,
sensitivity to initial conditions, critical path networks, contingency, emergence, and self-
organization. The expectations I have derived from CST within this thesis include an

89
overall conception of continuous technological change with periods of punctuated
changes, multi-scalar dynamics including the ability to theorize on the existence of
shared social-technological ideas (ideal types) and how these relate within long term
technological systems, and the ability to integrate theoretically material culture and non-
material thoughts and actions of past people.
I have appended several other theoretical ideas onto the existing complex systems
model in order to more precisely account for the actions and ideas of people within a
theory of technological change. First, I have assumed an essentialist position advocating
a mind-body dichotomy between the ideas in people’s heads and their subsequent actions.
In contrast to culture historical essentialism I assume that there are underlying essential
ideas that direct our actions in creating technological products, but I reject the ability to
know the exact ideal characteristics of an object now or in the past. By rejecting the
ability to ever observe or define the essential qualities of an object I hope to distance
myself from culture historical essentialism by attempting to measure instead the variation
of many objects around a hypothesized, but unattainable, ideal type thereby creating a
bridge between thoughts and actions. In this way I hope also to find common ground
between diametrically opposed essentialist and materialist theoretical positions.
Second, I have assumed that technological changes occur intentionally and
unintentionally. In my theorization of CST in chapter 2 and my application of certain
aspect of CST in chapter 4 I ignore many other internal and external systemic factors that
may cause technological change and instead argue that technological change is located in
the changes to cognitively-based ideal types. More precisely, I argue that technological
change occurs due to a combination of intentional and unintentional events that can serve

90
to alter the trajectory of a technological system through the knowledge to identify their
potential and successfully incorporate them into a technological system. This idea
incorporates the punctuated events of directed and purposeful action (i.e., intentional
change) in association with the constant acquisition of unanticipated techniques, tool
characteristics, tool types, or technological knowledge in general acquired during the
directed and purposeful events of intentional technological change (i.e., unintentional
change).
In summation of this thesis, I feel confident to conclude with two points. First, a
morphometrics method using computer assisted shape analysis of flake debitage can be
used to identify technological change in the archaeological record. Second, CST, as
modified within this thesis to explore on certain parameters and explanation, can be
applied usefully to the archaeological record to interpret the process of technological
change.
The application of computer assisted morphometry to analyze lithic debitage in the
archaeological record is still in its infancy, and the results of my morphometrics analysis
at Liben Bore and Gogoshiis Qabe pose many new directions for future research. For
instance, is there an observable difference in the flake morphometry between primary,
secondary, or tertiary flakes in the archaeological record? How might style affect the
adoption of unanticipated variations thereby affecting the ideal type? Does raw material
affect the morphology of flake shape in spite of shared properties of chonchoidal
fracture? Could a morphometrics analysis even be used to identify style in the form of
flakes within the archaeological record?

91
Within this thesis I have had to assume that many of these questions will not have a
direct influence on technological change. However, this does not belittle the recognition
of their possible significance within a theory of technological change, nor does it affect
my conclusion about morphometrics in general. In this thesis I have merely set out in
part to demonstrate that computer assisted shape analysis can or cannot be used to
identify technological change through time by analyzing how flake shape varies within an
archaeological sequence. As an initial study, I feel confident to conclude that
morphometrics does indeed identify changes through time.
However, identifying technological change through time was only half of this
thesis’ objective. The identified changes had to be interpreted as well in order to make
them useful to archaeology. The application of CST, as I advocate it here, can provide a
useful explanation of the process of technological change identified in the archaeological
record. Using expectation from a complex systems model I have been able to offer a
minimal explanation of how the technological systems at both Liben Bore and Gogoshiis
Qabe changed through time without any evidence that facilitates why the changes
occurred in the first place.
Furthermore the complex systems model brought together materialized actions and
cognitive ideas and situated them within a multi-scale continuous and dynamic
conception of time and change. And, it is here that I think CST may have the most to
offer archaeological research in the future. When associated with a conception of ideal
types, CST provides a useful model to posit a relationship between ideas and actions,
individuals and groups, and shorter periods of time within much greater spans of time.
Using a complex systems model we do not have to restrain ourselves to typologies that

92
imply synchronicity. Instead we can begin to explore the many levels of variation
operating continuously through time within a complex system that serve to create
technological, social, and even behavior changes within people. In the short section that
follows I intend to posit how CST, as it is applied here, may be able to provide an
alternative way to explain the development of modern human behavior, a direction for
future research I intend to pursue.
The epistemological implications of the modern human origins debate include
Eurocentrism, materialism and culture-historical essentialism, but herald a much greater
impact on the discipline itself by re-defining key concepts such as “modern behavior” (cf.
Henshilwood et al. 2001; Henshilwood and Marean 2003; McBrearty and Brooks
2000:534; Wadley 2001). Current trends within this debate seek to move beyond simple
normative and direct-historical trait-list approaches reminiscent of the culture-historical
roots of European and African archaeology towards a more social approach advocating
intangible, socially-produced behavior as well as material culture (for example see
Deacon and Deacon 1999:101-102; Henshilwood and Marean 2003:635; McBrearty and
Brooks 2000:491-492; Mitchell 2002:104-105). As a result, the application of CST as a
tool for the identification of cognitive ideal types and intentional and unintentional
changes might be able to provide salient advantages towards answering key questions
about the development of technology and behavior within this debate.
First, recognition of both intentional and unintentional changes and how these
changes are adopted into a technological system through the critical path and contingency
to transform the technological system can render obsolete the necessity of a strict
dichotomy between “punctuated” and “gradualist” models within the debate (cf. Brooks

93
et al. 1995; Henshilwood et al. 2001; Henshilwood and Marean 2003:630; Klein 1999;
Kusimba 2003:117; McBrearty and Brooks 2000:454; Milo 1998:99; Shea 2003;
Thompson et al. 2004; Yellen et al. 1995; Milo 1998). Instead a complex systems model
assumes that both processes must work together to propel the trajectory of technological
systems, and the behavior, actions, and knowledge of technological agents in new and
unforeseen directions.
Second, a complex theory model may be able to describe more accurately the
interaction between material culture and behavior within this debate, thereby
disqualifying certain current traits recognized as modern human behavior and possibly
even moving beyond a culture historical trait list approach. The reason for this is found
in the ideal type. The ideal type, and a study of the variation around these ideal types, is
a link between the material record and intangible behavior. The transition from a
technological system with little or no formal object definition to a technology with
clearly pre-defined ideas that influence the overall forms of objects over vast geographic
areas and time periods suggests the adoption of specific ideological principles.
Precisely, these principles manipulate behavior by elevating the form of an object
to that of “symbol” thereby transcending regional specialization. If symbolization and
standardization of tool forms does in fact herald in part the foundation of modern human
behavior as others have suggested (cf. Deacon and Deacon 1999:101-102; Henshilwood
and Marean 2003; Klein 1999:512; McBrearty and Brooks 2000:491-492; Mitchell
2002:104-105; Wadley 2001) then the advent of the Acheulian “handaxe” may be the
first tangible evidence for the development of modern human behavior.

94
This is just one example of possible future research for CST but is by no means the
limits of this research. The applicability of both CST and morphometrics for
archaeological research is much more diverse. Complex systems theory already has been
used be other researchers to explain social change within archaeological contexts (cf.
Bentley and Maschner 2003; Van der Leeuw and McGlade 1997). Yet the complex
systems model is still cutting-edge theorization of systems theory, chaos, and non-
linearity. As the literature on these diverse concepts increases, this should in turn open
up many new avenues of theorizing how people behaved and acted in the past.
However, computer assisted morphometry might have more practicality to
mainstream archaeology. The expediency, reliability, cost-effectiveness, and
standardization of morphometrics can play a significant role in future lithic analysis
methodology. Refinement of morphometrics techniques can lend this method very useful
for identifying the character of archaeological deposits during an excavation and even
using this method as a tool to correlate the morphological trends at one site with one or
more other sites. Thus, morphometrics can become just the method essential to Horn of
African archaeology that provides a foothold on understanding the spatial and temporal
enormity of Stone Age assemblages within this area. Only time will tell though.
Regardless, I intend to pursue both CST and computer assisted morphometry in the hopes
of advancing archaeological knowledge and practice in order to contribute to the story of
humanity.
95
APPENDIX A AN EXPERIMENT ON TECHNOLOGICAL PROCESS USING STONE TOOLS
Introduction
A practical experiment was conducted during the Fall of 2003 to investigate the
process of intentional and unintentional technological change within an experimental
archaeological setting as interpreted using a CST. This experiment enlisted nine
volunteers with no prior experience making stone tools. The lack of lithic tool
production experience was essential to ensure a contemporary de novo lithic technology
with little influence from prior archaeological knowledge as to how stone tools have been
made prior and a relatively even beginning point to compare each of the three groups
against. This project was undertaken to observe whether:
1. Technological change occurs primarily through unintentional variations incurred through intentional technological production.
2. Intentional and goal-oriented developments follow a pre-planned route of research and technology while unintentional variations may alter the trajectory of technological research, development and implementation in new and unforeseen ways.
3. Experiential knowledge plays a vital role in the identification and implementation of unintentional variation within a technological system. In particular, agents with low experiential knowledge of a technology will not grasp the full significance of certain unintentional variations until a substantial experiential knowledge base (i.e., critical path) is achieved.
These three project goals were tested by observing the actions of each group
member during each task and noting how their behavior changed, or did not change,
between tasks and series. Each task was designed to be cumulative thereby allowing the
knowledge acquired in task one to also be applied to task two. However, each task was
96
also distinctly different thereby forcing group members to create new solutions for each
task. The ability to recognize intentional and unintentional variations and note their
influence on a group’s developed technological system hinged on my greater experience
producing, using, and studying stone tools. Through my knowledge, I was able to
identify the accidental production of tool forms or the accidental use of tool production
techniques based on my prior experience with similar situations and examples from the
archaeological record, and observe if the group member identified the usefulness of the
unintentional variation or not. For example, if a group member accidentally produced a
flake during a task requiring them to cut through a piece of leather, I observed if the
group member identified this potentially useful tool and how they incorporated it within
their technological system. In later tasks I was able to observe how group members
further utilized flakes, for example, in terms of their ideal tool types and actual tool
production and if the group members had sufficient knowledge to create more flakes or
were unable to sustain the tool type.
The observations and interpretations made within this project rest on several
underlying assumptions. These assumptions are:
1. Participants prior knowledge will not affect the results of their ability to create and sustain a lithic technology because their lack of knowledge to produce stone tools. However, prior knowledge may limit the choices perceived available to each group (i.e., to chop though a piece of wood you need an axe-like tool).
2. Ideas direct actions. Shared ideas create similarity within tool forms and tool use.
3. Technological change results primarily from intentional and unintentional variations recognized during the process of technological production. The adoption of these variations changes the ideal type and technological system in general.
4. Technological change may or may not occur through other processes but this is inconsequential to the effect of intentional and unintentional changes.
97
5. Modern-day experimental technological production should replicate comparable real-world archaeological technological production for both intentional and unintentional technological change.
The experiment consisted of each group independently conducting a series of 4
tasks that were repeated twice in sequence (Series 1 and Series 2). Each task was
designed so that every group could apply the knowledge gained from the prior task to the
next task. The specific tasks for each group included the following:
1. Develop an implement to cut through a section of leather. 2. Develop an implement to chop through a 2 inch thick diameter oak branch. 3. Develop an implement to inscribe fine, parallel lines onto a piece of wood. 4. Develop of an implement to bore a hole in a section of wood.
The rules for the experiment were simple and required that each group initially fill
out a questionnaire asking what they intended to produce, why they wanted to produce a
particular design and how they conceived the tool manufacturing process. Furthermore,
each group was also required to submit a scale drawing of the intended final outcome of
the tool(s) with a brief explanation of its particular hypothesized morphology and
function. This information was thought to be useful to compare a group’s intentions with
the final tools produced. However, the drawings of a group’s ideal tool were frequently
much too generalized to be much use in comparison with the actual tool(s) produced.
Furthermore, the tool(s) produced during the task were frequently modified, thereby
creating inconsistency in the ability to compare ideal tool form drawings against the end-
products. As a result, I found that my direct conversations with group members about
their ideal tool and how they intend to make the tool were much more informative and
useful for identifying their ideal types and how these change through time though
intentional and unintentional variations.

98
The methodology was straightforward and consisted of giving each group a
collection of variably-sized quartzite and chert cobbles. While the participants were told
the common name of each rock, caution was taken not to use descriptive or functional
terminology such as “core”, “hammerstone” or “flake” and thus bias the participant’s
conceptions of the “proper” functions of the supplied materials. In addition to the
quartzite and chert stones, other raw materials available to each group included a 26cm
elk antler baton, a 15cm white tail deer antler tine and a 28cm x 18cm piece of leather.
Series 1
Task 1: Cutting a Piece of leather
The first task was to cut a large piece of leather using only the stone tools provided.
All three groups decided to rely initially only upon naturally sharp edges of the chert
instead of attempting to secondarily manufacture a sharp edge. Frequently, a large rock
was used as an anvil to support a cutting tool from above. Alternately, a large rock was
also situated on the ground and the leather simply rubbed over an upward facing sharp
edge. Most importantly, one group eventually began to experiment with flaking chert
after experimenting with an unintentionally produced flake. But while this group seemed
to grasp the importance of flaking raw materials to produce sharp edges, they could not
duplicate the sharp flakes through their random and haphazard smashing two stones
together. Therefore, they reverted back to a simple hammer and anvil cutting technique.
It was only toward the end of this task that the same group found a sharp flake
unintentionally produced during the hammer and anvil technique and swiftly and
successfully scored the leather with the distal end of the flake.
While two groups still did not recognize and utilize a flake tool technique, the
recognition and utilization by the third group demonstrated that the unintentional

99
production of tool variations can alter the conception of the ideal tool and how they go
about accomplishing a task.
Task 2: Chopping through a Branch
The next task was designed to build on experiential knowledge gained from the
previous task and required each group to chop through a 5cm (2 inch) thick branch of
oak. All three groups clearly noted their influence with the image of an axe as the pattern
of choice because of its sharp bifacial blade, high mobility and the mechanical force it
afforded to chop through wood. A second group began to recognize the properties and
value of flakes during this task. However, like the group in task one, this second group
lacked the knowledge to consistently produce flakes. Flakes were still a novelty
produced only by accident.
Task 3: Inscribe a Series of Lines into Wood
This task required each group to score a series of crosshatched and zigzag lines into
a piece of wood. As in past experiments, all groups initially chose the simplest solution
by utilizing readily available material of naturally pointed stones. This process quickly
failed to produce desired results so all groups eventually reverted to lessons learned in
previous tasks and sought additional stones for flaking sharp edges and points. It was
during this process of attempted flake production that one group’s quartz nodule they
used as a hammerstone shattered. The quartz shatter produced predominantly non-flake
angular debris with numerous sharp corners and edges. This group quickly discovered
that the angular debris from the quartz boulder provided an excellent tool for inscribing
the wood and shifted their focus from using and producing flakes to using non-flaked
angular debris initially made unintentionally.

100
Up until this point I have emphasized the usefulness and unintentionally produced
nature of flake materials. However, the example from task three clearly shows that flakes
are not the only useful unintended variation but just another variation nonetheless.
Interestingly, in this task, the most successful final tool was unintentionally produced
while trying to produce flakes. What followed was the important discovery that rough,
angular and pointed pieces of quartz could also be successfully utilized for the required
task at hand instead of expending time and energy on the precise production of flakes.
Task 4: Drill a Hole through a Piece of Wood
The requirement for this task was to drill a hole of any diameter through a 0.5cm
piece of wood. Similar to past experiments, the participants were equally influenced by
their knowledge of modern drilling technology and immediately set out to produce a
drill-like stone tool that fit the hand well and could be applied in a spinning motion. Two
groups began experimenting with flaking chert nodules in attempts to produce thin, drill-
like stone tools representative of their preconceived ideal tool form. The first group
accidentally produced their flake and created a successful tool from it whereas the second
group, which had up until now not utilized flake technology, began to experiment with
creating and using flakes. The third group unsuccessfully completed this task because
their hammering method split the wood in two.
Most groups began this task with a clear-cut ideal tool form in mind and quickly set
about its manufacture. It was only after repeated unsuccessful attempts to make the tool
that the focus was then shifted to utilizing the resulting flake debitage instead. While the
manufacture of these ultimately successful flakes was originally intentional, their final
utility was not initially recognized until later. It was again observed that unintentional
101
variations and usage of manufactured products could be successfully applied to
accomplish the task at hand.
Summary of Series 1
At the conclusion of Series 1, the technological systems of all groups had
progressed significantly in both the design and implementation of stone tools. Each
group had developed a flake-based technology that allowed the rudimentary manufacture
and modification of tool edges. While functionally-driven, goal-oriented tasks were the
motivation for each group, it was equally clear that the tool designs of each group also
reflected the intention of the task and the prior knowledge of the group members.
Through direct observation and conversation with participants during each task,
experiential knowledge seemed to provide each group the ability to ultimately recognize
and utilize unintended outcomes during intentional production that they otherwise may
have missed earlier. It was observed that the frequency to recognize useful unintended
variations increased as group members acquired more direct knowledge of stone tools.
This in turn enabled them to identify and either implement or reject coincidental and
unintended variations.
Series 2
Series 2 consisted of identical tasks from the previous series and was designed to
allow direct observation of the importance of experiential knowledge and how it may
influence the recognition and ultimate application of unintended outcomes. All groups
initially expressed confidence in using stone tools to complete the required tasks.
Sharp flake production was the dominant objective for cutting the leather and
wood although one group still attempted to reproduce an unusual triangular-shaped tool
with a hook that was unintentionally created in a previous task. After considerable effort

102
and numerous tool failures from breakage, this group eventually discarded the hooked
stone tool idea and reverted back to simple flake technology to successfully accomplish
the cutting tasks. It was observed that the identification of an earlier unintended variation
(the triangular flake) clearly influenced the intentional production of the technology and
facilitated rapid change of the ideal type conception for this group even if the produced
tool was eventually proven unsuccessful. This unstable and perturbative process
ultimately led to the emergent development of a similar tool form that might not have
been pursued had the initial conditions been slightly different. Similar albeit less original
variants were also utilized in the drilling and scoring tasks as all groups simply relied
upon their past experience to reproduce stone implements found acceptable in the
previous series.
Conclusion
The primary objective of this experiment was to investigate whether technological
change through unintentional variations can be directly observed and documented. In
addition, this project observed the influence of increasing experiential knowledge in the
identification and implementation of unintentional variations within a technological
system.
Each group consistently relied on a pre-planned ideal tool type to accomplish each
task but the actual manufactured product was rarely similar in design. The reasons for
this possibly relate to the low manufacturing skill level of the participants combined with
their inability to recognize and utilize unintended tool variants to better accomplish the
tasks. As the knowledge base of the technological producers increased, the ability to
recognize unintended outcomes also increased thereby altering the overall trajectory of
the technological system.

103
APPENDIX B MATHEMATICAL FORMULAE
Formfactor 4ПA / P2
Roundness 4A / ПL2
Elongation skeleton length / mean fiber width
Aspect Ratio L / B
Formfactor Divided by Roundness П2AL2 / AP2
Where:
A = Area
B = Breadth
L = Length
P = Perimeter
104
LIST OF REFERENCES Allen, Peter M.
1989 Modeling Innovation and Change. In What’s New? A Closer Look at the Process of Innovation, S.E. Van der Leeuw and R. Torrence (eds), p. 258-280. London: Unwin and Hyman.
Allen, Peter M.
1997 Models of Creativity: Towards a New Science of History. In Time, Process, and Structured Transformation in Archaeology, J. McGlade and S.E. Van der Leeuw (eds), p. 35-55. London: Routledge.
Andrefsky, Willam Jr.
1998 Lithics: Macroscopic Approaches to Analysis. Cambridge Manuals in Archaeology Cambridge: Cambridge University Press.
Bailey, G. N.
1983 Concepts of Time in Quaternary Prehistory. Annual Review of Anthropology 12:165-192.
Bentley, R. Alexander
2003 An Introduction to Complex Systems. In Complex Systems and Archaeology: Empirical and Theoretical Applications, R. Alexander Bentley and Herbert D. G. Maschner (eds), p. 9-23. Foundations of Archaeological Inquiry. Salt Lake City: University of Utah Press.
Bentley, R. Alexander and Herbert D. G. Maschner
2003 Complex Systems and Archaeology: Empirical and Theoretical Applications. Foundations of Archaeological Inquiry. Salt Lake City: University of Utah Press.
Binford, Lewis R.
1965 Archaeological Systematics and the Study of Culture Process. American Antiquity 31:203-210.
Binford, Lewis 1981 Behavioral Archaeology and the “Pompeii Premise.” Journal of
Anthropological Research 7:195-208. Black, Glenn A. and Paul Weer
1936 A Proposed Terminology for Shape Classifications of Artifacts. American Antiquity 1(4):280-294.

105
Boden, Margaret A. 1998 What is Creativity? In Creativity in Human Evolution and Prehistory,
Steven Mithen (ed), p. 22-59. New York: Routledge. Brandt, Steven A.
1988 Early Holocene Mortuary Practices and Hunter-Gatherer Adaptations in Southern Somalia. World Archaeology 20(1):40-56.
Brandt, Steven A.
2000 Emergency Archaeological Fieldwork and Capacity Building at the Gilgel Gibe Hydroelectric Project, Deneba, Southern Ethiopia. Unpublished Report to the Ethiopian Tourism Commission and Center for Research and Conservation of the Cultural Heritage, Addis Ababa, Ethiopia.
Braudel, Fernand
1980 History and the Social Sciences: The Longue Duree. In On History, p. 25-54. Chicago: University of Chicago Press.
Brooks, Alison S., David M. Helgren, Jon S. Cramer, Alan Frnklin, William Hornyak, Jody M. Keating, Richard G. Klein, William Rink, Henry Schwarcz, J.N. Leith Smith, Kathlyn Stewart, Nancy Todd, Jacques Verniers, John Yellen
1995 Dating and Context of three Middle Stone Age sites with bone points in the Upper Semliki Valley, Zaire. Science 268:548-553.
Clark, J. Desmond and Sonia Cole (Eds.)
1957 Third Pan-African Congress on Prehistory, Livingstone 1955. London: Chatto and Windus.
Deacon, H. J. and J. Deacon
1999 Human Beginnings in South Africa, Walnut Creek: Alta Mira. Dibble, Harold L. and Phillip G. Chase
1981 A New Method for Describing and Analyzing Artifact Shape. American Antiquity 46(1):178-187.
Fabian, Johannes
1983 Time and the Emerging Other. In Time and the Other: How Anthropology Makes Its Object, p. 1-35. New York: Columbia University Press. .
Fairtlough, Gerard
2000 The Organization of Innovative Enterprises. In Technological Innovation as an Evolutionary Process, John Ziman (ed), p. 267-277. Cambridge: Cambridge University Press.

106
Fitzhugh, Ben 2001 Risk and Invention in Human Technological Evolution. Journal of
Anthropological Archaeology 20: 125-167. Frison, George C.
1968 A Functional Analysis of Certain Chipped Stone Tools. American Antiquity 33(2):149-155.
Gero, Joan and Jim Mazullo
1984 Analysis of Artifact Shape Using Fourier Series in Closed Form. Journal of Field Archaeology 11(3):315-322.
Goodwin, A. J. H. & Van Riet Lowe, C.
1929 The Stone Age cultures of South Africa. Annals of the South African Museum 27:1-289.
Henshilwood, C.S., J.C. Sealy, R. Yates, K. Cruz-Uribe, P. Goldberg, F. E. Grine, R. G. Klein, C. Poggenpoel, K. van Niekerk, I. Watts
2001 Blombos Cave, Southern Cape, South Africa: Preliminary Report on the 1992-1999 Excavation of the Middle Stone Age Levels. Journal of Archaeological Science 28:421-448.
Henshilwood, Christopher S. and Curtis W. Marean
2003 The Origin of Modern Human Behavior: Critique of the Models and Their Test Implications. Current Anthropology 44(5):627-651.
Hodder, Ian
1991 Interpretive Archaeology and Its Role. American Antiquity 56(1):7-18. Hodder, Ian
1998 Creative Thought: A Long-Term Perspective. In Creativity in Human Evolution and Prehistory, Steven Mithen (ed), p. 61-77. New York: Routledge.
Hodder, Ian
1999 Towards a Reflexive Methodology. In The Archaeological Process: An Introduction, p. 80-104. Oxford: Blackwell.
Ingles, David
1996 Landmark Locomotives: Too Big, Too Early, Too Different. Trains Magazine, January.
Jelinek, A. J.
1976 Form, Function, and Style in Lithic Analysis. In Culture Change and Continuity: Essays in Honor of James Bennett Griffin, ed. C. E. Cleland, p. 19-33. New York: Academic.
107
Kim, Jangsuk
2001 Elite Strategies in the Spread of Technological Innovation: The Spread of Iron in the Bronze Age Societies of Denmark and Southern Korea. Journal of Anthropological Archaeology 20: 442-478.
Kinahan, John
2004 Draft Final Report on the Gilgel Gibe Archaeological Project (Reservoir Component). Unpublished Report to the Authority for Research and Conservation of the Cultural Heritage, Addis Ababa, Ethiopia.
Klein, Richard
1999 The Human Career: Human Biological and Cultural Origins. 2nd ed. Chicago: University of Chicago Press.
Knapp, A. Bernard
1996 Archaeology Without Gravity: Postmodernism and the Past. Journal of Archaeological Theory and Method 3(2):127-158.
Kuhn, Steven L. and Mary C. Stiner
1998 Middle Paleolithic ‘Creativity’: Reflection on an Oxymoron? In Creativity in Human Evolution and Prehistory, Steven Mithen (ed), p. 143-164. New York: Routledge.
Kusimba, Sibel B.
2003 African Foragers: Environment, Technology, Interactions. Walnut Creek: Alta Mira.
Lemonnier, Pierre
1989 Towards an Anthropology of Technology. Man 24:526:527. Lemonnier, Pierre
1992 Elements for An Anthropology of Technology. Anthropological Papers No. 88. Ann Arbor: Museum of anthropology, University of Michigan.
Lemonnier, Pierre (ed)
1993 Introduction. In Technological Choices: Transformation in Material Cultures Since the Neolithic. Pierre Lemonnier (ed), p. 1-35. New York: Routledge.
Martin, Gerry
2000 Stasis in Complex Artifacts. In Technological Innovation as an Evolutionary Process, John Ziman (ed), p. 90-99. Cambridge: Cambridge University Press.

108
McBrearty, Sally 1988 The Sangoan-Lupemban and Middle Stone Age Sequence at the Muguruk
Site, Western Kenya. World Archaeology 19(3):388-420. McBrearty, Sally and Alison S. Brooks
2000 The Revolution That Wasn’t: A New Interpretation of the Origin of Modern Human Behavior. Journal of Human Evolution 39:453-563.
McGlade, James
1999 Archaeology and the Evolution of Cultural Landscapes: Towards an Interdisciplinary Research Agenda. In The Archaeology of Landscape, Peter Ucko and Robert Layton (eds), p. 458-482. New York: Routledge.
McGlade, James
2003 The Map is Not the Territory: Complexity, Complication, and Representation. In Complex Systems and Archaeology: Empirical and Theoretical Applications, R. Alexander Bentley and Herbert D. G. Maschner (eds), 111-119. Foundations of Archaeological Inquiry. Salt Lake City: University of Utah Press.
McGlade, James and Jacqueline M. McGlade
1989 Modelling the Innovative Component of Social Change. In What’s New? A Closer Look at the Process of Innovation, S.E. Van der Leeuw and R. Torrence (eds), 281-296. London: Unwin and Hyman.
McGlade, James and Sander E. Van der Leeuw
1997 Introduction: Archaeology and Non-Linear Dynamics—New Approaches to Long-Term Change. In Time, Process, and Structured Transformation in Archaeology, J. McGlade and S.E. Van der Leeuw (eds), 1-29. London: Routledge.
Milo, Richard G.
1998 Evidence for hominid predation at Klasies River Mouth, South Africa, and its implication for the behavior of early modern humans. Journal of Archaeological Science 25:99-133.
Mitchell, Peter, Royden Yates, John E. Parkington
2002 At the Transition: The Archaeology of the Pleistocene-Holocene Boundary in Southern Africa. In Humans at the End of the Ice Age: the Archaeology of the Pleistocene-Holocene Transition, ed by Lawrence Guy Strauss, Berit Valentin Eriksen, Jon M. Erlandson, David R. Yesner. Plenum Press: New York.
Modis, Theodore
2003 The Limits of Complexity, p. 26-32. The Futurist May-June.

109
Mokyr, Joel 2000 Evolutionary Phenomena in Technological Change. In Technological
Innovation as an Evolutionary Process, John Ziman (ed), p. 52-65. Cambridge: Cambridge University Press.
Negash, Agazi
2004 Unpublished Report on the Lithic Analysis at Liben Bore, Ethiopia. University of California, Berkeley.
O’Brian, Michael J. and R. Lee Lyman
2000 Applying Evolutionary Archaeology: A Systematic Approach. New York: Kluwer.
Pfaffenberger, Bryan
1992 Social Anthropology of Technology. Annual Review of Anthropology 21:491-516.
Raper, Jonathan
2001 Multidimensional Geographic Information Science. New York: Taylor & Francis.
Robertshaw, Peter 1993 The Development of Archaeology in East Africa. In A History of African
Archaeology, edited by P. T. Robertshaw, p. 320-331. New York: Heineman.
Rolland, Nicholas and Harold L. Dibble
1990 A New Synthesis of Middle Paleolithic Variability. American Antiquity 55(3):480-499.
Roux, Valentine
2003 A Dynamic Systems Framework for Studying Technological Change: Application to the the Emergence of the Potter’s Wheel in the Southern Levant. Journal of Archaeological Method and Theory 10(1): 1-30.
Rovner, Irwin
1995 Complex Measurements Made Easy: Morphometric Analysis of Artefacts Using Expert Vision Systems. In Computer Applications and Quantitative Methods in Archaeology, J. Wilcock and K. Lockyear (eds), BAR International Series 598.
Russ, John C.
2002 The Image Processing Handbook. Boca Raton: CRC Press.

110
Schiffer, Michael Brian 2001a Toward an Anthropology of Technology. In Anthropological Perspectives
on Technology, Michael Brian Schiffer (ed), p. 1-13. Amerind Foundation New World Studies Series, No. 5. Albuquerque: University of New Mexico Press.
2001b The Explanation of Long-Term Technological Change. In
Anthropological Perspectives on Technology, Michael Brian Schiffer (ed), p. 215-232. Amerind Foundation New World Studies Series, No. 5. Albuquerque: University of New Mexico Press.
Schiffer, Michael B. and James M. Skibo
1987 Theory and Experiment in the Study of Technological Change. Current Anthropology 28(5): 595-622.
Schiffer, Michael B. and James M. Skibo
1997 The Explanation of Artifact Variability. American Antiquity 62(1): 27-50. Semaw, Sileshi
2000 The World’s Oldest Stone Artefacts from Gona, Ethiopia: Their Implications for Understanding Stone Technology and Patterns of Human Evolution Between 2.6 – 1.5 Million Years Ago. Journal of Archaeological Science 27:1197-1214.
Shanks, Michael and Ian Hodder
1995 Processual, Postprocessual, and Interpretive Archaeologies. In Interpreting Archaeology, Ian Hodder, Michael Shanks, Alexandra Alexandri, Victor Buchli, John Carmen, Jonathan Last, and Gavin Lucas. p. 3-29. London: Routledge.
Shea, John J.
2003 Neandertals, Competition, and the Origin of Modern Human Behavior in the Levant. Evolutionary Anthropology 12:173-187.
Skibo, James M. and Michael B. Schiffer
2001 “Understanding Artifact Variability and Change: A Behavioral Framework. In Anthropological Perspectives on Technology, Michael Brian Schiffer (ed), p. 139-150. Albuquerque: University of New Mexico Press.
Spratt, D.A.
1989 Innovation Theory Made Plain. In What’s New? A Closer Look at the Process of Innovation, S.E. Van der Leeuw and R. Torrence (eds), p. 245-257. London: Unwin and Hyman.

111
“Technology” 2000 Def. American Heritage Dictionary. 4th ed.
“Technology”
2004 Def. Oxford English Dictionary. 3rd ed. Thomas, Julian
2000 Introduction: The Polarities of Post-Processual Archaeology. In Interpretive Archaeology: A Reader, p. 1-18. London: Leichester University Press.
Thompson, Jessica C., John R.F. Bower, Erich C. Fisher, Audax Z. P. Mabulla, Curtis W. Marean, Kathy Stewart, and Carl F. Vondra
2004 “Loiyangalani: Behavioral and Taphonomic Aspects of a Middle Stone Age site in the Serengeti Plain, Tanzania.” Paper presented at the 2004 Paleoanthropology Society Meetings, Montreal, Canada.
Tilley, Christopher
1991 An Hermeneutics of Meaning. In Material Culture and Text: The Art of Ambiguity, p. 114-148. London: Routledge.
Tilley, Christopher
1993 Introduction: Interpretation and a Poetics of the Past. In Interpretative Archaeology, Christopher Tilley (ed), p. 1-27. Oxford: Berg.
Torrence, Robin and Sander Van der Leeuw (eds)
1989 Introduction: What’s New About Innovation. In What’s New? A Closer Look at the Process of Innovation, S.E. Van der Leeuw and R. Torrence (eds), p. 1-15. London: Unwin and Hyman.
Trigger, Bruce G.
1989 A History of Archaeological Thought, Cambridge: Cambridge University Press.
Van der Leeuw, Sander
1989 Risk, Perception, Innovation. In What’s New? A Closer Look at the Process of Innovation, S.E. Van der Leeuw and R. Torrence (eds), p. 300-325. London: Unwin and Hyman.
Van der Leeuw, Sander E. and James McGlade
1997 Structural Change and Bifurcation in Urban Evolution: A Non-Linear Dynamical Perspective. In Time, Process, and Structured Transformation in Archaeology, J. McGlade and S.E. Van der Leeuw (eds), p. 331-369. London: Routledge.
112
Van der Leeuw, S.E. and R. Torrence 1989 Introduction: What’s New About Innovation. In What’s New? A Closer
Look at the Process of Innovation, S.E. Van der Leeuw and R. Torrence (eds), p. 1-15. London: Unwin and Hyman.
Wadley, Lyn
2001 What is Cultural Modernity? A General View and a South Africa Perspective from Rose Cottage Cave. Cambridge Archaeological Journal 11(2):201-221.
Watson, Patty Jo, Steven A. LeBlanc, and Charles L. Redman
1971 The Normative View of Culture and the Systems Theory Approach. In Explanation in Archeology: An Explicitly Scientific Approach, p. 61-87. New York: Columbia University Press.
Wayland, E. J.
1930 Pleistocene Pluvial Periods in Uganda. The Journal of the Royal Anthropological Institute of Great Britain and Ireland. 60: 467-475.
Whitley, David
1998 New Approaches to Old Problems: Archaeology in Search of an Ever Elusive Past. In Reader in Archaeological Theory: Post-Processual and Cognitive Approaches, David S. Whitley (ed), p. 1-30. New York: Routledge.
Williams, Garnett P.
1997 Chaos Theory Tamed. Washington D.C.: Joseph Henry Press. Yellen, John, Alison Brooks, Els Cornelissen, Michael Mehlman, Kathlyn Stewart
1995 A Middle Stone Age Worked Bone Industry from Katanda, Upper Semliki Valey, Zaire. Science 268:553-556.
Ziman, John
2000a Evolutionary Models for Technological Change. In Technological Innovation as an Evolutionary Process, John Ziman (ed), p. 3-12. Cambridge: Cambridge University Press.
2000b Selectionism and Complexity. In Technological Innovation as an
Evolutionary Process, John Ziman (ed), p. 41-51. Cambridge: Cambridge University Press.
113
BIOGRAPHICAL SKETCH
Erich Fisher grew up in Houston, Texas. He is a graduate of Texas State
University, San Marcos (formerly Southwest Texas State University), where he majored
in anthropology and cartography/GIS. He is currently working in Ethiopia, Tanzania,
and South Africa on various Stone Age archaeological projects and 3D GIS applications
within archaeology.


![Notes on Complex Function Theory [Sarason]](https://img.pdfslide.us/doc/110x75/55cf93ab550346f57b9e147a/notes-on-complex-function-theory-sarason.jpg)