Embed Size (px)
Citation preview
1
A competency-based approach to pass/fail decisions in an objective structured
clinical examination: An observational study
Nazdar Ezzaddin Alkhateeb*
Department of Medical Education, College of Medicine, Hawler Medical University, Erbil,
Kurdistan Region, Iraq
Ali Al-Dabbagh
Department of Medical Education, College of Medicine, Hawler Medical University, Erbil,
Kurdistan Region, Iraq
Yaseen Omar Mohammed
Community Health Department, Cihan University, Erbil, Kurdistan Region, Iraq
Mohammed Ibrahim
Child Health Department, School of Medicine, University of Dundee, Dundee, Scotland, United
Kingdom
. CC-BY-NC-ND 4.0 International licenseIt is made available under a is the author/funder, who has granted medRxiv a license to display the preprint in perpetuity. (which was not certified by peer review)
The copyright holder for this preprint this version posted March 27, 2020. .https://doi.org/10.1101/2020.03.24.20042093doi: medRxiv preprint
2
A competency-based approach to pass/fail decisions in an objective structured
clinical examination: An observational study
Background: Any high-stakes assessment that leads to an important decision requires
careful consideration in determining whether a student passes or fails. This observational
study conducted in Erbil, Iraq, in June 2018 proposes a defensible pass/fail decision based
on the number of failed competencies.
Methods: Results were obtained for 150 medical students on their final objective
structured clinical examination. Cutoff scores and pass/fail decisions were calculated using
the modified Angoff, borderline, borderline-regression and holistic methods. The results
were compared with each other and with a new competency method using Cohen’s kappa.
Rasch analysis was used to compare the consistency of competency data with Rasch model
estimates.
Results: The competency method resulted in 40 (26.7%) students failing, compared with
76 (50.6%), 37 (24.6%), 35 (23.3%) and 13 (8%) for the modified Angoff, borderline,
borderline regression and holistic methods, respectively. The competency method
demonstrated a sufficient degree of fit to the Rasch model (mean outfit and infit statistics
of 0.961 and 0.960, respectively).
Conclusions: the competency method was more stringent in determining pass/fail,
compared with other standard-setting methods, except for the modified Angoff method.
The fit of competency data to the Rasch model provides evidence for the validity and
reliability of pass/fail decisions.
Keywords: pass/fail decision; competence-based; standard-setting; Rasch model
. CC-BY-NC-ND 4.0 International licenseIt is made available under a is the author/funder, who has granted medRxiv a license to display the preprint in perpetuity. (which was not certified by peer review)
The copyright holder for this preprint this version posted March 27, 2020. .https://doi.org/10.1101/2020.03.24.20042093doi: medRxiv preprint
3
Introduction
The 21st century has brought a worldwide shift towards a competency-based approach in
undergraduate medical education 1. In medical education and assessment literature, ‘competence’
is the ability to perform a skill in a specific setting or situation, whereas ‘competency’ refers strictly
to the skill itself 2. Adopting a competency-based approach to teaching necessitates changing the
assessment methods3.
One of the greatest challenges to institutions responsible for training and certifying physicians is
assessing clinical competence 4–6, which is significant because it helps to protect patients by
determining whether candidates can progress to higher levels of study and/or medical qualification.
Objective structured clinical examinations (OSCEs) are the most commonly used clinical
competency assessment tools. If OSCEs are correctly designed and analysed, they can benefit
medical students’ learning and future performance 7.
A key but difficult task in OSCEs is making pass/fail decisions in cases of borderline performance.
To handle this issue, many standard-setting methods have been introduced and implemented in a
range of clinical examinations 8. However, concerns regarding the reliability, validity and
acceptability of these methods remain, particularly in the context of pass/fail decisions 9. The
differences in cutoff scores among different standard-setting methods may reduce the legal
defensibility of these cutoffs, especially when there are differences in the pass/fail decision 10.
Pass/fail decisions are very important for students; failing an exam leads to remedial work, lost
time and, under certain circumstances, the question of whether the student will continue or quit
medical school11.
For standard setters, the presentation of performance data may contribute to the development of a
credible and defensible pass/fail cutoff score 12. To recognise the relationship between the
observed (actual) score on an examination and the underlying competence in the domain, which is
commonly unobserved, a test theory model is necessary 13. Item response theory (IRT), which has
received little attention in the medical education literature 14, provides a deeper analysis and gives
a range of information on the behaviour of individual test items (difficulty), individual students
(ability) and the underlying construct being examined 13. By using IRT models (e.g. the Rasch
model), standard setters can identify items that are not mapped to student ability (i.e. items that
are either too difficult or too easy for a particular cohort15. IRT models represent a powerful
method for interrogating clinical assessment data, resulting in more valid measures of students’
clinical competencies to inform defensible and fair decisions on students’ progression and
certification 16. Using Rasch measurement theory to establish competency level is a technique that
can help decision makers by simplifying data in meaningful way and correcting for a mix of judge
types 17.
Information gathered through assessment also directs students’ further formative development.
Acknowledging this encourages transforming the assessment experience into a personal inquiry-
based learning strategy 18 and listing potential types of learner deficits such as difficulties in
clinical reasoning, history taking, physical examination or professionalism 19 to help set adaptive
strategies.
. CC-BY-NC-ND 4.0 International licenseIt is made available under a is the author/funder, who has granted medRxiv a license to display the preprint in perpetuity. (which was not certified by peer review)
The copyright holder for this preprint this version posted March 27, 2020. .https://doi.org/10.1101/2020.03.24.20042093doi: medRxiv preprint
4
The depth and breadth of research on OSCEs continue to expand, but a gap remains in the literature
regarding pass/fail decisions in cases of borderline performance. This study aimed to examine
pass/fail decisions using different standard-setting methods and to compare these with a new
method based on the number of failed competencies. This will contribute to filling the knowledge
gap regarding where to draw the line for the borderline performer and help to provide successful
remediation. To achieve these aims, this study sought to answer the following questions:
Can the number of failed competencies facilitate pass/fail decisions? How accurately do the
competency method data fit the Rasch model to provide a defensible pass/fail decision?
Methods
This observational study was conducted in Erbil, Iraq, at the College of Medicine at Hawler
Medical University.
Participants
The data used in this study were examination results obtained from 150 final-year medical students
completing an OSCE as part of their exit examination in June 2018.
The OSCE
The OSCE included 23 work stations and two rest stations. A time of 5 minutes was allocated for
each station, so each OSCE session took approximately 125 minutes. The examination was run in
three parallel circuits on three different floors of the same hospital and was conducted in two
rounds. Students were isolated between rounds to decrease the risk of sharing exam materials.
Stations used real patients, trained simulated patients, manikins, or data and videos.
Each station’s score sheet contained a detailed checklist of the items examined. The checklist was
scored with a maximum of 100 points. A global rating was also included for each station (1 = fail,
2 = borderline, 3 = pass, 4 = above the expected level).
Validity and reliability
The content validity of the OSCE was established by using blueprinting to ensure an adequate
sampling across subject areas and competencies, in terms of the number of stations covering each
competency and the spread over the content of the tested course. The following skills were
included in the blueprint as competencies 20: history taking (five stations), physical examination
(six stations), data interpretation (five stations), procedural skills (two stations), communication
skills (two stations—one station testing counselling skills and one history-taking station also
assessing communication skills) and patient management (four stations).
For the quality assurance of the stations, question selection was conducted at both the department
and the faculty level. The stations were prepared and reviewed for accuracy by the OSCE
. CC-BY-NC-ND 4.0 International licenseIt is made available under a is the author/funder, who has granted medRxiv a license to display the preprint in perpetuity. (which was not certified by peer review)
The copyright holder for this preprint this version posted March 27, 2020. .https://doi.org/10.1101/2020.03.24.20042093doi: medRxiv preprint
5
Committee, which included members from all departments. Stations were written in advance of
the examination date, including instructions for the students, notes for the examiners, scenarios for
the standardised patients, a list of requirements for each station and marking sheets. To ensure the
consistency and fairness of the scores, training was conducted for both the examiners and the
standardised patients.
Because each student taking the OSCE had to perform a number of different tasks at the stations,
this wide sampling of cases and skills should result in a more reliable picture of a student’s overall
competence. Moreover, as the students moved through the stations, they were examined by a
number of different examiners, serving to reduce individual examiner bias.
Standard-setting methods
For our examination of the exam results, standards were set using four different methods: a holistic
score of 50% (university regulation), the modified Angoff (MA) method, the borderline regression
(BLR) method and the borderline (BL) method.
Angoff standards21,22 for all stations were set by a group of eight experts. All experts had
participated in teaching clinical sessions and assessing OSCE examinations. The experts were
asked to define the criteria for a borderline (minimally competent) student. Through discussion,
they reached consensus that a borderline candidate is a candidate performing at a level between
‘pass’ and ‘fail’. Using this definition, for each item on the checklist (on a scale of 0–100), the
experts were asked to estimate the probability that a borderline student would perform that item
correctly. For each item, experts differing more than 20% from the others were asked to discuss
this with the other experts and to reconsider their judgment. The MA passing score was calculated
for each station by averaging the estimates across experts and items. The MA passing score for the
total exam was calculated by averaging the 23 station passing scores.
BLR 23 was the second method investigated. We performed a linear regression analysis, using
student performance as total percentage scores and examiner global ratings (fail = 1, borderline =
2, pass = 3; and above the expected level = 4) to determine the cutoff score. The cutoff score was
derived by substituting the borderline value (2) into the regression equation.
For the BL method, students with borderline performances were identified, and their checklist
scores were collected. The mean score for this group was set as the passing score 24.
To assess the passing score for each competency, we first calculated the means of both checklist
scores and global ratings of the stations assessing each individual competency, so each student had
a mean checklist score and a mean global rating for each competency. The passing score of each
competency was calculated using the BLR method, where students who failed more than half of
the competencies (i.e. three or more of the six competencies) were determined to have failed the
examination. Rasch item fit statistics were used to show how well the data for the competency
method fit the Rasch measurement model. We then compared the pass/fail decision according to
each standard-setting method with the pass/fail decision considering those who failed three or more
competencies to have failed the exam.
. CC-BY-NC-ND 4.0 International licenseIt is made available under a is the author/funder, who has granted medRxiv a license to display the preprint in perpetuity. (which was not certified by peer review)
The copyright holder for this preprint this version posted March 27, 2020. .https://doi.org/10.1101/2020.03.24.20042093doi: medRxiv preprint
6
Data collection and data analysis
We did not require approval from our research ethics committee because this study was carried
out using data acquired from normal exams in the curriculum (raw scores for each of the 23 stations
for the 150 students in this study were obtained from the College of Medicine) with the goal of
calculating the cutoff score for passing using different standard-setting methods and comparing
these methods with the new competency method to improve student assessment and establish a
defensible pass/fail decision. Thus, a retrospective analysis of existing data was conducted.
Statistical analysis
SPSS, Version 23 and Excel 2010 were used for the data analysis. Cohen’s kappa was used to
measure agreement between standard-setting methods on pass/fail decisions; this statistic can be
interpreted as follows: Values ≤ 0 indicate no agreement, values of 0.01–0.20 indicate no
agreement to slight agreement, values of 0.21–0.40 indicate fair agreement, values of 0.41–0.60
indicate moderate agreement, values of 0.61–0.80 indicate substantial agreement and values of
0.81–1.00 indicate almost perfect agreement 25.
Analytical plan
A one-parameter (Rasch) IRT model was fitted to the data on 150 students and six competencies.
We estimated competency difficulty based on how the student answered. Item difficulty is the
value along the latent variables continuum at which a student has a 50% probability of passing each
competency. In the Rasch model, the disparity between student ability and item difficulty predicts
the likelihood of a correct answer. For example, if the difference between student ability and item
difficulty is zero, there will be 50% likelihood of a student answering a question correctly. Higher
item (competency) difficulty estimates indicate that students require a higher level of the ability to
have a 50% probability of passing the competency 14.
An expected score will be calculated from each observed score in the Rasch process, using a t-test
for each item. Item fitness to the Rasch model can be identified by means of infit and outfit
statistics, which are expressed as ‘infit mean square’ or ‘infit t’ and ‘outfit mean square’ or ‘outfit
t’. A value of 1 for outfit indicates a perfect fit, whereas values less than 0.70 indicate misfit and
values greater than 1.30 indicate overfit. Infit t values also show the degree to which a question
fits the Rasch model. Observed data follow the Rasch model if the results of infit t are non-
significant (t from -2 to 2)14.
The item information function was calculated mathematically using the Rasch method by
combining information on student ability and item difficulty. The sum over all items was plotted
against student ability, giving the ‘test information function’ curve, which allowed the estimation
of reliability at different levels of student ability. A tall narrow curve indicates a test containing
highly discriminating items; less discriminating items provide less information but over a wider
range 14.
. CC-BY-NC-ND 4.0 International licenseIt is made available under a is the author/funder, who has granted medRxiv a license to display the preprint in perpetuity. (which was not certified by peer review)
The copyright holder for this preprint this version posted March 27, 2020. .https://doi.org/10.1101/2020.03.24.20042093doi: medRxiv preprint
7
Results The MA method yielded the highest mean passing score: 61.10 in the first round and 61.19 after
discussion. This method resulted in a failure rate of 50.6%. The lowest cutoff score was produced
by the holistic method, which had a failure rate of only 8%. The other standard-setting methods’
cutoff scores and failure rates are shown in Table 1.
To check for internal consistency reliability of the OSCE, Cronbach’s alpha was computed across
the 23 stations for all students (n = 150) and was found to be 0.8.
Table 1. Standard-setting procedures applied to the 23 OSCE stations
Standard-setting method
Passing cutoff score
Number of students failing
Failure rate (%)
MA 61.19 76 50.6
BL 55.73 37 24.6
BLR 54.93 35 23.3
Holistic method 50 13 8
Competency method
≥ 3 competencies 40 26.7
OSCE: objective structured clinical examination; MA: modified Angoff; BL: borderline; BLR: borderline regression
Table 2 shows that failure in three or more competencies coincided with the student failure, as
assessed by the holistic, BL and BLR methods, with 100%, 82.8% and 81% agreement,
respectively.
Table 2. Percent agreement of the competency method with other standard-setting methods on
which students failed the OSCE
Number of failed
competencies
Standard-setting method
N (%)
MA BL BLR Holistic
< 3 39 (51.3) 7 (19) 6 (17.2) 0 (0)
≥ 3 37 (48.7) 30 (81) 29 (82.8) 13 (100)
Total number of students
failing
76 37 35 13
OSCE: objective structured clinical examination; MA: modified Angoff; BL: borderline; BLR: borderline regression
Cohen’s kappa values for the different standard-setting methods on 3450 decisions across the 23
OSCE stations are shown in Table 3.
. CC-BY-NC-ND 4.0 International licenseIt is made available under a is the author/funder, who has granted medRxiv a license to display the preprint in perpetuity. (which was not certified by peer review)
The copyright holder for this preprint this version posted March 27, 2020. .https://doi.org/10.1101/2020.03.24.20042093doi: medRxiv preprint
8
Table 3. Cohen’s kappa for the different standard-setting methods
Standard-setting methods Kappa Sensitivity
(identified
a passing
student)
Specificity
(identified a
failing
student)
Mean kappa
MA Holistic 0.169 54 100 0.392
BL 0.483 65.5 100
BLR 0.457 64.3 100
Competency 0.457 64.9 94.9
62.175 98.727
BL Holistic 0.449 82.5 100 0.653
MA 0.483 100 48.7
BLR 0.963 98.3 100
Competency 0.718 93.7 76.9
93.625 81.4
BLR Holistic 0.475 83.9 100 0.652
BL 0.963 100 94.6
MA 0.457 100 46.1
Competency 0.713 94.6 74.4
94.625 78.775
Holistic MA 0.169 100 17.1 0.379
BL 0.449 100 35.1
BLR 0.475 100 37.1
Competency 0.425 100 33.3
100 30.65
Competency Holistic 0.425 81 100 0.578
BL 0.718 92 81.1
BLR 0.713 91.3 82.9
MA 0.457 97.3 48.7
90.4 78.175 OSCE: objective structured clinical examination; MA: modified Angoff; BL: borderline; BLR: borderline regression
Cohen’s kappa values ranged from 0.169 between the holistic and MA methods to 0.963 between
the BL and BLR methods. The BL method had the highest mean kappa value (0.653), whereas the
holistic method had the lowest mean kappa value (0.379). MA had the highest mean specificity to
detect a failing student (98.727), whereas the holistic method had the lowest specificity (30.65).
The outfit and infit statistics showed that all competencies were within the acceptable range (both
for mean square and t values) and accurately fit the Rasch measurement model (Table 4).
Table 4. Item difficulty, standard error, and outfit and infit statistics
Competency Item
difficulty
Standard
error
Outfit Infit
MNSQ ZSTD MNSQ ZSTD
History -1.05 0.2 0.919 -0.51 0.937 -0.54
Examination -1.78 0.27 0.82 -0.62 0.847 -0.95
Management -0.21 0.17 1.07 0.6 1.097 1.19
. CC-BY-NC-ND 4.0 International licenseIt is made available under a is the author/funder, who has granted medRxiv a license to display the preprint in perpetuity. (which was not certified by peer review)
The copyright holder for this preprint this version posted March 27, 2020. .https://doi.org/10.1101/2020.03.24.20042093doi: medRxiv preprint
9
Note: Item difficulty measured in logits (negative values indicate easier questions)
MNSQ: mean square (values ranging from 0.70 to 1.30 are within acceptable limits for the Rasch model); ZSTD: t-
test (values ranging from -2 to +2 are within acceptable limits for the Rasch model)
Discrimination describes how well the OSCE items (competencies) separate students with abilities
below the competency location from those with abilities above the competency location. One-
parameter IRT often assumes fixed discrimination among all competency items. In practice, a high
discrimination parameter (> 1) means that the probability of a correct response increases more
rapidly as ability increases. Here, the discrimination value was 1.31, which indicates that the
competencies better discriminate between high- and low-ability students than expected for items
of this difficulty.
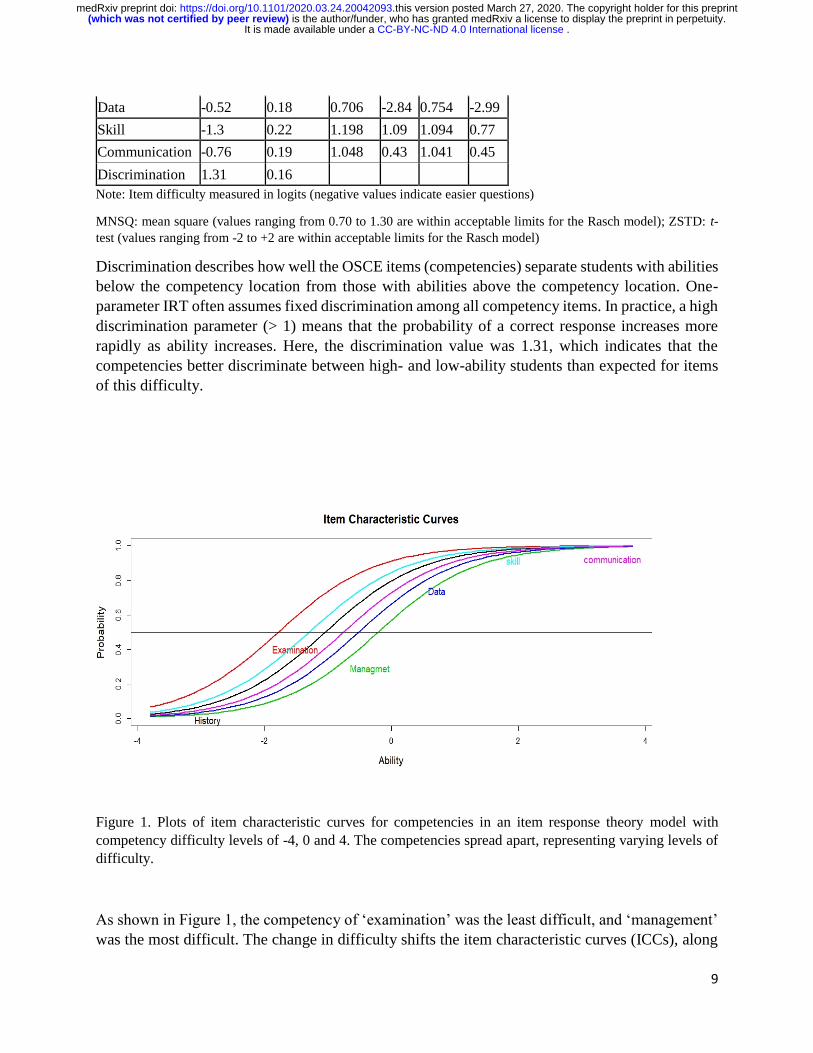
Figure 1. Plots of item characteristic curves for competencies in an item response theory model with
competency difficulty levels of -4, 0 and 4. The competencies spread apart, representing varying levels of
difficulty.
As shown in Figure 1, the competency of ‘examination’ was the least difficult, and ‘management’
was the most difficult. The change in difficulty shifts the item characteristic curves (ICCs), along
Data -0.52 0.18 0.706 -2.84 0.754 -2.99
Skill -1.3 0.22 1.198 1.09 1.094 0.77
Communication -0.76 0.19 1.048 0.43 1.041 0.45
Discrimination 1.31 0.16
. CC-BY-NC-ND 4.0 International licenseIt is made available under a is the author/funder, who has granted medRxiv a license to display the preprint in perpetuity. (which was not certified by peer review)
The copyright holder for this preprint this version posted March 27, 2020. .https://doi.org/10.1101/2020.03.24.20042093doi: medRxiv preprint
10
with ability. The probability of success was higher for the competency of ‘examination’ than for
the other competency items at any ability level. A student would only need an ability level greater
than -1.78 on the competency of ‘examination’ to be expected to succeed on the competency.
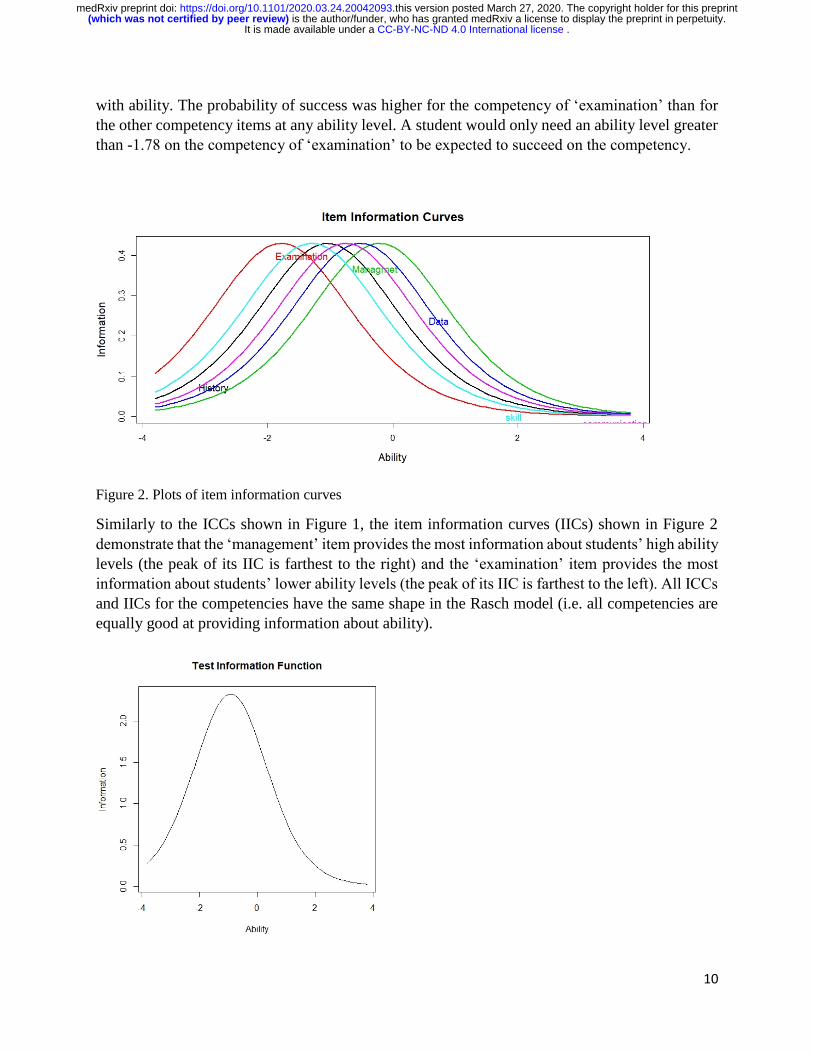
Figure 2. Plots of item information curves
Similarly to the ICCs shown in Figure 1, the item information curves (IICs) shown in Figure 2
demonstrate that the ‘management’ item provides the most information about students’ high ability
levels (the peak of its IIC is farthest to the right) and the ‘examination’ item provides the most
information about students’ lower ability levels (the peak of its IIC is farthest to the left). All ICCs
and IICs for the competencies have the same shape in the Rasch model (i.e. all competencies are
equally good at providing information about ability).
. CC-BY-NC-ND 4.0 International licenseIt is made available under a is the author/funder, who has granted medRxiv a license to display the preprint in perpetuity. (which was not certified by peer review)
The copyright holder for this preprint this version posted March 27, 2020. .https://doi.org/10.1101/2020.03.24.20042093doi: medRxiv preprint
11
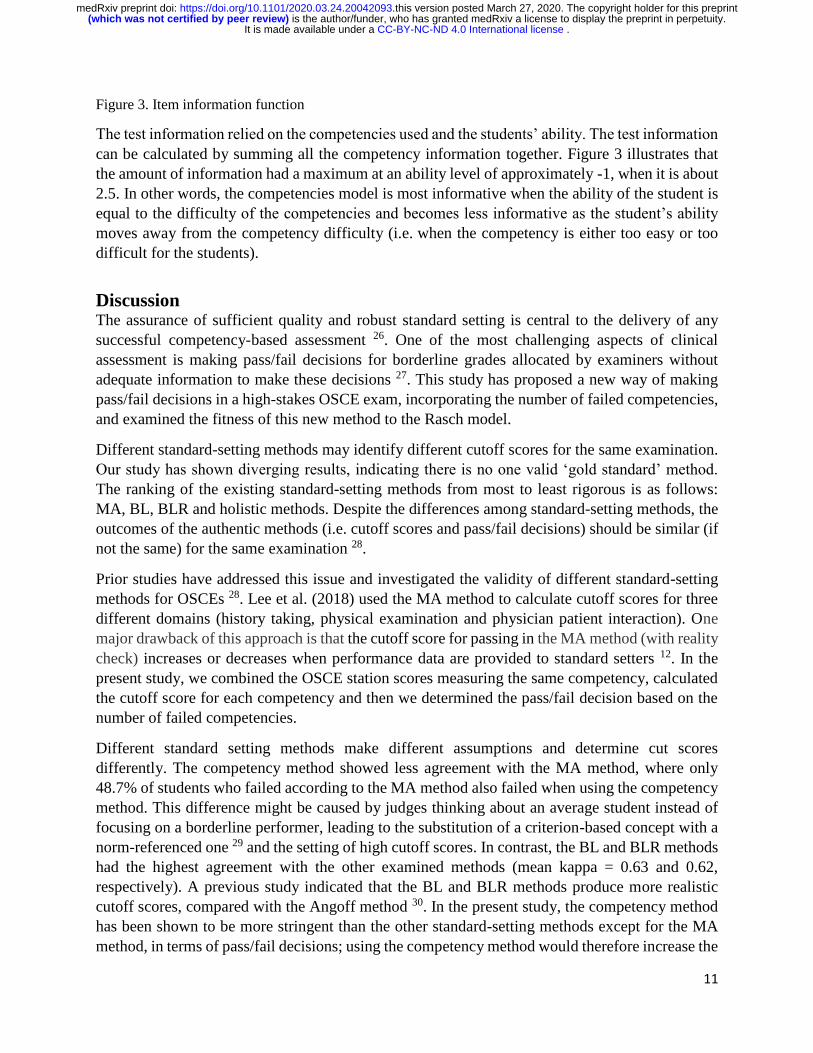
Figure 3. Item information function
The test information relied on the competencies used and the students’ ability. The test information
can be calculated by summing all the competency information together. Figure 3 illustrates that
the amount of information had a maximum at an ability level of approximately -1, when it is about
2.5. In other words, the competencies model is most informative when the ability of the student is
equal to the difficulty of the competencies and becomes less informative as the student’s ability
moves away from the competency difficulty (i.e. when the competency is either too easy or too
difficult for the students).
Discussion The assurance of sufficient quality and robust standard setting is central to the delivery of any
successful competency-based assessment 26. One of the most challenging aspects of clinical
assessment is making pass/fail decisions for borderline grades allocated by examiners without
adequate information to make these decisions 27. This study has proposed a new way of making
pass/fail decisions in a high-stakes OSCE exam, incorporating the number of failed competencies,
and examined the fitness of this new method to the Rasch model.
Different standard-setting methods may identify different cutoff scores for the same examination.
Our study has shown diverging results, indicating there is no one valid ‘gold standard’ method.
The ranking of the existing standard-setting methods from most to least rigorous is as follows:
MA, BL, BLR and holistic methods. Despite the differences among standard-setting methods, the
outcomes of the authentic methods (i.e. cutoff scores and pass/fail decisions) should be similar (if
not the same) for the same examination 28.
Prior studies have addressed this issue and investigated the validity of different standard-setting
methods for OSCEs 28. Lee et al. (2018) used the MA method to calculate cutoff scores for three
different domains (history taking, physical examination and physician patient interaction). One
major drawback of this approach is that the cutoff score for passing in the MA method (with reality
check) increases or decreases when performance data are provided to standard setters 12. In the
present study, we combined the OSCE station scores measuring the same competency, calculated
the cutoff score for each competency and then we determined the pass/fail decision based on the
number of failed competencies.
Different standard setting methods make different assumptions and determine cut scores
differently. The competency method showed less agreement with the MA method, where only
48.7% of students who failed according to the MA method also failed when using the competency
method. This difference might be caused by judges thinking about an average student instead of
focusing on a borderline performer, leading to the substitution of a criterion-based concept with a
norm-referenced one 29 and the setting of high cutoff scores. In contrast, the BL and BLR methods
had the highest agreement with the other examined methods (mean kappa = 0.63 and 0.62,
respectively). A previous study indicated that the BL and BLR methods produce more realistic
cutoff scores, compared with the Angoff method 30. In the present study, the competency method
has been shown to be more stringent than the other standard-setting methods except for the MA
method, in terms of pass/fail decisions; using the competency method would therefore increase the
. CC-BY-NC-ND 4.0 International licenseIt is made available under a is the author/funder, who has granted medRxiv a license to display the preprint in perpetuity. (which was not certified by peer review)
The copyright holder for this preprint this version posted March 27, 2020. .https://doi.org/10.1101/2020.03.24.20042093doi: medRxiv preprint
12
number of students failing the OSCE. However, this result was expected and may be desirable
because the negative consequences of certifying an incompetent examinee (false positive) may far
outweigh those of not certifying a competent one (false negative). It is important to minimise
passing incompetent students 31. According to course and programme leaders in a previous study,
examiners in clinical examinations were too lenient and tended to avoid failing students, especially
by giving borderline students the benefit of doubt 27. Such a practice has the potential to have major
adverse implications for medical practice 32.
The second aim of the present study was to determine how accurately the data of the competency
method fit the Rasch model. Classical test theory and IRT are widely used to address measurement-
related issues that arise from commonly used assessments in medical education, including OSCEs.
Traditionally, post-examination analysis results are often based on classical test theory. However,
statistics in classical test theory are based on the aggregate, and their values are sample-size-
dependent. Medical educators need to further investigate the relationship between students’ ability
(independent of item sample size) and the ease or difficulty of questions (independent of student
sample size). IRT and one of its main models (Rasch) offers a comprehensive and forensic analysis
of exam data that can be used to enhance test quality 14. Furthermore, Rasch analysis provides
beneficial graphical displays that aid test constructors in appraising the effectiveness of their
assessments and, in the context of pass/fail decisions, enables us to establish the cutoff score for
each competency according to student ability level. To judge the compatibility of the observed
data with the Rasch model, mean square values were used: A value of 1 indicates a precise fit,
whereas values from 0.70 to 1.30 indicate a good fit. However, values < 0.70 or > 1.30 are termed
misfitting and overfitting, respectively, and should lead to an analysis of the items 33. Our results
showed that the examined competencies accurately fit the Rasch model, with all competencies’
mean square values within the acceptable range. The Rasch analysis showed that the competency
of ‘management’ was the most difficult, requiring greater student ability to pass.
In contrast to other standard-setting methods, which reduce all of the information obtained from
an assessment to a binary pass/fail judgment and simplify high-stakes decision making such that a
minimally competent student is treated the same as a maximally competent student—meaning that
both can graduate as doctors 34, the competency method provides rich data on each student’s
strengths and weaknesses. This presents an opportunity for students to learn from the assessment,
guiding those who fail the examination in the remediation process and helping them to concentrate
on their deficient competencies. The mantra that ‘assessment drives learning’ is often repeated
with the belief that the effect of assessment is always useful 34. However, according to Kalet et al.
(2012), effective remediation requires good data. In the present study, implementing the
competency method in an OSCE exam provided data that could facilitate effective remediation.
The main strength of the present study is the comparison of many commonly used standard-setting
methods for OSCEs. The reported Cohen’s kappa statistics were based on 3450 decisions over 23
stations. Another strength of the study is the use of the Rasch statistical IRT model to enhance the
credibility of competency-based pass/fail decisions. Therefore, this new competency method is
more dependable, as it is derived from mathematical principles, whereas other methods are based
on an overall impression of the examination difficulty and provides a less defensible cut score.
. CC-BY-NC-ND 4.0 International licenseIt is made available under a is the author/funder, who has granted medRxiv a license to display the preprint in perpetuity. (which was not certified by peer review)
The copyright holder for this preprint this version posted March 27, 2020. .https://doi.org/10.1101/2020.03.24.20042093doi: medRxiv preprint
13
However, obtaining data from final-year medical students in a single institution from one
geographical region may limit the generalisability of our findings. It would be useful to include
more students from different medical colleges in the region. Thus, our findings need to be
interpreted with caution when applied to other institutional settings.
Our findings indicate the importance of combining the results of OSCEs based on content
similarities of stations, which is more meaningful for a competency-based assessment and would
enable faculty to draw more meaningful conclusions and provide actionable feedback.
Despite the implementation of many standard-setting methods in clinical examinations, concerns
remain about the reliability of pass/fail decisions in high-stakes assessments, especially in the
context of clinical assessment. The findings from this study make several contributions to the
existing literature. First, the number of failed competencies help to establish a pass/fail decision,
although this method is more stringent than other standard-setting methods examined except for
MA. The competency method offers rich information about individual learners and provides data
that facilitate effective remediation. The competency data fit the Rasch model well, which provides
evidence for the validity and reliability of pass/fail decisions made using this method. The
competency method can be used to set a cutoff score reflecting the desired student ability for each
competency.
Acknowledgement
We thank Jennifer Barrett, PhD, from Edanz Group (www.edanzediting.com/ac) for critically
reviewing and editing a draft of this manuscript.
Declaration of interest
The authors report no conflicts of interest. The authors alone are responsible for the content and
writing of this article.
Author contributions
NA, AA, MI designed the study, YM was the statistician and did the analysis. NA wrote the first
draft of manuscript and data entry. All authors reviewed and approved the final manuscript.
References
Albanese M. 1999. Rating educational quality: Factors in the erosion of professional standards. Acad Med: Journal of the Association of American Medical Colleges. 74(6):652–658.
Bandaranayake RC. 2008. Setting and maintaining standards in multiple choice examinations: AMEE guide No. 37. Med Teach. 30:836–845.
Bennion LD, Durning SJ, LaRochelle J, Yoon M, Schreiber-Gregory D, Reamy BV, Torre D. 2018. Untying the Gordian knot: Remediation problems in medical schools that need remediation. BMC Med
. CC-BY-NC-ND 4.0 International licenseIt is made available under a is the author/funder, who has granted medRxiv a license to display the preprint in perpetuity. (which was not certified by peer review)
The copyright holder for this preprint this version posted March 27, 2020. .https://doi.org/10.1101/2020.03.24.20042093doi: medRxiv preprint
14
Educ. 18(1):120.
Cleaton N, Yeates P, McCray G. 2018. Exploring the relationship between examiners’ memories for performances, domain separation and score variability. Med Teach. [accessed 2019 May 20]:[7 p.]. https://www.tandfonline.com/doi/abs/10.1080/0142159X.2018.1463088.
Core Committee. 2002. Global minimum essential requirements in medical education. Med Teach. 24(2):130–135.
Cusimano MD. 1996. Standard setting in medical education. Acad Med: Journal of the Association of American Medical Colleges. 71(10):S112–S120.
De Champlain AF. 2010. A primer on classical test theory and item response theory for assessments in medical education. Med Educ. 44:109–117.
Eva KW, Bordage G, Campbell C, Galbraith R, Ginsburg S, Holmboe E, Regehr G. 2016. Towards a program of assessment for health professionals: From training into practice. Adv Health Sci Educ. 21(4):897–913.
General Medical Council. 2015. Outcomes for graduates (tomorrow’s doctors). Manchester: General Medical Council; [accessed 2018 September 1]. https://www.gmc-uk.org/-/media/documents/outcomes-for-graduates-jul-15-1216_pdf-61408029.pdf.
Gormley G. 2011. Summative OSCEs in undergraduate medical education. Ulster Med J. 80(3):127–132.
Harrison C. 2017. Feedback in the context of high-stakes assessment: Can summative be formative? [dissertation]. Maastricht: Maastricht University; [accessed 2018 November 19] https://cris.maastrichtuniversity.nl/portal/files/15203388/c5759.pdf.
Kalet A, Tewksbury L, Ogilvie J, Buckvar-Keltz L, Porter B, Yingling S. 2012. Remediation of learners who perform poorly on an OSCE. In Zabar S, Kachur EK, Kalet A, Hanley K, editors. Objective structured clinical examinations. New York (NY): Springer New York; p. 35–38.
Khan K, Ramachandran S. 2012. Conceptual framework for performance assessment: Competency, competence and performance in the context of assessments in healthcare—deciphering the terminology. Med Teach. 34:920–928.
Lee M, Hernandez E, Brook R, Ha E, Harris C, Plesa M, Kahn D. 2018. Competency-based standard setting for a high-stakes objective structured clinical examination (OSCE): Validity evidence. MedEdPublish. 7(3):1–15.
Liu M, Liu K-M. 2008. Setting pass scores for clinical skills assessment. Kaohsiung J Med Sci. 24(12):656–663.
McHugh ML 2012. Interrater reliability: The kappa statistic. Biochemia Medica. 22(3):276–282.
Möltner A, Tımbıl S, Jünger J. 2015. The reliability of the pass/fail decision for assessments comprised of multiple components. GMS Zeitschrift Fur Medizinische Ausbildung, German Medical Science. 32(4):Doc42.
Norcini JJ, Shea JA, Hancock EW, Webster GD, Baranowski RA. 1988. A criterion-referenced examination in cardiovascular disease? Medical Education. 22(1):32–39.
Pell G, Fuller R, Homer M, Roberts T. 2010. How to measure the quality of the OSCE: A review of
. CC-BY-NC-ND 4.0 International licenseIt is made available under a is the author/funder, who has granted medRxiv a license to display the preprint in perpetuity. (which was not certified by peer review)
The copyright holder for this preprint this version posted March 27, 2020. .https://doi.org/10.1101/2020.03.24.20042093doi: medRxiv preprint
15
metrics—AMEE guide No. 49. Med Teach. 32(10):802–811.
Schoonheim-Klein M, Muijtjens A, Habets L, Manogue M, Van Der Vleuten C, Van Der Velden U. 2009. Who will pass the dental OSCE? Comparison of the Angoff and the borderline regression standard setting methods. European Journal of Dental Education. 13:1396–5883.
Shewade HD, Jeyashree K, Kalaiselvi S, Palanivel C, Panigrahi KC. 2017. Competency-based tool for evaluation of community-based training in undergraduate medical education in India—a Delphi approach. Adv Med Educ Pract. 8:277–286.
Shulruf B, Damodaran A, Jones P, Kennedy S, Mangos G, O ’Sullivan AJ, Rhee J., Taylor S.,
Velan G., Harris P. 2018. Enhancing the defensibility of examiners’ marks in high stake OSCEs. BMC Medical Education. 18(10). [accessed 2019 May 20]: [9 p.]. https://doi.org/10.1186/s12909-017-1112-z.
Shulruf B, Jones P, Turner R. 2015. Using student ability and item difficulty for making defensible pass/fail decisions for borderline grades. Higher Education Studies. 5(4):107–118.
Tavakol M, Dennick R. 2013. Psychometric evaluation of a knowledge based examination using Rasch analysis: An illustrative guide: AMEE guide no. 72. Med Teach. 35:838–848.
Tavakol M, Dennick R. 2017. The foundations of measurement and assessment in medical education. Med Teach. 39(10):1010–1015.
Tavakol M, Doody GA. 2015. Making students’ marks fair: Standard setting, assessment items and post hoc item analysis. International Journal of Med Educ. 6:38–39.
Tor E, Steketee C. 2011. Rasch analysis on OSCE data: An illustrative example. Australasian Medical Journal. 4(6):339–345.
Torbeck L, Wrightson AS. 2005. A method for defining competency-based promotion criteria for family medicine residents. Academic Medicine: Journal of the Association of American Medical Colleges. 80(9):832–839.
Wood TJ, Humphrey-Murto SM, Norman GR. 2006. Standard setting in a small scale OSCE: A comparison of the Modified Borderline-Group Method and the Borderline Regression Method. Advances in Health Sciences Education. 11:115–122.
Wyse AE. 2017. Five methods for estimating Angoff cut scores with IRT. Educational Measurement: Issues and Practice, Vol. 36 No. 4, pp. 16–27.
Yang Y-Y, Lee F-Y, Hsu H-C, Huang C-C, Chen J-W, Lee W-S, Chuang C-L, Chang C-C, Chen H-M, Huang C-C. 2011. A core competence-based objective structured clinical examination (OSCE) in evaluation of clinical performance of postgraduate year-1 (PGY1) residents. Journal of the Chinese Medical Association, Elsevier, Vol. 74 No. 5, pp. 198–204.
Yousuf N, Violato C, Zuberi RW. 2015. Standard setting methods for pass/fail decisions on high-stakes objective structured clinical examinations: A validity study. Teaching and Learning in Medicine, Vol. 27 No. 3, pp. 280–291.
Zieky M, Perie M, Livingston S. 2006. A Primer on Setting Cut Scores on Tests of Educational Achievement Excerpts From Passing Scores: A Manual for Setting Standards of Performance on Educational and Occupational Tests, Prince- Ton, NJ: Educational Testing Service, Inc., available at:
. CC-BY-NC-ND 4.0 International licenseIt is made available under a is the author/funder, who has granted medRxiv a license to display the preprint in perpetuity. (which was not certified by peer review)
The copyright holder for this preprint this version posted March 27, 2020. .https://doi.org/10.1101/2020.03.24.20042093doi: medRxiv preprint

16
https://www.ets.org/Media/Research/pdf/Cut_Scores_Primer.pdf (accessed 28 November 2018).
. CC-BY-NC-ND 4.0 International licenseIt is made available under a is the author/funder, who has granted medRxiv a license to display the preprint in perpetuity. (which was not certified by peer review)
The copyright holder for this preprint this version posted March 27, 2020. .https://doi.org/10.1101/2020.03.24.20042093doi: medRxiv preprint