Embed Size (px)
Citation preview
1
A Comparison Study of Portland Cement Hydration Kinetics as Measured by
Chemical Shrinkage and Isothermal Calorimetry
Xueyu Panga Dale P Bentz
b Christian Meyer
c Gary P Funkhouser
a Robert Darbe
a
a Halliburton 3000 N Sam Houston Pkwy E Houston TX 77032 USA
b Engineering Laboratory National Institute of Standards and Technology USA
c Department of Civil Engineering and Engineering Mechanics Columbia University USA
Corresponding author Email XueyuPanghalliburtoncom (X Pang)
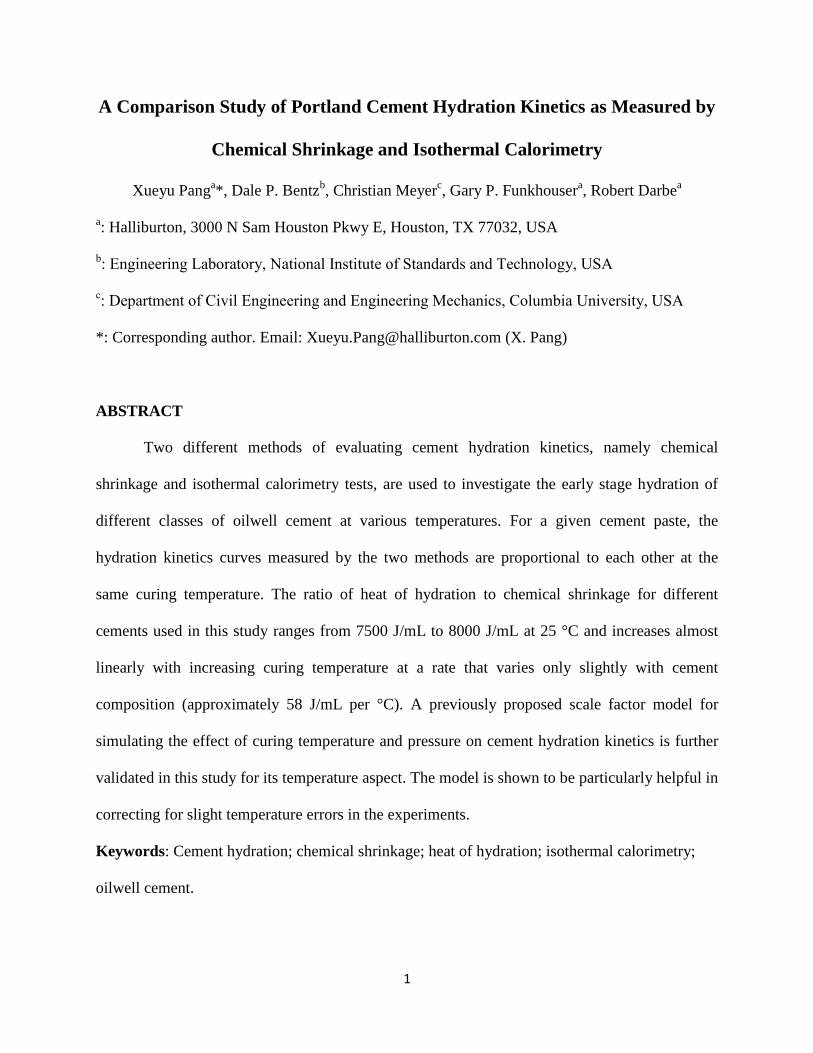
ABSTRACT
Two different methods of evaluating cement hydration kinetics namely chemical
shrinkage and isothermal calorimetry tests are used to investigate the early stage hydration of
different classes of oilwell cement at various temperatures For a given cement paste the
hydration kinetics curves measured by the two methods are proportional to each other at the
same curing temperature The ratio of heat of hydration to chemical shrinkage for different
cements used in this study ranges from 7500 JmL to 8000 JmL at 25 degC and increases almost
linearly with increasing curing temperature at a rate that varies only slightly with cement
composition (approximately 58 JmL per degC) A previously proposed scale factor model for
simulating the effect of curing temperature and pressure on cement hydration kinetics is further
validated in this study for its temperature aspect The model is shown to be particularly helpful in
correcting for slight temperature errors in the experiments
Keywords Cement hydration chemical shrinkage heat of hydration isothermal calorimetry
oilwell cement
2
1 Introduction
The hydration of Portland cement is a complex process Despite decades of research
many detailed features are still not clearly understood today primarily because of the
complicating influences of different clinker phases impurities and their interactions
Nevertheless the general hydration kinetics of cement is often represented by the rate of change
of the overall degree of hydration α which is defined as the total weight fraction of cement
reacted As a composite material consisting mainly of four compounds or clinker phases (C3S
C2S C3A and C4AF1) the overall degree of hydration of cement is typically written as [1]
3 3 2 2 3 3 4 4C S C S C S C S C A C A C AF C AFt p t p t p t p t (1)
where pi is the original weight fraction of Phase i in the anhydrous cement and αi(t) is the degree
of hydration of Phase i at time t Direct determination of αi(t) can be made by quantitative X-ray
diffraction analysis (QXDA) [1 2] though it is difficult to obtain accurate results Some
properties of a hydrating cement paste such as the non-evaporable water content the cumulative
heat evolution and the total chemical shrinkage have been shown to have approximately linear
relationships with the overall degree of hydration [1 3-5] As a matter of fact is more easily
and commonly determined indirectly by tracking the time dependence of one or more of these
properties For the purposes of this paper the semi-continuous measure of the progress of the
degree of hydration with time ((t)) and its derivative (d(t)dt) are both referred to as the
hydration kinetics curves
Among the different methods of approximating cement hydration progress heat of
hydration tests used to be the only one that provided continuous data suitable for evaluating
hydration mechanisms Automated chemical shrinkage test methods have been developed in
1 Cement chemistry notation C=CaO S=SiO2 H=H2O A=Al2O3 F=Fe2O3
3
recent years [6-9] and are now also frequently used to study cement hydration mechanisms [9-
12] Therefore it is important to investigate the differences and similarities between these two
different methods which may also help us gain further insights about the cement hydration
process The experimental test methods and detailed test plan of this study are described in the
next section The theoretical analysis regarding the correlation between heat of hydration and
chemical shrinkage is presented in Section 3 Because temperature control of the chemical
shrinkage tests performed in this study was not very accurate a method of correcting the
temperature differences between isothermal calorimetry tests and chemical shrinkage tests is also
proposed in Section 3 based on a scale factor model developed earlier The scale factor model
was developed to simulate the effect of curing temperature and pressure on cement hydration
kinetics and has been preliminarily validated using chemical shrinkage test data [12] When the
hydration kinetics curve of a reference curing temperature is known for a given cement paste the
scale factor model can be used to estimate the hydration kinetics curve for a given temperature or
the temperature of a given hydration kinetics curve In section 41 the model is further validated
with isothermal calorimetry test data from this study Since the rate of hydration is measured
directly in these tests the accuracy and limitations of the scale factor model can be observed and
discussed in greater detail In section 42 it is shown that the hydration kinetics measured by
chemical shrinkage can be correlated excellently with those measured by isothermal calorimetry
by applying the proposed model in this study
2 Materials and Methods
21 Materials
4
Oilwell cements are based upon Portland cement but manufactured to a higher level of
consistency from one production batch to another There are no substantial differences between
oilwell cements and ordinary Portland cements except for the fact that some Class H (API
Specification 10A [13]) cement may have near zero C3A content API Classes A B and C
cements are similar to ASTM Types I II and III cements respectively The hydration kinetics of
four different classes of oilwell cements namely Class A C G and H were investigated at
different curing temperatures in this study All slurries (cement pastes) were prepared with de-
aerated water and cement only with no additives As will be shown in Section 22 standard
water-to-cement (wc) mass ratios for each class of cement were used as defined in API
Specification 10A [13] The main compound compositions of the different types of cements
derived from the oxide analysis test results using the Bogue calculation method [14] are
presented in Table 1 As shown in the table two different types of Class H cements were used a
premium Class H (H-P) and standard Class H Some minor composition variations were
observed between different batches of standard Class H cement (H-I and H-II) produced from the
same plant The particle size distributions of the cements were measured by the laser scattering
technique with dry dispersion methods The average test results (at least 10 measurements were
performed on each type of cement) are presented in Fig 1 The median particle sizes for Classes
A C G H-P and H-II cements were 38 microm 15 microm 34 microm 30 microm and 23 microm respectively
while their specific surface areas calculated from the PSD data (assuming spherical particles and
a cement density of 3150 kgm3) were 356 m
2kg 565 m
2kg 327 m
2kg 394 m
2kg and 323
m2kg respectively The particle size distribution curves for the Class A G and H-P cements are
very similar suggesting that similar grinding procedures may have been adopted in
5
manufacturing these cements Class C cement is ground much finer than the other classes to
achieve a higher specific surface area and enhance early-age reactivity
Table 1 Estimated main compound compositions (by mass percentage) of the different cements
Cement C3S C2S C3A C4AF C2F CaSO4 Free Lime
A 617 120 84 94 0 47 14
C 722 52 22 118 0 47 02
G 626 159 48 109 0 38 02
H-P 479 275 0 162 20 42 03
H-I 665 117 03 134 0 45 03
H-II 703 85 0 128 00 48 03
Figure 1 Particle size distributions of different classes of cements
22 Chemical Shrinkage Test
The total absolute volume of cement hydration product is smaller than the combined
initial volume of the anhydrous cement and water This reduction in volume during hydration is
known as chemical shrinkage Despite the apparently simple principle of chemical shrinkage
measurement there are experimental difficulties that can yield spurious results For example the
6
traditional chemical shrinkage test (ASTM C1608 [15]) involves adding a significant amount of
water on top of a thin specimen (lt 10 mm) to keep it saturated A recent study showed that the
quantity and the composition of the surface water have a significant impact on test results [16]
Increasing the amount of surface water was found to increase the chemical shrinkage rate before
the end of the induction period and to reduce the peak chemical shrinkage rate during later
periods The initial increase is probably due to the accelerated dissolution as a result of more
Ca2+
leaching out of the paste sample (and into the surface water solution) Massive precipitates
of portlandite were observed on the surface of specimens of alite (the main composition of
Portland cement) used for chemical shrinkage measurement [17] Additionally when the same
measuring device was used increasing sample thickness was consistently found to cause a
reduction in chemical shrinkage at later ages (gt15 h) [6 16 17] This thickness effect may be
explained by two hypotheses (1) the reduction in the permeability of the sample might prevent
surface water from filling all the pores in the thicker samples (depercolation) (2) a larger
fraction of the thinner sample is diluted by the surface water resulting in a faster hydration rate
at later ages Costoya [17] found that using a small diameter device with less surface water
(cylindrical flask) systematically gave a higher chemical shrinkage of a given mass of alite paste
than when the same mass of paste was used in a large diameter device with more surface water
(Erlenmeyer flask) even though the former generated a much thicker sample The author also
found that chemical shrinkage measured with the former device was the same as that measured
with a set ground paste sample for a period exceeding 250 h Therefore for cement pastes with
relatively high wc ratios surface water probably has a much stronger effect on the test result
than the thickness of the sample and the latter is probably not a limiting factor
7
In this study chemical shrinkage was measured by a recently developed test apparatus
[18] originally designed to obtain in-situ tensile strength of oilwell cements at different curing
pressures The apparatus allows automatic collection of chemical shrinkage data from samples
cured at different temperatures and pressures In addition by using a large volume of cement
paste (four 51 mm by 170 mm cylinders) the effect of surface water on test results is expected to
be minimal When a hydrostatic curing pressure of 069 MPa was applied tests performed using
hollow cylinders (whose entire annular surfaces were covered by filter paper for water
saturation) with a wall thickness of approximately 10 mm were found to generate the same
results as solid cylinders [18] suggesting sample thickness is not a limiting factor of test results
for this type of test under the conditions being employed The test design of the chemical
shrinkage test series is shown in Table 2 The main shortcoming of this new test apparatus is the
lack of precise temperature control Fortunately as will be discussed later any slight temperature
errors can be accounted for with a scale factor when the test results are correlated with those of
the isothermal calorimetry tests Test data oscillation also seems to be dramatically increased
when heating devices are employed for high temperature tests and such oscillations make it
difficult to calculate reliable derivative curves directly from cumulative experimental data
Uncertainties in test results caused by factors other than temperature fluctuations are estimated to
be less than 3 at the end of 3 d More detailed uncertainty analysis of this experimental
technique is given in [18]
Table 2 Chemical shrinkage tests (test series I test duration = 72 h)
Curing Temperature (degC) Ambienta 406
b 60
b
Cement wc - - -
A 046 CS-A-1 CS-A-2 CS-A-3
C 056 CS-C-1 CS-C-2 CS-C-3
G 044 CS-G-1 CS-G-2 CS-G-3
H-P 038 CS-HP-1 CS-HP-2 CS-HP-3
8
H-I 038 CS-H-1 CS-H-2 a Lab temperature (~24 degC plusmn 28 degC)
b Estimated specimen temperature (will be corrected later based on test results)
23 Isothermal Calorimetry Test
Compared to chemical shrinkage isothermal calorimetry is a more established test
method of measuring overall cement hydration progress In the second test series hydration of
the different types of cements is tracked with an isothermal calorimeter according to standard
test procedures [19] Tests were conducted at atmospheric pressure and three different curing
temperatures Table 3 shows the test design for this test series The temperatures of isothermal
calorimetry tests can be controlled more precisely due to the small sample size (4 g ~ 5 g) For
this technique the average absolute difference between replicate specimens of cement paste is
24x10-5
Wg (cement) with a maximum absolute difference of 000011 Wg (cement) for
measurements conducted between 1 h and 7 d after mixing [20] It should be mentioned that
the samples used in the isothermal calorimetry tests were cured under sealed condition which
is different from the saturated curing condition for the chemical shrinkage tests Although it is
difficult to accurately evaluate the effect of saturation condition on the isothermal calorimet ry
test results due to various experimental difficulties a previous study [5] suggests that
saturation has a negligible effect on tests with relatively high wc ratios (the small differences
in tests results were probably caused by the surface water effect discussed in Section 22)
Table 3 Isothermal calorimetry tests (test series II test duration = 168 h)
Curing Temperature (degC) 25 40 60
Cement wc - - -
A 046 IC-A-1 IC-A-2 IC-A-3
C 056 IC-C-1 IC-C-2 IC-C-3
G 044 IC-G-1 IC-G-2 IC-G-3
H-P 038 IC-HP-1 IC-HP-2 IC-HP-3
H-I 038 IC-H-1 IC-H-2 IC-H-3
9
3 Theoretical Background and Analysis
31 Indirect methods of measuring cement hydration
When the indirect methods are employed to measure cement hydration progress the
relationships between experimental results and the overall degree of hydration can be expressed
as [9 21-25]
0 0 0
( ) ( ) ( )( ) n
n
w t H t CS tt
w H CS (2)
where wn(t) and wn0 are the non-evaporable water content at time t and at complete hydration
respectively (typically in gg cement) H(t) and H0 are the cumulative heat evolution at time t and
at complete hydration respectively (typically in Jg cement) and CS(t) and CS0 are the total
chemical shrinkage at time t and at complete hydration respectively (typically in mLg cement)
wn0 depends on the molar masses of the hydration products while H
0 depends on the enthalpy
changes of the chemical reactions both of which are expected to remain constant as long as the
chemical formulae of the hydration products do not change However CS0 depends on the molar
volumes of water and the hydration products and hence varies with both temperature and
pressure According to Eq (2) since wn0 and H
0 remain invariant (at least within the temperature
and pressure range used in this study) the dependency of CS0 on temperature and pressure can
be approximately evaluated by studying the correlations between wn(t) H(t) and CS(t) at various
curing conditions Studies have shown that the ratio of CS(t) to wn(t) evaluated at discrete data
points decreases with increasing temperature [6 10] suggesting that CS0 decreases with
increasing temperature The focus of this study is the correlation between CS(t) and H(t) both of
which have been measured continuously
10
It should be pointed out that the indirect methods only give a gross approximation to the
hydration rate of cement because hydration of the different phases also progresses at different
rates If we ignore the interactions between different clinker phases and the phase changes of
different hydration products during hydration then the total heat of hydration and chemical
shrinkage may be correlated with the degree of hydration of each individual clinker phase as
follows
3 3 3 2 2 2 3 3 3 4 4 4C S C S C S C S C S C S C A C A C A C AF C AF C AFH t a p t a p t a p t a p t (3)
3 3 3 2 2 2 3 3 3 4 4 4C S C S C S C S C S C S C A C A C A C AF C AF C AFCS t b p t b p t b p t b p t (4)
where ai and bi are the cumulative heat evolution and the total chemical shrinkage respectively
associated with the complete hydration of 1 g of clinker phase i Eqs (3) and (4) can be used to
estimate the parameters associated with the complete hydration condition in Eq (2) using the
sums
0 0 i i i iH a p CS b p (5)
Eq (2) is only exact either when all the different clinker phases hydrate at the same rate or when
the coefficients (ie airsquos and birsquos) associated with different phases are the same neither of which
is true [26 27] Nevertheless Eq (2) is still widely used as acceptable approximations [9 21-
25] In addition if the ratios of the coefficients associated with different clinker phases are
constant that is
3 32 4
3 2 3 4
C S C AC S C AF
C S C S C A C AF
a aa a
b b b b (6)
then the following part of Eq (2) will still be exact
0 0
( ) ( )H t CS t
H CS (7)
11
Accurate determination of the coefficients (ie ai and bi) for each individual phase is challenging
because complete hydration of all clinker phases is difficult to achieve and estimation of the
phase compositions (ie pi) are usually not accurate Recent estimates (Table 4) suggest that Eq
(6) is approximately true for three out of four main clinker phases (C3S C3A C4AF) Therefore
Eq (7) should provide a reasonable approximation especially for early age hydration which is
typically dominated by C3S and C3A
Table 4 Coefficients for estimating the parameters at the complete hydration condition
Phase C3S C2S C3A C4AF Reference
ai (Jg) 510 247 1356 427 [28]
bi (mLg at 25 degC) 00596 00503 013 00469 [9]
aibi 8557 4911 10431 9104
Obtained by multi-linear regression analysis from experimental data of 21 different
cements slightly different from theoretical values calculated from standard enthalpy of
formation [28 29] which depend on the chemical formulae of hydration products
32 A scale factor model for the effect of curing conditions on cement hydration
When the time dependence of the degree of hydration of cement is represented by an
unknown function the effect of curing temperature and pressure can be modelled by
incorporating a scale factor C into that function [12] For example if hydration at the reference
temperature Tr and pressure Pr is represented by the following functions
Integral curve ( ) Derivative curve ( )
r r r rT P T Pt d dt t (8)
then the transformed functions at temperature T and pressure P are
Integral curve ( ) ( )
Derivative curve ( ) ( )
r r
r r
T P T P
T P T P
t Ct
d dt t C Ct
(9)
12
The scale factor is similar to the coefficient used to compute the equivalent age of a specified
curing condition when applying the maturity method to estimate concrete strength (ASTM
C1074 [30]) It is important to note that both the scale factor model and the equivalent age
method assume the hydration mechanism do not change over the ranges of temperature and
pressure studied The dependence of the scale factor on curing temperature can be modeled by
the following equation [12]
Dagger
1 1exp
r r
a rT T P P
r
E V P PC
R T T R T T
(10)
where Ea is the apparent activation energy (Jmol) ∆VDagger is the apparent activation volume
(m3mol) R is the universal gas constant (8314 J(molK)) T and P are the temperature (K) and
pressure (Pa) of an arbitrary curing condition while Tr and Pr are the temperature (K) and
pressure (Pa) of the reference curing condition C is the scale factor associated with temperature
change from Tr to T and pressure change from Pr to P
One of the most important advantages of the scale factor model is that it is very
straightforward and easy to use The physical meaning of the model is that the hydration rate at
any curing condition is increased or decreased by a factor of C compared with that at the
reference curing condition at the same degree of hydration Probably due to the different
mechanism of hydration during the very early period (before the end of the induction period) it
is sometimes necessary to offset the predicted hydration kinetics curve using the scale factor
model to generate a better agreement with the experimental curve especially when their curing
temperatures are different The offset is not necessary for tests performed at different curing
pressures in the range from 07 MPa to 517 MPa [12] Therefore a more accurate representation
of the relationship between the hydration kinetics curves at temperatures T and Tr (for the same
curing pressure) is
13
0
0
Integral Curves ( )
Derivative Curves ( )
r r
r r r
T T T T
T T T T T T
t C t t
t C C t t
(11)
where T and rT
are the functions representing the time dependence of the degree of hydration
at temperatures T and Tr respectively t0 is the offset time which appears to increase with
increasing differences between Tr and T rT TC is the scale factor related to the temperature
differences which is the same as defined in Eq(10) at constant pressure
1 1
expr
aT T
r
EC
R T T
(12)
33 Correlation between Heat of hydration and Chemical shrinkage
If we consider an isothermal calorimetry test performed at temperature TIC and a
chemical shrinkage test performed at temperature TCS the degree of hydration measured by the
former can be expressed as
0
( )IC
IC
T
T
H tt
H
(13)
while that measured by the latter can be expressed as
0
( )CS
CS
T
T
CS
CS tt
CS T
(14)
Note that as already discussed CS0 is a function of temperature Employing the scale factor
model one can obtain
0IC CS CS ICT T T Tt C t t
(15)
where the scale factor is related to the temperature difference between the two types of tests by
the following equation
14
1 1
expCS IC
aT T
CS IC
EC
R T T
(16)
By combining Eqs (13) - (15) the cumulative heat evolution H(t) can be related to the total
chemical shrinkage CS(t) by the following equation
0
00( )
IC CS CS ICT T T T
CS
HH t CS C t t
CS T
(17)
4 Test Results and Discussion
41 Verifications of the scale factor model
One of the most important assumptions of the scale factor model is that the normalized
rate of hydration vs degree of hydration curve of a given cement paste is invariant with curing
condition (for isothermal and isobaric tests) The assumption has been verified for different types
of cement in the pressure range from 07 to 517 MPa using chemical shrinkage test data [12]
Oscillations of chemical shrinkage test results at high temperatures made it difficult to derive the
rate of hydration accurately Therefore further validation of this assumption is desirable for
different curing temperatures with the heat evolution data Based on the values listed in Table 4
and assuming C2F generates the same amount of heat as C4AF on the same mass basis the
cumulative heat generated at complete hydration (H0) was estimated to be 4977 Jg (cement)
4611 Jg 4701 Jg 4292 Jg and 3859 Jg for Class A C G H-I and H-P cements
respectively The hydration progress of these different types of cement can be obtained by
normalizing the heat evolution data by their respective H0
values
It should be pointed out that the scale factor model was developed for a single reaction
process assuming that the curing condition only changes the rate of the reaction but not its
nature In reality Portland cement hydration is a much more complex process with all the
15
different clinker phases having different reaction rates as well as different sensitivities to curing
temperature changes (ie activation energies) The composition of the hydration products may
also change if curing temperature changes significantly Therefore the model can be applied
only approximately to analyze Portland cement hydration Figure 2 shows the rate of hydration
vs degree of hydration derived from the heat evolution data of Class H-I cement before and after
normalization While the normalized data at different curing temperatures coincide relatively
well during early and late periods slight deviations are observed during the middle period (ie
for degrees of hydration approximately ranging from 02 to 05) Figure 3 shows the normalized
rate of hydration vs degree of hydration of the four other types of cement obtained at different
curing temperatures Similar convergence behaviors were observed except for the Class A and
Class C cements at 60 degC both of which diverge significantly from their behavior at 25 degC and
40 degC For all the different types of cement the divergences of the normalized kinetics curves
becomes more significant as the temperature difference increases due to the different
temperature sensitivities of different phases The normalized hydration data at 25 degC and 40 degC
appear to show better compliance with the model indicating that the scale factor model is more
accurate for relatively small temperature changes
16
0 02 04 06 080
002
004
006
008
01
012
014
Degree of hydration
Rate
of
hydra
tion (
h)
0 02 04 06 080
02
04
06
08
1
Degree of hydration
Norm
aliz
ed r
ate
of
hydra
tion
25C
40C
60C
25C
40C
60C
Figure 2 Effect of curing temperature on hydration rate as a function of degree of hydration
(Class H-I cement wc = 038)
0 02 04 06 080
02
04
06
08
1
Norm
aliz
ed r
ate
of
hydra
tion
0 02 04 06 080
02
04
06
08
1
0 02 04 06 080
02
04
06
08
1
Degree of hydration
Norm
aliz
ed r
ate
of
hydra
tion
0 02 04 06 080
02
04
06
08
1
Degree of hydration
25C
40C
60C
25C
40C
60C
25C
40C
60C
25C
40C
60C
Class CClass A
Class G Class H-P
Figure 3 Normalized rate of hydration vs degree of hydration of different cements
According to Eq (11) the scale factor relating the hydration rates at two different curing
temperatures can be estimated by applying basic coordinate transformation rules to transform the
17
hydration kinetics curve at Tr to achieve the best agreement with that at T (the method is referred
to as the best fit method) Figure 4 shows the results of transforming the experimental hydration
data obtained at 25 degC and 40 degC to fitpredict those at higher curing temperatures for Class C
cement Although it seems impossible to achieve perfect agreement for the entire curing period
the predictions are in good agreements with the actual experimental results during the period up
to the first peak which is mainly associated with C3S hydration The second peak probably
includes the contribution from C3A hydration which reportedly has a higher activation energy
than the overall value for Portland cement [31 32] Therefore the transformed hydration data
from lower temperatures typically underestimate the second peak (Figure 4) Applying a
different scale factor for each individual phase in Portland cement would perhaps generate a
better fit Unfortunately it is not yet possible to accurately and reliably measure the hydration
progress of the different phases separately
0 20 40 60 800
02
04
06
08
1
Time (h)
Degre
e o
f hydra
tion
0 5 10 150
005
01
015
02
025
Time (h)
Rate
of
hydra
tion (
h)
Measured
Transformed from 25C
Transformed from 40C
Measured
Transformed from 25C
Transformed from 40C
25C40C
25C40C
60C
60C
Figure 4 Measured and predicted hydration kinetics at different curing temperatures by
coordinate transformations (Class C cement wc = 056)
Figure 5 shows the measured and predicted hydration kinetics curves for the other types
of cement used in this study The predictions are most accurate for the Class H-I cement which
18
has almost no C3A and least accurate for the Class A cement which has the highest C3A
content This further confirms the hypothesis that a higher C3A activation energy can skew the
model results It is also interesting to note that the transformed data from lower temperatures
typically overestimate slightly the degree of hydration at later ages with the exception of Class
H-P cement for which the opposite is true Table 5 lists the offset time and scale factor as well
as the apparent activation energy (calculated from the scale factor using Eq (12)) associated with
each temperature change The constants are obtained by trial and error to provide the best
agreements as shown in Figures 4 and 5 For comparison purposes Table 5 also lists the scale
factors and apparent activation energies calculated with the peak hydration rate method as
proposed in a previous study [12] The constants obtained by the two different methods generally
agree well with each other for relatively small temperature changes (from 25degC to 40 degC and
from 40degC to 60 degC) but may differ quite noticeably for the larger temperature change (from 25
degC to 60 degC) The apparent activation energies obtained in different temperature ranges appear to
decrease with increasing temperature except for Class A cement for which the opposite is true
The apparent activation energies obtained in this study are also found to be much lower than
those calculated from chemical shrinkage test data [12] The latter are probably less accurate due
to the inadequate temperature control of the tests and errors associated with estimating CS0 at
different temperatures (H0 is assumed to be independent of temperature)
19
0 50 100 1500
01
02
03
04
05
06
07
Time (h)
Degre
e o
f hydra
tion
0 50 100 1500
01
02
03
04
05
06
07
Time (h)
Degre
e o
f hydra
tion
0 50 100 1500
02
04
06
08
Time (h)
Degre
e o
f hydra
tion
0 50 100 1500
02
04
06
08
Time (h)
Degre
e o
f hydra
tion
Measured Transformed from 25C Transformed from 40C
40C
60C
60C
40C
60C
40C
25C25C
25C
60C
40C
Class H-P Class H-I
Class GClass A
25C
Figure 5 Measured and predicted hydration kinetics of different cements at different curing
temperatures by coordinate transformations
42 Correlations between chemical shrinkage and heat of hydration of cement
Just as the hydration kinetics curve at a reference temperature can be transformed to fit
the curves obtained at other temperatures the chemical shrinkage curve can be transformed to fit
the heat evolution curve (and vice versa) according to their correlations developed in Section 33
Following Eq (17) the correlation factor H0CS
0(TCS) the scale factor
CS ICT TC and the offset
time t0 can all be estimated by transforming the chemical shrinkage curve to achieve the best
agreement with the heat evolution curve Since the scale factor model is more accurate for
smaller temperature changes the temperature of the chemical shrinkage test should be close to
that of the isothermal calorimetry test to obtain more reliable estimates Figures 6 shows the heat
20
evolution curves of the Class H-P cement measured at 25 degC and the transformed chemical
shrinkage curves (measured at lab temperature) that exhibit the best fit The two curves agree
excellently with each other except during very early stages (before the acceleration period)
where the hydration rate measured by chemical shrinkage seems to be higher than that measured
by heat evolution
Table 5 Activation energies obtained from different analysis methods
Cement Tr - T
(degC)
Best fit method Peak hydration rate method Ea (kJmol)
(from [12]) t0 (h) rT TC Ea (kJmol) rT TC Ea (kJmol)
A
25-40 04 21 384 228 427
526 25-60 08 55 402 704 461
40-60 08 29 462 309 489
C
25-40 075 218 403 223 415
488 25-60 1 48 370 548 401
40-60 06 22 342 246 390
G
25-40 09 23 431 237 447
50 25-60 1 55 402 576 413
40-60 05 22 342 243 385
H-P
25-40 1 215 396 212 389
425 25-60 15 45 355 453 356
40-60 11 21 322 214 330
H-I
25-40 1 226 422 226 422
443 25-60 12 48 370 554 404
40-60 07 21 322 245 389
21
0 10 20 30 40 50 60 70 800
1
2
3x 10
-3
Time (h)
Heat
evolu
tion r
ate
(W
g c
em
ent)
0 10 20 30 40 50 60 70 800
100
200
300
Cum
ula
tive h
eat
evolu
tion (
Jg
cem
ent)
Measured heat evolution
Transformed from chemical shrinkage
Figure 6 Heat evolution curves vs transformed chemical shrinkage curves
(Class H-P cement wc = 038 25 degC)
Figure 7 shows the heat evolution rate curves of the other types of cement measured at 25
degC and their corresponding best-fit transformed chemical shrinkage curves Similar to the Class
H-P cement excellent agreement is obtained between the heat evolution curve and the
transformed chemical shrinkage curve for the Class H-I cement However for cements that
contain significant C3A the agreements between the two types of curves are somewhat poorer
especially around the main hydration peaks The hydration of C3A first produces ettringite during
the hydration peak which then further reacts with excess C3A and transforms to calcium
monosulfoaluminate at later ages [26 28] The test results show that the second peak rate
(probably caused by C3A hydration) measured by chemical shrinkage is always higher than that
measured by heat evolution and that the rate measured by the former also decreases faster during
the deceleration stage Therefore the ratio of chemical shrinkage to heat evolution associated
with C3A hydration is higher than that associated with C3S hydration during the initial reaction
22
(to form ettringite) and probably the reverse is true during the later reaction (to form
monosulfoaluminate) It should be noted that the ratio of a3 to b3 associated with C3A hydration
as shown in Table 4 represents the long-term results of some average cements and is not strictly
applicable here
0 20 40 600
1
2
3
4
5x 10
-3
Time (h)
Heat
evolu
tion r
ate
(W
g c
em
ent)
0 20 40 600
1
2
3
4
5
6x 10
-3
Time (h)
Heat
evolu
tion r
ate
(W
g c
em
ent)
0 20 40 600
1
2
3
4
5x 10
-3
Time (h)
Heat
evolu
tion r
ate
(W
g c
em
ent)
0 20 40 600
1
2
3x 10
-3
Time (h)
Heat
evolu
tion r
ate
(W
g c
em
ent)
Measured heat evolution Transformed from chemical shrinkage
Class CClass A
Class G Class H-I
Figure7 Heat evolution vs transformed chemical shrinkage
for the different types of cement (derivative curves)
The integral curves of heat evolution of different cements cured at different temperatures
are compared with the transformed chemical shrinkage curves (measured at similar
temperatures) in Figure 8 In general excellent agreements can be obtained between the integral
hydration kinetics curves obtained from the two different methods The constants used to
transform the chemical shrinkage curves to fit the heat evolution curves including the correlation
23
factor the scale factor and the offset time are listed in Table 6 The cause of the offset time
(primarily observed for ambient temperature tests) is not yet clear It may be associated with
variations of the duration of the induction periods which tend to be affected by many different
factors that are difficult to control Following Eq (16) the temperature of the chemical shrinkage
test (TCS) can be estimated from the more-precisely-measured temperature of the isothermal
calorimetry test (TIC) by using the scale factor and the previously obtained activation energies in
the 25 degC to 60 degC temperature range (Table 5) As shown in Table 6 the calculated sample
temperatures of the chemical shrinkage tests are slightly higher than the previously estimated
values (Table 3) To further demonstrate that the scale factors are indeed associated with the
slight temperature differences between chemical shrinkage tests and isothermal calorimetry tests
one of the chemical shrinkage tests (Test CS-H-2) was performed by reducing the target
temperature (set with the temperature controllers) by 28 degC (5 degF) The obtained chemical
shrinkage curve of this particular test is found to be directly proportional to the heat evolution
curve (ie C = 1)
24
0 20 40 60 800
50
100
150
200
250
300
350
Time (h)
Cum
ula
tive h
eat
evolu
tion (
Jg
cem
ent)
0 20 40 60 800
100
200
300
400
Time (h)
Cum
ula
tive h
eat
evolu
tion (
Jg
cem
ent)
0 20 40 60 800
50
100
150
200
250
300
350
Time (h)
Cum
ula
tive h
eat
evolu
tion (
Jg
cem
ent)
0 20 40 60 800
50
100
150
200
250
300
Time (h)
Cum
ula
tive h
eat
evolu
tion (
Jg
cem
ent)
Measured heat evolution Transformed from chemical shrinkage
60C
40C
25C
60C
40C
25C
60C
40C
25C
60C
40C
25C
Class A Class C
Class G Class H-P
Figure 8 Heat evolution curves vs transformed chemical shrinkage curves for different types of
cement at different curing temperatures (integral curves)
25
Table 6 Best-fit constants for correlating chemical shrinkage and heat evolution test results and
the respective temperatures of different tests (Refer to Eq (17))
Test No t0 (h) CS ICT TC
H0CS
0(TCS)
(JmL) TIC (degC) TCS (degC)
CS-A-1 IC-A-1 1 109 7600 25 234
CS-C-1 IC-C-1 04 085 7800 25 283
CS-G-1 IC-G-1 07 095 7700 25 259
CS-HP-1 IC-HP-1 12 107 7500 25 236
CS-H-1 IC-H-1 1 111 8000 25 229
CS-A-2 IC-A-2 0 084 8400 40 436
CS-C-2 IC-C-2 0 09 8350 40 423
CS-G-2 IC-G-2 0 086 8850 40 431
CS-HP-2 IC-HP-2 06 09 8700 40 424
CS-H-2 IC-H-2 0 1 8850 40 400
CS-A-3 IC-A-3 0 09 9750 60 624
CS-C-3 IC-C-3 0 09 10100 60 627
CS-G-3 IC-G-3 0 091 9750 60 622
CS-HP-3 IC-HP-3 0 085 10200 60 643
At lab temperature (approximately 25 degC) the correlation factor between heat evolution
and chemical shrinkage (H0CS
0) for the different cements is found to range from 7500 JmL to
8000 JmL well within the previously reported range of 6500 JmL to 8500 JmL [33 34] The
correlation factor increases with increasing curing temperature Since H0 is independent of
curing temperature the results suggest that CS0 decreases with increasing temperature consistent
with previous studies [6 10] In the relatively small temperature range investigated (25 degC to 60
degC) the variations of CS0H
0 and H
0CS
0 with temperature can both be approximated by linear
models Figure 9 shows the dependence of CS0H
0 on curing temperature for different types of
cement The least square fits of all data points indicate the average rate of change to be -000076
mLkJ per degC for CS0H
0 and +58 JmL per degC for H
0CS
0 When normalized to the values at 25
degC the linear reduction rate of CS0 with increasing temperature is determined to be 057 065
058 066 and 057 per degC for Class A C G H-P and H-I cements respectively
26
suggesting an average reduction rate of 060 (with a standard deviation of 0046 ) per degC
For comparison a reduction rate of 078 per degC may be obtained from test data of Zhang et al
[10] in the same temperature range where the correlations between wn0 and CS
0 of Class H
cement were investigated
20 30 40 50 60 70009
01
011
012
013
014
Curing temperature (C)
CS
0H
0 (
mLk
J)
Class A
Class C
Class G
Class H-P
Class H-I
Figure 9 Dependence of correlation factor (CS0H
0) on curing temperature
5 Conclusions
The hydration kinetics of different types of cement cured at different temperatures has
been evaluated by both the traditional isothermal calorimetry test method and a newly developed
chemical shrinkage test method A scale factor model that can be used to predict the effect of
curing temperature on cement hydration kinetics previously validated with chemical shrinkage
test data is further discussed and validated with the heat evolution test data Due to the fact that
the different compounds in cement hydrate at different rates and have different temperature
sensitivities the model is found to be more accurate for cement with simpler compositions (eg
27
no or very low C3A content) andor for smaller temperature changes (eg le 15 degC) The scale
factor model also introduces a new method of estimating the apparent activation energies of
Portland cement (ie the best-fit method) The apparent activation energies of Class A C G H-P
and H-I cements determined using the heat of hydration data in the temperature range of 25 degC to
60 degC are 402 kJmol 37 kJmol 402 kJmol 355 kJmol and 37 kJmol respectively
A correlation study of chemical shrinkage and isothermal calorimetry test data indicate
that total chemical shrinkage is proportional to cumulative heat evolution if the two tests are
conducted on the same cement paste at the same curing temperature in agreement with previous
research The scale factor model discussed in this study can be used to account for any
unmeasured small temperature differences The proportionality constant namely the ratio of total
chemical shrinkage to total heat release at complete hydration (CS0H
0) varies slightly with
cement composition and decreases with increasing curing temperature If H0 is assumed to be
independent of curing temperature then CS0 decreases approximately linearly with increasing
temperature at a rate of 0600 plusmn 0046 per degC from the reference values at 25 degC for the
different cements used in this study Compared to C3S hydration early C3A hydration (typically
at the main hydration peak) seems to create a higher ratio of chemical shrinkage to heat
evolution while later C3A hydration (typically during the deceleration period) appears to create a
lower ratio As a result the rate of chemical shrinkage curve typically has a slightly different
shape than the heat flow curve for cements that contain significant C3A
Acknowledgements
Financial support for this study was provided by Halliburton Energy Services The
continuous support from Dr Lewis Norman and Dr Ron Morgan is cordially appreciated The
authors would also like to thank Mr David Meadows for his help in developing the chemical
28
shrinkage test apparatus and Ms Donna Chen for her help in performing part of the experimental
work
References
[1] Parrott LJ M Geiker WA Gutteridge D Killoh Monitoring Portland cement hydration
comparison of methods Cement and Concrete Research 20 (1990) pp 919-926
[2] Gutteridge WA and JA Dalziel Filler Cement The Effect of the Secondary Component
on the Hydration of Portland Cement Part I A Fine Non-Hydraulic Filler Cement and Concrete
Research 20 (1990) pp 778-782
[3] Bentz DP A three-dimensional cement hydration and microstructure program I hydration
rate heat of hydration and chemical shrinkage NISTIR 5756 US Department of Commerce
Washington DC 1995
[4] Escalante-Garcia JI Nonevaporable water from neat OPC and replacement materials in
composite cements hydrated at different temperatures Cement and Concrete Research 33 (11)
(2003) pp 1883-1888
[5] Lura P F Winnefeld S Klemm Simultaneous Measurements of Heat of Hydration and
Chemical Shrinkage on Hardening Cement Pastes Journal of Thermal Analysis and Calorimetry
101 (3) (2010) pp 925-932
[6] Geiker M Studies of Portland cement hydration measurements of chemical shrinkage and a
systematic evaluation of hydration curves by means of the dispersion model PhD Thesis
Technical University of Denmark 1983
[7] Mounanga P V Baroghel-Bouny A Loukili A Khelidj Autogenous deformations of
cement pastes Part I Temperature effects at early age and micro-macro correlations Cement
and Concrete Research 36 (2006) 110-122
29
[8] Peethamparan S E Weissinger J Vocaturo J Zhang G Scherer Monitoring chemical
shrinkage using pressure sensors Advances in the Material Science of Concrete ACI SP-270
Vol 7 (2010) 77-88
[9] Pang X and C Meyer Cement chemical shrinkage as measure of hydration kinetics and its
relationship with nonevaporable water ACI Materials Journal 109 (3) (2012) pp 341-352
[10] Zhang J EA Weissinger S Peethamparan GW Scherer Early Hydration and Setting of
Oil Well Cement Cement and Concrete Research 40 (2010) pp 1023-1033
[11] Scherer GW J Zhang JJ Thomas Nucleation and growth models for hydration of
cement Cement and Concrete Research 42 (2012) 982-993
[12] Pang X C Meyer R Darbe GP Funkhouser Modeling the effect of curing temperature
and pressure on cement hydration kinetics ACI materials journal accepted
[13] API Specification 10A Specification for Cements and Materials for Well Cementing
American Petroleum Institute 2010 38 pp
[14] ASTM C150C150M ndash 09 Standard Specification for Portland Cement ASTM
International West Conshohocken PA 2009 10 pp
[15] ASTM C1608 Standard Test Method for Chemical Shrinkage of Hydraulic Cement Paste
ASTM International West Conshohocken PA 2007 4 pp
[16] Sant G P Lura J Weiss Measurement of Volume Change in Cementitious Materials at
Early Ages Review of Testing Protocols and Interpretation of Results Journal of the
Transportation Research Record V 1979 (2006) pp 21-29
[17] Costoya M Kinetics and microstructural investigation on the hydration of tricalcium
silicate Doctoral Thesis Eacutecole Polytechnique Feacutedeacuterale de Lausanne Switzerland 2008
30
[18] Pang X Effects of curing temperature and pressure on the chemical physical and
mechanical properties of Portland cement PhD Dissertation Columbia University New York
2011
[19] ASTM C1679 Standard Practice for Measuring Hydration Kinetics of Hydraulic
Cementitious Mixtures Using Isothermal Calorimetry ASTM International West
Conshohocken PA 2009
[20] Bentz DP and CF Ferraris Rheology and setting of high volume fly ash mixtures
Cement and Concrete Composites 32 (4) (2010) pp 265-270
[21] Mills RH Factors influencing cessation of hydration in water cured cement pastes Special
Report No 90 in Proceedings of the Symposium on the Structure of Portland Cement Paste and
Concrete Highway Research Board Washington DC 1966 pp 406-424
[22] Mounanga P A Khelidj A Loukili V Baroghel-Bouny Predicting Ca(OH)2 Content and
chemical shrinkage of hydrating cement pastes using analytical approach Cement and Concrete
Research 34 (2004) pp 255-265
[23] Swaddiwudhipong S D Chen M H Zhang Simulation of the exothermic hydration
process of Portland cement Advances in Cement Research 14 (2) (2002) pp 61-69
[24] Schindler AK and KJ Folliard Heat of hydration models for cementitious materials ACI
Materials Journal 102 (1) (2005) pp 24-33
[25] Poole JL KA Riding KJ Folliard MCG Juenger AK Schindler Methods for
calculating activation energy for Portland cement ACI Materials Journal 104 (1) (2007) pp 303-
311
[26] Hewlett PC Learsquos Chemistry of Cement and Concrete 4th edition Butterworth-
Heinemann Oxford England 1998
31
[27] Escalante-Garcia JI and JH Sharp Effect of temperature on the hydration of the main
clinker phases in Portland cements Part I neat cements Cement and Concrete Research 28 (9)
(1998) pp 1245-1257
[28] Taylor HFW Cement Chemistry 2nd edition Thomas Telford London UK 1997
[29] Bentz DP T Barret I de la Varga J Weiss Relating compressive strength to heat release
in mortars Advances in Civil Engineering Materials accepted
[30] ASTM C1074 Standard Practice for Estimating Concrete Strength by the Maturity Method
ASTM International West Conshohocken PA 201010 pp
[31] Bushnell-Watson SM The effect of temperature upon the setting behaviour of refractory
CAC PhD Thesis University of Sheffield 1987
[32] Banfill PFG Superplasticizers for Ciment Fondu Part 2 effect of temperature on the
hydration reaction Advances in Cement Research 7 (1995) pp 151ndash157
[33] Bentz D G Sant J Weiss Early-age properties of cement-based materials I Influence of
cement fineness ASCE Journal of Materials in Civil Engineering 20 (7) (2008) pp 502-508
[34] Bentz DP Blending different fineness cements to engineer the properties of cement-based
materials Magazine of Concrete Research 62 (5) (2010) pp 327-338
2
1 Introduction
The hydration of Portland cement is a complex process Despite decades of research
many detailed features are still not clearly understood today primarily because of the
complicating influences of different clinker phases impurities and their interactions
Nevertheless the general hydration kinetics of cement is often represented by the rate of change
of the overall degree of hydration α which is defined as the total weight fraction of cement
reacted As a composite material consisting mainly of four compounds or clinker phases (C3S
C2S C3A and C4AF1) the overall degree of hydration of cement is typically written as [1]
3 3 2 2 3 3 4 4C S C S C S C S C A C A C AF C AFt p t p t p t p t (1)
where pi is the original weight fraction of Phase i in the anhydrous cement and αi(t) is the degree
of hydration of Phase i at time t Direct determination of αi(t) can be made by quantitative X-ray
diffraction analysis (QXDA) [1 2] though it is difficult to obtain accurate results Some
properties of a hydrating cement paste such as the non-evaporable water content the cumulative
heat evolution and the total chemical shrinkage have been shown to have approximately linear
relationships with the overall degree of hydration [1 3-5] As a matter of fact is more easily
and commonly determined indirectly by tracking the time dependence of one or more of these
properties For the purposes of this paper the semi-continuous measure of the progress of the
degree of hydration with time ((t)) and its derivative (d(t)dt) are both referred to as the
hydration kinetics curves
Among the different methods of approximating cement hydration progress heat of
hydration tests used to be the only one that provided continuous data suitable for evaluating
hydration mechanisms Automated chemical shrinkage test methods have been developed in
1 Cement chemistry notation C=CaO S=SiO2 H=H2O A=Al2O3 F=Fe2O3
3
recent years [6-9] and are now also frequently used to study cement hydration mechanisms [9-
12] Therefore it is important to investigate the differences and similarities between these two
different methods which may also help us gain further insights about the cement hydration
process The experimental test methods and detailed test plan of this study are described in the
next section The theoretical analysis regarding the correlation between heat of hydration and
chemical shrinkage is presented in Section 3 Because temperature control of the chemical
shrinkage tests performed in this study was not very accurate a method of correcting the
temperature differences between isothermal calorimetry tests and chemical shrinkage tests is also
proposed in Section 3 based on a scale factor model developed earlier The scale factor model
was developed to simulate the effect of curing temperature and pressure on cement hydration
kinetics and has been preliminarily validated using chemical shrinkage test data [12] When the
hydration kinetics curve of a reference curing temperature is known for a given cement paste the
scale factor model can be used to estimate the hydration kinetics curve for a given temperature or
the temperature of a given hydration kinetics curve In section 41 the model is further validated
with isothermal calorimetry test data from this study Since the rate of hydration is measured
directly in these tests the accuracy and limitations of the scale factor model can be observed and
discussed in greater detail In section 42 it is shown that the hydration kinetics measured by
chemical shrinkage can be correlated excellently with those measured by isothermal calorimetry
by applying the proposed model in this study
2 Materials and Methods
21 Materials
4
Oilwell cements are based upon Portland cement but manufactured to a higher level of
consistency from one production batch to another There are no substantial differences between
oilwell cements and ordinary Portland cements except for the fact that some Class H (API
Specification 10A [13]) cement may have near zero C3A content API Classes A B and C
cements are similar to ASTM Types I II and III cements respectively The hydration kinetics of
four different classes of oilwell cements namely Class A C G and H were investigated at
different curing temperatures in this study All slurries (cement pastes) were prepared with de-
aerated water and cement only with no additives As will be shown in Section 22 standard
water-to-cement (wc) mass ratios for each class of cement were used as defined in API
Specification 10A [13] The main compound compositions of the different types of cements
derived from the oxide analysis test results using the Bogue calculation method [14] are
presented in Table 1 As shown in the table two different types of Class H cements were used a
premium Class H (H-P) and standard Class H Some minor composition variations were
observed between different batches of standard Class H cement (H-I and H-II) produced from the
same plant The particle size distributions of the cements were measured by the laser scattering
technique with dry dispersion methods The average test results (at least 10 measurements were
performed on each type of cement) are presented in Fig 1 The median particle sizes for Classes
A C G H-P and H-II cements were 38 microm 15 microm 34 microm 30 microm and 23 microm respectively
while their specific surface areas calculated from the PSD data (assuming spherical particles and
a cement density of 3150 kgm3) were 356 m
2kg 565 m
2kg 327 m
2kg 394 m
2kg and 323
m2kg respectively The particle size distribution curves for the Class A G and H-P cements are
very similar suggesting that similar grinding procedures may have been adopted in
5
manufacturing these cements Class C cement is ground much finer than the other classes to
achieve a higher specific surface area and enhance early-age reactivity
Table 1 Estimated main compound compositions (by mass percentage) of the different cements
Cement C3S C2S C3A C4AF C2F CaSO4 Free Lime
A 617 120 84 94 0 47 14
C 722 52 22 118 0 47 02
G 626 159 48 109 0 38 02
H-P 479 275 0 162 20 42 03
H-I 665 117 03 134 0 45 03
H-II 703 85 0 128 00 48 03
Figure 1 Particle size distributions of different classes of cements
22 Chemical Shrinkage Test
The total absolute volume of cement hydration product is smaller than the combined
initial volume of the anhydrous cement and water This reduction in volume during hydration is
known as chemical shrinkage Despite the apparently simple principle of chemical shrinkage
measurement there are experimental difficulties that can yield spurious results For example the
6
traditional chemical shrinkage test (ASTM C1608 [15]) involves adding a significant amount of
water on top of a thin specimen (lt 10 mm) to keep it saturated A recent study showed that the
quantity and the composition of the surface water have a significant impact on test results [16]
Increasing the amount of surface water was found to increase the chemical shrinkage rate before
the end of the induction period and to reduce the peak chemical shrinkage rate during later
periods The initial increase is probably due to the accelerated dissolution as a result of more
Ca2+
leaching out of the paste sample (and into the surface water solution) Massive precipitates
of portlandite were observed on the surface of specimens of alite (the main composition of
Portland cement) used for chemical shrinkage measurement [17] Additionally when the same
measuring device was used increasing sample thickness was consistently found to cause a
reduction in chemical shrinkage at later ages (gt15 h) [6 16 17] This thickness effect may be
explained by two hypotheses (1) the reduction in the permeability of the sample might prevent
surface water from filling all the pores in the thicker samples (depercolation) (2) a larger
fraction of the thinner sample is diluted by the surface water resulting in a faster hydration rate
at later ages Costoya [17] found that using a small diameter device with less surface water
(cylindrical flask) systematically gave a higher chemical shrinkage of a given mass of alite paste
than when the same mass of paste was used in a large diameter device with more surface water
(Erlenmeyer flask) even though the former generated a much thicker sample The author also
found that chemical shrinkage measured with the former device was the same as that measured
with a set ground paste sample for a period exceeding 250 h Therefore for cement pastes with
relatively high wc ratios surface water probably has a much stronger effect on the test result
than the thickness of the sample and the latter is probably not a limiting factor
7
In this study chemical shrinkage was measured by a recently developed test apparatus
[18] originally designed to obtain in-situ tensile strength of oilwell cements at different curing
pressures The apparatus allows automatic collection of chemical shrinkage data from samples
cured at different temperatures and pressures In addition by using a large volume of cement
paste (four 51 mm by 170 mm cylinders) the effect of surface water on test results is expected to
be minimal When a hydrostatic curing pressure of 069 MPa was applied tests performed using
hollow cylinders (whose entire annular surfaces were covered by filter paper for water
saturation) with a wall thickness of approximately 10 mm were found to generate the same
results as solid cylinders [18] suggesting sample thickness is not a limiting factor of test results
for this type of test under the conditions being employed The test design of the chemical
shrinkage test series is shown in Table 2 The main shortcoming of this new test apparatus is the
lack of precise temperature control Fortunately as will be discussed later any slight temperature
errors can be accounted for with a scale factor when the test results are correlated with those of
the isothermal calorimetry tests Test data oscillation also seems to be dramatically increased
when heating devices are employed for high temperature tests and such oscillations make it
difficult to calculate reliable derivative curves directly from cumulative experimental data
Uncertainties in test results caused by factors other than temperature fluctuations are estimated to
be less than 3 at the end of 3 d More detailed uncertainty analysis of this experimental
technique is given in [18]
Table 2 Chemical shrinkage tests (test series I test duration = 72 h)
Curing Temperature (degC) Ambienta 406
b 60
b
Cement wc - - -
A 046 CS-A-1 CS-A-2 CS-A-3
C 056 CS-C-1 CS-C-2 CS-C-3
G 044 CS-G-1 CS-G-2 CS-G-3
H-P 038 CS-HP-1 CS-HP-2 CS-HP-3
8
H-I 038 CS-H-1 CS-H-2 a Lab temperature (~24 degC plusmn 28 degC)
b Estimated specimen temperature (will be corrected later based on test results)
23 Isothermal Calorimetry Test
Compared to chemical shrinkage isothermal calorimetry is a more established test
method of measuring overall cement hydration progress In the second test series hydration of
the different types of cements is tracked with an isothermal calorimeter according to standard
test procedures [19] Tests were conducted at atmospheric pressure and three different curing
temperatures Table 3 shows the test design for this test series The temperatures of isothermal
calorimetry tests can be controlled more precisely due to the small sample size (4 g ~ 5 g) For
this technique the average absolute difference between replicate specimens of cement paste is
24x10-5
Wg (cement) with a maximum absolute difference of 000011 Wg (cement) for
measurements conducted between 1 h and 7 d after mixing [20] It should be mentioned that
the samples used in the isothermal calorimetry tests were cured under sealed condition which
is different from the saturated curing condition for the chemical shrinkage tests Although it is
difficult to accurately evaluate the effect of saturation condition on the isothermal calorimet ry
test results due to various experimental difficulties a previous study [5] suggests that
saturation has a negligible effect on tests with relatively high wc ratios (the small differences
in tests results were probably caused by the surface water effect discussed in Section 22)
Table 3 Isothermal calorimetry tests (test series II test duration = 168 h)
Curing Temperature (degC) 25 40 60
Cement wc - - -
A 046 IC-A-1 IC-A-2 IC-A-3
C 056 IC-C-1 IC-C-2 IC-C-3
G 044 IC-G-1 IC-G-2 IC-G-3
H-P 038 IC-HP-1 IC-HP-2 IC-HP-3
H-I 038 IC-H-1 IC-H-2 IC-H-3
9
3 Theoretical Background and Analysis
31 Indirect methods of measuring cement hydration
When the indirect methods are employed to measure cement hydration progress the
relationships between experimental results and the overall degree of hydration can be expressed
as [9 21-25]
0 0 0
( ) ( ) ( )( ) n
n
w t H t CS tt
w H CS (2)
where wn(t) and wn0 are the non-evaporable water content at time t and at complete hydration
respectively (typically in gg cement) H(t) and H0 are the cumulative heat evolution at time t and
at complete hydration respectively (typically in Jg cement) and CS(t) and CS0 are the total
chemical shrinkage at time t and at complete hydration respectively (typically in mLg cement)
wn0 depends on the molar masses of the hydration products while H
0 depends on the enthalpy
changes of the chemical reactions both of which are expected to remain constant as long as the
chemical formulae of the hydration products do not change However CS0 depends on the molar
volumes of water and the hydration products and hence varies with both temperature and
pressure According to Eq (2) since wn0 and H
0 remain invariant (at least within the temperature
and pressure range used in this study) the dependency of CS0 on temperature and pressure can
be approximately evaluated by studying the correlations between wn(t) H(t) and CS(t) at various
curing conditions Studies have shown that the ratio of CS(t) to wn(t) evaluated at discrete data
points decreases with increasing temperature [6 10] suggesting that CS0 decreases with
increasing temperature The focus of this study is the correlation between CS(t) and H(t) both of
which have been measured continuously
10
It should be pointed out that the indirect methods only give a gross approximation to the
hydration rate of cement because hydration of the different phases also progresses at different
rates If we ignore the interactions between different clinker phases and the phase changes of
different hydration products during hydration then the total heat of hydration and chemical
shrinkage may be correlated with the degree of hydration of each individual clinker phase as
follows
3 3 3 2 2 2 3 3 3 4 4 4C S C S C S C S C S C S C A C A C A C AF C AF C AFH t a p t a p t a p t a p t (3)
3 3 3 2 2 2 3 3 3 4 4 4C S C S C S C S C S C S C A C A C A C AF C AF C AFCS t b p t b p t b p t b p t (4)
where ai and bi are the cumulative heat evolution and the total chemical shrinkage respectively
associated with the complete hydration of 1 g of clinker phase i Eqs (3) and (4) can be used to
estimate the parameters associated with the complete hydration condition in Eq (2) using the
sums
0 0 i i i iH a p CS b p (5)
Eq (2) is only exact either when all the different clinker phases hydrate at the same rate or when
the coefficients (ie airsquos and birsquos) associated with different phases are the same neither of which
is true [26 27] Nevertheless Eq (2) is still widely used as acceptable approximations [9 21-
25] In addition if the ratios of the coefficients associated with different clinker phases are
constant that is
3 32 4
3 2 3 4
C S C AC S C AF
C S C S C A C AF
a aa a
b b b b (6)
then the following part of Eq (2) will still be exact
0 0
( ) ( )H t CS t
H CS (7)
11
Accurate determination of the coefficients (ie ai and bi) for each individual phase is challenging
because complete hydration of all clinker phases is difficult to achieve and estimation of the
phase compositions (ie pi) are usually not accurate Recent estimates (Table 4) suggest that Eq
(6) is approximately true for three out of four main clinker phases (C3S C3A C4AF) Therefore
Eq (7) should provide a reasonable approximation especially for early age hydration which is
typically dominated by C3S and C3A
Table 4 Coefficients for estimating the parameters at the complete hydration condition
Phase C3S C2S C3A C4AF Reference
ai (Jg) 510 247 1356 427 [28]
bi (mLg at 25 degC) 00596 00503 013 00469 [9]
aibi 8557 4911 10431 9104
Obtained by multi-linear regression analysis from experimental data of 21 different
cements slightly different from theoretical values calculated from standard enthalpy of
formation [28 29] which depend on the chemical formulae of hydration products
32 A scale factor model for the effect of curing conditions on cement hydration
When the time dependence of the degree of hydration of cement is represented by an
unknown function the effect of curing temperature and pressure can be modelled by
incorporating a scale factor C into that function [12] For example if hydration at the reference
temperature Tr and pressure Pr is represented by the following functions
Integral curve ( ) Derivative curve ( )
r r r rT P T Pt d dt t (8)
then the transformed functions at temperature T and pressure P are
Integral curve ( ) ( )
Derivative curve ( ) ( )
r r
r r
T P T P
T P T P
t Ct
d dt t C Ct
(9)
12
The scale factor is similar to the coefficient used to compute the equivalent age of a specified
curing condition when applying the maturity method to estimate concrete strength (ASTM
C1074 [30]) It is important to note that both the scale factor model and the equivalent age
method assume the hydration mechanism do not change over the ranges of temperature and
pressure studied The dependence of the scale factor on curing temperature can be modeled by
the following equation [12]
Dagger
1 1exp
r r
a rT T P P
r
E V P PC
R T T R T T
(10)
where Ea is the apparent activation energy (Jmol) ∆VDagger is the apparent activation volume
(m3mol) R is the universal gas constant (8314 J(molK)) T and P are the temperature (K) and
pressure (Pa) of an arbitrary curing condition while Tr and Pr are the temperature (K) and
pressure (Pa) of the reference curing condition C is the scale factor associated with temperature
change from Tr to T and pressure change from Pr to P
One of the most important advantages of the scale factor model is that it is very
straightforward and easy to use The physical meaning of the model is that the hydration rate at
any curing condition is increased or decreased by a factor of C compared with that at the
reference curing condition at the same degree of hydration Probably due to the different
mechanism of hydration during the very early period (before the end of the induction period) it
is sometimes necessary to offset the predicted hydration kinetics curve using the scale factor
model to generate a better agreement with the experimental curve especially when their curing
temperatures are different The offset is not necessary for tests performed at different curing
pressures in the range from 07 MPa to 517 MPa [12] Therefore a more accurate representation
of the relationship between the hydration kinetics curves at temperatures T and Tr (for the same
curing pressure) is
13
0
0
Integral Curves ( )
Derivative Curves ( )
r r
r r r
T T T T
T T T T T T
t C t t
t C C t t
(11)
where T and rT
are the functions representing the time dependence of the degree of hydration
at temperatures T and Tr respectively t0 is the offset time which appears to increase with
increasing differences between Tr and T rT TC is the scale factor related to the temperature
differences which is the same as defined in Eq(10) at constant pressure
1 1
expr
aT T
r
EC
R T T
(12)
33 Correlation between Heat of hydration and Chemical shrinkage
If we consider an isothermal calorimetry test performed at temperature TIC and a
chemical shrinkage test performed at temperature TCS the degree of hydration measured by the
former can be expressed as
0
( )IC
IC
T
T
H tt
H
(13)
while that measured by the latter can be expressed as
0
( )CS
CS
T
T
CS
CS tt
CS T
(14)
Note that as already discussed CS0 is a function of temperature Employing the scale factor
model one can obtain
0IC CS CS ICT T T Tt C t t
(15)
where the scale factor is related to the temperature difference between the two types of tests by
the following equation
14
1 1
expCS IC
aT T
CS IC
EC
R T T
(16)
By combining Eqs (13) - (15) the cumulative heat evolution H(t) can be related to the total
chemical shrinkage CS(t) by the following equation
0
00( )
IC CS CS ICT T T T
CS
HH t CS C t t
CS T
(17)
4 Test Results and Discussion
41 Verifications of the scale factor model
One of the most important assumptions of the scale factor model is that the normalized
rate of hydration vs degree of hydration curve of a given cement paste is invariant with curing
condition (for isothermal and isobaric tests) The assumption has been verified for different types
of cement in the pressure range from 07 to 517 MPa using chemical shrinkage test data [12]
Oscillations of chemical shrinkage test results at high temperatures made it difficult to derive the
rate of hydration accurately Therefore further validation of this assumption is desirable for
different curing temperatures with the heat evolution data Based on the values listed in Table 4
and assuming C2F generates the same amount of heat as C4AF on the same mass basis the
cumulative heat generated at complete hydration (H0) was estimated to be 4977 Jg (cement)
4611 Jg 4701 Jg 4292 Jg and 3859 Jg for Class A C G H-I and H-P cements
respectively The hydration progress of these different types of cement can be obtained by
normalizing the heat evolution data by their respective H0
values
It should be pointed out that the scale factor model was developed for a single reaction
process assuming that the curing condition only changes the rate of the reaction but not its
nature In reality Portland cement hydration is a much more complex process with all the
15
different clinker phases having different reaction rates as well as different sensitivities to curing
temperature changes (ie activation energies) The composition of the hydration products may
also change if curing temperature changes significantly Therefore the model can be applied
only approximately to analyze Portland cement hydration Figure 2 shows the rate of hydration
vs degree of hydration derived from the heat evolution data of Class H-I cement before and after
normalization While the normalized data at different curing temperatures coincide relatively
well during early and late periods slight deviations are observed during the middle period (ie
for degrees of hydration approximately ranging from 02 to 05) Figure 3 shows the normalized
rate of hydration vs degree of hydration of the four other types of cement obtained at different
curing temperatures Similar convergence behaviors were observed except for the Class A and
Class C cements at 60 degC both of which diverge significantly from their behavior at 25 degC and
40 degC For all the different types of cement the divergences of the normalized kinetics curves
becomes more significant as the temperature difference increases due to the different
temperature sensitivities of different phases The normalized hydration data at 25 degC and 40 degC
appear to show better compliance with the model indicating that the scale factor model is more
accurate for relatively small temperature changes
16
0 02 04 06 080
002
004
006
008
01
012
014
Degree of hydration
Rate
of
hydra
tion (
h)
0 02 04 06 080
02
04
06
08
1
Degree of hydration
Norm
aliz
ed r
ate
of
hydra
tion
25C
40C
60C
25C
40C
60C
Figure 2 Effect of curing temperature on hydration rate as a function of degree of hydration
(Class H-I cement wc = 038)
0 02 04 06 080
02
04
06
08
1
Norm
aliz
ed r
ate
of
hydra
tion
0 02 04 06 080
02
04
06
08
1
0 02 04 06 080
02
04
06
08
1
Degree of hydration
Norm
aliz
ed r
ate
of
hydra
tion
0 02 04 06 080
02
04
06
08
1
Degree of hydration
25C
40C
60C
25C
40C
60C
25C
40C
60C
25C
40C
60C
Class CClass A
Class G Class H-P
Figure 3 Normalized rate of hydration vs degree of hydration of different cements
According to Eq (11) the scale factor relating the hydration rates at two different curing
temperatures can be estimated by applying basic coordinate transformation rules to transform the
17
hydration kinetics curve at Tr to achieve the best agreement with that at T (the method is referred
to as the best fit method) Figure 4 shows the results of transforming the experimental hydration
data obtained at 25 degC and 40 degC to fitpredict those at higher curing temperatures for Class C
cement Although it seems impossible to achieve perfect agreement for the entire curing period
the predictions are in good agreements with the actual experimental results during the period up
to the first peak which is mainly associated with C3S hydration The second peak probably
includes the contribution from C3A hydration which reportedly has a higher activation energy
than the overall value for Portland cement [31 32] Therefore the transformed hydration data
from lower temperatures typically underestimate the second peak (Figure 4) Applying a
different scale factor for each individual phase in Portland cement would perhaps generate a
better fit Unfortunately it is not yet possible to accurately and reliably measure the hydration
progress of the different phases separately
0 20 40 60 800
02
04
06
08
1
Time (h)
Degre
e o
f hydra
tion
0 5 10 150
005
01
015
02
025
Time (h)
Rate
of
hydra
tion (
h)
Measured
Transformed from 25C
Transformed from 40C
Measured
Transformed from 25C
Transformed from 40C
25C40C
25C40C
60C
60C
Figure 4 Measured and predicted hydration kinetics at different curing temperatures by
coordinate transformations (Class C cement wc = 056)
Figure 5 shows the measured and predicted hydration kinetics curves for the other types
of cement used in this study The predictions are most accurate for the Class H-I cement which
18
has almost no C3A and least accurate for the Class A cement which has the highest C3A
content This further confirms the hypothesis that a higher C3A activation energy can skew the
model results It is also interesting to note that the transformed data from lower temperatures
typically overestimate slightly the degree of hydration at later ages with the exception of Class
H-P cement for which the opposite is true Table 5 lists the offset time and scale factor as well
as the apparent activation energy (calculated from the scale factor using Eq (12)) associated with
each temperature change The constants are obtained by trial and error to provide the best
agreements as shown in Figures 4 and 5 For comparison purposes Table 5 also lists the scale
factors and apparent activation energies calculated with the peak hydration rate method as
proposed in a previous study [12] The constants obtained by the two different methods generally
agree well with each other for relatively small temperature changes (from 25degC to 40 degC and
from 40degC to 60 degC) but may differ quite noticeably for the larger temperature change (from 25
degC to 60 degC) The apparent activation energies obtained in different temperature ranges appear to
decrease with increasing temperature except for Class A cement for which the opposite is true
The apparent activation energies obtained in this study are also found to be much lower than
those calculated from chemical shrinkage test data [12] The latter are probably less accurate due
to the inadequate temperature control of the tests and errors associated with estimating CS0 at
different temperatures (H0 is assumed to be independent of temperature)
19
0 50 100 1500
01
02
03
04
05
06
07
Time (h)
Degre
e o
f hydra
tion
0 50 100 1500
01
02
03
04
05
06
07
Time (h)
Degre
e o
f hydra
tion
0 50 100 1500
02
04
06
08
Time (h)
Degre
e o
f hydra
tion
0 50 100 1500
02
04
06
08
Time (h)
Degre
e o
f hydra
tion
Measured Transformed from 25C Transformed from 40C
40C
60C
60C
40C
60C
40C
25C25C
25C
60C
40C
Class H-P Class H-I
Class GClass A
25C
Figure 5 Measured and predicted hydration kinetics of different cements at different curing
temperatures by coordinate transformations
42 Correlations between chemical shrinkage and heat of hydration of cement
Just as the hydration kinetics curve at a reference temperature can be transformed to fit
the curves obtained at other temperatures the chemical shrinkage curve can be transformed to fit
the heat evolution curve (and vice versa) according to their correlations developed in Section 33
Following Eq (17) the correlation factor H0CS
0(TCS) the scale factor
CS ICT TC and the offset
time t0 can all be estimated by transforming the chemical shrinkage curve to achieve the best
agreement with the heat evolution curve Since the scale factor model is more accurate for
smaller temperature changes the temperature of the chemical shrinkage test should be close to
that of the isothermal calorimetry test to obtain more reliable estimates Figures 6 shows the heat
20
evolution curves of the Class H-P cement measured at 25 degC and the transformed chemical
shrinkage curves (measured at lab temperature) that exhibit the best fit The two curves agree
excellently with each other except during very early stages (before the acceleration period)
where the hydration rate measured by chemical shrinkage seems to be higher than that measured
by heat evolution
Table 5 Activation energies obtained from different analysis methods
Cement Tr - T
(degC)
Best fit method Peak hydration rate method Ea (kJmol)
(from [12]) t0 (h) rT TC Ea (kJmol) rT TC Ea (kJmol)
A
25-40 04 21 384 228 427
526 25-60 08 55 402 704 461
40-60 08 29 462 309 489
C
25-40 075 218 403 223 415
488 25-60 1 48 370 548 401
40-60 06 22 342 246 390
G
25-40 09 23 431 237 447
50 25-60 1 55 402 576 413
40-60 05 22 342 243 385
H-P
25-40 1 215 396 212 389
425 25-60 15 45 355 453 356
40-60 11 21 322 214 330
H-I
25-40 1 226 422 226 422
443 25-60 12 48 370 554 404
40-60 07 21 322 245 389
21
0 10 20 30 40 50 60 70 800
1
2
3x 10
-3
Time (h)
Heat
evolu
tion r
ate
(W
g c
em
ent)
0 10 20 30 40 50 60 70 800
100
200
300
Cum
ula
tive h
eat
evolu
tion (
Jg
cem
ent)
Measured heat evolution
Transformed from chemical shrinkage
Figure 6 Heat evolution curves vs transformed chemical shrinkage curves
(Class H-P cement wc = 038 25 degC)
Figure 7 shows the heat evolution rate curves of the other types of cement measured at 25
degC and their corresponding best-fit transformed chemical shrinkage curves Similar to the Class
H-P cement excellent agreement is obtained between the heat evolution curve and the
transformed chemical shrinkage curve for the Class H-I cement However for cements that
contain significant C3A the agreements between the two types of curves are somewhat poorer
especially around the main hydration peaks The hydration of C3A first produces ettringite during
the hydration peak which then further reacts with excess C3A and transforms to calcium
monosulfoaluminate at later ages [26 28] The test results show that the second peak rate
(probably caused by C3A hydration) measured by chemical shrinkage is always higher than that
measured by heat evolution and that the rate measured by the former also decreases faster during
the deceleration stage Therefore the ratio of chemical shrinkage to heat evolution associated
with C3A hydration is higher than that associated with C3S hydration during the initial reaction
22
(to form ettringite) and probably the reverse is true during the later reaction (to form
monosulfoaluminate) It should be noted that the ratio of a3 to b3 associated with C3A hydration
as shown in Table 4 represents the long-term results of some average cements and is not strictly
applicable here
0 20 40 600
1
2
3
4
5x 10
-3
Time (h)
Heat
evolu
tion r
ate
(W
g c
em
ent)
0 20 40 600
1
2
3
4
5
6x 10
-3
Time (h)
Heat
evolu
tion r
ate
(W
g c
em
ent)
0 20 40 600
1
2
3
4
5x 10
-3
Time (h)
Heat
evolu
tion r
ate
(W
g c
em
ent)
0 20 40 600
1
2
3x 10
-3
Time (h)
Heat
evolu
tion r
ate
(W
g c
em
ent)
Measured heat evolution Transformed from chemical shrinkage
Class CClass A
Class G Class H-I
Figure7 Heat evolution vs transformed chemical shrinkage
for the different types of cement (derivative curves)
The integral curves of heat evolution of different cements cured at different temperatures
are compared with the transformed chemical shrinkage curves (measured at similar
temperatures) in Figure 8 In general excellent agreements can be obtained between the integral
hydration kinetics curves obtained from the two different methods The constants used to
transform the chemical shrinkage curves to fit the heat evolution curves including the correlation
23
factor the scale factor and the offset time are listed in Table 6 The cause of the offset time
(primarily observed for ambient temperature tests) is not yet clear It may be associated with
variations of the duration of the induction periods which tend to be affected by many different
factors that are difficult to control Following Eq (16) the temperature of the chemical shrinkage
test (TCS) can be estimated from the more-precisely-measured temperature of the isothermal
calorimetry test (TIC) by using the scale factor and the previously obtained activation energies in
the 25 degC to 60 degC temperature range (Table 5) As shown in Table 6 the calculated sample
temperatures of the chemical shrinkage tests are slightly higher than the previously estimated
values (Table 3) To further demonstrate that the scale factors are indeed associated with the
slight temperature differences between chemical shrinkage tests and isothermal calorimetry tests
one of the chemical shrinkage tests (Test CS-H-2) was performed by reducing the target
temperature (set with the temperature controllers) by 28 degC (5 degF) The obtained chemical
shrinkage curve of this particular test is found to be directly proportional to the heat evolution
curve (ie C = 1)
24
0 20 40 60 800
50
100
150
200
250
300
350
Time (h)
Cum
ula
tive h
eat
evolu
tion (
Jg
cem
ent)
0 20 40 60 800
100
200
300
400
Time (h)
Cum
ula
tive h
eat
evolu
tion (
Jg
cem
ent)
0 20 40 60 800
50
100
150
200
250
300
350
Time (h)
Cum
ula
tive h
eat
evolu
tion (
Jg
cem
ent)
0 20 40 60 800
50
100
150
200
250
300
Time (h)
Cum
ula
tive h
eat
evolu
tion (
Jg
cem
ent)
Measured heat evolution Transformed from chemical shrinkage
60C
40C
25C
60C
40C
25C
60C
40C
25C
60C
40C
25C
Class A Class C
Class G Class H-P
Figure 8 Heat evolution curves vs transformed chemical shrinkage curves for different types of
cement at different curing temperatures (integral curves)
25
Table 6 Best-fit constants for correlating chemical shrinkage and heat evolution test results and
the respective temperatures of different tests (Refer to Eq (17))
Test No t0 (h) CS ICT TC
H0CS
0(TCS)
(JmL) TIC (degC) TCS (degC)
CS-A-1 IC-A-1 1 109 7600 25 234
CS-C-1 IC-C-1 04 085 7800 25 283
CS-G-1 IC-G-1 07 095 7700 25 259
CS-HP-1 IC-HP-1 12 107 7500 25 236
CS-H-1 IC-H-1 1 111 8000 25 229
CS-A-2 IC-A-2 0 084 8400 40 436
CS-C-2 IC-C-2 0 09 8350 40 423
CS-G-2 IC-G-2 0 086 8850 40 431
CS-HP-2 IC-HP-2 06 09 8700 40 424
CS-H-2 IC-H-2 0 1 8850 40 400
CS-A-3 IC-A-3 0 09 9750 60 624
CS-C-3 IC-C-3 0 09 10100 60 627
CS-G-3 IC-G-3 0 091 9750 60 622
CS-HP-3 IC-HP-3 0 085 10200 60 643
At lab temperature (approximately 25 degC) the correlation factor between heat evolution
and chemical shrinkage (H0CS
0) for the different cements is found to range from 7500 JmL to
8000 JmL well within the previously reported range of 6500 JmL to 8500 JmL [33 34] The
correlation factor increases with increasing curing temperature Since H0 is independent of
curing temperature the results suggest that CS0 decreases with increasing temperature consistent
with previous studies [6 10] In the relatively small temperature range investigated (25 degC to 60
degC) the variations of CS0H
0 and H
0CS
0 with temperature can both be approximated by linear
models Figure 9 shows the dependence of CS0H
0 on curing temperature for different types of
cement The least square fits of all data points indicate the average rate of change to be -000076
mLkJ per degC for CS0H
0 and +58 JmL per degC for H
0CS
0 When normalized to the values at 25
degC the linear reduction rate of CS0 with increasing temperature is determined to be 057 065
058 066 and 057 per degC for Class A C G H-P and H-I cements respectively
26
suggesting an average reduction rate of 060 (with a standard deviation of 0046 ) per degC
For comparison a reduction rate of 078 per degC may be obtained from test data of Zhang et al
[10] in the same temperature range where the correlations between wn0 and CS
0 of Class H
cement were investigated
20 30 40 50 60 70009
01
011
012
013
014
Curing temperature (C)
CS
0H
0 (
mLk
J)
Class A
Class C
Class G
Class H-P
Class H-I
Figure 9 Dependence of correlation factor (CS0H
0) on curing temperature
5 Conclusions
The hydration kinetics of different types of cement cured at different temperatures has
been evaluated by both the traditional isothermal calorimetry test method and a newly developed
chemical shrinkage test method A scale factor model that can be used to predict the effect of
curing temperature on cement hydration kinetics previously validated with chemical shrinkage
test data is further discussed and validated with the heat evolution test data Due to the fact that
the different compounds in cement hydrate at different rates and have different temperature
sensitivities the model is found to be more accurate for cement with simpler compositions (eg
27
no or very low C3A content) andor for smaller temperature changes (eg le 15 degC) The scale
factor model also introduces a new method of estimating the apparent activation energies of
Portland cement (ie the best-fit method) The apparent activation energies of Class A C G H-P
and H-I cements determined using the heat of hydration data in the temperature range of 25 degC to
60 degC are 402 kJmol 37 kJmol 402 kJmol 355 kJmol and 37 kJmol respectively
A correlation study of chemical shrinkage and isothermal calorimetry test data indicate
that total chemical shrinkage is proportional to cumulative heat evolution if the two tests are
conducted on the same cement paste at the same curing temperature in agreement with previous
research The scale factor model discussed in this study can be used to account for any
unmeasured small temperature differences The proportionality constant namely the ratio of total
chemical shrinkage to total heat release at complete hydration (CS0H
0) varies slightly with
cement composition and decreases with increasing curing temperature If H0 is assumed to be
independent of curing temperature then CS0 decreases approximately linearly with increasing
temperature at a rate of 0600 plusmn 0046 per degC from the reference values at 25 degC for the
different cements used in this study Compared to C3S hydration early C3A hydration (typically
at the main hydration peak) seems to create a higher ratio of chemical shrinkage to heat
evolution while later C3A hydration (typically during the deceleration period) appears to create a
lower ratio As a result the rate of chemical shrinkage curve typically has a slightly different
shape than the heat flow curve for cements that contain significant C3A
Acknowledgements
Financial support for this study was provided by Halliburton Energy Services The
continuous support from Dr Lewis Norman and Dr Ron Morgan is cordially appreciated The
authors would also like to thank Mr David Meadows for his help in developing the chemical
28
shrinkage test apparatus and Ms Donna Chen for her help in performing part of the experimental
work
References
[1] Parrott LJ M Geiker WA Gutteridge D Killoh Monitoring Portland cement hydration
comparison of methods Cement and Concrete Research 20 (1990) pp 919-926
[2] Gutteridge WA and JA Dalziel Filler Cement The Effect of the Secondary Component
on the Hydration of Portland Cement Part I A Fine Non-Hydraulic Filler Cement and Concrete
Research 20 (1990) pp 778-782
[3] Bentz DP A three-dimensional cement hydration and microstructure program I hydration
rate heat of hydration and chemical shrinkage NISTIR 5756 US Department of Commerce
Washington DC 1995
[4] Escalante-Garcia JI Nonevaporable water from neat OPC and replacement materials in
composite cements hydrated at different temperatures Cement and Concrete Research 33 (11)
(2003) pp 1883-1888
[5] Lura P F Winnefeld S Klemm Simultaneous Measurements of Heat of Hydration and
Chemical Shrinkage on Hardening Cement Pastes Journal of Thermal Analysis and Calorimetry
101 (3) (2010) pp 925-932
[6] Geiker M Studies of Portland cement hydration measurements of chemical shrinkage and a
systematic evaluation of hydration curves by means of the dispersion model PhD Thesis
Technical University of Denmark 1983
[7] Mounanga P V Baroghel-Bouny A Loukili A Khelidj Autogenous deformations of
cement pastes Part I Temperature effects at early age and micro-macro correlations Cement
and Concrete Research 36 (2006) 110-122
29
[8] Peethamparan S E Weissinger J Vocaturo J Zhang G Scherer Monitoring chemical
shrinkage using pressure sensors Advances in the Material Science of Concrete ACI SP-270
Vol 7 (2010) 77-88
[9] Pang X and C Meyer Cement chemical shrinkage as measure of hydration kinetics and its
relationship with nonevaporable water ACI Materials Journal 109 (3) (2012) pp 341-352
[10] Zhang J EA Weissinger S Peethamparan GW Scherer Early Hydration and Setting of
Oil Well Cement Cement and Concrete Research 40 (2010) pp 1023-1033
[11] Scherer GW J Zhang JJ Thomas Nucleation and growth models for hydration of
cement Cement and Concrete Research 42 (2012) 982-993
[12] Pang X C Meyer R Darbe GP Funkhouser Modeling the effect of curing temperature
and pressure on cement hydration kinetics ACI materials journal accepted
[13] API Specification 10A Specification for Cements and Materials for Well Cementing
American Petroleum Institute 2010 38 pp
[14] ASTM C150C150M ndash 09 Standard Specification for Portland Cement ASTM
International West Conshohocken PA 2009 10 pp
[15] ASTM C1608 Standard Test Method for Chemical Shrinkage of Hydraulic Cement Paste
ASTM International West Conshohocken PA 2007 4 pp
[16] Sant G P Lura J Weiss Measurement of Volume Change in Cementitious Materials at
Early Ages Review of Testing Protocols and Interpretation of Results Journal of the
Transportation Research Record V 1979 (2006) pp 21-29
[17] Costoya M Kinetics and microstructural investigation on the hydration of tricalcium
silicate Doctoral Thesis Eacutecole Polytechnique Feacutedeacuterale de Lausanne Switzerland 2008
30
[18] Pang X Effects of curing temperature and pressure on the chemical physical and
mechanical properties of Portland cement PhD Dissertation Columbia University New York
2011
[19] ASTM C1679 Standard Practice for Measuring Hydration Kinetics of Hydraulic
Cementitious Mixtures Using Isothermal Calorimetry ASTM International West
Conshohocken PA 2009
[20] Bentz DP and CF Ferraris Rheology and setting of high volume fly ash mixtures
Cement and Concrete Composites 32 (4) (2010) pp 265-270
[21] Mills RH Factors influencing cessation of hydration in water cured cement pastes Special
Report No 90 in Proceedings of the Symposium on the Structure of Portland Cement Paste and
Concrete Highway Research Board Washington DC 1966 pp 406-424
[22] Mounanga P A Khelidj A Loukili V Baroghel-Bouny Predicting Ca(OH)2 Content and
chemical shrinkage of hydrating cement pastes using analytical approach Cement and Concrete
Research 34 (2004) pp 255-265
[23] Swaddiwudhipong S D Chen M H Zhang Simulation of the exothermic hydration
process of Portland cement Advances in Cement Research 14 (2) (2002) pp 61-69
[24] Schindler AK and KJ Folliard Heat of hydration models for cementitious materials ACI
Materials Journal 102 (1) (2005) pp 24-33
[25] Poole JL KA Riding KJ Folliard MCG Juenger AK Schindler Methods for
calculating activation energy for Portland cement ACI Materials Journal 104 (1) (2007) pp 303-
311
[26] Hewlett PC Learsquos Chemistry of Cement and Concrete 4th edition Butterworth-
Heinemann Oxford England 1998
31
[27] Escalante-Garcia JI and JH Sharp Effect of temperature on the hydration of the main
clinker phases in Portland cements Part I neat cements Cement and Concrete Research 28 (9)
(1998) pp 1245-1257
[28] Taylor HFW Cement Chemistry 2nd edition Thomas Telford London UK 1997
[29] Bentz DP T Barret I de la Varga J Weiss Relating compressive strength to heat release
in mortars Advances in Civil Engineering Materials accepted
[30] ASTM C1074 Standard Practice for Estimating Concrete Strength by the Maturity Method
ASTM International West Conshohocken PA 201010 pp
[31] Bushnell-Watson SM The effect of temperature upon the setting behaviour of refractory
CAC PhD Thesis University of Sheffield 1987
[32] Banfill PFG Superplasticizers for Ciment Fondu Part 2 effect of temperature on the
hydration reaction Advances in Cement Research 7 (1995) pp 151ndash157
[33] Bentz D G Sant J Weiss Early-age properties of cement-based materials I Influence of
cement fineness ASCE Journal of Materials in Civil Engineering 20 (7) (2008) pp 502-508
[34] Bentz DP Blending different fineness cements to engineer the properties of cement-based
materials Magazine of Concrete Research 62 (5) (2010) pp 327-338
3
recent years [6-9] and are now also frequently used to study cement hydration mechanisms [9-
12] Therefore it is important to investigate the differences and similarities between these two
different methods which may also help us gain further insights about the cement hydration
process The experimental test methods and detailed test plan of this study are described in the
next section The theoretical analysis regarding the correlation between heat of hydration and
chemical shrinkage is presented in Section 3 Because temperature control of the chemical
shrinkage tests performed in this study was not very accurate a method of correcting the
temperature differences between isothermal calorimetry tests and chemical shrinkage tests is also
proposed in Section 3 based on a scale factor model developed earlier The scale factor model
was developed to simulate the effect of curing temperature and pressure on cement hydration
kinetics and has been preliminarily validated using chemical shrinkage test data [12] When the
hydration kinetics curve of a reference curing temperature is known for a given cement paste the
scale factor model can be used to estimate the hydration kinetics curve for a given temperature or
the temperature of a given hydration kinetics curve In section 41 the model is further validated
with isothermal calorimetry test data from this study Since the rate of hydration is measured
directly in these tests the accuracy and limitations of the scale factor model can be observed and
discussed in greater detail In section 42 it is shown that the hydration kinetics measured by
chemical shrinkage can be correlated excellently with those measured by isothermal calorimetry
by applying the proposed model in this study
2 Materials and Methods
21 Materials
4
Oilwell cements are based upon Portland cement but manufactured to a higher level of
consistency from one production batch to another There are no substantial differences between
oilwell cements and ordinary Portland cements except for the fact that some Class H (API
Specification 10A [13]) cement may have near zero C3A content API Classes A B and C
cements are similar to ASTM Types I II and III cements respectively The hydration kinetics of
four different classes of oilwell cements namely Class A C G and H were investigated at
different curing temperatures in this study All slurries (cement pastes) were prepared with de-
aerated water and cement only with no additives As will be shown in Section 22 standard
water-to-cement (wc) mass ratios for each class of cement were used as defined in API
Specification 10A [13] The main compound compositions of the different types of cements
derived from the oxide analysis test results using the Bogue calculation method [14] are
presented in Table 1 As shown in the table two different types of Class H cements were used a
premium Class H (H-P) and standard Class H Some minor composition variations were
observed between different batches of standard Class H cement (H-I and H-II) produced from the
same plant The particle size distributions of the cements were measured by the laser scattering
technique with dry dispersion methods The average test results (at least 10 measurements were
performed on each type of cement) are presented in Fig 1 The median particle sizes for Classes
A C G H-P and H-II cements were 38 microm 15 microm 34 microm 30 microm and 23 microm respectively
while their specific surface areas calculated from the PSD data (assuming spherical particles and
a cement density of 3150 kgm3) were 356 m
2kg 565 m
2kg 327 m
2kg 394 m
2kg and 323
m2kg respectively The particle size distribution curves for the Class A G and H-P cements are
very similar suggesting that similar grinding procedures may have been adopted in
5
manufacturing these cements Class C cement is ground much finer than the other classes to
achieve a higher specific surface area and enhance early-age reactivity
Table 1 Estimated main compound compositions (by mass percentage) of the different cements
Cement C3S C2S C3A C4AF C2F CaSO4 Free Lime
A 617 120 84 94 0 47 14
C 722 52 22 118 0 47 02
G 626 159 48 109 0 38 02
H-P 479 275 0 162 20 42 03
H-I 665 117 03 134 0 45 03
H-II 703 85 0 128 00 48 03
Figure 1 Particle size distributions of different classes of cements
22 Chemical Shrinkage Test
The total absolute volume of cement hydration product is smaller than the combined
initial volume of the anhydrous cement and water This reduction in volume during hydration is
known as chemical shrinkage Despite the apparently simple principle of chemical shrinkage
measurement there are experimental difficulties that can yield spurious results For example the
6
traditional chemical shrinkage test (ASTM C1608 [15]) involves adding a significant amount of
water on top of a thin specimen (lt 10 mm) to keep it saturated A recent study showed that the
quantity and the composition of the surface water have a significant impact on test results [16]
Increasing the amount of surface water was found to increase the chemical shrinkage rate before
the end of the induction period and to reduce the peak chemical shrinkage rate during later
periods The initial increase is probably due to the accelerated dissolution as a result of more
Ca2+
leaching out of the paste sample (and into the surface water solution) Massive precipitates
of portlandite were observed on the surface of specimens of alite (the main composition of
Portland cement) used for chemical shrinkage measurement [17] Additionally when the same
measuring device was used increasing sample thickness was consistently found to cause a
reduction in chemical shrinkage at later ages (gt15 h) [6 16 17] This thickness effect may be
explained by two hypotheses (1) the reduction in the permeability of the sample might prevent
surface water from filling all the pores in the thicker samples (depercolation) (2) a larger
fraction of the thinner sample is diluted by the surface water resulting in a faster hydration rate
at later ages Costoya [17] found that using a small diameter device with less surface water
(cylindrical flask) systematically gave a higher chemical shrinkage of a given mass of alite paste
than when the same mass of paste was used in a large diameter device with more surface water
(Erlenmeyer flask) even though the former generated a much thicker sample The author also
found that chemical shrinkage measured with the former device was the same as that measured
with a set ground paste sample for a period exceeding 250 h Therefore for cement pastes with
relatively high wc ratios surface water probably has a much stronger effect on the test result
than the thickness of the sample and the latter is probably not a limiting factor
7
In this study chemical shrinkage was measured by a recently developed test apparatus
[18] originally designed to obtain in-situ tensile strength of oilwell cements at different curing
pressures The apparatus allows automatic collection of chemical shrinkage data from samples
cured at different temperatures and pressures In addition by using a large volume of cement
paste (four 51 mm by 170 mm cylinders) the effect of surface water on test results is expected to
be minimal When a hydrostatic curing pressure of 069 MPa was applied tests performed using
hollow cylinders (whose entire annular surfaces were covered by filter paper for water
saturation) with a wall thickness of approximately 10 mm were found to generate the same
results as solid cylinders [18] suggesting sample thickness is not a limiting factor of test results
for this type of test under the conditions being employed The test design of the chemical
shrinkage test series is shown in Table 2 The main shortcoming of this new test apparatus is the
lack of precise temperature control Fortunately as will be discussed later any slight temperature
errors can be accounted for with a scale factor when the test results are correlated with those of
the isothermal calorimetry tests Test data oscillation also seems to be dramatically increased
when heating devices are employed for high temperature tests and such oscillations make it
difficult to calculate reliable derivative curves directly from cumulative experimental data
Uncertainties in test results caused by factors other than temperature fluctuations are estimated to
be less than 3 at the end of 3 d More detailed uncertainty analysis of this experimental
technique is given in [18]
Table 2 Chemical shrinkage tests (test series I test duration = 72 h)
Curing Temperature (degC) Ambienta 406
b 60
b
Cement wc - - -
A 046 CS-A-1 CS-A-2 CS-A-3
C 056 CS-C-1 CS-C-2 CS-C-3
G 044 CS-G-1 CS-G-2 CS-G-3
H-P 038 CS-HP-1 CS-HP-2 CS-HP-3
8
H-I 038 CS-H-1 CS-H-2 a Lab temperature (~24 degC plusmn 28 degC)
b Estimated specimen temperature (will be corrected later based on test results)
23 Isothermal Calorimetry Test
Compared to chemical shrinkage isothermal calorimetry is a more established test
method of measuring overall cement hydration progress In the second test series hydration of
the different types of cements is tracked with an isothermal calorimeter according to standard
test procedures [19] Tests were conducted at atmospheric pressure and three different curing
temperatures Table 3 shows the test design for this test series The temperatures of isothermal
calorimetry tests can be controlled more precisely due to the small sample size (4 g ~ 5 g) For
this technique the average absolute difference between replicate specimens of cement paste is
24x10-5
Wg (cement) with a maximum absolute difference of 000011 Wg (cement) for
measurements conducted between 1 h and 7 d after mixing [20] It should be mentioned that
the samples used in the isothermal calorimetry tests were cured under sealed condition which
is different from the saturated curing condition for the chemical shrinkage tests Although it is
difficult to accurately evaluate the effect of saturation condition on the isothermal calorimet ry
test results due to various experimental difficulties a previous study [5] suggests that
saturation has a negligible effect on tests with relatively high wc ratios (the small differences
in tests results were probably caused by the surface water effect discussed in Section 22)
Table 3 Isothermal calorimetry tests (test series II test duration = 168 h)
Curing Temperature (degC) 25 40 60
Cement wc - - -
A 046 IC-A-1 IC-A-2 IC-A-3
C 056 IC-C-1 IC-C-2 IC-C-3
G 044 IC-G-1 IC-G-2 IC-G-3
H-P 038 IC-HP-1 IC-HP-2 IC-HP-3
H-I 038 IC-H-1 IC-H-2 IC-H-3
9
3 Theoretical Background and Analysis
31 Indirect methods of measuring cement hydration
When the indirect methods are employed to measure cement hydration progress the
relationships between experimental results and the overall degree of hydration can be expressed
as [9 21-25]
0 0 0
( ) ( ) ( )( ) n
n
w t H t CS tt
w H CS (2)
where wn(t) and wn0 are the non-evaporable water content at time t and at complete hydration
respectively (typically in gg cement) H(t) and H0 are the cumulative heat evolution at time t and
at complete hydration respectively (typically in Jg cement) and CS(t) and CS0 are the total
chemical shrinkage at time t and at complete hydration respectively (typically in mLg cement)
wn0 depends on the molar masses of the hydration products while H
0 depends on the enthalpy
changes of the chemical reactions both of which are expected to remain constant as long as the
chemical formulae of the hydration products do not change However CS0 depends on the molar
volumes of water and the hydration products and hence varies with both temperature and
pressure According to Eq (2) since wn0 and H
0 remain invariant (at least within the temperature
and pressure range used in this study) the dependency of CS0 on temperature and pressure can
be approximately evaluated by studying the correlations between wn(t) H(t) and CS(t) at various
curing conditions Studies have shown that the ratio of CS(t) to wn(t) evaluated at discrete data
points decreases with increasing temperature [6 10] suggesting that CS0 decreases with
increasing temperature The focus of this study is the correlation between CS(t) and H(t) both of
which have been measured continuously
10
It should be pointed out that the indirect methods only give a gross approximation to the
hydration rate of cement because hydration of the different phases also progresses at different
rates If we ignore the interactions between different clinker phases and the phase changes of
different hydration products during hydration then the total heat of hydration and chemical
shrinkage may be correlated with the degree of hydration of each individual clinker phase as
follows
3 3 3 2 2 2 3 3 3 4 4 4C S C S C S C S C S C S C A C A C A C AF C AF C AFH t a p t a p t a p t a p t (3)
3 3 3 2 2 2 3 3 3 4 4 4C S C S C S C S C S C S C A C A C A C AF C AF C AFCS t b p t b p t b p t b p t (4)
where ai and bi are the cumulative heat evolution and the total chemical shrinkage respectively
associated with the complete hydration of 1 g of clinker phase i Eqs (3) and (4) can be used to
estimate the parameters associated with the complete hydration condition in Eq (2) using the
sums
0 0 i i i iH a p CS b p (5)
Eq (2) is only exact either when all the different clinker phases hydrate at the same rate or when
the coefficients (ie airsquos and birsquos) associated with different phases are the same neither of which
is true [26 27] Nevertheless Eq (2) is still widely used as acceptable approximations [9 21-
25] In addition if the ratios of the coefficients associated with different clinker phases are
constant that is
3 32 4
3 2 3 4
C S C AC S C AF
C S C S C A C AF
a aa a
b b b b (6)
then the following part of Eq (2) will still be exact
0 0
( ) ( )H t CS t
H CS (7)
11
Accurate determination of the coefficients (ie ai and bi) for each individual phase is challenging
because complete hydration of all clinker phases is difficult to achieve and estimation of the
phase compositions (ie pi) are usually not accurate Recent estimates (Table 4) suggest that Eq
(6) is approximately true for three out of four main clinker phases (C3S C3A C4AF) Therefore
Eq (7) should provide a reasonable approximation especially for early age hydration which is
typically dominated by C3S and C3A
Table 4 Coefficients for estimating the parameters at the complete hydration condition
Phase C3S C2S C3A C4AF Reference
ai (Jg) 510 247 1356 427 [28]
bi (mLg at 25 degC) 00596 00503 013 00469 [9]
aibi 8557 4911 10431 9104
Obtained by multi-linear regression analysis from experimental data of 21 different
cements slightly different from theoretical values calculated from standard enthalpy of
formation [28 29] which depend on the chemical formulae of hydration products
32 A scale factor model for the effect of curing conditions on cement hydration
When the time dependence of the degree of hydration of cement is represented by an
unknown function the effect of curing temperature and pressure can be modelled by
incorporating a scale factor C into that function [12] For example if hydration at the reference
temperature Tr and pressure Pr is represented by the following functions
Integral curve ( ) Derivative curve ( )
r r r rT P T Pt d dt t (8)
then the transformed functions at temperature T and pressure P are
Integral curve ( ) ( )
Derivative curve ( ) ( )
r r
r r
T P T P
T P T P
t Ct
d dt t C Ct
(9)
12
The scale factor is similar to the coefficient used to compute the equivalent age of a specified
curing condition when applying the maturity method to estimate concrete strength (ASTM
C1074 [30]) It is important to note that both the scale factor model and the equivalent age
method assume the hydration mechanism do not change over the ranges of temperature and
pressure studied The dependence of the scale factor on curing temperature can be modeled by
the following equation [12]
Dagger
1 1exp
r r
a rT T P P
r
E V P PC
R T T R T T
(10)
where Ea is the apparent activation energy (Jmol) ∆VDagger is the apparent activation volume
(m3mol) R is the universal gas constant (8314 J(molK)) T and P are the temperature (K) and
pressure (Pa) of an arbitrary curing condition while Tr and Pr are the temperature (K) and
pressure (Pa) of the reference curing condition C is the scale factor associated with temperature
change from Tr to T and pressure change from Pr to P
One of the most important advantages of the scale factor model is that it is very
straightforward and easy to use The physical meaning of the model is that the hydration rate at
any curing condition is increased or decreased by a factor of C compared with that at the
reference curing condition at the same degree of hydration Probably due to the different
mechanism of hydration during the very early period (before the end of the induction period) it
is sometimes necessary to offset the predicted hydration kinetics curve using the scale factor
model to generate a better agreement with the experimental curve especially when their curing
temperatures are different The offset is not necessary for tests performed at different curing
pressures in the range from 07 MPa to 517 MPa [12] Therefore a more accurate representation
of the relationship between the hydration kinetics curves at temperatures T and Tr (for the same
curing pressure) is
13
0
0
Integral Curves ( )
Derivative Curves ( )
r r
r r r
T T T T
T T T T T T
t C t t
t C C t t
(11)
where T and rT
are the functions representing the time dependence of the degree of hydration
at temperatures T and Tr respectively t0 is the offset time which appears to increase with
increasing differences between Tr and T rT TC is the scale factor related to the temperature
differences which is the same as defined in Eq(10) at constant pressure
1 1
expr
aT T
r
EC
R T T
(12)
33 Correlation between Heat of hydration and Chemical shrinkage
If we consider an isothermal calorimetry test performed at temperature TIC and a
chemical shrinkage test performed at temperature TCS the degree of hydration measured by the
former can be expressed as
0
( )IC
IC
T
T
H tt
H
(13)
while that measured by the latter can be expressed as
0
( )CS
CS
T
T
CS
CS tt
CS T
(14)
Note that as already discussed CS0 is a function of temperature Employing the scale factor
model one can obtain
0IC CS CS ICT T T Tt C t t
(15)
where the scale factor is related to the temperature difference between the two types of tests by
the following equation
14
1 1
expCS IC
aT T
CS IC
EC
R T T
(16)
By combining Eqs (13) - (15) the cumulative heat evolution H(t) can be related to the total
chemical shrinkage CS(t) by the following equation
0
00( )
IC CS CS ICT T T T
CS
HH t CS C t t
CS T
(17)
4 Test Results and Discussion
41 Verifications of the scale factor model
One of the most important assumptions of the scale factor model is that the normalized
rate of hydration vs degree of hydration curve of a given cement paste is invariant with curing
condition (for isothermal and isobaric tests) The assumption has been verified for different types
of cement in the pressure range from 07 to 517 MPa using chemical shrinkage test data [12]
Oscillations of chemical shrinkage test results at high temperatures made it difficult to derive the
rate of hydration accurately Therefore further validation of this assumption is desirable for
different curing temperatures with the heat evolution data Based on the values listed in Table 4
and assuming C2F generates the same amount of heat as C4AF on the same mass basis the
cumulative heat generated at complete hydration (H0) was estimated to be 4977 Jg (cement)
4611 Jg 4701 Jg 4292 Jg and 3859 Jg for Class A C G H-I and H-P cements
respectively The hydration progress of these different types of cement can be obtained by
normalizing the heat evolution data by their respective H0
values
It should be pointed out that the scale factor model was developed for a single reaction
process assuming that the curing condition only changes the rate of the reaction but not its
nature In reality Portland cement hydration is a much more complex process with all the
15
different clinker phases having different reaction rates as well as different sensitivities to curing
temperature changes (ie activation energies) The composition of the hydration products may
also change if curing temperature changes significantly Therefore the model can be applied
only approximately to analyze Portland cement hydration Figure 2 shows the rate of hydration
vs degree of hydration derived from the heat evolution data of Class H-I cement before and after
normalization While the normalized data at different curing temperatures coincide relatively
well during early and late periods slight deviations are observed during the middle period (ie
for degrees of hydration approximately ranging from 02 to 05) Figure 3 shows the normalized
rate of hydration vs degree of hydration of the four other types of cement obtained at different
curing temperatures Similar convergence behaviors were observed except for the Class A and
Class C cements at 60 degC both of which diverge significantly from their behavior at 25 degC and
40 degC For all the different types of cement the divergences of the normalized kinetics curves
becomes more significant as the temperature difference increases due to the different
temperature sensitivities of different phases The normalized hydration data at 25 degC and 40 degC
appear to show better compliance with the model indicating that the scale factor model is more
accurate for relatively small temperature changes
16
0 02 04 06 080
002
004
006
008
01
012
014
Degree of hydration
Rate
of
hydra
tion (
h)
0 02 04 06 080
02
04
06
08
1
Degree of hydration
Norm
aliz
ed r
ate
of
hydra
tion
25C
40C
60C
25C
40C
60C
Figure 2 Effect of curing temperature on hydration rate as a function of degree of hydration
(Class H-I cement wc = 038)
0 02 04 06 080
02
04
06
08
1
Norm
aliz
ed r
ate
of
hydra
tion
0 02 04 06 080
02
04
06
08
1
0 02 04 06 080
02
04
06
08
1
Degree of hydration
Norm
aliz
ed r
ate
of
hydra
tion
0 02 04 06 080
02
04
06
08
1
Degree of hydration
25C
40C
60C
25C
40C
60C
25C
40C
60C
25C
40C
60C
Class CClass A
Class G Class H-P
Figure 3 Normalized rate of hydration vs degree of hydration of different cements
According to Eq (11) the scale factor relating the hydration rates at two different curing
temperatures can be estimated by applying basic coordinate transformation rules to transform the
17
hydration kinetics curve at Tr to achieve the best agreement with that at T (the method is referred
to as the best fit method) Figure 4 shows the results of transforming the experimental hydration
data obtained at 25 degC and 40 degC to fitpredict those at higher curing temperatures for Class C
cement Although it seems impossible to achieve perfect agreement for the entire curing period
the predictions are in good agreements with the actual experimental results during the period up
to the first peak which is mainly associated with C3S hydration The second peak probably
includes the contribution from C3A hydration which reportedly has a higher activation energy
than the overall value for Portland cement [31 32] Therefore the transformed hydration data
from lower temperatures typically underestimate the second peak (Figure 4) Applying a
different scale factor for each individual phase in Portland cement would perhaps generate a
better fit Unfortunately it is not yet possible to accurately and reliably measure the hydration
progress of the different phases separately
0 20 40 60 800
02
04
06
08
1
Time (h)
Degre
e o
f hydra
tion
0 5 10 150
005
01
015
02
025
Time (h)
Rate
of
hydra
tion (
h)
Measured
Transformed from 25C
Transformed from 40C
Measured
Transformed from 25C
Transformed from 40C
25C40C
25C40C
60C
60C
Figure 4 Measured and predicted hydration kinetics at different curing temperatures by
coordinate transformations (Class C cement wc = 056)
Figure 5 shows the measured and predicted hydration kinetics curves for the other types
of cement used in this study The predictions are most accurate for the Class H-I cement which
18
has almost no C3A and least accurate for the Class A cement which has the highest C3A
content This further confirms the hypothesis that a higher C3A activation energy can skew the
model results It is also interesting to note that the transformed data from lower temperatures
typically overestimate slightly the degree of hydration at later ages with the exception of Class
H-P cement for which the opposite is true Table 5 lists the offset time and scale factor as well
as the apparent activation energy (calculated from the scale factor using Eq (12)) associated with
each temperature change The constants are obtained by trial and error to provide the best
agreements as shown in Figures 4 and 5 For comparison purposes Table 5 also lists the scale
factors and apparent activation energies calculated with the peak hydration rate method as
proposed in a previous study [12] The constants obtained by the two different methods generally
agree well with each other for relatively small temperature changes (from 25degC to 40 degC and
from 40degC to 60 degC) but may differ quite noticeably for the larger temperature change (from 25
degC to 60 degC) The apparent activation energies obtained in different temperature ranges appear to
decrease with increasing temperature except for Class A cement for which the opposite is true
The apparent activation energies obtained in this study are also found to be much lower than
those calculated from chemical shrinkage test data [12] The latter are probably less accurate due
to the inadequate temperature control of the tests and errors associated with estimating CS0 at
different temperatures (H0 is assumed to be independent of temperature)
19
0 50 100 1500
01
02
03
04
05
06
07
Time (h)
Degre
e o
f hydra
tion
0 50 100 1500
01
02
03
04
05
06
07
Time (h)
Degre
e o
f hydra
tion
0 50 100 1500
02
04
06
08
Time (h)
Degre
e o
f hydra
tion
0 50 100 1500
02
04
06
08
Time (h)
Degre
e o
f hydra
tion
Measured Transformed from 25C Transformed from 40C
40C
60C
60C
40C
60C
40C
25C25C
25C
60C
40C
Class H-P Class H-I
Class GClass A
25C
Figure 5 Measured and predicted hydration kinetics of different cements at different curing
temperatures by coordinate transformations
42 Correlations between chemical shrinkage and heat of hydration of cement
Just as the hydration kinetics curve at a reference temperature can be transformed to fit
the curves obtained at other temperatures the chemical shrinkage curve can be transformed to fit
the heat evolution curve (and vice versa) according to their correlations developed in Section 33
Following Eq (17) the correlation factor H0CS
0(TCS) the scale factor
CS ICT TC and the offset
time t0 can all be estimated by transforming the chemical shrinkage curve to achieve the best
agreement with the heat evolution curve Since the scale factor model is more accurate for
smaller temperature changes the temperature of the chemical shrinkage test should be close to
that of the isothermal calorimetry test to obtain more reliable estimates Figures 6 shows the heat
20
evolution curves of the Class H-P cement measured at 25 degC and the transformed chemical
shrinkage curves (measured at lab temperature) that exhibit the best fit The two curves agree
excellently with each other except during very early stages (before the acceleration period)
where the hydration rate measured by chemical shrinkage seems to be higher than that measured
by heat evolution
Table 5 Activation energies obtained from different analysis methods
Cement Tr - T
(degC)
Best fit method Peak hydration rate method Ea (kJmol)
(from [12]) t0 (h) rT TC Ea (kJmol) rT TC Ea (kJmol)
A
25-40 04 21 384 228 427
526 25-60 08 55 402 704 461
40-60 08 29 462 309 489
C
25-40 075 218 403 223 415
488 25-60 1 48 370 548 401
40-60 06 22 342 246 390
G
25-40 09 23 431 237 447
50 25-60 1 55 402 576 413
40-60 05 22 342 243 385
H-P
25-40 1 215 396 212 389
425 25-60 15 45 355 453 356
40-60 11 21 322 214 330
H-I
25-40 1 226 422 226 422
443 25-60 12 48 370 554 404
40-60 07 21 322 245 389
21
0 10 20 30 40 50 60 70 800
1
2
3x 10
-3
Time (h)
Heat
evolu
tion r
ate
(W
g c
em
ent)
0 10 20 30 40 50 60 70 800
100
200
300
Cum
ula
tive h
eat
evolu
tion (
Jg
cem
ent)
Measured heat evolution
Transformed from chemical shrinkage
Figure 6 Heat evolution curves vs transformed chemical shrinkage curves
(Class H-P cement wc = 038 25 degC)
Figure 7 shows the heat evolution rate curves of the other types of cement measured at 25
degC and their corresponding best-fit transformed chemical shrinkage curves Similar to the Class
H-P cement excellent agreement is obtained between the heat evolution curve and the
transformed chemical shrinkage curve for the Class H-I cement However for cements that
contain significant C3A the agreements between the two types of curves are somewhat poorer
especially around the main hydration peaks The hydration of C3A first produces ettringite during
the hydration peak which then further reacts with excess C3A and transforms to calcium
monosulfoaluminate at later ages [26 28] The test results show that the second peak rate
(probably caused by C3A hydration) measured by chemical shrinkage is always higher than that
measured by heat evolution and that the rate measured by the former also decreases faster during
the deceleration stage Therefore the ratio of chemical shrinkage to heat evolution associated
with C3A hydration is higher than that associated with C3S hydration during the initial reaction
22
(to form ettringite) and probably the reverse is true during the later reaction (to form
monosulfoaluminate) It should be noted that the ratio of a3 to b3 associated with C3A hydration
as shown in Table 4 represents the long-term results of some average cements and is not strictly
applicable here
0 20 40 600
1
2
3
4
5x 10
-3
Time (h)
Heat
evolu
tion r
ate
(W
g c
em
ent)
0 20 40 600
1
2
3
4
5
6x 10
-3
Time (h)
Heat
evolu
tion r
ate
(W
g c
em
ent)
0 20 40 600
1
2
3
4
5x 10
-3
Time (h)
Heat
evolu
tion r
ate
(W
g c
em
ent)
0 20 40 600
1
2
3x 10
-3
Time (h)
Heat
evolu
tion r
ate
(W
g c
em
ent)
Measured heat evolution Transformed from chemical shrinkage
Class CClass A
Class G Class H-I
Figure7 Heat evolution vs transformed chemical shrinkage
for the different types of cement (derivative curves)
The integral curves of heat evolution of different cements cured at different temperatures
are compared with the transformed chemical shrinkage curves (measured at similar
temperatures) in Figure 8 In general excellent agreements can be obtained between the integral
hydration kinetics curves obtained from the two different methods The constants used to
transform the chemical shrinkage curves to fit the heat evolution curves including the correlation
23
factor the scale factor and the offset time are listed in Table 6 The cause of the offset time
(primarily observed for ambient temperature tests) is not yet clear It may be associated with
variations of the duration of the induction periods which tend to be affected by many different
factors that are difficult to control Following Eq (16) the temperature of the chemical shrinkage
test (TCS) can be estimated from the more-precisely-measured temperature of the isothermal
calorimetry test (TIC) by using the scale factor and the previously obtained activation energies in
the 25 degC to 60 degC temperature range (Table 5) As shown in Table 6 the calculated sample
temperatures of the chemical shrinkage tests are slightly higher than the previously estimated
values (Table 3) To further demonstrate that the scale factors are indeed associated with the
slight temperature differences between chemical shrinkage tests and isothermal calorimetry tests
one of the chemical shrinkage tests (Test CS-H-2) was performed by reducing the target
temperature (set with the temperature controllers) by 28 degC (5 degF) The obtained chemical
shrinkage curve of this particular test is found to be directly proportional to the heat evolution
curve (ie C = 1)
24
0 20 40 60 800
50
100
150
200
250
300
350
Time (h)
Cum
ula
tive h
eat
evolu
tion (
Jg
cem
ent)
0 20 40 60 800
100
200
300
400
Time (h)
Cum
ula
tive h
eat
evolu
tion (
Jg
cem
ent)
0 20 40 60 800
50
100
150
200
250
300
350
Time (h)
Cum
ula
tive h
eat
evolu
tion (
Jg
cem
ent)
0 20 40 60 800
50
100
150
200
250
300
Time (h)
Cum
ula
tive h
eat
evolu
tion (
Jg
cem
ent)
Measured heat evolution Transformed from chemical shrinkage
60C
40C
25C
60C
40C
25C
60C
40C
25C
60C
40C
25C
Class A Class C
Class G Class H-P
Figure 8 Heat evolution curves vs transformed chemical shrinkage curves for different types of
cement at different curing temperatures (integral curves)
25
Table 6 Best-fit constants for correlating chemical shrinkage and heat evolution test results and
the respective temperatures of different tests (Refer to Eq (17))
Test No t0 (h) CS ICT TC
H0CS
0(TCS)
(JmL) TIC (degC) TCS (degC)
CS-A-1 IC-A-1 1 109 7600 25 234
CS-C-1 IC-C-1 04 085 7800 25 283
CS-G-1 IC-G-1 07 095 7700 25 259
CS-HP-1 IC-HP-1 12 107 7500 25 236
CS-H-1 IC-H-1 1 111 8000 25 229
CS-A-2 IC-A-2 0 084 8400 40 436
CS-C-2 IC-C-2 0 09 8350 40 423
CS-G-2 IC-G-2 0 086 8850 40 431
CS-HP-2 IC-HP-2 06 09 8700 40 424
CS-H-2 IC-H-2 0 1 8850 40 400
CS-A-3 IC-A-3 0 09 9750 60 624
CS-C-3 IC-C-3 0 09 10100 60 627
CS-G-3 IC-G-3 0 091 9750 60 622
CS-HP-3 IC-HP-3 0 085 10200 60 643
At lab temperature (approximately 25 degC) the correlation factor between heat evolution
and chemical shrinkage (H0CS
0) for the different cements is found to range from 7500 JmL to
8000 JmL well within the previously reported range of 6500 JmL to 8500 JmL [33 34] The
correlation factor increases with increasing curing temperature Since H0 is independent of
curing temperature the results suggest that CS0 decreases with increasing temperature consistent
with previous studies [6 10] In the relatively small temperature range investigated (25 degC to 60
degC) the variations of CS0H
0 and H
0CS
0 with temperature can both be approximated by linear
models Figure 9 shows the dependence of CS0H
0 on curing temperature for different types of
cement The least square fits of all data points indicate the average rate of change to be -000076
mLkJ per degC for CS0H
0 and +58 JmL per degC for H
0CS
0 When normalized to the values at 25
degC the linear reduction rate of CS0 with increasing temperature is determined to be 057 065
058 066 and 057 per degC for Class A C G H-P and H-I cements respectively
26
suggesting an average reduction rate of 060 (with a standard deviation of 0046 ) per degC
For comparison a reduction rate of 078 per degC may be obtained from test data of Zhang et al
[10] in the same temperature range where the correlations between wn0 and CS
0 of Class H
cement were investigated
20 30 40 50 60 70009
01
011
012
013
014
Curing temperature (C)
CS
0H
0 (
mLk
J)
Class A
Class C
Class G
Class H-P
Class H-I
Figure 9 Dependence of correlation factor (CS0H
0) on curing temperature
5 Conclusions
The hydration kinetics of different types of cement cured at different temperatures has
been evaluated by both the traditional isothermal calorimetry test method and a newly developed
chemical shrinkage test method A scale factor model that can be used to predict the effect of
curing temperature on cement hydration kinetics previously validated with chemical shrinkage
test data is further discussed and validated with the heat evolution test data Due to the fact that
the different compounds in cement hydrate at different rates and have different temperature
sensitivities the model is found to be more accurate for cement with simpler compositions (eg
27
no or very low C3A content) andor for smaller temperature changes (eg le 15 degC) The scale
factor model also introduces a new method of estimating the apparent activation energies of
Portland cement (ie the best-fit method) The apparent activation energies of Class A C G H-P
and H-I cements determined using the heat of hydration data in the temperature range of 25 degC to
60 degC are 402 kJmol 37 kJmol 402 kJmol 355 kJmol and 37 kJmol respectively
A correlation study of chemical shrinkage and isothermal calorimetry test data indicate
that total chemical shrinkage is proportional to cumulative heat evolution if the two tests are
conducted on the same cement paste at the same curing temperature in agreement with previous
research The scale factor model discussed in this study can be used to account for any
unmeasured small temperature differences The proportionality constant namely the ratio of total
chemical shrinkage to total heat release at complete hydration (CS0H
0) varies slightly with
cement composition and decreases with increasing curing temperature If H0 is assumed to be
independent of curing temperature then CS0 decreases approximately linearly with increasing
temperature at a rate of 0600 plusmn 0046 per degC from the reference values at 25 degC for the
different cements used in this study Compared to C3S hydration early C3A hydration (typically
at the main hydration peak) seems to create a higher ratio of chemical shrinkage to heat
evolution while later C3A hydration (typically during the deceleration period) appears to create a
lower ratio As a result the rate of chemical shrinkage curve typically has a slightly different
shape than the heat flow curve for cements that contain significant C3A
Acknowledgements
Financial support for this study was provided by Halliburton Energy Services The
continuous support from Dr Lewis Norman and Dr Ron Morgan is cordially appreciated The
authors would also like to thank Mr David Meadows for his help in developing the chemical
28
shrinkage test apparatus and Ms Donna Chen for her help in performing part of the experimental
work
References
[1] Parrott LJ M Geiker WA Gutteridge D Killoh Monitoring Portland cement hydration
comparison of methods Cement and Concrete Research 20 (1990) pp 919-926
[2] Gutteridge WA and JA Dalziel Filler Cement The Effect of the Secondary Component
on the Hydration of Portland Cement Part I A Fine Non-Hydraulic Filler Cement and Concrete
Research 20 (1990) pp 778-782
[3] Bentz DP A three-dimensional cement hydration and microstructure program I hydration
rate heat of hydration and chemical shrinkage NISTIR 5756 US Department of Commerce
Washington DC 1995
[4] Escalante-Garcia JI Nonevaporable water from neat OPC and replacement materials in
composite cements hydrated at different temperatures Cement and Concrete Research 33 (11)
(2003) pp 1883-1888
[5] Lura P F Winnefeld S Klemm Simultaneous Measurements of Heat of Hydration and
Chemical Shrinkage on Hardening Cement Pastes Journal of Thermal Analysis and Calorimetry
101 (3) (2010) pp 925-932
[6] Geiker M Studies of Portland cement hydration measurements of chemical shrinkage and a
systematic evaluation of hydration curves by means of the dispersion model PhD Thesis
Technical University of Denmark 1983
[7] Mounanga P V Baroghel-Bouny A Loukili A Khelidj Autogenous deformations of
cement pastes Part I Temperature effects at early age and micro-macro correlations Cement
and Concrete Research 36 (2006) 110-122
29
[8] Peethamparan S E Weissinger J Vocaturo J Zhang G Scherer Monitoring chemical
shrinkage using pressure sensors Advances in the Material Science of Concrete ACI SP-270
Vol 7 (2010) 77-88
[9] Pang X and C Meyer Cement chemical shrinkage as measure of hydration kinetics and its
relationship with nonevaporable water ACI Materials Journal 109 (3) (2012) pp 341-352
[10] Zhang J EA Weissinger S Peethamparan GW Scherer Early Hydration and Setting of
Oil Well Cement Cement and Concrete Research 40 (2010) pp 1023-1033
[11] Scherer GW J Zhang JJ Thomas Nucleation and growth models for hydration of
cement Cement and Concrete Research 42 (2012) 982-993
[12] Pang X C Meyer R Darbe GP Funkhouser Modeling the effect of curing temperature
and pressure on cement hydration kinetics ACI materials journal accepted
[13] API Specification 10A Specification for Cements and Materials for Well Cementing
American Petroleum Institute 2010 38 pp
[14] ASTM C150C150M ndash 09 Standard Specification for Portland Cement ASTM
International West Conshohocken PA 2009 10 pp
[15] ASTM C1608 Standard Test Method for Chemical Shrinkage of Hydraulic Cement Paste
ASTM International West Conshohocken PA 2007 4 pp
[16] Sant G P Lura J Weiss Measurement of Volume Change in Cementitious Materials at
Early Ages Review of Testing Protocols and Interpretation of Results Journal of the
Transportation Research Record V 1979 (2006) pp 21-29
[17] Costoya M Kinetics and microstructural investigation on the hydration of tricalcium
silicate Doctoral Thesis Eacutecole Polytechnique Feacutedeacuterale de Lausanne Switzerland 2008
30
[18] Pang X Effects of curing temperature and pressure on the chemical physical and
mechanical properties of Portland cement PhD Dissertation Columbia University New York
2011
[19] ASTM C1679 Standard Practice for Measuring Hydration Kinetics of Hydraulic
Cementitious Mixtures Using Isothermal Calorimetry ASTM International West
Conshohocken PA 2009
[20] Bentz DP and CF Ferraris Rheology and setting of high volume fly ash mixtures
Cement and Concrete Composites 32 (4) (2010) pp 265-270
[21] Mills RH Factors influencing cessation of hydration in water cured cement pastes Special
Report No 90 in Proceedings of the Symposium on the Structure of Portland Cement Paste and
Concrete Highway Research Board Washington DC 1966 pp 406-424
[22] Mounanga P A Khelidj A Loukili V Baroghel-Bouny Predicting Ca(OH)2 Content and
chemical shrinkage of hydrating cement pastes using analytical approach Cement and Concrete
Research 34 (2004) pp 255-265
[23] Swaddiwudhipong S D Chen M H Zhang Simulation of the exothermic hydration
process of Portland cement Advances in Cement Research 14 (2) (2002) pp 61-69
[24] Schindler AK and KJ Folliard Heat of hydration models for cementitious materials ACI
Materials Journal 102 (1) (2005) pp 24-33
[25] Poole JL KA Riding KJ Folliard MCG Juenger AK Schindler Methods for
calculating activation energy for Portland cement ACI Materials Journal 104 (1) (2007) pp 303-
311
[26] Hewlett PC Learsquos Chemistry of Cement and Concrete 4th edition Butterworth-
Heinemann Oxford England 1998
31
[27] Escalante-Garcia JI and JH Sharp Effect of temperature on the hydration of the main
clinker phases in Portland cements Part I neat cements Cement and Concrete Research 28 (9)
(1998) pp 1245-1257
[28] Taylor HFW Cement Chemistry 2nd edition Thomas Telford London UK 1997
[29] Bentz DP T Barret I de la Varga J Weiss Relating compressive strength to heat release
in mortars Advances in Civil Engineering Materials accepted
[30] ASTM C1074 Standard Practice for Estimating Concrete Strength by the Maturity Method
ASTM International West Conshohocken PA 201010 pp
[31] Bushnell-Watson SM The effect of temperature upon the setting behaviour of refractory
CAC PhD Thesis University of Sheffield 1987
[32] Banfill PFG Superplasticizers for Ciment Fondu Part 2 effect of temperature on the
hydration reaction Advances in Cement Research 7 (1995) pp 151ndash157
[33] Bentz D G Sant J Weiss Early-age properties of cement-based materials I Influence of
cement fineness ASCE Journal of Materials in Civil Engineering 20 (7) (2008) pp 502-508
[34] Bentz DP Blending different fineness cements to engineer the properties of cement-based
materials Magazine of Concrete Research 62 (5) (2010) pp 327-338
4
Oilwell cements are based upon Portland cement but manufactured to a higher level of
consistency from one production batch to another There are no substantial differences between
oilwell cements and ordinary Portland cements except for the fact that some Class H (API
Specification 10A [13]) cement may have near zero C3A content API Classes A B and C
cements are similar to ASTM Types I II and III cements respectively The hydration kinetics of
four different classes of oilwell cements namely Class A C G and H were investigated at
different curing temperatures in this study All slurries (cement pastes) were prepared with de-
aerated water and cement only with no additives As will be shown in Section 22 standard
water-to-cement (wc) mass ratios for each class of cement were used as defined in API
Specification 10A [13] The main compound compositions of the different types of cements
derived from the oxide analysis test results using the Bogue calculation method [14] are
presented in Table 1 As shown in the table two different types of Class H cements were used a
premium Class H (H-P) and standard Class H Some minor composition variations were
observed between different batches of standard Class H cement (H-I and H-II) produced from the
same plant The particle size distributions of the cements were measured by the laser scattering
technique with dry dispersion methods The average test results (at least 10 measurements were
performed on each type of cement) are presented in Fig 1 The median particle sizes for Classes
A C G H-P and H-II cements were 38 microm 15 microm 34 microm 30 microm and 23 microm respectively
while their specific surface areas calculated from the PSD data (assuming spherical particles and
a cement density of 3150 kgm3) were 356 m
2kg 565 m
2kg 327 m
2kg 394 m
2kg and 323
m2kg respectively The particle size distribution curves for the Class A G and H-P cements are
very similar suggesting that similar grinding procedures may have been adopted in
5
manufacturing these cements Class C cement is ground much finer than the other classes to
achieve a higher specific surface area and enhance early-age reactivity
Table 1 Estimated main compound compositions (by mass percentage) of the different cements
Cement C3S C2S C3A C4AF C2F CaSO4 Free Lime
A 617 120 84 94 0 47 14
C 722 52 22 118 0 47 02
G 626 159 48 109 0 38 02
H-P 479 275 0 162 20 42 03
H-I 665 117 03 134 0 45 03
H-II 703 85 0 128 00 48 03
Figure 1 Particle size distributions of different classes of cements
22 Chemical Shrinkage Test
The total absolute volume of cement hydration product is smaller than the combined
initial volume of the anhydrous cement and water This reduction in volume during hydration is
known as chemical shrinkage Despite the apparently simple principle of chemical shrinkage
measurement there are experimental difficulties that can yield spurious results For example the
6
traditional chemical shrinkage test (ASTM C1608 [15]) involves adding a significant amount of
water on top of a thin specimen (lt 10 mm) to keep it saturated A recent study showed that the
quantity and the composition of the surface water have a significant impact on test results [16]
Increasing the amount of surface water was found to increase the chemical shrinkage rate before
the end of the induction period and to reduce the peak chemical shrinkage rate during later
periods The initial increase is probably due to the accelerated dissolution as a result of more
Ca2+
leaching out of the paste sample (and into the surface water solution) Massive precipitates
of portlandite were observed on the surface of specimens of alite (the main composition of
Portland cement) used for chemical shrinkage measurement [17] Additionally when the same
measuring device was used increasing sample thickness was consistently found to cause a
reduction in chemical shrinkage at later ages (gt15 h) [6 16 17] This thickness effect may be
explained by two hypotheses (1) the reduction in the permeability of the sample might prevent
surface water from filling all the pores in the thicker samples (depercolation) (2) a larger
fraction of the thinner sample is diluted by the surface water resulting in a faster hydration rate
at later ages Costoya [17] found that using a small diameter device with less surface water
(cylindrical flask) systematically gave a higher chemical shrinkage of a given mass of alite paste
than when the same mass of paste was used in a large diameter device with more surface water
(Erlenmeyer flask) even though the former generated a much thicker sample The author also
found that chemical shrinkage measured with the former device was the same as that measured
with a set ground paste sample for a period exceeding 250 h Therefore for cement pastes with
relatively high wc ratios surface water probably has a much stronger effect on the test result
than the thickness of the sample and the latter is probably not a limiting factor
7
In this study chemical shrinkage was measured by a recently developed test apparatus
[18] originally designed to obtain in-situ tensile strength of oilwell cements at different curing
pressures The apparatus allows automatic collection of chemical shrinkage data from samples
cured at different temperatures and pressures In addition by using a large volume of cement
paste (four 51 mm by 170 mm cylinders) the effect of surface water on test results is expected to
be minimal When a hydrostatic curing pressure of 069 MPa was applied tests performed using
hollow cylinders (whose entire annular surfaces were covered by filter paper for water
saturation) with a wall thickness of approximately 10 mm were found to generate the same
results as solid cylinders [18] suggesting sample thickness is not a limiting factor of test results
for this type of test under the conditions being employed The test design of the chemical
shrinkage test series is shown in Table 2 The main shortcoming of this new test apparatus is the
lack of precise temperature control Fortunately as will be discussed later any slight temperature
errors can be accounted for with a scale factor when the test results are correlated with those of
the isothermal calorimetry tests Test data oscillation also seems to be dramatically increased
when heating devices are employed for high temperature tests and such oscillations make it
difficult to calculate reliable derivative curves directly from cumulative experimental data
Uncertainties in test results caused by factors other than temperature fluctuations are estimated to
be less than 3 at the end of 3 d More detailed uncertainty analysis of this experimental
technique is given in [18]
Table 2 Chemical shrinkage tests (test series I test duration = 72 h)
Curing Temperature (degC) Ambienta 406
b 60
b
Cement wc - - -
A 046 CS-A-1 CS-A-2 CS-A-3
C 056 CS-C-1 CS-C-2 CS-C-3
G 044 CS-G-1 CS-G-2 CS-G-3
H-P 038 CS-HP-1 CS-HP-2 CS-HP-3
8
H-I 038 CS-H-1 CS-H-2 a Lab temperature (~24 degC plusmn 28 degC)
b Estimated specimen temperature (will be corrected later based on test results)
23 Isothermal Calorimetry Test
Compared to chemical shrinkage isothermal calorimetry is a more established test
method of measuring overall cement hydration progress In the second test series hydration of
the different types of cements is tracked with an isothermal calorimeter according to standard
test procedures [19] Tests were conducted at atmospheric pressure and three different curing
temperatures Table 3 shows the test design for this test series The temperatures of isothermal
calorimetry tests can be controlled more precisely due to the small sample size (4 g ~ 5 g) For
this technique the average absolute difference between replicate specimens of cement paste is
24x10-5
Wg (cement) with a maximum absolute difference of 000011 Wg (cement) for
measurements conducted between 1 h and 7 d after mixing [20] It should be mentioned that
the samples used in the isothermal calorimetry tests were cured under sealed condition which
is different from the saturated curing condition for the chemical shrinkage tests Although it is
difficult to accurately evaluate the effect of saturation condition on the isothermal calorimet ry
test results due to various experimental difficulties a previous study [5] suggests that
saturation has a negligible effect on tests with relatively high wc ratios (the small differences
in tests results were probably caused by the surface water effect discussed in Section 22)
Table 3 Isothermal calorimetry tests (test series II test duration = 168 h)
Curing Temperature (degC) 25 40 60
Cement wc - - -
A 046 IC-A-1 IC-A-2 IC-A-3
C 056 IC-C-1 IC-C-2 IC-C-3
G 044 IC-G-1 IC-G-2 IC-G-3
H-P 038 IC-HP-1 IC-HP-2 IC-HP-3
H-I 038 IC-H-1 IC-H-2 IC-H-3
9
3 Theoretical Background and Analysis
31 Indirect methods of measuring cement hydration
When the indirect methods are employed to measure cement hydration progress the
relationships between experimental results and the overall degree of hydration can be expressed
as [9 21-25]
0 0 0
( ) ( ) ( )( ) n
n
w t H t CS tt
w H CS (2)
where wn(t) and wn0 are the non-evaporable water content at time t and at complete hydration
respectively (typically in gg cement) H(t) and H0 are the cumulative heat evolution at time t and
at complete hydration respectively (typically in Jg cement) and CS(t) and CS0 are the total
chemical shrinkage at time t and at complete hydration respectively (typically in mLg cement)
wn0 depends on the molar masses of the hydration products while H
0 depends on the enthalpy
changes of the chemical reactions both of which are expected to remain constant as long as the
chemical formulae of the hydration products do not change However CS0 depends on the molar
volumes of water and the hydration products and hence varies with both temperature and
pressure According to Eq (2) since wn0 and H
0 remain invariant (at least within the temperature
and pressure range used in this study) the dependency of CS0 on temperature and pressure can
be approximately evaluated by studying the correlations between wn(t) H(t) and CS(t) at various
curing conditions Studies have shown that the ratio of CS(t) to wn(t) evaluated at discrete data
points decreases with increasing temperature [6 10] suggesting that CS0 decreases with
increasing temperature The focus of this study is the correlation between CS(t) and H(t) both of
which have been measured continuously
10
It should be pointed out that the indirect methods only give a gross approximation to the
hydration rate of cement because hydration of the different phases also progresses at different
rates If we ignore the interactions between different clinker phases and the phase changes of
different hydration products during hydration then the total heat of hydration and chemical
shrinkage may be correlated with the degree of hydration of each individual clinker phase as
follows
3 3 3 2 2 2 3 3 3 4 4 4C S C S C S C S C S C S C A C A C A C AF C AF C AFH t a p t a p t a p t a p t (3)
3 3 3 2 2 2 3 3 3 4 4 4C S C S C S C S C S C S C A C A C A C AF C AF C AFCS t b p t b p t b p t b p t (4)
where ai and bi are the cumulative heat evolution and the total chemical shrinkage respectively
associated with the complete hydration of 1 g of clinker phase i Eqs (3) and (4) can be used to
estimate the parameters associated with the complete hydration condition in Eq (2) using the
sums
0 0 i i i iH a p CS b p (5)
Eq (2) is only exact either when all the different clinker phases hydrate at the same rate or when
the coefficients (ie airsquos and birsquos) associated with different phases are the same neither of which
is true [26 27] Nevertheless Eq (2) is still widely used as acceptable approximations [9 21-
25] In addition if the ratios of the coefficients associated with different clinker phases are
constant that is
3 32 4
3 2 3 4
C S C AC S C AF
C S C S C A C AF
a aa a
b b b b (6)
then the following part of Eq (2) will still be exact
0 0
( ) ( )H t CS t
H CS (7)
11
Accurate determination of the coefficients (ie ai and bi) for each individual phase is challenging
because complete hydration of all clinker phases is difficult to achieve and estimation of the
phase compositions (ie pi) are usually not accurate Recent estimates (Table 4) suggest that Eq
(6) is approximately true for three out of four main clinker phases (C3S C3A C4AF) Therefore
Eq (7) should provide a reasonable approximation especially for early age hydration which is
typically dominated by C3S and C3A
Table 4 Coefficients for estimating the parameters at the complete hydration condition
Phase C3S C2S C3A C4AF Reference
ai (Jg) 510 247 1356 427 [28]
bi (mLg at 25 degC) 00596 00503 013 00469 [9]
aibi 8557 4911 10431 9104
Obtained by multi-linear regression analysis from experimental data of 21 different
cements slightly different from theoretical values calculated from standard enthalpy of
formation [28 29] which depend on the chemical formulae of hydration products
32 A scale factor model for the effect of curing conditions on cement hydration
When the time dependence of the degree of hydration of cement is represented by an
unknown function the effect of curing temperature and pressure can be modelled by
incorporating a scale factor C into that function [12] For example if hydration at the reference
temperature Tr and pressure Pr is represented by the following functions
Integral curve ( ) Derivative curve ( )
r r r rT P T Pt d dt t (8)
then the transformed functions at temperature T and pressure P are
Integral curve ( ) ( )
Derivative curve ( ) ( )
r r
r r
T P T P
T P T P
t Ct
d dt t C Ct
(9)
12
The scale factor is similar to the coefficient used to compute the equivalent age of a specified
curing condition when applying the maturity method to estimate concrete strength (ASTM
C1074 [30]) It is important to note that both the scale factor model and the equivalent age
method assume the hydration mechanism do not change over the ranges of temperature and
pressure studied The dependence of the scale factor on curing temperature can be modeled by
the following equation [12]
Dagger
1 1exp
r r
a rT T P P
r
E V P PC
R T T R T T
(10)
where Ea is the apparent activation energy (Jmol) ∆VDagger is the apparent activation volume
(m3mol) R is the universal gas constant (8314 J(molK)) T and P are the temperature (K) and
pressure (Pa) of an arbitrary curing condition while Tr and Pr are the temperature (K) and
pressure (Pa) of the reference curing condition C is the scale factor associated with temperature
change from Tr to T and pressure change from Pr to P
One of the most important advantages of the scale factor model is that it is very
straightforward and easy to use The physical meaning of the model is that the hydration rate at
any curing condition is increased or decreased by a factor of C compared with that at the
reference curing condition at the same degree of hydration Probably due to the different
mechanism of hydration during the very early period (before the end of the induction period) it
is sometimes necessary to offset the predicted hydration kinetics curve using the scale factor
model to generate a better agreement with the experimental curve especially when their curing
temperatures are different The offset is not necessary for tests performed at different curing
pressures in the range from 07 MPa to 517 MPa [12] Therefore a more accurate representation
of the relationship between the hydration kinetics curves at temperatures T and Tr (for the same
curing pressure) is
13
0
0
Integral Curves ( )
Derivative Curves ( )
r r
r r r
T T T T
T T T T T T
t C t t
t C C t t
(11)
where T and rT
are the functions representing the time dependence of the degree of hydration
at temperatures T and Tr respectively t0 is the offset time which appears to increase with
increasing differences between Tr and T rT TC is the scale factor related to the temperature
differences which is the same as defined in Eq(10) at constant pressure
1 1
expr
aT T
r
EC
R T T
(12)
33 Correlation between Heat of hydration and Chemical shrinkage
If we consider an isothermal calorimetry test performed at temperature TIC and a
chemical shrinkage test performed at temperature TCS the degree of hydration measured by the
former can be expressed as
0
( )IC
IC
T
T
H tt
H
(13)
while that measured by the latter can be expressed as
0
( )CS
CS
T
T
CS
CS tt
CS T
(14)
Note that as already discussed CS0 is a function of temperature Employing the scale factor
model one can obtain
0IC CS CS ICT T T Tt C t t
(15)
where the scale factor is related to the temperature difference between the two types of tests by
the following equation
14
1 1
expCS IC
aT T
CS IC
EC
R T T
(16)
By combining Eqs (13) - (15) the cumulative heat evolution H(t) can be related to the total
chemical shrinkage CS(t) by the following equation
0
00( )
IC CS CS ICT T T T
CS
HH t CS C t t
CS T
(17)
4 Test Results and Discussion
41 Verifications of the scale factor model
One of the most important assumptions of the scale factor model is that the normalized
rate of hydration vs degree of hydration curve of a given cement paste is invariant with curing
condition (for isothermal and isobaric tests) The assumption has been verified for different types
of cement in the pressure range from 07 to 517 MPa using chemical shrinkage test data [12]
Oscillations of chemical shrinkage test results at high temperatures made it difficult to derive the
rate of hydration accurately Therefore further validation of this assumption is desirable for
different curing temperatures with the heat evolution data Based on the values listed in Table 4
and assuming C2F generates the same amount of heat as C4AF on the same mass basis the
cumulative heat generated at complete hydration (H0) was estimated to be 4977 Jg (cement)
4611 Jg 4701 Jg 4292 Jg and 3859 Jg for Class A C G H-I and H-P cements
respectively The hydration progress of these different types of cement can be obtained by
normalizing the heat evolution data by their respective H0
values
It should be pointed out that the scale factor model was developed for a single reaction
process assuming that the curing condition only changes the rate of the reaction but not its
nature In reality Portland cement hydration is a much more complex process with all the
15
different clinker phases having different reaction rates as well as different sensitivities to curing
temperature changes (ie activation energies) The composition of the hydration products may
also change if curing temperature changes significantly Therefore the model can be applied
only approximately to analyze Portland cement hydration Figure 2 shows the rate of hydration
vs degree of hydration derived from the heat evolution data of Class H-I cement before and after
normalization While the normalized data at different curing temperatures coincide relatively
well during early and late periods slight deviations are observed during the middle period (ie
for degrees of hydration approximately ranging from 02 to 05) Figure 3 shows the normalized
rate of hydration vs degree of hydration of the four other types of cement obtained at different
curing temperatures Similar convergence behaviors were observed except for the Class A and
Class C cements at 60 degC both of which diverge significantly from their behavior at 25 degC and
40 degC For all the different types of cement the divergences of the normalized kinetics curves
becomes more significant as the temperature difference increases due to the different
temperature sensitivities of different phases The normalized hydration data at 25 degC and 40 degC
appear to show better compliance with the model indicating that the scale factor model is more
accurate for relatively small temperature changes
16
0 02 04 06 080
002
004
006
008
01
012
014
Degree of hydration
Rate
of
hydra
tion (
h)
0 02 04 06 080
02
04
06
08
1
Degree of hydration
Norm
aliz
ed r
ate
of
hydra
tion
25C
40C
60C
25C
40C
60C
Figure 2 Effect of curing temperature on hydration rate as a function of degree of hydration
(Class H-I cement wc = 038)
0 02 04 06 080
02
04
06
08
1
Norm
aliz
ed r
ate
of
hydra
tion
0 02 04 06 080
02
04
06
08
1
0 02 04 06 080
02
04
06
08
1
Degree of hydration
Norm
aliz
ed r
ate
of
hydra
tion
0 02 04 06 080
02
04
06
08
1
Degree of hydration
25C
40C
60C
25C
40C
60C
25C
40C
60C
25C
40C
60C
Class CClass A
Class G Class H-P
Figure 3 Normalized rate of hydration vs degree of hydration of different cements
According to Eq (11) the scale factor relating the hydration rates at two different curing
temperatures can be estimated by applying basic coordinate transformation rules to transform the
17
hydration kinetics curve at Tr to achieve the best agreement with that at T (the method is referred
to as the best fit method) Figure 4 shows the results of transforming the experimental hydration
data obtained at 25 degC and 40 degC to fitpredict those at higher curing temperatures for Class C
cement Although it seems impossible to achieve perfect agreement for the entire curing period
the predictions are in good agreements with the actual experimental results during the period up
to the first peak which is mainly associated with C3S hydration The second peak probably
includes the contribution from C3A hydration which reportedly has a higher activation energy
than the overall value for Portland cement [31 32] Therefore the transformed hydration data
from lower temperatures typically underestimate the second peak (Figure 4) Applying a
different scale factor for each individual phase in Portland cement would perhaps generate a
better fit Unfortunately it is not yet possible to accurately and reliably measure the hydration
progress of the different phases separately
0 20 40 60 800
02
04
06
08
1
Time (h)
Degre
e o
f hydra
tion
0 5 10 150
005
01
015
02
025
Time (h)
Rate
of
hydra
tion (
h)
Measured
Transformed from 25C
Transformed from 40C
Measured
Transformed from 25C
Transformed from 40C
25C40C
25C40C
60C
60C
Figure 4 Measured and predicted hydration kinetics at different curing temperatures by
coordinate transformations (Class C cement wc = 056)
Figure 5 shows the measured and predicted hydration kinetics curves for the other types
of cement used in this study The predictions are most accurate for the Class H-I cement which
18
has almost no C3A and least accurate for the Class A cement which has the highest C3A
content This further confirms the hypothesis that a higher C3A activation energy can skew the
model results It is also interesting to note that the transformed data from lower temperatures
typically overestimate slightly the degree of hydration at later ages with the exception of Class
H-P cement for which the opposite is true Table 5 lists the offset time and scale factor as well
as the apparent activation energy (calculated from the scale factor using Eq (12)) associated with
each temperature change The constants are obtained by trial and error to provide the best
agreements as shown in Figures 4 and 5 For comparison purposes Table 5 also lists the scale
factors and apparent activation energies calculated with the peak hydration rate method as
proposed in a previous study [12] The constants obtained by the two different methods generally
agree well with each other for relatively small temperature changes (from 25degC to 40 degC and
from 40degC to 60 degC) but may differ quite noticeably for the larger temperature change (from 25
degC to 60 degC) The apparent activation energies obtained in different temperature ranges appear to
decrease with increasing temperature except for Class A cement for which the opposite is true
The apparent activation energies obtained in this study are also found to be much lower than
those calculated from chemical shrinkage test data [12] The latter are probably less accurate due
to the inadequate temperature control of the tests and errors associated with estimating CS0 at
different temperatures (H0 is assumed to be independent of temperature)
19
0 50 100 1500
01
02
03
04
05
06
07
Time (h)
Degre
e o
f hydra
tion
0 50 100 1500
01
02
03
04
05
06
07
Time (h)
Degre
e o
f hydra
tion
0 50 100 1500
02
04
06
08
Time (h)
Degre
e o
f hydra
tion
0 50 100 1500
02
04
06
08
Time (h)
Degre
e o
f hydra
tion
Measured Transformed from 25C Transformed from 40C
40C
60C
60C
40C
60C
40C
25C25C
25C
60C
40C
Class H-P Class H-I
Class GClass A
25C
Figure 5 Measured and predicted hydration kinetics of different cements at different curing
temperatures by coordinate transformations
42 Correlations between chemical shrinkage and heat of hydration of cement
Just as the hydration kinetics curve at a reference temperature can be transformed to fit
the curves obtained at other temperatures the chemical shrinkage curve can be transformed to fit
the heat evolution curve (and vice versa) according to their correlations developed in Section 33
Following Eq (17) the correlation factor H0CS
0(TCS) the scale factor
CS ICT TC and the offset
time t0 can all be estimated by transforming the chemical shrinkage curve to achieve the best
agreement with the heat evolution curve Since the scale factor model is more accurate for
smaller temperature changes the temperature of the chemical shrinkage test should be close to
that of the isothermal calorimetry test to obtain more reliable estimates Figures 6 shows the heat
20
evolution curves of the Class H-P cement measured at 25 degC and the transformed chemical
shrinkage curves (measured at lab temperature) that exhibit the best fit The two curves agree
excellently with each other except during very early stages (before the acceleration period)
where the hydration rate measured by chemical shrinkage seems to be higher than that measured
by heat evolution
Table 5 Activation energies obtained from different analysis methods
Cement Tr - T
(degC)
Best fit method Peak hydration rate method Ea (kJmol)
(from [12]) t0 (h) rT TC Ea (kJmol) rT TC Ea (kJmol)
A
25-40 04 21 384 228 427
526 25-60 08 55 402 704 461
40-60 08 29 462 309 489
C
25-40 075 218 403 223 415
488 25-60 1 48 370 548 401
40-60 06 22 342 246 390
G
25-40 09 23 431 237 447
50 25-60 1 55 402 576 413
40-60 05 22 342 243 385
H-P
25-40 1 215 396 212 389
425 25-60 15 45 355 453 356
40-60 11 21 322 214 330
H-I
25-40 1 226 422 226 422
443 25-60 12 48 370 554 404
40-60 07 21 322 245 389
21
0 10 20 30 40 50 60 70 800
1
2
3x 10
-3
Time (h)
Heat
evolu
tion r
ate
(W
g c
em
ent)
0 10 20 30 40 50 60 70 800
100
200
300
Cum
ula
tive h
eat
evolu
tion (
Jg
cem
ent)
Measured heat evolution
Transformed from chemical shrinkage
Figure 6 Heat evolution curves vs transformed chemical shrinkage curves
(Class H-P cement wc = 038 25 degC)
Figure 7 shows the heat evolution rate curves of the other types of cement measured at 25
degC and their corresponding best-fit transformed chemical shrinkage curves Similar to the Class
H-P cement excellent agreement is obtained between the heat evolution curve and the
transformed chemical shrinkage curve for the Class H-I cement However for cements that
contain significant C3A the agreements between the two types of curves are somewhat poorer
especially around the main hydration peaks The hydration of C3A first produces ettringite during
the hydration peak which then further reacts with excess C3A and transforms to calcium
monosulfoaluminate at later ages [26 28] The test results show that the second peak rate
(probably caused by C3A hydration) measured by chemical shrinkage is always higher than that
measured by heat evolution and that the rate measured by the former also decreases faster during
the deceleration stage Therefore the ratio of chemical shrinkage to heat evolution associated
with C3A hydration is higher than that associated with C3S hydration during the initial reaction
22
(to form ettringite) and probably the reverse is true during the later reaction (to form
monosulfoaluminate) It should be noted that the ratio of a3 to b3 associated with C3A hydration
as shown in Table 4 represents the long-term results of some average cements and is not strictly
applicable here
0 20 40 600
1
2
3
4
5x 10
-3
Time (h)
Heat
evolu
tion r
ate
(W
g c
em
ent)
0 20 40 600
1
2
3
4
5
6x 10
-3
Time (h)
Heat
evolu
tion r
ate
(W
g c
em
ent)
0 20 40 600
1
2
3
4
5x 10
-3
Time (h)
Heat
evolu
tion r
ate
(W
g c
em
ent)
0 20 40 600
1
2
3x 10
-3
Time (h)
Heat
evolu
tion r
ate
(W
g c
em
ent)
Measured heat evolution Transformed from chemical shrinkage
Class CClass A
Class G Class H-I
Figure7 Heat evolution vs transformed chemical shrinkage
for the different types of cement (derivative curves)
The integral curves of heat evolution of different cements cured at different temperatures
are compared with the transformed chemical shrinkage curves (measured at similar
temperatures) in Figure 8 In general excellent agreements can be obtained between the integral
hydration kinetics curves obtained from the two different methods The constants used to
transform the chemical shrinkage curves to fit the heat evolution curves including the correlation
23
factor the scale factor and the offset time are listed in Table 6 The cause of the offset time
(primarily observed for ambient temperature tests) is not yet clear It may be associated with
variations of the duration of the induction periods which tend to be affected by many different
factors that are difficult to control Following Eq (16) the temperature of the chemical shrinkage
test (TCS) can be estimated from the more-precisely-measured temperature of the isothermal
calorimetry test (TIC) by using the scale factor and the previously obtained activation energies in
the 25 degC to 60 degC temperature range (Table 5) As shown in Table 6 the calculated sample
temperatures of the chemical shrinkage tests are slightly higher than the previously estimated
values (Table 3) To further demonstrate that the scale factors are indeed associated with the
slight temperature differences between chemical shrinkage tests and isothermal calorimetry tests
one of the chemical shrinkage tests (Test CS-H-2) was performed by reducing the target
temperature (set with the temperature controllers) by 28 degC (5 degF) The obtained chemical
shrinkage curve of this particular test is found to be directly proportional to the heat evolution
curve (ie C = 1)
24
0 20 40 60 800
50
100
150
200
250
300
350
Time (h)
Cum
ula
tive h
eat
evolu
tion (
Jg
cem
ent)
0 20 40 60 800
100
200
300
400
Time (h)
Cum
ula
tive h
eat
evolu
tion (
Jg
cem
ent)
0 20 40 60 800
50
100
150
200
250
300
350
Time (h)
Cum
ula
tive h
eat
evolu
tion (
Jg
cem
ent)
0 20 40 60 800
50
100
150
200
250
300
Time (h)
Cum
ula
tive h
eat
evolu
tion (
Jg
cem
ent)
Measured heat evolution Transformed from chemical shrinkage
60C
40C
25C
60C
40C
25C
60C
40C
25C
60C
40C
25C
Class A Class C
Class G Class H-P
Figure 8 Heat evolution curves vs transformed chemical shrinkage curves for different types of
cement at different curing temperatures (integral curves)
25
Table 6 Best-fit constants for correlating chemical shrinkage and heat evolution test results and
the respective temperatures of different tests (Refer to Eq (17))
Test No t0 (h) CS ICT TC
H0CS
0(TCS)
(JmL) TIC (degC) TCS (degC)
CS-A-1 IC-A-1 1 109 7600 25 234
CS-C-1 IC-C-1 04 085 7800 25 283
CS-G-1 IC-G-1 07 095 7700 25 259
CS-HP-1 IC-HP-1 12 107 7500 25 236
CS-H-1 IC-H-1 1 111 8000 25 229
CS-A-2 IC-A-2 0 084 8400 40 436
CS-C-2 IC-C-2 0 09 8350 40 423
CS-G-2 IC-G-2 0 086 8850 40 431
CS-HP-2 IC-HP-2 06 09 8700 40 424
CS-H-2 IC-H-2 0 1 8850 40 400
CS-A-3 IC-A-3 0 09 9750 60 624
CS-C-3 IC-C-3 0 09 10100 60 627
CS-G-3 IC-G-3 0 091 9750 60 622
CS-HP-3 IC-HP-3 0 085 10200 60 643
At lab temperature (approximately 25 degC) the correlation factor between heat evolution
and chemical shrinkage (H0CS
0) for the different cements is found to range from 7500 JmL to
8000 JmL well within the previously reported range of 6500 JmL to 8500 JmL [33 34] The
correlation factor increases with increasing curing temperature Since H0 is independent of
curing temperature the results suggest that CS0 decreases with increasing temperature consistent
with previous studies [6 10] In the relatively small temperature range investigated (25 degC to 60
degC) the variations of CS0H
0 and H
0CS
0 with temperature can both be approximated by linear
models Figure 9 shows the dependence of CS0H
0 on curing temperature for different types of
cement The least square fits of all data points indicate the average rate of change to be -000076
mLkJ per degC for CS0H
0 and +58 JmL per degC for H
0CS
0 When normalized to the values at 25
degC the linear reduction rate of CS0 with increasing temperature is determined to be 057 065
058 066 and 057 per degC for Class A C G H-P and H-I cements respectively
26
suggesting an average reduction rate of 060 (with a standard deviation of 0046 ) per degC
For comparison a reduction rate of 078 per degC may be obtained from test data of Zhang et al
[10] in the same temperature range where the correlations between wn0 and CS
0 of Class H
cement were investigated
20 30 40 50 60 70009
01
011
012
013
014
Curing temperature (C)
CS
0H
0 (
mLk
J)
Class A
Class C
Class G
Class H-P
Class H-I
Figure 9 Dependence of correlation factor (CS0H
0) on curing temperature
5 Conclusions
The hydration kinetics of different types of cement cured at different temperatures has
been evaluated by both the traditional isothermal calorimetry test method and a newly developed
chemical shrinkage test method A scale factor model that can be used to predict the effect of
curing temperature on cement hydration kinetics previously validated with chemical shrinkage
test data is further discussed and validated with the heat evolution test data Due to the fact that
the different compounds in cement hydrate at different rates and have different temperature
sensitivities the model is found to be more accurate for cement with simpler compositions (eg
27
no or very low C3A content) andor for smaller temperature changes (eg le 15 degC) The scale
factor model also introduces a new method of estimating the apparent activation energies of
Portland cement (ie the best-fit method) The apparent activation energies of Class A C G H-P
and H-I cements determined using the heat of hydration data in the temperature range of 25 degC to
60 degC are 402 kJmol 37 kJmol 402 kJmol 355 kJmol and 37 kJmol respectively
A correlation study of chemical shrinkage and isothermal calorimetry test data indicate
that total chemical shrinkage is proportional to cumulative heat evolution if the two tests are
conducted on the same cement paste at the same curing temperature in agreement with previous
research The scale factor model discussed in this study can be used to account for any
unmeasured small temperature differences The proportionality constant namely the ratio of total
chemical shrinkage to total heat release at complete hydration (CS0H
0) varies slightly with
cement composition and decreases with increasing curing temperature If H0 is assumed to be
independent of curing temperature then CS0 decreases approximately linearly with increasing
temperature at a rate of 0600 plusmn 0046 per degC from the reference values at 25 degC for the
different cements used in this study Compared to C3S hydration early C3A hydration (typically
at the main hydration peak) seems to create a higher ratio of chemical shrinkage to heat
evolution while later C3A hydration (typically during the deceleration period) appears to create a
lower ratio As a result the rate of chemical shrinkage curve typically has a slightly different
shape than the heat flow curve for cements that contain significant C3A
Acknowledgements
Financial support for this study was provided by Halliburton Energy Services The
continuous support from Dr Lewis Norman and Dr Ron Morgan is cordially appreciated The
authors would also like to thank Mr David Meadows for his help in developing the chemical
28
shrinkage test apparatus and Ms Donna Chen for her help in performing part of the experimental
work
References
[1] Parrott LJ M Geiker WA Gutteridge D Killoh Monitoring Portland cement hydration
comparison of methods Cement and Concrete Research 20 (1990) pp 919-926
[2] Gutteridge WA and JA Dalziel Filler Cement The Effect of the Secondary Component
on the Hydration of Portland Cement Part I A Fine Non-Hydraulic Filler Cement and Concrete
Research 20 (1990) pp 778-782
[3] Bentz DP A three-dimensional cement hydration and microstructure program I hydration
rate heat of hydration and chemical shrinkage NISTIR 5756 US Department of Commerce
Washington DC 1995
[4] Escalante-Garcia JI Nonevaporable water from neat OPC and replacement materials in
composite cements hydrated at different temperatures Cement and Concrete Research 33 (11)
(2003) pp 1883-1888
[5] Lura P F Winnefeld S Klemm Simultaneous Measurements of Heat of Hydration and
Chemical Shrinkage on Hardening Cement Pastes Journal of Thermal Analysis and Calorimetry
101 (3) (2010) pp 925-932
[6] Geiker M Studies of Portland cement hydration measurements of chemical shrinkage and a
systematic evaluation of hydration curves by means of the dispersion model PhD Thesis
Technical University of Denmark 1983
[7] Mounanga P V Baroghel-Bouny A Loukili A Khelidj Autogenous deformations of
cement pastes Part I Temperature effects at early age and micro-macro correlations Cement
and Concrete Research 36 (2006) 110-122
29
[8] Peethamparan S E Weissinger J Vocaturo J Zhang G Scherer Monitoring chemical
shrinkage using pressure sensors Advances in the Material Science of Concrete ACI SP-270
Vol 7 (2010) 77-88
[9] Pang X and C Meyer Cement chemical shrinkage as measure of hydration kinetics and its
relationship with nonevaporable water ACI Materials Journal 109 (3) (2012) pp 341-352
[10] Zhang J EA Weissinger S Peethamparan GW Scherer Early Hydration and Setting of
Oil Well Cement Cement and Concrete Research 40 (2010) pp 1023-1033
[11] Scherer GW J Zhang JJ Thomas Nucleation and growth models for hydration of
cement Cement and Concrete Research 42 (2012) 982-993
[12] Pang X C Meyer R Darbe GP Funkhouser Modeling the effect of curing temperature
and pressure on cement hydration kinetics ACI materials journal accepted
[13] API Specification 10A Specification for Cements and Materials for Well Cementing
American Petroleum Institute 2010 38 pp
[14] ASTM C150C150M ndash 09 Standard Specification for Portland Cement ASTM
International West Conshohocken PA 2009 10 pp
[15] ASTM C1608 Standard Test Method for Chemical Shrinkage of Hydraulic Cement Paste
ASTM International West Conshohocken PA 2007 4 pp
[16] Sant G P Lura J Weiss Measurement of Volume Change in Cementitious Materials at
Early Ages Review of Testing Protocols and Interpretation of Results Journal of the
Transportation Research Record V 1979 (2006) pp 21-29
[17] Costoya M Kinetics and microstructural investigation on the hydration of tricalcium
silicate Doctoral Thesis Eacutecole Polytechnique Feacutedeacuterale de Lausanne Switzerland 2008
30
[18] Pang X Effects of curing temperature and pressure on the chemical physical and
mechanical properties of Portland cement PhD Dissertation Columbia University New York
2011
[19] ASTM C1679 Standard Practice for Measuring Hydration Kinetics of Hydraulic
Cementitious Mixtures Using Isothermal Calorimetry ASTM International West
Conshohocken PA 2009
[20] Bentz DP and CF Ferraris Rheology and setting of high volume fly ash mixtures
Cement and Concrete Composites 32 (4) (2010) pp 265-270
[21] Mills RH Factors influencing cessation of hydration in water cured cement pastes Special
Report No 90 in Proceedings of the Symposium on the Structure of Portland Cement Paste and
Concrete Highway Research Board Washington DC 1966 pp 406-424
[22] Mounanga P A Khelidj A Loukili V Baroghel-Bouny Predicting Ca(OH)2 Content and
chemical shrinkage of hydrating cement pastes using analytical approach Cement and Concrete
Research 34 (2004) pp 255-265
[23] Swaddiwudhipong S D Chen M H Zhang Simulation of the exothermic hydration
process of Portland cement Advances in Cement Research 14 (2) (2002) pp 61-69
[24] Schindler AK and KJ Folliard Heat of hydration models for cementitious materials ACI
Materials Journal 102 (1) (2005) pp 24-33
[25] Poole JL KA Riding KJ Folliard MCG Juenger AK Schindler Methods for
calculating activation energy for Portland cement ACI Materials Journal 104 (1) (2007) pp 303-
311
[26] Hewlett PC Learsquos Chemistry of Cement and Concrete 4th edition Butterworth-
Heinemann Oxford England 1998
31
[27] Escalante-Garcia JI and JH Sharp Effect of temperature on the hydration of the main
clinker phases in Portland cements Part I neat cements Cement and Concrete Research 28 (9)
(1998) pp 1245-1257
[28] Taylor HFW Cement Chemistry 2nd edition Thomas Telford London UK 1997
[29] Bentz DP T Barret I de la Varga J Weiss Relating compressive strength to heat release
in mortars Advances in Civil Engineering Materials accepted
[30] ASTM C1074 Standard Practice for Estimating Concrete Strength by the Maturity Method
ASTM International West Conshohocken PA 201010 pp
[31] Bushnell-Watson SM The effect of temperature upon the setting behaviour of refractory
CAC PhD Thesis University of Sheffield 1987
[32] Banfill PFG Superplasticizers for Ciment Fondu Part 2 effect of temperature on the
hydration reaction Advances in Cement Research 7 (1995) pp 151ndash157
[33] Bentz D G Sant J Weiss Early-age properties of cement-based materials I Influence of
cement fineness ASCE Journal of Materials in Civil Engineering 20 (7) (2008) pp 502-508
[34] Bentz DP Blending different fineness cements to engineer the properties of cement-based
materials Magazine of Concrete Research 62 (5) (2010) pp 327-338
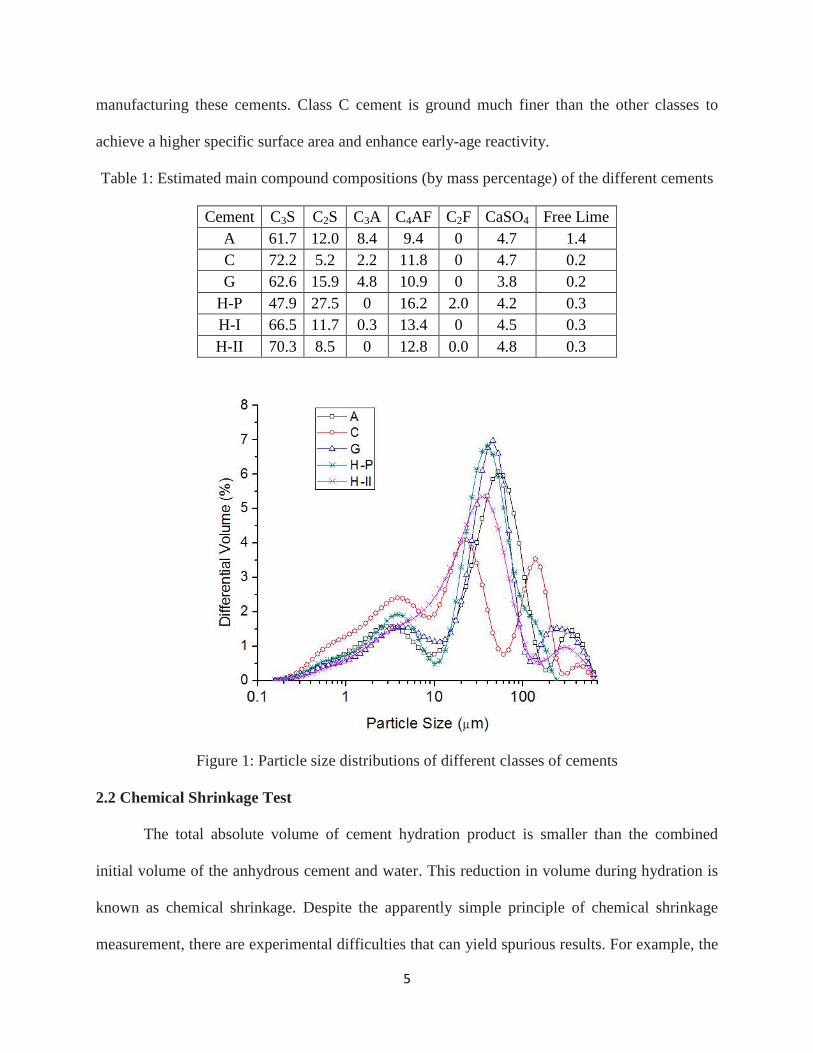
5
manufacturing these cements Class C cement is ground much finer than the other classes to
achieve a higher specific surface area and enhance early-age reactivity
Table 1 Estimated main compound compositions (by mass percentage) of the different cements
Cement C3S C2S C3A C4AF C2F CaSO4 Free Lime
A 617 120 84 94 0 47 14
C 722 52 22 118 0 47 02
G 626 159 48 109 0 38 02
H-P 479 275 0 162 20 42 03
H-I 665 117 03 134 0 45 03
H-II 703 85 0 128 00 48 03
Figure 1 Particle size distributions of different classes of cements
22 Chemical Shrinkage Test
The total absolute volume of cement hydration product is smaller than the combined
initial volume of the anhydrous cement and water This reduction in volume during hydration is
known as chemical shrinkage Despite the apparently simple principle of chemical shrinkage
measurement there are experimental difficulties that can yield spurious results For example the
6
traditional chemical shrinkage test (ASTM C1608 [15]) involves adding a significant amount of
water on top of a thin specimen (lt 10 mm) to keep it saturated A recent study showed that the
quantity and the composition of the surface water have a significant impact on test results [16]
Increasing the amount of surface water was found to increase the chemical shrinkage rate before
the end of the induction period and to reduce the peak chemical shrinkage rate during later
periods The initial increase is probably due to the accelerated dissolution as a result of more
Ca2+
leaching out of the paste sample (and into the surface water solution) Massive precipitates
of portlandite were observed on the surface of specimens of alite (the main composition of
Portland cement) used for chemical shrinkage measurement [17] Additionally when the same
measuring device was used increasing sample thickness was consistently found to cause a
reduction in chemical shrinkage at later ages (gt15 h) [6 16 17] This thickness effect may be
explained by two hypotheses (1) the reduction in the permeability of the sample might prevent
surface water from filling all the pores in the thicker samples (depercolation) (2) a larger
fraction of the thinner sample is diluted by the surface water resulting in a faster hydration rate
at later ages Costoya [17] found that using a small diameter device with less surface water
(cylindrical flask) systematically gave a higher chemical shrinkage of a given mass of alite paste
than when the same mass of paste was used in a large diameter device with more surface water
(Erlenmeyer flask) even though the former generated a much thicker sample The author also
found that chemical shrinkage measured with the former device was the same as that measured
with a set ground paste sample for a period exceeding 250 h Therefore for cement pastes with
relatively high wc ratios surface water probably has a much stronger effect on the test result
than the thickness of the sample and the latter is probably not a limiting factor
7
In this study chemical shrinkage was measured by a recently developed test apparatus
[18] originally designed to obtain in-situ tensile strength of oilwell cements at different curing
pressures The apparatus allows automatic collection of chemical shrinkage data from samples
cured at different temperatures and pressures In addition by using a large volume of cement
paste (four 51 mm by 170 mm cylinders) the effect of surface water on test results is expected to
be minimal When a hydrostatic curing pressure of 069 MPa was applied tests performed using
hollow cylinders (whose entire annular surfaces were covered by filter paper for water
saturation) with a wall thickness of approximately 10 mm were found to generate the same
results as solid cylinders [18] suggesting sample thickness is not a limiting factor of test results
for this type of test under the conditions being employed The test design of the chemical
shrinkage test series is shown in Table 2 The main shortcoming of this new test apparatus is the
lack of precise temperature control Fortunately as will be discussed later any slight temperature
errors can be accounted for with a scale factor when the test results are correlated with those of
the isothermal calorimetry tests Test data oscillation also seems to be dramatically increased
when heating devices are employed for high temperature tests and such oscillations make it
difficult to calculate reliable derivative curves directly from cumulative experimental data
Uncertainties in test results caused by factors other than temperature fluctuations are estimated to
be less than 3 at the end of 3 d More detailed uncertainty analysis of this experimental
technique is given in [18]
Table 2 Chemical shrinkage tests (test series I test duration = 72 h)
Curing Temperature (degC) Ambienta 406
b 60
b
Cement wc - - -
A 046 CS-A-1 CS-A-2 CS-A-3
C 056 CS-C-1 CS-C-2 CS-C-3
G 044 CS-G-1 CS-G-2 CS-G-3
H-P 038 CS-HP-1 CS-HP-2 CS-HP-3
8
H-I 038 CS-H-1 CS-H-2 a Lab temperature (~24 degC plusmn 28 degC)
b Estimated specimen temperature (will be corrected later based on test results)
23 Isothermal Calorimetry Test
Compared to chemical shrinkage isothermal calorimetry is a more established test
method of measuring overall cement hydration progress In the second test series hydration of
the different types of cements is tracked with an isothermal calorimeter according to standard
test procedures [19] Tests were conducted at atmospheric pressure and three different curing
temperatures Table 3 shows the test design for this test series The temperatures of isothermal
calorimetry tests can be controlled more precisely due to the small sample size (4 g ~ 5 g) For
this technique the average absolute difference between replicate specimens of cement paste is
24x10-5
Wg (cement) with a maximum absolute difference of 000011 Wg (cement) for
measurements conducted between 1 h and 7 d after mixing [20] It should be mentioned that
the samples used in the isothermal calorimetry tests were cured under sealed condition which
is different from the saturated curing condition for the chemical shrinkage tests Although it is
difficult to accurately evaluate the effect of saturation condition on the isothermal calorimet ry
test results due to various experimental difficulties a previous study [5] suggests that
saturation has a negligible effect on tests with relatively high wc ratios (the small differences
in tests results were probably caused by the surface water effect discussed in Section 22)
Table 3 Isothermal calorimetry tests (test series II test duration = 168 h)
Curing Temperature (degC) 25 40 60
Cement wc - - -
A 046 IC-A-1 IC-A-2 IC-A-3
C 056 IC-C-1 IC-C-2 IC-C-3
G 044 IC-G-1 IC-G-2 IC-G-3
H-P 038 IC-HP-1 IC-HP-2 IC-HP-3
H-I 038 IC-H-1 IC-H-2 IC-H-3
9
3 Theoretical Background and Analysis
31 Indirect methods of measuring cement hydration
When the indirect methods are employed to measure cement hydration progress the
relationships between experimental results and the overall degree of hydration can be expressed
as [9 21-25]
0 0 0
( ) ( ) ( )( ) n
n
w t H t CS tt
w H CS (2)
where wn(t) and wn0 are the non-evaporable water content at time t and at complete hydration
respectively (typically in gg cement) H(t) and H0 are the cumulative heat evolution at time t and
at complete hydration respectively (typically in Jg cement) and CS(t) and CS0 are the total
chemical shrinkage at time t and at complete hydration respectively (typically in mLg cement)
wn0 depends on the molar masses of the hydration products while H
0 depends on the enthalpy
changes of the chemical reactions both of which are expected to remain constant as long as the
chemical formulae of the hydration products do not change However CS0 depends on the molar
volumes of water and the hydration products and hence varies with both temperature and
pressure According to Eq (2) since wn0 and H
0 remain invariant (at least within the temperature
and pressure range used in this study) the dependency of CS0 on temperature and pressure can
be approximately evaluated by studying the correlations between wn(t) H(t) and CS(t) at various
curing conditions Studies have shown that the ratio of CS(t) to wn(t) evaluated at discrete data
points decreases with increasing temperature [6 10] suggesting that CS0 decreases with
increasing temperature The focus of this study is the correlation between CS(t) and H(t) both of
which have been measured continuously
10
It should be pointed out that the indirect methods only give a gross approximation to the
hydration rate of cement because hydration of the different phases also progresses at different
rates If we ignore the interactions between different clinker phases and the phase changes of
different hydration products during hydration then the total heat of hydration and chemical
shrinkage may be correlated with the degree of hydration of each individual clinker phase as
follows
3 3 3 2 2 2 3 3 3 4 4 4C S C S C S C S C S C S C A C A C A C AF C AF C AFH t a p t a p t a p t a p t (3)
3 3 3 2 2 2 3 3 3 4 4 4C S C S C S C S C S C S C A C A C A C AF C AF C AFCS t b p t b p t b p t b p t (4)
where ai and bi are the cumulative heat evolution and the total chemical shrinkage respectively
associated with the complete hydration of 1 g of clinker phase i Eqs (3) and (4) can be used to
estimate the parameters associated with the complete hydration condition in Eq (2) using the
sums
0 0 i i i iH a p CS b p (5)
Eq (2) is only exact either when all the different clinker phases hydrate at the same rate or when
the coefficients (ie airsquos and birsquos) associated with different phases are the same neither of which
is true [26 27] Nevertheless Eq (2) is still widely used as acceptable approximations [9 21-
25] In addition if the ratios of the coefficients associated with different clinker phases are
constant that is
3 32 4
3 2 3 4
C S C AC S C AF
C S C S C A C AF
a aa a
b b b b (6)
then the following part of Eq (2) will still be exact
0 0
( ) ( )H t CS t
H CS (7)
11
Accurate determination of the coefficients (ie ai and bi) for each individual phase is challenging
because complete hydration of all clinker phases is difficult to achieve and estimation of the
phase compositions (ie pi) are usually not accurate Recent estimates (Table 4) suggest that Eq
(6) is approximately true for three out of four main clinker phases (C3S C3A C4AF) Therefore
Eq (7) should provide a reasonable approximation especially for early age hydration which is
typically dominated by C3S and C3A
Table 4 Coefficients for estimating the parameters at the complete hydration condition
Phase C3S C2S C3A C4AF Reference
ai (Jg) 510 247 1356 427 [28]
bi (mLg at 25 degC) 00596 00503 013 00469 [9]
aibi 8557 4911 10431 9104
Obtained by multi-linear regression analysis from experimental data of 21 different
cements slightly different from theoretical values calculated from standard enthalpy of
formation [28 29] which depend on the chemical formulae of hydration products
32 A scale factor model for the effect of curing conditions on cement hydration
When the time dependence of the degree of hydration of cement is represented by an
unknown function the effect of curing temperature and pressure can be modelled by
incorporating a scale factor C into that function [12] For example if hydration at the reference
temperature Tr and pressure Pr is represented by the following functions
Integral curve ( ) Derivative curve ( )
r r r rT P T Pt d dt t (8)
then the transformed functions at temperature T and pressure P are
Integral curve ( ) ( )
Derivative curve ( ) ( )
r r
r r
T P T P
T P T P
t Ct
d dt t C Ct
(9)
12
The scale factor is similar to the coefficient used to compute the equivalent age of a specified
curing condition when applying the maturity method to estimate concrete strength (ASTM
C1074 [30]) It is important to note that both the scale factor model and the equivalent age
method assume the hydration mechanism do not change over the ranges of temperature and
pressure studied The dependence of the scale factor on curing temperature can be modeled by
the following equation [12]
Dagger
1 1exp
r r
a rT T P P
r
E V P PC
R T T R T T
(10)
where Ea is the apparent activation energy (Jmol) ∆VDagger is the apparent activation volume
(m3mol) R is the universal gas constant (8314 J(molK)) T and P are the temperature (K) and
pressure (Pa) of an arbitrary curing condition while Tr and Pr are the temperature (K) and
pressure (Pa) of the reference curing condition C is the scale factor associated with temperature
change from Tr to T and pressure change from Pr to P
One of the most important advantages of the scale factor model is that it is very
straightforward and easy to use The physical meaning of the model is that the hydration rate at
any curing condition is increased or decreased by a factor of C compared with that at the
reference curing condition at the same degree of hydration Probably due to the different
mechanism of hydration during the very early period (before the end of the induction period) it
is sometimes necessary to offset the predicted hydration kinetics curve using the scale factor
model to generate a better agreement with the experimental curve especially when their curing
temperatures are different The offset is not necessary for tests performed at different curing
pressures in the range from 07 MPa to 517 MPa [12] Therefore a more accurate representation
of the relationship between the hydration kinetics curves at temperatures T and Tr (for the same
curing pressure) is
13
0
0
Integral Curves ( )
Derivative Curves ( )
r r
r r r
T T T T
T T T T T T
t C t t
t C C t t
(11)
where T and rT
are the functions representing the time dependence of the degree of hydration
at temperatures T and Tr respectively t0 is the offset time which appears to increase with
increasing differences between Tr and T rT TC is the scale factor related to the temperature
differences which is the same as defined in Eq(10) at constant pressure
1 1
expr
aT T
r
EC
R T T
(12)
33 Correlation between Heat of hydration and Chemical shrinkage
If we consider an isothermal calorimetry test performed at temperature TIC and a
chemical shrinkage test performed at temperature TCS the degree of hydration measured by the
former can be expressed as
0
( )IC
IC
T
T
H tt
H
(13)
while that measured by the latter can be expressed as
0
( )CS
CS
T
T
CS
CS tt
CS T
(14)
Note that as already discussed CS0 is a function of temperature Employing the scale factor
model one can obtain
0IC CS CS ICT T T Tt C t t
(15)
where the scale factor is related to the temperature difference between the two types of tests by
the following equation
14
1 1
expCS IC
aT T
CS IC
EC
R T T
(16)
By combining Eqs (13) - (15) the cumulative heat evolution H(t) can be related to the total
chemical shrinkage CS(t) by the following equation
0
00( )
IC CS CS ICT T T T
CS
HH t CS C t t
CS T
(17)
4 Test Results and Discussion
41 Verifications of the scale factor model
One of the most important assumptions of the scale factor model is that the normalized
rate of hydration vs degree of hydration curve of a given cement paste is invariant with curing
condition (for isothermal and isobaric tests) The assumption has been verified for different types
of cement in the pressure range from 07 to 517 MPa using chemical shrinkage test data [12]
Oscillations of chemical shrinkage test results at high temperatures made it difficult to derive the
rate of hydration accurately Therefore further validation of this assumption is desirable for
different curing temperatures with the heat evolution data Based on the values listed in Table 4
and assuming C2F generates the same amount of heat as C4AF on the same mass basis the
cumulative heat generated at complete hydration (H0) was estimated to be 4977 Jg (cement)
4611 Jg 4701 Jg 4292 Jg and 3859 Jg for Class A C G H-I and H-P cements
respectively The hydration progress of these different types of cement can be obtained by
normalizing the heat evolution data by their respective H0
values
It should be pointed out that the scale factor model was developed for a single reaction
process assuming that the curing condition only changes the rate of the reaction but not its
nature In reality Portland cement hydration is a much more complex process with all the
15
different clinker phases having different reaction rates as well as different sensitivities to curing
temperature changes (ie activation energies) The composition of the hydration products may
also change if curing temperature changes significantly Therefore the model can be applied
only approximately to analyze Portland cement hydration Figure 2 shows the rate of hydration
vs degree of hydration derived from the heat evolution data of Class H-I cement before and after
normalization While the normalized data at different curing temperatures coincide relatively
well during early and late periods slight deviations are observed during the middle period (ie
for degrees of hydration approximately ranging from 02 to 05) Figure 3 shows the normalized
rate of hydration vs degree of hydration of the four other types of cement obtained at different
curing temperatures Similar convergence behaviors were observed except for the Class A and
Class C cements at 60 degC both of which diverge significantly from their behavior at 25 degC and
40 degC For all the different types of cement the divergences of the normalized kinetics curves
becomes more significant as the temperature difference increases due to the different
temperature sensitivities of different phases The normalized hydration data at 25 degC and 40 degC
appear to show better compliance with the model indicating that the scale factor model is more
accurate for relatively small temperature changes
16
0 02 04 06 080
002
004
006
008
01
012
014
Degree of hydration
Rate
of
hydra
tion (
h)
0 02 04 06 080
02
04
06
08
1
Degree of hydration
Norm
aliz
ed r
ate
of
hydra
tion
25C
40C
60C
25C
40C
60C
Figure 2 Effect of curing temperature on hydration rate as a function of degree of hydration
(Class H-I cement wc = 038)
0 02 04 06 080
02
04
06
08
1
Norm
aliz
ed r
ate
of
hydra
tion
0 02 04 06 080
02
04
06
08
1
0 02 04 06 080
02
04
06
08
1
Degree of hydration
Norm
aliz
ed r
ate
of
hydra
tion
0 02 04 06 080
02
04
06
08
1
Degree of hydration
25C
40C
60C
25C
40C
60C
25C
40C
60C
25C
40C
60C
Class CClass A
Class G Class H-P
Figure 3 Normalized rate of hydration vs degree of hydration of different cements
According to Eq (11) the scale factor relating the hydration rates at two different curing
temperatures can be estimated by applying basic coordinate transformation rules to transform the
17
hydration kinetics curve at Tr to achieve the best agreement with that at T (the method is referred
to as the best fit method) Figure 4 shows the results of transforming the experimental hydration
data obtained at 25 degC and 40 degC to fitpredict those at higher curing temperatures for Class C
cement Although it seems impossible to achieve perfect agreement for the entire curing period
the predictions are in good agreements with the actual experimental results during the period up
to the first peak which is mainly associated with C3S hydration The second peak probably
includes the contribution from C3A hydration which reportedly has a higher activation energy
than the overall value for Portland cement [31 32] Therefore the transformed hydration data
from lower temperatures typically underestimate the second peak (Figure 4) Applying a
different scale factor for each individual phase in Portland cement would perhaps generate a
better fit Unfortunately it is not yet possible to accurately and reliably measure the hydration
progress of the different phases separately
0 20 40 60 800
02
04
06
08
1
Time (h)
Degre
e o
f hydra
tion
0 5 10 150
005
01
015
02
025
Time (h)
Rate
of
hydra
tion (
h)
Measured
Transformed from 25C
Transformed from 40C
Measured
Transformed from 25C
Transformed from 40C
25C40C
25C40C
60C
60C
Figure 4 Measured and predicted hydration kinetics at different curing temperatures by
coordinate transformations (Class C cement wc = 056)
Figure 5 shows the measured and predicted hydration kinetics curves for the other types
of cement used in this study The predictions are most accurate for the Class H-I cement which
18
has almost no C3A and least accurate for the Class A cement which has the highest C3A
content This further confirms the hypothesis that a higher C3A activation energy can skew the
model results It is also interesting to note that the transformed data from lower temperatures
typically overestimate slightly the degree of hydration at later ages with the exception of Class
H-P cement for which the opposite is true Table 5 lists the offset time and scale factor as well
as the apparent activation energy (calculated from the scale factor using Eq (12)) associated with
each temperature change The constants are obtained by trial and error to provide the best
agreements as shown in Figures 4 and 5 For comparison purposes Table 5 also lists the scale
factors and apparent activation energies calculated with the peak hydration rate method as
proposed in a previous study [12] The constants obtained by the two different methods generally
agree well with each other for relatively small temperature changes (from 25degC to 40 degC and
from 40degC to 60 degC) but may differ quite noticeably for the larger temperature change (from 25
degC to 60 degC) The apparent activation energies obtained in different temperature ranges appear to
decrease with increasing temperature except for Class A cement for which the opposite is true
The apparent activation energies obtained in this study are also found to be much lower than
those calculated from chemical shrinkage test data [12] The latter are probably less accurate due
to the inadequate temperature control of the tests and errors associated with estimating CS0 at
different temperatures (H0 is assumed to be independent of temperature)
19
0 50 100 1500
01
02
03
04
05
06
07
Time (h)
Degre
e o
f hydra
tion
0 50 100 1500
01
02
03
04
05
06
07
Time (h)
Degre
e o
f hydra
tion
0 50 100 1500
02
04
06
08
Time (h)
Degre
e o
f hydra
tion
0 50 100 1500
02
04
06
08
Time (h)
Degre
e o
f hydra
tion
Measured Transformed from 25C Transformed from 40C
40C
60C
60C
40C
60C
40C
25C25C
25C
60C
40C
Class H-P Class H-I
Class GClass A
25C
Figure 5 Measured and predicted hydration kinetics of different cements at different curing
temperatures by coordinate transformations
42 Correlations between chemical shrinkage and heat of hydration of cement
Just as the hydration kinetics curve at a reference temperature can be transformed to fit
the curves obtained at other temperatures the chemical shrinkage curve can be transformed to fit
the heat evolution curve (and vice versa) according to their correlations developed in Section 33
Following Eq (17) the correlation factor H0CS
0(TCS) the scale factor
CS ICT TC and the offset
time t0 can all be estimated by transforming the chemical shrinkage curve to achieve the best
agreement with the heat evolution curve Since the scale factor model is more accurate for
smaller temperature changes the temperature of the chemical shrinkage test should be close to
that of the isothermal calorimetry test to obtain more reliable estimates Figures 6 shows the heat
20
evolution curves of the Class H-P cement measured at 25 degC and the transformed chemical
shrinkage curves (measured at lab temperature) that exhibit the best fit The two curves agree
excellently with each other except during very early stages (before the acceleration period)
where the hydration rate measured by chemical shrinkage seems to be higher than that measured
by heat evolution
Table 5 Activation energies obtained from different analysis methods
Cement Tr - T
(degC)
Best fit method Peak hydration rate method Ea (kJmol)
(from [12]) t0 (h) rT TC Ea (kJmol) rT TC Ea (kJmol)
A
25-40 04 21 384 228 427
526 25-60 08 55 402 704 461
40-60 08 29 462 309 489
C
25-40 075 218 403 223 415
488 25-60 1 48 370 548 401
40-60 06 22 342 246 390
G
25-40 09 23 431 237 447
50 25-60 1 55 402 576 413
40-60 05 22 342 243 385
H-P
25-40 1 215 396 212 389
425 25-60 15 45 355 453 356
40-60 11 21 322 214 330
H-I
25-40 1 226 422 226 422
443 25-60 12 48 370 554 404
40-60 07 21 322 245 389
21
0 10 20 30 40 50 60 70 800
1
2
3x 10
-3
Time (h)
Heat
evolu
tion r
ate
(W
g c
em
ent)
0 10 20 30 40 50 60 70 800
100
200
300
Cum
ula
tive h
eat
evolu
tion (
Jg
cem
ent)
Measured heat evolution
Transformed from chemical shrinkage
Figure 6 Heat evolution curves vs transformed chemical shrinkage curves
(Class H-P cement wc = 038 25 degC)
Figure 7 shows the heat evolution rate curves of the other types of cement measured at 25
degC and their corresponding best-fit transformed chemical shrinkage curves Similar to the Class
H-P cement excellent agreement is obtained between the heat evolution curve and the
transformed chemical shrinkage curve for the Class H-I cement However for cements that
contain significant C3A the agreements between the two types of curves are somewhat poorer
especially around the main hydration peaks The hydration of C3A first produces ettringite during
the hydration peak which then further reacts with excess C3A and transforms to calcium
monosulfoaluminate at later ages [26 28] The test results show that the second peak rate
(probably caused by C3A hydration) measured by chemical shrinkage is always higher than that
measured by heat evolution and that the rate measured by the former also decreases faster during
the deceleration stage Therefore the ratio of chemical shrinkage to heat evolution associated
with C3A hydration is higher than that associated with C3S hydration during the initial reaction
22
(to form ettringite) and probably the reverse is true during the later reaction (to form
monosulfoaluminate) It should be noted that the ratio of a3 to b3 associated with C3A hydration
as shown in Table 4 represents the long-term results of some average cements and is not strictly
applicable here
0 20 40 600
1
2
3
4
5x 10
-3
Time (h)
Heat
evolu
tion r
ate
(W
g c
em
ent)
0 20 40 600
1
2
3
4
5
6x 10
-3
Time (h)
Heat
evolu
tion r
ate
(W
g c
em
ent)
0 20 40 600
1
2
3
4
5x 10
-3
Time (h)
Heat
evolu
tion r
ate
(W
g c
em
ent)
0 20 40 600
1
2
3x 10
-3
Time (h)
Heat
evolu
tion r
ate
(W
g c
em
ent)
Measured heat evolution Transformed from chemical shrinkage
Class CClass A
Class G Class H-I
Figure7 Heat evolution vs transformed chemical shrinkage
for the different types of cement (derivative curves)
The integral curves of heat evolution of different cements cured at different temperatures
are compared with the transformed chemical shrinkage curves (measured at similar
temperatures) in Figure 8 In general excellent agreements can be obtained between the integral
hydration kinetics curves obtained from the two different methods The constants used to
transform the chemical shrinkage curves to fit the heat evolution curves including the correlation
23
factor the scale factor and the offset time are listed in Table 6 The cause of the offset time
(primarily observed for ambient temperature tests) is not yet clear It may be associated with
variations of the duration of the induction periods which tend to be affected by many different
factors that are difficult to control Following Eq (16) the temperature of the chemical shrinkage
test (TCS) can be estimated from the more-precisely-measured temperature of the isothermal
calorimetry test (TIC) by using the scale factor and the previously obtained activation energies in
the 25 degC to 60 degC temperature range (Table 5) As shown in Table 6 the calculated sample
temperatures of the chemical shrinkage tests are slightly higher than the previously estimated
values (Table 3) To further demonstrate that the scale factors are indeed associated with the
slight temperature differences between chemical shrinkage tests and isothermal calorimetry tests
one of the chemical shrinkage tests (Test CS-H-2) was performed by reducing the target
temperature (set with the temperature controllers) by 28 degC (5 degF) The obtained chemical
shrinkage curve of this particular test is found to be directly proportional to the heat evolution
curve (ie C = 1)
24
0 20 40 60 800
50
100
150
200
250
300
350
Time (h)
Cum
ula
tive h
eat
evolu
tion (
Jg
cem
ent)
0 20 40 60 800
100
200
300
400
Time (h)
Cum
ula
tive h
eat
evolu
tion (
Jg
cem
ent)
0 20 40 60 800
50
100
150
200
250
300
350
Time (h)
Cum
ula
tive h
eat
evolu
tion (
Jg
cem
ent)
0 20 40 60 800
50
100
150
200
250
300
Time (h)
Cum
ula
tive h
eat
evolu
tion (
Jg
cem
ent)
Measured heat evolution Transformed from chemical shrinkage
60C
40C
25C
60C
40C
25C
60C
40C
25C
60C
40C
25C
Class A Class C
Class G Class H-P
Figure 8 Heat evolution curves vs transformed chemical shrinkage curves for different types of
cement at different curing temperatures (integral curves)
25
Table 6 Best-fit constants for correlating chemical shrinkage and heat evolution test results and
the respective temperatures of different tests (Refer to Eq (17))
Test No t0 (h) CS ICT TC
H0CS
0(TCS)
(JmL) TIC (degC) TCS (degC)
CS-A-1 IC-A-1 1 109 7600 25 234
CS-C-1 IC-C-1 04 085 7800 25 283
CS-G-1 IC-G-1 07 095 7700 25 259
CS-HP-1 IC-HP-1 12 107 7500 25 236
CS-H-1 IC-H-1 1 111 8000 25 229
CS-A-2 IC-A-2 0 084 8400 40 436
CS-C-2 IC-C-2 0 09 8350 40 423
CS-G-2 IC-G-2 0 086 8850 40 431
CS-HP-2 IC-HP-2 06 09 8700 40 424
CS-H-2 IC-H-2 0 1 8850 40 400
CS-A-3 IC-A-3 0 09 9750 60 624
CS-C-3 IC-C-3 0 09 10100 60 627
CS-G-3 IC-G-3 0 091 9750 60 622
CS-HP-3 IC-HP-3 0 085 10200 60 643
At lab temperature (approximately 25 degC) the correlation factor between heat evolution
and chemical shrinkage (H0CS
0) for the different cements is found to range from 7500 JmL to
8000 JmL well within the previously reported range of 6500 JmL to 8500 JmL [33 34] The
correlation factor increases with increasing curing temperature Since H0 is independent of
curing temperature the results suggest that CS0 decreases with increasing temperature consistent
with previous studies [6 10] In the relatively small temperature range investigated (25 degC to 60
degC) the variations of CS0H
0 and H
0CS
0 with temperature can both be approximated by linear
models Figure 9 shows the dependence of CS0H
0 on curing temperature for different types of
cement The least square fits of all data points indicate the average rate of change to be -000076
mLkJ per degC for CS0H
0 and +58 JmL per degC for H
0CS
0 When normalized to the values at 25
degC the linear reduction rate of CS0 with increasing temperature is determined to be 057 065
058 066 and 057 per degC for Class A C G H-P and H-I cements respectively
26
suggesting an average reduction rate of 060 (with a standard deviation of 0046 ) per degC
For comparison a reduction rate of 078 per degC may be obtained from test data of Zhang et al
[10] in the same temperature range where the correlations between wn0 and CS
0 of Class H
cement were investigated
20 30 40 50 60 70009
01
011
012
013
014
Curing temperature (C)
CS
0H
0 (
mLk
J)
Class A
Class C
Class G
Class H-P
Class H-I
Figure 9 Dependence of correlation factor (CS0H
0) on curing temperature
5 Conclusions
The hydration kinetics of different types of cement cured at different temperatures has
been evaluated by both the traditional isothermal calorimetry test method and a newly developed
chemical shrinkage test method A scale factor model that can be used to predict the effect of
curing temperature on cement hydration kinetics previously validated with chemical shrinkage
test data is further discussed and validated with the heat evolution test data Due to the fact that
the different compounds in cement hydrate at different rates and have different temperature
sensitivities the model is found to be more accurate for cement with simpler compositions (eg
27
no or very low C3A content) andor for smaller temperature changes (eg le 15 degC) The scale
factor model also introduces a new method of estimating the apparent activation energies of
Portland cement (ie the best-fit method) The apparent activation energies of Class A C G H-P
and H-I cements determined using the heat of hydration data in the temperature range of 25 degC to
60 degC are 402 kJmol 37 kJmol 402 kJmol 355 kJmol and 37 kJmol respectively
A correlation study of chemical shrinkage and isothermal calorimetry test data indicate
that total chemical shrinkage is proportional to cumulative heat evolution if the two tests are
conducted on the same cement paste at the same curing temperature in agreement with previous
research The scale factor model discussed in this study can be used to account for any
unmeasured small temperature differences The proportionality constant namely the ratio of total
chemical shrinkage to total heat release at complete hydration (CS0H
0) varies slightly with
cement composition and decreases with increasing curing temperature If H0 is assumed to be
independent of curing temperature then CS0 decreases approximately linearly with increasing
temperature at a rate of 0600 plusmn 0046 per degC from the reference values at 25 degC for the
different cements used in this study Compared to C3S hydration early C3A hydration (typically
at the main hydration peak) seems to create a higher ratio of chemical shrinkage to heat
evolution while later C3A hydration (typically during the deceleration period) appears to create a
lower ratio As a result the rate of chemical shrinkage curve typically has a slightly different
shape than the heat flow curve for cements that contain significant C3A
Acknowledgements
Financial support for this study was provided by Halliburton Energy Services The
continuous support from Dr Lewis Norman and Dr Ron Morgan is cordially appreciated The
authors would also like to thank Mr David Meadows for his help in developing the chemical
28
shrinkage test apparatus and Ms Donna Chen for her help in performing part of the experimental
work
References
[1] Parrott LJ M Geiker WA Gutteridge D Killoh Monitoring Portland cement hydration
comparison of methods Cement and Concrete Research 20 (1990) pp 919-926
[2] Gutteridge WA and JA Dalziel Filler Cement The Effect of the Secondary Component
on the Hydration of Portland Cement Part I A Fine Non-Hydraulic Filler Cement and Concrete
Research 20 (1990) pp 778-782
[3] Bentz DP A three-dimensional cement hydration and microstructure program I hydration
rate heat of hydration and chemical shrinkage NISTIR 5756 US Department of Commerce
Washington DC 1995
[4] Escalante-Garcia JI Nonevaporable water from neat OPC and replacement materials in
composite cements hydrated at different temperatures Cement and Concrete Research 33 (11)
(2003) pp 1883-1888
[5] Lura P F Winnefeld S Klemm Simultaneous Measurements of Heat of Hydration and
Chemical Shrinkage on Hardening Cement Pastes Journal of Thermal Analysis and Calorimetry
101 (3) (2010) pp 925-932
[6] Geiker M Studies of Portland cement hydration measurements of chemical shrinkage and a
systematic evaluation of hydration curves by means of the dispersion model PhD Thesis
Technical University of Denmark 1983
[7] Mounanga P V Baroghel-Bouny A Loukili A Khelidj Autogenous deformations of
cement pastes Part I Temperature effects at early age and micro-macro correlations Cement
and Concrete Research 36 (2006) 110-122
29
[8] Peethamparan S E Weissinger J Vocaturo J Zhang G Scherer Monitoring chemical
shrinkage using pressure sensors Advances in the Material Science of Concrete ACI SP-270
Vol 7 (2010) 77-88
[9] Pang X and C Meyer Cement chemical shrinkage as measure of hydration kinetics and its
relationship with nonevaporable water ACI Materials Journal 109 (3) (2012) pp 341-352
[10] Zhang J EA Weissinger S Peethamparan GW Scherer Early Hydration and Setting of
Oil Well Cement Cement and Concrete Research 40 (2010) pp 1023-1033
[11] Scherer GW J Zhang JJ Thomas Nucleation and growth models for hydration of
cement Cement and Concrete Research 42 (2012) 982-993
[12] Pang X C Meyer R Darbe GP Funkhouser Modeling the effect of curing temperature
and pressure on cement hydration kinetics ACI materials journal accepted
[13] API Specification 10A Specification for Cements and Materials for Well Cementing
American Petroleum Institute 2010 38 pp
[14] ASTM C150C150M ndash 09 Standard Specification for Portland Cement ASTM
International West Conshohocken PA 2009 10 pp
[15] ASTM C1608 Standard Test Method for Chemical Shrinkage of Hydraulic Cement Paste
ASTM International West Conshohocken PA 2007 4 pp
[16] Sant G P Lura J Weiss Measurement of Volume Change in Cementitious Materials at
Early Ages Review of Testing Protocols and Interpretation of Results Journal of the
Transportation Research Record V 1979 (2006) pp 21-29
[17] Costoya M Kinetics and microstructural investigation on the hydration of tricalcium
silicate Doctoral Thesis Eacutecole Polytechnique Feacutedeacuterale de Lausanne Switzerland 2008
30
[18] Pang X Effects of curing temperature and pressure on the chemical physical and
mechanical properties of Portland cement PhD Dissertation Columbia University New York
2011
[19] ASTM C1679 Standard Practice for Measuring Hydration Kinetics of Hydraulic
Cementitious Mixtures Using Isothermal Calorimetry ASTM International West
Conshohocken PA 2009
[20] Bentz DP and CF Ferraris Rheology and setting of high volume fly ash mixtures
Cement and Concrete Composites 32 (4) (2010) pp 265-270
[21] Mills RH Factors influencing cessation of hydration in water cured cement pastes Special
Report No 90 in Proceedings of the Symposium on the Structure of Portland Cement Paste and
Concrete Highway Research Board Washington DC 1966 pp 406-424
[22] Mounanga P A Khelidj A Loukili V Baroghel-Bouny Predicting Ca(OH)2 Content and
chemical shrinkage of hydrating cement pastes using analytical approach Cement and Concrete
Research 34 (2004) pp 255-265
[23] Swaddiwudhipong S D Chen M H Zhang Simulation of the exothermic hydration
process of Portland cement Advances in Cement Research 14 (2) (2002) pp 61-69
[24] Schindler AK and KJ Folliard Heat of hydration models for cementitious materials ACI
Materials Journal 102 (1) (2005) pp 24-33
[25] Poole JL KA Riding KJ Folliard MCG Juenger AK Schindler Methods for
calculating activation energy for Portland cement ACI Materials Journal 104 (1) (2007) pp 303-
311
[26] Hewlett PC Learsquos Chemistry of Cement and Concrete 4th edition Butterworth-
Heinemann Oxford England 1998
31
[27] Escalante-Garcia JI and JH Sharp Effect of temperature on the hydration of the main
clinker phases in Portland cements Part I neat cements Cement and Concrete Research 28 (9)
(1998) pp 1245-1257
[28] Taylor HFW Cement Chemistry 2nd edition Thomas Telford London UK 1997
[29] Bentz DP T Barret I de la Varga J Weiss Relating compressive strength to heat release
in mortars Advances in Civil Engineering Materials accepted
[30] ASTM C1074 Standard Practice for Estimating Concrete Strength by the Maturity Method
ASTM International West Conshohocken PA 201010 pp
[31] Bushnell-Watson SM The effect of temperature upon the setting behaviour of refractory
CAC PhD Thesis University of Sheffield 1987
[32] Banfill PFG Superplasticizers for Ciment Fondu Part 2 effect of temperature on the
hydration reaction Advances in Cement Research 7 (1995) pp 151ndash157
[33] Bentz D G Sant J Weiss Early-age properties of cement-based materials I Influence of
cement fineness ASCE Journal of Materials in Civil Engineering 20 (7) (2008) pp 502-508
[34] Bentz DP Blending different fineness cements to engineer the properties of cement-based
materials Magazine of Concrete Research 62 (5) (2010) pp 327-338
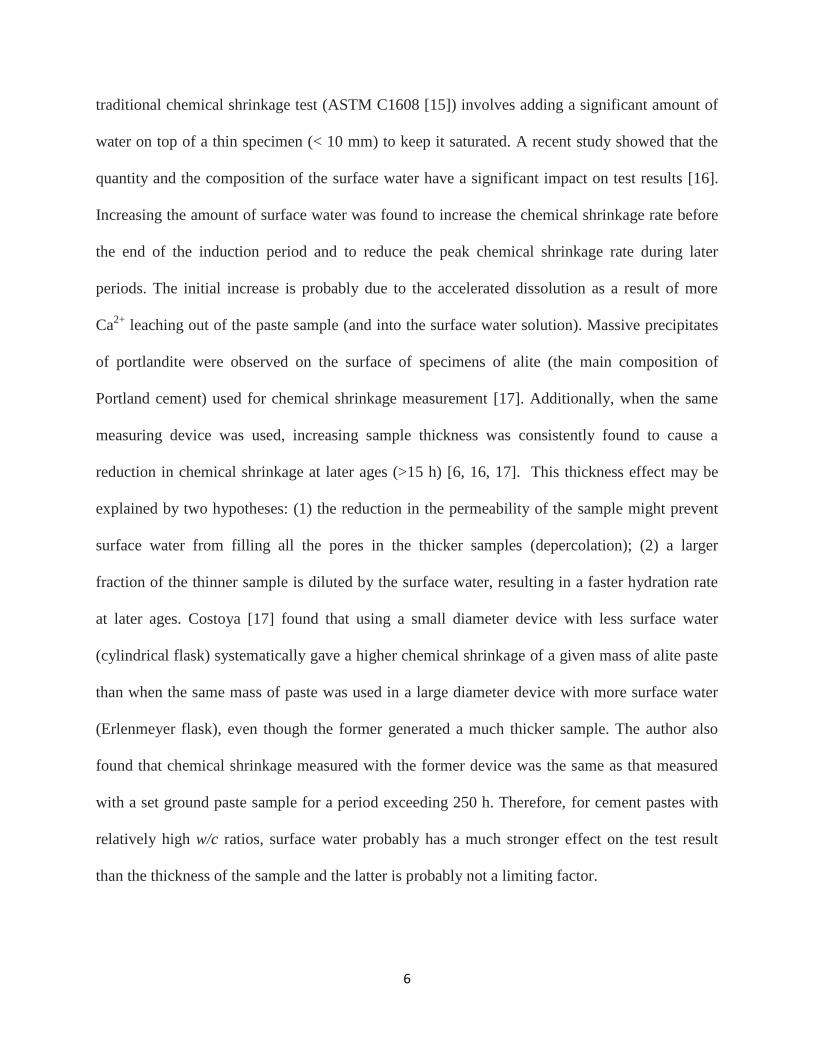
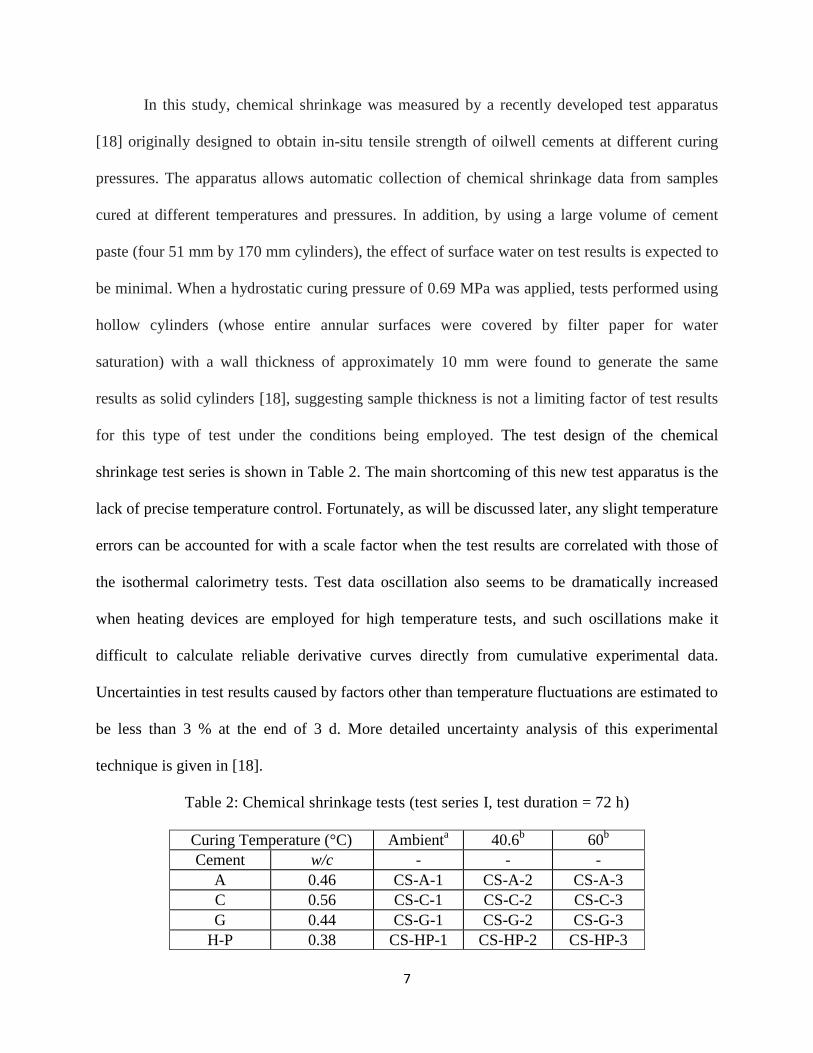
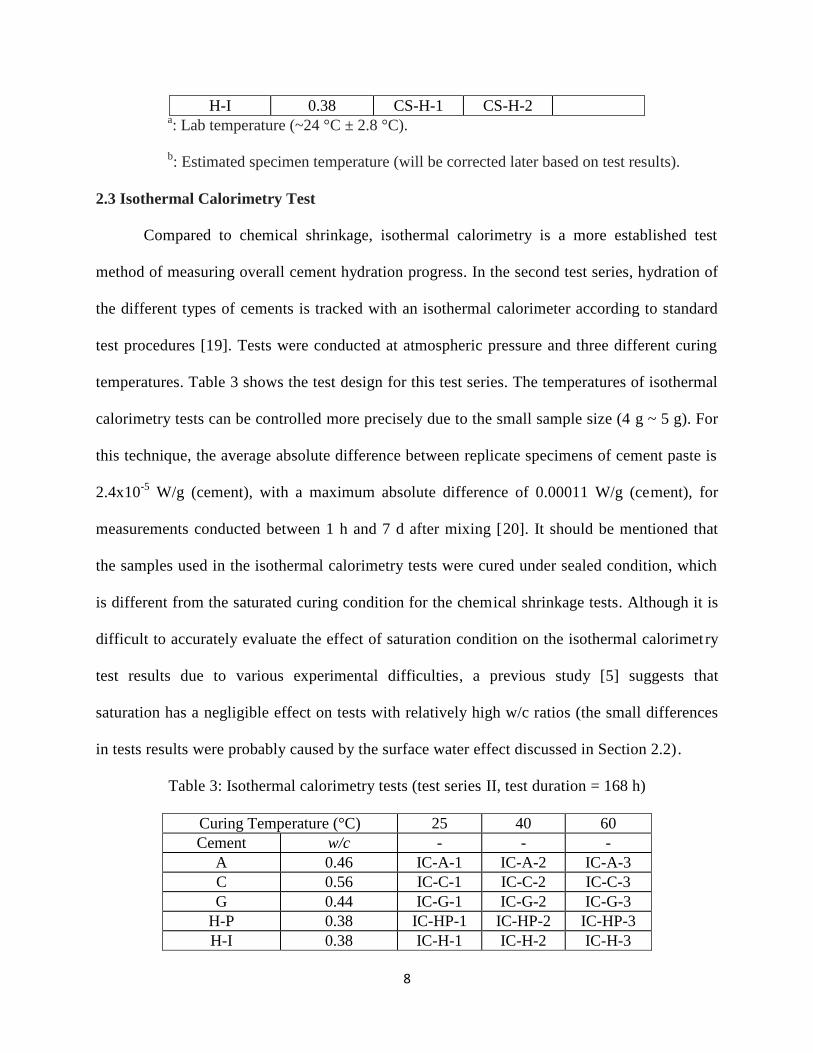
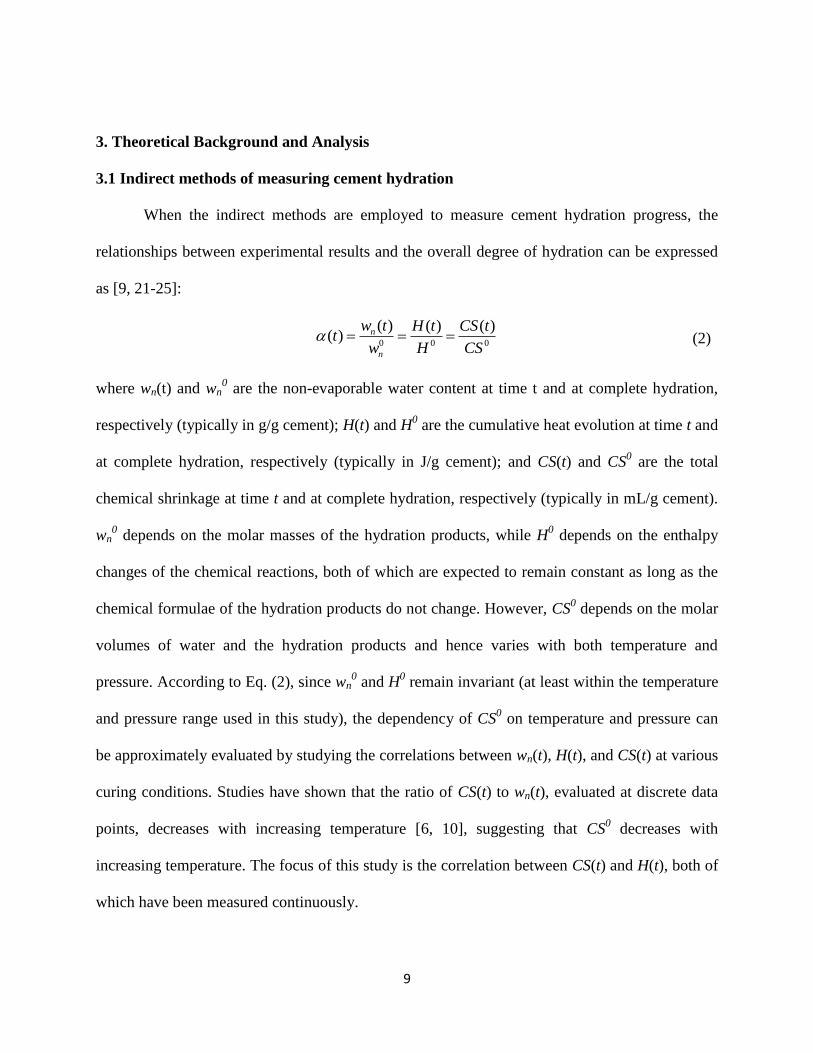
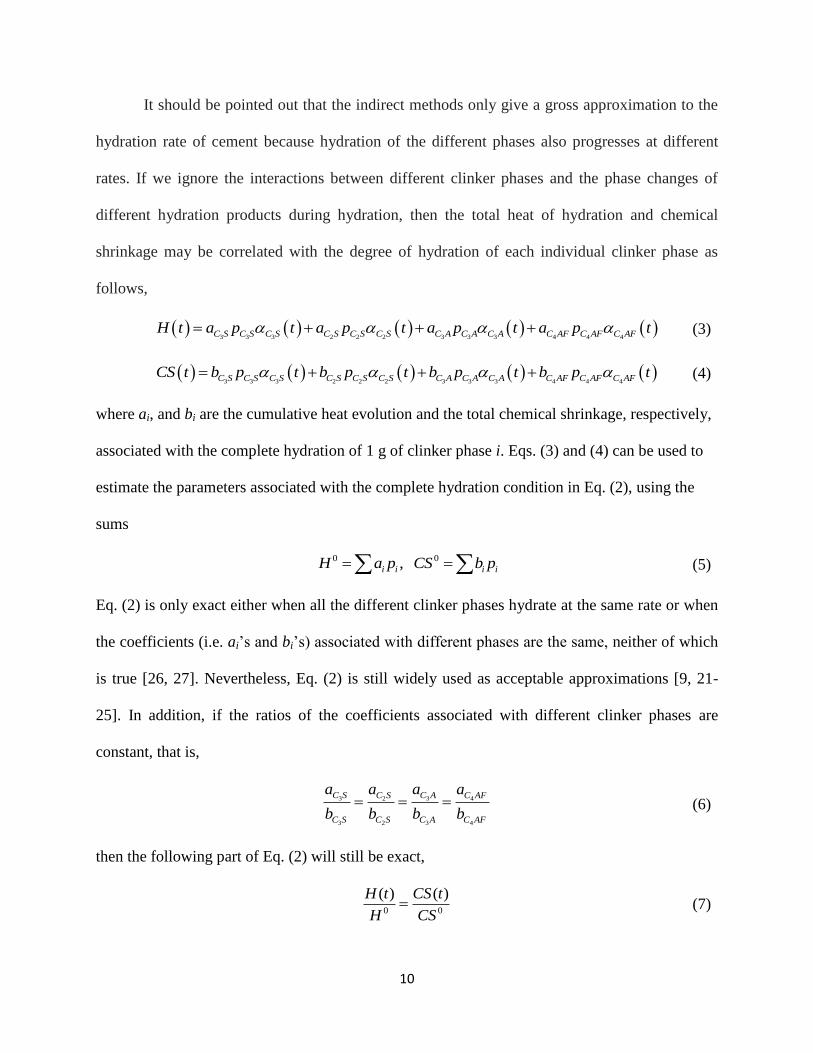
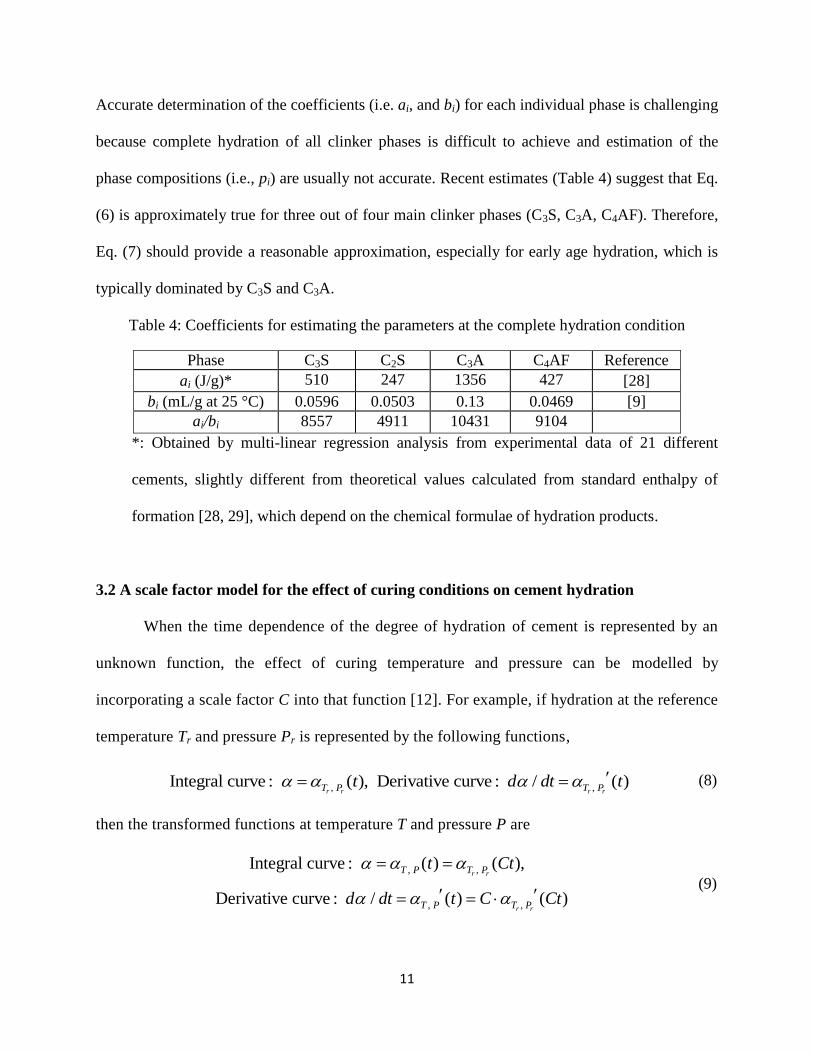
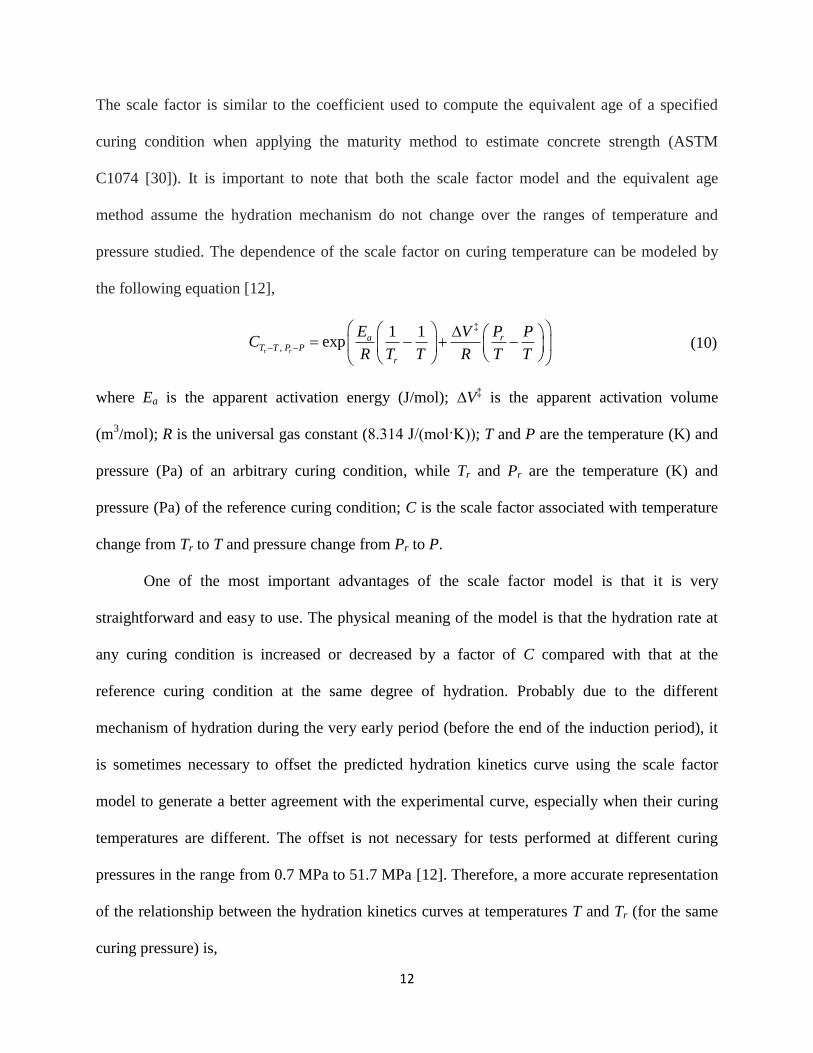
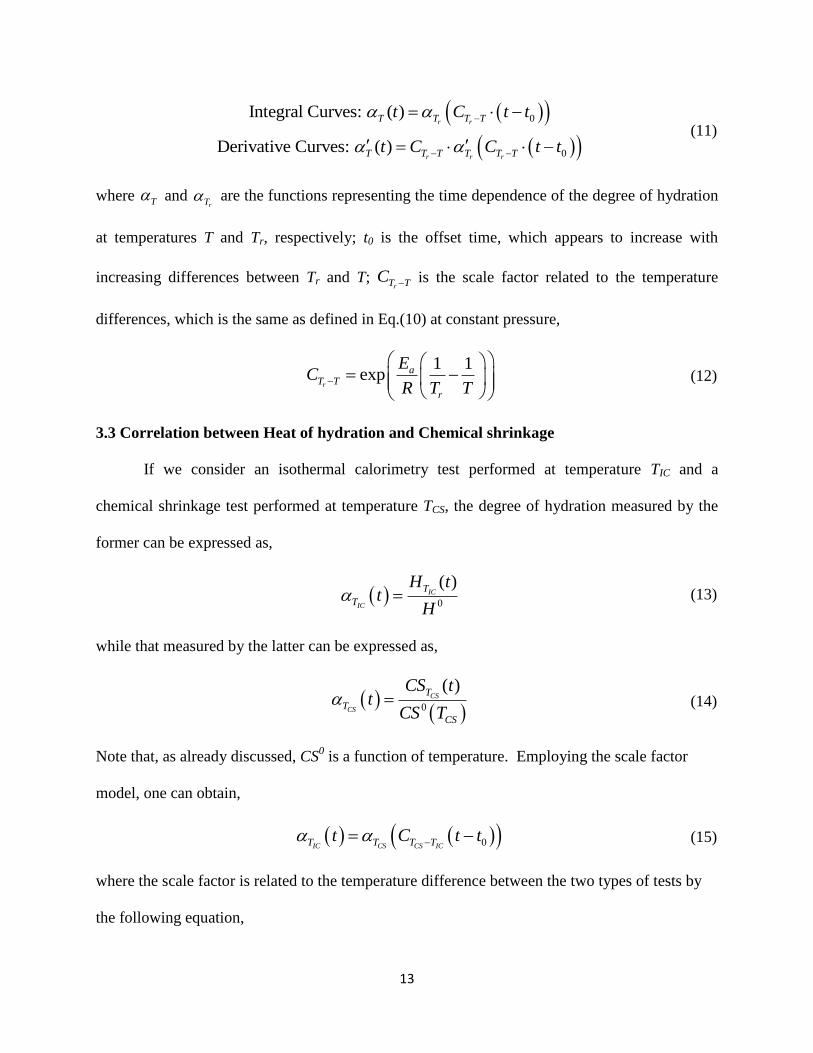
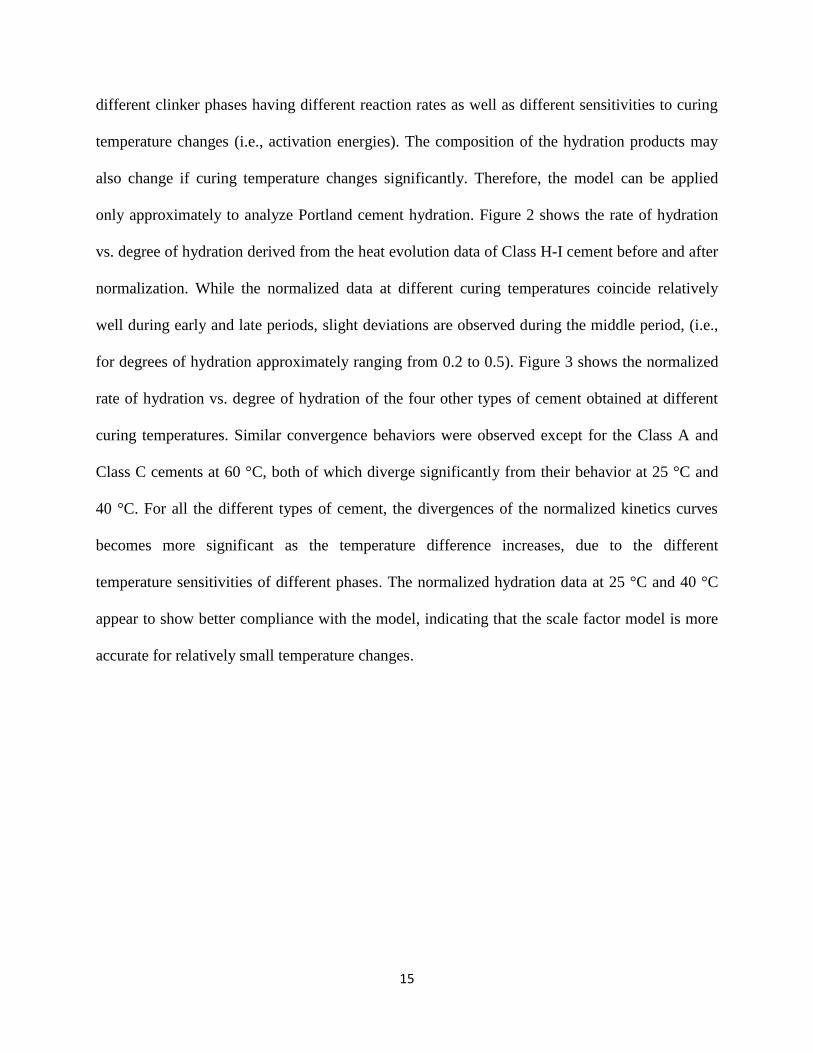
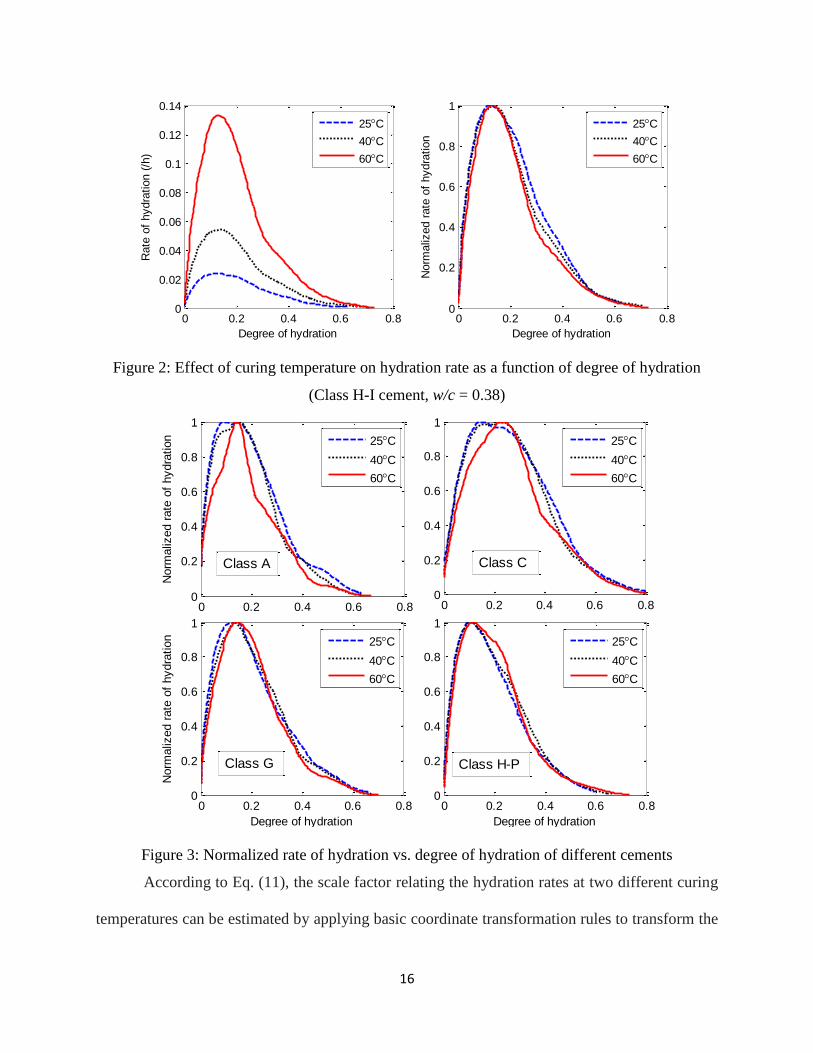
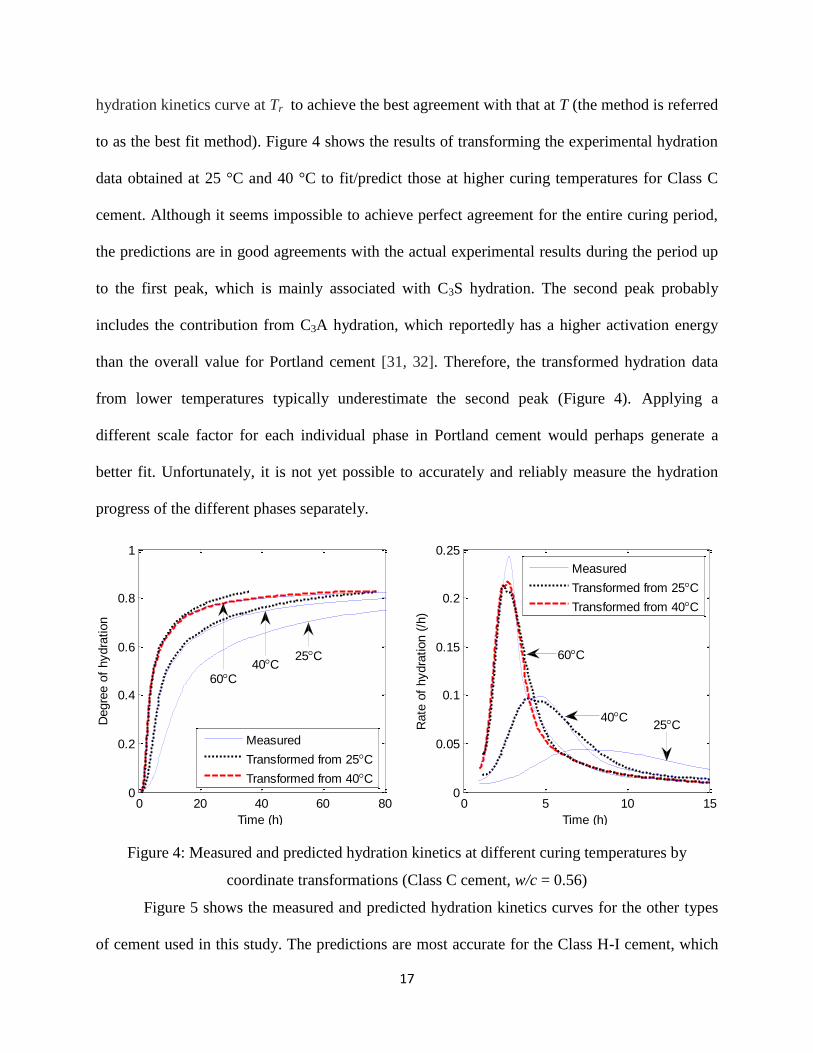
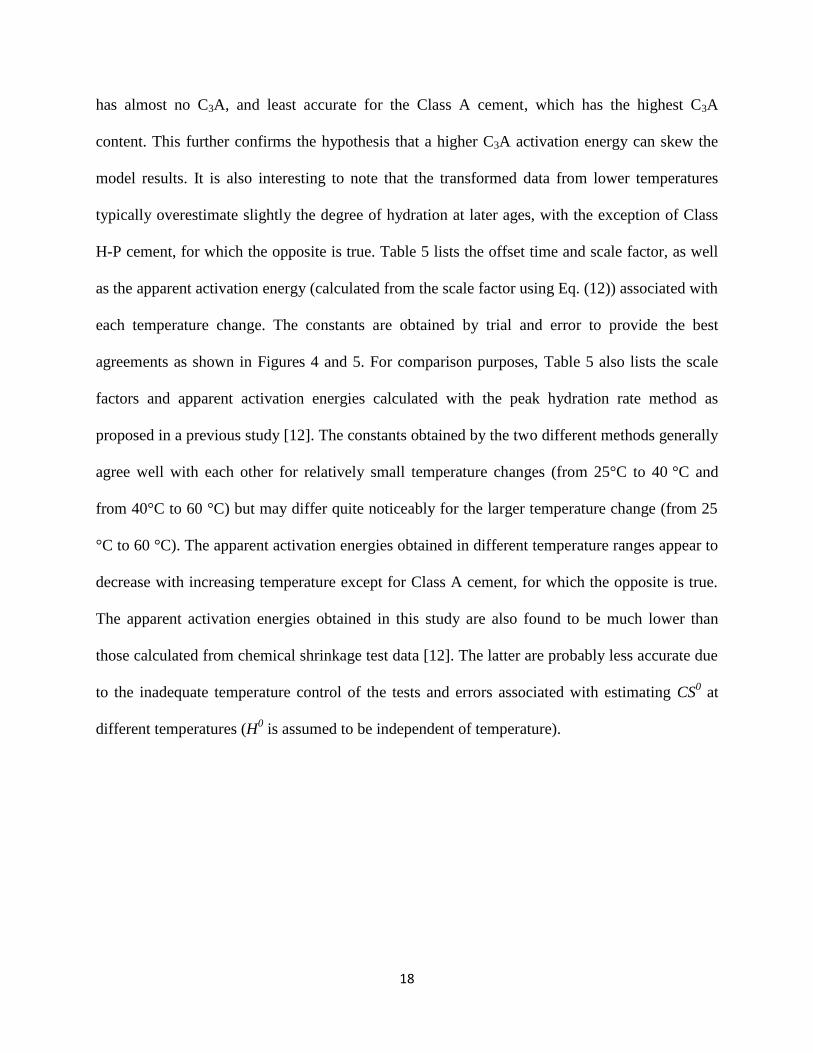
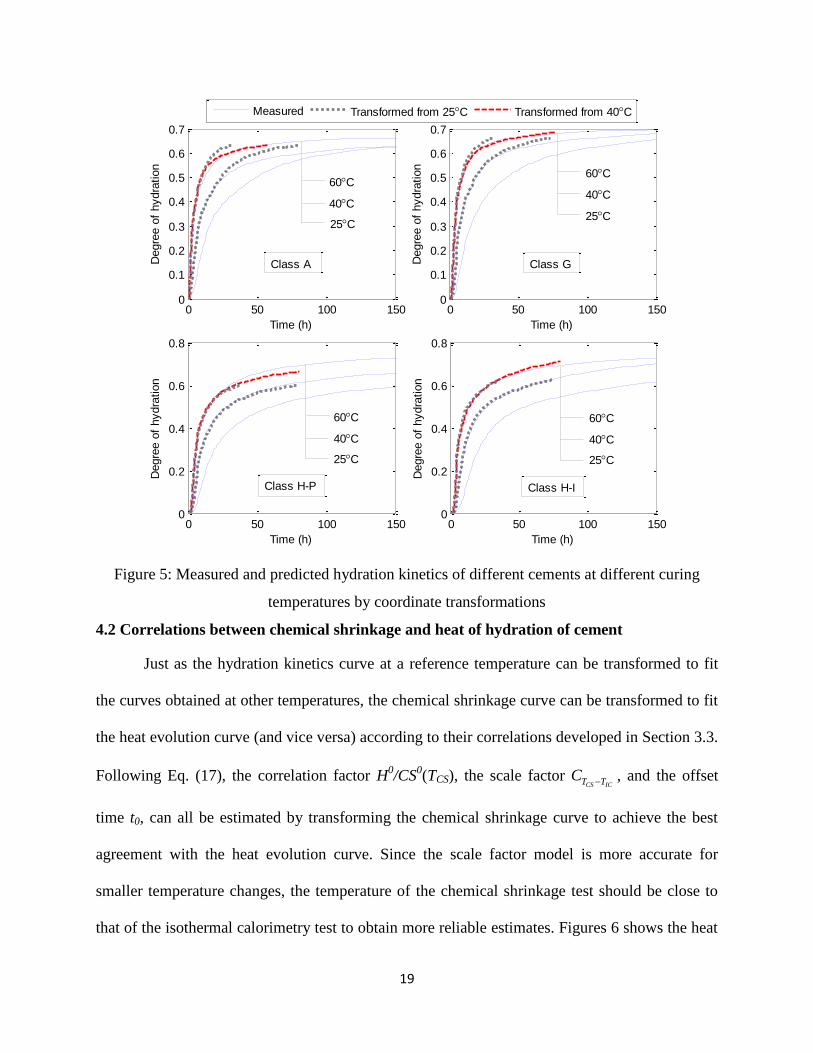
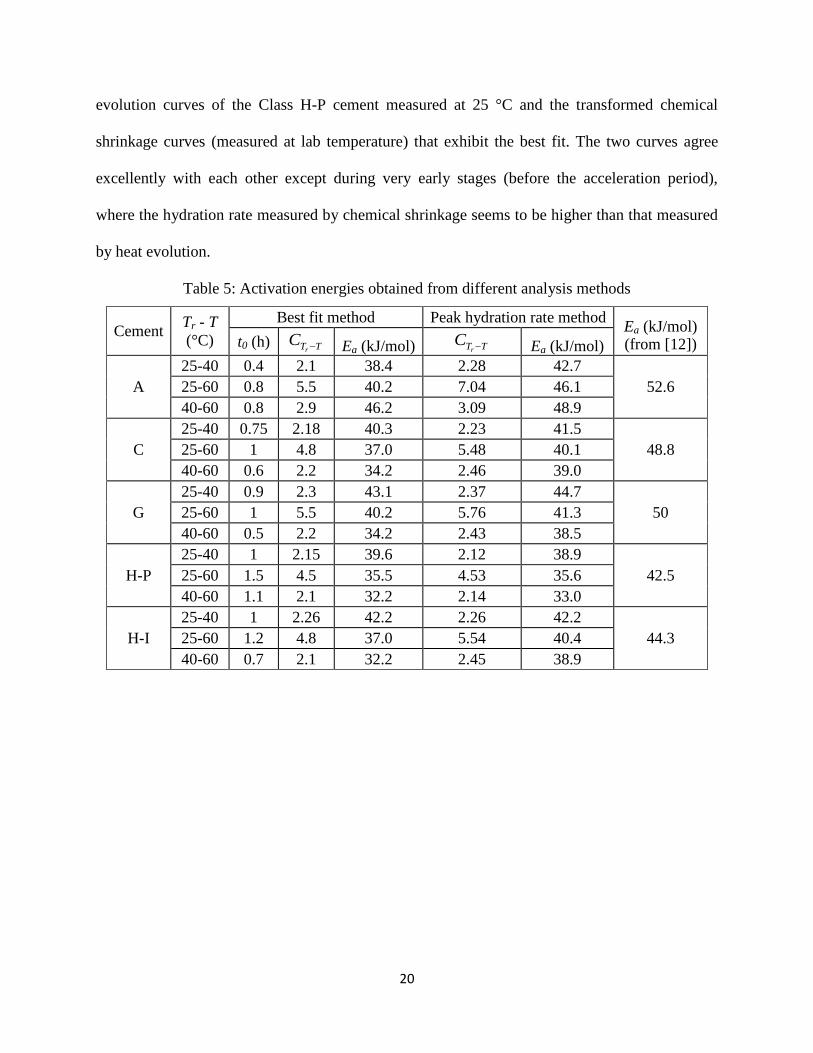
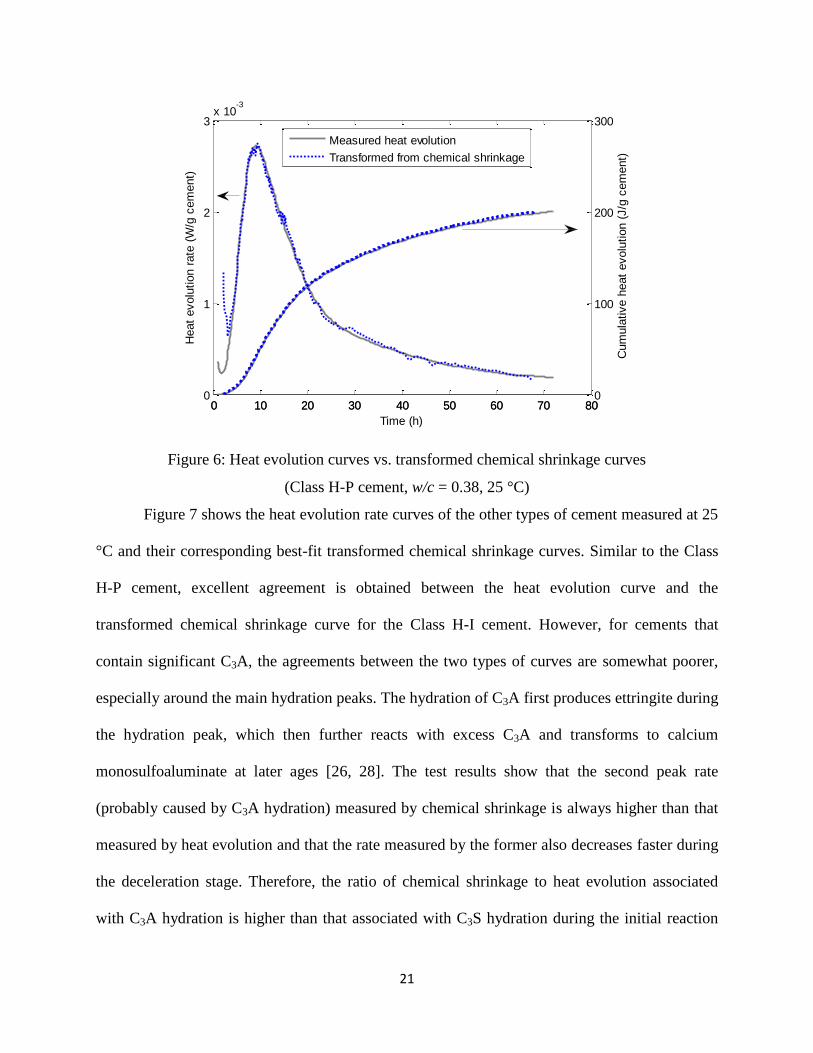
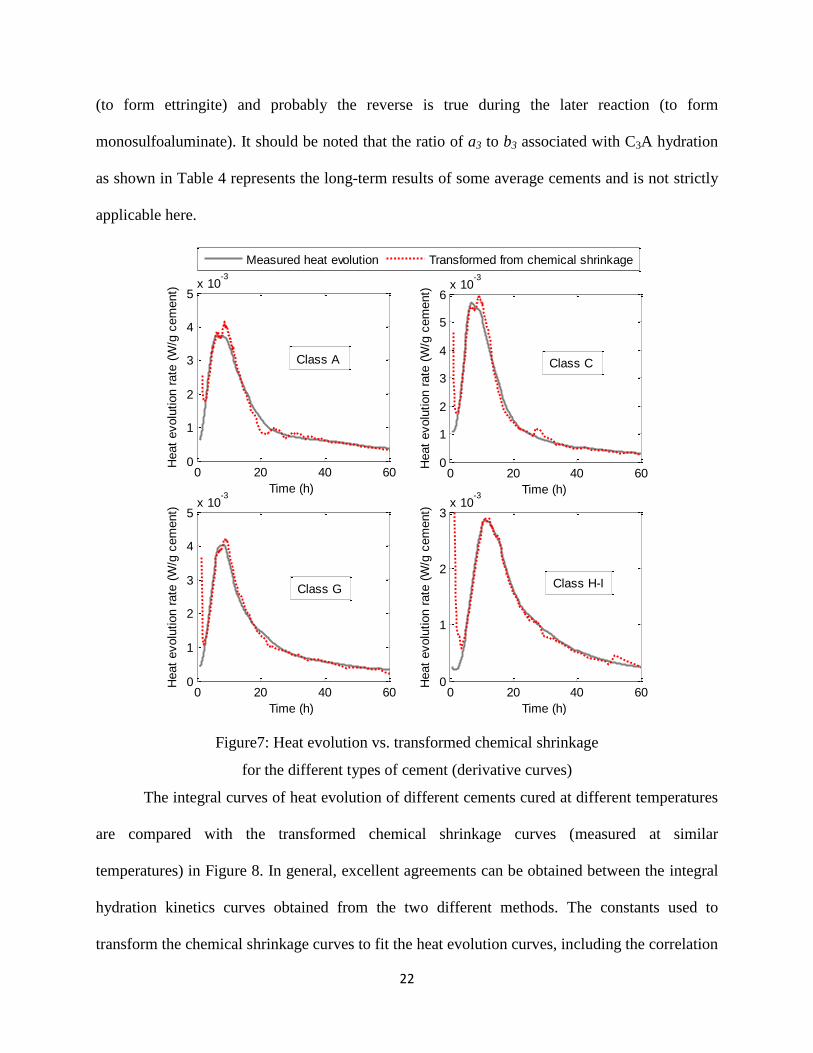
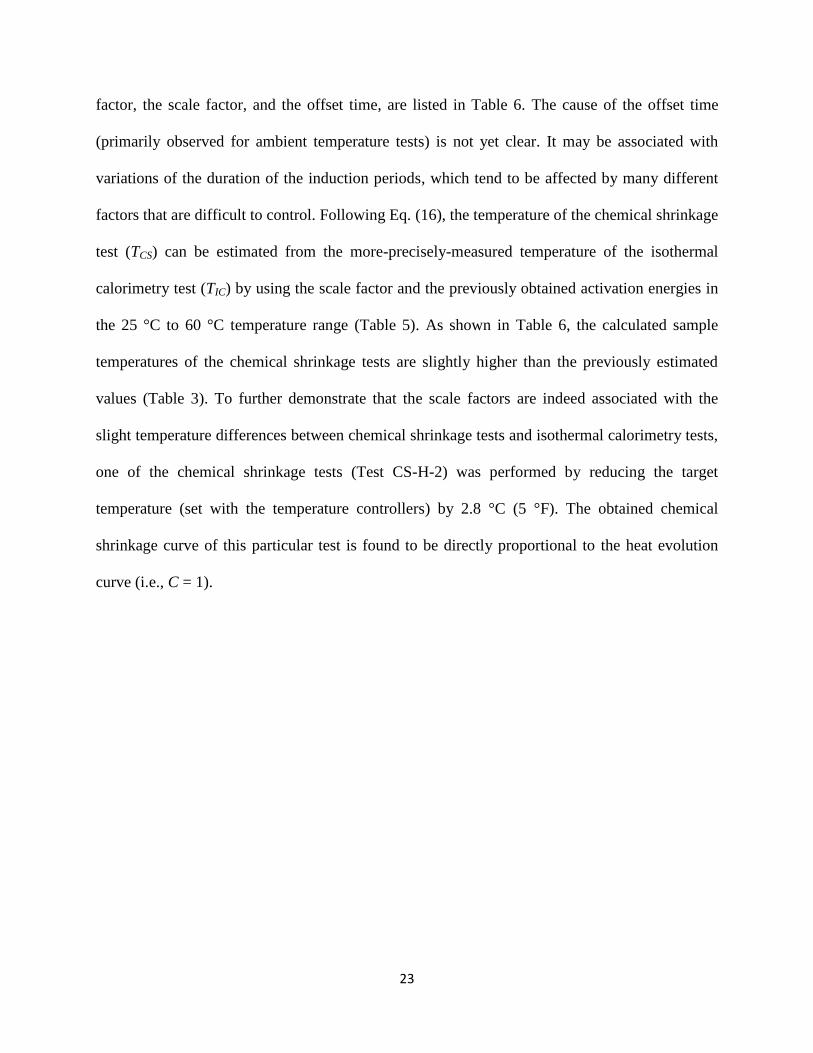
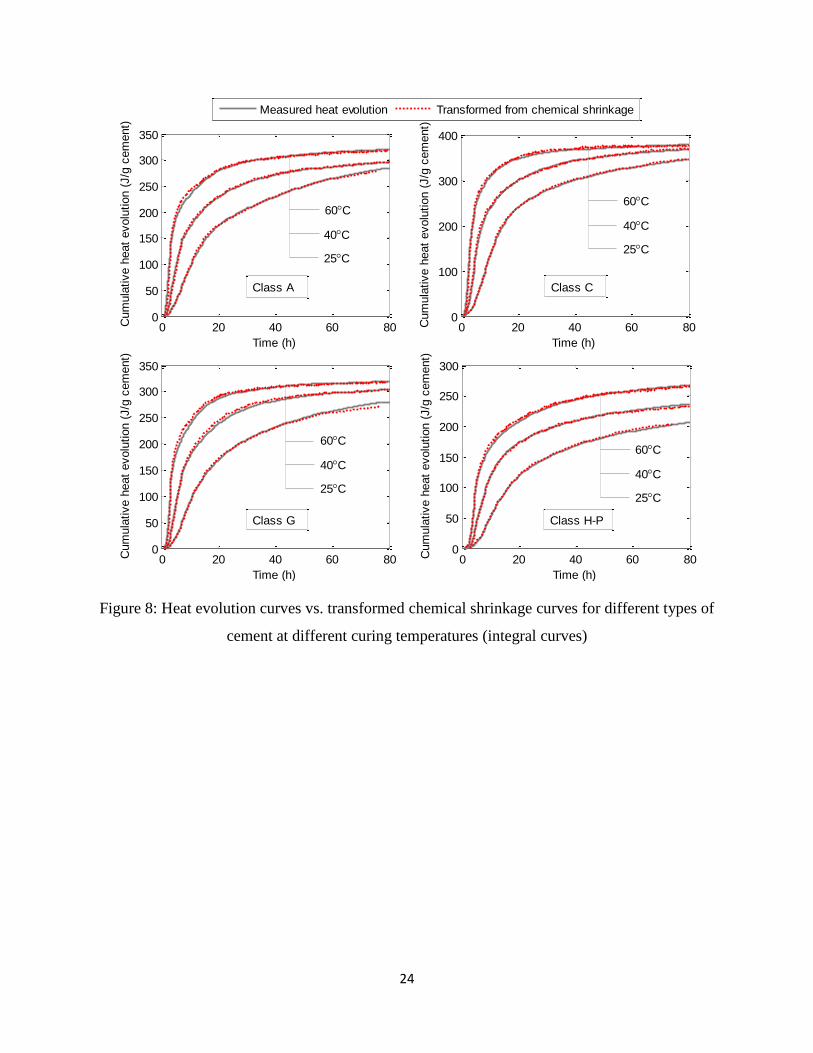
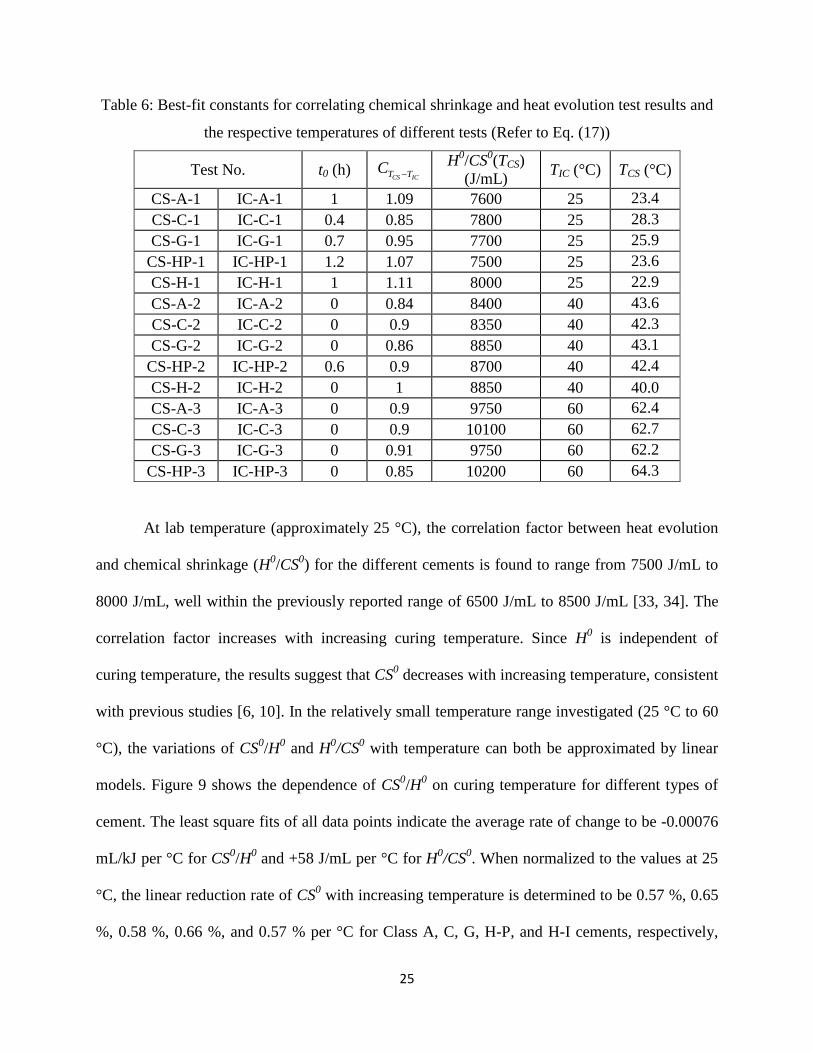
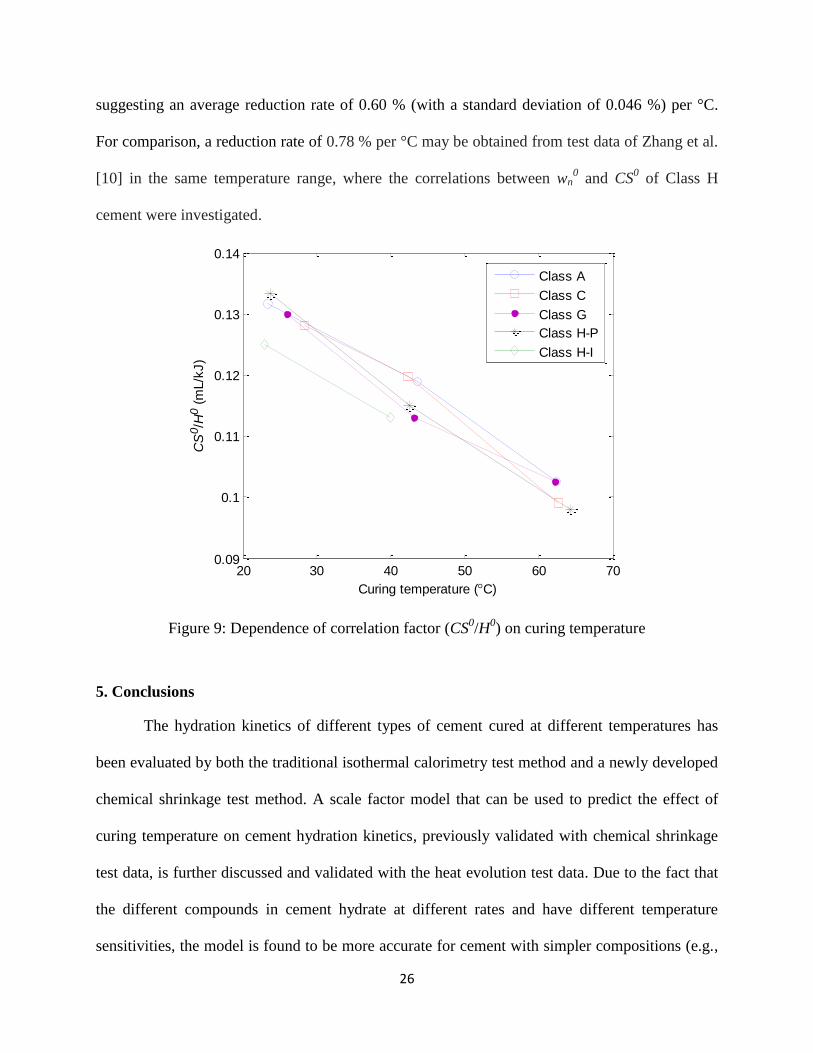