Embed Size (px)
Citation preview
Business Management Dynamics Vol.1, No.4, Oct 2011, pp.33-49
A Comparison on Efficiency of Domestic and Foreign Banks in Malaysia: A DEA Approach Ong Tze San1, Lim Yee Theng1 and Teh Boon Heng2
Abstract This study utilizes non parametric Data Envelopment Analysis (DEA) to analyze and compare the efficiency of foreign and domestic banks in Malaysia. The analysis is based on a panel data set of 9 domestic banks and 12 foreign banks in Malaysia over the period of 2002-2009. Intermediation approach is used to define the inputs and outputs in computerizing the efficiency scores. Surprisingly, the findings are inconsistent with most of the findings of previous studies where the foreign banks were outperforming their domestic peers in term of efficiency. Conversely, the finding of this study shows that domestic banks have a higher efficiency level than foreign banks, this imply that domestic banks are relatively more managerially efficient in controlling their costs. The second stage of the empirical results is based on the Tobit model, which suggests that the pure technical efficiency (PTE) of banks in Malaysia is mainly affect by capital strength, loan quality, expenses and asset size. .
Key words: DEA, banks, local, foreign, Malaysia, comparison.
Available online
www.bmdynamics.com ISSN: 2047-7031
INTRODUCTION
The efficiency of banks in Malaysia is important and should receive greater attention. The foremost reason is that banks play an important role as financial intermediaries. The banks are the party who channel funds from those who have excess funds to those who have productive needs for those funds. Therefore, their efficiency will indirectly affect the whole country’s economics, operation and wealth. The second reason is that as the evidence proven that banks play an important role in the Global Crisis 2008, however, Malaysian capital and debt market are not well developed. Thus, success of banks in term of efficiency has attracted the interest from researchers, investors and policy makers. Lastly, the banks in Malaysia are facing stronger rivalry due to the globalization and liberalization of the financial system. Furthermore, the foreign banks entry is just like a coin has two sides. It either brings harms or potential benefits to domestic banks, therefore the finding of efficiency of domestic and foreign banks in Malaysia become important. BACKGROUND OF STUDY The Structure of the Malaysian Banking System
The Malaysian banking system can be classified into commercial banking financial institutions and non-commercial banking financial institutions. In fact, these two institutions are different in term of the activities that they undergo. Furthermore, the banking system can be classified into three main types; there are commercial banks (domestic and foreign), finance companies and the merchant banks.
The main players in the banking system are commercial banks since they are the largest and most significant funds providers in the banking system. Besides, commercial banks in Malaysia not only enjoy the widest scope of permissible activities but also able to engage in a full range of banking services. There are total of 23 commercial banks in Malaysia where domestic bank 9 and foreign bank 14.
On the other hand, finance companies formed the second largest group of deposit taking institutions in Malaysia. Finance companies engage in specializing of consumption credit, comprising mainly of hire purchase financing, leasing, housing loans, block discounting and secured personal loans. Whereas, merchant banks play an important role in the short-term money market and capital raising activities.
1 Faculty of Economics and Management, University Putra Malaysia, Malaysia. [email protected]. 2 Faculty of Management, Multimedia University Malaysia
Business Management Dynamics Vol.1, No.4, Oct 2011, pp.33-49
Research Objectives
The main objectives in this study are as follow:
1. To analysis and compare the efficiency of domestic and foreign banks in Malaysia during the period of 2002 to 2009.
2. To identify whether domestic or foreign banks are more efficient during the Global Crisis 2008.
3. To examine the determinants of efficiency of banks in Malaysia. Impact of Foreign Bank Entry
Several studies have found that the entry of foreign bank can bring potential benefits in terms of better resource allocation and higher efficiency (Levine, 1996; Walter and Gray, 1983; Goldberg and Saunders, 1981; Gelb and Sagari, 1990). Moreover, the study of Levine (1996) had mentioned that allow the entry of foreign banks may (i) enhance domestic financial development by promote improvement of domestic financial infrastructure and financial policy, (ii) improve a country’s access to international capital markets, (iii) improve the financial services quality in domestic bank by stimulate bank competition and subsequently encourage the domestic banks implement more advance banking skills and technology. However, the foreign banks entry has certain disadvantages too. According to Stiglitz (1993), the entry of foreign bank can bring impact to domestic banks in term of potential costs. The researcher found that domestic banks have to incur more costs in order to compete with foreign banks by applying more advance banking skills and technology. In addition, the results of Claessens et al (2001) shown that the foreign banks entry has brought certain risks to domestic banks by making the competition more intense and thereby reduce the earnings of domestic banks. The Comparison of the Efficiency of Domestic and Foreign Banks: Empirical Evidence
The literature on bank efficiency found that foreign banks showed lower efficiency than domestic banks, especially in developed countries (Hasan et al., 1996; Mahajan et al., 1996; Kraft et al., 2006; Havrylchyk, 2006). While, there are still have certain foreign banks from other countries able to operate more efficiently than domestic banks in other developed countries (Berger et al., 1999). This indicates that the empirical findings have been ambiguous and inconclusive. Determinants of Bank Efficiency
In fact, the choice of variables in bank efficiency studies will significantly affects the research’s result. The variables that researcher used in this study are specific to the bank specific variable. The reason behind this is this type of variables is controllable by the banks. Hence, the banks management is able to alter the bank’s efficiency level by controlling the variable that has significant relationship with the bank efficiency. Researcher decided to use capital strength as a proxy of capitalization, loan quality as a proxy of asset quality, expenses as a proxy of management capability, profitability as a proxy of earning robustness, asset size as a proxy of bank size and liquidity as a proxy of liquidity to identify the determinants of bank efficiency and its relationship. Each of these independent variables will be discussed in turn. Capital strength
Capital is the ratio of book value of equity to total assets (Equity/ TA). The past literatures have proven that bank efficiency is associated with equity-to-total asset ratio (Kaparakis et al., 1994; Esho, 2001; Chou et al., 2002; Chan and Liu, 2006). Loan Quality
Business Management Dynamics Vol.1, No.4, Oct 2011, pp.33-49
By referring to Table 2.1, the ratio of loan loss provision to total loans (LLP/TL) is the formula that most commonly used in measuring loan quality (Sufian, 2009; Kosmidou et al, 2007; Havrylchyk, 2006; Chiu and Chen, 2008; Barr et al, 2002; Sufian and Abdul Majib, 2007). Expenses
By referring to Table 2.1, the ratio of non interest expenses to average assets is the ratio that more frequently used on studies of bank efficiency in measuring the management quality (Sufian, 2009; Kosmidou et al, 2007). Profitability
Profits are defined to be the ratio of total revenue to total assets. Referring to literature search, return to asset (ROA) is more commonly used on research of bank efficiency in measuring the profitability of banks compare to return to equity (ROE). Therefore, in this study, researcher will choose to use ROA in measuring the profitability of the banks. Asset Size
The natural log of total assets is used to examine the relationship between bank efficiency and bank size (Havrylchyk, 2006; Kosmidou et al, 2007; Chiou, 2009; Sufian, 2009). Liquidity
Altunbas et al. (2002), Kosmidou et al. (2007) and Sufian (2009) had used the ratio of total loans to total assets as a proxy for liquidity risk or particularly, as an indicator for bank liquidity position. METHODOLOGY Research Design
The whole Malaysian banking industry is included in this study and Malaysian Islamic Banks, Development Banks, Investments Banks, Export-Import Banks and Cooperative Banks are excluded from the sample. On the other hand, this empirical study covered data from an eight-year study period (2002-2009) in calculating the efficiencies in order to provide a better picture of efficiency. The chosen period is including the period of Global Crisis 2008. Hence, this enables researcher to examine the impact of Global Crisis 2008 to the efficiency of domestic and foreign banks in Malaysia. Furthermore, the selection criterion is based on the continuous operating of the banks from 2002 to 2009 to make sure that the number of sample is consistent. As at the year 2009, there were 9 domestically incorporated and 14 locally incorporated foreign commercial banks in Malaysia (Source: Bank Negara Malaysia, 2009). But due to 1 bank started operating in Malaysia at the year 2009 and unable to get the annual report of another bank, only 9 domestic banks and 12 foreign banks are included in this study. Bank’s Inputs and Outputs
Since there is no consensus in the literature concerning the most appropriate approach; the researcher applies the approach that frequently adopted by many other studies, such as Hasan and Marton (2003); Bonin et al (2005); Matthews and Mahadzir (2006); Sufian (2009) utilized the intermediation approach to classify bank’s input and outputs. Because of the insufficient banking quantity data such as number of employees, branches and deposit accounts. This paper according to Chiu and Chen (2008), Matthews and Mahadzir (2006) and Chiou (2009) utilized total deposits and fixed assets as bank’s inputs. Whereas, according to Sufian (2009), Chiou (2009), Miller and Noulas (1996) consider total loans, and total investments as bank’s outputs. Efficiency Measurement
Business Management Dynamics Vol.1, No.4, Oct 2011, pp.33-49
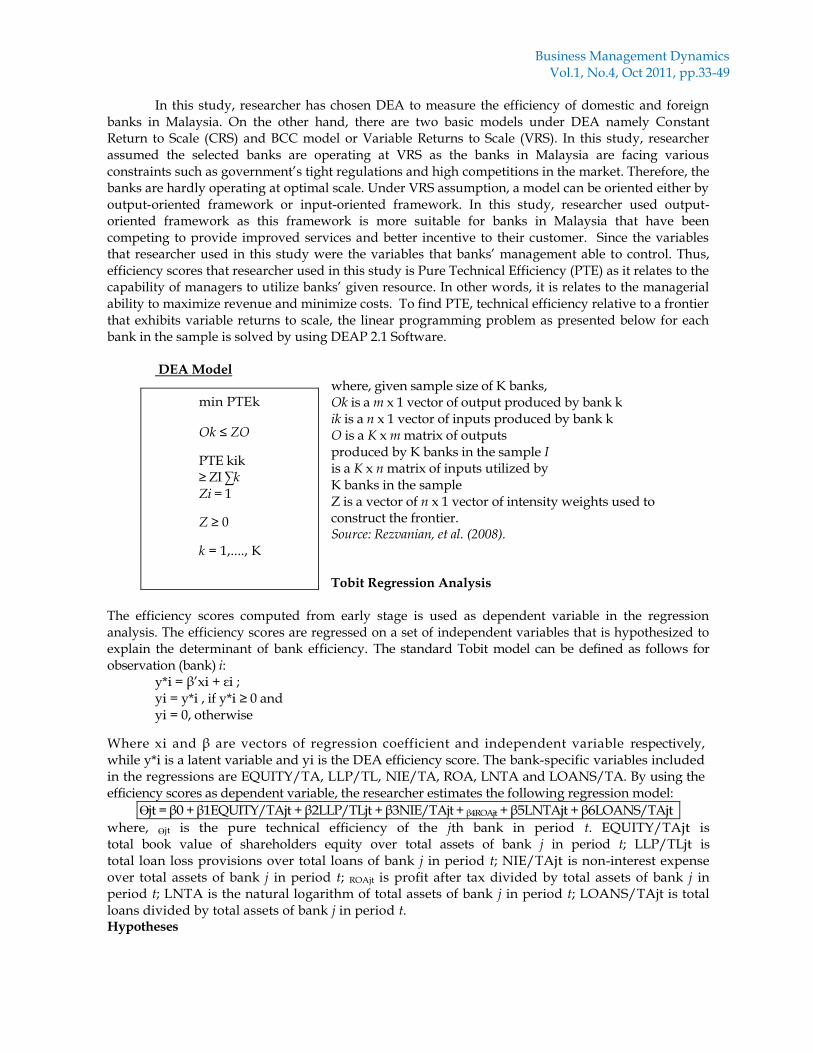
In this study, researcher has chosen DEA to measure the efficiency of domestic and foreign banks in Malaysia. On the other hand, there are two basic models under DEA namely Constant Return to Scale (CRS) and BCC model or Variable Returns to Scale (VRS). In this study, researcher assumed the selected banks are operating at VRS as the banks in Malaysia are facing various constraints such as government’s tight regulations and high competitions in the market. Therefore, the banks are hardly operating at optimal scale. Under VRS assumption, a model can be oriented either by output-oriented framework or input-oriented framework. In this study, researcher used output-oriented framework as this framework is more suitable for banks in Malaysia that have been competing to provide improved services and better incentive to their customer. Since the variables that researcher used in this study were the variables that banks’ management able to control. Thus, efficiency scores that researcher used in this study is Pure Technical Efficiency (PTE) as it relates to the capability of managers to utilize banks’ given resource. In other words, it is relates to the managerial ability to maximize revenue and minimize costs. To find PTE, technical efficiency relative to a frontier that exhibits variable returns to scale, the linear programming problem as presented below for each bank in the sample is solved by using DEAP 2.1 Software.
DEA Model
where, given sample size of K banks, Ok is a m x 1 vector of output produced by bank k ik is a n x 1 vector of inputs produced by bank k O is a K x m matrix of outputs produced by K banks in the sample I is a K x n matrix of inputs utilized by K banks in the sample Z is a vector of n x 1 vector of intensity weights used to construct the frontier. Source: Rezvanian, et al. (2008). Tobit Regression Analysis
The efficiency scores computed from early stage is used as dependent variable in the regression analysis. The efficiency scores are regressed on a set of independent variables that is hypothesized to explain the determinant of bank efficiency. The standard Tobit model can be defined as follows for observation (bank) i:
y*i = β’xi + εi ; yi = y*i , if y*i ≥ 0 and yi = 0, otherwise
Where xi and β are vectors of regression coefficient and independent variable respectively, while y*i is a latent variable and yi is the DEA efficiency score. The bank-specific variables included in the regressions are EQUITY/TA, LLP/TL, NIE/TA, ROA, LNTA and LOANS/TA. By using the efficiency scores as dependent variable, the researcher estimates the following regression model:
Өjt = β0 + β1EQUITY/TAjt + β2LLP/TLjt + β3NIE/TAjt + β4ROAjt + β5LNTAjt + β6LOANS/TAjt
where, Өjt is the pure technical efficiency of the jth bank in period t. EQUITY/TAjt is total book value of shareholders equity over total assets of bank j in period t; LLP/TLjt is total loan loss provisions over total loans of bank j in period t; NIE/TAjt is non-interest expense over total assets of bank j in period t; ROAjt is profit after tax divided by total assets of bank j in period t; LNTA is the natural logarithm of total assets of bank j in period t; LOANS/TAjt is total loans divided by total assets of bank j in period t. Hypotheses
min PTEk
Ok ≤ ZO
PTE kik ≥ ZI ∑k Zi = 1
Z ≥ 0
k = 1,...., K
Business Management Dynamics Vol.1, No.4, Oct 2011, pp.33-49
Hypothesis 1: There is a significant relationship between capital strength and bank efficiency Hypothesis 2: There is a significant relationship between loan quality and bank efficiency. Hypothesis 3: There is a significant relationship between expenses and bank efficiency. Hypothesis 4 : There is a significant relationship between profitability and bank efficiency. Hypothesis 5: There is a significant relationship between asset size and bank efficiency. Hypothesis 6: There is a significant relationship between liquidity and bank efficiency. RESULTS AND DISCUSSION Descriptive Statistics Analysis Input Analysis
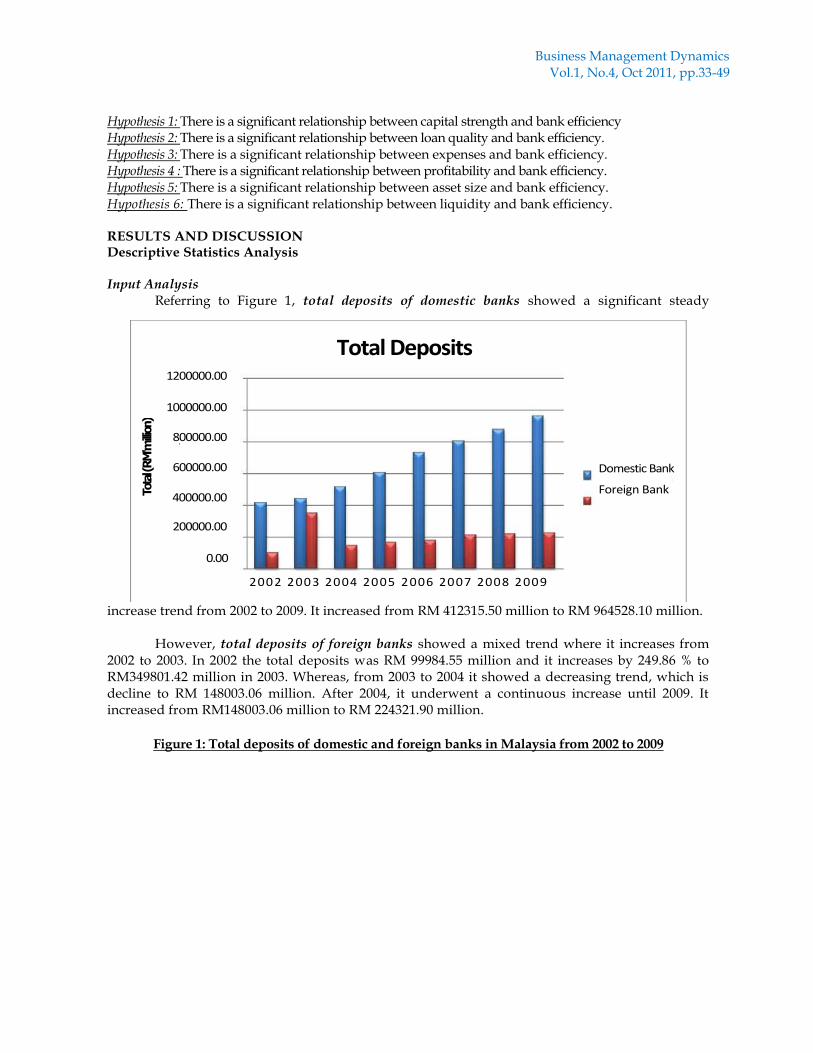
Referring to Figure 1, total deposits of domestic banks showed a significant steady
increase trend from 2002 to 2009. It increased from RM 412315.50 million to RM 964528.10 million.
However, total deposits of foreign banks showed a mixed trend where it increases from 2002 to 2003. In 2002 the total deposits was RM 99984.55 million and it increases by 249.86 % to RM349801.42 million in 2003. Whereas, from 2003 to 2004 it showed a decreasing trend, which is decline to RM 148003.06 million. After 2004, it underwent a continuous increase until 2009. It increased from RM148003.06 million to RM 224321.90 million.
Figure 1: Total deposits of domestic and foreign banks in Malaysia from 2002 to 2009
Tota
l (RM
'milli
on)
1200000.00
1000000.00
400000.00
800000.00
600000.00
200000.00
0.00
2002 2003 2004 2005 2006 2007 2008 2009
Total Deposits
Domestic Bank
Foreign Bank
Business Management Dynamics Vol.1, No.4, Oct 2011, pp.33-49
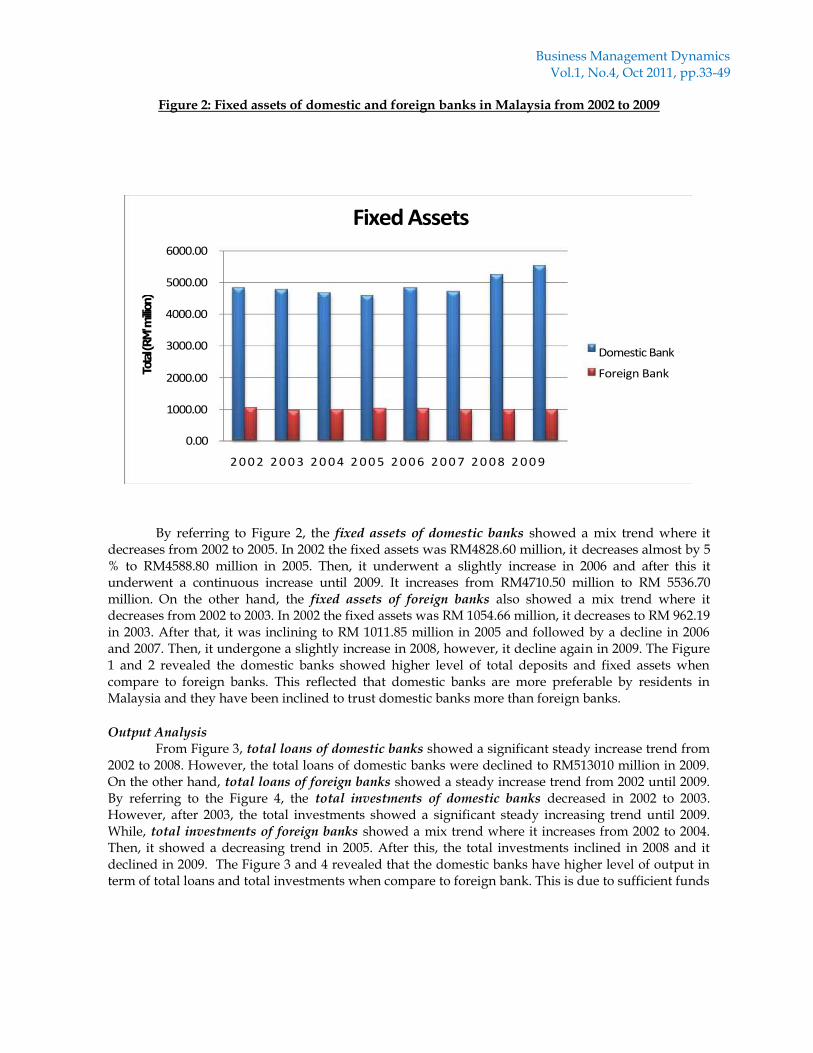
Figure 2: Fixed assets of domestic and foreign banks in Malaysia from 2002 to 2009
By referring to Figure 2, the fixed assets of domestic banks showed a mix trend where it decreases from 2002 to 2005. In 2002 the fixed assets was RM4828.60 million, it decreases almost by 5 % to RM4588.80 million in 2005. Then, it underwent a slightly increase in 2006 and after this it underwent a continuous increase until 2009. It increases from RM4710.50 million to RM 5536.70 million. On the other hand, the fixed assets of foreign banks also showed a mix trend where it decreases from 2002 to 2003. In 2002 the fixed assets was RM 1054.66 million, it decreases to RM 962.19 in 2003. After that, it was inclining to RM 1011.85 million in 2005 and followed by a decline in 2006 and 2007. Then, it undergone a slightly increase in 2008, however, it decline again in 2009. The Figure 1 and 2 revealed the domestic banks showed higher level of total deposits and fixed assets when compare to foreign banks. This reflected that domestic banks are more preferable by residents in Malaysia and they have been inclined to trust domestic banks more than foreign banks.
Output Analysis
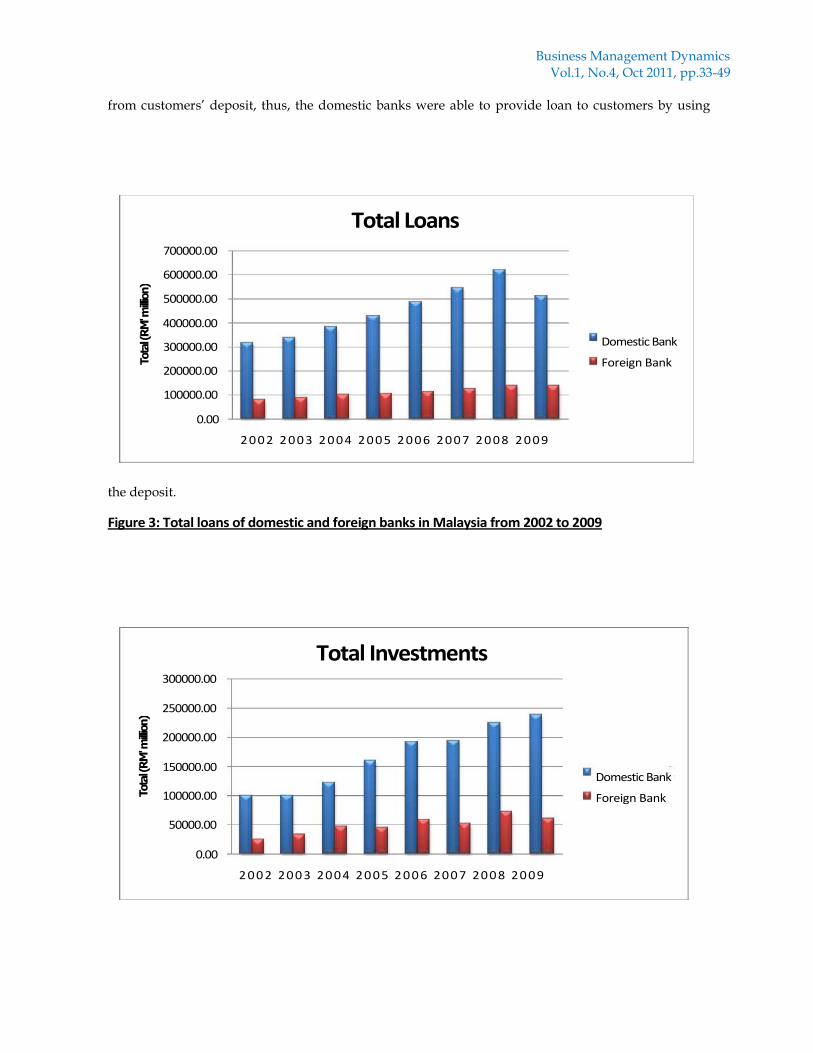
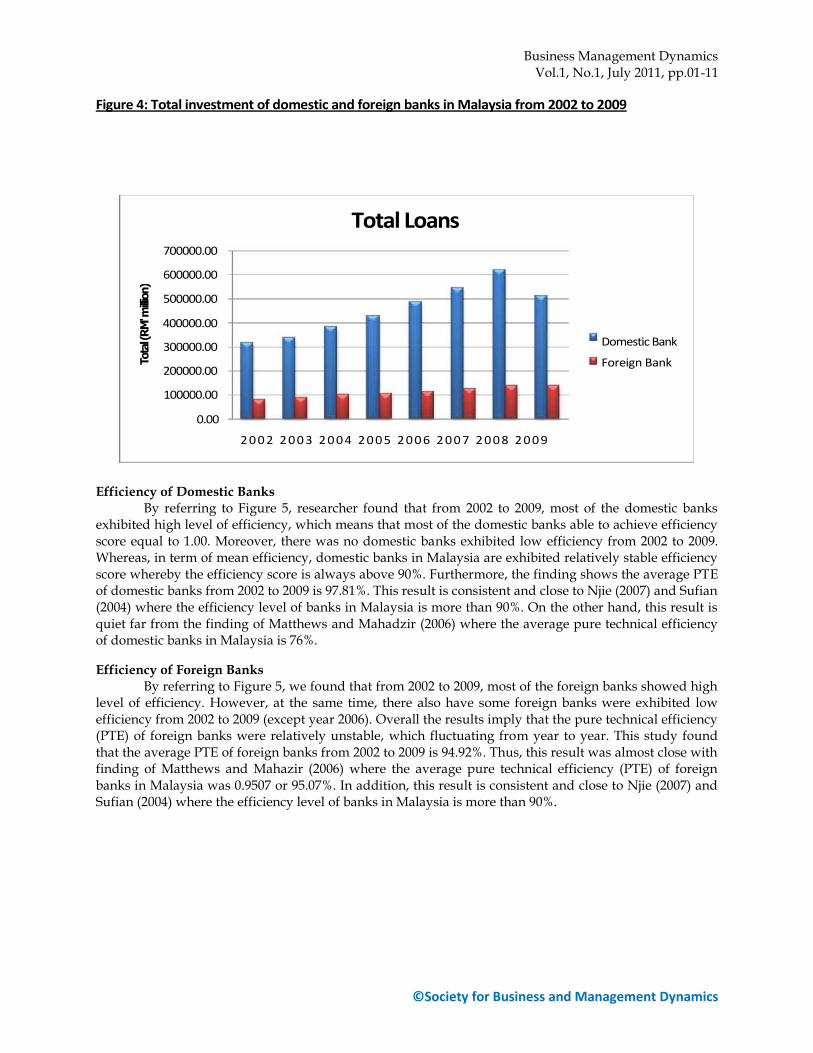
From Figure 3, total loans of domestic banks showed a significant steady increase trend from 2002 to 2008. However, the total loans of domestic banks were declined to RM513010 million in 2009. On the other hand, total loans of foreign banks showed a steady increase trend from 2002 until 2009. By referring to the Figure 4, the total investments of domestic banks decreased in 2002 to 2003. However, after 2003, the total investments showed a significant steady increasing trend until 2009. While, total investments of foreign banks showed a mix trend where it increases from 2002 to 2004. Then, it showed a decreasing trend in 2005. After this, the total investments inclined in 2008 and it declined in 2009. The Figure 3 and 4 revealed that the domestic banks have higher level of output in term of total loans and total investments when compare to foreign bank. This is due to sufficient funds
Tota
l (RM
' milli
on)
4000.00
6000.00
5000.00
3000.00
2000.00
1000.00
0.00
2 0 0 2 2 0 0 3 2 0 0 4 2 0 0 5 2 0 0 6 2 0 0 7 2 0 0 8 2 0 0 9
Fixed Assets
Domestic Bank
Foreign Bank
Business Management Dynamics Vol.1, No.4, Oct 2011, pp.33-49
from customers’ deposit, thus, the domestic banks were able to provide loan to customers by using
the deposit.
Figure 3: Total loans of domestic and foreign banks in Malaysia from 2002 to 2009
Tota
l (R
M' m
illio
n)
400000.00
700000.00
600000.00
500000.00
300000.00
200000.00
100000.00
0.00
2 0 0 2 2 0 0 3 2 0 0 4 2 0 0 5 2 0 0 6 2 0 0 7 2 0 0 8 2 0 0 9
Total Loans
Domestic Bank
Foreign Bank
Tota
l (R
M' m
illio
n)
300000.00
250000.00
200000.00
150000.00
100000.00
50000.00
0.00
2 0 0 2 20 0 3 20 0 4 20 0 5 2 0 0 6 20 0 7 20 0 8 20 0 9
Total Investments
Domestic Bank
Foreign Bank
Business Management Dynamics Vol.1, No.1, July 2011, pp.01-11
©Society for Business and Management Dynamics
Figure 4: Total investment of domestic and foreign banks in Malaysia from 2002 to 2009
Efficiency of Domestic Banks
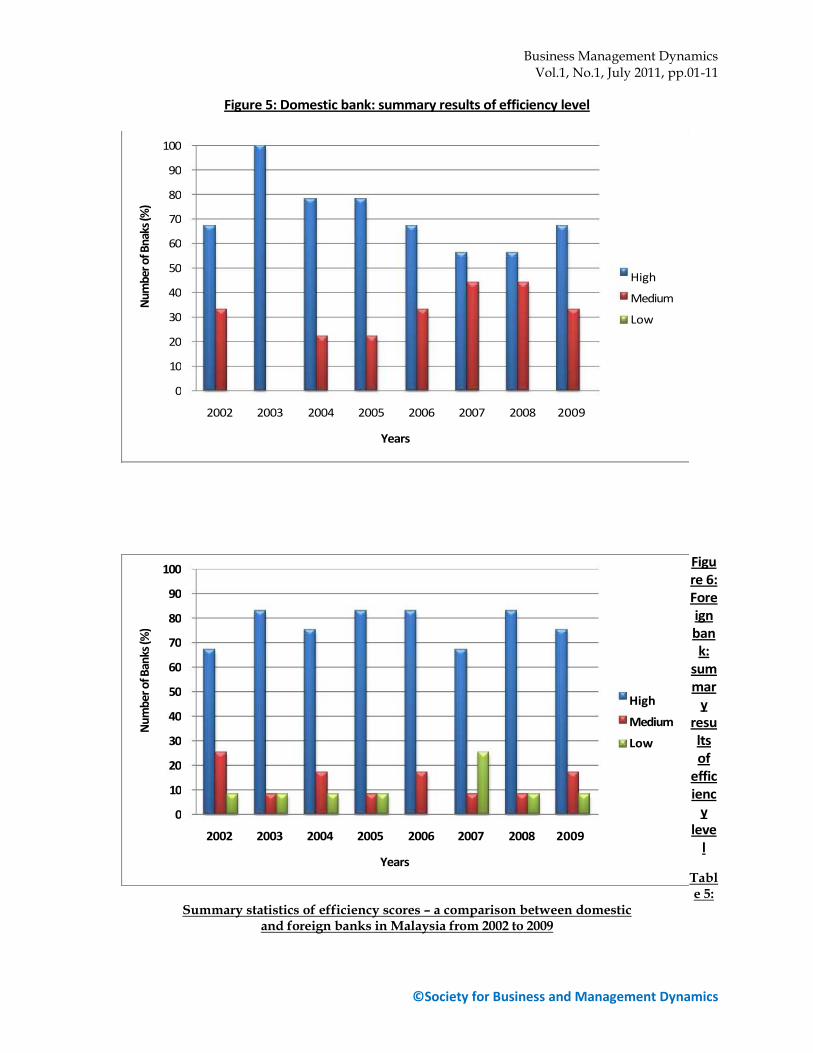
By referring to Figure 5, researcher found that from 2002 to 2009, most of the domestic banks exhibited high level of efficiency, which means that most of the domestic banks able to achieve efficiency score equal to 1.00. Moreover, there was no domestic banks exhibited low efficiency from 2002 to 2009. Whereas, in term of mean efficiency, domestic banks in Malaysia are exhibited relatively stable efficiency score whereby the efficiency score is always above 90%. Furthermore, the finding shows the average PTE of domestic banks from 2002 to 2009 is 97.81%. This result is consistent and close to Njie (2007) and Sufian (2004) where the efficiency level of banks in Malaysia is more than 90%. On the other hand, this result is quiet far from the finding of Matthews and Mahadzir (2006) where the average pure technical efficiency of domestic banks in Malaysia is 76%.
Efficiency of Foreign Banks
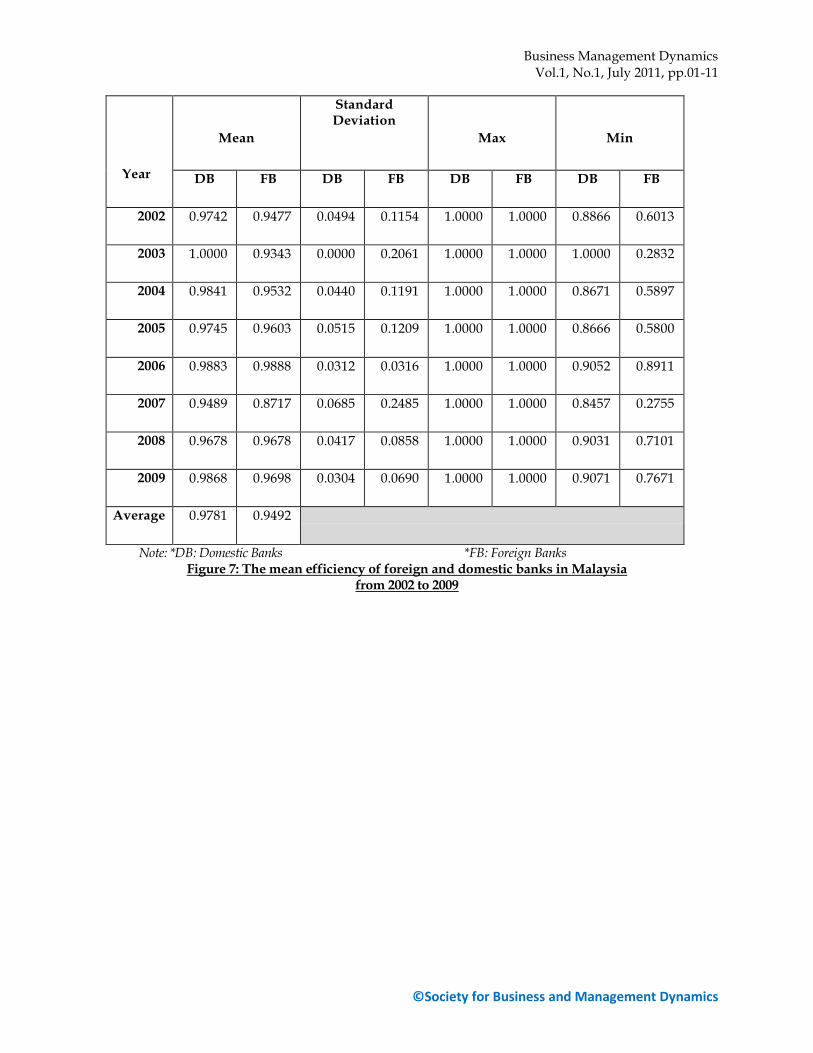
By referring to Figure 5, we found that from 2002 to 2009, most of the foreign banks showed high level of efficiency. However, at the same time, there also have some foreign banks were exhibited low efficiency from 2002 to 2009 (except year 2006). Overall the results imply that the pure technical efficiency (PTE) of foreign banks were relatively unstable, which fluctuating from year to year. This study found that the average PTE of foreign banks from 2002 to 2009 is 94.92%. Thus, this result was almost close with finding of Matthews and Mahazir (2006) where the average pure technical efficiency (PTE) of foreign banks in Malaysia was 0.9507 or 95.07%. In addition, this result is consistent and close to Njie (2007) and Sufian (2004) where the efficiency level of banks in Malaysia is more than 90%.
Tota
l (R
M' m
illio
n)
400000.00
700000.00
600000.00
500000.00
300000.00
200000.00
100000.00
0.00
2 0 0 2 2 0 0 3 2 0 0 4 2 0 0 5 2 0 0 6 2 0 0 7 2 0 0 8 2 0 0 9
Total Loans
Domestic Bank
Foreign Bank
Business Management Dynamics Vol.1, No.1, July 2011, pp.01-11
©Society for Business and Management Dynamics
Figure 5: Domestic bank: summary results of efficiency level
Figure 6: Foreign bank:
summar
y results of
efficienc
y leve
l
Table 5:
Summary statistics of efficiency scores – a comparison between domestic and foreign banks in Malaysia from 2002 to 2009
Num
ber o
f Ban
ks (%
)
100
90
80
70
60
40
50
30
20
10
0
2002 2003 2004 2005 2006 2007 2008 2009
Years
High
Medium
Low
Num
ber o
f Bna
ks (%
) 100
90
80
40
70
60
50
30
20
10
0
2002 2003 2004 2005 2006 2007 2008 2009
Years
High
Medium
Low
Business Management Dynamics Vol.1, No.1, July 2011, pp.01-11
©Society for Business and Management Dynamics
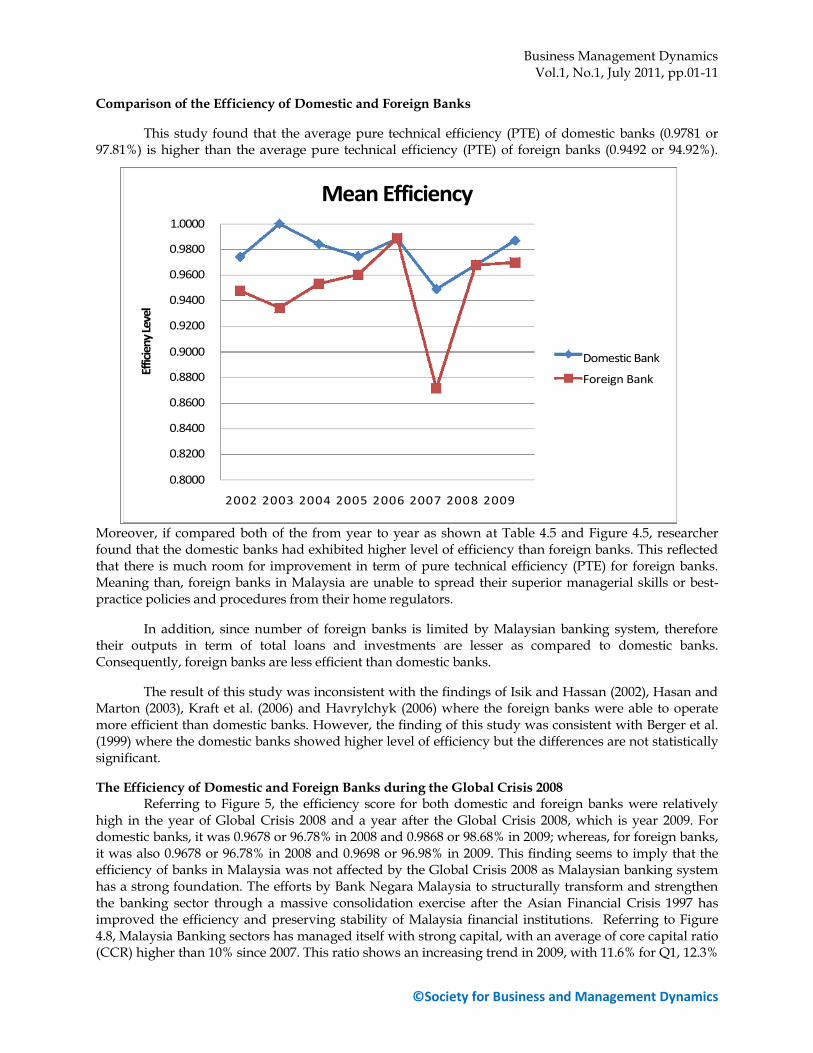
Year
Mean
Standard Deviation
Max Min
DB FB DB FB DB FB DB FB
2002 0.9742 0.9477 0.0494 0.1154 1.0000 1.0000 0.8866 0.6013
2003 1.0000 0.9343 0.0000 0.2061 1.0000 1.0000 1.0000 0.2832
2004 0.9841 0.9532 0.0440 0.1191 1.0000 1.0000 0.8671 0.5897
2005 0.9745 0.9603 0.0515 0.1209 1.0000 1.0000 0.8666 0.5800
2006 0.9883 0.9888 0.0312 0.0316 1.0000 1.0000 0.9052 0.8911
2007 0.9489 0.8717 0.0685 0.2485 1.0000 1.0000 0.8457 0.2755
2008 0.9678 0.9678 0.0417 0.0858 1.0000 1.0000 0.9031 0.7101
2009 0.9868 0.9698 0.0304 0.0690 1.0000 1.0000 0.9071 0.7671
Average 0.9781 0.9492
Note: *DB: Domestic Banks *FB: Foreign Banks Figure 7: The mean efficiency of foreign and domestic banks in Malaysia
from 2002 to 2009
Business Management Dynamics Vol.1, No.1, July 2011, pp.01-11
©Society for Business and Management Dynamics
Comparison of the Efficiency of Domestic and Foreign Banks
This study found that the average pure technical efficiency (PTE) of domestic banks (0.9781 or 97.81%) is higher than the average pure technical efficiency (PTE) of foreign banks (0.9492 or 94.92%).
Moreover, if compared both of the from year to year as shown at Table 4.5 and Figure 4.5, researcher found that the domestic banks had exhibited higher level of efficiency than foreign banks. This reflected that there is much room for improvement in term of pure technical efficiency (PTE) for foreign banks. Meaning than, foreign banks in Malaysia are unable to spread their superior managerial skills or best-practice policies and procedures from their home regulators.
In addition, since number of foreign banks is limited by Malaysian banking system, therefore their outputs in term of total loans and investments are lesser as compared to domestic banks. Consequently, foreign banks are less efficient than domestic banks.
The result of this study was inconsistent with the findings of Isik and Hassan (2002), Hasan and Marton (2003), Kraft et al. (2006) and Havrylchyk (2006) where the foreign banks were able to operate more efficient than domestic banks. However, the finding of this study was consistent with Berger et al. (1999) where the domestic banks showed higher level of efficiency but the differences are not statistically significant.
The Efficiency of Domestic and Foreign Banks during the Global Crisis 2008 Referring to Figure 5, the efficiency score for both domestic and foreign banks were relatively
high in the year of Global Crisis 2008 and a year after the Global Crisis 2008, which is year 2009. For domestic banks, it was 0.9678 or 96.78% in 2008 and 0.9868 or 98.68% in 2009; whereas, for foreign banks, it was also 0.9678 or 96.78% in 2008 and 0.9698 or 96.98% in 2009. This finding seems to imply that the efficiency of banks in Malaysia was not affected by the Global Crisis 2008 as Malaysian banking system has a strong foundation. The efforts by Bank Negara Malaysia to structurally transform and strengthen the banking sector through a massive consolidation exercise after the Asian Financial Crisis 1997 has improved the efficiency and preserving stability of Malaysia financial institutions. Referring to Figure 4.8, Malaysia Banking sectors has managed itself with strong capital, with an average of core capital ratio (CCR) higher than 10% since 2007. This ratio shows an increasing trend in 2009, with 11.6% for Q1, 12.3%
1.0000
0.9800
0.9600
0.9400
Effic
ieny
Lev
el
0.9200
0.9000
0.8800
Mean Efficiency
2002 2003 2004 2005 2006 2007 2008 2009
0.8600
0.8400
0.8200
0.8000
Domestic Bank
Foreign Bank
Business Management Dynamics Vol.1, No.1, July 2011, pp.01-11
©Society for Business and Management Dynamics
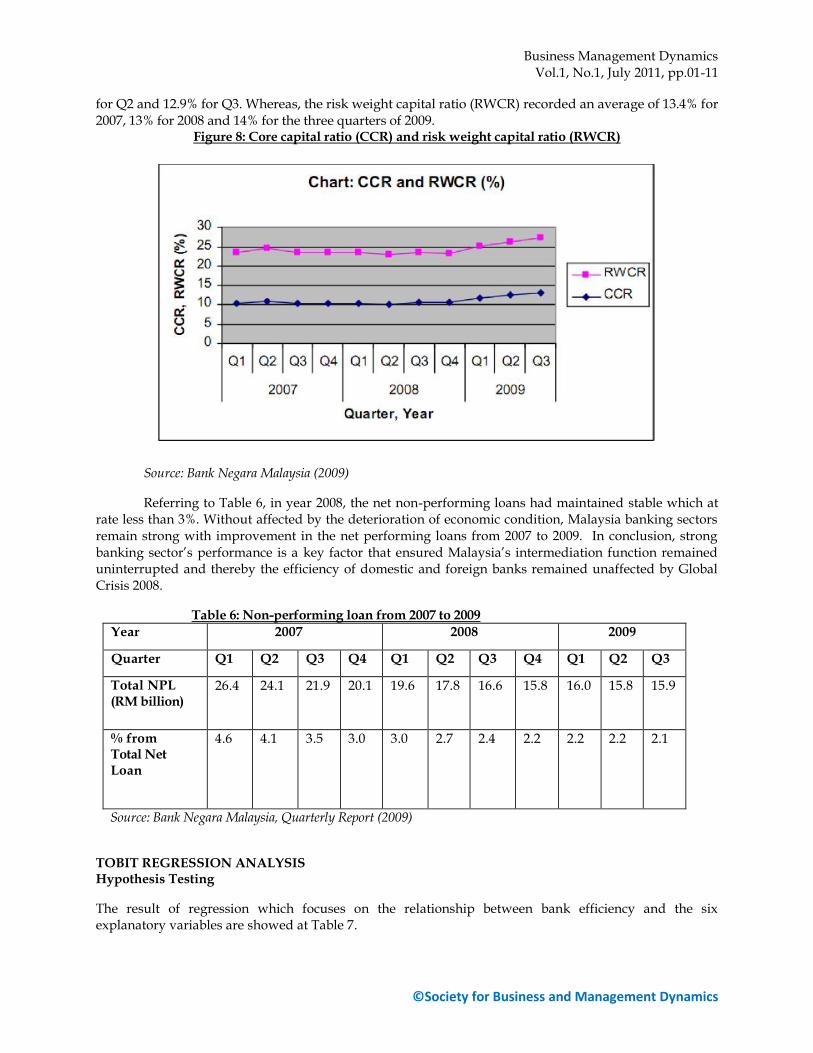
for Q2 and 12.9% for Q3. Whereas, the risk weight capital ratio (RWCR) recorded an average of 13.4% for 2007, 13% for 2008 and 14% for the three quarters of 2009.
Figure 8: Core capital ratio (CCR) and risk weight capital ratio (RWCR)
Source: Bank Negara Malaysia (2009)
Referring to Table 6, in year 2008, the net non-performing loans had maintained stable which at rate less than 3%. Without affected by the deterioration of economic condition, Malaysia banking sectors remain strong with improvement in the net performing loans from 2007 to 2009. In conclusion, strong banking sector’s performance is a key factor that ensured Malaysia’s intermediation function remained uninterrupted and thereby the efficiency of domestic and foreign banks remained unaffected by Global Crisis 2008.
Table 6: Non-performing loan from 2007 to 2009
Year 2007 2008 2009
Quarter Q1 Q2 Q3 Q4 Q1 Q2 Q3 Q4 Q1 Q2 Q3
Total NPL (RM billion)
26.4 24.1 21.9 20.1 19.6 17.8 16.6 15.8 16.0 15.8 15.9
% from Total Net Loan
4.6 4.1 3.5 3.0 3.0 2.7 2.4 2.2 2.2 2.2 2.1
Source: Bank Negara Malaysia, Quarterly Report (2009)
TOBIT REGRESSION ANALYSIS Hypothesis Testing
The result of regression which focuses on the relationship between bank efficiency and the six explanatory variables are showed at Table 7.
Business Management Dynamics Vol.1, No.1, July 2011, pp.01-11
©Society for Business and Management Dynamics
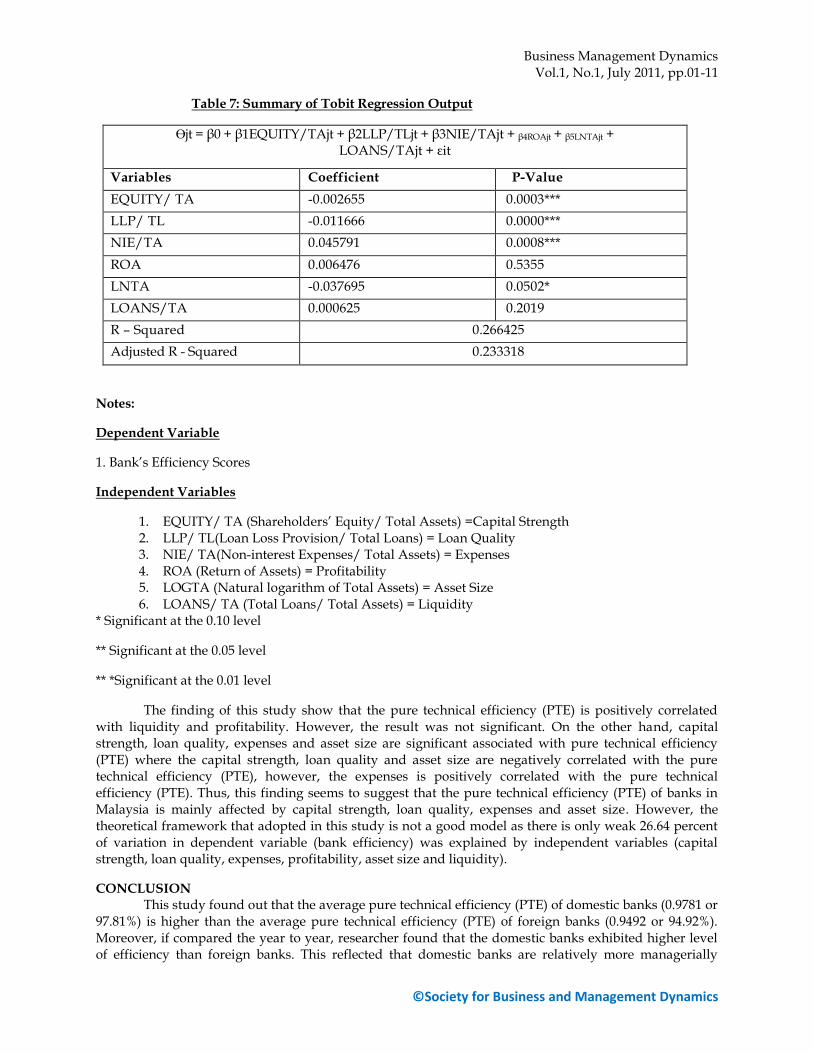
Table 7: Summary of Tobit Regression Output
Өjt = β0 + β1EQUITY/TAjt + β2LLP/TLjt + β3NIE/TAjt + β4ROAjt + β5LNTAjt + LOANS/TAjt + εit
Variables Coefficient P-Value
EQUITY/ TA -0.002655 0.0003***
LLP/ TL -0.011666 0.0000***
NIE/TA 0.045791 0.0008***
ROA 0.006476 0.5355
LNTA -0.037695 0.0502*
LOANS/TA 0.000625 0.2019
R – Squared 0.266425
Adjusted R - Squared 0.233318
Notes:
Dependent Variable
1. Bank’s Efficiency Scores
Independent Variables
1. EQUITY/ TA (Shareholders’ Equity/ Total Assets) =Capital Strength 2. LLP/ TL(Loan Loss Provision/ Total Loans) = Loan Quality 3. NIE/ TA(Non-interest Expenses/ Total Assets) = Expenses 4. ROA (Return of Assets) = Profitability 5. LOGTA (Natural logarithm of Total Assets) = Asset Size 6. LOANS/ TA (Total Loans/ Total Assets) = Liquidity
* Significant at the 0.10 level
** Significant at the 0.05 level
** *Significant at the 0.01 level
The finding of this study show that the pure technical efficiency (PTE) is positively correlated with liquidity and profitability. However, the result was not significant. On the other hand, capital strength, loan quality, expenses and asset size are significant associated with pure technical efficiency (PTE) where the capital strength, loan quality and asset size are negatively correlated with the pure technical efficiency (PTE), however, the expenses is positively correlated with the pure technical efficiency (PTE). Thus, this finding seems to suggest that the pure technical efficiency (PTE) of banks in Malaysia is mainly affected by capital strength, loan quality, expenses and asset size. However, the theoretical framework that adopted in this study is not a good model as there is only weak 26.64 percent of variation in dependent variable (bank efficiency) was explained by independent variables (capital strength, loan quality, expenses, profitability, asset size and liquidity).
CONCLUSION This study found out that the average pure technical efficiency (PTE) of domestic banks (0.9781 or
97.81%) is higher than the average pure technical efficiency (PTE) of foreign banks (0.9492 or 94.92%). Moreover, if compared the year to year, researcher found that the domestic banks exhibited higher level of efficiency than foreign banks. This reflected that domestic banks are relatively more managerially
Business Management Dynamics Vol.1, No.1, July 2011, pp.01-11
©Society for Business and Management Dynamics
efficient in controlling their costs as home field advantage hypothesis can disadvantage to foreign banks in terms of higher costs. Meaning that, the foreign banks will incur higher costs compare to domestic banks when providing the same financial services to customers. In addition, foreign banks face the problem of differences in regulatory, language, culture, currency or bias against foreign banks and sometimes the home regulators of foreign banks might face difficulty in monitoring institutions from a distance. Furthermore, both banks showed relatively high efficiency in the year of Global Crisis 2008 and a year after the Global Crisis 2008, which was year 2009. This finding seems to imply that the pure technical efficiency (PTE) of banks in Malaysia was not affected by the Global Crisis 2008 as Malaysian banking system has healthy volume of international reserves, strong capitalization and ample liquidity. The finding of this study also show that the pure technical efficiency (PTE) is positively correlated with liquidity and profitability. However, the result was not significant. On the other hand, capital strength, loan quality, expenses and asset size are significant associated with pure technical efficiency (PTE) where the capital strength, loan quality and asset size are negatively correlated with the pure technical efficiency (PTE), however, the expenses is positively correlated with the pure technical efficiency (PTE). Thus, this finding seems to suggest that the pure technical efficiency (PTE) of banks in Malaysia is mainly affected by capital strength, loan quality, expenses and asset size. However, the theoretical framework that adopted in this study is not a good model as there is only weak 26.64 percent of variation in dependent variable (bank efficiency) was explained by independent variables (capital strength, loan quality, expenses, profitability, asset size and liquidity).
SUGGESTION FOR FUTURE STUDY Firstly, it is recommended to include technical efficiency, scale efficiency and allocative efficiency
in future study. Furthermore, the future research may include finance companies, merchant banks and Islamic banks in order to obtain a more accurate situation and precise results that can represent the whole Malaysian finance industry. In addition, future researchers are encouraged to apply different analytical models, such as parametric, Stochastic Frontier Approach (SFA) in their research. By using the different models, they can justify whether the efficiency scores generated by different frontier models are consistent with the DEA that is used or not. Besides, future researchers may choose more banks’ inputs and outputs. This could help minimize sampling error by increasing possible input and output variables and be able to generate different results. Furthermore, future research can be extended in the way that employing the Malmquist Productivity Index (MPI) to investigate the productivity of banks over time with changing of technology. On the other hand, future researchers may select other variables that differ from this study. In this study, the researcher used bank specific variables as independent variable to determine the determinant of bank efficiency. Future researcher may use macro environment variables such as regulatory, bank type, geographical region and ownership. Finally, future study may include longer sampling periods to make sure that the result for the determinant of bank efficiency is more accurate and reliable.
REFERENCES Altunbas, Y., Liu, M.H., Molyneux, P., Seth, R. (2000). Efficiency and risk in Japanese banking. Journal of
Banking and Finance, 24, 1605-1628. Angelidis, D. and Lyroudi, K. (2006). Efficiency in the Italian Banking Industry: Data Envelopment
Analysis and Neural Networks. Journal of Finance and Economics. Ataullah, A., Cockerill, T. & Le, H. (2004). Financial liberalization and bank efficiency: a comparative
analysis of India and Pakistan. Applied Economics, 36(17), 1915- 1924. Banker, R.D., Charnes, A., Cooper, W.W. (1984). Some models for estimations of technical and scale
inefficiencies in data envelopment analysis. Management Science 30(9), 1078-1092. Barr, R. S., Killgo, K. A., Siems, T. F., Zimmel, S. A. (2002). Evaluating the productive efficiency and
performance of U.S. commercial banks. Manage. Finan. 28(8), 3- 25. Benston, G.J. (1965). Branch banking and economies of scale. Journal of Finance, 20, 312-331. Berger, A. & Humphrey, D. (1997). Efficiency of financial institutions: International survey and
directions for future research. European Journal of Operational Research 98, 175-212.
Business Management Dynamics Vol.1, No.1, July 2011, pp.01-11
©Society for Business and Management Dynamics
Berger, A. N., DeYoung, R., Genay, H., Udell, G. F. (1999). Globalization of financial institutions: evidence from cross border banking performance. Brookings- Wharton Paper Finan. Serv. 3, 23-158.
Berger, A.N. (2007). International comparisons of banking efficiency. Finance Marketing Institute Instrum. 16, 119-144.
Bonin, J.P., Hasan, I., Wachtel, P. (2005). Bank performance, efficiency and ownership in transition countries. Journal of Banking and Finance 29, 31-53.
Boot, A. W., and A. Schmeijts (2005). The competitive challenge in banking. Amsterdam Center for Law & Economics Working Paper No. 2005-08.
Casu, B. and MNolyneus, P. (2000). A comparative study of efficiency in European Banking. Center for Financial Institutions Working Papers, Wharton School
Center for Financial Institutions, University of Pennsylvania, Pennsylvania. Chan, V.L. and Liu, M. (2006). Effects of deregulation on bank efficiency and productivity in
Taiwan, Academia Economic Papers, 34, 251-300. Charnes, A., Cooper, W.W., Rhodes, E. (1978). Measuring the efficiency of decision making units.
European Journal of Operational Research 2 (6), 429-444. Chen, T. Y. (2002). Measuring firm performance with DEA and Prior information in Taiwan’s banks.
Applied Economics Letters 9, 202-204. Chiou, C.C. (2009). Effects of Financial Holding Company Act on bank efficiency and productivity in
Taiwan. Journal of Neurocomputing, 72, 3490-3506. Chiu, Y. H. and Chen, Y.C. (2008). The analysis of Taiwanese bank efficiency: Incorporating both
external environment risk and internal risk. Journal of Economic Modelling, 26, 456-463. Chou, R., Hasan, I., Lozano-Vivas, A., Shen, C.H. Deregulation and efficiency of Taiwanese banks, in:
Fu, T.T., Huang,C.J., lovell, C. (Eds). Productivity and Economic Performance in the Asia-Pacific Region, Edward Elgar, Cheltenham, Northampton, MA, pp.184-207.
Christopoulos, D.K., Lolos, S. E. G., Tsionas, E. G. (2002). Efficiency of the Greek banking system in view of the EMU: a heteroscedastic stochastic frontier approach. Journal of Policy Modeling, 24, 813-829.
Claessens, S., Demirguc-Kunt, A. & Huizinga, H. (2001). How does foreign entry affect the domestic banking market? J. Banking Finace 25(5), 891-911.
Coelli, T. (1996). A guide to DEAP Version 2.1: A Data Envelopment Analysis (Computer) Program. CEPA Working Paper 96/08, University of New England, Australia.
Dacanay, S. J. O. (2007). Profit and cost efficiency of Philippine commercial banks under periods of liberalization, crisis and consolidation. The Business Review, Cambridge, &(2), 315-322.
Drake, Leigh, Hall, Maximilian, J.B. & Simper, Richard (2006). The impact of macroeconomic and regulatory factors on bank efficiency: a non-parametric analysis of Hong Kong’s banking system. J. Bank Finance. 30(5), 1443-1466.
Esho, N. (2001). The determinants of cost efficiency in cooperative financial institutions: Australia evidence, Journal of Banking and Finance, 25, 941-964.
Farrel, M. J. (1957). The Measurement of productive efficiency. Journal of the Royal Statistical Society Series A, 120, 253-281.
Gelb, A. & Sagari, S. (1990). Banking. In: Messerlin, P., Sanvant, K. (Eds.), The Uruguay Round: Services in the World Economy. The World Bank and UN Centre on Transnational Corporations, Washington, DC.
Gilbert, R.A., Wilson, P.W. (1998). Effects of deregulation on the productivity of Korean Banks. Journal of Economics and Business 50, 133-155.
Goldberg, L.G. & Saunders, A. (1981). The determinants of foreign banking activity in the US. Journal of Banking and Finance 5, 17-32.
Gregoriou, G.N., and J, Zhu. (2005). Data Envelopment Analysis: Evaluating Hedge Funds and CTAs and SC-ROM. John Wiley and Sons Inc.
Hasan, I. and Marton, K. (2003). Development and efficiency of banking sector in transitional economy: Hungarian experience. Journal of Banking and Finance 27, 2249-2271.
Business Management Dynamics Vol.1, No.1, July 2011, pp.01-11
©Society for Business and Management Dynamics
Hasan, Iftekhar and Hunter, William C. (1996). Efficiency of Japanese multinational banks in the United States, in: A.H. Chen (Ed.). Research in Finance, vol. 14, pp. 157-173 (London: JAI Press).
Hauner, D. (2005). Explaining efficiency differences among large German and Austrian banks. Appl. Econ. 37(9), 969-980.
Havrylchyk, O. (2006). Efficiency of the Polish banking industry: Foreign versus domestic banks. Journal of Banking and Finance 30, 1975-1996.
Isik, I., Hassan, M.K. (2002). Technical, scale and allocative efficiencies of Turkish banking industry. Journal of Banking and Finance 26, 719-766.
Kabir Hassan.M. and Sanchez.B. (2009). Efficiency Analysis of Microfinance Institutions in Developing Countries. Working Paper No. 2009-WP-12.
Kabir, M.H. and Benito, S. (2007). Efficiency Determinants and Dynamic Efficiency Changes in Latin American Banking Industries. Networks Financial Working Paper, No, 2007-WP-32.
Kaparakis, E. I., Miller, S. M., Noulas, A. G. (1994). Short-term cost inefficiency of commercial banks: a flexible stochastic frontier approach. Journal of Money, Credit and Banking 26, 875-893.
Kosmidou, K., Pasiouras, F. & Tsaklanganos, A. (2007). Domestic and multinational determinants of foreign bank profits: The case of Greek banks operating abroad. Journal of Multinational Financial Management, 17, 1-15.
Kosmidou, K., Tanna, S., Pasiouras, F. (2006). Determinants of profitability of domestic UK commercial banks: panel evidence from the period 1995-2002. Applied Research Working Paper Series, Coventry University Business School.
Kraft, E., Tirtirogle, D. (1998). Bank efficiency in Croatia: A stochastic-frontier analysis. Journal of Comparative Economics 26, 282-300.
Kraft, Evan, Hofler, Richard and Payne, James (2006). Privatization, foreign bank entry and bank efficiency in Croatia: a Fourier-flexible function stochastic cost frontier analysis. Applied Economics, 38, pp. 2075-2088.
Kwan, S.H., Eisenbeis, R. (1995). An analysis of inefficiencies in banking. J. Bank. Finan. 19(3-4), 733-734.
Levine, R. (1996). Foreign banks, financial development and economic growth. In: Claude, E.B. (Ed.), International Financial Markets. AEI Press, Washington, DC.
Mahajan, Arvind, Rangan, Nanda and Zardkoohi, Asghar (1996). Cost structures in multinational and domestic banking. Journal of Banking and Finance, 20, pp. 283-306.
Maindiratta, A. (1990). Largest size-efficient scale and size efficiencies of decision- making units in data envelopment analysis. Journal of Econometrics 46, 57-72.
Matthews, K. & Mahazir, I. (2006). Efficiency and productivity growth of domestic and foreign commercial banks in Malaysia. Cardiff Business School Working Paper Series, E2006/2.
Mester, L. J. (1996). A study of bank efficiency taking into account risk preferences. Journal of Banking and Finance, 20, 1025-1045.
Miller, S. M. and Noulas, A. G. (1996). The technical efficiency of large bank production. Journal of Banking and Finance, 20, 495-509.
Njie, M. (2007). Impact of financial liberalization on the productive efficiency of the banking industry in Malaysia. Banker’s Journal Malaysia, 131, 49-67.
Oks, A. (2001). Efficiency of the financial intermediaries and economic growth in CEEC. University of Tartu.
Pasiouras, F. (2008). Estimating the technical and scale efficiency of Greek commercial banks: the impact of credit risk, off-balance sheet activities, and international operations. Res. Int. Business Finan. 22(3), 301-318.
Pasiouras, F. and Kosmidou, K. (2007). Factors influencing the profitability of domestic and foreign commercial banks in the European Union, International Business and Finance, 21, 222-237.
Rangkakulnuwat, P. (2007). Technical efficiency of Thai Commercial Banks between 2002 and 2005. UTCC Journal, Vol. 24, No. 1, ppl129-138.
Business Management Dynamics Vol.1, No.1, July 2011, pp.01-11
©Society for Business and Management Dynamics
Resti, A. (1997). Evaluating the cost efficiency of the Italian banking system: what can be learned from the joint application of parametric and non-parametric techniques. Journal of Banking and Finance 21, 221-250.
Rezvanian, R., Rao, N. and Mehdian, S. M. (2008). Efficiency change, technological progress and productivity growth of private, public and foreign banks in India: evidence from the post-liberalziation era. Applied Financial Economics. 18:9, 701-713.
Sathye, M. (2001). X-efficiency in Australian banking: An empirical investigation. Journal of Banking and Finance 25, 613-630.
Sathye, M. (2005). Technical efficiency of large bank production in Asia and the pacific. Multinational Finance Journal, 9, (1 & 2), 1-22.
Schaek, K. and Cihak, M. (2008). How does competition affect efficiency and soundness in banking? Working Paper Series, no.932.
Sealey, C., & Lindley, J.T. (1977). Inputs, Outputs and a theory of production and cost at depository financial institutions. Journal of Finance, 32, 1251-1266.
Sherman, D., Gold, F. (1990). Bank branch operating efficiency: evaluation with data envelopment analysis approach. J. Bank Finance 9, 297-315.
Smith, C.W.Jr and Watts, R.L. (1992). The investment opportunity set and corporate financing, dividend and compensation policies. Journal of Financial Economics, Vol. 32, No. 3, pp. 263-92.
Souza, G., Staub, R., Tabak, B. (2006). Assessing the significance of factors effects in output oriented dea measures of efficiency: An application to Brazilian banks. Brazilian Journal of Business Economics 6(1), 7-20.
Souza, G., Staub, R., Tabak, B. (2008). A probabilistic approach for assessing the significance of contextual variables in nonparametric frontier models: An application of Brazilian banks. Brazilian Review of Econometrics 28(1), 111-125.
Staub, R., Souza, G., Tabak, B. (2010). Evolution of bank efficiency in Brazil: A DEA approach. European Journal of Operational Research 202, 204-213.
Stiglitz, J.E. (1993). The role of the state in financial markets. In: Proceedings of the World Bank Annual Conference on Development Economics, pp. 19-52.
Sufian, F. (2004). The efficiency effects of bank mergers an acquisition in a developing economy: evidence from Malaysia. International Journal of Applied Econometrics and Quantitative Studies, 1(4), 53 74.
Sufian, F. (2006). The efficiency of non-bank financial institutions: empirical evidence from Malaysia. International Research Journal of Finance and Economics, 6(2006), 49-65.
Sufian, F. (2007a). Trends in the efficiency of Singapore’s commercial banking groups: a non-stochastic frontier DEA window analysis approach. Int. J. Product. Perform. Manage. 56, 99-136.
Sufian, F. (2007b). The efficiency of Islamic banking industry in Malaysia: Foreign vs domestic banks. Humanomics: The International Journal of Systems and Ethics, Emerald Group Publishing, vol. 23(3), 174-192.
Sufian, F. (2009). Determinants of bank efficiency during unstable macroeconomic environment: Empirical evidence from Malaysia. Research in International Business and Finance, 23(2009), 54-77.
Sufian, F. and Abdul Majid (2007) Bank ownership, characteristics and performance: a comparative analysis of domestic and foreign Islamic banks in Malaysia. Munich Personal RePEc Archieve Paper Np, 12131.
Tahir, I. M., Abu Bakar, N. M. and Haron, S. (2009). Estimating Technical and Scale Efficiency of Malaysian Commercial Banks: A Non-Parametric Approach. International Review of Business Research Papers. Vol. 5(1), 113-123.
Walter, I. & Gray, H.P. (1983). Protectionism and international banking, sectoral efficiency, competitive structure and national policy. Journal of Banking and Finance 7, 597-609.
Yeh, Q. (1996). The application of Data Envelopment Analysis in conjunction with financial ratios for bank performance evaluation. Journal of the Operational Research Society, 47, 980-988.