Embed Size (px)
Citation preview
Faculty of Engineering Science and Technology
Department of Computer Science and Computational Engineering, Narvik
A COMPARISON ON DEVELOPMENT OF PUMPED STORAGE HYDROPOWER IN EUROPE AND ASIA-
An Analytical Case Study based on Pumped Storage Hydroelectric Projects developed in Europe and Asia in period 2010-2017
Parash Mani Mishra Master’s thesis in Engineering Design … June 2017

0

i
Abstract
Energy consumption in European countries is increasing in significant amount each year. EU
countries are becoming more concerned towards environmental safeguarding along with
energy production. Wind and solar power have increased their market in many power systems
in the recent decades and the main limitation is that they are greatly time dependent and are
not available all the time to cope with variable energy demand. This limitation has led to the
concept of a bulk energy storage system-Pumped Storage Hydropower.
Asia holds the largest share of global installed hydropower capacity of 611,063 MW and
Europe has total installed hydropower capacity of 218,404 MW. Similarly, the PSH installed
capacity of Asia is 67,850 MW and Europe is 50,949 MW. The characteristics of pumped
storage hydropower commissioned in the present decade 2010-2017 in Europe and Asia have
been compared based on annual addition of PSH capacity in grids, unit cost of construction,
mode of use of PSH plants and ownership of PSHs,. Furthermore, the policies undertaken by
countries in Europe and Asia are discussed and recommendations for PSH development are
made. The results show that there are some measurable differences in development of PSH in
Europe and Asia which includes differences in use cases, ownership and policies undertaken
for PSH development.
Keywords: Renewable, Hydropower, Pumped Storage, Policy, Europe, Asia

ii
Acknowledgement
Firstly, I would like to offer my sincere gratitude to my esteemed supervisor Professor
Mojtaba Moatamedi for his constant effort, suggestions and guidelines for bringing this paper
in this final stage. His attempt was to let this paper be my own work, but steered me in the
right direction whenever needed.
Similarly, I would like to extend my heartfelt gratitude to my supervisor at the UiT Campus
Narvik, Associate Professor Guy Beeri Mauseth and external supervisor Dr. Linmei Nie for
their encouragement and constructive advice throughout this paper.
Likewise, I am highly obliged to my friends Santosh Aryal and Anil Aryal for their incredible
help and positive suggestions for bringing this paper in this format. Also my special thanks
goes to Marshal Pokhrel and Ramesh Nepali for their kind proofreading.
On a personal note, I am indebted to my parents who gave me the strength and support to
pursue my further studies. I owe a big thanks to Indira Pokharel for her genuine support and
encouragement.
Last but not the least, I am beholden to all my friends, and well wishers specifically, who
have directly or indirectly co-operated with me in bringing this paper at this stage.
Parash Mani Mishra
June 2017
iii
Table of Contents
Abstract ....................................................................................................................................... i
Acknowledgement ..................................................................................................................... ii
List of Figures ............................................................................................................................ v
List of Tables ............................................................................................................................ vi
Abbreviations ........................................................................................................................... vii
1. Introduction ........................................................................................................................ 1
1.1 Background ................................................................................................................. 1
1.2 Definition .................................................................................................................... 1
1.3 Problem Statement ...................................................................................................... 3
1.4 Objective of Research ................................................................................................. 4
2. Literature Review ............................................................................................................... 5
2.1 Status of renewable energy in Europe ......................................................................... 5
2.2 Status of electricity from renewable energy sources in Europe .................................. 8
2.3 Driving Force for hydropower development ............................................................. 11
2.4 Status of Hydropower in Asia and Europe ................................................................ 12
2.4.1 Status of Hydropower in Asia ............................................................................ 12
2.4.2 Status of Hydropower in Europe........................................................................ 16
2.5 Status of Pumped Storage Hydropower in the World ............................................... 19
2.6 Pumped Storage Hydropower in Europe ................................................................... 20
2.7 Pumped Storage Hydropower in Asia ....................................................................... 20
2.7.1 Development of Pumped storage power stations in China ................................ 21
3. Methodology ..................................................................................................................... 22
3.1 Pumped Storage Hydroelectric Plants in Asia .......................................................... 22
3.2 Pumped Storage Hydroelectric Plants in Europe ...................................................... 23
3.3 Comparison of PSH development in Europe and Asia ............................................. 25
iv
3.3.1 Annual Addition of PSH in grids in Europe and Asia ....................................... 25
3.3.2 Cost of PSH construction in Europe and Asia ................................................... 25
3.3.3 Use Cases of PSH in Europe and Asia............................................................... 25
3.3.4 Ownership of PSHs in Europe and Asia ............................................................ 26
3.3.5 Policies for development of PSHs in Europe and Asia...................................... 26
4. Data Analysis and Result .................................................................................................. 27
4.1 Annual Addition of PSH in grids in Europe and Asia .............................................. 27
4.2 Cost of PSH construction in Europe and Asia .......................................................... 27
4.3 Use Cases of PSH in Europe and Asia ...................................................................... 28
4.4 Ownership of PSHs in Europe and Asia ................................................................... 36
4.5 Policies for development of PSHs in Europe and Asia ............................................. 36
4.5.1 Policies undertaken in Europe ........................................................................... 36
4.5.2 Policies undertaken in Asia ................................................................................ 37
4.5.3 Recommendation for Policies Changes ............................................................. 37
5. Discussion ......................................................................................................................... 39
6. Conclusions ...................................................................................................................... 41
7. Further Research ............................................................................................................... 42
8. Bibliography ..................................................................................................................... 43
v
List of Figures
Figure 1-1 Typical diagram of Pump storage hydropower ........................................................ 2
Figure 1-2 Typical example of Pumped storage hydropower operation .................................... 3
Figure 2-1 Primary production of energy from renewable source EU, 1990-2014 ................... 8
Figure 2-2 Electricity generated from renewable energy sources EU-28, 2004-2014 .............. 9
Figure 4-1 Annual addition of Pumped Storage Hydro capacity in Europe and Asia ............. 27
Figure 4-2 Unit cost of Construction ($ per MW) of PSHs in Europe and Asia ..................... 28
Figure 4-3 Use Cases of Pumped Storage Hydroelectric Plants
( Commissioned in 2010-2017 ) in Asia ................................................................. 32
Figure 4-4 Use Cases of Pumped Storage Hydroelectric Plants
( Commissioned in 2010-2017 ) in Europe ............................................................ 35
vi
List of Tables
Table 2.1 Gross inland consumption of energy, 1990-2014(million tons of oil equivalent) .... 5
Table 2.2 Share of electricity from renewable sources in gross electricity consumption % ..... 9
Table 2.3 Hydropower Installed Capacity of South and Central Asia ..................................... 12
Table 2.4 Hydropower Installed Capacity of East Asia and Pacific ........................................ 14
Table 2.5 Hydropower Installed Capacity of Europe .............................................................. 16
Table 2.6 Countries with Largest Installed capacity of Pumped Storage Plants ..................... 19
Table 2.7 Actual and projected total hydropower capacity and electricity generation in EU . 20
Table 3.1 Pumped Storage Hydroelectric Projects commissioned in Asia in time period
2010-2017 ................................................................................................................................ 22
Table 3.2 Pumped Storage Hydroelectric Projects commissioned in Asia in time period
2010-2017 ................................................................................................................................ 24
Table 4.1 Use Cases of Pumped Storage Hydroelectric Plants in Asia ................................... 28
Table 4.2 Use Cases of Pumped Storage Hydroelectric Plants in Europe ............................... 32
vii
Abbreviations
EU European Union
GW Giga Watt
MW Mega Watt
MWh Mega Watt-hour
Mtoe Million tons of Oil Equivalent
PSH Pumped Storage Hydropower
TOS Transmission Service Operator
TWh Tera Watt-hour
1
1. Introduction
1.1 Background
The world has stepped ahead in search of clean reliable renewable sources of energy after
realizing the severe impacts of global warming resulting from Carbon emission and radiation
hazard due to malfunctioning of atomic energy plants. Different sources of renewable energy
have been identified and most of them are greatly influenced by the seasonal changes on Earth.
Some of the most harnessed sources of renewable energy are hydropower, wind energy, solar
energy, biomass energy, tidal energy, etc. The major limitation of renewable sources is that they
are greatly time dependent and are not available all the time to cope with variable energy
demand. This limitation has led to the concept of storage type hydropower plants. As storage
plants can address seasonal scarcity of water and can be operated corresponding to the variable
demand, they have become very popular. The continuous increase in demand and substantial
variation in demand with time has further stressed on optimization of available energy sources.
A new type of hydropower plant was introduced to address this problem-pumped storage
hydropower plant.
1.2 Definition
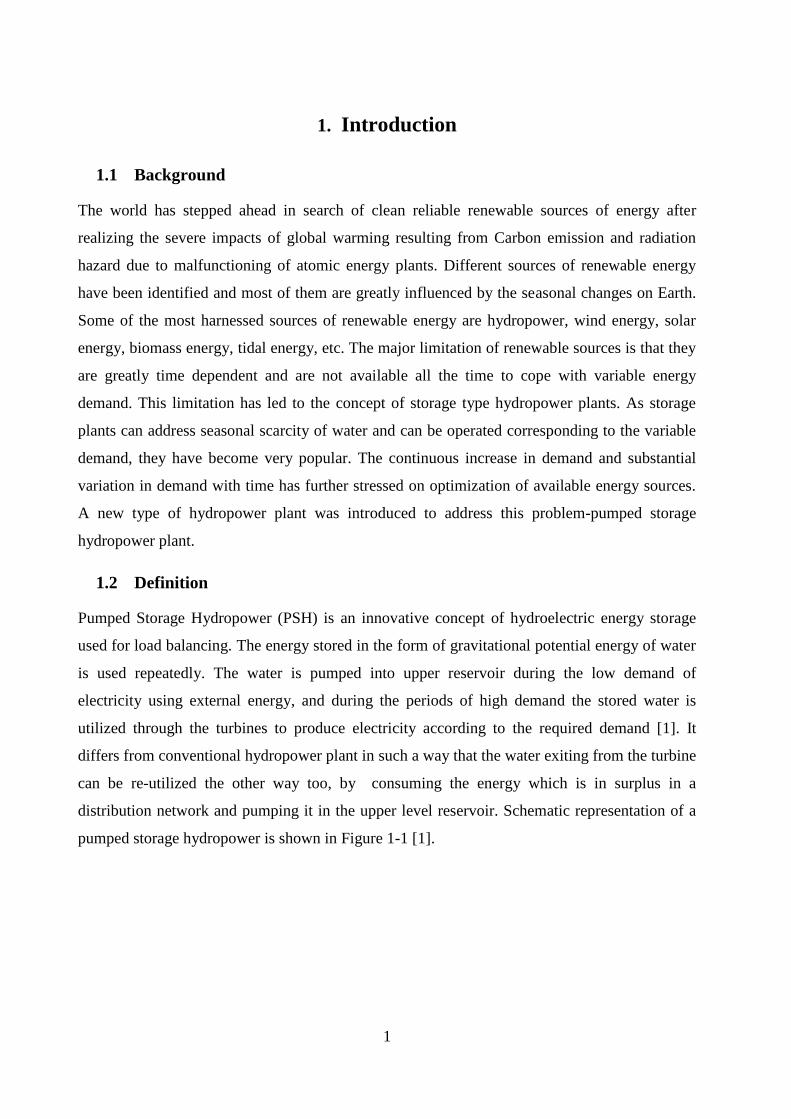
Pumped Storage Hydropower (PSH) is an innovative concept of hydroelectric energy storage
used for load balancing. The energy stored in the form of gravitational potential energy of water
is used repeatedly. The water is pumped into upper reservoir during the low demand of
electricity using external energy, and during the periods of high demand the stored water is
utilized through the turbines to produce electricity according to the required demand [1]. It
differs from conventional hydropower plant in such a way that the water exiting from the turbine
can be re-utilized the other way too, by consuming the energy which is in surplus in a
distribution network and pumping it in the upper level reservoir. Schematic representation of a
pumped storage hydropower is shown in Figure 1-1 [1].
2
Figure 1-1 Typical diagram of Pump storage hydropower
Source: Retrieved from “https://en.wikipedia.org/wiki/Pumped-storage_hydroelectricity”
Since the countries are becoming more concerned towards environmental safeguarding along
with energy production, Wind and solar power have increased their market in many power
systems in the recent decades. Amongst all renewable energy sources, wind energy is the one
with the largest economically feasible potential, but it is accompanied with the highest degree of
variability, and unpredictability [2]. Hence, the high percentage of wind power plants in the
generation mix is challenging the operation of power systems throughout the world. On the one
hand, variability and uncertainty within wind power system require more advanced scheduling
models, which have a direct impact on the amount and type of the required operation reserves.
On the other hand, wind and solar power systems are much more influenced by instantaneous
meteorological conditions which make them incapable of deciding their generation as per
demand. Hence there may be excess energy during off-peak hours when conventional generators
cannot reduce their output due to technical constraints. Thus, increasing the storage capability
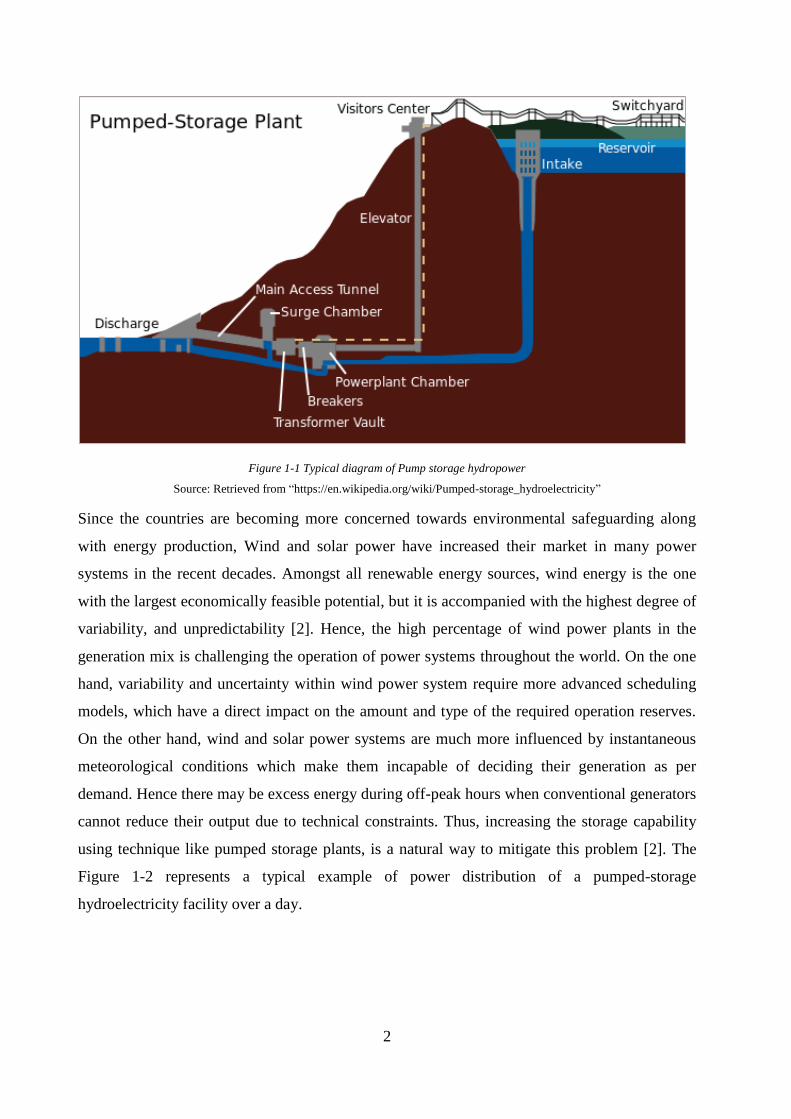
using technique like pumped storage plants, is a natural way to mitigate this problem [2]. The
Figure 1-2 represents a typical example of power distribution of a pumped-storage
hydroelectricity facility over a day.
3
Figure 1-2 Typical example of Pumped storage hydropower operation
Source: Adapted from “https://commons.wikimedia.org/wiki/File:Pumpspeicherkraftwerk_engl.png”
As seen in figure 1-2, during off-peak hours (night time), the PSH plant is operated in pump
mode thus pumping the water from lower reservoir to upper reservoir. Similarly, during peak
hours (day time) the plant functions in generation mode using the gravity-flow of water from
upper to lower reservoir.
1.3 Problem Statement
The EU countries are heading for replacement of the older sources of energy by renewable
energy sources aiming to reduce carbon emission and environmental safeguard. Meanwhile,
some of the shortcomings of major renewable sources like wind energy and solar energy such as
intermittency in supply, no possibility of mass storage and less reliability led to the construction
of bulk energy storage systems like storage hydropower and pumped storage hydropower.
Similar is the case with countries in Asia. But since Asia consists of more developing countries
experiencing acute shortage of energy, the scenario for consumption of energy and development
of renewable energy are quite different. Same is the condition of hydropower development.
With different scenario of demand and supply of electricity than Europe, developing Asian
Turbine Power
Pump Power

4
countries often face huge differences between demand and supply at both peak and off-peak
hours.
Hence, this thesis research has attempted to draw out the general differences in consumption of
energy, development of renewable energy including hydropower and use of pumped storage
hydroelectric plants for power balancing in the grids.
1.4 Objective of Research
This thesis has attempted to give the overview of status of renewable energy, condition of
hydropower development and compare the features of the pumped storage hydroelectric projects
commenced in the period 2010-2017 and highlight development policies in development of
pumped storage hydropower in Europe and Asia. The objectives of this research work are listed
below:
a) General Objective
- To know the status of energy consumption in EU-countries
- To understand the development of Renewable energy in EU-countries.
- To find out and compare the condition of hydropower development in Europe and
Asia
- To find out and compare the condition of pumped storage hydropower development
in Europe and Asia
b) Specific Objective
- To compare the characteristics of Pumped Storage Hydropower commissioned in the
present decade 2010-2017 in Europe and Asia.
- To understand the policies undertaken by countries in Europe and Asia for
development of Pumped Storage Hydropower.
5
2. Literature Review
2.1 Status of renewable energy in Europe
The Renewable Energy Directive requires the European Union to fulfill at least 20% of its total
energy need with renewable energy by 2020- which is to be achieved through the attainment of
individual national targets. All EU countries must ensure that at least 10% of their transportation
fuels come from renewable sources of energy [3].
A proposal published by the European Commission for revised Renewable energy Directive on
30 November 2016, requires to fulfill at least 27% of its total energy with renewable energy by
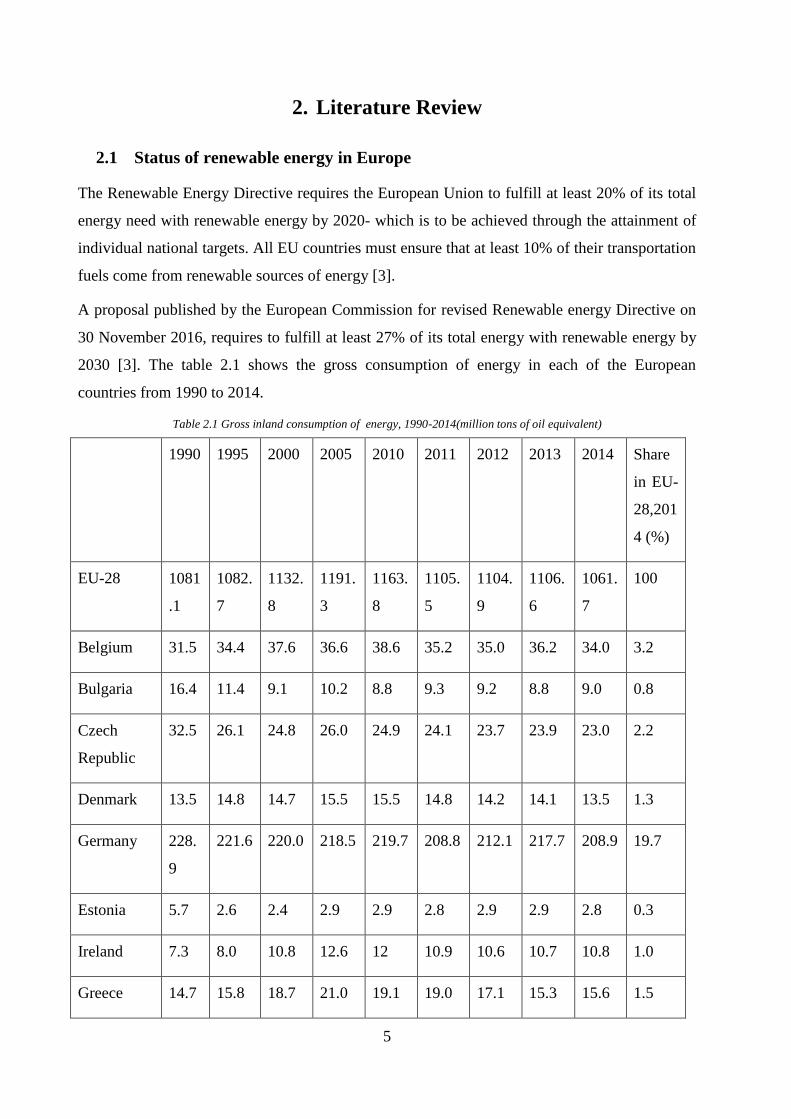
2030 [3]. The table 2.1 shows the gross consumption of energy in each of the European
countries from 1990 to 2014.
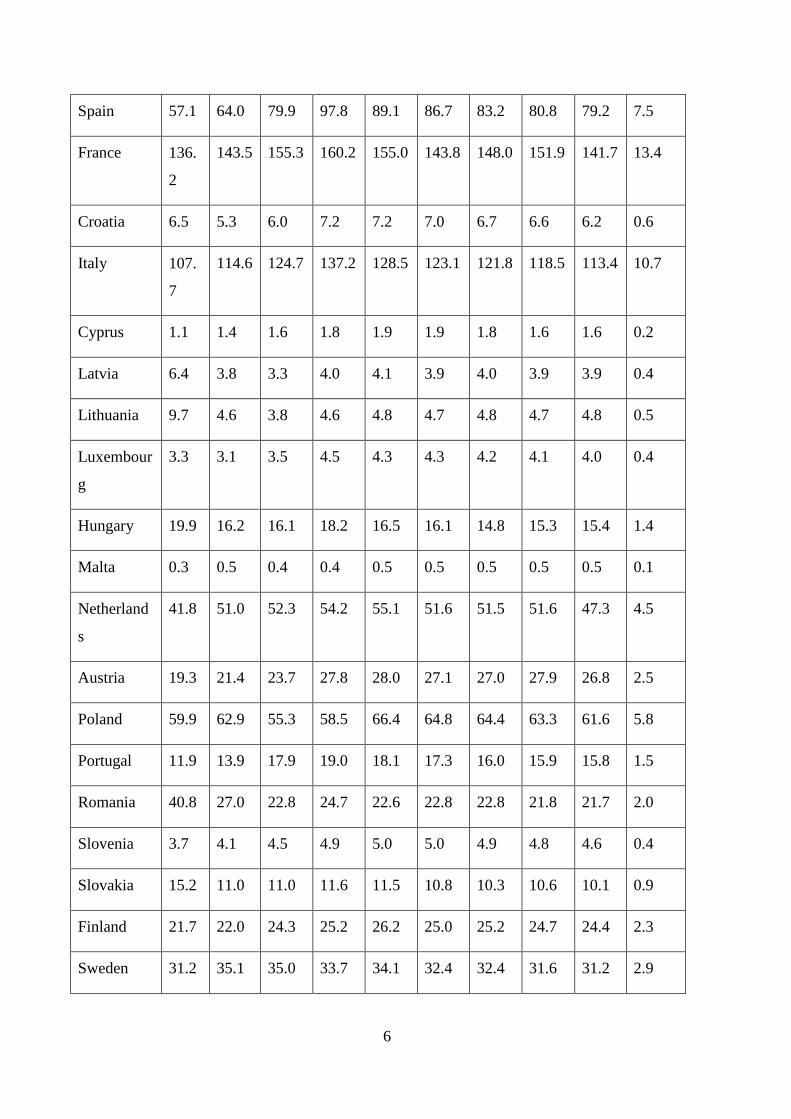
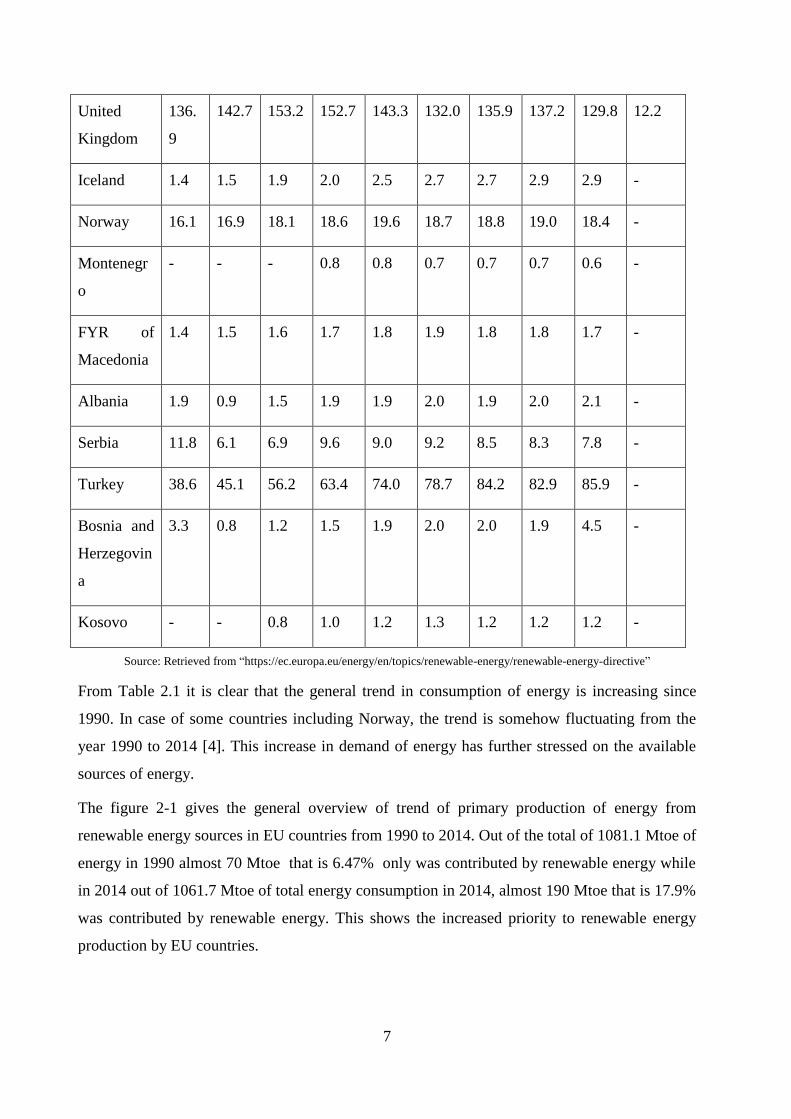
Table 2.1 Gross inland consumption of energy, 1990-2014(million tons of oil equivalent)
1990 1995 2000 2005 2010 2011 2012 2013 2014 Share
in EU-
28,201
4 (%)
EU-28 1081
.1
1082.
7
1132.
8
1191.
3
1163.
8
1105.
5
1104.
9
1106.
6
1061.
7
100
Belgium 31.5 34.4 37.6 36.6 38.6 35.2 35.0 36.2 34.0 3.2
Bulgaria 16.4 11.4 9.1 10.2 8.8 9.3 9.2 8.8 9.0 0.8
Czech
Republic
32.5 26.1 24.8 26.0 24.9 24.1 23.7 23.9 23.0 2.2
Denmark 13.5 14.8 14.7 15.5 15.5 14.8 14.2 14.1 13.5 1.3
Germany 228.
9
221.6 220.0 218.5 219.7 208.8 212.1 217.7 208.9 19.7
Estonia 5.7 2.6 2.4 2.9 2.9 2.8 2.9 2.9 2.8 0.3
Ireland 7.3 8.0 10.8 12.6 12 10.9 10.6 10.7 10.8 1.0
Greece 14.7 15.8 18.7 21.0 19.1 19.0 17.1 15.3 15.6 1.5
6
Spain 57.1 64.0 79.9 97.8 89.1 86.7 83.2 80.8 79.2 7.5
France 136.
2
143.5 155.3 160.2 155.0 143.8 148.0 151.9 141.7 13.4
Croatia 6.5 5.3 6.0 7.2 7.2 7.0 6.7 6.6 6.2 0.6
Italy 107.
7
114.6 124.7 137.2 128.5 123.1 121.8 118.5 113.4 10.7
Cyprus 1.1 1.4 1.6 1.8 1.9 1.9 1.8 1.6 1.6 0.2
Latvia 6.4 3.8 3.3 4.0 4.1 3.9 4.0 3.9 3.9 0.4
Lithuania 9.7 4.6 3.8 4.6 4.8 4.7 4.8 4.7 4.8 0.5
Luxembour
g
3.3 3.1 3.5 4.5 4.3 4.3 4.2 4.1 4.0 0.4
Hungary 19.9 16.2 16.1 18.2 16.5 16.1 14.8 15.3 15.4 1.4
Malta 0.3 0.5 0.4 0.4 0.5 0.5 0.5 0.5 0.5 0.1
Netherland
s
41.8 51.0 52.3 54.2 55.1 51.6 51.5 51.6 47.3 4.5
Austria 19.3 21.4 23.7 27.8 28.0 27.1 27.0 27.9 26.8 2.5
Poland 59.9 62.9 55.3 58.5 66.4 64.8 64.4 63.3 61.6 5.8
Portugal 11.9 13.9 17.9 19.0 18.1 17.3 16.0 15.9 15.8 1.5
Romania 40.8 27.0 22.8 24.7 22.6 22.8 22.8 21.8 21.7 2.0
Slovenia 3.7 4.1 4.5 4.9 5.0 5.0 4.9 4.8 4.6 0.4
Slovakia 15.2 11.0 11.0 11.6 11.5 10.8 10.3 10.6 10.1 0.9
Finland 21.7 22.0 24.3 25.2 26.2 25.0 25.2 24.7 24.4 2.3
Sweden 31.2 35.1 35.0 33.7 34.1 32.4 32.4 31.6 31.2 2.9
7
United
Kingdom
136.
9
142.7 153.2 152.7 143.3 132.0 135.9 137.2 129.8 12.2
Iceland 1.4 1.5 1.9 2.0 2.5 2.7 2.7 2.9 2.9 -
Norway 16.1 16.9 18.1 18.6 19.6 18.7 18.8 19.0 18.4 -
Montenegr
o
- - - 0.8 0.8 0.7 0.7 0.7 0.6 -
FYR of
Macedonia
1.4 1.5 1.6 1.7 1.8 1.9 1.8 1.8 1.7 -
Albania 1.9 0.9 1.5 1.9 1.9 2.0 1.9 2.0 2.1 -
Serbia 11.8 6.1 6.9 9.6 9.0 9.2 8.5 8.3 7.8 -
Turkey 38.6 45.1 56.2 63.4 74.0 78.7 84.2 82.9 85.9 -
Bosnia and
Herzegovin
a
3.3 0.8 1.2 1.5 1.9 2.0 2.0 1.9 4.5 -
Kosovo - - 0.8 1.0 1.2 1.3 1.2 1.2 1.2 -
Source: Retrieved from “https://ec.europa.eu/energy/en/topics/renewable-energy/renewable-energy-directive”
From Table 2.1 it is clear that the general trend in consumption of energy is increasing since
1990. In case of some countries including Norway, the trend is somehow fluctuating from the
year 1990 to 2014 [4]. This increase in demand of energy has further stressed on the available
sources of energy.
The figure 2-1 gives the general overview of trend of primary production of energy from
renewable energy sources in EU countries from 1990 to 2014. Out of the total of 1081.1 Mtoe of
energy in 1990 almost 70 Mtoe that is 6.47% only was contributed by renewable energy while
in 2014 out of 1061.7 Mtoe of total energy consumption in 2014, almost 190 Mtoe that is 17.9%
was contributed by renewable energy. This shows the increased priority to renewable energy
production by EU countries.
8
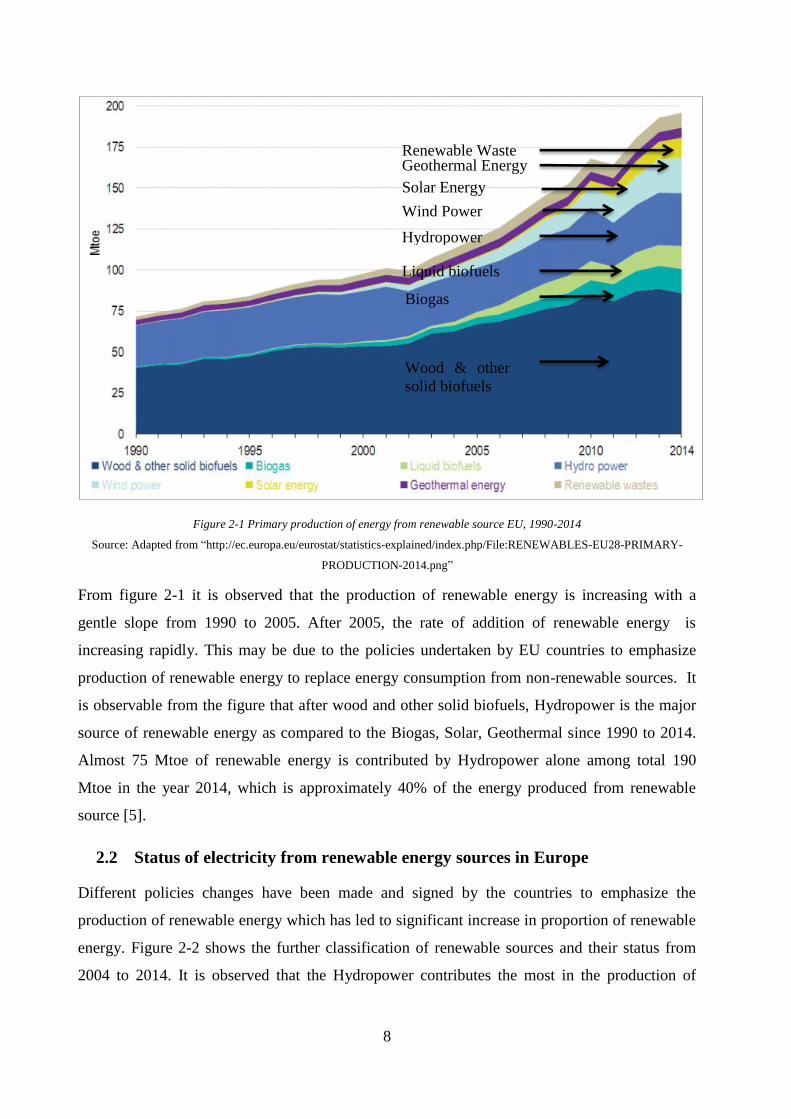
Figure 2-1 Primary production of energy from renewable source EU, 1990-2014
Source: Adapted from “http://ec.europa.eu/eurostat/statistics-explained/index.php/File:RENEWABLES-EU28-PRIMARY-
PRODUCTION-2014.png”
From figure 2-1 it is observed that the production of renewable energy is increasing with a
gentle slope from 1990 to 2005. After 2005, the rate of addition of renewable energy is
increasing rapidly. This may be due to the policies undertaken by EU countries to emphasize
production of renewable energy to replace energy consumption from non-renewable sources. It
is observable from the figure that after wood and other solid biofuels, Hydropower is the major
source of renewable energy as compared to the Biogas, Solar, Geothermal since 1990 to 2014.
Almost 75 Mtoe of renewable energy is contributed by Hydropower alone among total 190
Mtoe in the year 2014, which is approximately 40% of the energy produced from renewable
source [5].
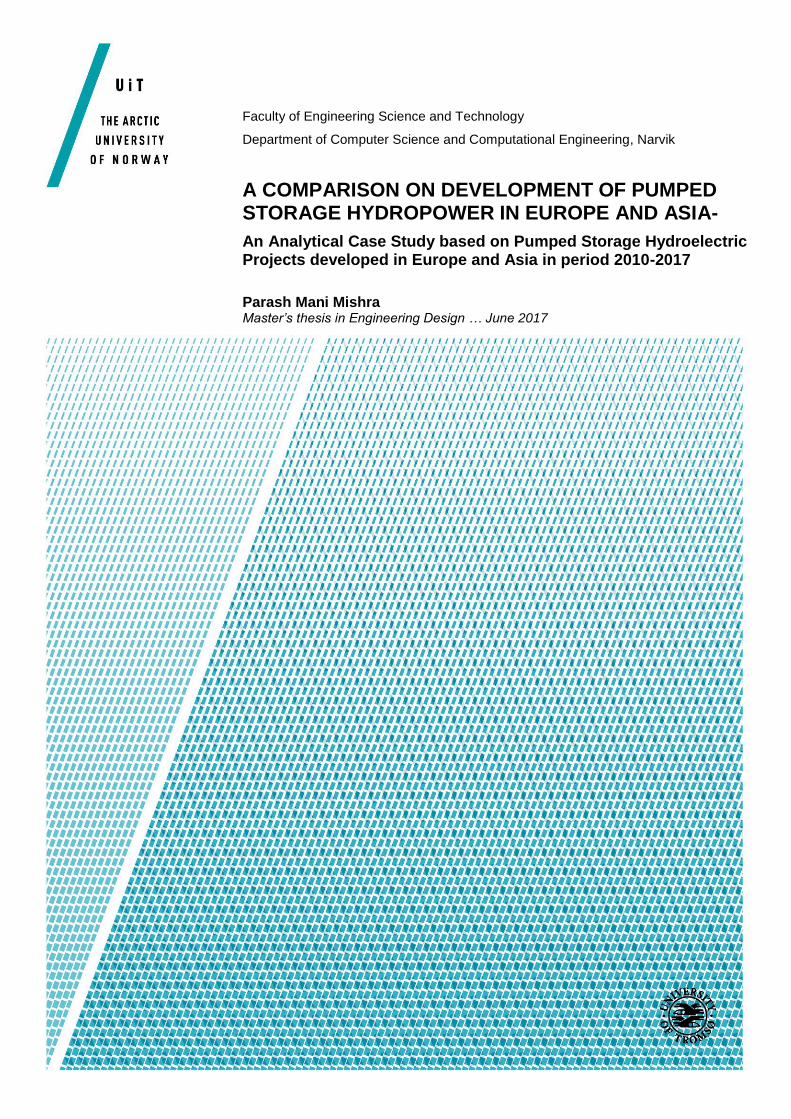
2.2 Status of electricity from renewable energy sources in Europe
Different policies changes have been made and signed by the countries to emphasize the
production of renewable energy which has led to significant increase in proportion of renewable
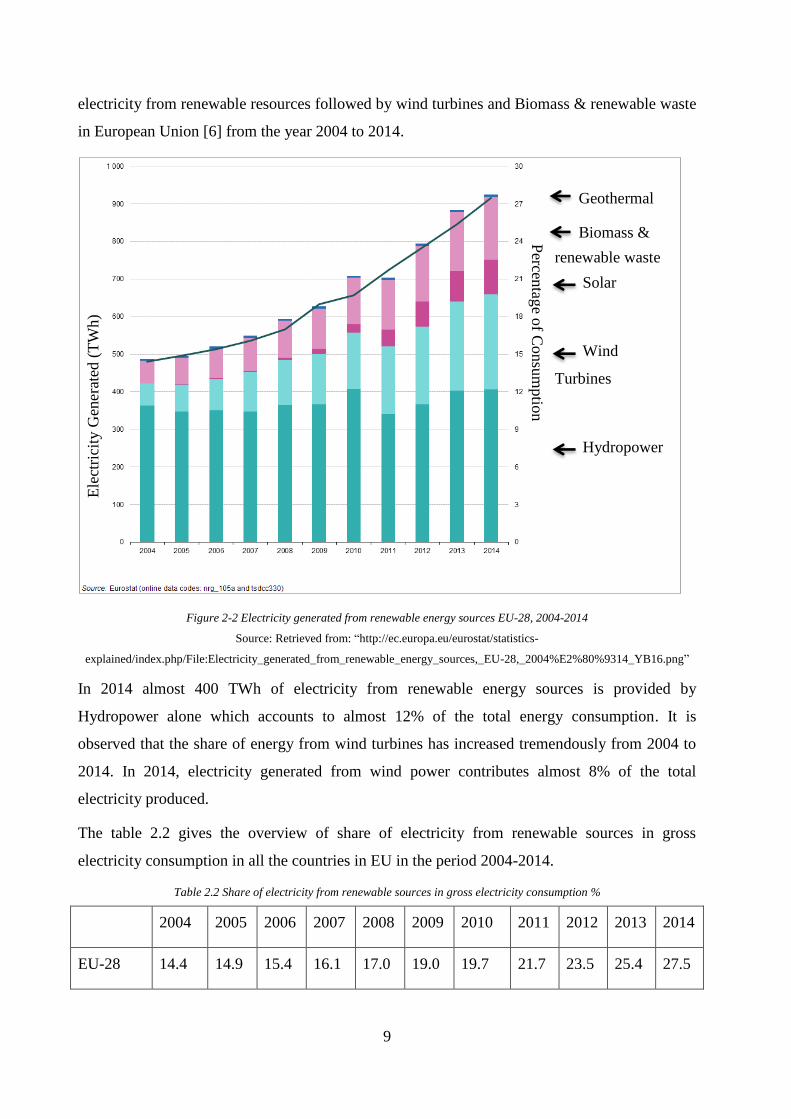
energy. Figure 2-2 shows the further classification of renewable sources and their status from
2004 to 2014. It is observed that the Hydropower contributes the most in the production of
Renewable Waste Geothermal Energy
Solar Energy
Wind Power
Hydropower
Liquid biofuels
Biogas
Wood & other
solid biofuels
9
electricity from renewable resources followed by wind turbines and Biomass & renewable waste
in European Union [6] from the year 2004 to 2014.
Figure 2-2 Electricity generated from renewable energy sources EU-28, 2004-2014
Source: Retrieved from: “http://ec.europa.eu/eurostat/statistics-
explained/index.php/File:Electricity_generated_from_renewable_energy_sources,_EU-28,_2004%E2%80%9314_YB16.png”
In 2014 almost 400 TWh of electricity from renewable energy sources is provided by
Hydropower alone which accounts to almost 12% of the total energy consumption. It is
observed that the share of energy from wind turbines has increased tremendously from 2004 to
2014. In 2014, electricity generated from wind power contributes almost 8% of the total
electricity produced.
The table 2.2 gives the overview of share of electricity from renewable sources in gross
electricity consumption in all the countries in EU in the period 2004-2014.
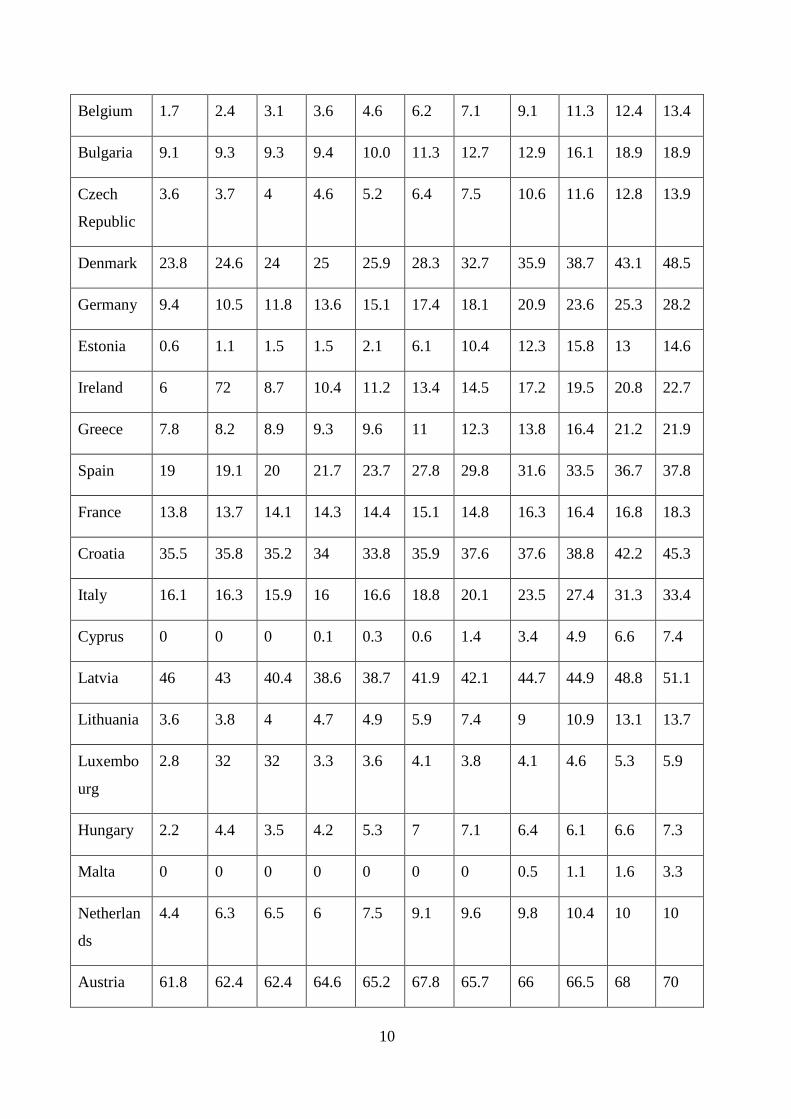
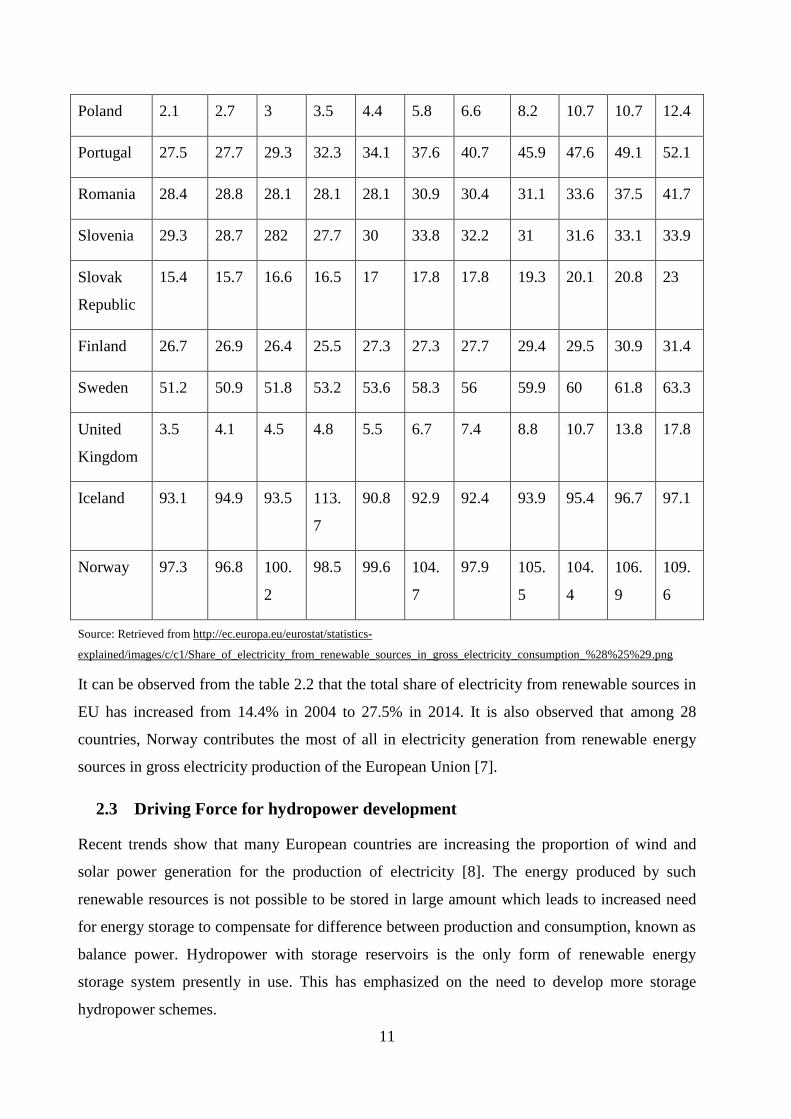
Table 2.2 Share of electricity from renewable sources in gross electricity consumption %
2004 2005 2006 2007 2008 2009 2010 2011 2012 2013 2014
EU-28 14.4 14.9 15.4 16.1 17.0 19.0 19.7 21.7 23.5 25.4 27.5
Geothermal
Biomass &
renewable waste
Solar
Wind
Turbines
Hydropower
Ele
ctri
city
Gen
erat
ed (
TW
h)
Percen
tage o
f Consu
mptio
n
10
Belgium 1.7 2.4 3.1 3.6 4.6 6.2 7.1 9.1 11.3 12.4 13.4
Bulgaria 9.1 9.3 9.3 9.4 10.0 11.3 12.7 12.9 16.1 18.9 18.9
Czech
Republic
3.6 3.7 4 4.6 5.2 6.4 7.5 10.6 11.6 12.8 13.9
Denmark 23.8 24.6 24 25 25.9 28.3 32.7 35.9 38.7 43.1 48.5
Germany 9.4 10.5 11.8 13.6 15.1 17.4 18.1 20.9 23.6 25.3 28.2
Estonia 0.6 1.1 1.5 1.5 2.1 6.1 10.4 12.3 15.8 13 14.6
Ireland 6 72 8.7 10.4 11.2 13.4 14.5 17.2 19.5 20.8 22.7
Greece 7.8 8.2 8.9 9.3 9.6 11 12.3 13.8 16.4 21.2 21.9
Spain 19 19.1 20 21.7 23.7 27.8 29.8 31.6 33.5 36.7 37.8
France 13.8 13.7 14.1 14.3 14.4 15.1 14.8 16.3 16.4 16.8 18.3
Croatia 35.5 35.8 35.2 34 33.8 35.9 37.6 37.6 38.8 42.2 45.3
Italy 16.1 16.3 15.9 16 16.6 18.8 20.1 23.5 27.4 31.3 33.4
Cyprus 0 0 0 0.1 0.3 0.6 1.4 3.4 4.9 6.6 7.4
Latvia 46 43 40.4 38.6 38.7 41.9 42.1 44.7 44.9 48.8 51.1
Lithuania 3.6 3.8 4 4.7 4.9 5.9 7.4 9 10.9 13.1 13.7
Luxembo
urg
2.8 32 32 3.3 3.6 4.1 3.8 4.1 4.6 5.3 5.9
Hungary 2.2 4.4 3.5 4.2 5.3 7 7.1 6.4 6.1 6.6 7.3
Malta 0 0 0 0 0 0 0 0.5 1.1 1.6 3.3
Netherlan
ds
4.4 6.3 6.5 6 7.5 9.1 9.6 9.8 10.4 10 10
Austria 61.8 62.4 62.4 64.6 65.2 67.8 65.7 66 66.5 68 70
11
Poland 2.1 2.7 3 3.5 4.4 5.8 6.6 8.2 10.7 10.7 12.4
Portugal 27.5 27.7 29.3 32.3 34.1 37.6 40.7 45.9 47.6 49.1 52.1
Romania 28.4 28.8 28.1 28.1 28.1 30.9 30.4 31.1 33.6 37.5 41.7
Slovenia 29.3 28.7 282 27.7 30 33.8 32.2 31 31.6 33.1 33.9
Slovak
Republic
15.4 15.7 16.6 16.5 17 17.8 17.8 19.3 20.1 20.8 23
Finland 26.7 26.9 26.4 25.5 27.3 27.3 27.7 29.4 29.5 30.9 31.4
Sweden 51.2 50.9 51.8 53.2 53.6 58.3 56 59.9 60 61.8 63.3
United
Kingdom
3.5 4.1 4.5 4.8 5.5 6.7 7.4 8.8 10.7 13.8 17.8
Iceland 93.1 94.9 93.5 113.
7
90.8 92.9 92.4 93.9 95.4 96.7 97.1
Norway 97.3 96.8 100.
2
98.5 99.6 104.
7
97.9 105.
5
104.
4
106.
9
109.
6
Source: Retrieved from http://ec.europa.eu/eurostat/statistics-
explained/images/c/c1/Share_of_electricity_from_renewable_sources_in_gross_electricity_consumption_%28%25%29.png
It can be observed from the table 2.2 that the total share of electricity from renewable sources in
EU has increased from 14.4% in 2004 to 27.5% in 2014. It is also observed that among 28
countries, Norway contributes the most of all in electricity generation from renewable energy
sources in gross electricity production of the European Union [7].
2.3 Driving Force for hydropower development
Recent trends show that many European countries are increasing the proportion of wind and
solar power generation for the production of electricity [8]. The energy produced by such
renewable resources is not possible to be stored in large amount which leads to increased need
for energy storage to compensate for difference between production and consumption, known as
balance power. Hydropower with storage reservoirs is the only form of renewable energy
storage system presently in use. This has emphasized on the need to develop more storage
hydropower schemes.
12
2.4 Status of Hydropower in Asia and Europe
2.4.1 Status of Hydropower in Asia
As published in the hydropower status report, 2016 by International hydropower association,
South and Central Asian Region include a number of hubs for development of Hydropower such
as Turkey, Tajikistan, Kyrgystan, the Himalayan region spanning Nepal, Bhutan and India’s
northernmost states. Harnessing the vast hydropower resources of Nepal and Bhutan is
considered crucial in order to meet the rapidly growing energy demand of South Asia in a cost
effective and environmentally sustainable manner. [9] Increased private sector involvement has
been witnessed across the South and Central Asian region with a number of notable public-
private partnerships which shows the new opportunities for Independent power producers [9].
The East Asia and Pacific region holds the largest share of global installed hydropower capacity.
China alone accounts for almost one-third of global hydropower capacity. China’s total installed
hydropower capacity is estimated to be 319 GW by the end of 2015. It is observable that most of
the developing countries have headed themselves in harnessing the clean renewable hydropower
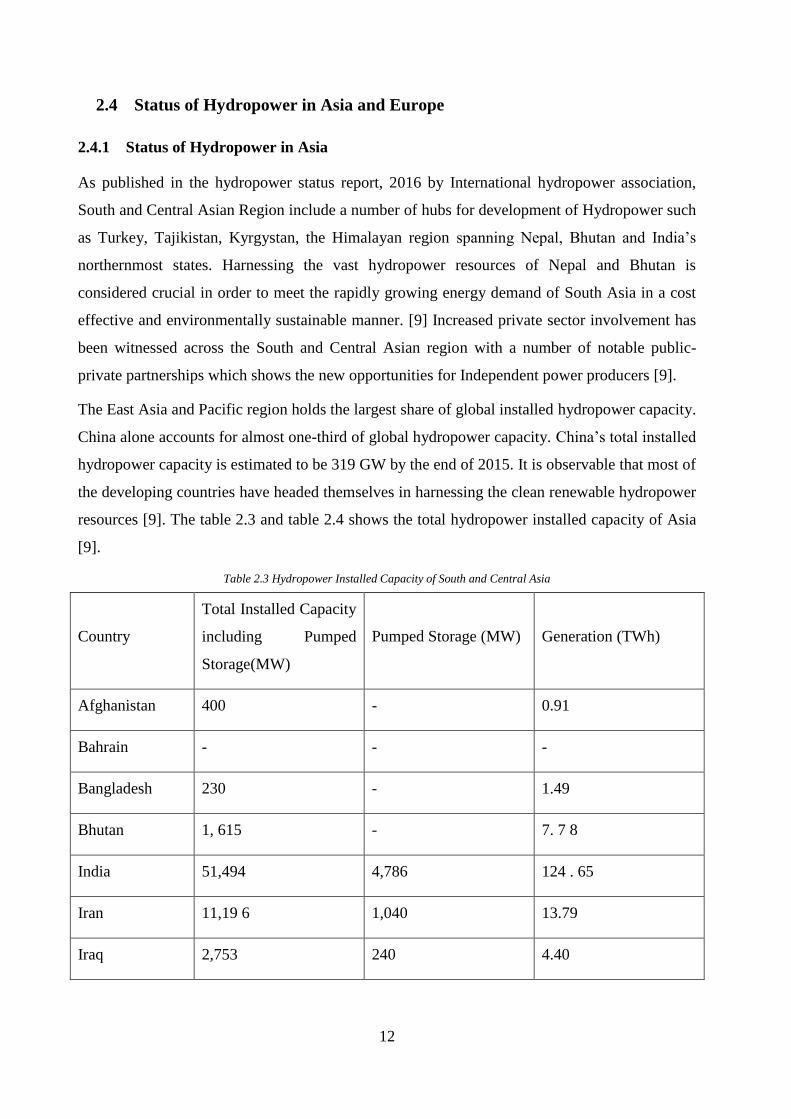
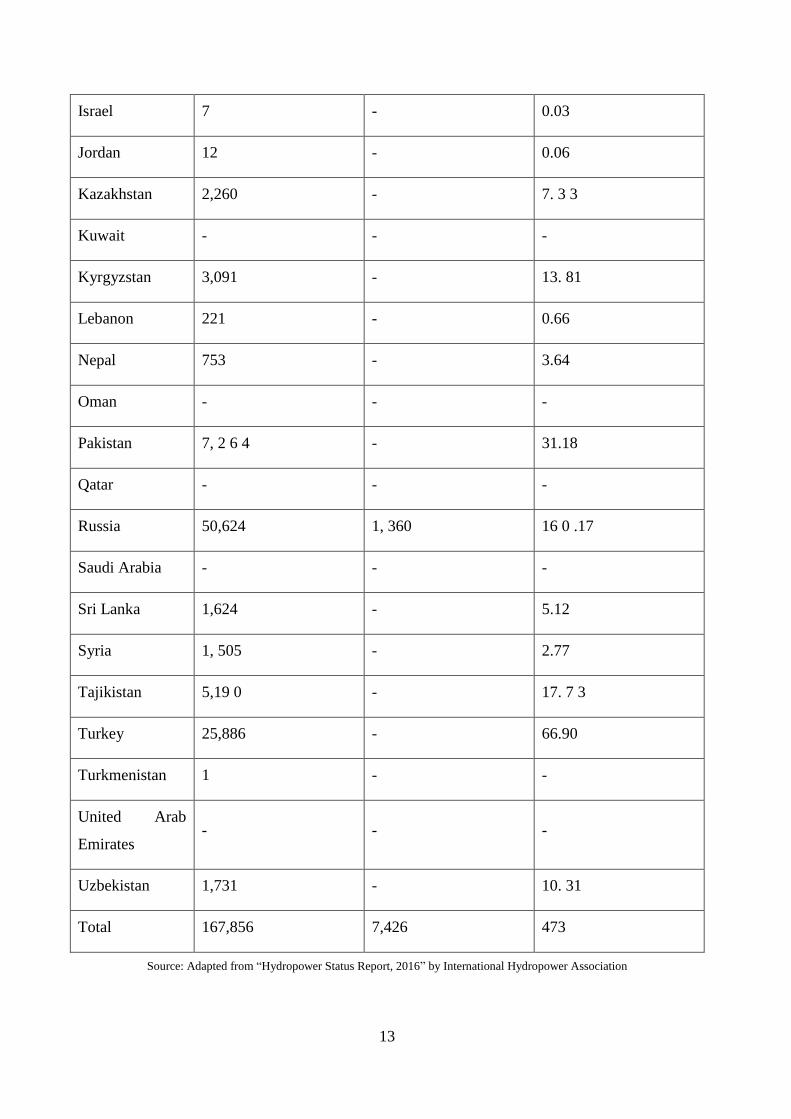
resources [9]. The table 2.3 and table 2.4 shows the total hydropower installed capacity of Asia
[9].
Table 2.3 Hydropower Installed Capacity of South and Central Asia
Country
Total Installed Capacity
including Pumped
Storage(MW)
Pumped Storage (MW) Generation (TWh)
Afghanistan 400 - 0.91
Bahrain - - -
Bangladesh 230 - 1.49
Bhutan 1, 615 - 7. 7 8
India 51,494 4,786 124 . 65
Iran 11,19 6 1,040 13.79
Iraq 2,753 240 4.40
13
Israel 7 - 0.03
Jordan 12 - 0.06
Kazakhstan 2,260 - 7. 3 3
Kuwait - - -
Kyrgyzstan 3,091 - 13. 81
Lebanon 221 - 0.66
Nepal 753 - 3.64
Oman - - -
Pakistan 7, 2 6 4 - 31.18
Qatar - - -
Russia 50,624 1, 360 16 0 .17
Saudi Arabia - - -
Sri Lanka 1,624 - 5.12
Syria 1, 505 - 2.77
Tajikistan 5,19 0 - 17. 7 3
Turkey 25,886 - 66.90
Turkmenistan 1 - -
United Arab
Emirates - - -
Uzbekistan 1,731 - 10. 31
Total 167,856 7,426 473
Source: Adapted from “Hydropower Status Report, 2016” by International Hydropower Association
14
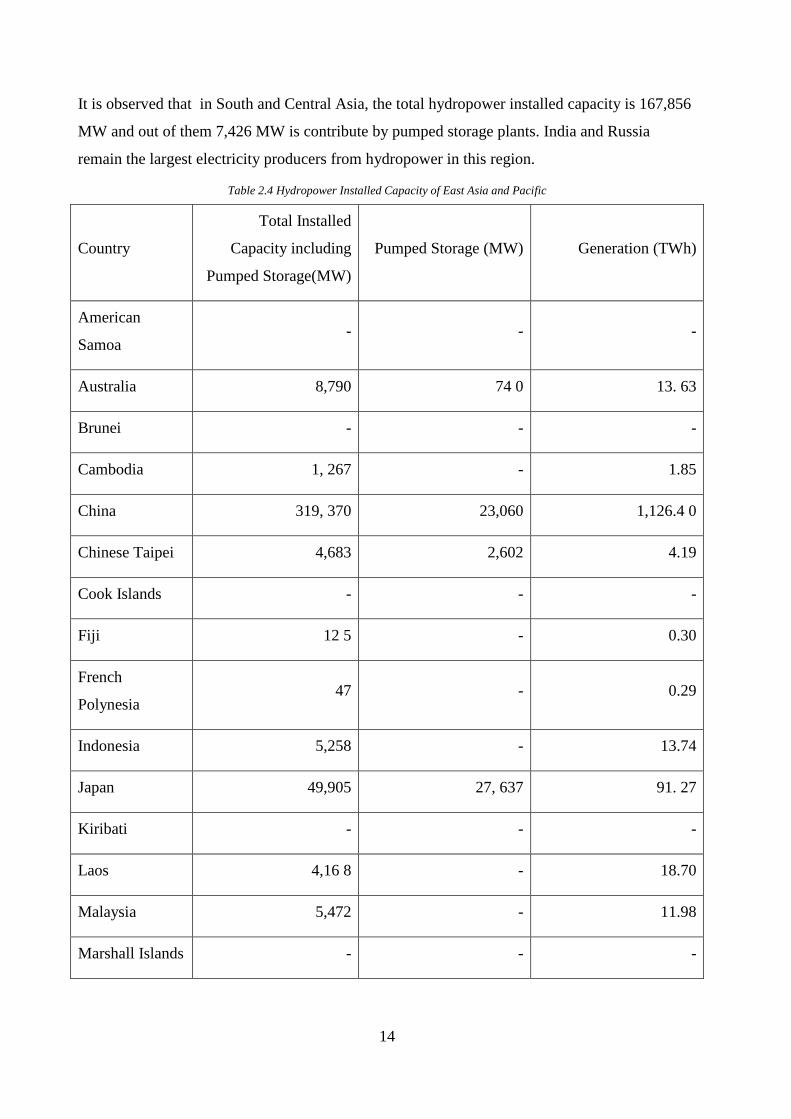
It is observed that in South and Central Asia, the total hydropower installed capacity is 167,856
MW and out of them 7,426 MW is contribute by pumped storage plants. India and Russia
remain the largest electricity producers from hydropower in this region.
Table 2.4 Hydropower Installed Capacity of East Asia and Pacific
Country
Total Installed
Capacity including
Pumped Storage(MW)
Pumped Storage (MW) Generation (TWh)
American
Samoa - - -
Australia 8,790 74 0 13. 63
Brunei - - -
Cambodia 1, 267 - 1.85
China 319, 370 23,060 1,126.4 0
Chinese Taipei 4,683 2,602 4.19
Cook Islands - - -
Fiji 12 5 - 0.30
French
Polynesia 47 - 0.29
Indonesia 5,258 - 13.74
Japan 49,905 27, 637 91. 27
Kiribati - - -
Laos 4,16 8 - 18.70
Malaysia 5,472 - 11.98
Marshall Islands - - -

15
Micronesia,
Federated States
Of
- - -
Mongolia - - -
Myanmar 3,140 - 5.78
Nauru - - -
New Caledonia 78 - 0.33
New Zealand 5,254 - 24.29
Niue - - -
North Korea 5,000 - 13.14
Papua New
Guinea 234 - 0.86
Philippines 4,235 685 9.95
Samoa 12 - 0.05
Singapore - - -
Solomon Islands - - -
South Korea 6,447 4,700 5.86
Thailand 4,510 1,000 11. 6 8
Timor-leste - - -
Tonga - - -
Tuvalu - - -
Vanuatu - - -
Vietnam 15 , 211 - 62.63
16
Wallis And
Futuna - - -
Total 443,207 60,424 1, 417
Source: Adapted from “Hydropower Status Report, 2016” by International Hydropower Association
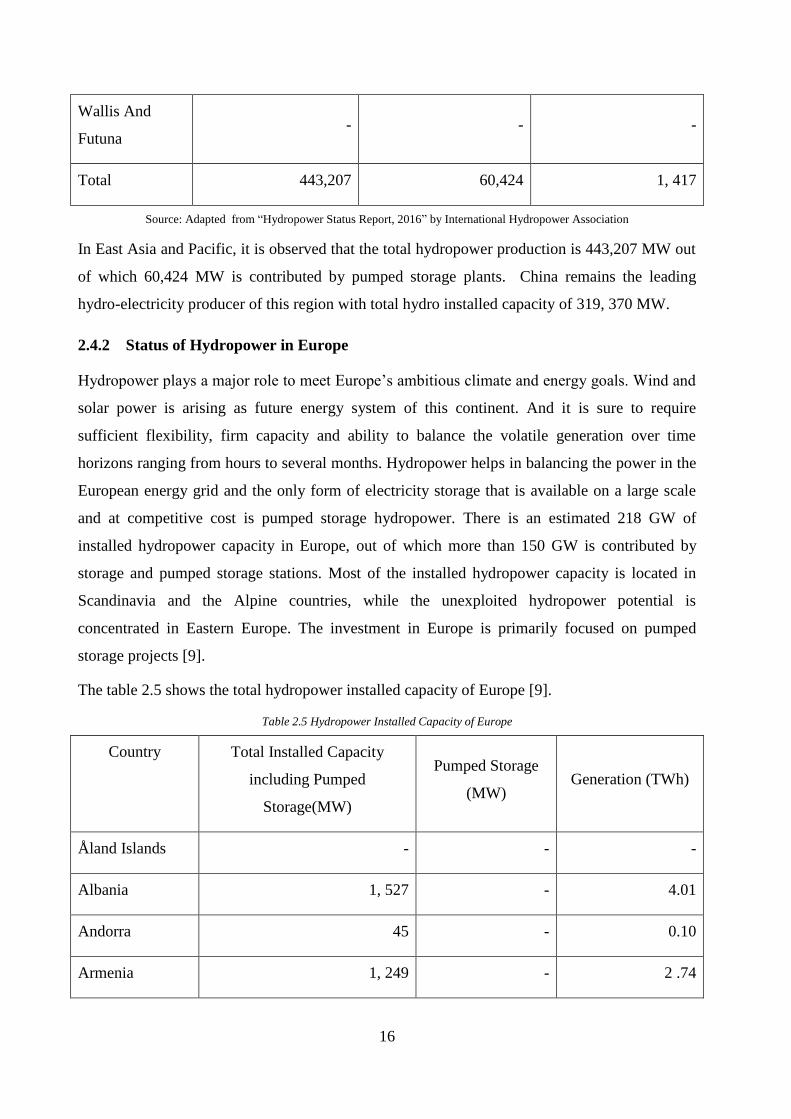
In East Asia and Pacific, it is observed that the total hydropower production is 443,207 MW out
of which 60,424 MW is contributed by pumped storage plants. China remains the leading
hydro-electricity producer of this region with total hydro installed capacity of 319, 370 MW.
2.4.2 Status of Hydropower in Europe
Hydropower plays a major role to meet Europe’s ambitious climate and energy goals. Wind and
solar power is arising as future energy system of this continent. And it is sure to require
sufficient flexibility, firm capacity and ability to balance the volatile generation over time
horizons ranging from hours to several months. Hydropower helps in balancing the power in the
European energy grid and the only form of electricity storage that is available on a large scale
and at competitive cost is pumped storage hydropower. There is an estimated 218 GW of
installed hydropower capacity in Europe, out of which more than 150 GW is contributed by
storage and pumped storage stations. Most of the installed hydropower capacity is located in
Scandinavia and the Alpine countries, while the unexploited hydropower potential is
concentrated in Eastern Europe. The investment in Europe is primarily focused on pumped
storage projects [9].
The table 2.5 shows the total hydropower installed capacity of Europe [9].
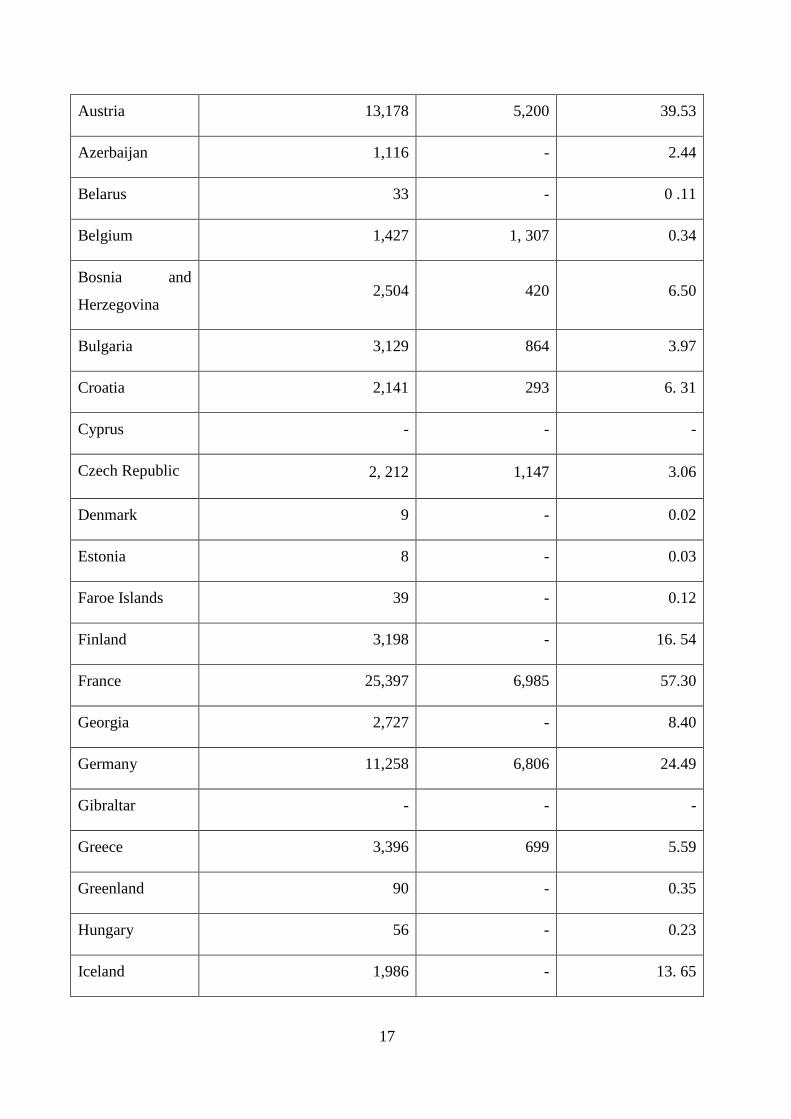
Table 2.5 Hydropower Installed Capacity of Europe
Country Total Installed Capacity
including Pumped
Storage(MW)
Pumped Storage
(MW) Generation (TWh)
Åland Islands - - -
Albania 1, 527 - 4.01
Andorra 45 - 0.10
Armenia 1, 249 - 2 .74
17
Austria 13,178 5,200 39.53
Azerbaijan 1,116 - 2.44
Belarus 33 - 0 .11
Belgium 1,427 1, 307 0.34
Bosnia and
Herzegovina 2,504 420 6.50
Bulgaria 3,129 864 3.97
Croatia 2,141 293 6. 31
Cyprus - - -
Czech Republic 2, 212 1,147 3.06
Denmark 9 - 0.02
Estonia 8 - 0.03
Faroe Islands 39 - 0.12
Finland 3,198 - 16. 54
France 25,397 6,985 57.30
Georgia 2,727 - 8.40
Germany 11,258 6,806 24.49
Gibraltar - - -
Greece 3,396 699 5.59
Greenland 90 - 0.35
Hungary 56 - 0.23
Iceland 1,986 - 13. 65

18
Ireland 529 292 1.08
Italy 21, 880 7,555 44.75
Kosovo 36 - 0.13
Latvia 1, 576 - 3.18
Liechtenstein - - -
Lithuania 876 760 0. 51
Luxembourg 1,13 4 1,10 0 0.09
Macedonia 674 - 1.19
Malta - - -
Moldova 76 - 0.37
Montenegro 658 - 1.80
Netherlands 37 - 0.09
Norway 30,566 1, 351 139. 0 0
Poland 2,351 1,782 2.36
Portugal 5,902 1, 343 9.78
Romania 6,705 92 14.48
San Marino - - -
Serbia 2,835 614 11. 5 0
Slovakia 2,522 916 3.79
Slovenia 1,479 180 4 .11
Spain 18, 561 5,268 32.01
Sweden 16,419 99 73.93

19
Switzerland 15, 635 1, 817 39.00
Ukraine 6,785 1, 315 11. 0 2
United Kingdom 4,443 2,74 4 8.65
Total 218,404 50,949 599
Source: Table Retrieved from “Hydropower Status Report, 2016” by International Hydropower Association
It is found that the total installed hydro capacity of EU countries is 218,404 MW out of which
50,949 MW is contributed by pumped storage plants. Norway remains the leading producer of
hydro-electricity in this region with total installed capacity of 30,566 MW.
2.5 Status of Pumped Storage Hydropower in the World
Pumped storage is a cost-effective bulk energy storage system. Pumped hydro storage power
plants represent approximately 99% of the world’s electrical energy storage capacity with over
150 GW [10]. Currently Japan is the worldwide leader in pumped storage hydropower but China
is expanding its pumped storage hydropower plants quickly and is expected to surpass Japan in
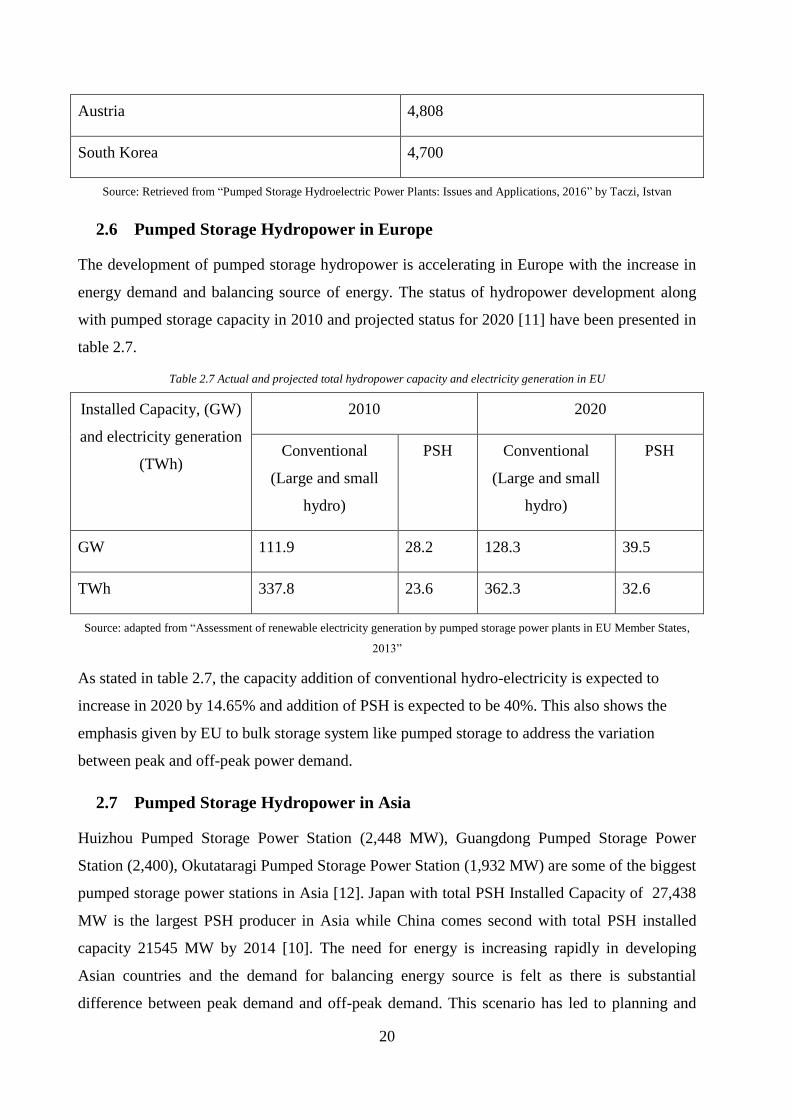
2018. The table 2.6 shows the list of ten countries having the largest installed capacity pumped
storage [10].
Table 2.6 Countries with Largest Installed capacity of Pumped Storage Plants
Country Installed PHS Capacity (MW)
Japan 27,438
China 21,545
United States of America 20,858
Italy 7,071
Spain 6,889
Germany 6,388
France 5,894
India 5,072
20
Austria 4,808
South Korea 4,700
Source: Retrieved from “Pumped Storage Hydroelectric Power Plants: Issues and Applications, 2016” by Taczi, Istvan
2.6 Pumped Storage Hydropower in Europe
The development of pumped storage hydropower is accelerating in Europe with the increase in
energy demand and balancing source of energy. The status of hydropower development along
with pumped storage capacity in 2010 and projected status for 2020 [11] have been presented in
table 2.7.
Table 2.7 Actual and projected total hydropower capacity and electricity generation in EU
Installed Capacity, (GW)
and electricity generation
(TWh)
2010 2020
Conventional
(Large and small
hydro)
PSH Conventional
(Large and small
hydro)
PSH
GW 111.9 28.2 128.3 39.5
TWh 337.8 23.6 362.3 32.6
Source: adapted from “Assessment of renewable electricity generation by pumped storage power plants in EU Member States,
2013”
As stated in table 2.7, the capacity addition of conventional hydro-electricity is expected to
increase in 2020 by 14.65% and addition of PSH is expected to be 40%. This also shows the
emphasis given by EU to bulk storage system like pumped storage to address the variation
between peak and off-peak power demand.
2.7 Pumped Storage Hydropower in Asia
Huizhou Pumped Storage Power Station (2,448 MW), Guangdong Pumped Storage Power
Station (2,400), Okutataragi Pumped Storage Power Station (1,932 MW) are some of the biggest
pumped storage power stations in Asia [12]. Japan with total PSH Installed Capacity of 27,438
MW is the largest PSH producer in Asia while China comes second with total PSH installed
capacity 21545 MW by 2014 [10]. The need for energy is increasing rapidly in developing
Asian countries and the demand for balancing energy source is felt as there is substantial
difference between peak demand and off-peak demand. This scenario has led to planning and
21
construction of pumped storage plants. Yet, it is seen that very few Asian countries have
installed pumped storage plants to support their power system till date [13].
2.7.1 Development of Pumped storage power stations in China
The first PSH in China was put into operation in Gangnan, Pingshan County, Hebei Province on
May 14, 1968. It is a mixed PSH with a pumped storage unit with the installed capacity of 11
MW. Its construction started the history of the PSH development in China. [14]. After the mid-
1980s, the power network of China continually expanded with the rapid development of social
economy, as the result of Chinese Reform and Opening. Thermal power dominated the power
networks of Guangdong Province, North China and East China. The amount of hydropower that
can be utilized in these regions is small as there are limited hydro resources in this region. But
the power networks were facing problem with load regulation in absence of an appropriate
economic measure. The power- shortage situation of the region changed from shortage of
electric quantity to the deficiency of load regulation capacity. Consequently the construction of
the PSH in power networks gradually became a compulsion to improve this problem. The total
installed capacity of the PSH in China reached 21.83 GW by the end of 2014, which accounts
for 1.6% of the national total in China. Up to 2020, the total installed capacity of the PSH will
reach 70 GW [14].
22
3. Methodology
This thesis tries to illustrate the overview of the current conditions of energy consumption,
energy production from renewable sources, hydropower, the demanding for balancing power in
case of operation of wind power or other types of renewable energy in a grid system. Moreover
this thesis analyses the case studies focused on PSHs in Europe and Asia and highlights the
policies in development of PSH in EU and Asia. The thesis explores the recent trend of
development of pumped storage hydroelectric plants in Europe and Asia. In this thesis, the
comparison is made between the characteristics of PSH in operation in Asia and Europe from
2010 to 2017.
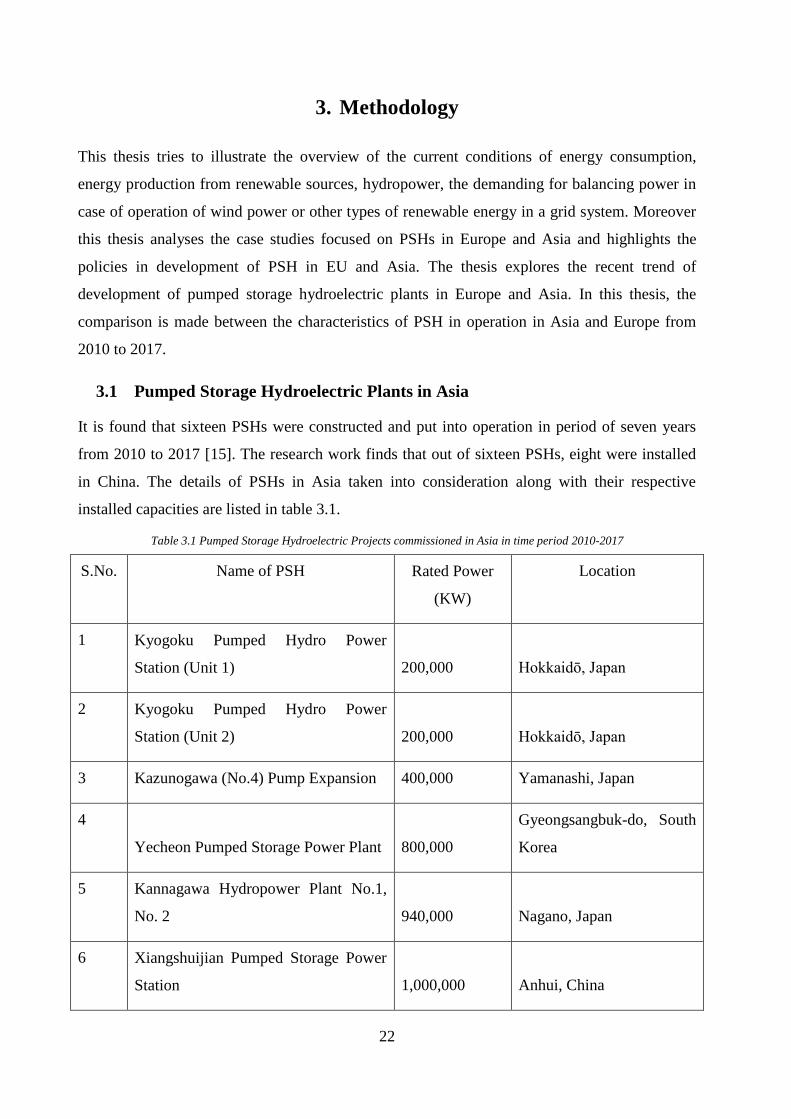
3.1 Pumped Storage Hydroelectric Plants in Asia
It is found that sixteen PSHs were constructed and put into operation in period of seven years
from 2010 to 2017 [15]. The research work finds that out of sixteen PSHs, eight were installed
in China. The details of PSHs in Asia taken into consideration along with their respective
installed capacities are listed in table 3.1.
Table 3.1 Pumped Storage Hydroelectric Projects commissioned in Asia in time period 2010-2017
S.No. Name of PSH Rated Power
(KW)
Location
1 Kyogoku Pumped Hydro Power
Station (Unit 1) 200,000 Hokkaidō, Japan
2 Kyogoku Pumped Hydro Power
Station (Unit 2) 200,000 Hokkaidō, Japan
3 Kazunogawa (No.4) Pump Expansion 400,000 Yamanashi, Japan
4
Yecheon Pumped Storage Power Plant 800,000
Gyeongsangbuk-do, South
Korea
5 Kannagawa Hydropower Plant No.1,
No. 2 940,000 Nagano, Japan
6 Xiangshuijian Pumped Storage Power
Station 1,000,000 Anhui, China

23
7 Tehri Pumped Storage Hydroelectric
Power Plant 1,000,000 Uttarakhand, India
8 Siah Bishe Pumped Storage Power
Plant 1,040,000 Mazandaran, Iran
9 Xianyou Pumped Storage Power
Station 1,200,000 Fujian, China
10 Baoquan Reservoir 1,200,000 XinXiang, China
11 Heimifeng Pumped Storage Power
Station 1,200,000 Hunan, China
12 Pushihe Pumped Storage Power
Station 1,200,000 Liaoning, China
13 Omarugawa Pumped Hydro Storage
Station 1,200,000 Miyazaki, Japan
14 Hohhot Pumped Storage Power Station 1,224,000 Inner Mongolia, China
15 Xianju Pumped Storage Power Station 1,500,000 Zhejiang, China
16 Huizhou Pumped Storage Power
Station 2,448,000 Guangdong, China
Source: http://www.energystorageexchange.org/projects/advanced_search
It is found that 16,752 MW of PSH is added to grids in Asia in the period 2010-2017. Most of
the PSH plants are installed in China with total added capacity of 10,972 MW.
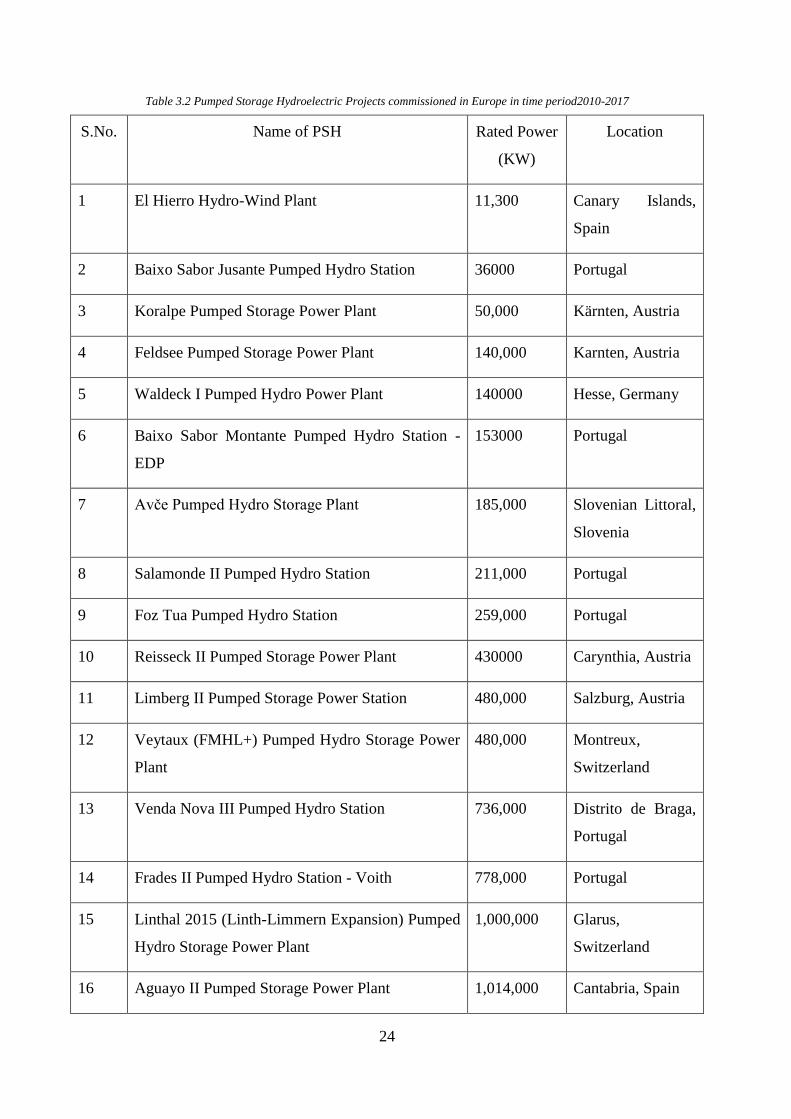
3.2 Pumped Storage Hydroelectric Plants in Europe
In Europe, seventeen PSHs are put into operation in the period 2010-2017 [15]. Out of them,
four PSH were constructed in Austria. The details of PSHs in Europe taken into consideration
along with their respective installed capacities are listed in table 3.2:
24
Table 3.2 Pumped Storage Hydroelectric Projects commissioned in Europe in time period2010-2017
S.No. Name of PSH Rated Power
(KW)
Location
1 El Hierro Hydro-Wind Plant 11,300 Canary Islands,
Spain
2 Baixo Sabor Jusante Pumped Hydro Station 36000 Portugal
3 Koralpe Pumped Storage Power Plant 50,000 Kärnten, Austria
4 Feldsee Pumped Storage Power Plant 140,000 Karnten, Austria
5 Waldeck I Pumped Hydro Power Plant 140000 Hesse, Germany
6 Baixo Sabor Montante Pumped Hydro Station -
EDP
153000 Portugal
7 Avče Pumped Hydro Storage Plant 185,000 Slovenian Littoral,
Slovenia
8 Salamonde II Pumped Hydro Station 211,000 Portugal
9 Foz Tua Pumped Hydro Station 259,000 Portugal
10 Reisseck II Pumped Storage Power Plant 430000 Carynthia, Austria
11 Limberg II Pumped Storage Power Station 480,000 Salzburg, Austria
12 Veytaux (FMHL+) Pumped Hydro Storage Power
Plant
480,000 Montreux,
Switzerland
13 Venda Nova III Pumped Hydro Station 736,000 Distrito de Braga,
Portugal
14 Frades II Pumped Hydro Station - Voith 778,000 Portugal
15 Linthal 2015 (Linth-Limmern Expansion) Pumped
Hydro Storage Power Plant
1,000,000 Glarus,
Switzerland
16 Aguayo II Pumped Storage Power Plant 1,014,000 Cantabria, Spain

25
17 La Muela pumped-storage plant 2,000,000 Valancia, Spain
Source: http://www.energystorageexchange.org/projects/advanced_search
It is found that in the above mentioned period, 8103.3 MW of PSH capacity is added to grids in
Europe.
3.3 Comparison of PSH development in Europe and Asia
In order to draw out the differences in patterns of PSH development in Europe and Asia, attempt
has been made to compare annual addition of installed capacity of PSH in both continents.
Moreover, comparison is made between unit cost of PSH construction taking PSH of similar
capacity into consideration. Similarly, the major objectives of PSH installation with respect to
power grid is compared taking the above mentioned PSHs into consideration. Lastly the PSH
development policies of some of the representative countries of Europe and Asia are discussed
to estimate the future trend of PSH development.
3.3.1 Annual Addition of PSH in grids in Europe and Asia
In order to compare the annual addition of PSH, the PSHs commissioned in the period 2010-
2017 are grouped based on their year of commissioning and the total addition for each year in
Europe and Asia was calculated and compared.
3.3.2 Cost of PSH construction in Europe and Asia
The unit cost of PSH development highly depends on a number of factors such as topography,
geology and accessibility of the project area. The thesis has attempted to compare the unit cost
of construction in PSHs in Europe and Asia commissioned in the period 2010-2017.
For the comparison of unit cost of installation of PSH in Europe and Asia, the projects with
similar capacity are grouped together. The total cost of construction of individual PSHs are
divided by their installed capacity to compute per-megawatt-cost of construction.
3.3.3 Use Cases of PSH in Europe and Asia
PSH contribute to the power grid in a number of ways. Based on the requirement of grid, PSH
are set to perform particular tasks. This thesis work has attempted to investigate the general
trend of use of PSHs in the grids in European and Asian countries. The investigation is carried
out to classify the PSHs based on the following use cases in the grid [16]:
a) Electric Energy Time Shift
26
b) Electric Supply Capacity
c) Load Following (Tertiary Balancing)
d) Electric Supply Reserve Capacity- Spinning
e) Frequency Regulation
f) Volatage Support
g) Renewable Energy Time Shift
h) Black Start
i) Renewables Capacity Firming
3.3.4 Ownership of PSHs in Europe and Asia
Comparison is made to see whether the public institution owns the PSH or there is participation
of private sector. The investigation is carried out to determine the general trend of ownership of
each of the above mentioned PSH projects. This comparison greatly reflects the policies
undertaken by the countries for development of PSHs.
3.3.5 Policies for development of PSHs in Europe and Asia
The thesis research gives the overview of obstructions/ difficulties faced, historical changes in
policies and current policies undertaken by some representing countries of Europe and Asia.
27
4. Data Analysis and Result
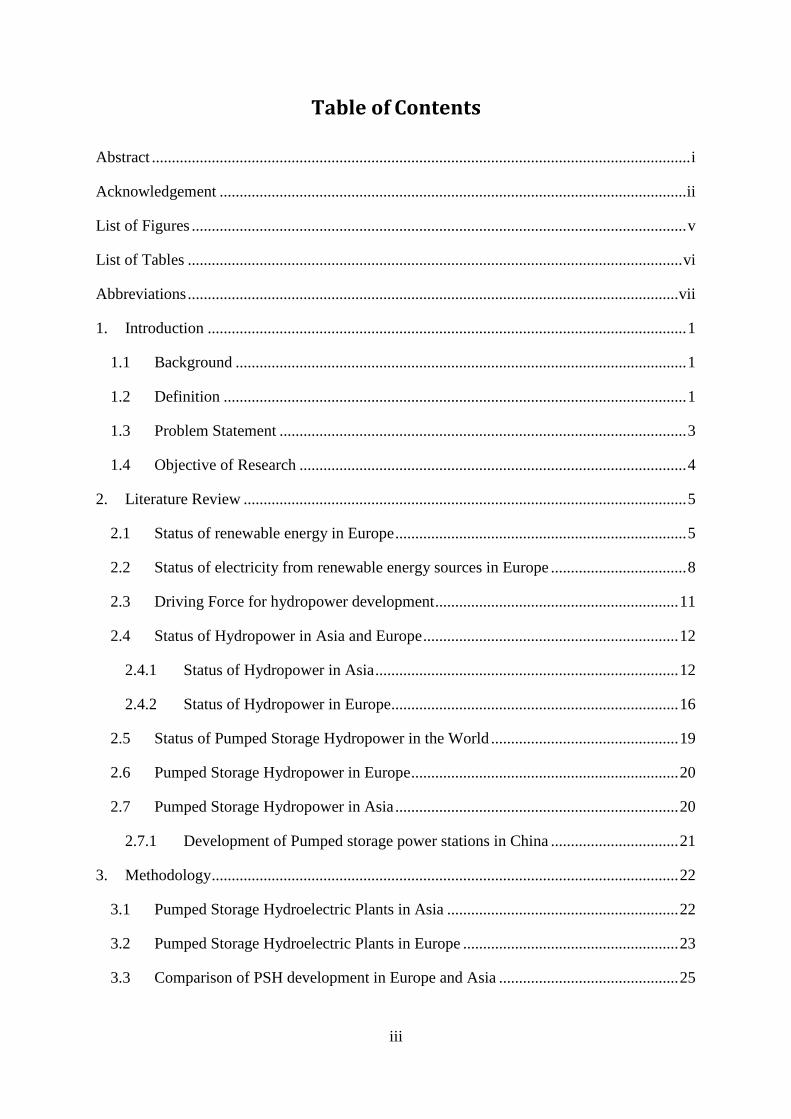
4.1 Annual Addition of PSH in grids in Europe and Asia
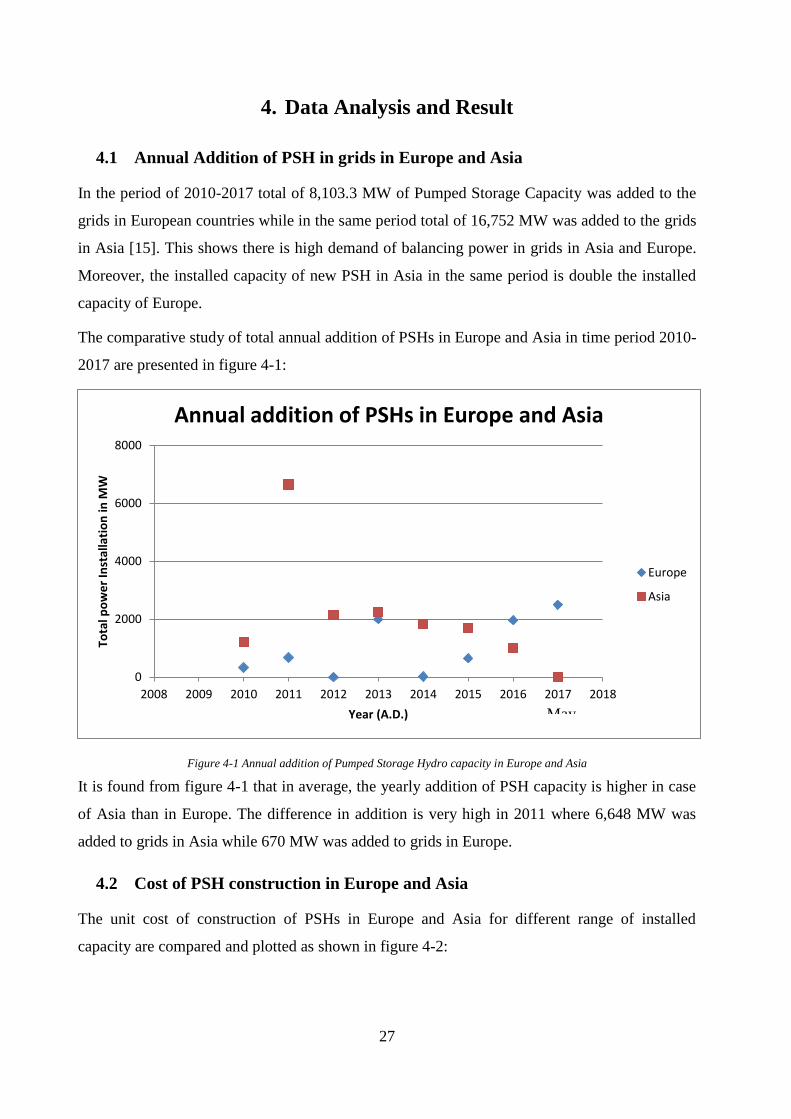
In the period of 2010-2017 total of 8,103.3 MW of Pumped Storage Capacity was added to the
grids in European countries while in the same period total of 16,752 MW was added to the grids
in Asia [15]. This shows there is high demand of balancing power in grids in Asia and Europe.
Moreover, the installed capacity of new PSH in Asia in the same period is double the installed
capacity of Europe.
The comparative study of total annual addition of PSHs in Europe and Asia in time period 2010-
2017 are presented in figure 4-1:
Figure 4-1 Annual addition of Pumped Storage Hydro capacity in Europe and Asia
It is found from figure 4-1 that in average, the yearly addition of PSH capacity is higher in case
of Asia than in Europe. The difference in addition is very high in 2011 where 6,648 MW was
added to grids in Asia while 670 MW was added to grids in Europe.
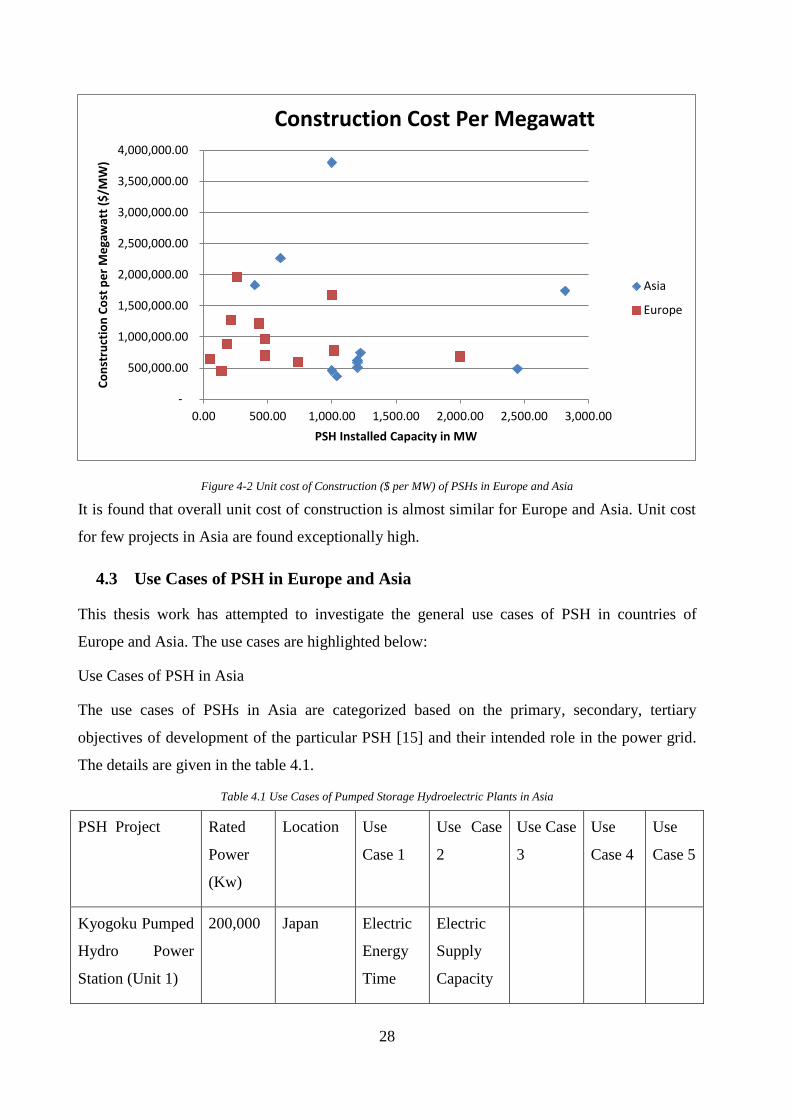
4.2 Cost of PSH construction in Europe and Asia
The unit cost of construction of PSHs in Europe and Asia for different range of installed
capacity are compared and plotted as shown in figure 4-2:
0
2000
4000
6000
8000
2008 2009 2010 2011 2012 2013 2014 2015 2016 2017 2018
Tota
l po
we
r In
stal
lati
on
in M
W
Year (A.D.)
Annual addition of PSHs in Europe and Asia
Europe
Asia
May
28
Figure 4-2 Unit cost of Construction ($ per MW) of PSHs in Europe and Asia
It is found that overall unit cost of construction is almost similar for Europe and Asia. Unit cost
for few projects in Asia are found exceptionally high.
4.3 Use Cases of PSH in Europe and Asia
This thesis work has attempted to investigate the general use cases of PSH in countries of
Europe and Asia. The use cases are highlighted below:
Use Cases of PSH in Asia
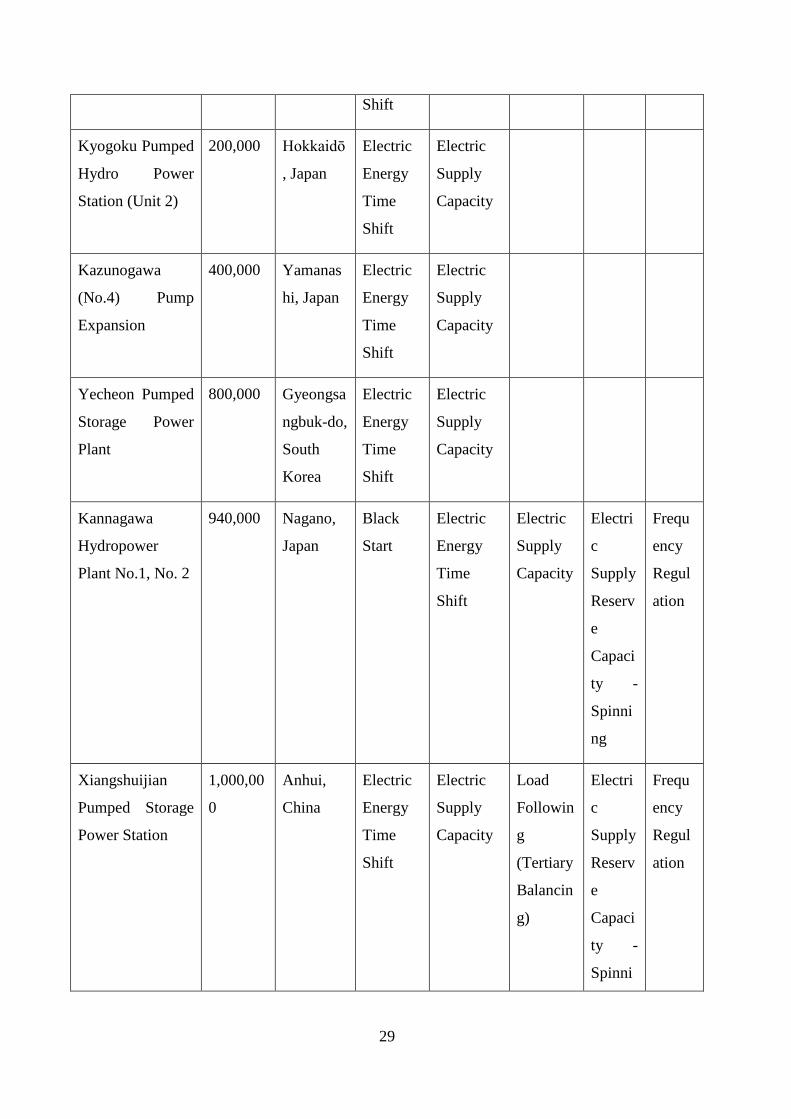
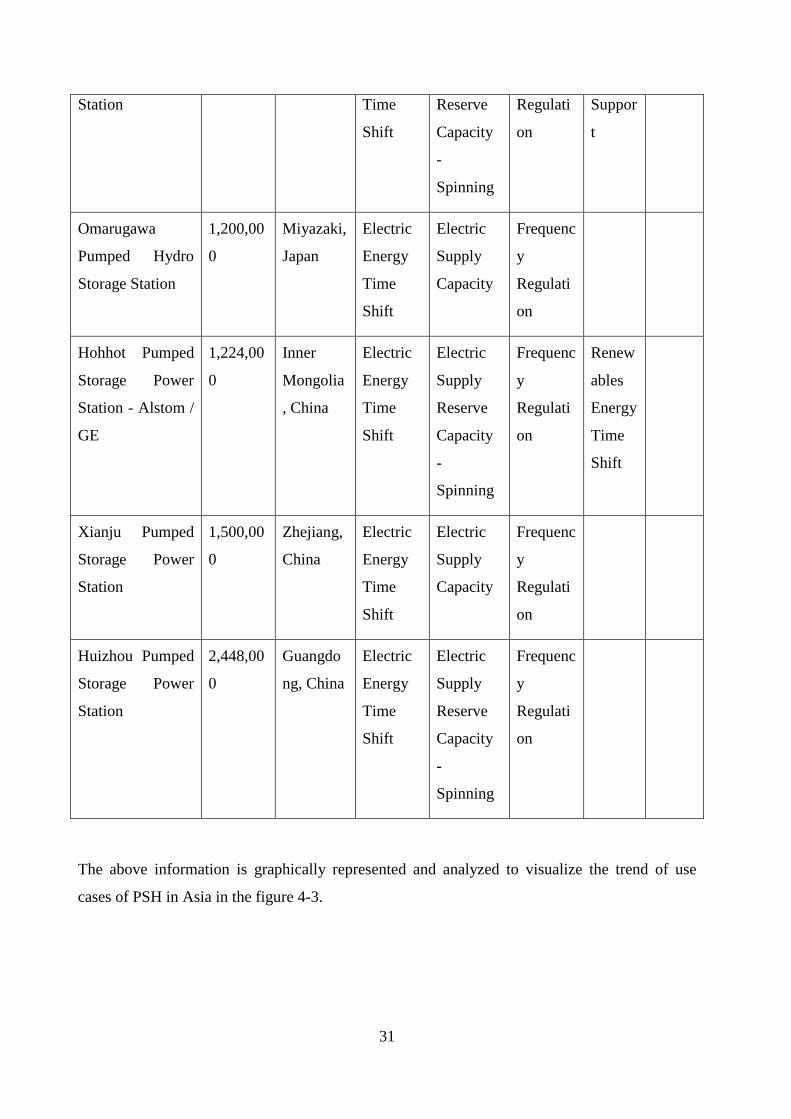
The use cases of PSHs in Asia are categorized based on the primary, secondary, tertiary
objectives of development of the particular PSH [15] and their intended role in the power grid.
The details are given in the table 4.1.
Table 4.1 Use Cases of Pumped Storage Hydroelectric Plants in Asia
PSH Project Rated
Power
(Kw)
Location Use
Case 1
Use Case
2
Use Case
3
Use
Case 4
Use
Case 5
Kyogoku Pumped
Hydro Power
Station (Unit 1)
200,000 Japan Electric
Energy
Time
Electric
Supply
Capacity
-
500,000.00
1,000,000.00
1,500,000.00
2,000,000.00
2,500,000.00
3,000,000.00
3,500,000.00
4,000,000.00
0.00 500.00 1,000.00 1,500.00 2,000.00 2,500.00 3,000.00
Co
nst
ruct
ion
Co
st p
er
Me
gaw
att
($/M
W)
PSH Installed Capacity in MW
Construction Cost Per Megawatt
Asia
Europe
29
Shift
Kyogoku Pumped
Hydro Power
Station (Unit 2)
200,000 Hokkaidō
, Japan
Electric
Energy
Time
Shift
Electric
Supply
Capacity
Kazunogawa
(No.4) Pump
Expansion
400,000 Yamanas
hi, Japan
Electric
Energy
Time
Shift
Electric
Supply
Capacity
Yecheon Pumped
Storage Power
Plant
800,000 Gyeongsa
ngbuk-do,
South
Korea
Electric
Energy
Time
Shift
Electric
Supply
Capacity
Kannagawa
Hydropower
Plant No.1, No. 2
940,000 Nagano,
Japan
Black
Start
Electric
Energy
Time
Shift
Electric
Supply
Capacity
Electri
c
Supply
Reserv
e
Capaci
ty -
Spinni
ng
Frequ
ency
Regul
ation
Xiangshuijian
Pumped Storage
Power Station
1,000,00
0
Anhui,
China
Electric
Energy
Time
Shift
Electric
Supply
Capacity
Load
Followin
g
(Tertiary
Balancin
g)
Electri
c
Supply
Reserv
e
Capaci
ty -
Spinni
Frequ
ency
Regul
ation

30
ng
Tehri Pumped
Storage
Hydroelectric
Power Plant
1,000,00
0
Uttarakha
nd, India
Electric
Energy
Time
Shift
Electric
Supply
Capacity
Siah Bishe
Pumped Storage
Power Plant
1,040,00
0
Mazandar
an, Iran
Electric
Energy
Time
Shift
Electric
Supply
Capacity
Load
Followin
g
(Tertiary
Balancin
g)
Xianyou Pumped
Storage Power
Station
1,200,00
0
Fujian,
China
Electric
Energy
Time
Shift
Electric
Supply
Capacity
Electric
Supply
Reserve
Capacity
-
Spinning
Freque
ncy
Regula
tion
Load
Follo
wing
(Tertia
ry
Balan
cing)
Baoquan
Reservoir
1,200,00
0
XinXiang
, China
Electric
Energy
Time
Shift
Heimifeng
Pumped Storage
Power Station
1,200,00
0
Hunan,
China
Electric
Energy
Time
Shift
Electric
Supply
Reserve
Capacity
-
Spinning
Pushihe Pumped
Storage Power
1,200,00
0
Liaoning,
China
Electric
Energy
Electric
Supply
Frequenc
y
Voltag
e
31
Station Time
Shift
Reserve
Capacity
-
Spinning
Regulati
on
Suppor
t
Omarugawa
Pumped Hydro
Storage Station
1,200,00
0
Miyazaki,
Japan
Electric
Energy
Time
Shift
Electric
Supply
Capacity
Frequenc
y
Regulati
on
Hohhot Pumped
Storage Power
Station - Alstom /
GE
1,224,00
0
Inner
Mongolia
, China
Electric
Energy
Time
Shift
Electric
Supply
Reserve
Capacity
-
Spinning
Frequenc
y
Regulati
on
Renew
ables
Energy
Time
Shift
Xianju Pumped
Storage Power
Station
1,500,00
0
Zhejiang,
China
Electric
Energy
Time
Shift
Electric
Supply
Capacity
Frequenc
y
Regulati
on
Huizhou Pumped
Storage Power
Station
2,448,00
0
Guangdo
ng, China
Electric
Energy
Time
Shift
Electric
Supply
Reserve
Capacity
-
Spinning
Frequenc
y
Regulati
on
The above information is graphically represented and analyzed to visualize the trend of use
cases of PSH in Asia in the figure 4-3.

32
Figure 4-3 Use Cases of Pumped Storage Hydroelectric Plants ( Commissioned in 2010-2017 ) in Asia
It is observed from the above information that out of sixteen PSHs in Asia commissioned
between 2010-2017 fifteen are primarily used for electric energy time shift. Fifteen PSHs serve
secondary purpose out of which ten PSHs are used for enhancing the electric supply capacity.
Furthermore, nine projects are used for tertiary purpose and out of them seven serve the purpose
of frequency regulation in the grid. Similarly, five out of sixteen PSHs serve fourth purpose and
three out of sixteen serve even fifth purpose. Minority of projects are used for tertiary balancing,
renewable energy time shift, voltage support or black start.
Use Cases of PSH in Europe
The use cases of PSHs in Europe are categorized based on the primary objective of development
of the particular PSH [15]. Details are presented in table 4.2.
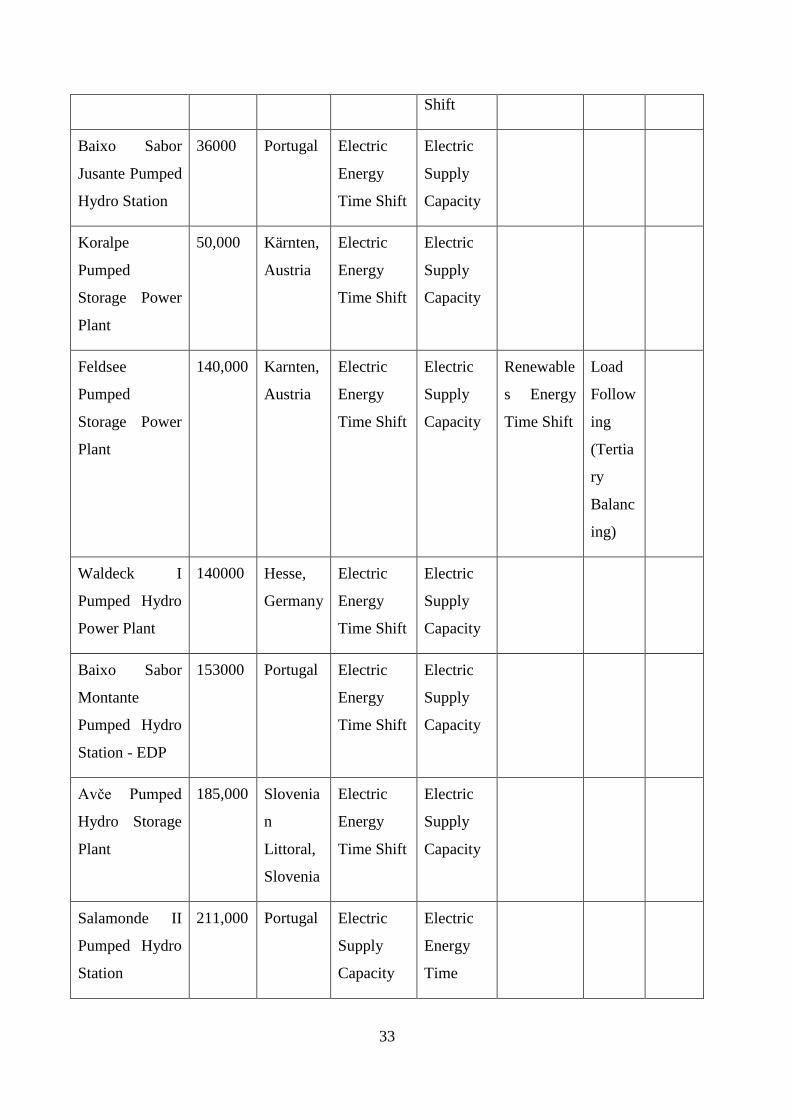
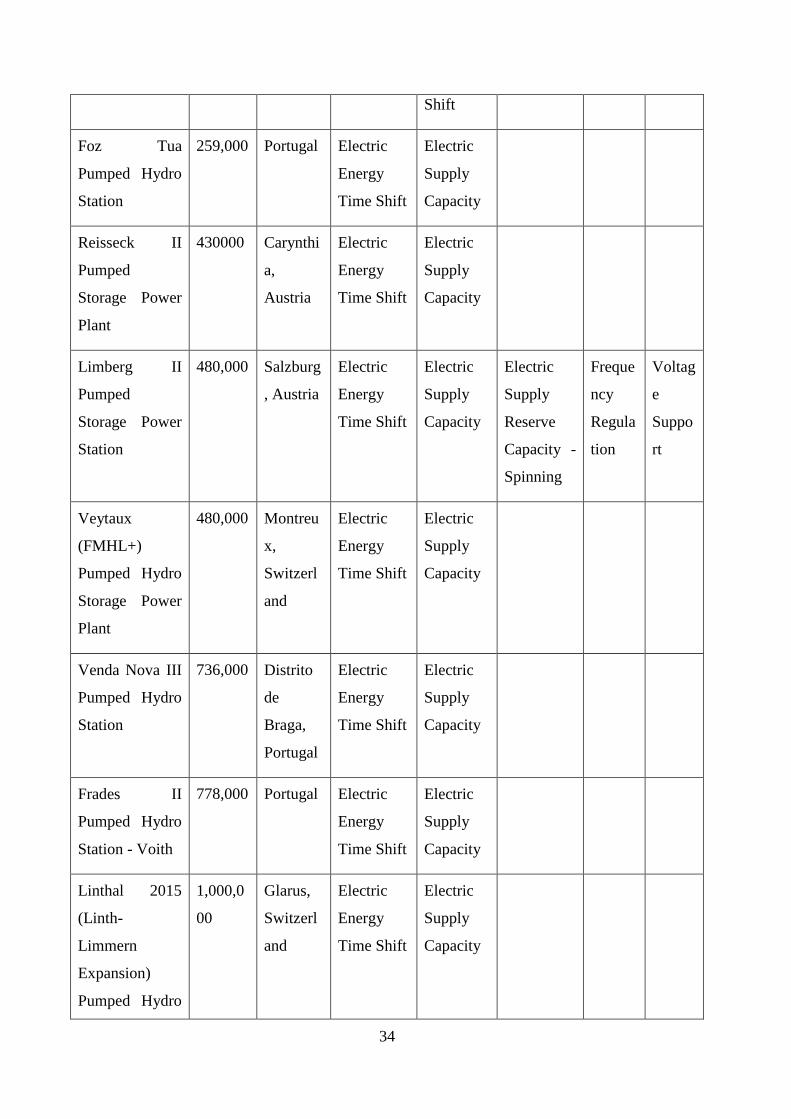
Table 4.2 Use Cases of Pumped Storage Hydroelectric Plants in Europe
PSH Project Rated
Power
(Kw)
Location Use Case 1 Use Case
2
Use Case 3 Use
Case 4
Use
Case 5
El Hierro
Hydro-Wind
Plant
11,300 Canary
Islands,
Spain
Renewable
s Capacity
Firming
Renewabl
es Energy
Time
Electric
Supply
Capacity
0
2
4
6
8
10
12
14
16
Use Case 1 Use Case 2 Use Case 3 Use Case 4 Use Case 5
No
. of
PSH
s
Use Cases of PSHs
Use Cases of 16 PSHs of Asia Electric Energy Time Shift
Electric Supply Capacity
Load Following (TertiaryBalancing)
Electric Supply ReserveCapacity - Spinning
Frequency Regulation
Voltage Support
Renewables Energy TimeShift
Black Start
33
Shift
Baixo Sabor
Jusante Pumped
Hydro Station
36000 Portugal Electric
Energy
Time Shift
Electric
Supply
Capacity
Koralpe
Pumped
Storage Power
Plant
50,000 Kärnten,
Austria
Electric
Energy
Time Shift
Electric
Supply
Capacity
Feldsee
Pumped
Storage Power
Plant
140,000 Karnten,
Austria
Electric
Energy
Time Shift
Electric
Supply
Capacity
Renewable
s Energy
Time Shift
Load
Follow
ing
(Tertia
ry
Balanc
ing)
Waldeck I
Pumped Hydro
Power Plant
140000 Hesse,
Germany
Electric
Energy
Time Shift
Electric
Supply
Capacity
Baixo Sabor
Montante
Pumped Hydro
Station - EDP
153000 Portugal Electric
Energy
Time Shift
Electric
Supply
Capacity
Avče Pumped
Hydro Storage
Plant
185,000 Slovenia
n
Littoral,
Slovenia
Electric
Energy
Time Shift
Electric
Supply
Capacity
Salamonde II
Pumped Hydro
Station
211,000 Portugal Electric
Supply
Capacity
Electric
Energy
Time
34
Shift
Foz Tua
Pumped Hydro
Station
259,000 Portugal Electric
Energy
Time Shift
Electric
Supply
Capacity
Reisseck II
Pumped
Storage Power
Plant
430000 Carynthi
a,
Austria
Electric
Energy
Time Shift
Electric
Supply
Capacity
Limberg II
Pumped
Storage Power
Station
480,000 Salzburg
, Austria
Electric
Energy
Time Shift
Electric
Supply
Capacity
Electric
Supply
Reserve
Capacity -
Spinning
Freque
ncy
Regula
tion
Voltag
e
Suppo
rt
Veytaux
(FMHL+)
Pumped Hydro
Storage Power
Plant
480,000 Montreu
x,
Switzerl
and
Electric
Energy
Time Shift
Electric
Supply
Capacity
Venda Nova III
Pumped Hydro
Station
736,000 Distrito
de
Braga,
Portugal
Electric
Energy
Time Shift
Electric
Supply
Capacity
Frades II
Pumped Hydro
Station - Voith
778,000 Portugal Electric
Energy
Time Shift
Electric
Supply
Capacity
Linthal 2015
(Linth-
Limmern
Expansion)
Pumped Hydro
1,000,0
00
Glarus,
Switzerl
and
Electric
Energy
Time Shift
Electric
Supply
Capacity

35
Storage Power
Plant
Aguayo II
Pumped
Storage Power
Plant
1,014,0
00
Cantabri
a, Spain
Electric
Energy
Time Shift
Electric
Supply
Capacity
Electric
Supply
Reserve
Capacity -
Spinning
Renew
ables
Energy
Time
Shift
La Muela
pumped-storage
plant
2,000,0
00
Valancia
, Spain
Renewable
s Capacity
Firming
The above information is graphically represented and analyzed to visualize the trend of use
cases of PSH in Europe in the figure 4-4:
Figure 4-4 Use Cases of Pumped Storage Hydroelectric Plants ( Commissioned in 2010-2017 ) in Europe
It is observed from the above information that out of seventeen PSHs in Europe commissioned
between 2010-2017, fourteen are primarily used for electric energy time shift. sixteen PSHs also
serve secondary purpose out of which fourteen PSHs are used for enhancing the electric supply
0
2
4
6
8
10
12
14
Use Case 1 Use Case 2 Use Case 3 Use Case 4 Use Case 5
No
. of
PSH
s
Use Cases of PSHs
Use Cases of 17 PSHs of EUROPE Electric Energy TimeShift
Electric Supply Capacity
Load Following(Tertiary Balancing)
Electric Supply ReserveCapacity - Spinning
Frequency Regulation
Voltage Support
Renewables EnergyTime Shift
Black Start
Renewables CapacityFirming

36
capacity. Furthermore, four Projects are used for tertiary purpose and out of them two serve the
purpose of electric supply reserve capacity in the grid. Similarly, three out of seventeen PSHs
serve fourth purpose and one out of seventeen serve even fifth purpose. Minority of projects
serve purpose of tertiary balancing, frequency regulation, renewable energy time shift, voltage
support, renewables capacity firming or black start.
From the analysis of PSHs developed in time period 2010-2017, it is seen that PSHs in Asia and
Europe are primarily constructed for time shifting of electric energy, which means, storing
energy in time of low demand and using it to produce energy during period of high demand. As
seen from figures 4-3 and 4-4, secondarily, PSH serve for electric supply capacity enhancement
in both continents. Electric supply reserve capacity-spinning seems to be the third purpose of
PSH development in Europe, while frequency regulation is the next purpose of PSH
development in Asia.
4.4 Ownership of PSHs in Europe and Asia
It is observed that the participation of private sector is not satisfactory in the construction of
PSH projects, which may be due to high level of technological complexities and financial risks
associated with the development of PSH projects [15]. As the history of PSH development is
quite older in case of Europe than in Asia, relatively more private sector participation is spotted
in Europe. In Asia, particularly China and developing countries like India, almost all the PSH
plants are owned and operated by Public sector [15].
4.5 Policies for development of PSHs in Europe and Asia
4.5.1 Policies undertaken in Europe
Policies undertaken by the respective government greatly influences the development of PSH.
As stated by Sufang Zhang [17] in Germany, restrictions on the sizes of reservoir were the most
obvious constraint for PSH preventing them from adequately supporting excessive renewable
generation over very long periods of time. In Croatia, every services provided by PSH to the
electricity systems were not adequately rewarded by the electricity market. Moreover, regulated
level of curtailment of excess renewable energy hindered operation of PSH [17]. PSH and other
generating devices with the same characteristics are treated in the same way as in the European
Network Code on requirements for grid connection [10]. It is clarified in the renewable energy
directive that electricity produced from PSH units should not be considered as renewable
energy. However, the directive has emphasized on the need to support the integration of energy
37
from renewable sources into the transmission and distribution grid [10]. Currently, No particular
investment framework exists for PSH. In most of the EU countries PSH pays double fees
(tariffs) for network access as PSH acts as an electricity consumer and electricity generator
based on its mode of operation. In the same time, some Transmission Service Operators (TSO)
charge nothing for the PSH’s role as electricity consumer and others recognize it as a renewable
based generator [10]. It is very essential for largely interconnected grids such as in EU countries,
to apply common rules regarding transmission access fees and use of system fees for electricity
storage systems to avoid situations like deployment of an electricity storage facility in one
country with favorable rules to provide services in next country with less favorable rules. No EU
legislation exists to regulate this issue and PSHs are treated as they fit in the local market
circumstances. Differences in policy across national markets create distortions impacting access
and related costs of energy from PSH in neighboring markets [10].
4.5.2 Policies undertaken in Asia
Except some developed countries, PSH is still a new concept to most of the countries in Asia.
Countries face a number of unwanted circumstances in planning, construction and operation of
PSH. In India, the deficit of off peak power for pumping in almost all regional grids highly
constrained PSH operation [17]. In China, most of the PSH plants before 2000 were constructed
under a generation-based tariff which was unattractive to investors. This tariff regime did not
fully reflect the value of PSH plants and hence the costs of PSH plants could not be fully
compensated. The structural reforms to electrical power sector of 2002 changed the context for
the construction, operation and tariff of PSH plants and as a result, in 2013, the cumulative
operation capacity in China reached 21.55 GW from 5.6 GW in 2000 [17]. Some particular
characteristics of PSH that can be used for financial sustaining are not yet paid enough attention
[17].
4.5.3 Recommendation for Policies Changes
It is often argued that it is uneconomic to build profitable PSH under the prevailing legal and
regulatory framework [10]. Moreover market uncertainties have negative impact on profitability
of PSH. A number of modifications need to be done in existing policies to address issues related
to financial sustainability of PSH project.
First and foremost, PSH systems should be paid for the ancillary services they provide such as
the ability to provide superior regulating reserves (fast response), load balancing ability and
voltage control in the grid. Expanding and inter linking the regional grid connections so as to
38
incorporate the advantages of PSH fully can be a second measure [17]. A next effective policy
change can be the establishment of time-of-day tariffs for generators in countries where they
lack this system [17]. Using time-of-day generator tariffs instead of uniform tariff irrespective of
time helps storage systems like PSH to operate in a more financially sustainable way. Pumped
Storage System supports environmental safeguard by reducing necessity of fuel-based
generators with high carbon emission during peak load time. Hence strict environmental
regulations need to be made flexible for construction of PSH taking into consideration, the
positive effects of clean energy in the environment produced from PSH.

39
5. Discussion
This thesis research highlights in the beginning, the increasing demand of energy in Europe. The
above research shows that the share of renewable energy in the energy market is increasing in
Europe. Based on the data for the time period 2004-2014 as presented in this research, after
hydro energy, wind energy is emerging as major renewable energy source in EU followed by
Solar energy. The energy harnessed from solar and wind turbines are highly intermittent and
there is no proper efficient bulk storage system to store such huge amount of energy to use
during period of high demand except pumped-hydro storage system. This has led to immediate
need to construct more pumped storage plants. This thesis has highlighted the targets set by
countries in Europe and Asia to increase capacity of pumped storage system.
As presented in Hydropower Status Report 2016, total of 50,949 MW of pumped storage
capacity has been added to European grids and many new are under construction. In the same
time, in Asia, 67,850 MW of pumped storage capacity has been added.
The thesis research has met its general objectives of understanding the status of energy
consumption and development of renewable energy sources in EU countries. It is found in
Hydropower Status Report, 2016 that total of 611,063 MW of hydro-energy has been installed
in Asia while total of 218,404 MW of hydro-energy has been installed in Europe in same time.
Moreover after a thorough research it is found that a total of 69, 850 MW of pumped storage
capacity has been added to grids in Asia and 50,949 MW of pumped storage capacity has been
added in Europe. Even though the overall PSH capacity in Asia seems to be more, this is mostly
concentrated in few countries such as Japan, China, South Korea, India and Russia. Hence it
does not give the true status of pumped storage development of all countries in Asia.
In order to address the specific objective of thesis research, the characteristics of pumped
storage hydropower commissioned in the present decade 2010-2017 in Europe and Asia have
been compared. It is observed that the average annual addition of PSH installed capacity is
slightly more in case of Asia than in Europe in the period 2010-2017. The increased imbalance
in power grids, especially in China, and the policies undertaken by China for PSH development
greatly influenced addition of PSH in Asia. In the period 2010-2017 total of 16,752 MW of PSH
was added in Asia and again more than half of it was installed in China alone. Similarly in the
same period, 8103.3 MW of PSH capacity was added. In case of Europe, the construction of
PSH projects is not concentrated in few countries unlike China.
40
Moreover, the comparison of unit cost of PSH development in Europe and Asia does not give a
clear distinction, yet, in average, the cost of PSH development seems slightly lower in Europe.
Cost of some of the projects considered in Asia are found exceptionally high which may be due
to topographical, geological or location factors but the investigation of the reason for high cost
is not carried out in this research work.
In most cases, primary objective of PSH development is electric energy time shift in case of
Europe and Asia. Electric Supply Capacity remains the major secondary application. It is
observed that frequency regulation of the power system is next major application for Asian
PSHs while PSHs in Europe serve third purpose of electric supply reserve capacity. The
multiple functions are solely dependent on the requirements of the grid of the particular place
and the technology used by the PSH plant. Only the general trend of multiple use cases have
been analyzed in this research.
The major reason for state-ownership of PSHs in most countries in Asia may be the inadequacy
in policies for profitable operation of PSH. While in case of European countries, since the
history of PSH development is longer and a lot has been researched and formulated to ensure
profitability, significant participation of private sector is seen.
As the next specific objective of the research, the researcher has investigated on the prevailing
policies related to PSH in some of the countries in Europe and Asia. It is found that the
prevailing policies in Europe are not enough in most of the countries to ensure profitable
operation of PSH. In Europe, market specific policies regarding PSH have made investment
risky. No clear distinction between PSH and other renewable energy systems is the next
hindrance. It is found that in most of the Asian countries PSH is still a new concept and hence
no specific policies are found for PSH development. In China, policies were changed a number
of times to ensure profitable operation of PSH. A number of recommendations as described
earlier in this research are necessary to help development of PSH.

41
6. Conclusions
The purpose of this thesis is to research on the status of energy consumption, development of
renewable energy sources, development of hydropower and pumped storage hydropower in
Europe and Asia. Specific objective include in-depth study of PSH, comparative study of PSH
in Europe and Asia and analysis of policies undertaken for PSH development. The objectives of
this research work are achieved through a series of literature reviews and investigations.
At first the thesis highlights the status of energy consumption and development of renewable
sources in Europe. At second stage, status of hydropower and pumped storage hydropower in
Europe and Asia are compared. Furthermore, for detailed comparison of PSH in Europe and
Asia, seventeen PSHs from Europe and sixteen PSHs from Asia commissioned in the present
decade (2010-2017) are taken. Comparison is made in a number of categories and differences
are highlighted. Furthermore policies in European and Asian countries regarding PSH
development are discussed. Thus, the thesis has been successful in researching its pre-defined
objectives.

42
7. Further Research
Further research can be done taking into consideration a large number of PSHs that were in
operation before the period mentioned in the thesis and under construction or scheduled to be
construction in near future which will provide more clear picture in the differences in the overall
trend of PSH development in Europe and Asia. Moreover, Further research work can be on the
PSH projects that were shut down as a result of existing policies and their inabilities to address
issues related to PSH. Similarly, in-depth research can be conducted on the causes of variation
in unit cost of construction in different PSH of similar capacity in Europe and Asia.
43
8. Bibliography
[1] www.Wikipedia.org. [Online]. https://en.wikipedia.org/wiki/Pumped-
storage_hydroelectricity
[2] I. Perez-Diaz Juan, M. Chazarra, J. Garcia-Gonzalez, G. Cavazzini, and A. Stoppato,
"Trends and challenges in the operation of pumped-storage hydropower plants," Elsevier,
2015.
[3] ec.europa.eu. [Online]. https://ec.europa.eu/energy/en/topics/renewable-energy/renewable-
energy-directive
[4] ec.europa.eu. [Online]. http://ec.europa.eu/eurostat/statistics-
explained/index.php?title=File:Final_energy_consumption,_1990%E2%80%932014_(milli
on_tonnes_of_oil_equivalent)_YB16-fr.png&oldid=321959
[5] ec.europa.eu. [Online]. http://ec.europa.eu/eurostat/statistics-
explained/index.php/File:RENEWABLES-EU28-PRIMARY-PRODUCTION-2014.png
[6] (2017, May) ec.europa.eu. [Online]. http://ec.europa.eu/eurostat/statistics-
explained/index.php/Renewable_energy_statistics
[7] (2017, May) ec.europa.eu. [Online]. http://ec.europa.eu/eurostat/statistics-
explained/index.php/Energy_from_renewable_sources
[8] Eivind Solvang, "Norwegian hydropower for large-scale electricity balancing needs," 2014.
[9] "Hydropower Status Report," International Hydropower Association, London, 2016.
[10] Istvan Taczi, "Pumped Storage Hydroelectric Power Plants: Issues and Applications," in
Energy Regulators Regional Association, 2016.
[11] Punys Petras, Baublys Raimundas, Kasiulis Egidiijus, Vaisvila Andrius , and Pelikan
Bernhard , "Assessment of renewable electricity generation by pumped storage power
plants in EU Member States," Science Direct, 2013.
[12] (2017, May) www.wikipedia.org. [Online]. https://en.wikipedia.org/wiki/List_of_pumped-
44
storage_hydroelectric_power_stations
[13] (2017, May) www.wikipedia.org. [Online]. https://en.wikipedia.org/wiki/List_of_pumped-
storage_hydroelectric_power_stations
[14] Kong Yigang et al., "Pumped storage power stations in China: The past, the present, and
the future," Science Direct.
[15] (2017, May) www.energystorageexchange.org. [Online].
http://www.energystorageexchange.org/projects/advanced_search
[16] "Pumped Storage and Potential Hydropower from Conduits," United States Department of
Energy, Washington, 2015.
[17] Sufang Zhang, Philip Andrews Speed, and Pradeep Parera, "Institutional and pricing
reforms for pumped storage hydroelectricity in China: supporting the energy transition".
[18] www.hydropower.org. [Online].
https://www.hydropower.org/sites/default/files/publications-
docs/2016%20Hydropower%20Status%20Report_1.pdf
[19] T Hino and A Lejeune, Pumped Storage Hydropower Developments.: Elsevier Ltd., 2012.
[20] (2017, May) www.eia.gov. [Online].
https://www.eia.gov/todayinenergy/detail.php?id=11991
[21] (2017, May) www.eia.gov. [Online].
https://www.eia.gov/todayinenergy/detail.php?id=6350
[22] (2017, May) www.energystorage.org. [Online]. http://energystorage.org/energy-
storage/technologies/pumped-hydroelectric-storage