Embed Size (px)
Citation preview

International Journal of Marketing Studies; Vol. 7, No. 4; 2015 ISSN 1918-719X E-ISSN 1918-7203
Published by Canadian Center of Science and Education
24
A Comparison of Willingness-To-Pay Measures Using Integrated Hierarchical Survey with the Kano Model in Three Regions
Jong Seok Kim1
1 Technology Strategy Team, Mobile Communication Business, Samsung Electronics, Korea Correspondence: Jong Seok Kim Maetan dong 129, Samsung-ro Yeongtong-gu, Suwon-si, Gyeonggi-do 443-742, Korea. Tel: 82-2-010-3490-2679. E-mail: [email protected]
Received: May 25, 2015 Accepted: June 20, 2015 Online Published: July 30, 2015
doi:10.5539/ijms.v7n4p24 URL: http://dx.doi.org/10.5539/ijms.v7n4p24
Abstract What is best way to conduct conjoint analysis when there is a large number of attributes such as mobile phone? Although there is little empirical evidence that directly bears on this question, it is widely believed that the predictive accuracy of full-profile methods degrades as the number of attributes increases beyond ten. In order to minimize the complication of multi-attributes and reduce the consumers’ choice task burden, the author proposes an integrated hierarchical survey design (IHSD) with the Kano model.
The author compared the utility of mobile phone’s attributes for each market and for customer segment by analyzing empirical data which wear obtained from 6 Middle East & Africa countries, 5 Asia Pacific countries and 3 European countries. Based on an IHSD of 10,200 respondents, overall, Brand, Camera, Memory and Mobile-tv play a vital role in all countries. In contrast, WiFi, File-editor, MMS, LCD size, and Phone-type are displayed as the least important attribute.
The results of this study were successfully implemented for product planning, product development, and marketing strategy in terms of price setting, features prioritizing, and optimal designing for new products in the mobile phone company.
Keywords: integrated hierarchical survey design (IHSD), Kano model willingness-to-pay (WTP), choice-based conjoint analysis (CBC), customer segmentation 1. Introduction The functions and designs of mobile phones have rapidly evolved since they were first introduced into the markets of emerging and mature countries. Product features are the biggest competitive tool for differentiating from competitor’s products. Being the first producer to introduce a needed and valued new feature is one of the most effective ways to compete (Sata, 2013). Mobile phone users want to have many and advanced features such as internet and radio on their phone. This will enable them to use their phones for varieties of purposes, not just making and receiving calls. Manufacturers and marketers of mobile phone should also produce and market modern technology phones with features that will meet the taste of consumers (Dziwornu, 2013). Global smart phone markets are forecasted to grow by 25% (IDC, 2014). As mobile phones become more commoditized and as consumers become more informed about various product features and contents, marketers wish to measure consumers’ multi-attribute preferences and the willingness to pay (Lancaster, 1971) for mobile phones may vary among different customer segments within a country. The features incorporated in a mobile hand set are the most important factor which is considered by the consumers while purchasing the mobile phone. However, all features of mobile phones are not equally important (Sata, 2013). Conjoint analysis has been successfully applied to several marketing decisions to optimally design new mobile phones, price new products (Gustafsson et al., 2000) and prioritize features across segments in studies by Carroll and Green (1995), Green and Srinivasan (1978, 1990), Gustafsson et al. (2000), Louviere (1994) and Rao and Hauser (2004). However, a number of problems arose when conventional conjoint analysis was used to handle a large number (ten or more) of product attributes (Netzer & Srinivasan, 2011). Toubia, Simester, Hauser, and Dahan (2003) have developed an adaptive conjoint analysis method for dealing with a large number of attributes that reduces respondent burden while simultaneously improving accuracy.

www.ccsenet.org/ijms International Journal of Marketing Studies Vol. 7, No. 4; 2015
25
This technique was invented by the "academic" practitioner Richard Johnson at Sawtooth Software (Huber, 2005) in the early 1980's. The technique can deal with up to thirty attributes. In addition, there is still a lot of development with respect to improving this technique, both in terms of reducing the burden for the participant (Netzer & Srinivasan, 2009) and in terms of simplifying complicating choice process in decision making (Schrift, Netzer, & Kivetz, 2011). The first issue encountered is respondent fatigue; as the number of attributes grows, the number of full profile judgments that are required grows exponentially. The standard number of profiles used is 30 (e.g., Green & Srinivasan, 1990; Greenberg, 1986; Johnson, 1986), although the maximum number of profiles to which an individual can reliably respond has not been definitively determined (Vithala, 2008). The second issue encountered when using conventional conjoint analysis is limitation in short-term memory of the respondents (Madeleine et al., 1999). While the basic concept of conjoint analysis is both powerful and simple, the burden placed on respondents to complete tasks and make choices causes major difficulties with the analysis (Netzer & Srinivasan, 2007). Wind et al. (1989) studied the design process for an optimal Courtyard by Marriott hotel. The study used fifty attributes that described hotel features and services in seven sets (called “facets”) of attributes based on a hybrid conjoint analysis task (Green, 1984) and a price elasticity task using the ELASTICON model (Mahajan et al., 1982). The hybrid conjoint analysis (Wind et al., 1989) includes a number of untested assumptions that require more theoretical analysis and practical research. Hybrid models are continually improved as mobile phone industry practitioners continue to deal with the measurement and parameter estimation problems associated with the large numbers of conjoint attributes and levels (Green & Krierer, 1996). In a high-tech industry such as the mobile phone, there are numerous realistic impediments in applying a hybrid method to the research procedure, because a survey on mobile phone may require an extremely multi-dimensional profile design and very lengthy interviews (more than 60 minutes) regarding unfamiliar mobile phone features. Consequently, hybrid method is limited in its ability to handle complex problems with a large number of attributes and attribute levels.
In response to the limitations noted above, this study proposed an integrated hierarchical survey to be used with the Kano model to potentially facilitate high-dimensional conjoint analysis for mobile phones. In addition, in order to find different characteristics among regions, countries, and customer segments, the proposed method tries to compare the utility of mobile phone attributes by analyzing empirical data, which are obtained from 14 countries from 5 Asia-Pacific countries (Malaysia, Thailand, Vietnam, Indonesia, and Philippines), 6 Middle-East & Africa countries (Turkey, Nigeria, Pakistan, Egypt, Saudi Arabia, and South Africa) and 3 European countries (UK, France, and Germany).
Segmentation is the analysis process that categorizes consumers into groups with similar characteristics, which derives the final segments. The objective of segmentation is to differentiate the strategy for each target segment from that of competitors, because the characteristics of each segment may differ from countries and regions. Ultimately, it is to maximize the sales volume and profit through price differentiation by segment. The main purpose of this research is to help marketers give guideline for product planning, product development, and pricing strategy based on each customer region’s willingness-to-pay (mobile feature perceived value) in the mobile market where products become more and more complex and consumers have more access to vast amount of information. The results of this study were successfully implemented for product planning, product development and marketing strategy by a mobile phone company through utilization of the results to set prices, prioritize features and provide guideline for target market.
This paper is organized as follows. In section 2, the author proposes an integrated hierarchical survey using the Kano model that potentially facilitates conjoint analysis and provides guideline for selecting target markets. In section 3, the proposed approach is applied to a mature and an emerging market in order to estimate its’ usefulness for consumers and the feature prices for mobile phones across the target markets. Lastly, the results and managerial implications are discussed.
2. Proposed Methodology
In this section, the author proposes an integrated hierarchical survey for large-scale conjoint analysis which, along with the Kano model, facilitates the accumulation of the results of several surveys divided by the functional characteristics of mobile phone features. The process is depicted in Figure 1.

www.ccsenet.org/ijms International Journal of Marketing Studies Vol. 7, No. 4; 2015
26
Step1. List all possible features for current and new products
↓Step2. Divide the features into three groups (must-be, one- dimensional, and
attractive ) by functional characteristics using the Kano Model ↓
Step3. Do fractional factorial design for “must-be” CBC (choice-based conjoint) including two factors; one of which asks whether customers need ‘one-dimensional’ feature or not and the other being ‘attractive’ feature groups with “Must-be” attributes.
↓ Step4. Conduct conjoint analysis individually for each group
↓ Step5. “Must-be” CBC design is linked with “one-dimensional” and
“attractive” CBC design for integrated hierarchical survey ↓
Step6. Estimate the utilities of each level of each feature in the context of CBC.
↓ Step7. Calculate Importance and WTP for a country as well as segment
obtained by factor & cluster analysis ↓
Step8. Suggest managerial implications
Figure 1. Proposed methodology framework
The first step was to list all of the possible features with the product planning team, product development team and market research specialists. The second step divided the selected features for designing a mobile phone into subgroups based on their functional characteristics using the Kano model. The method for classifying features was determined using Kano questionnaire. The third step incorporated a fractional factorial design for the “must-be” choice-based conjoint (CBC) (Oppewal et al., 1994) which includes two factors: whether customers required the “one-dimensional” feature or the “attractive” feature, along with the “must-be” attributes. The consumers who selected the “must-be” features could choose both the “one-dimensional” feature and the “attractive” feature groups or one of the two feature groups in no particular order. Fractional factorial design was applied to both the “one-dimensional” features and the “attractive” features for individual CBCs. Random sequences of the combinations of attribute levels were generated for each of the three types of choice-based conjoint analysis (“must-be,” “one-dimensional” and “attractive”). At the same time, the fourth step conducted a survey of the individual groups for the conjoint analysis on the functional characteristics of a mobile phone. The analysis of the accumulated data obtained from all of the feature groups was completed using conditional logit models as part of the fifth step. In addition, the “must-be” CBC design was linked with the “one-dimensional” and “attractive” CBC designs. The sixth step was to analyze the accumulated results obtained from all of the feature groups and estimate the usefulness of each feature’s level in the context of the CBC. Based on the results of the sixth step, the importance and WTP of each attribute were estimated in step 7. Finally in step 8, managerial implications were suggested for an action plan. The details of some of the techniques including the Kano model, integrated survey by features, the estimation method and WTP are explained in the following paragraphs. 2.1 The Kano Model
When planning a product or service, one makes a list of potential customer needs that the product or service should perhaps try to satisfy. Current and potential customers are one good source to get ideas for what should be on the list of potential customer requirements. Many methods are available for investigating the characteristics of customer requirements. For instance, one can ask customers to rank them in order. The method the author discusses here is based on Kano’s approach (Kano, 1984).
The Kano model is a quality measurement tool which is used to determine the overall importance of individual requirements (Kano, 1984). In this study, the Kano analysis was used as the screening process for the factors used for conjoint analysis by categorizing the product features according to customer expectations (Clausing,

www.ccsen
1994). Thiand are dif
As shown “indifferenthe custom“reverse” study (Ber
Table 1. K
Cu
Funque
First, as dewhen the phow functcustomer tsatisfactionone-dimensatisfactionthe less saFor exampattractive cnot dissatimulti-phonmore satis
2.2 Integra
In this stuorder to ov
Subjects wwhen conf
First, the aof defininattributes
net.org/ijms
is is quite useffferent for diff
in Table1 belont,” and “revermer was indiffgroup. Thus, o
rger et al., 1993
Kano evaluation
ustomer Requireme
nctional estion
1.2.3.4.5.
epicted in Figuproduct is lesstional the prodto be dissatisfin. Good cam
nsional featurn was simply p
atisfied the cusple, the more mcurve indicateisfied when thnebook cannotfied when the
ated Hierarchi
udy, an integravercome the pr
were able to cofronted with a
author determinng must-be or (must-be or a
I
ful when the cferent populatio
ow, five grouprse”). Howeveferent and unimonly three gro3).
n table (adapte
ents
I like I expect I’m neutral I can live it I dislike
ure 2 below, ths functional, bduct becomes. ied; having a gmera functiones, traditionalproportional to
stomers are, anmobile phone s areas where
he product is let be automaticmobile phone
ical Survey De
ated hierarchicroblems caused
ognitively groucomplex decis
ned the methoattractive sho
attractive) and
International Jou
customer needons.
ps of attributes er, the “indiffermportant, or uoups (“must-be
ed from Berger
Dysfunctional
1 I like
2I e
Q AR IR IR IR R
he must-be curbut where the
For instance, good camera f
n is expectedl ideas abouo how functionnd the more fu
features are ethe customer
ess functionalcally saved wh
has this featur
Figure
esign (IHSD)
cal survey desd by high-dim
up the decisiosion involving
ods for choice eould be consid(2) design re
urnal of Marketi
27
ds are not all th
were identifierent” and “rev
unsatisfied to te”, “one-dimen
r et al. 1993)
question
expect 3I’m
AI I I R
rve indicates acustomer’s sahaving a poo
function, howed, and therefut quality havnal the produc
unctional the pembedded, the is more satisf. For instance,
hen the mobilere.
2. Kano mode
sign (IHSD) wmensional attrib
on attributes thnumerous elem
experiments bdered in the lquirements im
ing Studies
he same, do n
ed (“must-be,”verse” groups wthe mobile phonsional” and “
m neutral 4I ca
AIIIR
aspects where atisfaction never camera funcever, does not fore it is a ve sometimesct was that is, troduct is, the mmore the cus
fied when the p, a mobile cus
e phone is turn
el
was proposed butes in the typ
hat influence thments.
ased on IHSDlight of (1) h
mposed by var
ot have all the
” “one-dimensiwere not used one features o“attractive”) w
an live it
the customer ier rises above
ction in a mobraise the levemust-be requ
s been assumthe less functiomore satisfiedtomer will be product is morstomer may noned off, but the
for use with tpical conjoint a
heir choice int
with the Kanohow respondenrious choice sc
Vol. 7, No. 4;
e same import
ional,” “attractin this study
of “indifferent”were utilized in
5 I dislike
O M M M Q
is more dissatie neutral, no mbile phone caul of the customuirement. Sec
med that custonal the produ
d the customerssatisfied. Last
re functional bot be dissatisfie customer ma
the Kano modanalysis.
to coherent su
o model. The rnts choose prochemes. Choic
2015
ance,
tive,” since ” and n this
isfied matter
ses a mer’s cond, omer
uct is, s are. t, the but is ied if ay be
del in
ubsets
result oduct ce of

www.ccsenet.org/ijms International Journal of Marketing Studies Vol. 7, No. 4; 2015
28
attributes into subset (must-be or attractive) can be based on consumer’s choice or the importance on product attributes without any order. The author assumed that there is a total of N attributes that are divided into three attribute groups by the Kano model and are denoted as “must-be” (i=1,...,I), “one-dimensional” (q=1,...,Q) and “attractive” (r=1,…,R). The author then added two binary variables into the “must-be” attribute group. One of the binary variables linked the “must-be” group with the “attractive” group, and the other variable linked the “must-be” group with the “one-dimensional” group. As a result, the extended “must-be” attribute group consisted of I+2 attributes (i=1,…, I, I+1, I+2) including the two binary variables. These two binary variables were used to determine if any of the attributes in the “one-dimensional” or the “attractive” groups need to be added to the must-be” attribute group instead. What if more than one of the attributes in the “one-dimensional” group should be moved to the “must-be” attribute group. If a customer was interested in “attractive” attributes being added to the “must-be” attributes, then s/he chose the profile which had the “attractive” group within the “must-be” attribute group. The procedure was the same for the “one-dimensional” group. Four different cases of “must-be” profiles could be generated using these two binary variables: 1) including both “one-dimensional” and “attractive,” 2) including “one-dimensional” and excluding “attractive,” 3) excluding “one-dimensional” and including “attractive,” and 4) excluding both of them. For example, the consumers who selected the “must-be” features could choose both the “one-dimensional” feature and the “attractive” feature groups or just one of the two feature groups. The hierarchy of the choice tasks was formed in this survey. Therefore, consumers could choose a set of attribute profiles which consisted of different combinations of “must-be,” “one-dimensional,” and “attractive” profiles. These profiles were typically constructed according to the fractional factorial design (typically an orthogonal fraction of the full factorial design).
This approach is based on the assumption that an individual’s preference formation or choice process for complex problems (problems involving many attributes) can be represented by a hierarchical process. Individuals are assumed to form preferences first for higher-order constructs (for example, must-be features) and then trade-off their preference for such higher-order constructs (for example, one-dimensional and attractive features) to arrive at some overall preference or choice. It is further assumed that individuals first form impressions for each of the decision constructs separately, and then integrate these impressions into overall preference values for the decision alternatives. In terms of research design, the approach thus involves (a) constructing separate experimental tasks for each higher-order constructs separately as one would typically do for simple preference tasks and then (b) developing a separate overall task in which respondents are requested to express their overall preference or arrive at some choice given their subjective preference ratings of the higher-order constructs used in step (a). The respondents are asked to rate which grouping is preferred by entering a rating score indicating the desired level of each attribute in terms of importance on a 1 to 4 equal-interval rating scale where 4 denotes the highest importance. The author assigned more than two people to complete randomly selected pair-wise choice set that satisfied an experimental design. An experimental task (Hamid et al., 2014) should be constructed for each person and for each individual preference should be analyzed separately. In addition, it is assumed that each person arrives at a joint choice by trading off his or her individual preference among “must-be”, “one-dimensional”, and “attractive”. This joint process can be analyzed by creating an experimental task requesting each person to choose jointly among “must-be’, “one-dimensional”, and “attractive” that differs in terms of each person’s preference of high-order constructs used in the experiment. After the CBC surveys for the “must-be,” “one-dimensional,” and “attractive” groups were completed independently, the results of all surveys were aggregated into one data set. The profile evaluations (Must-be, one-dimensional, attractive features) can be regarded as overall evaluations, thus at the level of the complete decision alternative, because all the decision constructs are described in the profiles, either as combinations of attribute levels or as summarizing ratings of constructs. Consequently, all separate subexperiments can be concatenated to estimate a single model. In addition, the need for a bridging experiment no long exists, because the profiles describe the complete choice alternative. The resulting profiles consist of a mix of attribute level descriptions and the numerical ratings of decision constructs which reduces the probability that respondents adopt simplifying response heuristics, like averaging. The IHSD reduced the burden of the respondent’s choice task by categorizing the attributes into three groups (“must-be,” “one-dimensional,” and “attractive”). This method also overcame the limitations of generating a comprehensive outcome for the CBC survey by integrating the results of the three groups. An important distinction of this method was that the consumer continuously chose additional profiles as he or she felt the need, instead of sequentially choosing “one-dimensional” and “attractive” CBC profiles. However, if the profile he or she wanted most was in either the “one-dimensional” or “attractive” CBC profile after a consumer chose the “must-be” CBC profile, then the desired features from the “must-be”, “one-dimensional” and “attractive” CBC profiles were “matched,” leading directly to the intention to purchase, as depicted in Figure 3. On the other hand, if the desired profile was not either the “one-dimensional” or

www.ccsen
“attractivewere aggreprofiles we
Thus, the Informationumber ofwas define
2.3 Estima
The indivi
behavior.
model cou
logit mode
that an ind
the alterna
indifferent
choice-bas
expressed
where xt is
ii xcU =)(
net.org/ijms
e” CBC profileegated into theere linked.
IHSD approaon overload waf profiles that ed as shown in
Figure 3. Inte
ation of the CB
idual who is p
Since the resp
uld be used to e
represented
els are typicall
dividual will c
ative and is d
t curves corre
sed model, the
using the follo
s the vector of
β
I
e, then the proe final data set
ach reduces boas reduced by needed to be
n Figure 3.
egrated hierarc
BC and Willing
presented with
ponses provide
estimate the pa
d the utility fo
y used to analy
choose one of t
divided by the
spond to the
e probability th
owing equation
the alternative
International Jou
ofiles were “nt. Figure 3 dep
oth the informgrouping the aevaluated was
chical survey d
gness to Pay (W
h the set of a
ed in the CBC
arameters of th
or the alternativ
yze discretely
two alternativ
e sum of all o
maximum atta
hat an individu
n. This is expla
e attributes and
( *icp
urnal of Marketi
29
not matched” picts how the “
mation overloadattributes. Thes smaller. The
design for linka
WTP)
alternative is a
C model in thi
he features in t
ve and was
chosen data. T
es, , from th
of the expone
ainable utility
ual will choose
ained through
d β is the vecto
ic
ic
exp
exp()
21i
ixC
=Σ=
ing Studies
and were dele“must-be”, “on
d problem ande respondents’e integrated hi
age between g
also the indivi
is study were
the context of
s a linear funct
This type of m
he choice set,
ential utilities.
for alt
e any specific a
the inclusion o
or of the unkno
)( *ixU
)(
)*
ββ
i
i
x
eted. The matcne-dimensiona
d the burden burden was reerarchical surv
roups of requi
idual who is s
binary, a bina
f the CBC. We
tion of the attr
model assumes
C, is exponent
This indicate
ternative.In
alternative f
of equation (1)
own parameter
ic
*ic
Vol. 7, No. 4;
ched CBC proal,” and “attrac
on the responeduced becausvey design (IH
rements
studying cons
ary discrete ch
have assumed
ributes. Condit
that the probab
tial to the utili
es the point w
the context o
from two choic
).
rs.
2015
ofiles ctive”
ndent. se the HSD)
umer
hoice
d that
ional
bility
ity of
where
f the
ces is
(1)

www.ccsenet.org/ijms International Journal of Marketing Studies Vol. 7, No. 4; 2015
30
The Breslow (partial) likelihood is generally used to estimate the parameters. The estimated values of the parameters for individual attributes can be considered as the utility values of the attributes. After determining the utility values of individual attributes, the price for individual levels of attributes was determined using the Willingness-to-pay (WTP) concept (Lancaster, 1971). Willingness To Pay (WTP) can be defined as the economic value that a consumer is willing to sacrifice in order to acquire a certain utility (Shogren et al., 1994). Another commonly used definition of WTP is that it is the maximum amount of money that a customer is willing to spend for a product or service (Cameron & James, 1987). The measurement of WTP is an important analysis for companies that want to offer their products. It is important how Pricing, importance of attributes, and consumer membership to a specific segment are influencing the WTP to obtain competitive strategies. When measuring WTP, it is important to collect data in a setting that is as realistic as possible (Miller et al., 2011). The marginal rate of substitution between the two attributes m and n is given by
(2)
One of the product attributes may be the price ( ). Designating the n-th attribute as the price, Equation 2 calculates the WTP for attribute m.
3. Empirical Study
The proposed integrated hierarchical survey design in 5 Asia-Pacific countries (Malaysia, Thailand, Vietnam, Indonesia, and Philippines), 6 Middle-East & Africa countries (Turkey, Nigeria, Pakistan, Egypt, Saudi Arabia, and South Africa) and 3 European countries (UK, France, and Germany) for designing an optimal mobile phone across multiple segments is discussed in this section.
As a result of discussions with the product planning team, product development team, and market researchers, one hundred features were identified as important features in current and future products. By utilizing the Kano questionnaire, thirty-six different attributes were derived from the total 100 attributes, and 98 levels were derived from the original 500. 3.1 Data and Survey
The author surveyed on one Kano analysis and on one conjoint analysis sequentially. The first survey (Kano analysis) was conducted in the middle of 2010, and the second survey (conjoint analysis), designed based on the results of the first survey, was conducted at the end of 2010. For the Kano analysis, 800 respondents with sufficient relevant purchasing power among three regions were invited to participate. Their purchasing power was evaluated by their level of income, the amount of high/mid/low-end products purchased, their depth of understanding of mobile phones, their occupation, their educational level, etc. Totally, 8800 respondents in 6 Middle-East countries, 5 Asia-Pacific countries, and 2400 respondents in 3 European countries. The survey was conducted to sample ranging from 18 to 54 years old. Examples of the online survey forms are given in Appendices B, C, D, E, F, and G. The surveys were administrated in 2010 by the leading research agency (TNS) and were completed after each feature was fully explained to the respondents in order to ensure that they were knowledgeable about the product.
Table 2. Three attribute groups distinguished based on the KANO model
Point of view Attribute
Must be Brand, Type, Thickness, LCD size, LCD Color, MP3 Player, FM Radio, Bluetooth, File_editer, File_viewer, Price, One dimension, Attractive
One dimensional Open OS, Camera Resolution, Auto Focus, Memory Size, External Slot, MMS, HSDPA, HSUPA, Full brower, External Music Key
Attractive Mobile TV, FM_Transmitter, Touch Screen, Push-to-talk, VoIP, Push E-mail, WiFi, GPS, SNS(Cyworld), Mobile Blog, Qwerty, Music_downlad
Using the questionnaire prepared for the Kano analysis, which is presented in Appendix A, fourteen attributes were selected as features for the “must-be” requirements. Ten attributes were selected for the “one-dimensional” requirements and twelve attributes were selected for the “attractive” requirements. “Indifferent” and “reverse” requirements included multi-phonebook, SOS, messaging, TV-out and team manager, etc. Finally, thirty-six attributes were selected and their levels are described in Appendices E, F, and G. These were also designed using the Kano model along with the knowledge obtained from in-depth consumer interviews and internal corporate expertise. Based on the results of the Kano analysis, four focus group discussions (FGD) for conjoint analysis
ini
mii
xU
xUMWTP
∂∂∂∂−=
/
/
ip

www.ccsenet.org/ijms International Journal of Marketing Studies Vol. 7, No. 4; 2015
31
were conducted in three different regions. The goal of the focus research was to obtain an in-depth understanding of issues impinging on consumer spending behavior, including the purchase decision process, consumer adoption habits, mobile phone feature perception, and factors affecting willingness-to-pay. In addition, the groups were used to willingness-to-pay methodologies used during later research phases and gained insight into the meaning of the quantitative results. Each focus group consisted of 8-10 residential customers drawn from demographically diverse households. Moderators provided feature descriptions, a structured questionnaire, and fractional factorial design (typically an orthogonal fraction of the full factorial deign) of the experimental conjoint cards to the consumers. A one-on-one direct interview method was used by well-trained interview specialists in order to improve the reliability of the survey.
Based on the thirty-six attributes selected using the Kano analysis, the author conducted a large-scale consumer
study in order to design an “optimal” mobile phone from three different regions. CBC with an integrated
hierarchical survey of 10,200 respondents in three regions was conducted using the same attributes as those in
the Kano analysis. The choice set for each CBC was then selected at random. Although the number of attributes
was reduced by the Kano model, there were still approximately 3 million profiles created by the “must-be”
requirements , 7,100 profiles created by the “one dimensional” requirements
and 4,000 profiles created by the “attractive” requirements when the integrated
hierarchical survey method was not used. The author drew 48 profiles for the “must-be”
requirements, 32 profiles for the “one-dimensional” requirements, and 16 profiles for the
“attractive” requirements by using fractional factorial design for the experiments. Those profiles that deemed not
attainable in internal discussion were removed. The final numbers of profiles for the “must-be,”
“one-dimensional” and “attractive” requirements were 36, 28, and 16, respectively. Since random sequences
were generated for the conjoint profile in each of the three stages (“must-be,” “one-dimensional,” and
“attractive”), a pair of choice cards was created for the CBC survey. Obviously, the number of profiles is much
larger if mobile phones are described in terms of say 10 or more attributes. Although we reduced the number of
profiles for each CBC by fractional factorial design (FFD), it was very difficult to have one person respond to all
of the questions. In addition, multiple pair-wise comparison requirements could interfere with the accuracy of the
survey. One way of avoiding this problem for each respondent is giving a limited number of profiles for evaluation rather than administering all profiles as done in a full profile approach. In the case of the “must-be” requirements, a comparison sequence was accomplished by having three people compare six pairs of cards out of eighteen pairs of cards. In the case of the “one-dimensional” requirements, two people compared seven pairs of cards out of fourteen pairs of cards. In the case of the “attractive” requirements, all of the respondents compared eight pairs of cards. In this study, the number of choice cards for each respondent was 18, 14 and 8 for the 36 “must-be,” 28 “one-dimensional” and 16 “attractive” profiles, respectively. Individuals categorized the attributes with respect to the particular construction of integrated information about these attributes. In other words, a choice was made between two alternatives based on their constructions, and then their separate construction choices were integrated in order to evaluate the alternatives holistically. The results of this study included summaries of the data from the aggregation of all of the respondents as well as within selected segments. 3.2 Results of the Conjoint Analysis
3.2.1 Importance Based on Conjoint Analysis for Three Different Regions
The following is a summary of three different regions regarding the consumer importance level on the base of utility values of conjoint study as noted in Table 3. The main purpose of having a level of importance was to maximize effectiveness and consumer satisfaction. The author observed the contributions of each feature to the probability of purchase. As shown in Table 3 below, it was referred to as the importance score and was calculated by dividing the utility value of each attribute by the total utility value. The inclusion of a brand, which accounted for 27% and 20% of the purchase decision, was determined to be, by far, the most important feature in Middle-East Africa and Asia-Pacific countries respectively. Use of the conjoint importance score is aimed to expand the market by finding the different consumers’ needs across the region. In detail, such attributes as “FM Transmitter,” “Touch screen” and “Music download” are considered to be the consumers’ new crucial needs in
)2456( 6412 ×××)742( 118 ×× )2( 12
)62( 13 ×
)2( 5)2( 4
www.ccsenet.org/ijms International Journal of Marketing Studies Vol. 7, No. 4; 2015
32
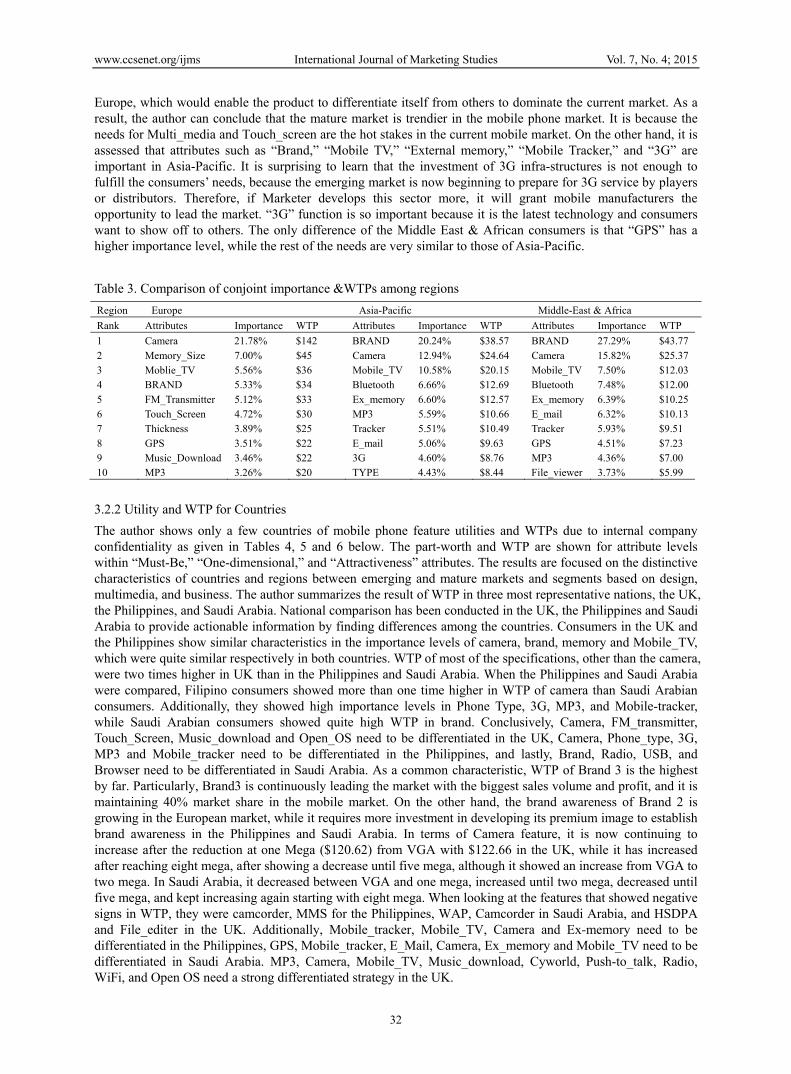
Europe, which would enable the product to differentiate itself from others to dominate the current market. As a result, the author can conclude that the mature market is trendier in the mobile phone market. It is because the needs for Multi_media and Touch_screen are the hot stakes in the current mobile market. On the other hand, it is assessed that attributes such as “Brand,” “Mobile TV,” “External memory,” “Mobile Tracker,” and “3G” are important in Asia-Pacific. It is surprising to learn that the investment of 3G infra-structures is not enough to fulfill the consumers’ needs, because the emerging market is now beginning to prepare for 3G service by players or distributors. Therefore, if Marketer develops this sector more, it will grant mobile manufacturers the opportunity to lead the market. “3G” function is so important because it is the latest technology and consumers want to show off to others. The only difference of the Middle East & African consumers is that “GPS” has a higher importance level, while the rest of the needs are very similar to those of Asia-Pacific.
Table 3. Comparison of conjoint importance &WTPs among regions
Region Europe Asia-Pacific Middle-East & Africa
Rank Attributes Importance WTP Attributes Importance WTP Attributes Importance WTP
1 Camera 21.78% $142 BRAND 20.24% $38.57 BRAND 27.29% $43.772 Memory_Size 7.00% $45 Camera 12.94% $24.64 Camera 15.82% $25.373 Moblie_TV 5.56% $36 Mobile_TV 10.58% $20.15 Mobile_TV 7.50% $12.034 BRAND 5.33% $34 Bluetooth 6.66% $12.69 Bluetooth 7.48% $12.005 FM_Transmitter 5.12% $33 Ex_memory 6.60% $12.57 Ex_memory 6.39% $10.256 Touch_Screen 4.72% $30 MP3 5.59% $10.66 E_mail 6.32% $10.137 Thickness 3.89% $25 Tracker 5.51% $10.49 Tracker 5.93% $9.51 8 GPS 3.51% $22 E_mail 5.06% $9.63 GPS 4.51% $7.23 9 Music_Download 3.46% $22 3G 4.60% $8.76 MP3 4.36% $7.00 10 MP3 3.26% $20 TYPE 4.43% $8.44 File_viewer 3.73% $5.99
3.2.2 Utility and WTP for Countries
The author shows only a few countries of mobile phone feature utilities and WTPs due to internal company confidentiality as given in Tables 4, 5 and 6 below. The part-worth and WTP are shown for attribute levels within “Must-Be,” “One-dimensional,” and “Attractiveness” attributes. The results are focused on the distinctive characteristics of countries and regions between emerging and mature markets and segments based on design, multimedia, and business. The author summarizes the result of WTP in three most representative nations, the UK, the Philippines, and Saudi Arabia. National comparison has been conducted in the UK, the Philippines and Saudi Arabia to provide actionable information by finding differences among the countries. Consumers in the UK and the Philippines show similar characteristics in the importance levels of camera, brand, memory and Mobile_TV, which were quite similar respectively in both countries. WTP of most of the specifications, other than the camera, were two times higher in UK than in the Philippines and Saudi Arabia. When the Philippines and Saudi Arabia were compared, Filipino consumers showed more than one time higher in WTP of camera than Saudi Arabian consumers. Additionally, they showed high importance levels in Phone Type, 3G, MP3, and Mobile-tracker, while Saudi Arabian consumers showed quite high WTP in brand. Conclusively, Camera, FM_transmitter, Touch_Screen, Music_download and Open_OS need to be differentiated in the UK, Camera, Phone_type, 3G, MP3 and Mobile_tracker need to be differentiated in the Philippines, and lastly, Brand, Radio, USB, and Browser need to be differentiated in Saudi Arabia. As a common characteristic, WTP of Brand 3 is the highest by far. Particularly, Brand3 is continuously leading the market with the biggest sales volume and profit, and it is maintaining 40% market share in the mobile market. On the other hand, the brand awareness of Brand 2 is growing in the European market, while it requires more investment in developing its premium image to establish brand awareness in the Philippines and Saudi Arabia. In terms of Camera feature, it is now continuing to increase after the reduction at one Mega ($120.62) from VGA with $122.66 in the UK, while it has increased after reaching eight mega, after showing a decrease until five mega, although it showed an increase from VGA to two mega. In Saudi Arabia, it decreased between VGA and one mega, increased until two mega, decreased until five mega, and kept increasing again starting with eight mega. When looking at the features that showed negative signs in WTP, they were camcorder, MMS for the Philippines, WAP, Camcorder in Saudi Arabia, and HSDPA and File_editer in the UK. Additionally, Mobile_tracker, Mobile_TV, Camera and Ex-memory need to be differentiated in the Philippines, GPS, Mobile_tracker, E_Mail, Camera, Ex_memory and Mobile_TV need to be differentiated in Saudi Arabia. MP3, Camera, Mobile_TV, Music_download, Cyworld, Push-to_talk, Radio, WiFi, and Open OS need a strong differentiated strategy in the UK.

www.ccsenet.org/ijms International Journal of Marketing Studies Vol. 7, No. 4; 2015
33
Table 4. Conjoint utility and WTP for the Philippines
Variable Utility Estimate
P-value WTP Variable Utility Estimate
P-value WTP
BRAND1(SEC) 0.06787 <.0001 $3.73 Camera1 0.23399 <.0001 $12.86 BRAND2(L) 0.00000 <.0001 $0 Camera2 0.32428 <.0001 $17.82 BRAND3(N) 0.52987 <.0001 $ 29.11 Camera3 0.56951 <.0001 $31.29 BRAND4(M) 0.06162 <.0001 $ 3.39 Camera4 0.38295 <.0001 $21.04 BRAND5(SE) 0.34472 <.0001 $18.94 Camera5 0.38874 <.0001 $21.36 MP3 0.13871 <.0001 $7.62 Camera6 0.56285 <.0001 $30.93 TYPE1(F) 0.01657 0.4828 $ 0.91 3G 0.17717 <.0001 $9.73 TYPE2(S) 0.19315 <.0001 $10.61 USPrice -0.0182 <.0001 Torch_light 0.02205 0.0428 $1.21 WAP 0.00970 0.4062 $0.53 Camcorder1 -0.05750 0.0054 $-3.16 WiFi 0.06525 <.0001 $3.59 MMS1 -0.04365 0.0801 $-2.40 Browser 0.06449 <.0001 $3.54 editer1 0.03451 0.0012 $1.90 E_mail 0.16989 <.0001 $9.33 Radio1 0.01741 0.4555 $0.96 Ex_memory1 0.14797 <.0001 $8.13 Radio2 0.06328 0.0024 $3.48 Ex_memory2 0.22828 <.0001 $12.54 Mobile_tracker 0.13775 <.0001 $7.57 Ex_memory3 0.34513 <.0001 $18.96 File_viewer 0.11202 <.0001 $ 6.15 Bluetooth 0.23864 <.0001 $13.11 Mobile_TV 0.33280 <.0001 $18.29 GPS 0.08689 <.0001 $4.77
Table 5. Conjoint utility and WTP for Saudi Arabia
Variable Utility Estimate
P-value WTP Variable Utility Estimate
P-value WTP
BRAND1(SEC) 0.25230 <.0001 $11.36 Camera1 0.34358 <.0001 $15.48 BRAND2(L) 0.00000 <.0001 $0 Camera2 0.34121 <.0001 $15.37 BRAND3(N) 1.06060 <.0001 $47.77 Camera3 0.62424 <.0001 $28.12 BRAND4(M) 0.31918 <.0001 $14.38 Camera4 0.52833 <.0001 $23.80 BRAND5(SE) 0.50470 <.0001 $22.73 Camera5 0.60853 <.0001 $27.41 MP3 0.20758 <.0001 $9.35 Camera6 0.74299 <.0001 $33.47 TYPE1(F) 0.04500 <.0001 $2.03 Ex_memory1 0.15290 <.0001 $6.89 TYPE2(S) 0.13557 0.0074 $6.11 Ex_memory2 0.23356 <.0001 $10.52 Bluetooth 0.25125 <.0001 $11.32 Ex_memory3 0.36306 <.0001 $16.35 GPS 0.26312 <.0001 $11.85 3G 0.26981 <.0001 $12.15 Torch_Light 0.06883 <.0001 $3.10 WAP -0.02611 0.0567 $-1.18 Mobile_Tracker 0.20653 <.0001 $9.30 WiFi 0.00836 0.5338 $0.38 File_Viewer 0.08697 <.0001 $3.92 USB1 0.04060 0.0083 $1.83 Browser 0.07771 <.0001 $3.50 USB2 0.09654 <.0001 $4.35 E_mail1 0.21128 <.0001 $9.52 File_editer 0.03831 <.0001 $1.73 PC_sync 0.07690 <.0001 $3.46 Camcorder -0.06490 0.012 $ -2.92 Mobile_TV 0.25171 <.0001 $11.34 USPrice -0.0222 <.0001
Table 6. Conjoint utility and WTP for the UK
Variable Utility Estimate
P-value WTP Variable Utility Estimate
P-value WTP
BRAND1 0.19912 <.0001 $35.82 External_music key 0.0236 <.0001 $ 4.25 BRAND2 0.19695 <.0001 $35.43 Push_to_talk 0.11002 <.0001 $19.79 BRAND3 0.33803 <.0001 $60.81 Browser1 0.06278 <.0001 $11.29 BRAND4 0.27783 <.0001 $49.98 E_mail1 0.09243 <.0001 $16.63 BRAND5 0.12641 <.0001 $22.74 Ex_memory1 0.15609 <.0001 $28.08 TYPE1 0.00818 <.0001 $1.47 Ex_memory2 0.28902 <.0001 $52.00 TYPE2 0.0009161 0.9092 $0.16 Ex_memory3 0.3279 <.0001 $58.99 TYPE3 0.01915 0.003 $3.45 HSDPA -0.01887 <.0001 $-3.39 MP3 0.1533 <.0001 $27.58 HSUPA 0.02315 <.0001 $ 4.16 Radio 0.07727 <.0001 $13.90 Mobile_TV 0.2882 <.0001 $ 51.85 WiFi 0.09645 <.0001 $21.05 Qwerty 0.12224 <.0001 $21.99 Open OS 0.13977 <.0001 $25.15 MMS 0.05297 <.0001 $ 9.53 Camera1 0.68179 <.0001 $122.66 Bluetooth 0.12081 <.0001 $21.73 Camera2 0.67046 <.0001 $120.62 GPS1 0.11702 <.0001 $21.05

www.ccsenet.org/ijms International Journal of Marketing Studies Vol. 7, No. 4; 2015
34
Camera3 0.81452 <.0001 $146.53 Music download 0.19487 <.0001 $35.06 Camera4 0.93389 <.0001 $168.01 Cyworld 0.05077 <.0001 $ 9.13 Camera5 1.00314 <.0001 $180.47 File_viewer 0.0323 <.0001 $ 5.81 Camera6 1.08925 <.0001 $195.96 File_editer -0.03195 <.0001 $-5.75 USPrice -0.008688 <.0001
Regarding WTP for each attribute, the highest scoring utility is associated with the camera function in all three countries, except for Brand. All three countries demonstrated the highest utility for brand 3. The WTP for brand 3 was $29.11, $47.77, and $60.81 for the Philippines, Saudi Arabia, and the UK, and the price was slightly higher in both Malaysia and the UK. Brand 3 was the company which maintains 40% of M/S, leads globally, and had a high consumer value to the brand. On the other hand, Brand 2 kept increasing its brand value by vigorous investments on the brand to overcome its low-end brand image and to launch high-end products. Especially, relatively low utility value was shown in WiFi and File_editer, MMS, LCD size, and phone type in all three countries. The Philippines and Saudi Arabia show similar WTP patterns in terms of camera, but the WTP for the camera is the highest at 2 Mega, followed by “more than 8 Mega.” The increase rate slows down between 3 Mega and 8 Mega, and it suddenly increases sharply again for 8 Mega and above. Therefore, for “more than 3 Mega,” the addition of a camera should strategically not be entered by considering cost and time-to-market factors. However, the UK shows different WTP patterns compared to the Philippines and Saudi Arabia in terms of camera, but the WTP climaxes at VGA, and again “more than 2 Mega.” Thus, for “more than 2 Mega,” the addition of a camera can make a great increase in demand, due to the proportional WTP increase. The WTP patterns of the camera aspect show almost the same result in each country. Since European countries have a well-developed service infrastructure, the WTP for memory was about three times higher than that of the emerging markets. Such results is caused due to the differences in the values of consumers of mature markets from that of consumers of emerging markets, caused by the different stage of market growth.
With respect to the country level, in the Philippines, however, the differentiated marketing strategy for MP3 players, 3G, Mobile_tracker, and external memories would be a good method to expand market share. The WTP of Saudi Arabia consumers for every feature, excluding LCD, Camcorder, WAP, USB, File_editer, and WiFi was high in general. In detail, Saudi Arabia consumers have high WTP for Mobile TV, 3G, E-mail, and Bluetooth with $11.34, $12.15, $9.52, and $11.32 respectively.
Therefore, since the camera function, MP3, Bluetooth, Mobile_TV, and External_memory are important features in these three countries, these functions can, and should, take advantage of the differentiation strategy under the competitive environment not only in the three countries, but also in the rest of mobile markets. All features excluding Bar type, File_editer, and HSDPA, Music_download, GPS, Bluetooth, MP3, and Open OS are significant attributes in the UK. In the Philippines, however, the differentiated marketing strategy for Bluetooth, MP3 players, 3G, GPS, Mobile_tracker, and external memories would be a good method to expand market share. For 3G, there is a big gap between the WTP ($10) for emerging and the WTP ($3) for mature countries. This means that 3G in emerging markets will be greater in demand compared to mature markets. UK consumers’ needs for “Brand,” “Open OS” and “Qwerty” are higher than the rest of the European consumers. Therefore, if one can provide the product that is superior in those attributes, it will be able to grab the market opportunities. On the other hand, it is indicated that any particular strategy is unnecessary for the market in Saudi Arabia, because they share the similar needs with the rest of the Middle East & African countries. However, more strategic approach is desired for the markets in the Middle East and Africa by more specifically differentiating the product.
3.2.3 Conjoint Importance Score and WTP for Regional Segments
Segments are classified mainly into 4 different macro groups. Each segment has a distinctive profile, or contrasting pattern of desired features and price sensitivities. Based on their primary needs, the customer segments can be categorized as following. First, using multimedia functions, such as music, game, video for fun in mobile society; this segment likes cool, fun, and classy design with features. Customers in the C segment prefer entertainment functions such as taking photos and listening to music. Second, using the mobile phone for business purposes, this segment has concerns about ease to carry, battery duration, and sound quality. Customers in A segment strongly prefer productivity-related functions like e-mail and internet access. Third, being fashionable and stylish from others, this segment likes stylish designs with some features related to entertainment, but does not really want many advanced features. Customers in the B segment have an average willingness to pay. Last, this segment wants to be reachable and prepared in case of emergencies with the most basic features. This D segment cares only about price, not even about sound quality or ease of use. Price is the

www.ccsenet.org/ijms International Journal of Marketing Studies Vol. 7, No. 4; 2015
35
most important buying factor. Marketers need to understand how each segment has different characteristics in terms of benefits they seek among regions, which are Asia-Pacific, MEA, and Europe, and the author should find the difference of willingness to pay among segments. The order of willingness to pay among segments is C, B, A, and D from among regions. The average difference in WTP is $5 to $15 from three main segments. The results of this analysis are summarized in Table 7. Because consumers’ WTP differs for B segment and C segment, WTP for each segment can be a very important guideline to establish the price for each mobile phone. Therefore, one needs to clearly understand what features are thought importantly by consumers on WTP differences in each segment. According to Table 7, the WTP of Camera in the D segment is $88, while that of segment B is $127, showing a $40 difference. Similarly in Table 8, the WTP of Camera in segment D is $5, while that of segment B is $19, showing a $14 difference between the two. Showing different WTP for the same feature in different segments is not uncommon to appear in many other features. Consequently, it is significantly important to have a value curve for each feature for WTP within a company to maximize profit. Also, it would be very helpful to track the amount of consumers’ WTP reduction for each feature as the price goes down in percent by each wave, to establish differentiated strategy against competitors. Lastly, it is also valuable because it enables marketers to systematically organize features that consumers wish to have considering their WTP in comparison with cost and regional & national importance level.
Table 7. Comparison of segments in the Europe markets
A Segment (B) B Segment (S) C Segment (M) D Segment (E)
Rank Importance WTP Importance WTP Importance WTP Importance WTP
1 Camera_Res. (17.73%) $93 Camera (21.51%) $127 Camera (23.38%) $130 Camera (23.34%) $88 2 BRAND (8.23%) $43 Memory_size (6.41%) $38 Memory_size (6.06%) $34 Memory_size
(9.13%) $34
3 Memory_Size (6.11%) $32 Brand (5.74%) $34 Mobile_TV (5.73%)
$31 FM_transmitter (5.14%)
$19
4 Moblie_TV (5.70%) $30 Mobile_TV (5.51%) $32 FM_transmitter (5.45%)
$30 Brand (5.01%) $19
5 Thickness (5.08%) $27 Touch_screen (4.71%) $28 Brand (4.47%) $25 Touch_screen (4.78%)
$19
6 FM_Transmitter (4.89%) $26 LCD_size (4.53%) $27 Touch_screen (4.27%) $23 Mobile_TV (4.51%)
$19
7 Touch_Screen (4.74%) $25 FM_Transmitter (4.52%) $27 Thickness (3.78%) $20 GPS (4.00%) $16 8 GPS (3.93%) $21 Thickness (4.44%) $26 Music_Download
(3.55%) $20 Music_Download
(3.91%) $14
9 MP3 (3.13%) $16 LCD_size (4.00%) $24 Bluetooth (3.26%) $19 Thickness (3.46%) $13 10 LCD_color (2.94%) $15 GPS (3.48%) $20 Auto_focus (3.21%) $17 MP3 (3.44%)
$13
Table 8. Comparison of segments in Asia-Pacific markets
Country A segment(B) B Segment(S) C Segment(M) D Segment(E)
Rank Importance WTP Importance WTP Importance WTP Importance WTP
1 Brand (19%) $27 Camera (17%) $19 Camera (16%) $17 Brand (19%) $12
2 Camera (15%) $12 Brand (15%) $33 Brand (13%) $26 Camera (15%) $5
3 Ex_memory (9%) $13 Ex_memory (10%) $23 Ex_memory (11%) $22 TV (9%) $11
4 Mobile_TV (8%) $24 Mobile_TV (8%) $35 Mobile_TV (9%) $36 Ex_memory (9%) $5
5 Bluetooth (6%) $16 3G (5%) $22 Bluetooth (5%) $22 Tracker (6%) $7
6 MP3 (5%) $16 Bluetooth (5%) $21 MP3 (5%) $19 Bluetooth (5%) $6
7 E_mail (5%) $15 E_mail (4%) $17 Mobile_Tracker (5%) $19 Radio (4%) $4
8 TYPE (5%) $14 Radio (4%) $14 TYPE (5%) $18 GPS (4%) $5
9 LCD (4%) $8 Mobile_tracker (4%) $15 3G (5%) $18 TYPE (4%) $5
10 Tracker (3%) $9 MP3 (3%) $14 E_mail (4%) $18 E_mail (4%) $5

www.ccsenet.org/ijms International Journal of Marketing Studies Vol. 7, No. 4; 2015
36
Table 9. Comparison of segments in the Middle-East & Africa markets
Country A segment(B) B Segment(S) C Segment(M) D Segment(E)
Rank Importance WTP Importance WTP Importance WTP Importance WTP
1 BRAND (26%) $38 BRAND (16%) $31 Camera (19%) $30 BRAND (16%) $9
2 Camera (14%) $13 Camera (16%) $20 BRAND (14%) $35 Camera (12%) $4
3 Bluetooth (6%) $18 Ex_memory (9%) $18 Ex_memory (8%) $21 LCD (10%) $8
4 Ex_memory (6%) $9 Radio (6%) $19 Mobile_TV (6%) $31 Ex_memory (9%) $4
5 3G (5%) $13 Mobile_TV (6%) $22 MP3 (5%) $28 Tracker (7%) $8
6 MP3 (4%) $13 Bluetooth (5%) $20 E_mail (5%) $27 Radio (7%) $7
7 Mobile_TV (4%) $11 E_mail (4%) $16 Bluetooth (5%) $26 TorchLight (6%) $6
8 E_mail (4%) $11 Tracker (4%) $15 3G (5%) $24 E_mail (4%) $5
9 Viewer (3%) $10 MP3 (4%) $15 GPS (4%) $23 GPS (4%) $5
10 Radio (3%) $9 TYPE (4%) $15 Viewer (3%) $17 TYPE (4%) $4
4. Discussion
The proposed method with the Kano model proved to be a practical and efficient tool for decision-making, since it helped mobile manufacturers to better understand how customers evaluate and perceive quality attributes. The Kano model was used to explain how the quality attributes can be classified into mainly three categories of perceived quality: “Must-be,” “One-dimensional,” and “Attractive.” It has lots of benefits in terms of cost and time reduction and is expected to bring a great effect into the industrial field.
Use of the conjoint important score is aimed to expand the market by finding the different consumers’ needs across the regions. In detail, attributes such as “FM Transmitter,” “Touch screen” and “Music download” are considered to be the consumers’ new crucial needs in Europe, which would enable the product to superiorly differentiate itself from others to dominate the current market. On the other hand, it is shown that attributes such as “Brand,” “Mobile TV,” “External memory,” “Mobile Tracker,” and “3G” are more important in Asia-Pacific. Therefore, if mobile manufacturers develop this sector more, it will grant mobile manufacturers the opportunity to lead the market. The only difference of the Middle East & African consumers is that “GPS” has a higher importance while the rest of the needs are very similar to those of Asia-Pacific. Regarding WTP among countries, the highest scoring utility, besides brand, appeared to be associated with the camera function in all countries. Especially, relatively low utility value was given in WiFi and File-editer, MMS, LCD size, and Phone type. In a value based approach, the price of a product is based on the perceived valuation by the target customers. The research in the field of pricing is of ample importance. This is because price is the only element of the marketing mix that generates income. All other elements, such as advertising and promotion, product development, selling effort, distribution, packaging, and so forth, involve expenditures (Monroe, 2003).
Regarding among regions, the needs for 3G and the internet related feature (WAP, WiFi, etc.) in the emerging market are low compared to those for 3G and internet related feature in the mature market. Also, the needs for productivity and advanced features, such as camera and e-mail, are lower in Asia-Pacific than in Europe. It is therefore recommended that manufactures and marketers of mobile phones should consider producing and selling phones with modern technology features that are more durable and highly quality. However, the needs for internet related features, 3G, and advanced features, such as Biz scanners, digital compasses, and hearing aids are higher in Asia-Pacific. Based on the results regarding WTP among regions and countries, the author strongly suggest that mobile manufacturers launch mobile phones with more advanced camera features embedded to maintain strong position in Europe. The author also recommend that mobile producers to consider more seriously in investment for marketing promotion and value added service for success in Asia-Pacific, the Middle-East & Africa.
The results of this study were successfully implemented for product planning, product development, and marketing in terms of price setting, feature prioritizing, and optimal designing for new products in the mobile phone company. Key features from the consumer perspective and the estimated value can be utilized for the priority order of mobile phone features at the stage of development. It is also helpful to make a decision for the mid and long-term product line-ups as providing the feature value of country, region, and segment. In addition, based on the needs of customers, the customer segments were categorized as the following. First, using multimedia functions such as music, game, and video for fun in a mobile society, customers in C segment like cool, fun, and classy designs with features. They prefer entertainment functions, such as taking photos and listening to music. Second, consumers using the mobile phone for business purposes have concerns about the ease to carry, battery duration, and sound quality. Customers in the A segment strongly prefer
www.ccsenet.org/ijms International Journal of Marketing Studies Vol. 7, No. 4; 2015
37
productivity-related functions like e-mail and internet access. Lastly, being fashionable and stylish from others, these customers like stylish designs with some features related to entertainment, but not many advanced features. Customers in the B segment have an average willingness to pay. Marketers need to understand how the customers in each segment have different characteristics in terms of benefits they seek among regions, which are Asia-pacific, MEA, and Europe, and marketers should find the different willingness to pay among the segments. The order of willingness to pay among segments is C, B, A, and D from among the region. Furthermore, the author analyzed the differences by consumer characteristics from the five Asia-Pacific, six Middle-East & Africa and three European countries.
Therefore it can be concluded that the product features are the biggest competitive tool for differentiating from competitor’s products. Being the first producer to introduce a needed and valued new feature is one of the most effective ways to compete thus enhancing consumer decision making process. Product and brand attributes are significantly important to consumers when making their purchasing decision. In this way, the company can assess each feature’s value to customers versus its cost to the company. Additionally by determining which combination of these features match the current trends and consumer needs would be cost effective to the mobile phone companies. The results of this research study corresponds with previous researches conducted (Pakola et al., 2010; Das, 2012; Malaasi, 2012; 2008; Raymond K. Dziwornu, 2013) that considers the features of mobile phone as a crucial factor in consumer buying decision in all countries. It is significant that this study made huge impact on mobile phone manufacturers in several ways: 1) It has been converted into product development with consumer-oriented approach; 2) The pricing policy has been changed from cost-based pricing into value-based pricing; and 3) Marketing strategy has been changed from an unsystematic function into a systematic and consistent one.
The integrated hierarchical survey by function with the Kano model proves to be a highly useful, efficient, and accurate methodology for understanding a consumer mobile phone behavior. Although the proposed method was applied to designs of mobile phones in the emerging and mature markets, its accuracy was not compared with the traditionally used method such as CBC, Adaptive Conjoint Analysis (ACA) and Hybrid method. This is left for further areas of research. References Batt & Katz. (1997). A Conjoint Model of Enhanced Voice Mail Service. Telecommunication Policy, 21(8),
743-760. http://dx.doi.org/10.1016/S0308-5961(97)00044-X
Berger, C. et al. (1993). Kano’s Method for Understanding Customer-defined Quality. Center for Quality Management Journal (fall), 3-25.
Carroll & Green. (1995). Psychometric Methods in Marketing Research: Part I, Conjoint Analysis. Journal of Marketing Research, 32(November), 385-391.
Clausing, D. (1994). Total Quality Development. New York: ASME Press.
Das, D. (2012). An empirical study of factors influencing buying behavior of youth Consumers towards mobile handsets: A case study in coastal district of Odisha. Asian Journal of Research in Business Economic Management, 2(4), 68-82.
DeSarbo, W. S., Wedel, M., Vriens, M., & Ramaswamy, V. (1992). Latent Class Metric Conjoint Analysis. Marketing Letters, 3, 273-288. http://dx.doi.org/10.1007/BF00994135
Dziwornu, R. K. (2013). Factors Affecting Mobile phone purchase in the Greater Accra Region of Ghana: A Binary Logit Model Approach. International Journal of Marketing Studies, 5(6), 151-160. http://dx.doi.org/10.5539/ijms.v5n6p151
Green, P. E. (1984). Hybrid Models for Conjoint Analysis: An Expository Review. Journal of Marketing Research, 21(May), 155-169. http://dx.doi.org/10.2307/3151698
Green, P. E., & Krieger, A. (1996). An Individual Hybrid Models for Conjoint Analysis. Management Science, 42(June), 850-867. http://dx.doi.org/10.1287/mnsc.42.6.850
Green, P. E., & Srinivasan, V. (1978). Conjoint Analysis in Consumer Research: Issues and Outlook. Journal of Consumer Research, 5, 103-123. http://dx.doi.org/10.1086/208721
Green, P. E., & Srinivasan, V. (1990). Conjoint Analysis in Marketing: New Developments with Implications for Research and practice. Journal of Marketing, 54(October), 3-16. http://dx.doi.org/10.2307/1251756
Greenberg. (1986). Determinants of perceived fairness of performance evaluation. Journal of Applied

www.ccsenet.org/ijms International Journal of Marketing Studies Vol. 7, No. 4; 2015
38
Psychology, 71, 340-342. http://dx.doi.org/10.1037/0021-9010.71.2.340
Gustafsson, A., Hermann, A., & Huber, F. (2000). Conjoint Measurement: Method and Application-Berlin. Heidelberg: Springer Verlag. http://dx.doi.org/10.1007/978-3-662-06395-8
Hauser, J., & Clausing, D. (1988). The house of quality. Harvard Business Review, 66(3), 63-73.
Huber, J. (2005). What has Marketing Learned from Richard Johnson? Journal of Marketing Research, 17(2), 250-253. http://dx.doi.org/10.1509/jmkr.2005.42.3.250
IDC (International Data Corporation). (2014). Retrieved from http//www.IDC.com.
IMF (International Monetary Fund). (2007). Retrieved from http://www.imf.org
Johnson, R. M. (1986). Accuracy of Utility Estimation in Adaptive Conjoint Analysis. Working Paper, Sawtooth Software, Sequim, WA, (April).
Johnson, R. M., & Zwerina, K. (1996). The Importance of Utility Balance in Efficient Choice Designs. Journal of Marketing Research, 18(August), 307-317.
Kamakura, W. A. (1988). A Least Squares Procedure for Benefit Segmentation with Conjoint Experiments. Journal of Marketing Research, 25, 157-167. http://dx.doi.org/10.2307/3172647
Kano, N., Seraku, N., Takashashi, F., & Tsuji, S. (1984). Attractive Quality and Must-Be Quality. The Journal of the Japanese Society for Quality Control, (April), 47-56.
Lancaster, K. (1971). Consumer Demand: A New Approach. Columbia University Press: New York.
Louviere, J. J. (1994). Conjoint Analysis. In R. P. Bagozzi (Ed.), Advanced Methods of Marketing Research (pp. 223-259). Cambridge.
Louviere, J. J., & Woodworth, G. (1983). Design and Analysis of Simulated Consumer Choice or Allocation Experiments: An Approach based on aggregated data. Journal of Marketing Research, 20(November), 350-367. http://dx.doi.org/10.2307/3151440
Madeleine, K., & William. (1999). A Comparison of Conjoint Methods When There Are Many Attributes. Marketing Letters, 10, 125-138. http://dx.doi.org/10.1023/A:1008036829555
Mahajan, V., Green, P. E., & Goldberg, S. M. (1982). A Conjoint model for measuring self-and cross-price demand relationships. Journal of Marketing Research, 19(August), 334-342. http://dx.doi.org/10.2307/3151567
Malasi, J. M. (2012). Influence of product Attributes on Mobile phone preference among university students: A Case of Undergraduate students. International Journal of Academic Research in Economics and Management Science, 1(6), 10-16.
Monroe, K. (2003). Pricing: Making Profitable Decisions (3rd ed.). McGraw-Hill Irwin.
Netzer & Srinivasan. (2007). Adaptive Self-Explication of Multi-Attribute Preferences. Stanford University Graduate School of Business Research Paper.
Netzer & Srinivasan. (2011). Adaptive Self-Explication of Preference. Journal of Marketing Research, XLVIII(February), 140-156.
Netzer, O., & Srinivasan, V. (2009). Adaptive Self-explication of Multi-Attribute Preferences. Working paper, Columbia University.
Oppewal & Timmernans. (1992). Residential choice behaviour of dual earner households: a decompositional joint choice model. Environment and Planning A, 24(4), 517-533. http://dx.doi.org/10.1068/a240517
Oppewal, H., Louviere, J., & Timmermans, H. (1994). Modeling Hierarchical conjoint processes with integrated choice experiments. Journal of Marketing Research, 31(February), 92-105. http://dx.doi.org/10.2307/3151949
Pakol et al. (2010). Influence of product Attributes on Mobile Phone markets in Finland. In submission to the 23nd EMAC conference, Track: New Technologies an E-marketing.
Rao, V. R., & Hauser, J. (2004). Conjoint Analysis, Related Modeling, and Applications. In Y. Wind & P. E. Green (Eds.), Market Research and Modeling: Progress and Prospects: A Tribute to Paul Green (pp. 141-168). Kluwer Academic Publishers.
Sata, M. (2013). Consumer Buying Behavior of Mobile Phone Devices. Journal of Marketing and Consumer

www.ccsen
Resea
Schrift, RXLIII
Shahriari, ProduIntern
Strategy A
Suh, N. P.
Toubia, O.of Ma
Toubia, OScien
Vithala. (2Mode
Wedel, M.Internhttp:/
Wind, Y., Consu
AppendixFunctional fo
of the questio
If the ed
If the
Dysfunctiona
of the questio
Appendix
net.org/ijms
arch, 2, 8-15.
R. Y., Netzer, I(April), 308-3
H., Haji, M. Juct by Combinnational, 30(D
Analytics. (201
(1990). The P
., Hauser, J. Rarketing Resea
., Simester, D.nce, 22(3), 273
2008). Developels. Springer.
., & Steenkamnational //dx.doi.org/10
Green, P. E.,umer-based m
x A. Functionaorm
on
dges of your mobi
edges of your mo
al form
on
x B. An Examp
I
O., & Kive26. http://dx.d
J., & Eslamiponing Robust D
December), 128
1). Retrieved f
Principles of de
., & Simester, arch, 42(Febru
. I., Hauser, J.-303. http://dx
pments in Con
mp, J-B. E. M. Journal
0.1016/0167-81
Shifflet, D., marketing. Interf
al and Dysfun
ile phone grip weldo you feel?
bile phone do not you feel?
ple of the Onl
International Jou
etz, R. (2011)doi.org/10.1509
oor, R. (2014)Design and Cu85-1292. http:/
from http://ww
esign. New Yor
D. I. (2004). Pary), 116-131.
R., & Dahan,x.doi.org/10.12
njoint Analysi
(1989). Fuzzyof Re
116(89)90052-
& Scarbroughrfaces, 19(Janu
nctional Quest
ll in your hand, ho
t grip well, how do
line Survey
urnal of Marketi
39
). Complicatin9/jmkr.48.2.30
). An Integrateustomer Requ//dx.doi.org/10
ww.strategyana
rk: Oxford Un
Polyhedral Me http://dx.doi.o
, E. (2003). Fa287/mksc.22.3
is. In B. Wier
y Clusterwise Research -9
h, M. (1989). uary-February)
tions in the Ka
ow
1. I like 2. It mu3. I am n4. I can 5. I disli
o
1. I like 2. It mu3. I am n4. I can 5. I disli
ing Studies
ng Choice. Jo08
ed Approach firements. Qua
0.1002/qre.154
alytics.com
niversity Press.
ethods for Adaorg/10.1509/jm
ast Polyhedral.273.17743
renga (Ed.), H
Regression Apin Mar
Courtyard by), 25-47. http:/
ano Questionn
it that way. ust be that way. neutral. live with it that wike it that why.
it that way. ust be that way. neutral. live with it that wike it that why.
Journal of Ma
for Enhancingality and Relia48
.
aptive Conjointmkr.41.1.116.2
l Conjoint Esti
Handbook of M
pproach to Benrketing,
y Marriott: De//dx.doi.org/10
naire
way.
way.
Vol. 7, No. 4;
arketing Rese
the Quality oability Enginee
t Analysis. Jou25082
imation. Mark
Marketing Dec
nefit Segmenta6, 241
esign a Hotel 0.1287/inte.19.
2015
arch,
of the ering
urnal
keting
cision
ation. -258.
with 1.25
www.ccsen
Appendix
Appendix
net.org/ijms
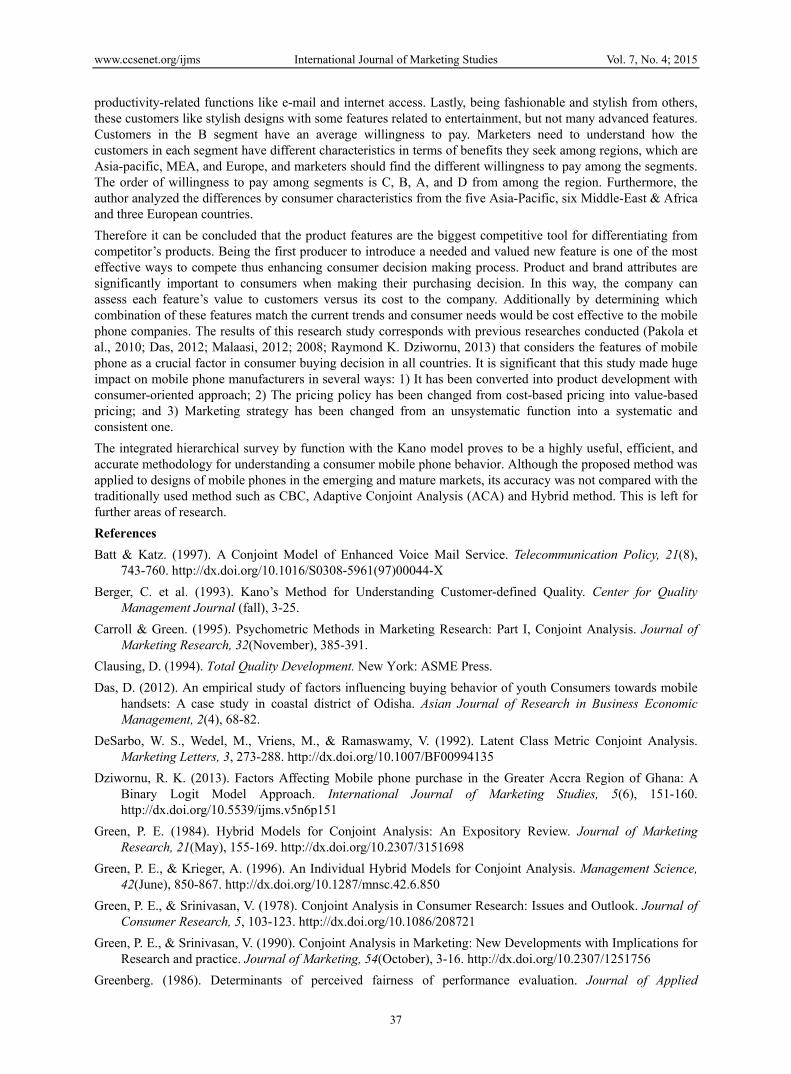
x C. Color Pre
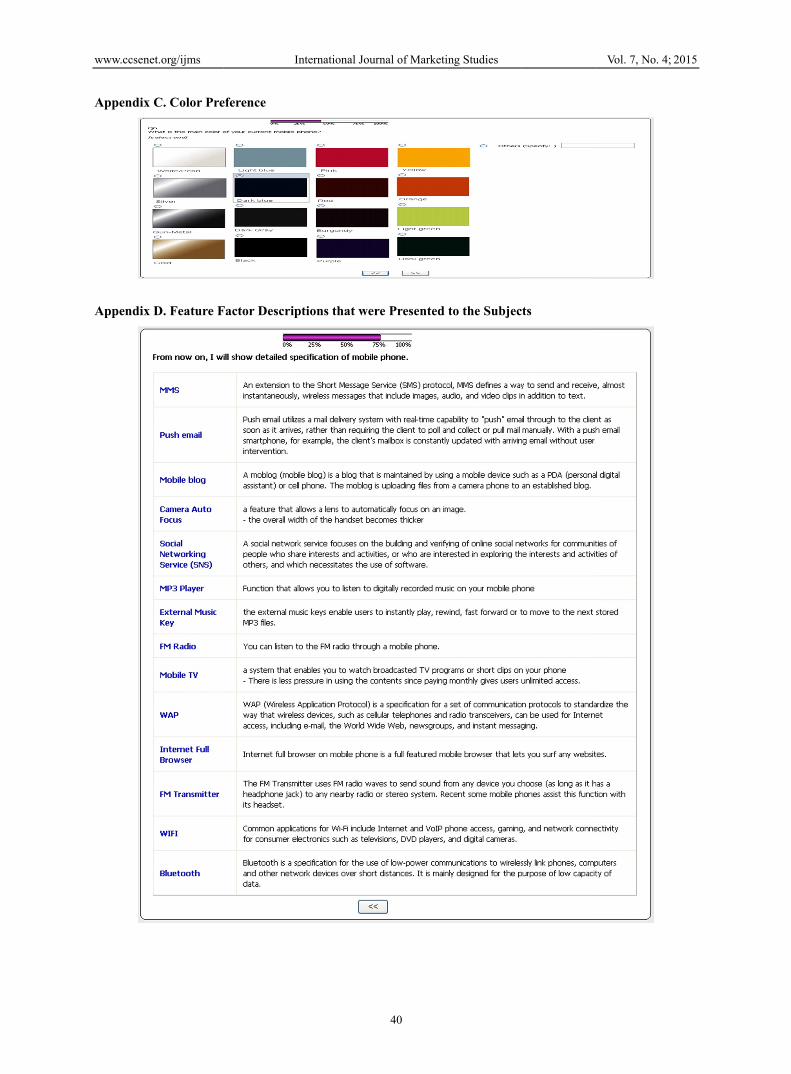
x D. Feature F
I
eference
Factor Descrip
International Jou
ptions that we
urnal of Marketi
40
ere Presented
ing Studies
to the Subjeccts
Vol. 7, No. 4;
2015

www.ccsenet.org/ijms International Journal of Marketing Studies Vol. 7, No. 4; 2015
41
Appendix E. Attributes and Levels for “Must-Be” 1 2 3 4 5 6 Brand OEM SAMSUNG LG NOKIA SONY MOTOROLA TYPE FLIP BAR CLAMSHELL SLIDE Thickness THICKER
THAN 30mm
15-20mm 10-15mm THINNER THAN 10mm
LCD size 1" 1.8" 1.8~2.0" 2.1~2.3" LARGER THAN 2.3"
LCD Resolution 100*120 128*160 176*220 320*240 LCD color 4K 65K 262K 16M MP3 Player YES NO FM Radio YES NO Bluetooth YES NO File_editer YES NO File_viewer YES NO One dimension YES NO Attractive YES NO Price 1 2 3 4 5 6
Appendix F. Attributes and Levels for “One-Dimensional”
1 2 3 4 5 6 Open OS YES NO Camera Resolution NO CAMERA VGA 1M 2M 3M 5M MORE THAN 8M Auto Focus YES NO Memory Size NO 5-10MB 10-30MB 30-50MB External Slot YES NO MMS YES NO HSDPA YES NO HSUPA YES NO Full_browser YES NO External Music Key YES NO
Appendix G. Attributes and Levels for “Attractive”
1 2 Mobile TV YES NO
FM Transmitter YES NO Touch Screen YES NO Push-To-Talk YES NO
VoIP YES NO Push E-mail YES NO
WIFI YES NO GPS YES NO
SNS (Cyworld) YES NO Mobile Blog YES NO QWERTY YES NO
Music download (FREE) YES NO
Copyrights Copyright for this article is retained by the author(s), with first publication rights granted to the journal.
This is an open-access article distributed under the terms and conditions of the Creative Commons Attribution license (http://creativecommons.org/licenses/by/3.0/).