Embed Size (px)
Citation preview

A Comparison of U.S. and European University- Industry Relations in the Life Sciences
Jason Owen-Smith, Stanford University Massimo Riccaboni, University of Siena
Fabio Pammolli, University of Siena Walter W. Powell, Stanford University
FINAL DRAFT
Forthcoming, Management Science
Abstract
We draw upon diverse datasets to compare the institutional organizational of upstream life science research across the United States and Europe. Understanding cross-national differences in the organization of innovative labor in the life sciences requires attention to the structure and evolution of biomedical networks involving public research organizations (universities, government laboratories, non-profit research institutes, and research hospitals), science-based biotechnology firms, and multinational pharmaceutical corporations. We use network visualization methods and correspondence analyses to demonstrate that innovative research in biomedicine has its origins in regional clusters in the U.S. and in European nations. But the scientific and organizational composition of these regions varies in consequential ways. In the United States, public research organizations and small firms conduct R&D across multiple therapeutic areas and stages of the development process. Ties within and across these regions link small firms and diverse public institutes, contributing to the development of a robust national network. In contrast, the European story is one of regional specialization with a less diverse group of public research organizations working in a smaller number of therapeutic areas. European institutes develop local connections to small firms working on similar scientific problems, while cross-national linkages out of European regional clusters typically involve large pharmaceutical corporations. We show that the roles of large and small firms differ in the U.S. and Europe, arguing that the greater heterogeneity of the U.S. system is based on much closer integration of basic science and clinical development.
This research was supported by grants from the Association for Institutional Research (Grants # 99-129-0, 00-129-1, Jason Owen-Smith, PI), the National Science Foundation (Grant # 9710729, W.W. Powell & K.W. Koput, PIs), the Merck Foundation (EPRIS Project, F. Pammolli PI), the European Commission (Contract # SOE1-CT 98-1116, DG 12-SOLS: ESSY Project). We are grateful to audiences at Georgia Tech, Columbia University, the University of Gothenberg, the Centre de Sociologie des Organisations in Paris, the NPRNet Workshop in Paris, and the comparative workshop at Stanford’s IIS for useful feedback. We thank Ashish Arora, Paul David, Bronwyn Hall, Hannah Kettler, Georg Kruecken, Kenneth Pavitt, Scott Shane, Deepak Somaya, Ed Steinmueller, and Paula Stephan for their helpful comments. The paper was a fully collaborative effort, authors’ names are listed in chronological order.

1
I. Introduction
Universities in the United States and Europe are often compared with respect to their
divergent levels of involvement in the private economy. The U.S. university system, with its mix of
both public and private institutions, has long played a significant role in conducting research that
contributes to technological development and industrial performance (Geiger, 1988; Rosenberg and
Nelson, 1994). Historically, this “knowledge plus” orientation, in which high-quality public and
academic research tends to be driven by “joint goals of understanding and use” (Stokes, 1997, p. 15)
was contrasted to the European scene, where universities were believed to contribute more to
knowledge for its own sake and to the preservation of distinctive national cultures (Ben David,
1977).
Over the past decade, the development of a number of key science and technology-based
industries – most notably information and communication technologies, and biotechnology – has
helped spark economic growth. The United States has broad commercial leadership in a number of
these new areas, and commentators suggest that U.S. universities and research institutes played a
significant role in this process (Mowery and Nelson, 1999; Mowery, Nelson, Sampat and Ziedonis,
2001). The diverse interfaces between U.S. research universities and the private sector have been
widely documented (Link, 1999; Mowery, 1999). Patenting by U.S. universities increased nearly
seven fold over the period 1976-1998 (Owen-Smith, 2000) and licensing revenues from the sale of
intellectual property have grown briskly as well. The science-based startup firm has been the
cornerstone of the commercial field of biotechnology, with university researchers playing a
significant role as founders, consultants, and members of scientific advisory boards.
In contrast, industry-university relations in Europe have lagged behind, in part due to legal
prohibitions in some countries against faculty collaboration with commercial entities, and cultural
predispositions against academic involvement with commerce. Since the late 1980s, however,
European attention has shifted to technology policy and academic technology transfer (Howells and
McKinlay, 1999). In a climate of strong anxiety about European Union competitiveness in science-
based industries, programs developed following the Single European Act of 1987,1 encourage

2
matches between universities and firms, placing particular emphasis on quick delivery of tangible
commercial results (Peterson and Sharp, 1998).
Strong contrasts exist between European and U.S. research infrastructures, however.
Consider, as an illustration, differences in university organization and governance between the U.S.
and Germany. The U.S. system is highly decentralized. Even public universities rely on diverse
funding sources, including state and national governments, foundations and corporate supporters,
tuition revenues, and alumni gifts. Private universities, especially elite ones, are also supported by
generous endowments. Financing is considerably more centralized within European nations, and
this centralization entails more hierarchical control. Faculty members in the U.S. have much more
research independence at early career stages, and academic scientists frequently move between
universities in an effort to better their labor market position. In France and elsewhere on the
continent, there is much less autonomy and mobility for younger scientists (Gittelman, 2000). In
addition, blurring boundaries between basic and goal-oriented research and increased competition
for research support and funding enable greater mixing of disciplines in the U.S (Galambos and
Sturchio, 1998; Morange, 1998). In Germany, a number of the highly prestigious Max Planck
institutes are organized hierarchically around a single field, such as biochemistry, genetics, or
immunology. Elite research institutes in the U.S., such as Cold Spring Harbor, Salk, or Scripps,
routinely bring together faculty from multiple disciplines.
Against this background, we undertake a broad comparison of linkages between research
universities, public research institutes and the private sector in the field of the life sciences and
analyze how differences in the pattern of these relationships have shaped the development of
biotechnology in the United States and Europe. The explosion of knowledge in molecular biology
and genetics has generated a wide range of new medical opportunities. Because the relevant
scientific knowledge and organizational skills are broadly dispersed, no single organization has been
able to internally master and control all the competencies required to develop a new medicine
(Powell, Koput, and Smith-Doerr 1996; Pammolli, Riccaboni and Orsenigo, 2000; Orsenigo,
Pammolli and Riccaboni, 2000). Biomedicine, then, is characterized by extensive reliance on
collaboration among many parties, including universities, research institutes, new biotechnology
3
firms, and mature pharmaceutical and chemical corporations (Arora and Gambardella, 1994; Lerner
and Merges, 1998; Stuart, Hoang, and Hybels, 1999; Arora et. al., 2000). These varied combinations
of organizations afford us the opportunity to analyze cross-national differences in the roles these
diverse organizations play in the process by which biomedical research moves from academic
laboratories into clinical development.
In section II below, we sketch the institutional terrains in Europe and the U.S. that have
shaped the division of labor in biomedical innovation. The research systems in the U.S. and Europe
are organized in qualitatively different ways, hence any comparison must be sensitive to variation on
multiple dimensions. We use the methods of correspondence analysis and large-scale network
analysis to capture these systemic differences. Methods and data sources are discussed in section III.
In section IV, we present the comparative analyses, beginning with relational data on collaborative
R&D projects. We look at R&D projects that were originated by public research organizations
(PRO),2 and subsequently developed by an array of different types of organizations. The distribution
shows U.S.-European variation, as well as numerous cross-national linkages. To better understand
these linkages, we examine the position of countries in an international network of collaborative
R&D projects. We then view these national patterns more closely through an assessment of patent
co-assignment relationships. We find, again, strong national- level patterns. We analyze these
national- level characteristics by looking at the focus of R&D at leading research organizations in
Europe and the U.S., matching patenting activity with therapeutic categories. These analyses point
out the heterogeneity of the U.S. system, on both scientific and organizational dimensions. We
examine this heterogeneity by mapping the evolution of interorganizational ties in the United States
at the regional level. We conclude our analyses with a fine-grained view of the Boston area, one of
the leading centers for biotech in the United States.
We assess the implications of our analyses in section V, stressing the twin importance of
integrative capacity (i.e. the ability to move back and forth from basic research to clinical
development) and relational capability (i.e., the ability to collaborate with diverse kinds of
organizations). We conclude by noting that while many analyses of the biomedical systems in the
U.S. and Europe highlight differences in financial and labor markets and note key policy differences

4
(for a review see Gambardella, Orsenigo, and Pammolli, 2000), we stress fundamental variation in
the organization of the upstream R&D process.
II. Trajectories of development in the U.S. and Europe.
The canonical explanation for differences in the rate of development of U.S. and European
biomedicine is straightforward, emphasizing first-mover advantage in the growth of small, research-
intensive U.S. biotechnology firms. Along with the biotech boom, emphasis has been placed on the
evolution of supporting institutions -- ranging from federal policy initiatives (e.g. the 1980 Bayh-
Dole Act) to the availability of venture capital, intellectual property (IP) law firms, and university
technology transfer. We think this story is accurate, but incomplete. We focus, in contrast, on the
upstream division of innovative labor. We highlight the importance of the underlying science and
the diversity of organizations involved in R&D activities. Using data on public-private R&D
relationships, we demonstrate that there are very different constellations of players in R&D networks
in Europe and the U.S., and that these participants are engaged in different kinds of research and
clinical activities. The contrasting stories are significant because our argument suggests that while
legal and financial reforms and the availability of venture capital are necessary, these elements alone
may not be sufficient to generate dense linkages between public research organizations and industry.
To foreshadow our argument, the United States is characterized by relationships between
U.S. public research organizations and firms located in dense regional clusters that span therapeutic
areas, cross multiple stages of the development process, and involve diverse collaborators. In
contrast, European innovative networks are characterized by sparser, more specialized relationships
among a more limited set of organizational participants located in national clusters. Both U.S. and
European networks are geographically clustered, then, but in quite different fashions. From these
disparate starting points, European and U.S. innovative networks branch out in divergent ways.
The science underlying biotechnology was developed in university and government
laboratories. The leading centers of research in the new molecular biology were dispersed widely
throughout advanced industrial nations.3 Initial technological breakthroughs – most notably Herbert

5
Boyer and Stanley Cohen’s discovery of recombinant DNA methods and George Köhler and Cesar
Milstein’s cell fusion technology to create monoclonal antibodies – occurred in Californian and
British universities. But from the outset, U.S. universities and academic scientists actively worked
to help create the biotechnology industry and reap rewards from their involvement (Liebeskind,
Oliver, Zucker and Brewer, 1996; Zucker, Darby, and Brewer, 1997; Mowery et. al. 2001).
Consequently, small science-based firms were first located in close proximity to key universities and
research institutes. In time, established pharmaceutical companies (EPCs) were also attracted to the
field, initially collaborating with biotech firms in research partnerships and providing a set of
downstream skills that were lacking in the R&D-intensive startups. Eventually, the considerable
promise of biotechnology led nearly every EPC to develop, with varying degrees of success, both in-
house capacity in the new science and a wide portfolio of alliances with small biotech firms (Arora
and Gambardella 1990; Gambardella, 1995; Henderson, Orsenigo, and Pisano, 1999).
The early development of dedicated biotech firms (DBFs) created an initial advantage for the
United States in biotechnology, as close contact between DBFs and universities became
commonplace by the mid-1980s. Important differences in the nature and level of support for
academic life science research have also played a key role in shaping the comparative advantage of
the U.S. system (Gambardella, et. al., 2000). 4 The structure of the research system and the strategies
pursued by funding agencies are crucially important. In the U.S., substantial R&D monies have been
administered through the NIH, which has supported significant interaction between the producers of
fundamental biological knowledge and those involved in clinical research and drug development at
public research centers and universities. Moreover, the U.S. biomedical research system is
characterized by numerous alternative sources of support, with selection mechanisms that
complement the NIH and act according to different principles (Stokes, 1997). These varied funding
sources permit diversity to be explored.
In Europe, funding has tended to be administered at the national level, with strongly
differentiated approaches apparent across countries. European funding patterns may have hindered
the development of a critical mass, especially in smaller countries. In many cases, resources have
either been spread among a large number of “small” laboratories, or they have been excessively
6
concentrated in the one or two centers of excellence. Support coming from the various European-
wide programs has only partially changed the situation. In addition, research funds are much less
likely to support integration between basic science and clinical development.
European biomedical research has also been considerably less integrated with teaching. The
relevance of the research-teaching nexus in fostering high quality scientific research and integrating
academic and industrial science should not be understated. In particular, the diffusion of molecular
biology into general training in many European countries is a relatively recent phenomenon. As
compared to the U.S., molecular biology research has tended to be confined to highly specialized
university and research institute laboratories (Morange, 1998). Particularly in Continental Europe,
policies have been targeted mainly to creating specific organizational devices to manage technology
transfer, such as science and technology parks. These intermediary institutions may even increase
the distance between universities and industry by introducing an additional layer to the relationship.
We argue that these institutional differences in funding, and the relationships among research,
clinical work, and teaching, shape the structure of university- industry R&D networks in the U.S. and
Europe.
Partly as a consequence of the institutional differences sketched above, the founding of new
biotechnology companies in Europe was more difficult. Rates of formation of start-ups are strongly
correlated with the strength of university and public research institutes in the underlying science
(Zucker et al, 1997). In the absence of small local firms, the large European companies turned to
small American partners to tap new competencies as they struggled to catch up. Given the head start
and faster rates of technological development in the U.S., European start-ups may have been pre-
empted by American firms. Moreover, the more dominant large European pharmaceutical firms
have had a pronounced effect on the development of European R&D networks, as these
organizations serve a ‘clearing-house’ function for the development of more specialized innovations
from national research clusters.
III. Data and Methods

7
Analyzing cross-national differences in research funding, organization, and practice, as well
as differential integration across R&D, clinical activity, and teaching is most effectively
accomplished with methods that visually represent these patterns of relationships. We are less
interested in the attributes of individual research organizations and much more concerned with the
linkages that structure innovation systems. Hence we utilize methods that capture these relational
features graphically. We use correspondence analysis and graph-drawing techniques to examine key
characteristics of life science knowledge networks. Correspondence analysis is an analytical
technique for studying the canonical correlations between two (or more) sets of categorical
variables.5 We perform correspondence analyses to visually represent correlations among
therapeutic patent classifications and public research organization assignees in a common two-
dimensional space.
We adopt a general analytical technique based on the theory of random fields (Ising, 1925;
Guyon, 1994) to graphically display collaborative networks at the national, cross-national, and
organizational level 6. Specifically, we applied the Fruchterman-Reingold (FR) algorithm (1991) to
simulate our network of collaborations as a system of interacting particles with repelling forces
( ) ),(/21, vuvu xxdcx =ρ between every pair of nodes u,v V∈ , and additional attracting forces
12
, /),()( cxxdx vuvu =α which are in place only between connected nodes, where ),( vu xxd is the
Euclidean distance of locations ux and vx of nodes u and v respectively. The parameter 1c is set to
nAc /2 , where A is the desired layout area, n is the number of nodes and 2c is an experimentally
chosen constant. The FR algorithm aims to minimize the force of each node, which is equivalent to
minimize the energy U of the overall random field model
[ ] −
=otherwise
connected are and nodes if )(, (x) ?
vu (x)?(x)axU
u,v
u,vu,vvu
More precisely, the FR algorithm is designed to find a stable configuration corresponding to a local
minimum1. In order to prevent the algorithm from resting in sub-optimal local outcomes and to
improve the fit of the final configuration, we run the algorithm with several randomly chosen initial 1

8
layouts. At the end, the drawings we present to illustrate our argument capture not only the pattern and
density of collaborative activity, but also are a meaningful indicator of the extent to which such
collaborations create actual clusters of tightly connected partners.
We draw on several complementary data sets to analyze European and U.S. research
organization- industry innovation networks for the period spanning 1988-1999. Two patent data sets
and two research collaboration data sets form the core of our analyses. The databases, referred to in
the tables and figures as “U.S. Biomedicine,” developed by Powell and Kenneth Koput, and by
Owen-Smith focus primarily on the United States. In their examination of the role research
universities play in the commercial field of the life sciences, they find 1,026 linkages between public
research organizations and dedicated biotech firms over the twelve-year period. For each
relationship, data are available on the purpose of the affiliation, its duration, and the identities of the
participants. These relationships represent formal contractual ties established between firms or
through the auspices of the United States Patent and Trademark Office. The larger database from
which these relationships are extracted focuses on dedicated biotechnology firms (Powell and
Koput) and Research One (R1) Universities as designated by the Carnegie Foundation classification
system (Owen-Smith, 2000). Both databases have been used extensively in previous research
(Powell et. al. 1996, Powell et al. 1999; Owen-Smith 2000, 2001).7
The biotech database covers independently operated, profit-seeking entities involved in
human therapeutic and diagnostic applications of biotechnology. 8 The sample includes 482 firms,
180 of which exist in all years over the period 1988-99. There were 229 entrants during the period,
and 91 exits overall. The database, like the industry, is largely centered in the U.S., although in
recent years there has been significant expansion in Europe. In 1999, 80% of the companies were
located in the United States, while 10% made their homes in Europe. The U.S. university database
focuses on the role that research-intensive campuses have played in biotechnology through the
specific lens of patent co-assignment. Drawing on a data set coded from bibliographic information
drawn from patents assigned to 89 R1 Universities from 1976-1998, we identified 181 co-assigned
pharmaceutical patents that were jointly owned by R1 universities and dedicated biotech firms or
non-university research institutes and hospitals.9

9
Pammolli and Riccaboni have developed two comprehensive data sets with extensive
coverage of Europe and the U.S.. The Pharmaceutical Industry Database (referred to as “PHID”)
developed at the University of Siena covers 4,358 collaborative R&D projects among industrial and
nonindustrial sources.10 For each R&D project, the PHID database distinguishes the organization
that originated a new pharmacologically active compound from the organization(s) that licensed that
patent for further development. In addition to this originator-developer distinction, each project is
classified according to the Anatomic Therapeutic Classification (ATC), which identifies
pharmacological actions and biological targets.11
The second database, referred to in the tables as “Patents,” draws upon 8,031 patents for
therapeutically useful compounds or processes issued by major world patent offices (U.S., U.K,
Germany, France, Japan, European, and the Patent Cooperation Treaty legal office) and assigned to
the 98 most prolific non- industrial research organizations worldwide.12 These 98 institutions
represent more than 70% of all non-industrial patents in this sample. Thus, there is a natural cutoff
point at 98, as the remainder of the distribution is very widely dispersed across hundreds of
organizations. These patents were also coded according to the same pharmacological classification
used for R&D projects.
Taken together, these four data sources enable us to develop a comprehensive and novel view
of patent co-assignment and collaborative networks involving European and U.S. biotechnology
firms, pharmaceutical corporations, and public research organizations. Our data are broad in scope
and involve thousands of relationships among multiple types of organizations, enabling us to map
qualitative differences in public-private R&D networks in the life sciences.
IV. Analyses: Cross-National Networks and Organizational Competencies in R&D.
We begin by presenting data on R&D projects generated by PROs and developed
collaboratively with other organizations.13 We distinguish the roles of originators and developers,
with the former responsible for the underlying basic science, focusing on the early stages of target
identification/validation and drug discovery, and the latter handling downstream stages of R&D and

10
subsequent manufacture and/or marketing. We identify originators as the institution that started the
R&D project and, typically, held the relevant patent. Note that a variety of organizations - - PROs,
DBFs, and EPCs - - perform the roles of developing, producing, and commercializing new
biomedical products.
[Insert Table 1 here]
The bulk of the collaborative projects occur within the U.S., while a much smaller number
are carried out in Europe. For our purposes here, we are somewhat less interested in the scale of
activity than in what kind of organizations are involved. In the U.S., dedicated biotech firms do the
lion’s share of the development work (nearly 55%) on PRO-originated innovations. When a U.S.
PRO turns to a European partner, the large multinational corporation is the dominant option. In
Europe, there are real differences in collaboration within and across nations. In local within-country
collaborations, European PROs turn to DBFs and other PROs. But when collaboration occurs across
European countries, the EPCs become the dominant partner. When European PROs reach across the
Atlantic, U.S. DBFs are the primary developers. The picture that emerges is one of very different
roles for small firms and large multinationals in Europe and the U.S.. The large pharmaceuticals are
responsible for the bulk of cross-national collaborations in Europe, while the small biotechs are the
key developers in the U.S. We turn now to an in-depth examination of these organizational
differences.
Organizational Underpinnings. Figure 1 represents the R&D projects data graphically, locating
the position of nations in a global network. In this figure the spatial position of the nodes represents
the relative centrality of individual nations in the international R&D project network. The size of the
nodes corresponds to the number of biomedical patents held by PROs in each nation. Thus, node size
reflects relative differences in the stock of patented biomedical knowledge held by PROs in each
nation, and indicates the volume of innovations generated by each national research system. The
numbers associated with the lines are counts of the number of cross-national R&D agreements. For
example, the close connection between the U.S. and the U.K. represents 441 individual R&D project
ties between PROs and commercial entities. Figure 1 portrays several key characteristics of the

11
international biomedical R&D projects network, reflecting relative national positions in terms of
both stocks and international flows of knowledge.
[Insert Figure 1 here]
Note the centrality and size of the American node. The large and diverse public research
system in the U.S. dominates global patenting and is central in the cross-national project network.
This centrality is reflected in the spatial location of the node (a result of Pajek’s clustering
algorithm), in multiple connections to otherwise isolated European nations (e.g. the Netherlands,
Spain, Belgium, and Denmark), and in high volume cross-national ties. Note that each international
link involving the U.S. represents a higher volume of individual R&D agreements than any of the
cross-national ties between other nations. Figure 1 clearly implies that the public research
organizations in the United States are structurally central and quantitatively dominant in cross-
national R&D project networks.
The nationally aggregated picture presented in Figure 1 does not tell the full story, however.
R&D projects and patented biomedical innovations stem from the work of scientists and clinicians in
organizations. Figure 2 examines the upstream collaborative network among individual PROs to
analyze relationships among organizations whose patenting activity drives the size of the nodes in
Figure 1. Figure 2 is based on patent co-assignment networks among public research organizations.
Each node is a university, research institute or hospital, and each tie represents two or more patent
co-assignments between the organizations. As was the case with Figure 1, the relative spatial
position of nodes is a reflection of the minimum-energy algorithm we employ using Pajek. Several
features stand out in this image.
[Insert Figure 2 here]
Consider first the regional and national clustering of organizations that we highlight with
dashed and dotted lines. The tightly clustered French, German and British research organizations on
the left side of the figure and the densely connected U.S. regions in the image’s upper right hand
quadrant are the result of minimum-energy network drawing techniques and not of arbitrary
placement. In addition to demonstrating the coherence of national and regional R&D systems, close
inspection of the patterns of patent co-assignment help explain the causes of the U.S. dominance
12
apparent in Figure 1. Note the organizational homogeneity of the French and German national
clusters, which do not include hospitals and have no identified universities.14 The United Kingdom
has a somewhat higher degree of organizational diversity, reflected by the presence of both
government and non-profit research and funding agencies. Contrast these relatively isolated and
homogeneous national clusters with the large and densely interconnected Boston region in the upper
quadrant of the figure, which is composed of tight, repeated interconnections among a diverse set of
PROs. Elite universities (Harvard, MIT), research institutes (the Dana-Farber Cancer Center), and
hospitals (Brigham and Women’s and Massachusetts General) play central roles in innovative
collaborations both within Boston and across U.S. regions.
Closely knit regional networks such as those found in Boston help account for the global
centrality of American PROs. But connections across U.S. regions (note for instance the ties
between Harvard, Stanford, and the UC system, connections from Dana Farber to the University of
Chicago, and from Brigham and Women’s hospital to Duke University) and co-assignment ties
linking geographically dispersed universities to the National Institutes of Health illustrate a public
research system that also reaches across regions and organizational forms. Recall that these
relationships represent patent-co-assignments, a particularly close form of R&D collaboration. We
argue that these systemic cross-national variations in the organization of early-stage research
collaborations explain national differences in biomedical commercialization above and beyond
variations in policies or later-stage technology transfer infrastructures. Consequently, we expect the
structural clustering of European nations and U.S. regions, and the consolidating effect of inter-
regional ties in the U.S., to result from characteristics of the science underlying these patent co-
assignment networks. To consider this assertion, we turn to correspondence analyses of the specific
therapeutic areas covered by public research institute patents in the U.S. and Europe. As we use the
term here, a therapeutic class is one of 102 specific disease areas on which a patented innovation
focuses. Thus we can distinguish both the scientific content and the specific target of patented
research in the U.S. and Europe.
The Organizational Division of Scientific Labor. Figures 3 and 4 display the outputs from
correspondence analyses relating U.S. and European public research organizations and the

13
therapeutic classes in which they patent. Correspondence analysis is applied here to capture
substantial differences between leading U.S. and European research institutions in terms of scientific
specialization. 15 As an output, correspondence analysis provides a graphical representation in a chi-
squared metric such that institutions with profiles close to the average are plotted near the origin
while more specialized profiles are plotted on the periphery. In Figures 3 and 4, the bold-faced labels
represent the most prolific PROs in terms of number of patents, while the lighter labels denote
therapeutic macro-classes. Institutions and therapeutic categories play dual roles, weighting
organizational profiles and rescaling the dimensions of the figures. Here again, the spatial
relationships among PROs and therapeutic classes are meaningful representations of quantitative
relationships. Inter-point distances are reflective of differences in institutional therapeutic profiles.
For example, if a given institution holds the same number of patents for each therapeutic category,
then it will be centrally located. In contrast, an institution specialized in one class will appear on the
periphery of the correspondence map.16
[Figures 3 and 4 Here]
Figures three and four demonstrate that while research is proceeding on substantively similar
topics across the continents, the division of organizational labor that produces it varies greatly. Note
the big differences in the types of core actors. In the European case (Figure 3) universities are
underrepresented. Instead, research institutes such as France’s Institute Pasteur and Germany’s Max
Planck and Max Delbruck centers play important roles. This centrality is not surprising, given the
preeminent role of these institutes in the history of molecular biology (Morange, 1998). In contrast,
Figure 4 reprises Figure 2, showing that the core actors in the U.S. innovation system are much more
organizationally diverse. Note the centrality of the U.S. government (the National Institutes of
Health complex), and Johns Hopkins University and the University of California System. But also
observe the key presence of elite research institutes such as Scripps and Salk, major research
hospitals and medical schools (Brigham and Women’s, Massachusetts General, and Baylor College
of Medicine), as well as elite research universities (MIT, Stanford, Pennsylvania, Duke and
Rockefeller). The clear implication is that the universe of central public research organizations is
much more heterogeneous in the U.S. than in Europe.

14
Observe the relative dispersion of therapeutic classes that appear in both Figures 3 and 4.
For Europe, Figure 3 indicates a fairly dispersed set of therapeutic classes, indicating that the
organizations associated with them are specialized innovators whose patents focus on specific sets of
therapies and biological targets. In contrast, therapeutic classes are not clearly separable in figure 4,
indicating that leading U.S. PROs hold patents that span multiple substantive areas. Finally,
consider the co- location of therapeutic classes and public research organizations in the two figures.
Figure 3 highlights not only specialization by organizational form, but also national specialization in
areas of innovation. There are two apparent clusters of research institutes and therapeutic classes.
The French institutes on the left hand side of Figure 3 are located close to each other and co- located
on a distinctive set of therapeutic classes relating primarily to infectious disease and AIDS research.
German research institutes, at the right hand side of the figure, are more involved with hereditary
cardiovascular diseases. The more dispersed and diverse British institutions, e.g. Cancer Research
Campaign (CRC), Medical Research Council (MRC), and the British Technology Group (BT) are
somewhat broader in focus but still cluster in therapeutic classes largely related to cancer research.
The greater breadth of the British research system, and its higher degree of diversity compared to
France and Germany, may explain its more central role in international R&D networks (recall Figure
1). Figure 4, on the other hand, tells a quite different story. In the U.S. national innovation system,
diverse public research institutions play the role of generalist innovators regardless of geographic
location, though the prevalence of Boston and California-based research organizations in the core
suggests the importance of regional agglomeration.
This difference in the science is a critical finding, suggesting that increases in scale alone will
not alter the focus of R&D efforts because organizations typically engage in local search, and would
continue to patent in those areas in which they are most skilled. In essence, then, we argue that one
reason for greater integration across and within U.S. regions can be found in the scientific overlap
among generalist patentors. Alterations in the scale of patenting activity without corresponding
shifts in this division of labor will not make the European system resemble its American counterpart.
Instead, we contend that mere increases in scale might deepen specialization and heighten
fragmentation among European national research systems.

15
One key message of the correspondence analyses is that national specialization in Europe
falls along scientific lines. In the U.S., there is abundant regional clustering, but, unlike the
European case, agglomeration is not driven by scientific specialization. Points of excellence develop
in both the U.S. and European systems, but in the Europe those clusters are limited to narrower
medical specialties and specific nations. The U.S. represents a very different profile, characterized
by diverse, substantively generalist research organizations connected both within and across key
regional clusters. To further our understanding of the organization of the U.S. national system, we
turn to an analysis of its growth out of a few key regional clusters.
A National System From Regional Origins. We have stressed the dual role of universities and
startup firms in biotechnology’s origins. Here, we present data that confirm the co- location of
universities, research institutes, and dedicated biotech firms in a small number of geographic regions
in the United States. In 1988, 73% of all collaborations between DBFs and PROs occurred in just
six areas: Boston, the New York metropolitan area, Seattle, San Diego County, the Bay Area, and
Texas (principally Houston).17 This phenomenon has been attributed to a range of intellectual,
economic, and social factors. Knowledge spillovers are clearly important, especially when novel
discoveries are involved. The availability of skilled labor and access to venture capital are critical as
well. Extensive social ties and reputational credibility catalyze further relationships, sustaining a
process of increasing returns. But how do initial locational advantages and rapid technological
development interact? In addition to institutional and labor market differences, we argue that the
structure of scientific knowledge in biomedicine plays a key role.
The field of the life sciences has witnessed a rapid expansion of knowledge that has taken
the form of a branching process, in which general hypotheses have given rise to sub-hypotheses, and
in turn to further inquiries (Orsenigo et. al., 2001). The structure of knowledge is hierarchical,
highly cumulative, and, in the industry’s early years, difficult to appropriate without close contact
with cutting edge academic researchers. But discoveries that were considered revolutionary at the
outset were soon incorporated into the standard toolkit of laboratory practice. As the skills became
widely accessible and new transversal technologies (e.g. genomics, combinatorial chemistry, and
high throughput screening) allowed for sophisticated production and screening of new molecular
16
structures absent contact with established research centers, DBF dependence upon prestigious
university researchers declined, and the central importance of network connections to local partners
waned.
We seek to explain how the evolution of the science has affected the network of collaborative
relationships. Several possibilities can be sketched, with different roles for various types of
institutions. For example, universities and firms that were first movers on the research frontier could
continue their close ties as the research moves into clinical development. But as initial successes are
achieved and publicized, many other participants are attracted to the field, both in the U.S. and
abroad. An alternative process could involve the initial entrants as the carriers of the field, moving
from co- localized relationships to more distant linkages with other firms and universities. This
process might be driven by a production logic, in which diffusion occurs with movement from
upstream R&D to downstream commercialization. A different trajectory would emphasize the
catalyzing role of geographic centers, stressing the capacity of initial entrants to identify new
knowledge and relevant skills developed outside their regions. In this scenario, the most well-
connected early entrants would be the most capable at accessing new ideas (Koput and Powell,
2001). Combined with the overwhelming initial importance of regional clusters, this latter pattern
implies that we should observe a process of de-localization of PRO-DBF ties over time. This
delocalization would be facilitated by the generalist research focus of core organizations highlighted
in Figure 4.
We begin by mapping alterations in the level of geographic clustering of PRO-DBF
relationships in the United States. The biotechnology industry’s early development in the U.S.
depended upon regional concentrations of co- located universities, firms, research organizations, and
key resource providers such as law and venture capital. Thus the earliest linkages between biotech
firms and public research organizations should be dominated by relationships in which both partners
are co-located in the same geographic region. If this sector evolves as established ‘local’ players
expand their set of potential partners and as new technologies become standard practice, then the
proportion of ties with regionally co-located or ‘local’ partners should decline over time.

17
Figure 5 presents both graphical and quantitative evidence for the process of industry
evolution. The figure on the left represents 1988, on the right, 1998. The triangles represent the six
most active regions where biotechnology originated, and their location on the pyramid reflects the
volume of the interorganizational linkages that connect them to other areas. The size of the triangle
reflects the number of ties within the region. Thus, Boston is both the most connected region
internally and the most extensively linked externally.
[Figure 5 here]
Note the aggregate decline in the percentage of local ties from a high of just over 40% in
1988 to a low of 8% in 1998. This decline occurs in the context of a rising volume of collaborations,
the number of ties active in 1998 is more than double the number a decade before. The combination
of an increasing number of collaborations and a decreasing proportion of local connections
represents the declining importance of ties within the initial regional clusters. Figure five indicates
that the growing volume of PRO-industry ties in U.S. biomedicine occurred in the context of a shift
in the distribution of those ties, such that the importance of connections between organizations co-
located in the same geographic region decreased, while the prevalence of network linkages between
organizations in different areas increased.
As noted above, the sharp decline in local ties within established regions could, in the context
of an aggregate increase in connections, result from three very different trajectories: (1) deepening
ties across established regions (e.g. links between triangles in Figure 5); (2) connections from
established regions to other areas of the nation (e.g. ties connecting nodes above the dashed lines to
those below it); or (3) increasing linkages involving two partners located outside established regions.
Figure 5 shows that the second of these options describes the bulk of changes in the regional
distribution of ties as the U.S. national network expanded over a ten-year period. While within
cluster and cross-cluster ties declined, and ties that do not involve established clusters showed only a
slight increase, the proportion of linkages involving a partner in an established cluster and one in
another region of the country more than doubled, accounting for about 54% of all connections by
1998.

18
We contend that this important structural shift illuminates a dual process of network
expansion that encompasses both increased scale and a shifting geographic distribution. In our view,
this transformation is enabled by both the generalist scientific role played by elite PROs within
established regional clusters (recall Figure 4) and by the integrative role of the National Institutes of
Health (recall Figure 2). Moreover, the regional clusters that gave birth to the U.S. national network
may have already contained the seeds of this distributional shift.
We turn to closer analysis of one U.S. regional ‘starting point’ to examine this possibility.
A persistent question we have entertained is whether the U.S. system is simply different andmore
diverse because of its larger scale. So we examine a single regional cluster at an early point in its
development to ascertain whether organizational diversity and integration between research and the
clinic were present from the founding of the field. Consider Figure 6, which presents two views of
inter-organizational linkages involving the Boston region, the most prominent regional cluster
apparent in Figures 2 and 5. Figure 6a represents only linkages internal to Boston in 1988. These are
the specific inter-organizational ties represented by the size of the Boston node in Figure 5. Figure
6b highlights all ties involving at least one partner in the Boston area in the same year. In both
cases, the shape of nodes represents the type of organization. Triangles are universities, circles are
DBFs and squares are research institutes or hospitals. Node size is a function of network degree
such that the largest nodes are the most connected. As with other Pajek representations, the location
of nodes relative to each other is a function of the strength and pattern of ties among them. Figure
6b adds shading to image to capture the geographic location of partners. Black nodes (of any shape)
are located in the Boston metro area. Gray nodes are located in one of the other established regional
clusters (Figure five’s triangles) and white nodes are located in other areas of the country.
[Figure 6 here]
In Figure 6a, the organiza tional diversity of the Boston area in 1988 is clear. Firms (e.g.,
Seragen, Genzyme, Cambridge Bio), universities (Tufts, Harvard, MIT, BU) research institutes
(Dana-Farber) and hospitals (Brigham and Women’s, Massachusetts General) are connected to local
partners. Nevertheless, that organizational diversity is apparent in a relatively sparse network of
connections that makes the Boston region look less clustered than our earlier analyses suggest. Two

19
key research institute and hospital players (Brigham & Women’s and Dana Farber) are isolated from
the central network corridor. Viewed through a Boston-only lens, the region appears composed of
loosely connected clusters surrounding MIT and Harvard. Organizational heterogeneity was
common in Boston in 1988, but the early density of the Boston network appears to be a function of
organizations located in other areas of the nation.
At a glance, Figure 6b looks more like a coherent regional network than Figure 6a. Three
important clusters (surrounding Dana-Farber, Harvard, and MIT) are brought into closer connection
by diverse organizations located outside of Boston. Consider the structural roles played by the UC
system, Stanford, Centocor (a Philadelphia-based DBF) and the Sloan-Kettering Cancer Institute
(located in New York City). These four organizations add a coda to our story of organizational
diversity. While Boston is internally diverse, the density of the region’s innovation networks is
greatly increased by the inclusion of diverse organizations from other geographic locations. Figure
6b captures a single regional ‘starting point’ and demonstrates that the diversity and density of
Boston’s networks is a function of both local depth and ties that connect multiple region. Note also
the key role played by Boston DBFs in reaching out to PROs located in other areas of the country.
Recall from Figure 5 that it is exactly this type of tie (indicated by connections from black nodes to
white nodes in Fig. 6b) that promotes the expansion of the U.S. national system. Unpacking the
structure of the PRO-DBF network in Boston at an early time point provides two key insights into
the development of the U.S. national system documented in Figure 5. First, the seeds of that
expansion were already present in one focal region as early as 1988. The lesson of Figure 6b is that
ties to key organizations in other parts of the country helped make Boston a major regional starting
point. Second, Figure 6b emphasizes the central role that small science-based firms played in
connecting with other areas of the nation. A quick glance at the local Boston nodes (black) in the
figure suggests that it is DBFs such as T Cell Sciences that connect to geographically distant PROs
rather than the elite PROs linking to distant firms.
In essence, the dual process we highlight reveals that a national U.S. biomedical network
grew from regionally clustered beginnings on the strength of overlapping scientific expertise, the
critical integrative effect of the NIH, and the expansive role played by small firms. In the European

20
case, the absence of strong scientific overlap (recall the national scientific specialization apparent in
Figure 3), a single key upstream institution such as the NIH, or rapidly-developing small firms
mitigate against this type of network expansion. These critical differences, we argue, have several
notable consequences. First the relative homogeneity of elite European PROs -- few European
universities and no European hospitals appear in either Figure 2 or Figure 3 -- suggests that in
addition to scientific specialization, European networks will be less integrated across the
development process than their U.S. counterparts, which include universities, hospitals and research
institutes. Second, the integrative role played by the U.S. National Institutes of Health occurs much
further downstream in Europe, as large pharmaceutical companies undertake the bulk of cross-
national European research collaborations (recall Table 1). Finally, there is a very different role for
small science-based firms in the U.S. and European contexts. Where Figure 6 shows that as early as
1988 it was small firms in Boston that were linked to disparate and geographically diffuse PROs,
Table 1 indicates that in Europe, small firms play a local role, deepening ties within scientifically
specialized national clusters rather than reaching across them.
V. Conclusions
Our analyses of university-industry interfaces in the U.S. and Europe emphasize the
importance of the division of innovative labor. We do not object to arguments that the United States’
first-mover advantage was critical in establishing the trajectory of the field. But we supplement this
explanation by stressing the diversity of actors involved and the varied roles played by scientific
specialists and generalists. Without recognizing these elements in the context of an evolutionary
trajectory shaped by distinct cultural and institutional contexts, European efforts to “catch up” to the
U.S. by mirroring established policies and arrangements will likely be misguided. Central to the U.S.
system are two key factors: relational and integrative capability. A wide diversity of U.S.
organizations have established protocols in place for fostering research collaboration. Moreover,
these alliances span organizations with different missions and serve to link basic research with
clinical development.

21
The institutional structure of biomedical research evolved quite differently in Europe and the
United States. The diversity of the U.S. public research system, a highly mobile scientific labor
force, and a host of regulatory and policy initiatives promoted widespread commercialization of
academically originated research, largely through the founding of small biotechnology firms. In
addition, the generalist technological role and integrative development profiles of U.S. public
research organizations have capitalized on scientific developments in molecular biology that more
closely link goal-oriented therapeutic research with fundamental biological investigation. European
universities developed competencies in molecular biology less quickly than specialized research
insitutes. The disciplinary focus of these institutes, combined with the centralizing effects of national
R&D funding infrastructures and regulatory contexts, serve to limit universities’ participation in
commercially-oriented R&D and concentrate R&D networks in specialized national clusters.
We also observe qualitively different paths in the development of local centers of excellence
in the U.S. and Europe. In the former case, generalist regional clusters developed around public
research organizations that integrated innovation and development work. These clusters planted the
seeds of accumulative advantage as the regions attracted talented researchers, high quality students,
and increasing shares of R&D funding, in addition to for-profit firms dedicated to the
commercialization of new technologies. In Europe, national clusters of specialists may also have
benefitted from accumulative advantage in research funding and talent, but the funding sources were
national rather than European, and research priorities and a community of local specialist firms may
have deepened already narrow competencies rather than enabling broad exploration. The role that
European pharmaceutical corporations played as clearinghouses for innovations developed within
these national clusters may have also mitigated against the broadening of regional scientific and
organizational competencies.
Finally, notable differences in the constellation of organizations able to capture and develop
innovations aided in pushing U.S. and European industries in different evolutionary directions. We
observe divergent roles played by public research organization originators, dedicated biotechnology
firms, and large pharmaceutical companies that contribute to disparate industry outcomes in Europe
and the United States. Our emphasis on the diversity of types of organizations and their multiple

22
roles stands as a corrective to policy attempts to develop high volume collaborations in Europe
through copying American policies. Our focus on the division of innovative labor implies that
European efforts to adopt U.S. policies should be directed more at generating integration between
basic research and clinical development and fostering extensive linkages among universities, small
firms, and the heretofore dominant public institutes and large pharmaceutical companies.
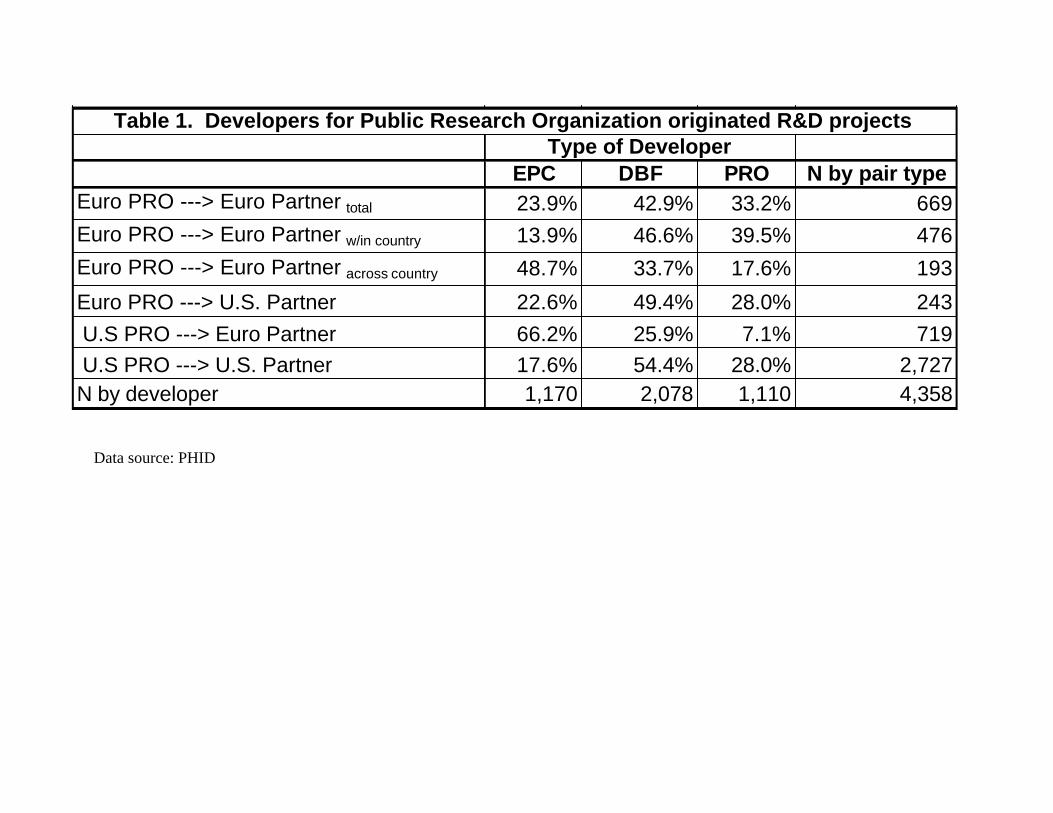
Table 1. Developers for Public Research Organization originated R&D projects Type of Developer
EPC DBF PRO N by pair typeEuro PRO ---> Euro Partner total 23.9% 42.9% 33.2% 669Euro PRO ---> Euro Partner w/in country 13.9% 46.6% 39.5% 476Euro PRO ---> Euro Partner across country 48.7% 33.7% 17.6% 193
Euro PRO ---> U.S. Partner 22.6% 49.4% 28.0% 243 U.S PRO ---> Euro Partner 66.2% 25.9% 7.1% 719 U.S PRO ---> U.S. Partner 17.6% 54.4% 28.0% 2,727N by developer 1,170 2,078 1,110 4,358
Data source: PHID

24
Figure 1. Cross-National Network of R&D Projects Involving PROs and Commercial Entitites, 1990-99
Data source: PHID, Patents

ARCH Arch Dev. Corp., Univ. of Chicago (IL) MINN University of Minnesota (MN) BETH Beth Israel Hospital (MA) MIT Massachusetts Institute of Tech. (MA) BETM Beth Israel Medical Center (MA) MP Max Planck Institut (Germany) BW Brigham and Women's Hospital (MA) MRC Medical Research Council (UK) CEDS Cedars-Sinai Medical Center (CA) MSIN Mount Sinai Hospital (Canada) CH Children's Hospital Medical Center (MA) NCU University of North Carolina (NC) CNRS Centre Nat. de la Recherche Sc. (France) NIH National Institutes of Health (MD) COL Columbia University (NY) NYU New York University (NY) COMM Commonwealth Sc. and Ind. Res. Org. (Australia) OREG University of Oregon (OR) CORN Cornell Research Foundation (NY) PENN University of Pennsylvania (PA) CSH Cold Spring Harbor Lab. (NY) PITT University of Pittsburgh (PA) DF Dana-Farber Cancer Institute (MA) PUR Purdue University (IN) DK German Cancer Institute (Germany) SCR Scripps Research Institute (CA) DUKE Duke University (NC) SFLU University of South Florida (FL) EMORY Emory University (GA) SK Sloan Kettering (NY) FH Fred Hutchinson Cancer Res. Center (WA) STAN Stanford University (CA) FLU University of Florida (FL) TEMPLE Temple University (PA) GSU Georgia State University (GA) TEX University of Texas System (TX) HARV Harvard University (MA) TJEFF Thomas Jefferson University (PA) IC Imperial Cancer Research Fund. (UK) TUL Tulane University (LA) IL University of Illinois (IL) UAB University of Alabama (AL) INSERM Institut National de la Santé et de la Rech. Médicale (France) UC University of California System (CA) IOWA University of Iowa (IA) UTAH University of Utah (UT) IP Institut Pasteur (France) UWA University of Washington (WA) JH Johns Hopkins University (MD) WA Washington University (MO) LUDC Ludwig Inst. for Cancer Res. (Switzerland) WAU Wisconsin Alumni Research Found. (WI) MEL University of Melbourne (Australia) WI Wistar Institute (PA) MGH Massachusetts General Hospital (MA) YU Yale University (CT) MICH University of Michigan (MI)
Australia
France
Germany
United Kingdom
Boston
New York
California
Figure 2. Organization Level Patent Co-Assignment Network for PROs, 1990-99 (Data source: Patents)

Figure 3. Correspondence analysis: Co-location of prolific European PRO patentors and therapeutic classes, 1990-99 LEGEND (most common classes) A – AIDS B – Blood diseases
CR – Oncological diseases CV – Cardiovascular diseases DE – Dermatological diseases DI – Diabetes GA – Gastrointestinal diseases GE – Genetic diseases HO – Hormonal Products IM – Immunological sys. diseases IN – Infective diseases IF – Inflammatory diseases M – Musculoskeletal diseases R – Respiratory Sys. diseases S – Sensory diseases
BTG – British Technology Group (UK) IP – Institut Pasteur (FR) CNRS – Centre Nationale de la Recherche Scientifique (FR) MP – Max Planck Institut (GER) CRC – Cancer Research Campaign (UK) MRC – Medical Research Council (UK) DK – German Cancer Institute (GER) INSERM - Institut National de la Santé et de la Recherche Médicale (FR)
(22 %)
(43.7 %)
*The percentages represent the proportion of inter- institutional variance in technological profile accounted for by the x and y axes.
*
Data source: Patents

27
Figure 4. Correspondence analysis: Co-location of prolific U.S. PRO patentors and therapeutic classes, 1990-99 LEGEND (most common classes) A – AIDS B – Blood diseases CR – Oncological diseases CV – Cardiovascular diseases DE – Dermatological diseases DI – Diabetes GA – Gastrointestinal diseases GE – Genetic diseases HO – Hormonal Products IM – Immunological sys. diseases IN – Infective diseases IF – Inflammatory diseases M – Musculoskeletal diseases R – Respiratory Sys. diseases S – Sensory diseases
BAY – Baylor College of Medicine MGH – Massachusetts General Hospital SALK – Salk Institute BW – Brigham & Women’s Hospital MIT – Massachusetts Institute of Technology SCR – Sripps Research Institute DF – Dana Farber NIH – National Institutes of Health SK – Sloan Kettering DUKE – Duke University PENN – University of Pennsylvania STAN – Stanford University JH – Johns Hopkins University ROCK – Rockefeller University TEX – University of Texas System UC – University of California System
(16.5 %)
(32.8 %)
*
*The percentages represent the proportion of inter- institutional variance in technological profile accounted for by the x and y axes. Data source: Patents

28
1988 1998w/in clusters 40.6% 8.3%across clusters 12.5% 8.3%to other regions 25.0% 54.2%among other areas 21.9% 29.2%N 210 515
Figure 5. A. Interorganizational Linkages by Region in the U.S., 1988
B. Interorganizational Linkages by Region in the U.S., 1998
Coherent regional clusters
Other areas
Data source: U.S. Biomedicine

29
Figure 6.
A: PRO – DBF ties internal to the Boston region, 1988
B: PRO-DBF ties internal and external to the Boston Region, 1988
UC
Stanford
Sloan_Kettering
Centocor
Triangles = Universities Circles = DBFs Boxes = Research Institutes/Hospitals
Black = Boston Region Gray = Other Coherent Region (e.g. Bay Area, NYC) White = Other Areas
Data source: U.S. Biomedicine

References
Albert R., H. Jeong, and A. Barabasi, 2000. Error and Attack Tolerance in Complex Networks. Nature 406 378-382.
Arora A., A. Gambardella. 1990. Complementarity and External Linkages: The Strategies of Large Firms in Biotechnology. J. Ind. Econom. 38 361-379.
-------. 1994. Explaining Technological Information and Utilizing It: Scientific Knowledge, Capacity, and External Linkages in Biotechnology. J. Econ. Behavior and Org. 24 91-114.
Arora A., A. Fosfuri, A. Gambardella. 2001. Markets For Technology, Cambridge, MA, MIT Press.
Arora A., A. Gambardella, F. Pammolli, M. Riccaboni. 2000. The Nature and the Extent of the Market for Technology in Biopharmaceuticals. Paper Presented at the “International Conference on Technology Policy and Innovation: Economic and Historical Perspectives”, Paris, 20-22 November 2000.
Batagelj V., A. Mrvar. 2000. Drawing Genealogies. Connections 21 47-57. Ben-David, J. 1977. Centers of Learning : Britain, France, Germany, and the United States. New York, McGraw-Hill. Carroll, J.D., P.E. Green, C.M. Schaffer. 1986. Interpoint Distance Comparisons in
Correspondence Analysis. J. Market. Res. 23 271-280. Clark B. R. 1995. Places of Inquiry. Research and Advanced Education in Modern
Universities. Berkeley, University of California Press. Fruchterman, T., E. Reingold. 1991. Graph Drawing by Force-Directed
Replacement. Software -- Practice and Experience 21 1129-1164. Galambos L., J. Sturchio. 1998. Pharmaceutical Firms and the Transition to
Biotechnology: A Study In Strategic Innovation. Bus. Hist. Rev. LXXII 250-278. Gambardella A. 1995. Science and Innovation. The U.S. Pharmaceutical Industry
During The 1980s. New York, Cambridge University Press. Gambardella A., L. Orsenigo, F. Pammolli. 2000. Global Competitiveness in
Pharmaceuticals: A European Perspective. European Commission, Brussels (http://dg3.eudra.org/pharmacos/comdoc_doc.htm).
Geiger R., 1988. Research and Relevant Knowledge: American Research Universities since World War II. New York, Oxford University Press.
Gittelman, M., 2000. Mapping National Knowledge Networks: Scientists, Firms and Institutions in Biotechnology in the United States and France. Ph.D. Dissertation, New York University.
Greenacre, M.J. 1984. Theory and Applications of Correspondence Analysis. London, Academic Press.
Guyon X., 1994. Random Fields on a Network. Berlin, Springer. -----. 1993. Correspondence Analysis in Practice, Academic Press, New York. Henderson, R., L. Orsegnigo, and G. Pisano, 1999. “The Pharmaceutical Industry and the
Revolution in Molecular Biology.” Pp. 267-311 in Sources of Industrial Leadership, D. Mowery, R.R. Nelson, eds. New York: Cambridge University Press.
Howells, J., McKinlay. 1999. Commercialization of University Research in Europe. Report to the Advisory Council on Science and Technology, Ontario, Canada.
Ising E., 1925. Beitrag zur Theorie des Ferromagnetismus. Zeitshrift Physik 31 235-258.

31
Koput K., W.W. Powell. 2001. Organizational Growth and Collaborative Capacity: Science and Strategy in a Knowledge-Intensive Field. Manuscript.
Lerner J., R. Merges. 1998. The Control of Technology Alliances: An Empirical Analysis of the Biotechnology Industry. J. Ind. Econ. 46 125-156.
Liebeskind, J., A. Oliver, L. Zucker, M. Brewer. 1996. Social Networks, Learning,
and Flexibility: Sourcing Scientific Knowledge in New Biotechnology Firms. Org. Sci. 7 428-443.
Link, A. 1999. Public/Private Partnerships in the United States. Ind. and Innov. 6 191-217. Morange M., 1998. A History of Molecular Biology. Cambridge, Ma, Harvard University Press. Mowery D., 1999. America’s Industrial Resurgence?: An Overview. Pp. 1-16 in U.S.
Industry in 2000: Studies in Competitive Performance. Washington, DC, National Academy Press.
Mowery D., R.R. Nelson (eds.). 1999. Sources of Industrial Leadership. Studies of Seven Industries. New York, Cambridge University Press.
Mowery, D., R.R. Nelson, B.N. Sampat, A.A. Ziedonis. 2001. The Growth of Patenting and Licensing by U.S. Universities: An Assessment of the Effects of the Bayh-Dole Act of 1980. Res. Pol. 30 99-119.
Orsenigo L., 1989. The Emergence of Biotechnology. New York, St Martin Press. Orsenigo L., F. Pammolli, M. Riccaboni. 2001. Technological Change and Network
Dynamics. Lessons from the Pharmaceutical Industry. Res. Pol.30 485-508. Owen-Smith, J. 2000. Public Science, Private Science: The Causes and Consequences of Patenting by Research One Universities. Ph.D. Dissertation, University of
Arizona. -------. 2001. New Arenas for University Competition: Accumulative Advantage in
Academic Patenting. In J. Croissant (ed.) Degrees of Compromise: Industrial Interests and Academic Values. New York, SUNY Press.
Pammolli F., M. Riccaboni, L. Orsenigo. 2000. Variety and Irreversibility in Scientific and Technological Systems. in Nicita A., U. Pagano. (eds.) The Evolution of Economic Diversity. London: Routledge.
Pavitt K. 2000. Academic Research In Europe, SPRU Working Paper, n. 43. Peterson J., M. Sharp. 1998. Technology Policy in the European Union. Basingstoke,
MacMillan. Powell W.W., K.W. Koput, L.Smith-Doerr. 1996. Interorganizational Collaboration
and the Locus of Innovation in Biotechnology. Admin. Sci. Quart. 41 116-145. Powell, W.W., K.W. Koput, L. Smith-Doerr, J. Owen-Smith. 1999. Network
Position and Firm Performance: Organizational Returns to Collaboration in the Biotechnology Industry. Pp. 129-59 in S. Andrews, D. Knoke. (eds.) Research in the Sociology of Organizations. Greenwich, CT, JAI Press.
Rosenberg N., R.R. Nelson. 1994. American Universities And Technical Advance In Industry. Res. Pol. 23 323-348.
Stokes D.E., 1997. Pasteur’s Quadrant: Basic Science and Technological Innovation. Washington DC, Brookings Institution Press.
Stuart T.E., H. Hoang, R.C. Hybels, 1999. Interorganizational Endorsements and the Performance of Entrepreneurial Ventures. Admin. Sci. Quart. 44 315-349.

32
Winkler G. 1995. Image Analysis, Random Fields and Dynamic Monte Carlo Models. Applications of Mathematics 27. Berlin, Springer.
Zucker, L.G., M.R. Darby, M.B. Brewer. 1997. Intellectual Human Capital and the Birth of U.S. Biotechnology Enterprises. Amer. Econ. Rev. 88 290-306.
1 The Single European Act provided, for the first time, a legal basis for European R&D programs (framework
programs) developed by the European Commission to complement national programs and funds. 2 We define PRO as any government research laboratory, public or private university, or nonprofit or public
research hospital or institute. 3 A survey of high impact publications in molecular biology and genetics between 1988 and 1992 lists the
Institute Chemie Biologique in Strasbourg, the MRC lab in Cambridge, UK, the Institute Pasteur in Paris, and the
Karolinska Institute in Stockholm among the most prolific research centers. See Science Watch, July/August
1993, Vol. 4, No. 7, Institute for Scientific Information. 4 Pavitt (2000) estimates that the resources devoted to academic research in the life sciences in the U.S. are 50%
larger than in Europe. 5 For illustration, see Greenacre, 1984, 1993. 6The theory of random fields provides a unified theoretical framework to cope with large systems of interacting
agents both in natural and social sciences. The reader interested in the relationship between the theory of random
field and graph drawing techniques is referred to Brandes and Wagner, 1997; Guyon, 1994 and Winkler, 1995. A
software package for large network analysis is available online at http://vlado.fmf.uni-lj.si/pub/networks/pajek.
Pajek has been used to analyze multiple types of large networks (Batagelj & Mrvar 2000; Albert, Jeong, &
Barabasi, 2000). 7 For detail on the Powell-Koput database see Powell et. al. 1996 (pp 124-129) and Powell et. al. 1999 (pp 136-
140). For detail on the Owen-Smith database see Owen-Smith 2000a (pp 59-66 and 76-81). 8 This data focuses on dedicated human biotechnology firms. Companies involved in veterinary and agricultural
biotech, which draw on different scientific capabilities and operate in a much different regulatory climate, are
omitted. We also exclude companies that are wholly owned subsidiaries of pharmaceutical and chemical
corporations. We do, however, include biotech companies that have minority or majority investments in them by
other firms, so long as the company is independently traded on the stock market. Our rationale for excluding both
biotech subsidiaries and large diversified corporations is that the former do not make decisions autonomously and
biotechnology may represent only a small portion of the latter’s activities. 9 To accomplish this we use a recent Office of Technology Assessment and Forecasting crosswalk between
United States Patent Office subject area classifications and 3 digit Standard Industrial Classification product
codes. Patent co-assignment represents shared ownership of intellectual property and, as such, indicates a
33
particularly close and potentially consequential form of inter-organizational collaboration. Co-assignment limits
each partner’s ability to unilaterally appropriate rents from intellectual property. Thus, it is not a relationship that
organizations (especially for-profit organizations) enter into lightly. Co-assignment is common in cases where
patents have multiple inventors who are employed by different organizations. 10 For further details about the PHID, see Riccaboni, 2000 (pp. 9-11 and 31-33). 11 The ATC classification has been developed and maintained since 1971 by the European Pharmaceutical
Marketing Research Association. The 3 digit ATC designation is a widely accepted standard for classifying
pharmaceutical products and is used by anti-trust associations around the globe. 12 Information on the patents is found in Patent Fast Alert, published by Current Drugs, Ltd., London, U.K.. 13 In this paper we focus only on the PROs as originators, and do not examine cases where DBFs and EPCs
are sources of new research opportunities, or cases where PROs were developers for PRO originators. 14 Scientists at the CNRS or Max Plancks may well have university laboratories, but the government institute
is identified as their primary affiliation on the patents. 15 Correspondence analysis allows us to deal simultaneously with organizational and scientific profiles of the
U.S. and European public research systems. For readers not familiar with dual scaling techniques, it may be
worthwhile to notice that correspondence analysis is essentially a variant of principle component analysis
tailored to categorical rather than continuous data (Hill, 1974; Greenacre & Hastie, 1987: 437). As with
principle component analysis, correspondence analysis does not provide cut-and-dried conclusions, instead it
is an explanatory technique which offers a framework for interpretation (Greenacre, 1993: 85). 16 In order to allow the same interpretation for therapeutic classes in the space defined by research organizations,
we rescaled organization scores as suggested in Carroll, Green, Schaffer (1986). As a result, the plots in Figures 3
and 4 that report both institutions and therapeutic categories in rescaled standard coordinates are symmetric
(Greenacre, 1993). 17 Those six regions contain 14.6% (13) of the universities, 14.3% (24) of the research institutes and hospitals, and
27.2% (131) of the DBFs in our sample. Clearly the aggregate concentration of ties in clusters is a function of
their concentration in a handful of organizations. We do not attempt to separate the effects of organizational and
geographic concentration of ties here. Instead, we content ourselves with noting their importance for a full
understanding of regional and industry development. We treat each of the clusters as coherent units for the
purposes of cross-national comparison, but we recognize that each area is itself a complex system of relationships
with a core and periphery and a distinctive evolutionary trajectory. The same factors that we expect to effect
industry development at the national level also play out within regions.