Embed Size (px)
Citation preview

Atlanta University CenterDigitalCommons@Robert W. Woodruff Library, AtlantaUniversity Center
ETD Collection for AUC Robert W. Woodruff Library
6-1-1965
A comparison of two methods of improving rate ofreading of college freshmenDaisy L. WoodsonAtlanta University
Follow this and additional works at: http://digitalcommons.auctr.edu/dissertations
Part of the Education Commons
This Thesis is brought to you for free and open access by DigitalCommons@Robert W. Woodruff Library, Atlanta University Center. It has beenaccepted for inclusion in ETD Collection for AUC Robert W. Woodruff Library by an authorized administrator of DigitalCommons@Robert W.Woodruff Library, Atlanta University Center. For more information, please contact [email protected].
Recommended CitationWoodson, Daisy L., "A comparison of two methods of improving rate of reading of college freshmen" (1965). ETD Collection for AUCRobert W. Woodruff Library. Paper 673.

A COMPARISON OF’ TWO METHODS OF IMPROVING
RATE OF READING OF COLLEGE FRESHMEN
A THESIS
SUBMITTED TO THE FACULTY OF THE SCHOOL OF EDUCATION,
ATLANTA UNIVERSITY IN PARTIAL FULFILLMENT OF THE
REQUIREMENTS FOR THE DEGREE OF
MASTER OF ARTS
BY
DAISY L. WOODSON
SCHOOL OF EDUCATION
ATLANTA UNIVERSITY
ATLANTA, GEORGIA
JUNE ,1965

DEDICATION
To my aunts, Miss Lula J. Harper and Mrs. Daisy C.
Flagg for their love, understanding, patience, and en
couragement, and to other members of my family for their
interest and help that sustained me during this period, of
research.
D.L.W.
~1 1

ACKNOWLEDGEMENTS
I would like to express my deepest gratitude and
appreciation to Dr. Lynette S. Gaines, advisor, and Mrs.
Miriam H. Jellins, co—advisor for their generous patience,
warm encouragement, and skillful guidance through the stage
of this research project.
To Mrs. L. B. Graves, Director of the Reading Pro
gram at Morris Brown College, I am deeply grateful for her
untiring willingness to cooperate in making the necessary
arrangements for this study.
I sincerely appreciate the encouragement given me by
my friends during this period of research.
I wish to express my sincere thaEiks to the twenty—
four freshman subjects of Morris Brown College, Atlanta,
Georgia.
iii

TABLE OF CONTENTS
Page
DEDICATION. • . . . . . , • . . . . • . . . . . . . . . . . . . . . . . . . . . . . . . . ii
ACKNO~L~~DGE~NTS. .. • • . . • . • • • ... . , . . . • • . . • • . . . . . . . • iii
LIST OF TABLES. . • • • . . . . a . • • . . . . . . . . . . . . . . . . . . . . . . . ix
Chapter
I. INTRODUCTION. . • • • • i.
Rationale. . . . • . . . . . • • • • • . . • . • a . • • • . • 1Evolution of the Problem............ 5Statement of the Problem,......,... 6Purpose of the Study..............., 6Definitionofperms,.............,.. 7Limitations of the Study............ 7LocaleoftheStudy................. 7Subjects, Materials, and Equipment., 8MethodofResearch..............•, 9Research Procedure..... a..aa a... •e.• 9Instruments Used in the Study....... 10Review of Related Literature....... 13
Factors Influencing Rate ofReading. . . . . . . . . . . . . . . . . . . . . . . .
Eye Movements in Reading......... 15The Book—Centered Approach and
the Machine Approach as Mehtodsof Improving Rate of Reading... 19
Summary of Related Literature,...... 26
II. SELECTION OF’ SUBJECTS, DESCRIPTION OFGROUPS INSTRUCTIONAL PROCEDURE, ANDTEST RESULTS.... .•. .. ..
Introduction. . . . . . . . . . . . . . . . . . . . . . . 28Selection of Subjects for the
Study. . . . . • • • . . • • a . . • . . . . . . . . . . . 29Distribution of I~te11igence
Quotients on the Otis QuickScoring Mental Ability Test(Gamma Form Em) . . . . . . . . . . . . . a • 29
iv
V
TABLE OF CONTENTS—ContinuedPage
Chapter
Comparison of IntelligenceQuotients on the Otis QuickScoring Mental Maturity Test(Gamma Form Em)................ 31
Comparison of the Median Scoreson the Iowa Silent ReadingTest (FormAm)................. 33
Concluding Statement Regarding Selection of Subjects.............. 35
Description of the Book—centeredApproach to Improved Rate ofComprehension........... .. .. ...... 36Introduction.. . . . . . . . . . . . . . . . . . . . 36Objectives.. . . . . . . . . . . . . . . . . . .
General Setting and Use of Materials.. . . . . . . . •. . . . . . . . . . . . . . .. 38
Examples of Specific ProceduresUsed With the Group............ 38
Description of the MaChine CenteredApproach to Improved Rate ofComprehension..................... 4~Introduction. . . . . . . . . . . . . . . . . . . . . 4~Objectives.. . . . a . . . . . . • . . . . . • . • . • 43General Setting and Use of Mate
rials. . . . . . . . . . . . . . . . . . . . . .. . . . 43Examples of Specific Procedures
Used With the Group............ 44Description of the Two Groups in the
Initial Phase of the Study....... 47General Description of the Sub
jects. . . . . . . . . . . . . . . . . . . . . . . . . . 47Eye—movement Photograpby......... 47Distribution of Rate Scores on
the Gilmore Oral Reading Test(Form A). . . . . . . . * . . . . . . . . . . . . . . 51
Comparison of the Rate Scores onThe Gilniore Oral Reading Pest(Form A). . . . . . . . . . .. . . . . . . . . . . . 53
Distribution of ComprehensionScores on the Gilmore OralReading Test (Form A).........~ 53
Comparison of the ComprehensionRaw Scores on the Gilmore OralReading Test(FormA).......... 56
vi
TABLE OF CON~ENTS—Contjnued
Chapter Page
Distribution of Rate Scoreson the Iowa Silent ReadingTest(FormAm)................ 56
Comparison of the Rate Scoreson the Iowa Silent ReadingTest(FormAm)................ 59
Distribution of ComprehensionScores on the Iowa SilentReading Test (Form Am)........ 60
Comparison of the ComprehensionScores on the Iowa Silent R0ad—ingTest(FormAm)............ 61
Distribution of Rate Scores onthe Diagnostic Reading Test(Form A)...................... 63
Comparison of Rate Scores onthe Diagnostic Reading Test(Form A)..... ... . . . •• • • •• • • • .. 65
Distribution of ComprehensionScores on the Diagnostic Reading Test (FormA)............. 66
Comparison of ComprehensionScores on the Diagnostic Read—ingTest(FormA)............. 68
Concluding Statement Regarding theDescription of the Two Groups inthe Initial Phase of the Study.. 69
The Intermediate Pest Results,.,,.. 70Distribution of Rate Scores on
the Iowa Silent Reading Test(Form Dm). . . . . . . . . . . . . . . . . . . . . 70
Comparison of Rate Scores on theiowa Silent Reading Test (FormDin)..... . . . •,•..... . . . . . . ....... 72
Distribution of ComprehensionScores on the Iowa Silent Read—ingPest(FormDM)..........0... 73
Comparison of the ComprehensionScores on the Iowa Silent Read—ingPest(FormDm)............. 75
Distribution~ia~ Scores on theDiagnostic Reading Test (Form G) 76
Comparison of Rate Scores on theDiagnostic Reading Test (Form G) 77
Distribution of ComprehensionScores on The Diagnostic Reading Test (Form~ 79

Vii
TABLE OF CONTENTS—Continued
Chapter Page
Comparison of the ComprehensionScores on the Diagnostic Read—ingTest(FormG)........,..., 80
Concluding Statement Regarding thePerformance of the Two Groupsin the Intermediate Phase ofthe Study. . . . . • • a a a . • , . • . • . a • • • 83
The Terminal Test Resülts.......... 84Distribution of Rate Scores on
the Iowa Silent Reading Test(Form Bill).. . . . . . . • . . . . . . . . . . . . 84
Comparison of Rate Scores onthe Iowa Silent Reading Test(Form Bul). . • . . . , • • • • • • • • • • • 88
Distribution of ComprehensionScores on the Iowa Silent Read—ingTest(FormBm)............ 88
Comparison of ComprehensionScores on the Iowa SilentReading Test (Form Bqi)........ 91
Distribution of Rate Scores onthe Diagnostic Reading Test(Form B) . • . . . • . . . . . . . . . . . . . . . 9~
Comparison of Rate Scores onthe Dia~nostio Reading Test(Form B).. .. ,•. .. a a ~. . . • . . . . . . 94
Distribution of ComprehensionScores on the Diagnostic Read—Test (FormB),..............., 95
Comparison of ComprehensionScores on the Diagnostic Rçad~Test (Form B)......,.......... 96
Concluding Statement Regarding thePerformance of the rJ~O Groups atthe Terminal Phase of the Study. 99
III. SUMMARY, CONCLUSIONS, IMPLICATIONS ANDRECOMMENDATIONS 102
Introduction. • • a a • . . . • . • . a • . . a • • .. • 104Basic Design and Methodology...... 104Summary of Basic Findings a. ..... . . a 106
Pre—Testing and Initial Phase ofStudy...... . ... . . . .. . . .. . . ..~. 106
Intermediate Phase of Study..... 109Terminal Phase of the Study..... 110Additional Findings—Comparison
of the groups at DifferentPhases of the Study........... ill
viii
TABLE OF CONTENTS—Continued
Chapter Page
Conclusions, . . . . . . . . . . . . . . . . . . . . . . , 116
APPE~IX.. . . . . . .. . . . . . . . . . . . . . . . . . . . . . . . . 119
BIBLIOGRAPHY. . . . . . . . 130
VITA...... .

LIST OF TABLES
Table Page
1. Frequencies, Percentages, and BasicStatistics Derived from Performancesof Groups on the Otis Quick ScoringMental Ability Test (Gamma Em),.......,. 30
2. Measures of the Difference Between Intelligence Quotients on the OtisQuick Scoring Mental Ability Test ForGroups X—l and Y—l....................., 3~
.3. Frequencies, Percentages and BasicStatistics Derived From Median ScoresMade by the two Groups on the IowaSilent Reading Test at the Beginningof the Experiment. . . . . . . . . . . . * . . . . . . . . . . 34
4. Measures of the Difference Between MedianScores on the Iowa Silent Reading Testfor Groups X—1 and Y—l.~................. 35
5. Examples of Procedures Used in RealizingCommon Objectives of the Two Groups.,.... 48
6. Frequencies, Percentages, and BasicStatistics Derived front Performancesof Groups X—l and Y—l on the GilmoreOral Reading Test, Form A—. InitialPhase . . • . . . . . . . . . . . . . . . . . . . . . . . . . . . . . . . 52
7. Measures of the Difference Between RateScores on the Gilmore Oral ReadingTest Form A for Groups X—l and Y—l...... 54
8. Basic Statistics and Distribution ofComprehension Scores on the GilmoreOral Reading Test Form A for GroupsX—l and Y—l — Initial Phase..........~.. 55
9. Measures of the Difference BetweenComprehension Scores on the GilmoreQral Reading Test Form A for GroupsX—l and y—i . . • . . . . . . . . . . . . . . . . . . . . . . . . . . 57
10. Basic Statistics and Distributions ofRate Scores on the Iowa Silent ReadingTest Form Am— Intial Phase.........~..,. 58
ix

x
LIST OF’ TABLES—Continued
Table Page
11. Measures of the Difference Between RateScores on the Iowa Silent ReadingTest Form Am for Groups X—l and Y—1..... 60
12. Basic Statistics and Distribution ofComprehension Scores on the IowaSilent Reading Test Form Am— InitialPhase......,............................ 6~
l3~ Measures of the Difference Between Comprehension Scores on the Iowa Silent Reading Test Form Am for Groups X—1 and Y—1.. 63
14. Basic Statisti~ and Distributions of RateScores on the Diagnostic Reading TestFormA—InitialPhase.................... 64
15. Measures of the Difference Between RateScores on the Diagnostic Reading TestForm A for Groups X—1 and Y—l............ 66
16. Basic S~ätistics and Distributioxs of ComprehensIon Sàores on the Diagnostic ReadingTestFormA—InitialPhase............... 67
17. Measures of the Difference Between Coinpre—hension Scores on the Diagnostic ReadingTest Form A for Groups X—l and Y—l....... 69
18. Basic Statistics and Distributions of RateScores on the Iowa Silent Reading PestForm Din— Intermediate Phase.............. 71
19. Measures of the Difference Between Scoreson the Iowa Silent Reading Test Form Dinfor Groups X—l and Y—1.................. 73
20. Basic Statistics and Distributions ofComprehension Scores on the Iowa SilentReading•~~~~St Form. Din— Intermediate Phase. 74
21. Measures of the Difference Between Comprehension Scores on the Iowa Silent Reading Test Form Din for Groups X—l and Y—1.. 77
22 Basic Statistics and Distributions of RateScores on the Diagnostic Reading TestForm G— Intermediate Phase......,.... ..... 78
xi
LIST OF TABLES—Continued
Table Page
23. Measures of the Difference Between RateScores on the Diagnostic Reading TestForm G for Groups X—l and Y—l........... 79
24. Basic Statistics and Distributions ofComprehension Scores~ on the DiagnosticReading Test Form G— Intermediate Phase... 81
25. Measures of the Difference Between Comprehension Scores on the Diagnostic Reading Test Form G for Groups X—l and Y—l... 8~
26. Summary of Initial and Intermediate Resultson the Variables of tne Diagnostic Reading Test.................................. 85
~7. Summary of Initial and Intermediate Resultson the Iowa Silent Reading Test........... 86
28. Frequencies, Percentages and Basic Statist2csDerived from Performances of Grou~X—~ andY—2 on the Rate Section of the Iowa SilentReading Test, Form Bm— Terminal Phase ... 87
29. Measures of the Difference Between RateScores on the Iowa Silent Reading TestForm Bin for Groups X—2—and Y—~............ 89
30. Basic Statistics and Distributions of Comprehension Scores on the Iowa Silent ReadingTest Form Bm— Terminal Phase............., 90
31. Measures of the Difference Between Comprehension Scores on the Iowa Silent ReadingTest Form Bin for Groups X—2 and Y—2....... 92
32. Frequencies, Percentages and Basic StatisticsDerived from Performances of Groups X—2and Y—2 on the Rate Seetion of the Diagnostic Reading Test Form B— Terminal 4iase~ 93
33. Measures of the Difference Between RateScores on the Diagnostic Reading TestForm B for Groups X—2 and Y—2............... 95
34. Frequencies, Percentages and Basic StatisticsDerived from Performances of Groups X—2and Y—2 on the Diagnostic Reading TestForm-B—Terminal phase,................... 97

xii
LIST OF TABLES—Continued
Table Page
35. Measures of the Difference Between Comprehension Scores on the Diagnostic Reading Test Form B for Groups X—2 and Y—2,. 98
36. Summary of Intermediate and Terminal Resultson the Diagnostic Reading Test.......... 100
37. Summary of the Intermediate and TerminalResults on the Iowa Silent Reading Test. 101

CHA~PTER 1
INTRODUCTION
Rationale
Today, despite the fact that there are other means of
mass communication in constant and wide use, reading is still
considered one of the most important means of communication.
Reading remains important because, unlike the newer media,
the reader retains control over the flow of ideas. The leader
can stop and reflect upon what has been read. There is more
reading done today than ever before, Our world is truly a
reading world. With more reading being done than in previous
time, it becomes necessary to be able to read more rapidly in
order to~cover larger amounts of reading matter.
Improving rate of reading is by no means a new trend.
Interest in increasing speed of reading was evident in pro
fessional literature of the period, 1920—1930,when studies
showed the possibility of improving speed of reading in a
relatively short period with gains reported in test scores
of comprehension. Around 1930 attempts were made to improve
rate and comprehension in college classes. At the University
of Kansas, the students considered the possibility of inproving
their own rate. They observed the characteristics of eye
movement and then the relationship of eye movements to

2
effective reading was discussed.’
Most educators are aware of the fact that inefficient
reading habits cause many students to fail in high school
and college. One of the most frequent problems found among
inadequate readers at the college level is an extremely~
rate of reading. This is in agreement with Hadley who noted
that a relatively small percentage of students have reading
speed and comprehension skills adequate for handling all
college assignments.2 In evaluating the college level read
ing program Parker found that seventy—five per cent of the
students listed rate as one of their major interests in the
program. Fifty—eight per cent listed comprehension.3
Various methods are used to improve reading rate.
The more traditional method involves the use of timed read
ing exercises. The individual reads a given selection of a
certain length for several minutes and then determines his
rate in words per minute~ The selection is usually followed
by a number of comprehension questions which determine the
‘Paul Witty, “Evaluation of Methods and Devices to improve Reading Rate and Comprehension,” Elementary English,mi (May, 1954), p. 260.
2L. S. Hadley, “New College Students Lack Study Techniques,” School and Society, LXXXV (November, 1957), p. 353.
3Walter R. Parker, Jr., “An Evaluation of the Effectiveness of a College—Level Reading Program.” (Unpublished Ph. D.Dissertation, University of North Carolina at Chapel Hill,1963).

3
degree to which the individual has comprehended what he read.
Another method attempts to increase rate of reading by train
ing eye movements. Some authorities believe that a good
reader makes few fixations and regressions and has a wide eye
span. In connection with this method certain mechanical
devices were invented and are used in many improvement pro
grams. Among the devices in wide use are the tachistoscope
and Controlled Reader. The tachistoscope is a device which
presents material for from 1/100 to 1 1/2 seconds. There is
usually time for one fixation and the reader must perceive
the words, phrases, or other material in that length of
time. The Controlled Reader presents material in a left—
to—right fashion and there is usually no time for regress~s.
With the increased interest in improving rate of read
ing many other mechanical devices in addition to those al
ready listed have been invented to aid in this process.
Many universities have developed “reading films” for high
school and college use. In general, these devices have been
placed into the following three categories: the tachistoscopes
which present numbers, letters, words, or phrases from 1/100
tO 1 1/2 seconds; the directional attack control techniques
which present continuous reading material in a timed left—
to—right fashion; and the accelerating devices which employ
some type of bar which moves down the page and dissuades
the reader from rereading.1
1iIelen M, Robinson and ~elenK. Smith “Rate Problems inthe Reading Clinic,” The Reading Teacher, X~T (May, 1962) pp. 421—426.

4
Within the last four years a newer approach to reading
has received a great deal of attention. This approach is a
result of the work of Evelyn Wood and is for the most part
concerned with improving rate of reading. As a result of the
“Wood Method” or “Dynamic Approach”, Reading Dynamics Insti
tutes were established in many of the larger cities of the
United States.
Those who advocate this approach claim that a person
can read an easy novel at a rate of five thousand to six
thousand words per minute. The more technical material can
be read at 2,500 words per minute. This method uses neither
machinery nor conventional eye movements. It trains the
eyes to move vertically down the center of the page. It has
been found that some Wood readers read down one page and up
the next and can see a page or two at a single glance. The
course consists of a three—hour session each week for eight
weeks. Some of Mrs. Wood’s students have been able to read
40 to 50 pages of unfamiliar material in one minute.1
The dynamic approach to reading has not been widely
accepted. Many experts feel that if anyone reads more than
800 to 900 words a minute he is skimming. It is felt that
it is physically and scientifically impossible to read at
thousands of words a minute.2
1The National Observer, November 23, 1964, p. 22.

5
The researcher feels that both practice materials and
mechanical devices can be used to increase rate of reading.
This study will seek to determine the extent of the improve
ment of rate of reading comprehension by use of mechanical
devices and practice materials. The assumptions are that
mechanical devices will be more effective in improving speed
for reading, but comprehension may suffer and that there
will be considerable gains in speed of reading for both groups.
Evolution of the Problem
Recently there has been an increased emphasis on speed
of reading. Reading programs were instituted in many public
schools, colleges and universities. With this increased
emphasis on improving rate of reading,nany mechanical devices
which claim to improve rate of reading have come into exist
ence.
Interest in this study evolved from the writer’s ex
perience with freshman students in their reading classes.
The reading rate of many of these studentswas very slow.
After using various practice materials and mechanical devices
to improve rate of reading, the writer became interested in
determining the relative effectiveness of these two methods
of improving rate of reading in college freshmen.
Contribution to Educational Research
It was hoped that this study would make the following
contributions to educational knowledge:

6
1. This study might provide information about improving rate of reading that will be of significance to other teachers.
2. It might provide specific information about theeffectiveness of the two methods of improvingrate of reading.
3. It might encourage others to do more detailedstudies in the area of rate.
Statement of the Problem
This problem was designed to determine the relative
effectiveness of the machine approach and the book—c~tered
approach as methods of improving rate of reading in two
groups of college freshmen.
Purpose of the Study
The major purpose of this study was to determine if
there was a difference between the student’s progress in
improving rate by using a book—centered approach and the
rate improvement of those who used a machine approach.
The study was based mainly on the Null Hypothesis.
More specifically, the purposes of this study were
as follows;
1. To determine if one method was more effectivethan the other in improving reading efficiency.
2. To determine if one method was more effectivein improving rate alone.
3. To determine if both methods were equally effectivewith any one group.
4. To compare the performance of the two groups interms of changes in rate.
5. To derive from the findings, implications andrecommendations which might lead to a better

7
understanding of methods of improving rate ofreading.
Definition of Terms
For the purpose of clarity certain terms used through
out the study are defined below:
1. Rate of reading—— the rate of comprehension ofprinted material.
2. MachIne approach—— employment of a variety ofmechanical devices to improve rate of reading.These devices include those that present continuous reading material in a timed left—to—right fashion and those which present materialfor very brief exposures.’
3. Book—centered approach—— employment of readingselections appearing in print. These seleótionscan be timed and usually contain comprehensionquestions at the end of the selection.2
Limitations of the Study
This study was limited to twenty—four freshman stu
dents at Morris Brown College, Atlanta, Georgia. It was
limited by the fact that the experiment lasted for only
ten weeks.
Locale of the Study
This study was conducted at Morris Brown College in
the Northwest section of Atlanta, Georgia. Morris Brown is
a four—year liberal arts institution and is a part of the
1George D. Spache, Toward Better Reading (champaign,Illinois: Garrard Publishing Company, 1962), p. 255.
2Waren C. Thompson, “A Book Versus Machine Experimentin Adult Reading Improvement,” College English, XV (May,1954), p. 471.

8
Atlanta University Center. It is a co—educational insti
tution and was founded in 1885. The enrollment totals more
than 900 students who come from twenty—six states and four
foreign countries.
Subjects, MaterialS, and Equipment
The subjects of this study were twenty—four freshman
students. These students were selected from those enrolled
in freshman reading classes during the first semester of
1964—65. All of the subjects except one were graduates of
high schools in the southeastern United States. The subjects
were enrolled in the usual freshman courses that are required
by the college. They were all full—time students and were
taking from 12 to 16 credit hours. There were nineteen fe
male and five male subjects and the average age was 17.5
years. None of the subjects were married.
The materials and equipment used in the study were:
1.. The Iowa Silent Reading Pests, Forms AM, DM, andBM.
2. The Diagnostic Reading Tests, Forms A, G, and B.
3. The Otis Quick—Scoring Mental Ability Test,Gamma Form Em.
4. The Gilmore Oral Reading Test, Form A.
5. The EDL Reading Eye—Camera
6. Mechanical devices such as the Controlled Reader,and tachistoscope.
7. Practice materials appearing in various workbooks.
9
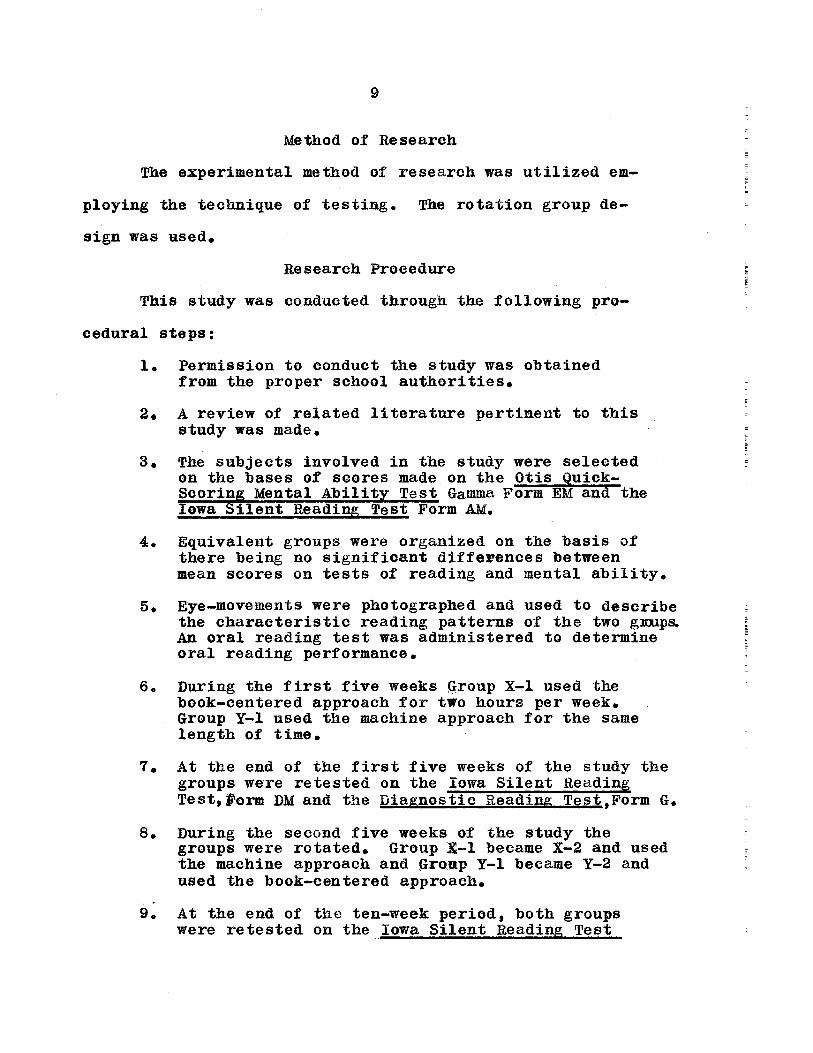
Method of Research
The experimental method of research was utilized em
ploying the technique of testing. The rotation group de
sign was used.
Research Procedure
This study was conducted through the following pro
cedural steps:
1. Permission to conduct the study was obtainedfrom the proper school authorities.
2. A review of related literature pertinent to thisstudy was made.
3. The subjects involved in the study were selectedon the bases of scores made on the Otis Quick—Scoring Mental Ability Test Gamma F&rm EM and theIowa Silent Reading Test Form AM.
4. Equivalent groups were organized on the basis ofthere being no significant differences betweenmean scores on tests of reading and mental ability.
5. Eye—movementS were photographed and used to describethe characteristic reading patterns of the two g~ips.An oral reading test was administered to determineoral reading performance.
6. During the first five weeks Group X—l used thebook—centered approach for two hours per week.Group Y—l used the machine approach for the samelength of time.
7. At the end of the first five weeks of the study thegroups were retested on the Iowa Silent ReadingTest,F’orm DM and the ~iagnostic Reading Test,Form G.
8. During the second five weeks of the study thegroups were rotated. Group X—l became X—2 and usedthe machine approach and group Y—l became Y—2 andused the book—centered approach.
9, At the end of the ten—week period, both groupswere retested on the Iowa Silent Reading Test

10
Form BM and the Diagnostic Reading Test Form B.
10. The data obtained from the tests were statistically treated and assembled into appropriatetables.
11. The findings, conclusions, implications andrecommendations stemming from the analysis and interpretation of the data were incorporated in thefinal thesis copy.
Instruments Used in the Study
The instruments used in this study are described below.
1. The Iowa Silent Reading Test is published by theWorld Book Company. The test measures three areasof silent reading abilities. The areas measuredare (1) rate of reading; (2) comprehension of woi~s,poetry sentences, paragraphs, and longer articles;and (aS skills used in locating information. Thetotal testing time is 45 minutes.
One reviewer in Mental Measurements Yearbook states
that:
The validity of the total score derivedfrom the Iowa Silent Reading Tests as a measureof reading ability depends on the extent towhich the subtests adequately sample the important skills involved in reading ability ofthe work—study type (which is the announcedobjective, according to the manual of directions). A conscientious effort has been madeto measure the skill of reading consideredmost important, and the reviewer is inclined tobelieve that the total score is as valid ameasure of the work study type of reading abilityas most reading tests are.
a. Diagnostic Reading Tests: Survey Section is published by the Committee on Diagnostic ReadingTests, Inc.
~Oscar Buros, The Third Mental Measurements Yearbook(New York: Rutgers University Press, 1948), p. 517.

11
This test is appropriate for grade 7 through thecéllege freshman year. It can be used as an independent test or as a screening test to identifystudents who need further testing. The surveysection has three subtests: (i) general reading,(2) vocabulary, and (3) comprehension.
The Survey Section gives a brief overview ofgeneral reading ability. The rate and comprehension scores are indicated to have reliabilitycoefficients of about .80. The validity of thevarious part scores can be determined by subjective judgement. The rate tests are prfbablyabout as valid as rate tests usually are.
3. The Otis Quick Scoring Mental Ability Test ispublished by the World Book Company. This testmay be used with high school and college students. The purpose of the test is to measure thethin~j:ing power or degree of maturity of the mind.The test yields a single score which summarizesthe 80 items.
This test is the result of over twenty—five yearsof research and development. The reliabilitycoefficients indicate a satisfactory level of consistency, and the information in the manual ofdirections gives evidence of the validity.
4. The Gilmore Oral Réadin~ Test is published by theWorld Book Company • This test provides measuresof accuracy of oral reading, comprehension ofmaterial read, and rate of reading. The test iscomprised of 10 paragraphs which form a continuousstory about episodes in a family group. The fivecomprehension questions which follow each paragraphare of the recall type.
In order to dtain statistical validity of the testthe author compared scores on his test with scoresobtained from other oral reading tests. The correlations of the Gilmore Oral Reading Test withtwo other oral teits ranged from .39 or moderatecorrelation to .80 or high correlation.2
1oscar Buros (ed.), The Fourth Mental Measurement Yearbook (Highland Park: The Gryphen Press, 1953), pp. 571—572.
2john V. Gilmore, Gilmore Oral Reading Test Manual ofDirections (New York: World Book Company, 1952), p. 5.

12
5. The Reading Eye—Camera is an instrument used todetermine the fundamental reading skills of anindividual. The subject reads a test selectionin accordance with his level of achievement. Ashe reads small bead.s of light are reflected fromhis eyes and photographed into the moving film,The comprehension of the subject is checked byuse of ten questions to which the subject answers“yes” or “no”. The film is analyzed on the basisof the objective data secured from over 5,000oases used in standardization.
In discussing the eye—movement photography, Taylor
concludes that:
Analysis of eye—mevement photographs.re—veals data that is objective, with factors thatare directly countable and measurable. Furtherobje~ti~it~ ~esuL .from~the~records directly the subject’s activity ratherthan a written or oral expression of thisactivity,1
6. The Controlled Reader is a filmstrip projectorequiped with a speed control of 0—1,000 wordsper minute. The reading material is presenteda line at a time in continuous left—to—rightmovement. Taylor and Frackenpohi concluded thatthe Controlled Reader more than satisfies therequirements for an effective reading instrument. The size, weight, ease of operation, andeconomy of purchase and maintenance make it avery useful classroom instrument. Today, theControlled Reader is being used in thousand~ ofclassrooms and hundreds of reading clinics.
7. The T~chistoscope involves the use of the tachis—toscopic teoh~ique or the presentation of a seriesof timed exposures. The subject is exposed to thewords, numbers, or phrases for a period ranging
1Stanford E. Taylor, Eye—Movement Photography with TheReading Eye. (Huntington, N. Y.: Educational DevelopmentalLaboratories, Inc., 1959), p. 3.
2Stanford E. Taylor and Helen Frackénpohl, ControlledReader Technique. (Huntington, New York: Educational Developmental Laboratories, Inc., 1958), pp. 2—5..

13
from 1 second to 1/100 of a second. The SVEGraded Word Phrases were used’with this instrument. In the SVE Teacher’s Manual it was pointedout that:
The tachistoscopic training widens perceptual span and also helps overcome faultyreading habits such as lip movement, inner vocalization and pointing; it also eliminatesword callers.’
8. Workbooks — the workbooks used in the book—centeredapproach were suited to the reading levels of thesubjects. They were written by people who are wellqualified to prepare such materials.
Summary of Related Literature
The literature pertinent to this study has been re
viewed under the following captions:. (1) factors influencing
rate of reading, (2) eye movements in reading, and (3) the
book—centered approach and the machine approach as methods
of improving rate of reading.
Factors influencing rate of readin~.
It seems expedient to give some consideration to factors
influencing rate of reading before becoming too involved in
methods of improvement. Most authorities agree that the dif
ficulty of the material and the purpose for which it is being
read exert a great deal of influence on the rate at which it
can be read with understanding.
1~elma E. Herr, SVE Teacher’s Manual (Chicago, IllsSociety for Visual Education, Inc.), p. 2.

14
Bond and Wagner consider the problem of speed of
reading as a problem of adjustment. A child should be
taught that there is no one rate at which all materials
should be read. He should understand that the rate of com
prehension depends upon the purpose for reading and the
1difficulty of the material being read.
Harris points out that an efficient reader varies
his rate of reading according to the nature of the reading
material. He lists the following as four main rates: (1)
skimming, (2) rapid reading, (3) normal reading, and (4)
careful reading.2
Similar convictions have been expressed by other in
vestigators. For example, McKee writes:
Speed in itself has no value. Every pupilshould learn to adjust his speed to reading tothe purpose for which he is reading and to thedifficulty of the material at hand. He should3use several speeds, each to be used as needed.
Similarly, Carrillo and Sheldon conclude:
The mature reader is the adaptable, versatile reader; he should be able to adapt hisrate of reading to the purpose with which heapproaches the printed page; and to the difficulty of the material.4
L. Bond and Eva Bond Wagner, r~~ch~n~ the child toRead (New York: The Macmillian Company, l9~O), p. 247.
2Albert J. Harris, Effective Te4ching of Reading (NewYork: David McKay Company, inc., l~ô2), p~ ilu.
3Paul McKee, The Teaching of Reading in the ElementarySchool (Boston: Hougn~on Mizzlin, L~4b), p. ILU.
4Lawrence W. Carrillo and William D. Sheldon, ~‘The Flexibility of Reading Rate,” The Journal of Educational Psycho1o~,xLIII (May, 1952), p. 300.

15
Braam is in agreement with the other authorities on
this point. In addition to listing the purpose for reading
and the level of difficulty of the materials as factors in
fluencing rate or speed of reading, he included prior know
ledge concerning the subject. The efficient reader will
vary his rate of reading if any one of these factors is
altered.1
Charles Letson conducted a study to determine whether
the material or the purpose had more influence on reading
rates. He used 601 college freshmen as subjects. He tested
each one on a two—part test. One part tested the flexibility
of rate in accordance with the difficulty of the material
and held constant the purpose; and the other tested the flexi
bility of rate in accordance with purpose and held constant
the difficulty. He found that the difficulty of the material
exerts a greater influence on rate than does the purpose.~
Eye Movements in Reading
Authorities have presented facts which show the im
portance of eye movements in reading. It is felt that
parents as well as teachers should know more about the basic
characteristics of eye—movements and how the patterns of
these movements relate to proficiency in reading.
~Leonard Bramm “Developing.~ and Measuring Flexibility i~Reading,” The Reading Teacher, XVI ~January, l~6~), pp. ~dT—5I.
2Charles T. Letson, “The Relative Influence of Materialand Purpose on Reading Rates,” Journal of Educational Research,LII (February, 1959), pp. 238—40.

16
Tinker has said that eye movement behavior is of
significance to the teacher, for it provides external signs
of the internal working of the mind during reading. The
nature of the eye—movement patterns reveals quite well how
the mind operates in trying to understand and grasp meanings
during reading. Growth in eye movement habits is usually re
vealed by an increase in the span of recognition or number of
words perceived in a single fixation, increase in rate of
recognition or time devoted to each fixation pause, and
regularity of the sequences of fixations or freedom from re—
gre ssi on • 1
The eyes move along a line of print in jumps. They
make pauses or fixations at which time word perception occurs.
Sometimes it is necessary to re—examine what has been read;
to do this the eyes make a backward move to the left. This
backward move is called a regression. When the eyes reach
the right end of a line they jump back to the left to the
beginning of the next line. This is called the return
sweep. Fixations account for about 94 per cent of the read
ing time and the other six per cent is spent in eye movement.
It is during the fixation pause that the reader actually
recognizes the letters, words or phrases. The size of the
‘Miles A. Tinker, “Eye—Movements in Reading,” Education,L~IX (May, 1959), pp. 575—579.

17
unit recognized during a fixation and the duration of the
fixation depend upon the reader’s ability to recognize
words and his familiarity with the material being read.
Spache reported that difficulty of the material, famil
iarity of the content, and format influence the patterns
of fixations.1
There are various reasons given for regressing while
reading. Sometimes the reader regresses out of habit or
lack of confidence. Bayle reported that regressions some
times occur when the flow of thought is interrupted be
cause of failure to recognize the meaning of a word or
failure to relate the meaning of the word to the condi
tions under which it is being used. He also suggests that
a certain amount of regression is desirable. Regressions
for verification, for phrase analysis, and for re’~examination
of a previous sentence seem to be useful.2 Hildreth re
ports that one researcher found that high school students
made on the average of 15 regressions per 100 words and
college students made ii.~
‘George D. Spache. “A Rationale for Mechanical Methodsfor Improving Reading,” Significant Elements in College andAdult Reading Improvement, Seventh Yearlook or the NationalReading Conference for College and Adults, (Forth Worth,Texas:. Texas Christian University Press, 1958), pp. 115—132.
2Evelyn Bayle, “The Nature and C3uses of RagressiveMovements in Reading,” Journal of ~perimenta1 Education,XI (Sept. 1942), pp. 16—36..
3Gertrude Rildreth, Teaching Reading (New York: HoltRinehart and Winston, Inc., 1958), p. 70.

18
Various suggestions have been made concerning the
relationship between eye—movement characteristics and
reading achievement. Some authorities believe that eye
movements are the major determinants of reading ability;
others believe that they are symptoms of good or poor
reading; and still others. believe that they may be
causes or symptoms or both. Early researchers concluded
that if eye movements were improved reading would improve.
Since poor readers had more fixations and regressions
than good readers it seeme4 logical that if the number of
regressions and fixations were improved reading would
improve
Tinker was one of the first to question the desir
ability of attempting to improve reading through exercises
designed to correct eye movements. He held that eye move
ments did not cause poor reading. Eye movements reflect
good or poor reading performance.2
Spache suggests that:
Eye movements reflect difficulties of thereader in sight recognition, word analysis,and comprehension. There is little reason tobelieve that irregular eye movements cause poorreading. Secondly, irregularities are presentin the eye—movement patterns of both good and
1Henry P. Smith and Emerald V. Dechant, Pshchology inTeaching Reading (Englewood Cliffs, N. J.: Prentice—Hall,Inc., 1961), p. 126.
2Miles A. Tinker, “The Role of Eye Movements inDiagnostic and Remedial Reading,” School and Society,XXXIX (February, 1934), pp.~ 147—148.

19
poor readers, particularly when they areattemptiag to read difficult or unfamiliarmaterial~
In recent years Evelyn Wood has developed an entirely
new approach to the reading pattern. Wood uses a vertical
approach in connection with her dynamic approach to reading.
This method abandons the conventional eye movements and
trains the eye to move vertically down the center of the
page. Some of her students read down on page and up the
next. One advocate of this approach contests the accepted
belief that the eyes cannot see while moving. He says that
the eyes are never still. This is in direct contrast to the
standard reading patterns which reveal that one reads only
during the fixation or eye—stop. Mrs. Wood has said that
eye—movement cameras are not fast enough to record her stu
dents reading patterns.2
The Book—Centered~ and the Machine Approach as
Methods of Improving Rate of Reading
For many years the machine approach to teaching read
ing has been questioned. Many research studies have indi
cated that machines are not necessary to a reading course
and that equivalent or better gains could be obtained with
out them.
1Spache, bc. cit.
2The National Observer, Nobember 23, 1964, p. 22.

20
Gates feels that most of these devices do expen
sively what can probably be done just as well, or better,
by merely opening a book and pushing a card down the
page at a speed to suit the reader’s ability and purpose.
He believes that the clever teacher can improve the
reading of children more by using materials to be found
in her classroom than by using any of the pacing instru—
ments with which he is familiar,’
These views seem to be in harmony with the results
of several research studies. In an experimental study
with the Reading—Rate Controller, Wooster reported that
no extra benefits seemed to accrue from training on the
Reading—Rate Controller in a course for college students.2
The control group using hook—centered work made greater
gains than did the two experimental groups who used a
rate controller in addition to the regular book—centered
work of the course.
Barry and Smith state that in a two—year study,
employing 2,637 ninth graders, no advantage was fund
from use of the State University of Iowa Reading Films.
1Arthur I. Gates, “Teaching Machines in Perspective,aElementary School Journal, LXII (October, 1961), pp. 1—13.
2George F. Wooster, “An Experimental Study of theReading —Rate Controller “ Journal of Educational Psychol—a~z~ XLV (November, l954~, pp. 421—426.

21
It is also worth noting that the two groups who used the
entire series of fourteen films made the smallest gain in
rate improvement in comparison with matched groups that
used such material as articles from the Reader’s Digest
or various books.1
Manolakes used officers in the Marine Corps as
subjects for his audy. He divided the subjects into ex
perimental and control groups. The variable element was
the exclusion of tachistoscopic training from the pro
gram of the experimental group. The investigator reported
that there was a significant difference between the two
groups in reading rate. This difference favored the ex
perimental group.2
Edwin and Mary Smith made an experimental study to
determine the value of the perceptoscope over a book—
centered course. There were two groups of students. The
reading classes were taught for eight weeks. In their
report they state that the machine group dropped in com
prehension and the book group advanced slightly. The
gains in speed were impressive for both groups.3
1Robert F. Barry and Paul E. Smith, “An Experiment inNinth—Grade Reading Improvement,” Journal of EducationalPsychology, XLV (November, 1954), pp. 407—13.
2Ge9rge Manolakes, ‘tThe Effects of TachistosoopicTraining in an Adult Reading Program.” Journal o~t AppliedPsychology, XXVI (December, 1952), pp. 410—12.
3Edwin H. and Mary P. Smith, “Speed Reading in theMachine Age,” College English, XX (February, 1959), pp.242—44.

22
In an experiment conducted at the Air Command and
Staff School, one experimental group participated in a
book—centered course which was devoted entirely to read
ing and working exercises in Norman Lewis’ How to Read
setter and FaSter. A second experimental group partici
pated in a machine—oriented course which was oriented
around the reading rate controller. The speed of the
book—centered group was significantly higher than that of
the machine group.1
In another study using the book—centered approach
and the machine approach as methods of improving rate of
reading similar results were reported. Allen, in a study
involving army personnel; found that the subjects pre
ferred a rate controller to the tachistoscope. However,
the overwhelming majority of participants did not believe
that the exercises on the mechanical devices were as
beneficial as the pratical work exercises for developing
ability to handle specific reading problems.2
Andrews reports a steady increase in reading speed
using practice material. There were fifty ten—minute
practice sessions during a school year. The practice
1Warren C. Thompson, “A Book Versus Machine Experiment in Adult R~ading~ Improvement,” College English, XV(May, 1954), pp. 471—72.
2Robert M. Allen, “Adult Reading Improvement at anArmy Service School,” School and Society, L~IV (August,1959), pp. 72—26.

23
consisted of reading easy material as rapidly as possible
for a minute and than counting the words read. The read
ing materials used were of low level of difficulty Andrews
suggests that improvement was due to the heavy emphasis
on rate,~
Even though there is considerable controversy as to
the value of many of the mechanical devices, they have be
come an important feature in many reading programs. A
growing number of modern reading specialists have dis
covered that certain mechanical aids, when carefully used,
make marked contributions to the development of reading
progress.
Speer emphasizes the current demand for accelerated
programs using mechanical devices and states that:
Accelerated reading using a variety ofinstruments has as its main emphasis thedevelopment of more rapid and efficientreaders, while at the same time effectivecomprehension or understanding is retained.
He concluded that:
All the instrumental techniques havedemonstrated their value at all grades andage levels above seventh grade...The successes, however, have encouraged many teachersto extend the work to lower grades.2
~Joe W. Andrews, “An Approach to Speed Reading,”English Journal, XLI (September, 1952), pp. 353—56.
2George S. Speer, “Using ~&echanical Devices Can Increase Speed of Reading,” The Nation’s Schools, XLVIII(October, 1951), pp. 45—48.

24
In Hoffman’s discussion of his experiment with the
Controlled Reader, he stated that classroom teachers in
dicated that the Controlled Reader experiment was very
valuable. The increase in rate for the Controlled Reader
experimental group was much higher than the increase for
the group that followed the traditional program. Notes
kept on individual cards indicated an increase in speed
of reading with a commensurate increase in comprehension.1
Forbes Bottomly conducted an experiment with 460
pupils to determine if a specific short—term reading pro
gram involving the Controlled Reader might be more effective
in boosting the reading speed and comprehension than the
regular developmental program. The data collected supported
the hypothesis that the major use of the Controlled Reader
should be in boosting reading speed and that its best use
is with average or better achievers who do not at first
read rapidly.2
Cosper and Kephart report that 38 college students
were given a reading program consisting of about 28 to 30
hours of training of which about half was on an accelerators
1Paul A. Hoffman, “Outcomes of Controlled Reading,”Clearing House, ~xvii (October, 1962) pp. 90—91.
2Forbes Bottomly, “An Experiment With the ControlledReader,” Journal of Educational Research, LIV (March, 1961),pp. 264—69.

25
The group tachistoscope was used from ten to fifteen
minutes per session. In addition a film was shown once
a week and every two weeks a difficult essay was read.
The reading rate of the group increased significantly
more than a comparable control group of 28 students.
Comprehension did not change significantly. Retesting
after 14 months showed that approximately 60 per cent
of the gains in speed were retained.’
In an experiment with Brooklyn College freshmen,
Wedeen used two experimental groups and one control
group, one trained with a rate controller and the other
with a book—centered approach. Both experimental groups
improved significantly in reading rate with the controller—
trained group gaining more than the book—centered group.2
In one study significant gains were made by com
bining machine and book—centered approaches. Evidence
of one method’s being more effective than the other was
not of great importance in the study. Before the training,
the 98 students had an average comprehension percentile on
the Iowa Silent Reading Test of 45. By the end of the
‘Russell Cosper and Newell C. Kephart, “Retention ofReading Skills,” Journal of Educational Research, XLIV(November, 1955), pp. 211—16.
2Shirley Uliman Wedeen, “Mechanical Versus Non—Mechanical Reading Techniques for College Freshmen,”School and Society, LXXXIX (April, 1954), pp. 121—23.

2 6:
program the average percentile rank had increased to 96.
The numbers of words read per minute increased from 212
to 570. Eye movement photographs showed that the fixa
tion pause had decreased and the span of recognition
had increased.’
In an effective program there are usually machine
practice and workbook exercises. When the equipment is
available the procedure should include some tachistoscope
practice and some controlled reading, but the major em
phasis should be on a well—motivated practice sessions
stressing both rate and comprehension. There is no
reason to consider controlled reading superior to the
timed practice materials. The methods which do not re
quire any special type of apparatus seem to give results
similar to those obtained by use of elaborate equipment.2
Summary of Related Literature
The literature reviewed with relevance to this study
may be summarized as follows:~
‘Earnest A. Jones. “A. Small College Reading Progran~Techniques and Procedures in College and Adult Reading Pre—grams, The Sixth Yearbook of the Southwest Reading Conferencefor College and Universities, (Fort Worth, Texas: TexasChristian University Press, 1957), pp. 7—15.
2Albert J. Harris, How to Increase Reading Ability(New York: David McKay Company, Znc. 1962), p. 538.

27
1. The difficulty of the material and the purpose for which it is being read influencethe rate of reading.
2. There is no one rate at which all materialsshould be read.
3. There is considerable controversy as to thevalue of mechanical devices as aids to improving reading.
4. An effective reading program should employboth book—centered and machine methods ofimproving rate of reading.
5. Authorities do not agree as to whether onemethod is more effective than the other inimproving rate of reading.
6. The eyes move along a line of print in ajerky fashion.
7. Eye movements are characterized by fixations,regressions and return sweeps.
8. There is a relationship between eye—movementpatterns and reading performance, but thereis disagi~ment as to whether faulty eye—movement patterns are causes or symptoms ofpoor reading.
These basic findings from the literature were of
invaluable assistance to the writer in planning and
executing the procedures outlined in the following chapter.

CHAPTER II
SELECTION OF SUBJECTS, DESCRIPTION OF GROUPSINSTRUCTIONAL PROCEDURE, AND TEST RESULTS
Introduction
In accordance with the purposes of the study
two methods of improving rate of reading were employed,
the book—centered and the machine—centered approaches.
After intensive review of related studies, the writer
was eager to determine if one of these approaches
would be more effective than the other in improving
rate of reading.
~This chapter will present the procedure through
which this experimental study was conducted. The
following information will be presented: (i) selection
of subjects, ‘(a) description of instructional proce
dures, (3) description of the two groups at the initial
phase of the study, (4) intermediate test results, and
(5) terminal test results.
This study was conducted for a ten week period
during the first semester, 1964—65. It extended from
October, 1964 to December, 1964. The experimental
method of research utilizing the rotation technique was
used. Twenty—four freshman students were involved in
the study, and each group spent five weeks with one
method and five~~ weeks with the other method.

29
During the first period Group X—l was taught by
the book—centered approach and Group Y.--l was taught by
the machine approach. The groups were reversed after the
intermediate testing period; Group X—l became Group X—2
and Group Y—l became Y—2. The same teaching procedures
were used during both experimental periods.
Selection of the Subjects for the Study
During the first week of the first semester, 1964—
1965, the students were administered the Otis Quick
Scoring Mental Ability Test (Gamma Form Em), and the Iowa
Silent Reading Test (Form Am). The subjects were selected
on the basis of their performance on these two tests. The
.IQ scores of the subjects ranged from 82 to 116. The
scores of the Iowa Silent Reading Test ranged from 157
with a grade equivalent of 9.0 to 168 with a grade equiv
alent of 10.0.
Distribution of Intelligence Quotients on the Otis Quick
Scoring Mental Ability Test (Gamma Form Em).
It may be observed in Table 1, page 30, that the
subjects in Group X—l indicated ~ range of 27 with a low
score of 82 and a high score of 108. There was a mean of
99.25, a median of 100.00, a standard deviation of 6.84,
and a standard error of the mean of 2.07. Four or 33.33
per cent of the subjects scored above the mean, four or
33.33 per cent scored below the mean, and four or 33.33

30
TABLE 1
FREQUENCIES, PERCENTAGES, AND BASIC STATISTICS DERIV~FROM PERFORMANCES OF GROUPS ON THE OTIS QUICK SCORING
MENTAL ABILITY TEST(GAMMA EM)
Scores Group X—1 Group Y—1Frequency Percentage Frequency Percentage
114—116 0 1 08.33
113—115 0 0
108—110 1 08.33 1 08.33
105—109 2 16.67 1 08.33
102—104 1 08.33 1 08.33
99—101 4 33.33 2 16.67
96—98 1 08.33 1 08.33
93—95 2 16.67 3 25.00
90—92 0 0
87—89 0 2 16.67
84—86 0 0
81—83 1 08.33 0
Mean 99.25 99.01
Median 100.00 98.50
s 6.84 7.86
S.E. 2.07 2.38

31
per cent of them scored within the mean class interval.
For this group the intelligence quotients were relatively
close in distribution but tended to shift slightly toward
the upper end of the distribution; in the test manual it
was stated that the Gamma IQ has the same significance as
an IQ derived from the Binet Scale. Therefore, a mean
Gamma IQ of 99.25 would be given a rating of normal or
average.1
The subjects in Group Y—l indicated a range of 30
with a low score of 87 and a high score of 116. There
was a mean of 99.01, a median of 98.50, a standard de
viation of 7.86, and a standard error of the mean of 2.38.
Four or a3.33 per cent of the subjects scored above the
mean, six or 50.00 per cent scored below the mean and two
or 16.67 per cent of them scored within the mean class in
terval. The distribution of intelligence quotients above
and below the mean was even, with slightly more scatter
than Group X—1. The mean score was equivalent to an in
telligence level of Normal or Average.
Comparison of Intelligence Quotients on the Otis Quick
Scoring Mental Maturity Test (Gamma Form Em)
The data in Table 2, indicated the following re
sults: The mean score for Group X—l was 99.25; for Group
‘Lewis Terman and Mead Merrill, Stanford—Binet In...telli~enoe Scale. (Boston: Houghton Miffun Company,1962), p. 18.
3a
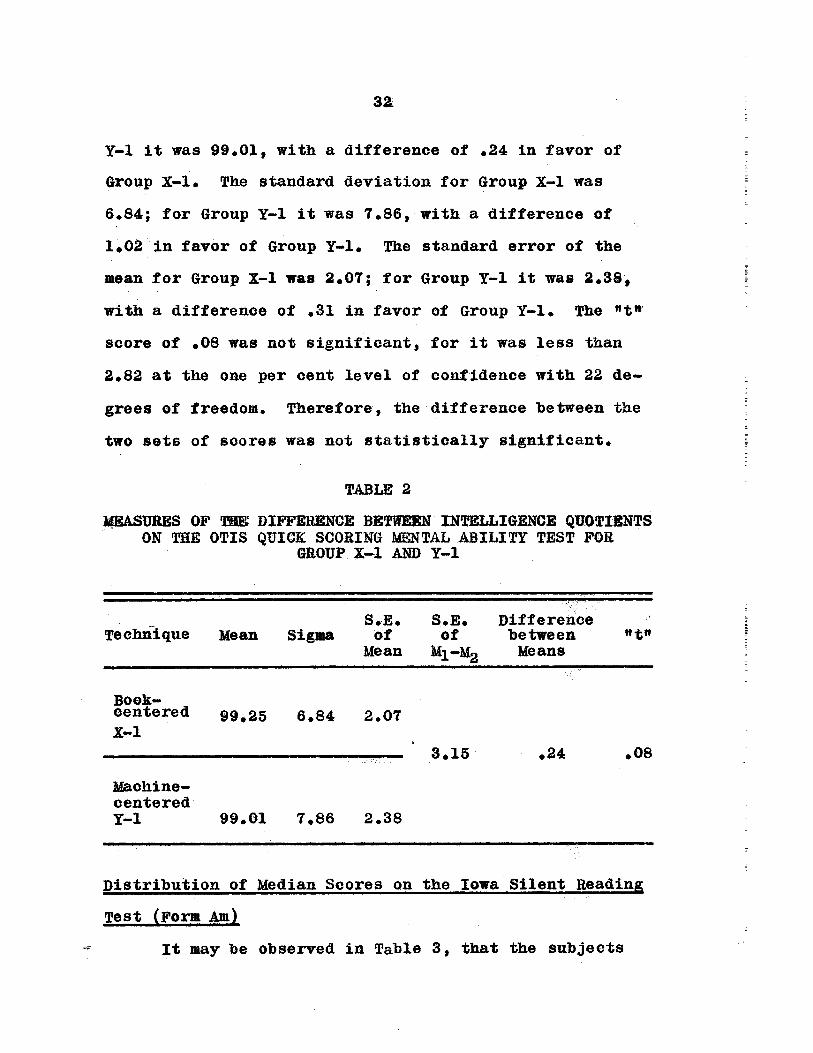
Y—1 it was 99.01, with a difference of .24 in favor of
Group X—l. The standard deviation for Group X—1 was
6.84; for Group Y—l it was 7.86, with a difference of
1.02 in favor of Group Y—l. The standard error of the
mean for Group X—1 was 2.07; for Group Y—1 it was 2.38,
with a difference of .31 in favor of Group Y—1. The “t”
score of •08 was not significant, for it was less than
2.82 at the one per cent level of confidence with 22 de-.
grees of freedom. Therefore, the difference between the
two sets of scores was not statistically significant.
TABLE 2
MEASURES OF 1~E DIFFERENCE BETw~KN INTELLIGENCE QUOTIENTSON THE OTIS QUICK SCORING MENTAL ABILITY PEST FOR
GROUP Xl AND Y—i
S.E. S.E. DifferenceTechnique Mean Sigma of of between
Mean M1—M2 Means
Book—centered 99.25 6.84 2.07x-1
~ 3.15 .24 .08
Machine-centeredY—1 99.01 7.86 2.38
Distribution of Median Scores on the Iowa Silent Reading
pest (Form Am)
It may be observed in Table 3, that the subjects
33
in Group X—l indicated a range of 12 with a low score of
157 and a high score of 168. There was a mean of 161.25,
a median of, l61.~0, a standard deviation of 3.38, and a
standard error of the mean of 1.02. Six or 50.00 per
cent of the subjects scored above the mean, six or 50.00
per cent scored below the mean, and none of the subjects
scored within the mean class interval. The distribution
of scores above and below the mean was even, and the mean
score was equivalent to grade’ 9.8.
The subjects in Group Y—l indicated a range of 11
with a low score of 158 and a high score of 168. There
was a mean of 164.33, a median of 165.10, a standard de
viation of 3.45, and a standard’ error of the mean of 1.04.
Comparison’ of the median scores on the Iowa Silent Reading
Test (Form Am)
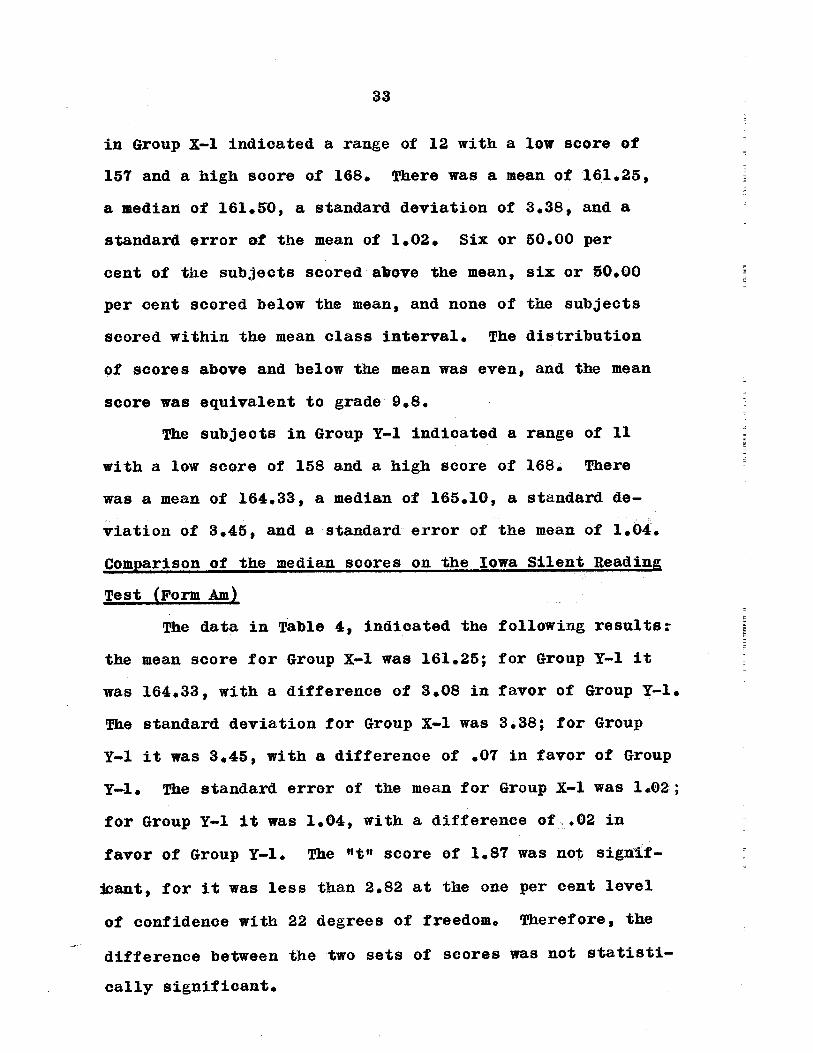
The data in Table 4, indicated the following results
the mean score for Group X—l was 161.25; for Group Y—l it
was 164.33, with a difference of 3.08 in favor of Group Y—l.
The standard deviation for Group X—l was 3.38; for Group
Y—1 it was 3.45, with a difference of .07 in favor of Group
Y—1. The standard error of the mean for Group X—1 was 1,02;
for Group Y—l it was 1.04, with a difference of .02 in
favor of Group Y—l. The “t” score of 1.87 was not signif—
~ant, for it was less than 2.82 at the one per cent level
of confidence with 22 degrees of freedom. Therefore, the
difference between the two sets of scores was not statisti
cally significant.

34
TABLE 3
FREQUENCIES, PERCENTAGES AND BASIC STATISTICS DERIVEDFROM MEDIAN SCORES MADE BY THE TWO GROUPS ON THE
IOWA SILENT READING TEST AT THE BEGINNINGOF THE EXPERIMENT
Scores - Group X—1 Group Y—1Frequency Percentage Frequency Percentage
168 1 08.33 3 25.00
167 0 1 08.33
166 0 0
165 0 5 41.67
164 3 25.00 0
163 2 16.67 0
162 0 0
161 0 0
160 1 08.33 1 08.33
159 1 08.33 0
158 2 16.67 2 16.67
157 2 16.67 0
Mean 161.25 164.33
Median 161.50 165.10
s 3.38 3.45
S.E. 1,02 1.04

3,5
TABLE 4
MEASUIZES OF TUE DIFFERENCE BETWEEN MEDIAN SCORESCN THE IOWA SILENT READING TEST FOR
GROUP X-1 AND Y-1
S.E. S.E. DifferenceTechnique Mean Sigma of of between
~ Mean Mean Moans
Book—centeredX—l 161.25 3.38 1.02
1.65 3.08 1.87
Machine—centeredY—1 164.33 3.45 1.04
Concluding Statement Regarding Selectionof Subjects
Through use of measures of intelligence and
average reading ability the two groups were found to be
of similar capacity and skill in these areas. It was
concluded, furthermore, that whatever tested differences
occurred between the two groups were merely chance
variations, As a result of these observations it was de
cided, also, that the rotation design presented would be
highly appropriate for this study.
Following the descriptions of the book— and machine—
centered approaches the initial, intermediate, and final
test results of the experiment are presented through use
of the same statistical measures employed in the selec
tion of subjects.

36
Pre—tests Selection of Subjects
Initial Pests
Figure l.——Sketch of the Rotation Method Designused in this study.
Description of the Book—centered~Approachto Improved Rate of Comprehension
Introduction
The book—centered approach to improving rate of
comprehension was used with both groups. This method
consisted of the use of timed exercises from various
practice materials.
In the introductory lesson an attempt was made to
give the students some insight into the area of rate of
reading comprehension. Through teacher lecture and
pupil—teacher discussion, the following questions were
Final Tests

37
answered: (1) What is rate of reading? (2) What are
some reasons for improving rate of reading? (3) what
are some factors which influence rate of reading? and
(4) What are some methods of improving rate of reading?
During this period the students were also instructed
as to how records were to be kept. They were made aware
of the fact that while rate was important they were not
to sacrifice comprehension for rate. It was made clear
to them that this work was not to be considered a con
test; they were not competing with each other. They
were told that each was competing with himself and that
through the use of their individual records they could
see their improvement and strive to do better with each
succeeding lesson. The materials to be used were intro
duced during this introductory period.
Objectives
The objectives of the lessons using the book—
centered approach were as follows:
1. To develop an aggressive approach toward reading.
2. To induce the reader to look at a group ofwords, react to it quickly, and pass onimmediately to the next group.
3. To increase perceptual span by developing skillin reading in thought units or phrases.
4. To increase rate of comprehension.
5. To increase vocabulary.

38
General. Setting and Use of Materials
An effort was made to make the physical atmosphere
as comfortable as possible. The room temperature, venti
lation, and lighting were properly adjusted. The stu
dents worked at tables. The setting for the work was not
a highly formal one. The subjects were always encouraged
to ask questions and to express their ideas. The materials..
consisted of workbooks, mimeographed exercises, and record
forms. The workbooks that were used were all appropriate
to the reading levels of the students. The objectives
were kept in mind in selecting the materials to be used.
Examples of Specific Procedures Used With the Group
The examples of the procedures used with this group
are organized according to the objectives listed earlier.
The examples of procedures that were used in realizing
common objectives to both groups may also be observed in
the table on page 48..
Objective one, to develop an aggressive approach
toward reading was accomplished through lecture and dis
cussion. The statement was made that reading is an active
rather than passive activity. This lead to a discussion
of what is meant by an active reader. The perceptual
process was described. The students came to realize that
in the perceptual process, the reader perceives a group
of words and reacts to it by attributing meaning to the

39
symbols. This meaning is based on past experiences so
therefore, the activity of thinking is involved in
reading.
To help the students understand how different
types of materials call for different rates of reading,
the students were assigned both informational and amusing
selections to read as timed exercises. They usually
found that they had better comprehension of informational
material when they read a little slower than for amusing
or pleasurable material. They were told that they had to
know when to “shift gears” in reading.
Objectives two and three were accomplished by using
the same exercises. There was a discussion as to why it
was so important to be able to look at a group of words,
react to it quickly, and pass on immediately to the next
group. This discussion lead to the third objective which
was to develop a questioning attitude toward reading.
The students were made aware of the fact that a good
reader is an active reader. He reads the material with
questions in mind and he derives the answers as quickly
as possible.
At each class meeting the students did one speed
of interpretation exercise. This exercise consisted of
40 items and was usually completed in one minute or less.
In this exercise the students had to place a check mark
before phrases which mentioned a certain object. Because

40
the items were timed it was necessary for them to keep
in mind what they were looking for, find a phrase which
mentioned it, react to it, and move on to the next
phrase.
In order to get maximum benefits from reading
matter, the reader must be able to~ recognize an idea or
a thought when he sees it. The eyes and mind can be
trained to grasp groups of words by using thought units
in reading. In the initial lecture the students were
told that phrases have certain functions. They are
often essential to getting a clear meaning of what is
being conveyed within a sentence. However, there are
other times when they are not essential to understanding
the thought or idea of the paragraph or a sentence. They
may be used to further illustrate an idea already clearly
stated.
To develop this kill in reading in thought units
or phrases the students used a speeded—comprehension—
of—phrases exercise. The exercise consisted of 20 items
and the students were given no more than two minutes to
complete the exercise. Each item consisted of a phrase
followed by five other phrases. The students were asked
to put a check mark through the phrase dosest in meaning
to the first phrase.
As is indicated in the table for realizing common
objectives, the book—centered approach presented a more

41
individualized approach to developing rate of compre
hension, After the first few weeks of the experiment
the students in this group were allowed to select what-.
ever article they desired to read. They read this story
at their own rate. After reading, they did the compre
hension check which followed the article. The students
were encouraged to analyze any errors made in the compre
hension. They did this by going back to the article
and finding the correct answer, comparing it with their
response, and determining why it was the best answer.
Individual records were kept foreach article read.
There was no really systematic method of~ in
creasing vocabulary used with the group. It was felt
that certain words may have been unfamiliar to the stu
dents. These words were written on the board and dis
cussed before the article was read. It was thought that
by discussing the words before reading the students would
have less difficulty understanding them when they saw
them in their reading. This incidental vocabulary study
was abandoned when the students began to select their own
articles to be read.
From time to time the teacher had brief individual
conferences with students. During these conferences the
student’s records were checked and his performance on
selections was discussed. In the early part of the study
42
the teacher decided what selections would be read.
Later students were permitted to select their own read
ing selection. This was done because many students blamed
low comprehension scores on lack of interest in the selec
tion read.
During the early part of the study an introduction
to a selection was given by the teacher. This introthac~
tion often aroused interest in the selection and gave a
purpose for reading the particular selection. Words
which the teacher thought might be unfamiliar to the stu
dents were written on the chalkboard and discussed in
terms of how they were used in the particular selection.
This procedural step was abandoned when thestudents be—
gan~ to select their own reading. Examples of the ex
ercises used with this group and the individual record
kept may be found in the Appendix.
The materials used with this group were as follows:
Stroud, James B., Ammons, Robert B., and Bainman, HenryA. Improving R~ding Ability, New York: Apple—ton—Century—Crofts, Inc., 1956.
Simpson, Elizabeth. SRA Better Reading Book. Chicago,Illinois: Science Research associates, Inc., 1951.
Gilbert, Doris. Breaking The Reading Barrier. Engle—wood, Cliffs, N. J.: Prentice—Hall, Inc., 1960.
Description of the Machine Centered Approach to Improved
Rate of Comprehension
Introduction
The machine approach to improving rate of reading
consisted of the use of mechanical devices. This method

43
consisted of perceptual training through the use of the
tachistoscope and reading selections presented with the
Controlled Reader.
The introductory lesson for this group was similar
to that for the book—centered group. There was a die—
oussion of rate of reading comprehension. The machines
to be used with the group were introduced and the pur
pose of each device was explained. The students were in
structed as to how records were to be kept. Individual
records of rate and comprehension were kept for each con
trolled reading exercise.
Objectives
The objectives of the lessons using the machine
centered approach were as follows:
1. To develop an aggressive approach towardreading.
2. To increase perceptual span.
3. To increase rate of comprehension.
4. To improve ability to organize thoughts.
General Setting’ and Use of Materials
The same effort was made to make the physical
atmosphere comfortable for this phase of the instruc
tional period as was done for the book—centered phase.
In addition to having the room temparature, ventilation,
and~lighting properly adjusted, it was necessary to ad
just the screen to the eye level of the students. The

44
students sat at tables while they worked. While view
ing films it was necessary for them to trim their chairs
in thedirection of the screen.
The materials used included mechanical devices,
books containing comprehension questions for the film
selections, and record forms. The materials used were
selected on the basis of the student~s reading level. A
variety of reading selections was used. There were
opportunities for students to read informational as well
as amusing selections.
Examples of Specific Pzocedures Used With the Group
The examples of procedures used in realizing ob
jectives for this group will be discussed briefly in
the following paragraphs. The procedures that were used
in realizing objectives common to both groups may also
be observed in the table on page 48.
The first objective of this group was realized
through explanation and demonstration. As with the book—
centered approach the perceptual process was described.
The good reader was defined as the active and aggresSive
reader. The tachistocope and Controlled Reader were
used to expose reading materials at various rates. A
variety of reading material was used with the Controlled
Reader. Some of the selections presented amusing stories,
while others presented factual information which required

45
very careful reading, still other stories presented
information in a general sort of way. This variety in
types of stories was used to point out to the students
that they could not read all types of reading material
at the same rate and still have accurate comprehension,
In order to increase the perceptual span the stu—
dents were given phrase training with the tachistoscope.
The phrases used were from three to five words in
length. The phrases were flashed at 1, 1/2., and 1/5
seconds. The phraseswere flashed at one speed until
most of the students were able to recognize them. Then
the next speed was used until the students were able to
recognize the phrases at that particular speed.
To increase rate of comprehension the students read
selections presented by use of the Controlled Reader.
These selections were usually introduced by the teachers
There was an attempt to induce the students to talk
about personal experiences and knowledge of a particular
subject being introduced whenever possible. The pur
poses for reading were established before the selection
was read. The selection was read at a certain speed
and then the comprehension questions were done. The
students exchanged papers and the selection was discussed
as the answers were corrected,
One objective for the machine group was to improve
ability to organize ~thoughts. The way in which a person
46
organizes his thoughts depends partly upon the method~
he employs. This objective was accomplished by using
controlled reading exercises. Because the reader sees
a group of words for~a very short length of time he has
to be able to put these thoughts together rapidly in
order to understand the entire reading selection.
• The vocabulary for the selection to be read was
written on the chalkboard. The definitions were usually
discussed before the selection was read. Sometimes
when many definitions were given the students were asked
to wait and select the appropriate definition in terms
of how the word was used in the particular selection.
Occasionally, brief conferences were held with
each student. At this time the student’s performance
was discussed and his records were checked. Through
these brief conferences the teacher learned to know
the students better and understand some of the reasons
for their performance.
The materials and equipment used with this group
were as follows:
1. The Controlled Reader and Filmstrip Librarypublished by Educational DevelopmentalLaboratories, Inc.
2. Books containing comprehension questions andreading selections to be used with the Con—trolled Reader. These are also published byEducational Developmental Laboratories, Inc.
3. The SVE Speed—i—a—Scope (Tachistoscope).
47
4. The SVE Graded Word Phrases published anddistributed by the Society For VisualEducation, Inc.
A copy of the individual record form that was used
with the Controlled Reader and a copy of the phrases
used with the tachistoscope may be found in the Appendix.
Description of the Two Groups in the
Initial Phase of the Study
General Description of the Subjects
An attempt was made to use only those students
whose comprehension score was higher than the rate score
or those whose rate and comprehension scores were nearly
the same, Eye—movement photography was used to describe
the characteristic reading patterns of the groups. In
addItion to the Otis guick Scoring Mental Ability Test
aud.the Iowa Silent Reading Test, the rate and compre
hension sections of the Priggs Diagnostic Test (Form A)
and the Gilmore Oral Reading Test (Form A) were used to
get a description of the groups.
Eye—movement Photography
Eye movements were photographed and used to
describe the characteristic reading patterns of the two
groups. Group averages for the measurable components of
the fundamental reading skills were derived after an
analysis of the eye movement graphs.

TABLE 5
EXAMPLES OF PROCEDURES USED IN REALIZING COMMON OBJECTIVES OF THE TWO GROUPS
Each individual workedat his own rate in abook specifically suitedto his reading level.He timed himself and -
read the selections..After reading the selection he did the comprehension oheok~ andanalyzed any errors ma~.
The selection to be usedwith the ControlledReader was introduced andpurposes for reading wereestablished. After reading the selection at acertain speed, the students did the comprehension check, exchangedpapers, and correctedthem. The comprehensionquestions were discussedas the answers were given.
Examples of ProceduresCommon Objectives The Book—Centered Graup The Machine—Centered Group
Developing anaggressive approach
• toward reading
Increasing rate ofcomprehension
The nature of the per— The nature of the perceptual process was ceptual process was de—described, and different scribed, and rates ofrates of reading were exposures of readingdiscussed in terms of materials were demon—specific and varied types strated through tachisto—of materials. Here scopic devices. Explana—brief lectures and dis~ *tions and demonstrationscussions ensued, were provided, with inter—
spersions of question—and—answer periods.

ThRLE~ 5——Continued
Each student preparedhis own list of tin—familiar words andlooked them up in thedictionary if they couldnot determine the meaning from the context.The students were encouraged to learn thenew words and to usethem.
The vocabulary for eachselection was written onthe chalkboard, Sometimesdefinitions were given before a selection was usedwith the ControlledReader. This presented anopportunity to point out.that words have multiplemeanings. At other timesthe words were defined anddiscussed in terms of con—text in which they wereused.
Common Objectives
Increasing vocabulary
Examples of ProceduresThe Book—Centered Group The Machine—Centered Group

50
The group averages for the components measured were
as follows: the average number of fixations per 100 words
for Group X—l was 87.50; for Group Y—l it was 89.33, with
a difference of 1.83. The average number of regressions
per 100 words for Group X—l was 8.91; for Group Y—l it
was 12.08, with a difference of 3.17. The average span
of recognition for Group X—1 was 1.15; for Group Y—1 it
was 1.16, with a difference of 1.00. The average duration
of fixation for Group X—1 was .29; for Group Y—l it was
.33; with a difference of .04. The average rate of compre~
hension for GroupX—l was 217.83; for Group Y—l it was
217.25, with a difference of .58. The average compre
hension score for Group X—1 was 70.00; for Group Y—1 it
was 77.50, with a difference of .50.
Both groups performed below the national norms
e~tab1ished for college students on all of the components
except regressions. The average number of regressions
for college students is 11 per 100 words. Group X—1 had
only 8.91 per 100 words. The average number of fixations
per 100 words ~s seventy—five. The fact that Group X—1
madá 87.50 and Group Y—1 made 89.33 fixations indicated
that they were making more pauses than the average of 83
fixations made by the high school students used in setting
norms. The average span of recognition for both groups
indicated that many of the subjects saw less words during

51
a fixation than the average high school student. The
average duration of fixation was exceedingly great for
bothgroups. The average time required by college stu.
dents to perceive the printed material covered in a
recognition span is .23 of a second. Both groups were
also very low in average rate of comprehension. The
average rate of comprehension for college students is
340 words per minute; for these groups it was slightly
above 200 words per minute.
Distribution of Rate Scores on the Gilmore Oral Reading
Test (Form A)
It may be observed in Table 6, that the subjects
in Group X—1 indicated a range of 49 with a low score
of 132 and a high score of 180. These rate scores are
in terms of words per minute. There was a mean of 152.00,
a median of 154.00, a standard deviation of 13.95, and a
standard error of the mean of 4.22. Six or 50.00 per cent
of the subjects scored above the mean, five or 41.67 per
cent scored below the mean, and one or 08.33 per cent of
them scored within the mean class interval. The scores
were fairly eveniy~ distributed.
The subjects in Group Y—1 indicated a range of 49
with a low score of 126 and a high score of 174. There
was mean of 148.50, a median of 142.00, a standard de—
viation of 15.20, and a standard error of the mean of
4.90. Five or 41.67 per cent of the subjects scored

5~
TABLE 6
FREQUENCIES, PERCENTAGES, AND BASIC STATISTICS DERIVEDFROM PERFORMANCES OF GROUPS X-1 AND Y-1 ON THE
GILMORE ORAL READING TEST, FORM A—INITIAL PHASE
Scores Group X—1 Group Y—1~ Frequency Percentage Frequency Percentage
180—184 1 08.33 0
175—179 0 0
170—174 0 1 08.33
165—169 1 08.33 3 25.00
160—164 1 08.33 1 08.33
155—159 3 25.00 0
150—154 1 08.33 0
145—149 0 0
140—144 2 16.67 a
135—139 2 16.67 2 16.67
130—134 1 08.33 2 16.67
125—129 0 1 08.33
Mean 152.00 149.50
Median 154.50 14~.00
S 13.95 16,20
S.E. 4.22 4.90

63
above the mean, seven or 58.33 per cent scored below
the mean, and none of the subjects scored within the mean
class interval. The group tended to shift toward the lower
end of the distribution; however, the mean score was gives
a performance rating of average in the manual of directions.
Comparison of the Rate Scores on The Gilmore Oral Reading
Test (Form A)
The data in Table i7, indicated the following re
sults: the mean score for Group X—l was 152.00; for Group
Y—l it was 148.50, with a difference of 3.50 in favor of
Group X—l. The standard deviation for Group X—l was 13.95;
for Group Y—l it was 16.20, with a difference of 2.25 in
favor of Group Y—1. The standard error of the mean for
Group X—l was 4.22; for Group Y—l it was 4.90, with a
difference of.68 in favor of Group Y—1. The “t” score of
.64 was not significant, for it was less than 2.82 at the
one per cent level of confidence with 22 degrees of free
dom. Therefore, the difference between the two sets of
scores was not statistically significant.
Distribution of Comprehension Scores on The Gilmore Oral
Reading Test (Form A)
It may be observed in Table 8, that the subjects in
Group X—i indicated a range of 9 with a low score of 40
and a high score of 48. These comprehension scores are
in terms of raw scores. There was a mean of 45.83, a
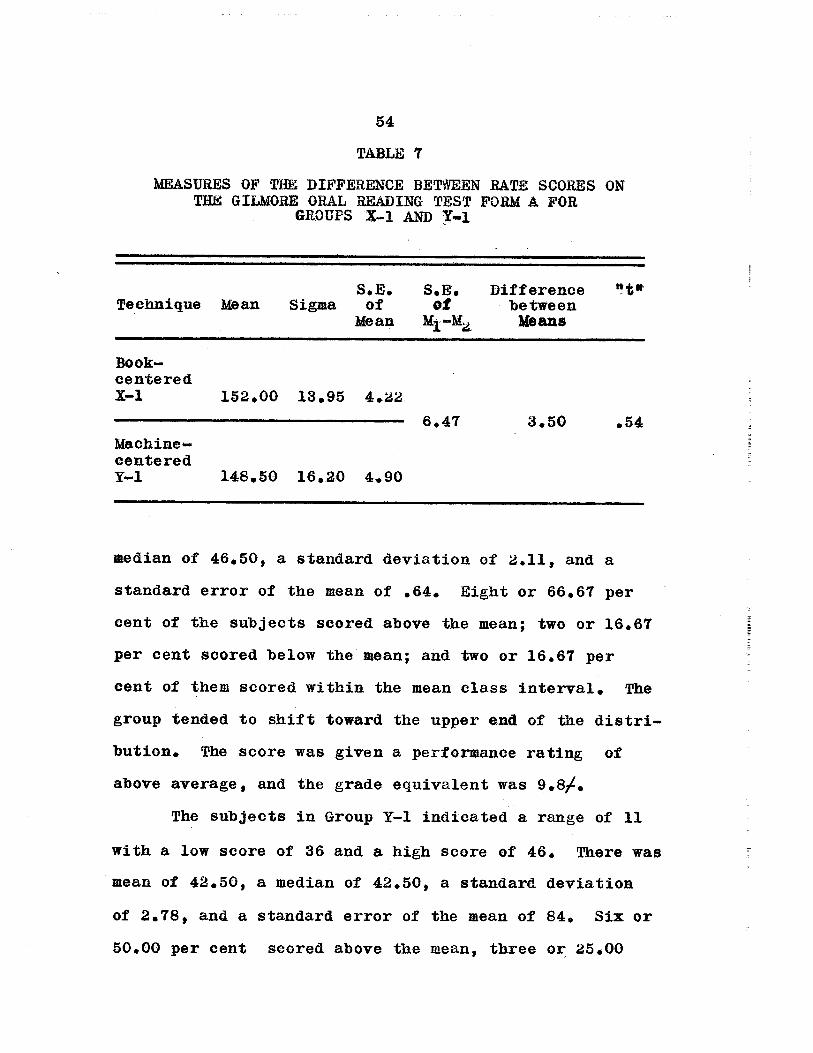
54
TABLE
MEASURES OF THE DIFFERENCE BETWEEN RATE SCORES ONTHE~ GILMORE ORAL READING TEST FORM A FOR
GR(UPS 1-1 AND Y-1
S.E. S.E. Difference “t”Technique Mean Sigma of of between
Mean M1—M2 Means
Book—centeredX—1 152.00 13.95 4.22
- 6.47 3.50 .54Macbine~centeredY—1 148.50 16.20 4.90
median of 46.50, a standard deviation of 2.11, and a
standard error of the mean of .64. Eight or 66.67 per
cent of the subjects scored above the mean; two or 16.67
per cent scored below the mean; and two or 16.67 per
cent of them scored within the mean class interval. The
group tended to shift toward the upper end of the distri
bution, The score was given a performance rating of
above average, and the grade equivalent was 9.81.
The subjects in Group Y—l indicated a range of 11
with a low score of 36 and a high score of 46. There was
mean of 42.50, a median of 42.50, a standard deviation
of 2.78, and a standard error of the mean of 84. Six or
50.00 per cent scored above the mean, three or 25.00
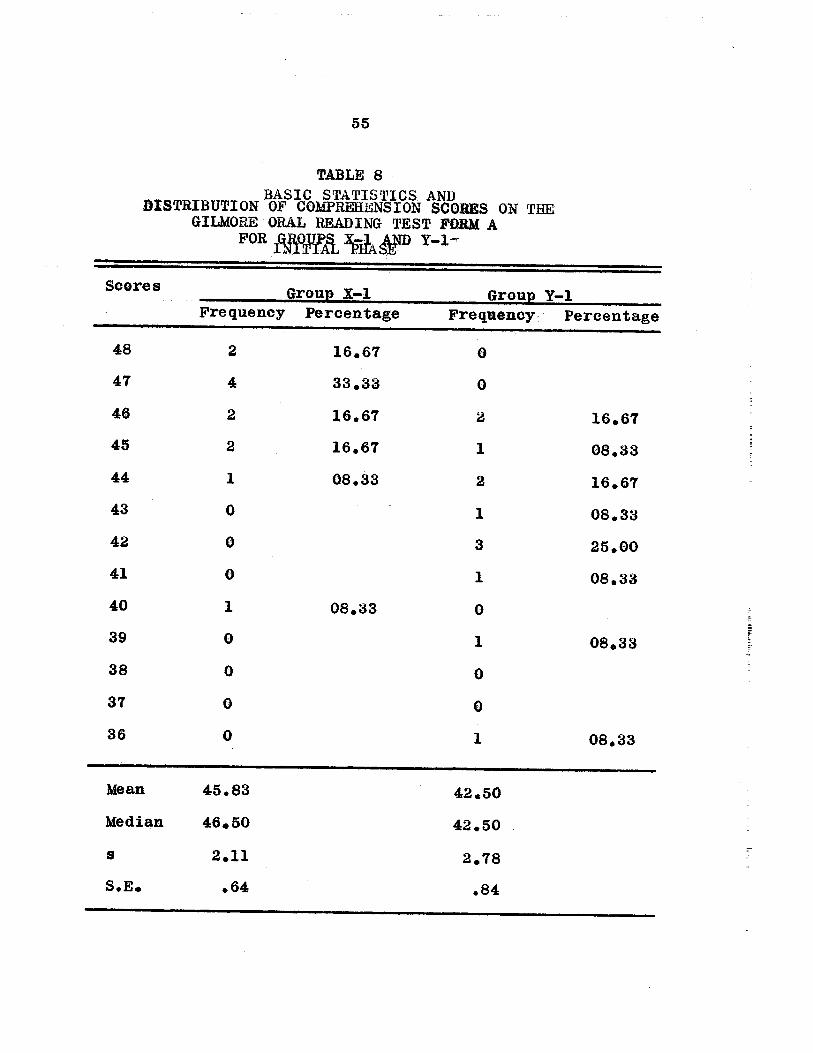
5.5
TABLE 8BASIC STATISTICS AND
DISTRIBUTION OF COMPREffi≤NSION SCORES ON TREGILMORE ORAL READING TEST FORM A
FOR ~Y-1-
Scores Group X—1 Group Y—1
Frequency Percentage Frequency. Percentage
48 2 16.67 0
47 4 33.33 0
46 2 16.67 2 16.67
45 2 16.67 1 08.33
44 1 08.33 2 16.67
43 0 1 08.33
44 0 3 25.00
41 0 1 08.33
40 1 08.33 0
39 0 1 08.33
38 0 0
37 0 0
36 0 1 08.33
Mean 45.83 . 42.50
Median 46.50 42.50
5 2.11 2.78
S.E. .64 .84

56
per cent scored below the mean, and three or 25.00 per
cent of them scored within the mean class interval. The
scores for this group were fairly evenly distributed,
with slightly more scatter than for Group X—l. The
mean score had a grade equivalent of 9.8~ and a per
formance rating of average.
Comparison of The Comprehension Raw Scores on The Gilmore
Oral. Reading Test (Form A)
The data in Table 9, indicated the following results:
the mean score for Group X—l was 45.83; for Group Y—l it
was 42.50, with a difference of 3.33 in favor of Group
X—l. The standard deviation for Group X—l was 2.11; for
Group Y—l it was 2.78, with a difference of .67 in favor
of Group Y—l. The standard error of the mean for Group
X—1 was .64; for Group Y—l it was .84, with a difference
of .20 in favor of Group Y—l. The “t” score of 3.14 was
significant, for it was more than 2.82 at the one per
cent level of confidence with 22 degrees of freedom.
Therefore, the difference between the two sets of scores
was statistically significant in favor of Group X~1.
Distribution of Rate Scores on The Iowa Silent Reading
Test (Form AM)
It may be observed in Table 10, that the subjects
in Group X—1 indicated a range of 32 with a low score of
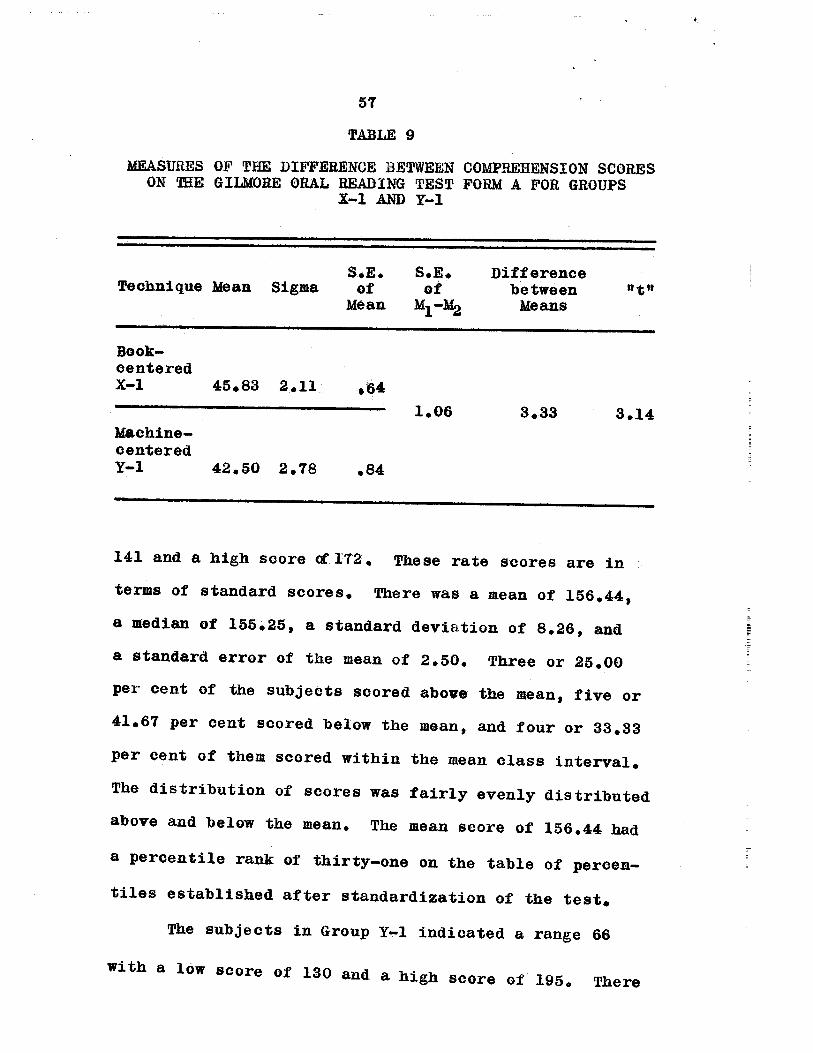
57
TABLE 9
MEASURES OF THE DIFFERENCE BETWEEN COMPREHENSION SCORESON IHE GILMORE ORAL REAI)ING TEST FORM A FOR GROUPS
X-1 AND Y-1
S.E. S.E. DifferenceTechnique Mean Sigma of of betwóen
Mean M1—M2 Means
Book—centeredX—1 45.83 2.11 .64
~ 1.06 3.33 3.14Machine—centeredY—1 42.50 2.78 .84
141 and a high score ~ 172 • These rate scores are in
terms of standard scores. There was a mean of 156.44,
a median of 155.25, a standard deviation of 8.26, and
a standard error of the mean of 2.50. Three or 25.00
per cent of the subjects scored above the mean, five or
41.67 per cent scored below the mean, and four or 33.33
per cent of them scored within the mean class interval.
The distribution of scores was fairly evenly distributed
above and below the mean. The mean score of 156.44 had
a percentile rank of thirty—one on the table of percen
tiles established after standardization of the test.
The subjects in Group Y—1 indicated a range 66
with a low score of 130 and a high score of 195. There

58
TABLE 10BASIC STATISTICS AND
DISTRIBUTIO)~•0F HATE SCORES ON THE IOWASILENT READING TEST FORM AM~
INITIAL PHASE
Score Group X—1 Group Y—1Frequency Percentage Frequency Percentage
189—195 0 16.67
182—188 0 0
175—181 0 0
168—174 2 16.67 0
161—167 1 08.33 3
154—160 4 33.33 4 33•33
147—153 4 33.33 0
140—146 1 08.33 1 09.33
133—139 0 1 08.33
126—-132 0 1 08.33
Mean 156.44 159.31
Median 155.25 158.75
s 8.26 18.13
S.E. 2.50 5.49

59
was mean of 159.31, a median of 158.75, a standard de
viation of 18.13, and a standard error of the mean of
5.49. Five or 41.67 per cent of the subjects scored
above the mean, three or 25.00 per cent scored below
the mean, and four or 33.33 per cent of them scored
within the mean class interval. The scores were fairly
evenly distributed above and below the mean, with more
scatter than for Group X—1. The mean score of 159.31
had a percentile rank of thirty—nine. The Group per
formed below the 5th percentile point of the standardj—
zation sample.
Comparison of the Rate Scores on The Iowa Silent Reading
Test (Form AM)
The data in Table 11, indicated the following re
sults: the mean score for Group X—l was 156.44; for
Group Y—l it was 159.31, with a difference of 2.87 in
favor of Group Y—l. The standard deviation for Group
X—l was 8.26; for Group Y—l it was 18.13, with a dif
ference of 9.87 in favor of Group Y—1. The standard
error of the mean for GroupX—1 was 2.50; for Group Y—1
it was 5.49, with a difference of 2.99 in favor of Group
Y—l. The “t” score of .47 was not significant, for it
was less than 2.82 at the one per cent level of confi
dence with 22 degrees of freedom.’ Therefore the dif—
ference between the two sets of scores was not statisti
cally significant.

60
TABLE 11
MEASURES OF TilE DIFFERENCE BETWEEN RATE SCORES ONTHE IOWA SILENT READING TEST FORM AM FOR
GROUP X—l AND Y-1
S.E. S.E. DifferenceTechnique Mean Sigma of of between
Mean M1—M2 Means
Oook-~C enteredX—1 156.44 8.26 2.50
6.03 2.87 .48
Machine—centeredY—1 159.31 18.13
Distribution of Comprehension Scores on The Iowa Silent
Reading Test (Form AM)
It may be observed in Table 12, that the subjects
in Group X—1 indicated a range of 77 with a low score of
144 and a high score of 220. These were standard scores
of comprehension. There was a mean of 168.90, a median
of 159.33, a standard deviation of 21.49, and a standard
error of 6.51. Three or 25.00 per cent of the subjects
scored above the mean, eight or 66.67 per cent scored
below the mean, and one or 18.33 per cent of them scored
within the mean class interval. The distribution~shows
that the scores tended to shift toward the lower end of
the distribution. Thern mean score of 168.90 had a per
centile rank of thirty—four which is below the 50th

61
percentile point of the standardization sample.
The subjects in Group Y—l indicated a range of
28 with a low score of 154 and a high score of 181.
There was a mean of 166.31, a median of 165.16, a
standard deviation of 8.82, and a standard error of
the mean of 2.66. Five or 41.67 per cent of the sub
jects scored above the mean, four or 33.33 per cent
scored below the mean, and three or 25.00 per cent of
them scored within the mean class interval. The scores
for this group were rather close in distribution and
tended to shift toward the upper end of the distribution.
The mean score h#d a percentile rank of thirty according
to the norms for the grade level.
Comparison of the Comprehension Scores on The Iowa
Silent Reading Test (Form AM)
The data in Table 13, indicated the following re
sults: the mean score for Group X—1 was 168.90; for Group
Y—1 it was 166.31, with a difference of 2.59 in favor of
Group X—1. The standard deviation for Group X—1 was
21.49; for Group Y—1 it was 8.82, with a difference of
12.67 in favor of Group X—1. The standard error of the
mean for Group X—l was 6.51; for Group Y—1 it was 2.66,
with a difference of 3.85 in favor of Group X—1, The
“t” score of .37 was not significant, for it was less
than 2.82 at the one per cent level of confidence with
22 degrees of freedom. Therefore, the difference be
tween the two sets of scores was not statistieally
significant.
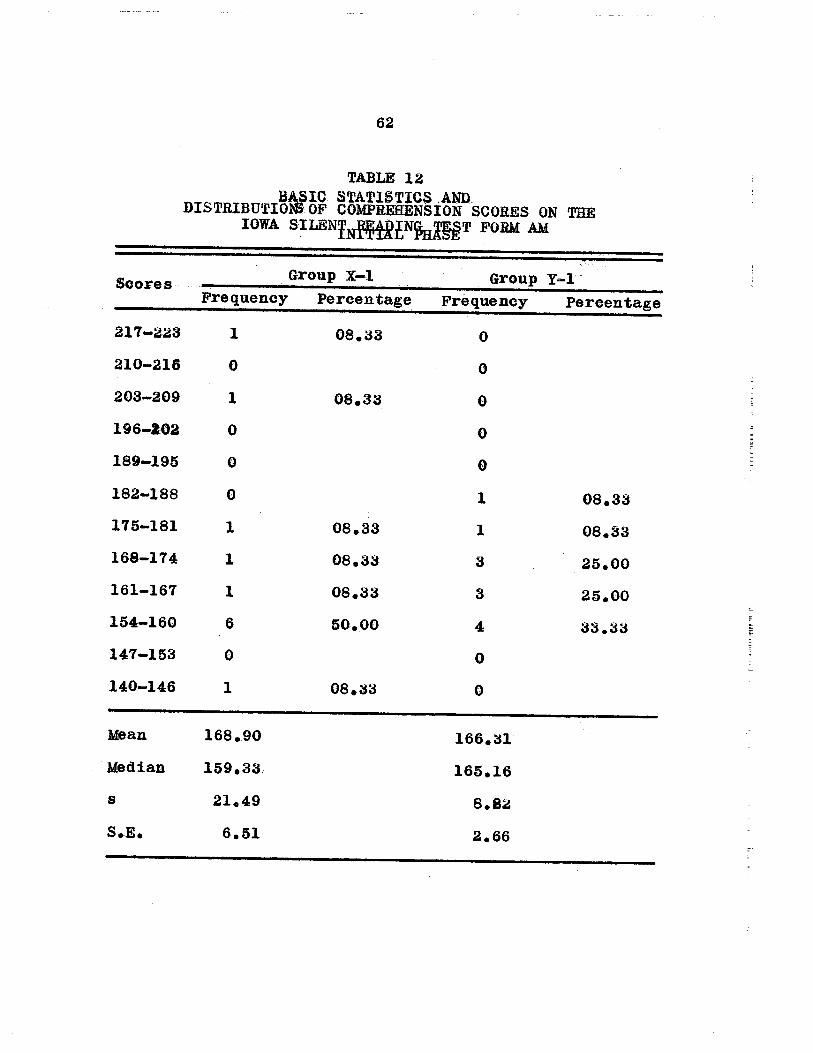
62
TABLE 12BASIC. STATISTICS AND..
DISTRIBUTIO)&OF COMPREHENSION SCORES ON THEIOWA SILENfNf~~N~~p FORM AM
Group X—•i Group Y-1Scores
Frequency Percentage Frequency Percentage
217—223 1 08.33 0
210—216 0 0
203—209 1 08.33 0
196—202 0 0
189—195 0 0
182—188 0 1 08.33
175—181 1 08.33 1 08.33
168—174 1 08.33 3 25.00
161—167 1 08.33 3 25.00
154—160 6 50.00 4 33.33
147—153 0 0
140—146 1 08.33 0
Mean 168.90 166.31
Median 159.33. 165.16
s 21.49 8.82
S.E. 6.51 2.66

63
TABLE 13
MEASURES OF THE DIFFERENCE BETWEEN COMPREHENSION SCORESON THE IOWA SILENT READING TEST FORM AM FOR
GROU1~ X-1 A1~D Y-l
Technique Mean Sigma S.E. S..E. Differenceof of between
~ Mean M1—M2, Means
Book—centeredX—i 168.90 21.49 6.51
7.03 2.59 .37
Machine-centeredY—1 166.31 8.82 2.66
Distribution of Rate Scores on The Diagnostic Reading
TestiFormA)
It may be observed in Table 14, that the subjects
in Group X—1 indicated a range of 144 with a low score
of 191 and a high score of 334. These are in terms of
raw scores. There was a mean of 239.50, a median of
339.50, a standard deviation of 40.30, and a standard
error of the mean of 12.21. Three or 25.00 per cent of
the subjects scored above the mean, nine or 75.00 per
cent scored below the mean, and none of them scored with
in the mean class interval. The scores for this group
tended to shift toward the lower end of the distribution.

64
TABLE 14
BASIC STATISTI~ANflDISTRIBUTIO~OF RATE SCORES ON THE
DIAGNOSTIC READING TEST FORM A—INITIAL PHASE
Group X—1 Group Y—1Scores
. Frequency Percentage Frequency Percentage
~ 330—339 1 08.33 0
320—329 0 0
310—319 0 0
300—309 1 O8.~3 0
290—299 0 0
280—289 0 0
270—279 0 08,33 3 25.00
a6O—2~9 1 08,33 3 16.67
250—259 0 1 08.33
240—249 0 3 25.00
230—239 3 25.00 1 08.33
220—229 2 16.67 0
210—219 1 08.33 2 16.67
200—209 2 16,67 0
1~0—199 1 08.33 0
Mean 239,50 250.30
Median 2~9.50 249.50
s 40.30 20.60
S.E.. 12.21 6.24
65
The mean score for the group was represented by a per
centile equivalent of thirty—six.
The-subjects~in -GroupY—1 indicated a range ~of-66-
with a low score of 212 and a high score of 277. There
was a mean of 250.30, a median of 249.50, a standard
deviation of 20.60, and~a standard error of the mean of
6.24. Five or 41.67 per cent of the subjects scored
above the mean, six or 50.00 per cent scored below the
mean, and one or 08.33 per cent of them scored within
the mean class interval. The distribution of scores
was fairly even above and below the mean. The mean
score had a percentile rank of forty—six which indicated
that the group almost scored at the 50th percentile
point for the standardization sample.
Comparison of Rate Scores on The Diagnostic Reading Test
(Form A)
The data in Table 15, indicated the following re
sults: the mean score for Group X—1 was 239.50; for
Group Y—l it was 250.30 with a difference of 10.80 in
favor of Group Y—l. The standard devIation for Group
X—l was 40.30; for Group Y—l it was 20.60, with a dif
ference of 19.70 in favor of Group X—l. The standard
error of the mean for Group X—l was 12.21; f or Group
Y—l it was 6.24, with a difference of 5.97 in favor of
Group X—l. The “t”~ score of 2.49 was not significant,
for it was less than 2.82 at the one per cent level of
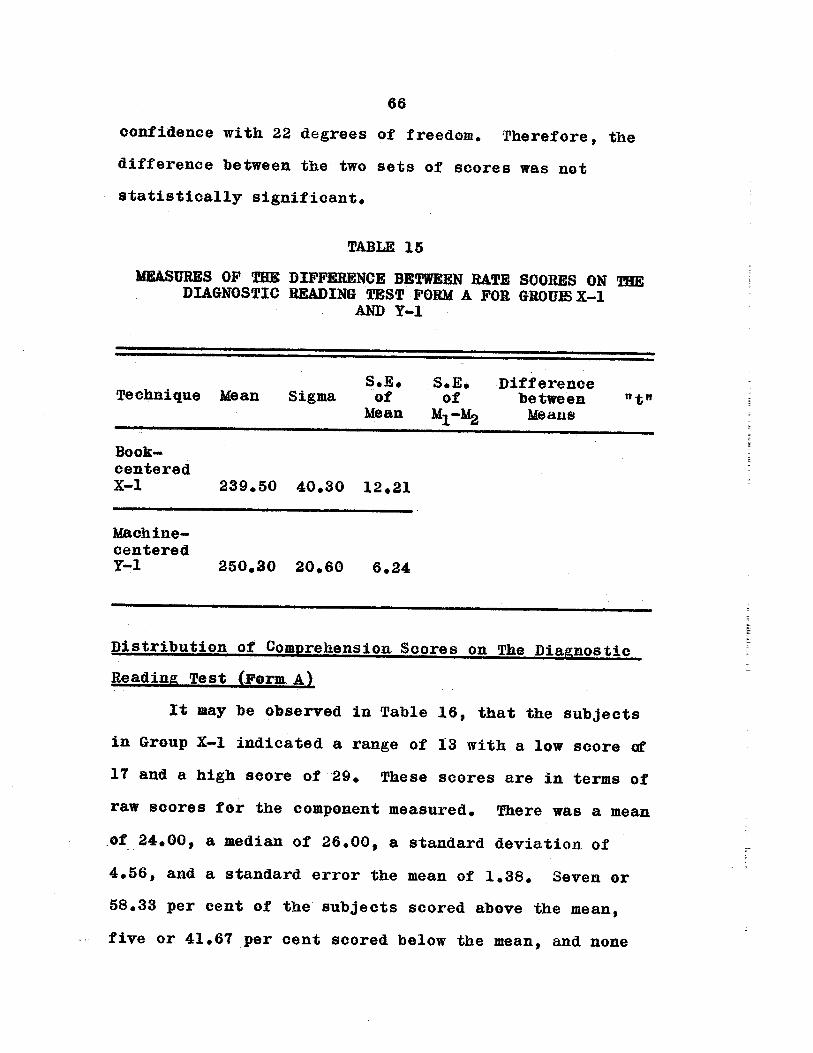
66
confidence with 22 degrees of freedom. Therefore, the
difference between the two sets of scores was not
statistically significant.
TABLE 15
MEASURES OF THE DIFFERENCE BETWEEN RATE SCORES ON THEDIAGNOSTIC READING TEST FORM A FOR GROU1~X—l
AND Y-1
S.E. S.E. DifferenceTechnique Mean Sigma of of between
~ Mean M1-M2 Means
Book—centeredX—1 239.50 40.30 12.21
Machine-centeredr—1 250.30 20.60 6.24
Distribution of Comprehension Scores on The Diagnostic
Reading Test (Form A)
It may be observed in Table 16, that the subjects
in Group X—1 indicated a range of 13 with a low score of
17 and a high score of 29. These scores are in terms of
raw scores for the component measured, There was a mean
~of 24.00, a median of 26.00, a standard deviation of
4.56, and a standard error the mean of 1.38. Seven or
58.33 per cent of the subjects scored above the mean,
five or 41.67 per cent scored below the mean, and none

67
TABLE 16BASIC STATISTICS AND
DISTRIBUTION OF COMPREHENSION SCORES ON THEDIAGNOSTIC READING TEST FORM A=
INITIAL PHASE
Group X—1 Group Y—iScores Frequency Percentage Frequency Percentage
31 0 1 08.33
30 0 3 25.00
29 2~ 16.67 0
28 2. 16.67 0
27 1 08.33 0
26 a 16.67 1 08.33
25 0 1 08.33
24 0 0
23 1 08.33 2 16.67
22 0 2. 16.67
21 0 0
20 1 08.3a 0
19 0 0
18 1 08.33 0
17 2 16.67 2 16.67
Mean 24.00 a4.70
Median 26.00 23.50
s 4.56 4.67
S.E. 1.38 1.41

68
of them scored within the mean class interval. The
distribution of scores was fairly evenly distributed
about the mean. The mean score 24.00 had a percentile
score of twenty—eight as shown on the table of norms for
the test.
The subjects in Group Y—l indicated a range of
15 with a low score of 17 and a high score of 31. There
was a mean of 24.70, a median of 23.50, a standard de
viation of 4.67, and a standard error of the mean of 1.41.
Six or 50.00 per cent of the subjects scored above the
mean, six or 50.00 per cent scored below the mean and
none of them scored within the mean class interval.
The scores for the group were evenly distributed above
and below the mean with slightly more scatter than for
Group X—1. The mean score for the group Was represented
by a percentile equivalent of twenty—eight. The average
performance for the group on the component of compre
hension was below standard for their grade level as
measured by this particular test.
Comparison of Comprehension Scores on The Diagnostic
Reading Test (Form A)
The data in Table 17, indicated the following
results: the mean score for Group X—l was 24.00; for
Group Y—1 it was 24.70, with a difference of .70 in
favor of Group Y—l. The standard deviation for Group
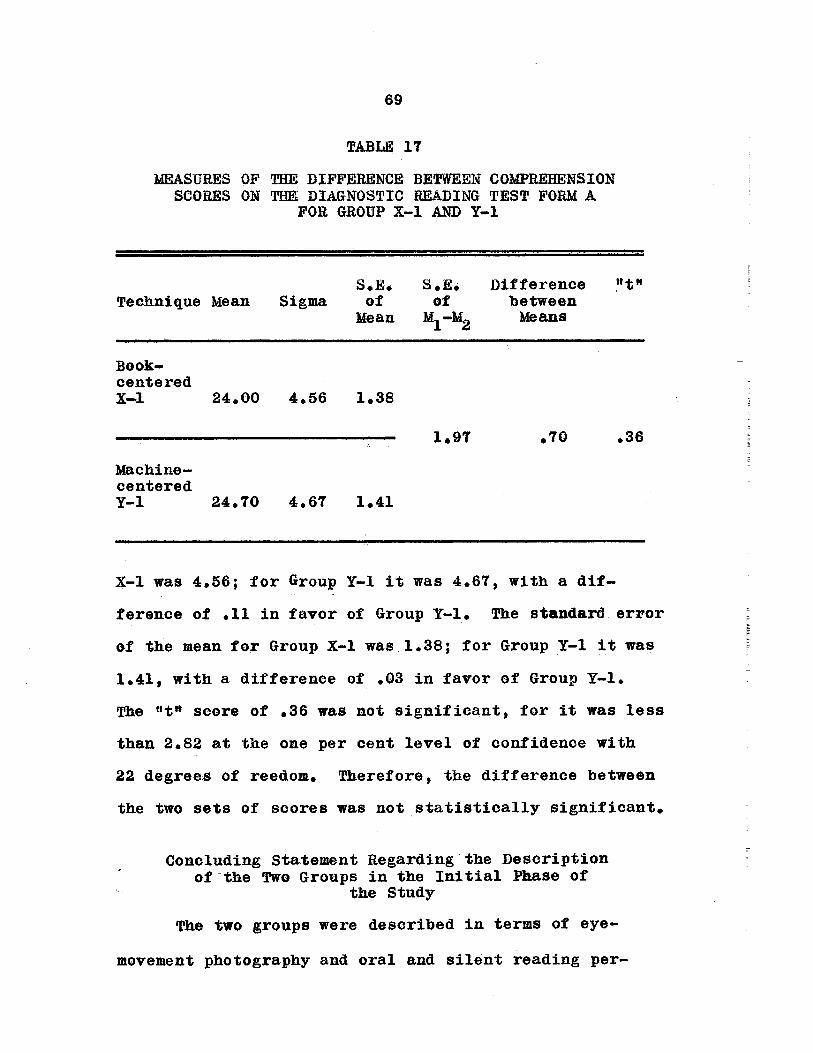
69
TABLE 17
MEASURES OF TUE DIFFERENCE BETWEEN COMPREHENSIONSCORES ON TUE DIAGNOSTIC READING PEST FORM A
FOR GROUP X—l AND Y-l
S.E. S.E. Difference “t”Technique Mean Sigma of of between
Mean M1—M2 Means
Book—centeredX—1 24.00 4.56 1.38
. 1.97 .70 .36
Machine —
centeredY—1 24.70 4.67 1.41
X—1 was 4,56; for Group Y—1 it was 4.67, with a dif
ference of .11 in favor of Group Y—1. The standard error
of thern mean for Group X—1 was 1.38; for Group Y—1 it was
1.41, with a difference of .03 in favor of Group Y—1.
The “t” score of .36 was not significant, for it was less
than 2.82 at the one per cent level of confidence with
22 degrees of reedom. Therefore, the difference between
the two sets of scores was not statistically significant.
Concluding Statement Regarding the Descriptionof the Two Groups in the Initial Phase of
the Study
The two groups were described in terms of eye—
movement photography and oral and silent reading per-

70
formance. In the initial phase of the study, the eye—
movement photography revealed that the reading patterns
of the two groups were very similar. It is interesting
to note that Group X—l made fewer regressions per. 100
words than the norms set for college students. This
Group also had fewer fixations and a higher rate of
comprehension than Group Y—l. These differences. were
not enough to be significant. It is further interesting
to note that Group 1—1 scored slightly higher in both
rate and comprehension on the Gilmore Oral Reading Test.
There were no significant differences between the groups
on either of the silent reading tests. However, there
was a significant difference in oral reading comprehension
in favor of Group X—l.
The Intermediate Test Results
Distribution of Rate Scores on The Iowa Silent Reading
Test (Form Dlvi)
It may be observed in Table 18, that the subjects
in Group X—1 indicated a range of 43 with a low score of
147 and a high score of 189.. These rate scores are pre—
ted in terms of standard scores. There was a mean of
166.30, a median of 163.00, a standard deviation of
13.05, and a standard error of the mean of 4.35. Four
or 33.33 per cent of the subjects scored above the mean,
seven or 58.33 per cent scored below the mean, and one
or 08.33 per cent of them scored within the mean class

71
TABLE 18BASIC STATISTICS AND
DISTRIBUPIO~OF BATE SCORES ON THEIOWA SILENT READING TEST FORM DM~
INTERMEDIATE PHASE
Group X—1 Group Y—1Scores
Frequency Percentage Frequency Percentage
189—191 1 08.33 0
186—188 0 1 08.33
183—185 16.67 08.33
180—182. 0 1 08.33
177—179 0 0
174—176 0 0
171—173 1 08.33 1 08.33
168—170 0 3 25.00
165—167 1 08.33 1 08.33
162—164 2 166.67 2 16.67
159~161 2 16.67 - 1 08.33
155—158 0 0
153.—155 1 08.33 1 08.33
150—iSa. 1 08,33 0
147—152.. 1 08.33 0
Mean 166.30 169.99
Median 163.00 168.50
s 1.05 9.09
S.E. 4.35 2.73

72
interval. The scores tended to shift toward the lower
end of the distribution. The mean score had a percen
tile rank of forty—six which was just below the 50th
percentile point of the standardization sample.
Phe subjects in Group Y—l indicated a range of
34 with a low score of 154 and a high score 187. There
was a mean of 169.99, a median of 168.50, a standard
deviation of 9.09, and a standard error of the mean of
2.73. Four or 33.33 per cent of the subjects scored
above the mean, five or 41.67 per cent scored below
the mean, and three or 25.00 per cent of them scored
withiii the mean class interval. The scores for this
group~ were fairly evenly distributed above and below
the mean. The mean score had a percentile rank of
fifty—two and indicated that the group performed above
the 50th percentile point of the standardization sample.
Comparison of Rate Scores on The Iowa Silent Reading
Test (Form DM)
The data lfl Table 19, indicated the following re
sults: The mean score for Group X—l was 166.30; for Group
Y—l it was 169.99, with a difference of 3.69 in favor of
Group Y—l. The standard deviation for Group X—l was
13.05; for Group Y—l it was 9.09, with a difference of
3.96 in favor of Group X—l. The standard error of the
mean for Group X—1 was 4.35, for Group Y—1 it was 2.73,

73
TABLE 19
MEASURES OF THE DIFFERENCE BETWEEN SCORES ONTHE IOWA SILENT READING TEST FORM DM
FOR GROU~ X—1 A1~D Y-1
S.E. S.E. DifferenceTechnique Mean Sigma of of between
Mean Mi~Ma MeanS
Book—centeredX—1 166.30 13.05 4.35
Machine—centeredY—1. 169.99 9.09 2.73
with a difference of 1.62 in favor of Group X—1. The
“t” score of 1.24 was not significant for it was less
than 2.82 at the one per cent level of confidence with
22 degrees of freedom. Therefore, the difference be
tween the two sets of rate scores was not statistically
significant.
Distribution of Comprehension Scores on The Iowa Silent
Readinp~ Test. (Form DM)
It may be observed in Table 20, that the subjects
in Group X—l indicated a range of 49 with a low score
of 148 and a high score of 196. The scores are in terms
of standard scores. There was a mean of 177.00, a median
— of 179.50, a standard deviation of 152.25, and a standard

74
TABLE 20BASIC ~STATISTIC5:AND
DISTRIB1JTIO~ OF COMPREHENSION SCORES ON THEIOWA SILENT READING TEST FORM DM~
INTER}4ED lATE PHASE
Group X—1 Group Y—IScores
Frequenoy Paroontage Frequency Percentage
195—199 1 08.33 1 08.33
190—194 3 25.00 3 25.00
185—189 0 0
180—184 2 16.67 2 16.67
175—179 1 08.33 0
170—174 2 16.67 0
165—169 1 08.33 4 33.33
160—164 0 0
155—159 0 0
150—154 1 08.33 2 16.67
145—149 1 08.33 0
Mean 177.00 175.75
Median 179.50 169.50
s 15.25 is.ao
S.E. 4.62 4.61

75
error of the mean of 4.62. Six or 50.00 per cent of the
subject scored above the mea;five or 41.67 per cent
scored below the mean, and one or 08.33 per cent of them
scored within the mean class interval. The scores for
this group were fairly evenly distributed above and be
low the mean.
The subjects in Group Y—1 indicated a range of
46 with a low score of 151 and a high score of 196.
There was a mean of 1775.75, a median of 169.50, a stand
ard deviation of 15.20, and a standard error of the
mean of 4.61. Six or 50.00 per cent of the subjects
scored above the mean, six or 50.00 per cent scored be
low the mean and none of the subjects scored within the
mean class interval. The comprehension scores for this
group were evenly distributed above and below the mean.
The mean score had a percentile equivalent of forty—nine.
Comparison of the Comprehension Scores on the Iowa Sil~t
Reading Test (Form DM)
The data in Table 21, indicated the following re
sults: The mean score for Group X—1 was 177.00; for Group
Y—l it was 175.75, with a difference of 1.25 in favor of
Group X—1. The standard deviation for Group X—1 was
15.25; for Group Y—1 it was 15.20, with a difference of
.05 in favor of Group X—l. The standard error of the
mean for Group X—1 was 4.62; for Group Y—1 it was 4.61,
with a difference of .01 in favor of Group X—1. The “t”

76
score of .19 was not significant, for it was less than
2.82 at the one per cent level of confidence with 22
degrees of freedom. Therefore, the difference between
the two sets of scores was not statistically significant.
Distribution Rate Scores on The Diagnostic Reading Pest
IForm G)
It may be observed on Table 22, that the subjects
in Group X—1 indicated a range of 136 with a low score
of 212 and a high score of 347. These scores are pre
sented in terms of raw scores for rate on the particular
test. There was a mean of 246.20, a median of 249.50,
a standard deviation of 40.70, and a standard error of
the mean of 12.33. Six or 50.00 per cent of the sub
jects scored above the mean, five or 41.67 per cent scored
below the mean, and one or 08.33 per cent of them scored
within the mean class interval. The rate scores for
this group were fairly evenly distributed above and be
low the mean. The mean score had a percentile rank of
forty—two.
The subjects in Group Y—1 indicated a range of 71
with a low score of 234 and a high score of 304. There
was a mean of 266.20, a median of 269.50, a standard
deviation of 2.60, and a standard error of the mean of
6.85. Six or 50.00 per cent of the subjects scored
4bove the mean, five or 41.67 per cent scored below the
— mean and one or 08.33 per cent of them scored within the

77
TABLE 21
MEASURES OF TUE DIFFERENCE BETWEEN COMPREHENSION SCORESON THE IOWA SILENT READING TEST FORM DM
FOR GROU1SX-l AND Y-l
S.E. S.E. DifferenceTechnique Mean Sigma of of between
~ Mean M1—M2 Means
Book—centeredX—~. 177.00 15.25 4.62
6.53 1.25 .19
Machine—centeredY—1 175.75 15.62 4.61
mean class interval. The rate scores for this group were
fairly evenly distributed above and below the mean, with
less scatter than Group X—l. The percentile rank of
fifty—five for the mean score indicated that the group
scored above the 50th percentile point of the standardi
zation sample.
Gomparison of Rate Scores on The Diagnostic Reading
Teat (Form G)
The data in Table 23, indicated the following re
sults: the mean score for Group X—l was 246.20; for
Group Y—l it was 266.20, with a difference of 20.00 in
favor of Group Y—1. The standard deviation for Group
X—l was 40.70; for Group Y—l it was 22.60, with a dif
ference of 18.10 in favor of Group X.-1. The standard

78
TABLE 22RASIC STATISTICS AND
DISPRIBUPIO~OF RATE SCORES ON THEDIAGNOSTIC READING TEST FORM G~
INTERMEDIATE PHASE
Group X—1 Group Y—1Scores
Frequency Percentage Frequency Percentage
340—349 1 08.33 0
330—339 0 0
320—329 1 08.33 0
310—319 0 0
300—309 0 1 08.33
290—299 1 08.33 1 08.33
280—289 1 08.33 2 16.67
270—279 0 2 16.67
260—269 1 08.33 1 08.33
250—259 1 08.33 1 08.33
240—249 1 08.33 2 16.67
230—239 2 16.67 16.67
220—229 1 08.33 0
210—219 2. 16.67 0
Mean 246.20 266.20
Median 249.50 269.50
8 40.70 22.60
S.E. 12.33 6,85

79
TABLE 23
MEASURES OF Tff~ DIFFERENCE BETWEEN RATE SCORES ON THEDIAGNOSTIC RF4DING PEST FORM G FOR GROUP~X-1 AND Y-1
S. E. S.E. DifferenceTechnique Mean Sigma of of between
~ Mean M1—M2 Means
Book—cente redX—l 246.20 40.70 12.33
14.11 20.00 1.42:
Machine—c enteredY—1 266.20 22.60 6.85
error of the mean for Group X—1 was 12.33; for Group Y—1
it was 6.85 with a difference of 5.48 in favor of Group
X—I. The “t” score of 1.42 was not significant, for it
was less than 2.82 at the one per cent level of confi
dence with 22 degrees of freedom. Therefore, the dif
ference between the two sets of scores on the component
of rate was not statistically significant.
Distribution of_Comprehension Scores on The Diagnostic
Reading Test (Form G)
It may be observed in Table 24, that the subjects
in Group X—l indicated a range of 16 with a low score of
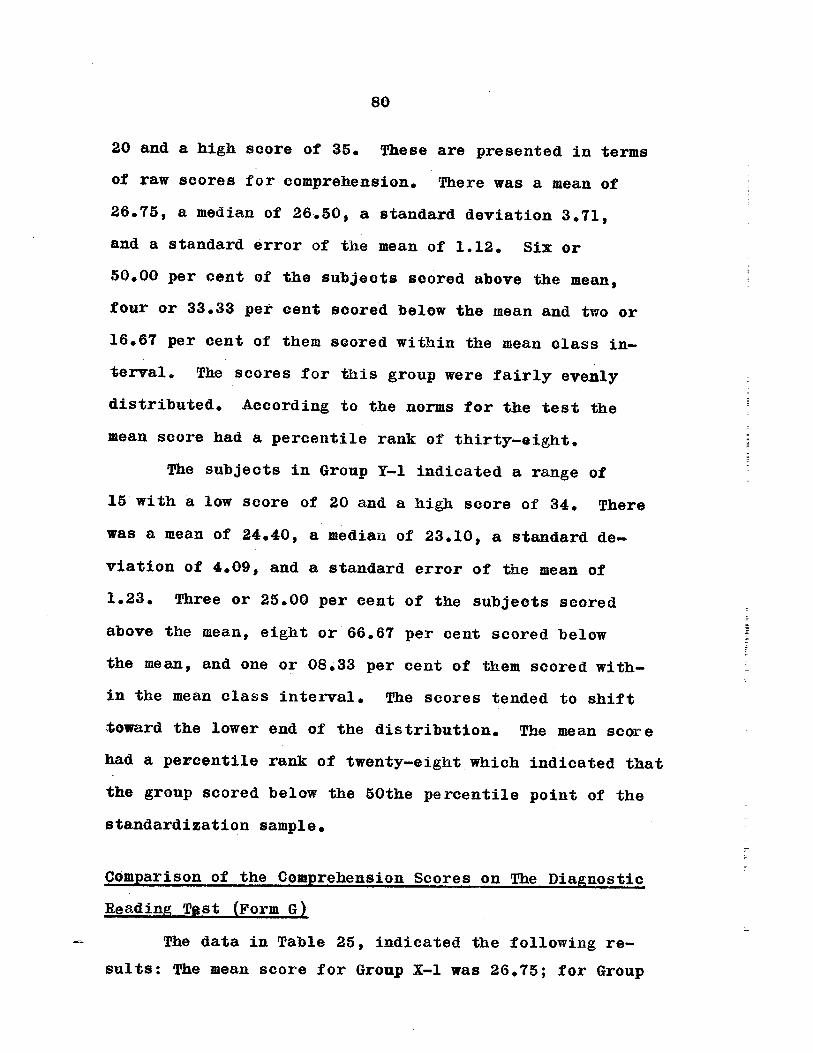
80
20 and a high score of 35. These are presented in terms
of raw scores for comprehension. There was a mean of
26.75, a median of 26.50, a standard deviation 3.71,
and a standard error of the mean of 1.12. Six or
50.00 per cent of the subjects scored above the mean,
four or 33.33 per cent scored below the mean and two or
16.67 per cent of them scored within the mean class in-.
terval. The scores for this group were fairly evenly
distributed. According to the norms for the test the
mean score had a percentile rank of thirty—eight.
The subjects in Group Y—1 indicated a range of
15 with a low score of 20 and a high score of 34. There
was a mean of 24.40, a median of 23.10, a standard de
viation of 4.09, and a standard error of the mean of
1.23. Three or 25.00 per cent of the subjects scored
above the mean, eight or 66.67 per cent scored below
the mean, and one or 08.33 per cent of them scored with
in the mean class interval. The scores tended to shift
toward the lower end of the distribution. The mean score
had a percentile rank of twenty—eight which indicated that
the group scored below the 50the percentile point of the
standardization sample.
Comparison of the Comprehension Scores on The Diagnostic
Reading Test (Form G)
The data in Table 25, indicated the following re—
suits: The mean score for Group X—l was 26.75; for Group
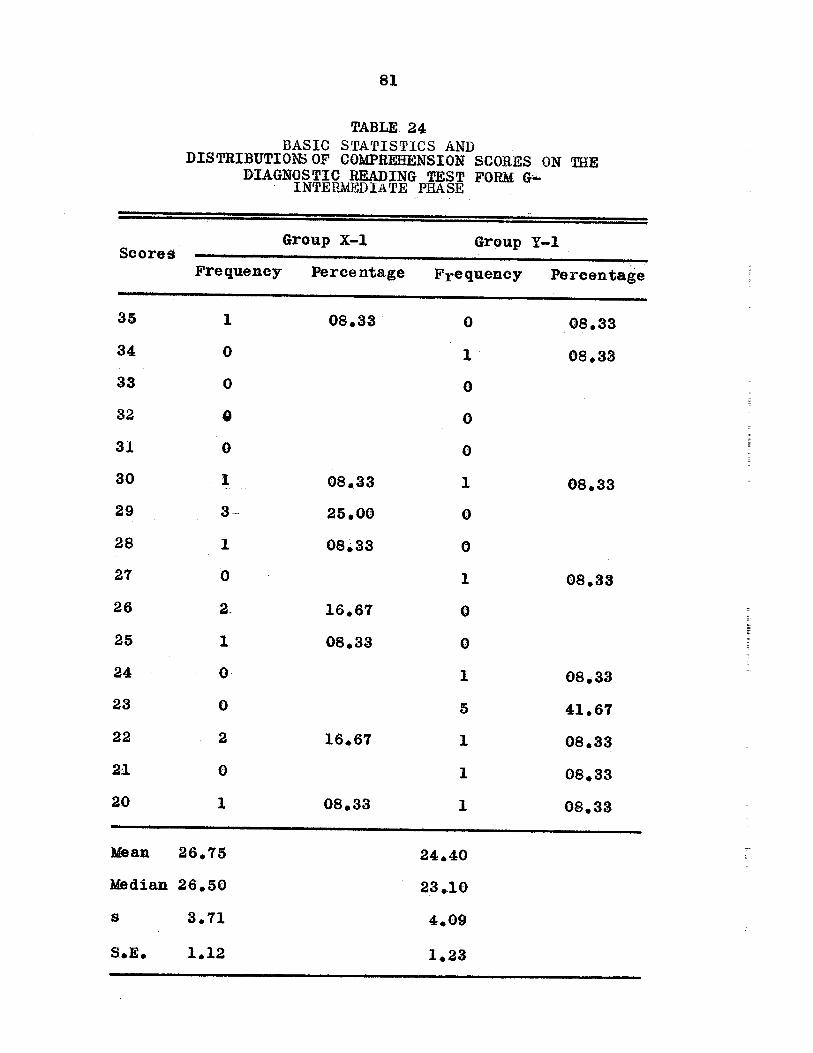
81
TABLE 24BASIC STATISTICS AND
DISTRIBUTIO1~ OF COMPREHENSION SCORES ON THEDIAGNOSTIC READING TEST FORM G—
INTERMEDIATE PHASE
Group X—1 Group Y—1Scores
Frequency Percentage Frequency Percentage
35 1 08.33 0 08.33
34 0 3. 08.33
33 0 0
32 0 0
31 0 0
30 1 08.33 1 08.33
29 3— 25.00 0
28 1 08.33 0
27 0 1 08.33
26 a. 16.67 0
25 1 08.33 0
24 0 1 08.33
23 0 5 41.67
22 2 16.67 1 08.33
21 0 1 08.33
20 1 08.33 1 08.33
Mean 26.75 24.40
Median 26.50 23.10
S 3.71 4.09
S.E. 1.12 1.23

82
Y—1 it was 24.40, with a difference of 2.35 in favor
of Group X—l. The standard deviation for Group X—l was
3.71; for Group Y—1 it was 4.09, with a difference of
.38 in favor of Group Y—1.. The standard error of the
mean for Group X—1 was 1.12; for Group Y—1 it was 1.23,
with a difference of .11 in favor of Group Y—l. The
“t” score of 1.47 was not significant, for it was less
than 2.82 at the one percent level of confidence with
22 degrees of freedom. Therefore, the difference be
tween the two sets of scores was not statistically
significant.
TABLE 25
MEASURES OF THE DIFFERENCE BEIWEEN COMPREHENSION SCORESON THE DIAGNOSTIC READING TEST FORM G FOR
GROU~X-l AND Y-l
S.E. S.E. DifferenceTechnique Mean Sigma of -of between
Mean M1— M2 Means
Book—centeredX—l 26.75 3.71 1.12
1.91 2.35 1.47
MachinecenteredY—1 24.40 4,09 1.23

83
Concluding Statement Regarding the Performanceof the Two Groups in the Intermediate
Phase of the Study
The rate of comprehension sections of the Iowa
Silent Reading Test and the Diagnostic Reading Test
were used to test the students at the intermediate phase
of the study. The test results indicated that there
were no significant differences between the test scores
of the two groups on either of the two components.
The results indicated that the group that used the
machine approach (Group Y—i) scored higher on the rate
sections of both tests; however, the comprehension scores
for this group were lower than those for Group X—l or
the Book centered Group.
It will be observed in Tables 26 and 27, that both
groups made considerable improvement during the first
experimental period. A comparison of the scores made
on the initial test with those of the intermediate test
revealed that the Group using the machine approach in
creased more in rate. It is interesting to note that on
the Iowa Silent Reading Test this same group also
improved more in comprehension than did the group using
the book—centered approach. There were no significant
differences within the groups in terms of performance
at the initial and intermediate phases: of the study.

84
The groups were rotated for the next experimental
period. Group X—1, book—centered became Group X—2
machine—centered and Group Y—1 machine centered became
Group Y—2 book—centered.
The Terminal Test Results
Distribution of Rate Scores on the Iowa Silent Reading
Test (Form BM)
It may be observed in Table 28, that the subjects
in Group X—2 indicated a range of 38 with a low score
of 147 and a high score of 184. These scores are in
terms of standard rate, score for the particular test.
There was a mean of 168.01, a median of 169.00, a
standard deviation of 11.94, and a standard error of the
mean of 3.62. Five or 41.67 per cent of the subjects
scored above the mean, five or 41.67 per cent scored
below the mean, and two or 16.67 per cent of them
scored within the mean class interval. The scores were
fairly evenly distributed above and below the mean.
The subjects in Group Y—2 indicated a range of 25
with a low score of 151 and a high score of 175.~ There
was a mean of 165.76, a median of 166.50, a standard
deviation of 7.38, and a standard error of the mean of
2.24. Five or 41.67 per cent of the subjects scored
above the mean, four or 33.33 per cent scored below the
mean, and three or 25.00 per cent of them scored within

TABLE 26
SUMMARY OF INITIAL AND INTERMEDIATE RESULTS ON THEVARIABLES OF TilE DIAGNOSTIC READING TEST
Test Initial Intermediate E DifferencesVariable Mean Sigma S.E.M Mean Sigma S.E.M. ~ M1—M2
Book—Centered (Groupx-i)
Rate239.50 40.30 12.21 246.20 40.70 12.33 6.70 17.35 .39
Comprehension 24.00 4.56 1.38 26.75 3.71 1.12 2.75 1,78 1.54
Machine—Centered(Group Y—i)
Rate 250.30 20.60 6.24 266.20 22.60 6.85 15.90 9.27 1.72
Comprehension 24.70 4.67 1.41 24.40 4.09 1.23 .30 1.87 .16
CR

TABLE 27
SUMMARY OF INITIAL AND INTERMEDIATE RESULTS ON THEIOWASILENT READING TEST
DifferencesTest Initial Intermediate S.E.
Variable Mean Sigma S.E.M. Mean Sigma S.E.M. M1—M2 M1—M2
Book—Centered (Groupx-i)
Rate 156.44 8.26 2.50 166.30 13.05 4.35 9.86 5.11 1.93
Comprehension 168.90 21.49 6.51 177.00 15.25 4.62 8.10 7.98 1.02
Machine—Centered(Group y—i)
Rate 159.30 18.13 5.49 169.99 9.09 2.73 10.68 6.13 1.74
Comprehension 166.31 8.82 2.66 175.75 15.62 4.61 9.44 5.32 1.77

87
TABLE 28
FREQUENCIES, PERCENTAGES AND BASIC STATISTICSDERIVED FROM PERFORMANCES OF GROUPS X—2: ANDY—2~ ON THE RATE SECTION OF THE IOWA SILENT
READING TEST, FORM BM - TERMINAL PHASE
Group X—2 GrotipY—aScores
Frequency Percentage Frequency Percentage
183—185 2 16.67 0
180—182 0 0
177—179 2 16.67 0
174—176 1 08.33 2 16.67
171—173 0 2 16.67
168—170 a 16.67 1 08.33
165—167 1 08.33 3 25.00
162—164 0 1 08.33
159—161 1 08.33 1 08.33
156—158 O~ 0
153—155 1 08.33 1 08.33
150—152 1 08.33 1 08.33
- 147—149 1 08.33 0
Mean 168.01 165.76
Median 169.00 166.50
8 11.94 7.38
S.E.M. 3.62 2.24

88
the mean class interval. The scores for the group were
relatively close in distribution and tended to shift to
ward the upper end of the distribution. The mean score
had percentile rank equivalent which indicated that it
was below the 50th percentile point of the standardi
zation sample.
Comparison of Rate Scores on The Iowa Silent Reading
Test (Form BM)
The data in Table 29, indicated the following
results: The mean score for Group X—2 was 168.01; for
Group Y—2 it was 165.76, with a difference of 2.25 in
favor of Group X—2. The standard deviation for Group
X—2 was was 11.94; for Group Y—2 it was 7.38, with a
difference of 4.56 in favor of Group X—2. The standard
error of the mean for Group X—2 was 3.62; for Group ~—ait was 2.24, with a difference of 1.38 in favor of Group
X—2. The “t” score of .53 was not significant, for it
was less than 2.82 at the one per cent level of confi
dence with 22 degrees of freedom. Therefore, the dif
ference between the two sets of rate scores was not
statistically significant.
Distribution of Comprehension Scores on The Iowa Silent
Reading Pest (Form BM)
It may be observed in Table 30, that the subjects
in Group X—2 indicated a range of .37 with a low score

89
TABLE 29
MEASURES OF THE DIFFERENCE BETWEEN RATE SCORES ON THEIOWA SILENT READING TEST FORM BM FOR
GROWS X-2 AND Y-2
S.E.~ S.E. DifferenceTechnique Mean Sigma of of between
Mean M1—M2 Means
Book—C enteredY—2 165.76 7.38 2.24
4.26 2.25 .53
Machine—C enteredX—2 168.01 11.94 3.62
of 154 and a high score of 190. These scores are in
terms of standard scores. There was a mean of 176.15, a
median of 174.50, a standard deviation of 13.65, and a
standard error of the mean of 4.14. Five or 41.67 per
cent of the subjects scored above the mean, six or 50
per cent scored below the mean, and one or 08.33 per
cent of them scored within the mean class interval. The
scores for this group were fairly evenly distributed
above and below the mean.
The subjects in Group Y—2 indicated a range of
50 with a low score of 158 and a high score of 207.
There was a mean of 181.15, a median of 179.50, a stand—
ard deviation of 15.00, and a standard error of the
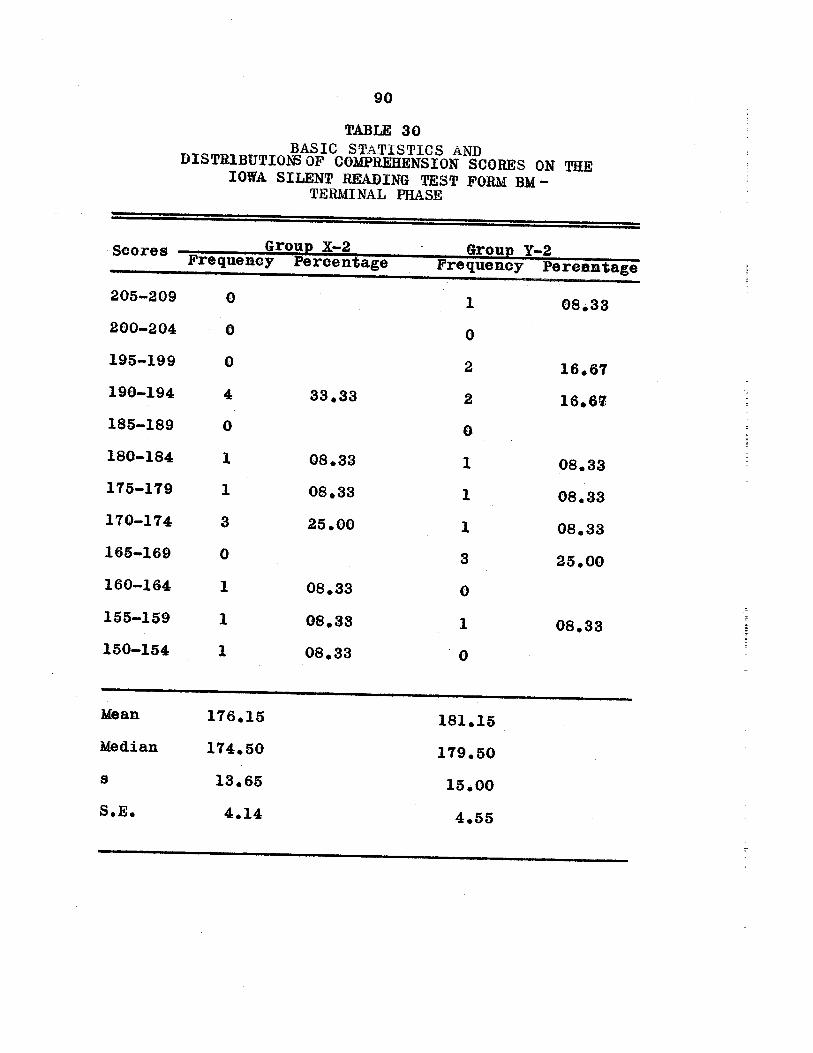
90
TABLE 30BASIC STATISTICS AN])
DISTRIBUTIo~ OF COMPREHENSION SCORES ON THEIOWA SILENT READING TEST FORM BM
TERMINAL PHASE
coores Group X—2 Group Y—2~ Frequency Percentage Frequency Percentage
205—209 0 1 08.33
200—204 0 0
195—199 0 2 16.67
190—194 4 33.33 2 16.67
185—189 0 0
180—184 1 08.33 1 08.33
175—179 1 08.33 1 08.33
170—174 3 25.00 1 08.33
165—169 0 3 25.00
160—164 1 08.33 0
155—159 1 08.33 1 08.33
150—154 1 08.33 0
Mean 176.15 181.15
Median 174.50 179.50
s 13.65 15.00
S.E. 4.14 4.55

91
mean of 4.55. Five or 41.67 per cent of the subjects
scored above the mean; six or 50.00 per cent scored be
low the mean; and one or 08.33 per cent of them scored
within the mean class interval. The scores were fairly
evenly distributed above and below the mean, with slightly
more scatter than Group X—2. The mean score represented
a percentile equivalent of seventy—four which indicated
that the group performed above the 50th percentile point
of the standardization sample.
Comparison of Comprehension Scores on The Iowa Silent
Reading Test (Form BM)
The data in Table 31 indicated the following re
sults: The mean score for Group X—2 was 176.15; for
Group Y-2 it was 181.15, with a difference of 5.00 in
favor of Group Y—2. The standard deviation for Group
X—2 was 13.65; for Group Y—2 it was 15.00, with a dif
ference of 1.35 in favor of Group Y—2. The standard
error of the mean for Group X—2 was 4.14; for Group
Y—2 it was 4.55, with a difference of .41 in favor of
Group Y:—20 The “t~ score of .81 was not significant,
for it was less than 2.82 at the one per cent level
of confidence with 22 degrees of freedom. Therefore,
the difference between the two sets of comprehension
scores was not statistically significant.

92
TABLE 31
MEASURES OF THE DIFFERENCE BETWEEN COMPREHENSION SCORESON THE IOWA SILENT READING TEST FORM BM FOR
GROU~ X-2 AND Y-2
S.E. S.E. DifferenceTechnique Mean Sigma of of between
Mean M1—M2 Means
Book—cente redY—2 181.15 1~O 4,55
. 6.15 5.00 .81
Machine-centeredX—2~ 176.15 13.65 4.14
Distribution of Rate Scores on The Diagnostic Reading
Test (Form B)
It may be observed in Table 32 that the subjects
in Group X—2 indicated a range of 92 with a low score of
204 and a high score of 295. These scores are in terms
of raw scores for the particular test. There was a mean
of 250.30, a median of 249.50, a standard deviation of
31.Oo and a standard error of the mean of 9.39. Six or
50.00 per cent of the subjects scored above the mean,
five or 41.67 per cent scored below the mean, and one or
08.33 per cent of them scored withinthe mean class
interval. The distribution of scores was fairly evenly
distributed above and below the mean. The mean score

93
TABLE 32
FREQUENCIES, P~CEN:TAGES AN]) BASIC STATISTICSDERIVED FROM PREFORMANCES OF GROUPS X—2 ANDY—2 ON THE RATE SECTION OF THE DIAGNOSTIC
READING TEST FORM B — TERMINAL PHASE
Group X—2 Group Y—2Scores ~ mr~
Frequency Percentage Frequency Percnetage
290—299 1 08.33 2 16.67
280—289 2 16.67 0
270—279 2 16.67 0
260—269 0 2 16.67
250—259 1 08.33 3 25.00
240—249 1 08.33 2 16.67
230—239 2 16.67 1 08.33
220—229 0 2 16.67
210—219 1 08.33 0
200—209 2 16.67 0
Mean 250.30 255.50
Median 249.50 252.83
s 31.00 21.90
S.E.M. 9.39 6.64

94
was below the 50th percentile point of the standardization
sample.
The subjects in Group Y—2 indicated a range of 75
with a low score of 225 and a high score of 299. There
was a mean of 255.50, a median of 252.83, a standard
deviation 21.90, and a standard error of the mean of 6.64.
Four or 33.33 per cent of the subjects scored above the
mean, five or 41.67 per cent scored below the mean, and
three or 25.00 per cent of them scored within the mean
class interval. The scores were fairly evenly distri
buted with less scatter than Group X—2. The mean score
represented a percentile equivalent of forty—seven which
was below the 50th percentile of the standardization
sample.
comparison of Rate Scores on The Diagnostic Reading Test
(Form B)
The data in Table 33 indicated the following re
sults: The mean score for Group X—2 was 250.30; for
Group Y—2 it was 255.50, with a difference of 5.20 in
favor of Group Y—2. The standard deviation for Group
X—2 was 31.00; for Group Y—2 it was 21.90, with a dif
ference of 9.10 in favor of Group X—2. The standard
error of the mean for Group X—2 was 9.39; for Group Y—2
it was 6.64, with a difference of 2.75 in favor of Group
X—2. The “t” score of .45 was not significant, for it

95
was less than 2.82 at the one per cent level of confi
dence with 22 degrees of freedom. Therefore,~ the dif
ference between the two sets of rate scores was not
statistically significant.
TABLE 33
MEASURES OF THE DIFFERENCE BETWEEN R~PE SCORES ON THEDIAGNOSTIC READING TEST FORM B FOR
GROUI~X-2 AN]) Y-2
. S.E. S.E. DifferenceTechnique Mean Sigma of of between
Mean M1—M2 Means
Book—centeredY—2 255,50 2190 6,64
11.50 5.20 .45
Machine-centered1—2 260.30 31.00 9.39
Distribution of Comprehension scores on The Diagnostic
Reading Test (Form B)
It may be observed in Table 34 that the subjects
in Group 1—2 indicated a range of .15 with a low score
of 18 and a high score of 32. These scores are in terms
of raw scores. There was a mean of 27.08, a median of
28.50, a standard deviation of 4.09, and a standard

96
error of the mean of 1.24. Six or 50.00 per cent of the
subjects scored above the mean; five or 41.67 per cent
scored below the mean; and one or 08.33 per cent of
them scored within the mean class interval. The scores
for this group were fairly evenly distributed above and
below the mean.. The mean score had a percentile rank of
forty—four; however, this was below the 50th percentile
for the standardization sample.
The subjects in Group Y—2 indicated a range of 17
with a low score of 18 and a high score of 34. There
was a mean of 27.17, a median of 27.50, a standard de
viation of 4.47, and a standard error of the mean of
1.35. Six or 50.00 per cent of the subjects scored
above the mean; four or 33.33 per cent scored below the
mean; and two or 16.66 per cent of them scored within
the mean class interval. The scores were fairly evenly
distributed above and below the mean, The mean score
for the group was represented by a percentile rank
equivalent of forty—four on the test norms for the
grade level. The average performance .for the group was
below the national standard as measured by this partic
ular test.
Gomparison of Comprehension Scores on The Diagnostic
Reading Test (Form B)
The data in Table 35 indicated the following re
sults: The mean score for Group X—2 was 27.08; for
97
TABLE 34
FREQUENCIES, PERCENTAGES AND BASIC STATISTICS DERIVEDFROM PERFORMANCES OF GROUPS X—~ AND Y-2 ON THE
DIAGNOSTIC READING TEST FORM B— TERMINALPHASE
Scores Group X—2 Group Y—2Frequency Percentage Frequency Percentage
34 0 1 08.33
3~3 0 0
32 1 08.33 0
31 0 1 08.33
30 4 3.3a 3 35.00
29 1 08.33 0
28 1 08.33 1 08.33
27 1 08.33 2 16.67
26 1 08.33 2 16.67
25 1 08.33 0
24 0 0
23 0 0
22. 0 0
21 0 0
20 1 08.33 0
19 0 1 08.33
18 1 08.33 1 08.33
Mean 27.08 27.17
Median 28.50 27.50
S 4.09 4.47S.E.M 1.24 1.35

98
Group Y—2 it was 27.17, with a difference of .09 in
favor of Group Y—2. The standard deviation for Group
X—2 was 4.09; for Group Y—2 it was 4.47, with a difference
of .38 in favor of Group Y—2. The standard error of the
mean for Group X—2 was 1.24; for Group Y—2 it was 1.35,
with a difference of .11 in favor of Group Y—2. The “t”
score of .05 was not significant, for it was less than
2.82 at the one per cent level of confidence with 22
degrees of freedom. Therefore, the difference between
the two sets of scores was not statistically significant.
TABLE 35
MEASURES OF THE DIFFERENCE BETWEEN COMPREHENSION SCORESON THE DIAGNOSTIC READING TEST FORM B FOR
GROU1SX-2 AND Y-2
S.E. S.E. DifferenceTecbnique Mean Sigma of of between lit”
Mean M1-M2 Means
Book—oente redY—2 27.17 4.47 1.35
1.83 .09 .05
MachinecenteredX—2 27.08 4.09 1.24

99
Concluding Statement Regarding the Performanceof the Two Groups at the Terminal Phase
of the Study
At the end of the experiment the students were
again tested on the Iowa Silent Reading Test and the
Diagnostic Reading Test. There were no significant
differences between the groups on either of the tests.
During this experimental period, Group X—2 used
the machine approach and Group Y—2 used the book—
centered approach. Group X—2 improved more in rate as
measured by the Iowa Silent Reading Test. The compre
hension score for Group Y—2 was slightly higher than
that for Group X—2 on both tests.
The tables on pages 100 and 101 give a comparison
of the intermediate and terminal performance of the two
groups. It was surprising to note that the rate scores
for Group Y—2, the Book—centered Group, as measured at
the end of the experiment were lower than the scores at
the intermediate period. This was true for both tests
used to measure rate. The comprehension for Group y—a
as measured by both tests increased more than did the
comprehension for X—2.

TABLE 36
Intermediate Terminal DifferencesPest
Variable Mean Sigma S.E.M. Mean Sigma S.E.M Mi—M2 M~4~ 9.~ft
~ Machine—Centered(Group X—2)
Rate 246.20 40.70 12.33 2~0,30 31.00 9.39 4.10 15.50 .26
Compre —
hension 26,75 3.71 1.12 27.08 4.09 1.24 .33 1.67 .20
Book—Centered (GroupY-2)
Rate 266,20. 22.60 6.85 255,50 21.90 6.64 10.70 9,54 1.12
Compre —
honsion 24.40 4.09 1.28 27.17 4.47 1,35 2.77 1.83 1.51;
SUMMARY OF INTERMEDIA~ ANT) TERMINAL RESULTS ONTHE DIAGNOSTIC READING TEST
‘-a00

TABLE 37
SUMMARY OF TNE~ INTERMEDIATE AND TERMINAL RESULTS ONTHE IOWA SILENT READING TEST
0I-.
Intermediate Terminal DifferencesTest S.E.
Variable Mean Sigma S.E.M. Mean Sigma S.E.M. M1—M2 ?4-M2 ~t”
Machine—Centered(Group X—2)
Rate 166.30 13.05 4q35 168.01 11.94 ~.62 1.71 5.66 .30
Comprehension 177.00 15.24 4.6~ 176.15 13.65 4.1.4 .85 6.20 .14
Book—Centered ( GroupY—2)
Rate 169.99 9.09 2.73 165.76 7.38 2.24 4.23 3.53 1.20
Comprehension 175.75 15.62 4.61 181.15 15.00 4.55 5.40 6.48 .83

CHAPTER III
SUMMARY, CONCLUSIONS, IMPLICATIONS AND RECOMMENDATIONS
Introduction
This chapter presents a summary of the basic design
of this shidy; specific answers to purposes of this study
through the summariza$ion of significant findings, con
clusions and implications which were drawn from test re
sults; and recommendations which were based on the findings,
conclusions, and implications of the study.
Basic Design and Methodology
This study was an experiment to determine the dif
ference, if any, between the students’ progress in
improving rate by using a book—centered approach and the
rate improvement by using a machine approach.
The more specific purposes of the study were as
follows:
1. To determine if one method was more effectivethan the other in improving reading efficiency.
2. To determine if one method was more effectivein improving rate alone.
3. To determein if both methods were equallyeffective with any one group.
4. To compare the performance of the two groups interms of changes in rate.
5. To derive from the findings, implications andrecommendations which might lead to a betterunderstanding of methods of improving rate ofreading.

103
This study was limited to twenty—four freshman
students of Morris Brown College, Atlanta, Georgia. In
this study an attempt was made to determine if there was
a difference in the student’s progress in improving rate
by using a book—centered approach and a machine approach.
The experiment extended over a ten week period. Five
weeks were used for the book—centered approach and five
weeks for the machine approach. The rotation—group method
was employed in this experiment. At certain points in the
experiment, reading tests were administered and the rate
and comprehension sections were used to measure the stu
dent’s progress. During the first half of the experiment
Group X—1 was taught by the book—centered approach. Group
Y—l was taught by the machine approach. Ihring the second
half of the experiment Group X—1 book—centered, became
Group X—~ machine centered. Group Y—l machine—centered,
became Group Y—2 book centered.
In order to accomplish the desired ends, it was
necessary for the writer to become familiar with the
literature pertinent to the investigation. The review of
literature disclosed many view points about the improve
ment of rate of reading.
There are certain factors that seem to influence
the rate at which an individual can read and comprehend
104
printed material. Most authorities agree that the two main
factors influencing rate of reading are the difficulty of
the material and the purpose for which it is being read.
The fact that the difficulty of the material and the pur
pose for reading influence the rate of reading leads to the
conclusion that there is not one rate at which all materials
Should be read. The rate at which material is read is de
pendent upon the two previously mentioned factors.
There is a relationship between eye—movement patterns
and reading performance butthere is disagreement as to
whether fau1ty•••~eye—movement patterns are causes or symptoms
of poor reading. It was stated by one prominent writer that
eye movements reflect difficulties of the reader in sight
word recognition, word analysis, and comprehension irreg
ularities are present in the eye—movement patterns of both
good and poor readers, particularly when they are attempting
to read difficult or unfamiliar material., His argument is
against eye—movement patterns causing poor reading.
In the area of related studies recent reports were
presented concerning the book—centered approach and the
machine approach as methods àf improving rate of reading.
Authorities do not agree as to whether one method is more
effective than the other in improving rate of reading. It
seems probable that an effective reading program should
employ both methods of improving rate.
105
The subjects involved in this study were twenty—
four freshman students, consisting of two groups of
twelve each during the first semester of the 1964—65
school term,
The instruments used in this study were as follows:
1. The Otis Quick Scoring Mental Ability TestGamma Form EM.
2. The Iowa Silent Reading Tests Forms Am, Dm,and Bm.
3. The Diagnostic Reading Tests Forms A, G, andB.
4. The Gilmore Oral Reading Test Form A.
5. The J~DL Reading Eye—camera.
6. Mechanical devices such as the controlled‘~i~eader and tachistoscope.
7. Practice materials appearing in various workbooks.
The tests used this study were administered accord
ing to the instructions presented in the manual, The
data derived from administering the tests were analyzed
and interpreted statistically.
The procedure of the experiment included the
following steps:
1. Permission to conduct the Study was obtainedfrom the proper school authorities,
2. A review of related literature pertinent tothis Study was made.
3. The subjects involved in this study wereselected on the basis of scores made on theOtis Quick—Scoring Mental Ability Test andthe Iowa Silent Reading Pest.

106
4. Equivalent groups were organized on the basisof there being no significant differencesbetween their mean scores on the tests ofreading and mental ability.
5. Eye—movements were photographed and used todescribe characteristic reading patterns ofthe two groups.
6. During the first five weeks Group X-4 usedthe book—centered approach for two hours perweek. Group Y—l used the machine approachfor the same length of time.
7. At the end of the first five weeks the groupswere retested on the Iowa Silent Reading TestForm Din and the Diagnostic Reading Test FormG.
8. During the second five weeks of the study thegroups were rotated. Group X—l became X—2and used the machine approach and G:roup 1—1became Y—2 and used the book—centered approach.
9. At the end of the ten—week period, both groupswere rested on the Iowa Silent Reading TestForm Bin and the Diagnostic Reading Test Form B.
10. The data obtained from the tests were statistically treated and assembled into appropriatetables.
11. The findings, conclusions, implications andrecommendations stemming from the analysisand interpretation of the data were incorporatedin -he--f4nal—tlie-si-s—eo-py.
Summary of Basic Findings
The following are findings regarding the two groups
for the initial, intermediate, and terminal testing
periods.
Pre—Te sting and Initial Phase of Study.
1. A comparison of the intelligence quotients ofGroup X—l and Group Y—l from the Otis QuickScoring Mental Ability Test revealed a mean of

1 Ô7
99.25 for Group X—l, for Group Y—1 99.01 witha difference of .24 in favor of Group X—1.The standard deviation for Group X—1 was 6.84,for Group Y—1 itwas 7.86, with a differenceof 1.02 in favor of Y—1. The standard errorof the mean for Group X—1 was 2.07, for GroupY—l it was 2.38, with a difference of .31 infavor of Group Y—1. The standard error of thedifference of the two means was 3.15. The “t”ratio was .08 and was not significant at the.01 level of confidence with 22 degrees offreedom. Therefore, the difference between thetwo sets of intelligence quotients was notstatistically significant for the two groups.
2. A comparison of the median scores of the book—cente red group and the machine group on thesilent reading test showed a mean of 161.25for Group X—l, for Group Y—1, a mean of 164.33with a difference of 3.08 in favor of GroupY—1. The standard error of the differencebetween the means was 1.65. The “t” ratio was1.87 which was not significant at the .01 levelof confidence with 22 degrees of freedom. Therefore, the difference between the two sets ofsocres was not statistically significant. Thesefindings led.. to the conólusion that the gradeequivalent for Group X—1 was 9.8 and the gradeequivalent for Group Y—1 was 10.4.
3. In comparison of the book—centered group andmachine group on rate scores on the oral reading test, there was a mean of 152.00 for GroupX—1, and 148.50 for Group Y—]. with a differenceof 3.50 in favor of Group X—l. The standarderror of the difference between the mean was6.47. The “t” ratio was .54 which was notsignificant at. the £~1 level of confidence, with22 degrees of freedom. Therefore, the differencebetween the two sets of scores on the componentof rate was not statistically significant.
4. A comparison of the comprehension scores of thetwo groups on the oral reading test revealed amean of 45.83 for Group X—1, and 42.50 for GroupY—1. The difference between the means was 3.33in favor of Group X—1. The standard error ofthe difference between the means was 1.06. The“t” ratio of 3.14 was significant at the .01level of confidence with 22 degrees of freedom.

108
Therefore~, the difference between the twosets of scores on the component of conipre—hension was statistically significant.
5. A comparison of rate scores attained by GroupX—l and Group Y—l on the silent reading testshowed mean scores of 156.44 and 159.31,respectively. The difference between themeans was 2.87 in favor of Group Y-.l. Thestandard error of the difference between themean was 6.03. With a “t” ratio of .48 theNull hypothesis was accepted, that is, thedifferences between the means of the two groupswas regarded as not significant.
6. A comparison of Group X..-1 and Group Y—1 on thecomprehension section of the silent readingtest indicated mean scores of 168.90 and 166.31,respectively. There was a difference of 2.59between the mean scores of the groups in favorof Group X—1. The standard error of the difference between the means was 7.03. With a “t”ratio of .37 the Null hypothesis was accepted,that is, the difference between the means ofthe two groups was regarded as not significant.
7. A comparison of scores on the rate section ofthe Diagnostic Reading Test indicated a meanscore of 239.50 for Group X—l and 250.30 forGroup Y—l. A difference of 10.80 existed between the mean scores of the groups in favorof Group Y—l. The standard error of the difference between the means was 4.34. With a“t” score of 2.49 the Null hypothesis wasaccepted, that is, the difference between themeans of the two groups was regarded as notsignificant.
8. A comparison of scores on the comprehensionsection of the Diagnostic Reading Test indicated a mean score of 24.00 for Group X—l and24.70 for Group Y—l. There was a differenceof .70 between the mean scores of the twogroups. The difference was in favor of Group~—1~ The standard error of the differencebetween the means was 1.97. With a “t” scoreof .36 the Null hypothesis was accepted, thatis, the difference between the means of thetwo groups was regarded as not significant.

109
9. A comparison of the groups on the componentsmeasured by the Reading Eye—Camera were asfollows: the average number of fixations per100 words for Group X—1 was 87.50; for GroupY—l it was 89.33, with a difference of 1.83.The average number of regressions per 100 wordsfor Group X—l was 8.91; for Group Y—1 it was12.08 with a difference of 3.17. The averagespan of recognition for Group X—1 was 1.15;for Group Y—1 it waw 1.16, with a difforcncc of1.00. The average duration of fixation forGroup X—l was .29; for Group Y—1 it was .33,with a difference of .04. The average rate ofcomprehension for Group X—l was 217.83; forGroup Y—l it was 27.25, with a difference of.58.The average comprehension score for Group X—1was 70.00; for Group Y—l it was 77.50, with adifference of .50.
Intermediate Phase of Study
1. A comparison of Group X—1 and Group Y—1 on therate section of the silent reading test indicated a mean score of 166.30 and 169.99 respectively, There was a difference of 3.69 betweenthe mean scores of Group X—1 and Group Y—l infavor of Group Y—1. The standard error of thedifference between the means was 5.14. The “t”ratio was .72 which was not significant at the.01 level of confidence, with 22 degrees of freedom. Therefore, the differencebetween the twosets of scores was not statistically significant.
2. A comparison of the comprehension scores of thetwo groups on the silent reading test revealeda mean of 177.00 for Group X—1, and 175.75 forGroup Y—l. The difference between the twomeans was 1.25 in favor of Group X—1. Thestandard error of the difference between themean was 6.53. The “t” ratio of .19 was notsignificant at the .01 level of confidence with22 degrees of freedom. Therefore, the differencebetween the two sets of scores on the componentof comprehension was not statistically significant.

110
3. A comparison of the rate scores of the groupson the Diagnostic Reading Pest indicated amean of 246.20 for Group X—1 and 266.20 forGroup Y—1. The difference between the mean was20.00 in favor of Group Y—1. The standard errorof the difference between the means was 14.11.The “t” ratio of 1.42 was not significant atthe .01 level of confidence with 22 degrees offreedom. Therefore, the difference between themean scores of the two groups was not significant.
4. A comparison of the comprehension scores of thetwo groups on the Diagnostic Reading Test revealed a mean of 26.75 for Group X—1 .and 24.40for Group Y—l. The difference between the twomeans was 2.35 in favor of Group X—1. Thestandard error of the mean was 1.91. The “t”ratio of 1.47 was not significant at the .01level of confidence with 22 degrees of freedom.Therefore, the difference between the means ofthe two groups on the component of comprehensiGawas not statistically significant.
Terminal Phase of the Study.
1. A comparison of the rate scores of Group X—2and Group Y—2 on the silent reading test indicated a mean of 168.01 and 165.76, respectively.The difference between tne two means was 2.25 infavor of Group X—2. The standard error of thedifference between the means was 4.26. The Ittli
ratio of. .53 was not significant at the .01level of confidenóe with 22 degrees of freedom.Therefore, the difference between the meanscores of the two groups on the component ofrate was not statistically significant.
2. Acompar~son of comprehension scores of the twogroups on the silent reading test indicated amean of 176.15 for Group X—2 and 181.15 forGroup Y—2. There was a difference of 5.00between the mean scores of the groups. Thisdifference was in favor of Group Y—2. Thestandard error of the difference between themeans was 6.15. The “t” ratio of .81 was notsignificant at the .01 level of confidencewith 22 degrees of freedom. Therefore, thedifference between the means of the two groupswas not statistically significant.

111
3. A comparison of Group X—2 and Group Y—2 on therate section of the Diagnostic Reading Test revealed a mean score of 250.30 for Group X—2 and255.50 for Group Y—2. The difference betweenthe mean scores of the two groups was 5.20 infavor of Group Y—2. The standard error of thedifference between the means was 11.50. The “t”ratio of .45 was not significant at the .01level of confidence with 22 degrees of freedom.The difference between the mean scores of thetwo groups was not statistically significant.
4. A comparison of Group X—2 and Y—2 on the comprehension section of the Diagnostic ReadingTest revealed a mean score of 27.08 for GroupX—2 and 27.17 for Group Y—2. There was a difference of .09 between the mean scores of thegroups. This difference was in favor of GroupY—2. The standard error of the difference be-.tween the means was 1.~3. The “t” ratio of .05was not significant at the .01 level of confidence with 22 degrees of freedom. Therefore,the difference between the two sets of scoreson the component of comprehension was notstatistically significant.
Additional Findings—Comparison of the groups at Different
Phases of the Study.
1. A comparison of the rate scores of Group X—1at the initial and intermediate phases of thestudy on the Iowa Silent Reading Test showedthe following results: a mean of 156.44 and 166,30 for initial and intermediate tests~respec—tively, with a difference of 9.86 in favor ofthe intermediate test; the standard error ofthe difference between the means was 5.11. The“t” score of 1.93 was not significant at the.01 level of confidence with 22 degrees offreedom. Therefore, the difference between theinitial and intermediate test results on thecomponent of rate was not statistically significant.
2. A comparison of the comprehension scores ofGroup X—l at the initial and. intermediate phasesof the Study on the Iowa Silent Reading Testshowed the following results: a mean of 168.90and 177.00 for the initial and intermediate testsrespectively, with a difference of 8.10 in favor

ii a
of the intermediate test; the standard errorof the difference between the means was 7.98.The “t” score of 1.02 was not significant atthe .01 level of confidence with 22 degreesof freedom. Therefore,, the difference betweenthe initial and intermeajate test results onthe component of comprehension was not statistically significant.
3. A comparison of the rate scores of Group Y—1at the i,nitial and intermediate phases of thestudy on the Iowa Silent Reading Test showedthe following results: a mean of 159.31 and169.99 for the initial and intermediate tests,respectively, with a difference of 10.68 infavor of the intermediate test; the standarderror of the difference between the means was6.13. The “t” score of 1.74 was not significant at the .01 level of confidence with 22degrees of freedom. Therefore, the differencebetween the initial and intermediate test re—suits on the component of rate was not statistically significant.
4. A comparison of the comprehension scores ofGroup Y—1 at the initial and intermediatephases of the study on the Iowa Silent ReadingTest showed the following results: a mean of166.31 and 175.75 for the initial and intermediate tests,respectively, with a differenceof 9.44 in favor of the intermediate test; thestandard error cf the difference between themeans was 5.32. The “t” score of 1.77 wasnot significant at the .01 level of confidencewith 22 degrees of freedom. Therefore, thedifference between the initial and intermdeiatetest results.was not statistically significant.
5. A comparison of the rate scores of Group X—lat the initial and intermediate phases of thestudy on the Diagnostic Reading Test showed thefollowing results: a mean of 239.50 and 246.20for initial and intermediate testsf.respectively,with a difference of 6.70 in favor of the intermediate test; the standard error of the diffex~ncebetween the means was 17.35. The “t” score of.39was not significant at the .01 level of confidence with 22 degrees of freedom. Theretore,the difference between the initial and intermediate test results on the component of ratewas not statistically significant.
11.3
6. A comparison of the comprehension scores ofGroup X—l at the initial and intermediatephases of the study on the Diagnostic Reading Test Showed the following results: amean of 24.00 and 26.75 for initial and intermediate tests, respectively, with a dif—.ference of 2.75 in favor of the intermediatetest; the standard error of the differencebetween the means was 1.78. The “t” ratioof 1.54 was not significant at the .01 levelof confidence with 22 degrees of freedom.Therefore, the difference between the meanscores of the two groups was not signifióant.
7. According to comparative data concerningGroup Y—l on the rate section of the Diagnostic Reading Test, the observed differencesbetween the initial and intermediate test wasobserved as follows: the mean scores were250.30 and 266.20,. respectively, with a difference of 15.90 in favor of the intermediatetest; the standard error of the differencebetween the two means was 9.27. The “t” of1.72 was not significant at the .01 level ofconfidence with 22 degrees of freedom. Therefore, the difference between the initial andintermediate testing on the component of ratefor Group Y—l was not statistically significant.
8. According to comparative data concerning GroupY—1 on the comprehension section of the Diagnostic Reading Test, the observed differencesbetween the initial and intermediate test wasobserved as follows: the mean scores were 24.70and 24.40~respectively, with a difference of.30 in favor of the initial test; the standarderror of the difference between the two meanswas 1.87. The “t” of .16 was not significantat the .01 level of confidence with 22 degreesof freedom. Therefore, the difference betweenthe initial and intermediate testing on thecomponent of comprehension was not statisticallysignificant.
9. According to comparative data concerning GroupX—2 on the rate section of the Iowa SilentReading Pest, the observed differences betweenthe intermediate and terminal test was observedas follows: the mean scores were 166.30 and

114
168.0i,respectively, with a difference of1.71 in favor of the terminal test; thestandard error of the difference betweenthe two means was 5.66. The “t” of .30 wasnot significant at the .01 level of confidence with 22 degrees of freedom. Therefore, the difference between the intermediateand terminal testing on the component of ratewas not statistically significant.
10. A comparison of the comprehension scores ofGroup X—2 at the intermediate and terminalphases of the study on the Iowa Silent Reading Test showed the following results: amean of 177.00 and 176.15 for the intermediateand terminal tests,respectively,with a difference of .85 in favor of the intermediatetest; the standard error of the differencebetween the means was 6.20. The ~‘t” score of.14 was not signifioai~t at the .01 lovol ofconfidenóe with 22 degrees of freedom. Therefore, the difference between the intermediateand terminal test results on the component ofcomprehension was not statistically significant.
11. A comparison of the rate section of the IowaSilent Reading Test for Group Y—2 indicatedthat the observed difference between the re—suits on the intermediate and terminal testwas observed as follows: a mean of 169.99and l65.76,respectively, with a differenoeof 4.23 in favor of the intermediate test;the standard error of the difference betweenthe means was 3.53. The “t” ratio of 1.20was not significant at the .01 level of confidences was 22 degrees of freedom. Therefore, the difference between the intermediateand terminal test results was not statistically significant.
12. A comparison of Group Y—2 on the comprehensionsection of the Iowa Silent R5ading Test indicated the results on the intermediate andterminal test to be observed as follows: amean score of 175.75 and 18l.15,;respectively,with a difference of 5.40 in favor of theterminal test; the standard error of the difference between the two means was 6.48. The“t” score of .83 was not significant at the.01 level of confidence with 22 degrees offreedom. Therefore, the difference between

115
the intermediate and terminal testing wasnot statistically significant.
13. According to comparative data concerningGroup X—2 on the rate section of the Diag—nostic Reading Test, the observed differencesbetween the intermediate and terminal testwas observed as follows: the mean scores were246.30 and 250.30, respectively, with a difference of 4.10 in favor of the terminal test;the standard error of the difference betweenthe two means was 15.50, The “t” score of.26 was not significant at the .01 level ofconfidence with 22 degrees of freedom. Therefore, the difference between the intermediateand terminal testing on the component of ratefor Group X—2 was not statistically significant.
14. A comparison of the comprehension section ofthe Diagnostic Test for Group X—2 indicatedthat the observed difference between the re—suits on the intermediate and terminal testwas observed as follows: a mean of 26,75 and27.08, respectively, with a difference of .33in favor of the terminal test; the standarderror of the difference between the means was1.67. The “t” ratio was not significant atthe .01 level of confidence with 22 degrees offreedom. Therefore, the difference betweenthe intermediate and terminal test results wasnot statistically significant.
15. According to comparative data concerning GroupY—2 on the rate seeWn of the Diagnostic Reading Test, the observed differences between theintermediate and terminal test was observed asfollows: the mean scores were 266.20 and 255.50,respectively, with a difference of 10.70 infavor of the intermediate test; the standarderror of the difference between the two meanswas 9.54. The “t” score of .12 was not significant at the .01 level of confidence with 22degrees of freedom. Therefore, the differencebetween the intermediate and terminal testingon the component of rate for Group Y—2 was notstatistically significant.
16. A comparison of the comprehension scores ofGroup Y—2 at the intermediate and terminal
116
phases of the study on the Diagnostic Reading Test showed the following results: amean of 24.40 and 27.17, respectively, witha difference of 2.77 in favor of the terminaltest; the standard error of the differencebetween the two means was 1.83. The “t” ratioof 1.51 was not significant at the ~fl level ofco~ifidence with 22 degrees of freedom. There—fore, the difference between the intermediateand terminal test results was not statisticallysignificant.
Conclusions
The conclusions of this study are based on the
findings just enumerated.
1. At the beginning of this experiment both groupswere equivalent in intelligence, lower in ratethan in comprehension, and were,therefore,in aposition to make comparabb gains under eitherthe book—centered or machine approach.
2. Likewise, the initial test results indicatedno significant differences in rate of readingof the two groups; hence, neither had aninitial advantage over the other in this mainvariable with which the study was concerned.
3. There was a significant difference between thecomprehension scores made on the oral readingtest. Since oral reading is considered a muchslower process than silent reading it was concluded that that difference which favored GroupX—l was further evidence of the students’ needfor help in the area of rate of comprehension.
4. At the beginning of the experiment Group X—1manifested a slight superiority over GroupY—1 on certain components measured by theReading—Eye Camera. This slight superiorityin rate persisted throughout the experiment,but only at a numerical level rather than astatistically significant one. This findingwas therefore used for purposes of implication.
5, Both groups gained consistently during thetotal period of experimentation; however, aftereach phase of the experiment the group using

117
the machine approach usually had higher numerical gains in reading rate than did the groupusing the book—centered approach. The groupusing the book—centered approach scored consistently higher in comprehension. Thesefindings permitted the conclusion that therewas a relatively consistent tendency for students to make more improvement in rate ifmechanical devices were used and to make moreimprovement in comprehension if the focus wason books designed for advancing rate of comprehension.
6. Within the groups the comparison of the twoprocedures showed no statistically significantdifferences in tested reading rate or comprehension; hence, any numerical advantage wasinterpreted as inferential rather than conclusive.
7. The final test results indicated that bothgroups showed considerable progress in rateand comprehension, thereby supporting thecurrently—popular position that both methodsare effective in the improving of rate ofreading comprehension.
The implications which grew out of the findings and
conclusions of this study are as follows:
1. General trends in the data led the writer toinfer that both the book—centered and machineapproaches have their respective advantagesin the improvement of rate of reading comprehension.
2. The very considerable progress made at eachpoint in the experiment implies that bothmethods have the possibility of advancingreading efficiency (rate ,~ comprehension).
3. The instances of numerical superiorty withinGroup X may find a part of their explanationsin further analysis of the oral reading testresults, with specific emphasis on the advantage in comprehension, and in more extensiveuse of the Reading—Eye Camera, with a closerlook at the initial advantage which this grouphad in rate.
118
4. Proper timing and pacing of the two methodsin terms of the needs of the students mightbecome the basis for a more highly integratedapproach to increased improvement of readingrate and comprehension than has been reportedin the literature. r2hjs implication was basedon the relatively consistent tendency for students to make more improvement in rate underthe machine approach and more in comprehensionunder the book—centered method.
The findings, conclusions, and implications were
considered basic to the following recommendations:
1. That for maximum achievement in reading, theprogram should include both approaches to improvement of rate of reading.
2. That a. variety of practice materials should beavailable for use with the book—centered approach.
3. That all students who can profit from instruction in improving rate of reading should begiven the opportunity to do so through highly integrated and interrelated uses of both methodof instruction.
4. That the subjects of this study be challengedto continue to improve their rate of readingthrough provision of a generous supply ofappropriate practice materials and mechanicaldevices which can be used on an individualizedbasis.
5. That a follow—up study of these subjects beinitiated in order to determine the degree towhich this improvement in rate of reading mightlead to later achievement in reading and related areas.

H

SPEED OF INTERPRETATION
EXERCISE 3
Directions: Is it readable? Does it normally have wordsthat can be read by the average citizen?Place a check mark beside each item whichmentions something that can be read.
Samples: a letter from home..~.Oriental rugs
Startt
l....a long time
2....spring blossoms
3....]arks and robins
4....forty years
5....a typed sentence
6...,shrill whistle
7..,.address on the envelope
8..,.title of a book
9....a joke book
lO....a victory
ll....printed list of rules
12.. • .Monday evening
13....a strong editorial
14....a book of essays
15....sing together
16....walk a mile
17....a new hair style
1$....a “For Sale” sign
19....Miss Chase’s brother
20.... .tending blackberries
21.. • .the oldtimers
22.. ..magazine advertisement
23... . carefully writtenpages
24....had grown up
25....the prisoner’s diary
26....last will and testa—meat
27....a driver’s license
28....letter to the editor
29..,.the old rat race
30..~.a disturbing thought
al....label on a can
3~2....by the time
33....in a frenzy
120

121
34,...all too late
35....sign a contract
36....sorry for yourself
37....message on the postal
38....accept no favors
39....saw a strangerwalking
40....a new manuscript
StopL
Errors..........
122
Name_________________________ Date______________
Directions:~ I~rk the phrase closest in meaning to thefirst phrase.
1. Classified as sensitive: highly concentrated; devoted to pleasure; conveying a message; to takepart in; having the capacity of rec~i.ving impressions.
2. A very robust person: one who displays strength orvigor; allowed special privileges; marked by crime;efficient as can be; a rodent animal.
3. Any opposing force: device for artifi~l respiration; a stopping place; a resting place; primarycause; a great resistance.
4. Worthy of respect: supporting an answer; decent inbehavior and character; short pause in reading; toresume speed; to progress onward.
5. Available means: to prevent inhalation; reservesource of supply; characterized by responses; actof resounding; to dissolve.
6. That which is parallel: sometimes restricted; anymarch or procession; a resemblance; lying evenlyeverywhere in the same direction; consisting ofseveral paragraphs.
7. That which is nonsense: to determine; a peculiar sortof type 4. having no meaning; being standard; an interiorcorner.
8. During the noonday: sometime in the evening; in themiddle of the day; under obligation; of differentvariety; coming from the other direction,
9. Under normal conditions: occuning naturally; thingsof no importance; to reduce in size; from the outside; a native or inhabitant.
10. Of a lazy nature: an allowance of time; never thesame; during the service; disinclined to action; neverthe same,
11. An inanimate object: inward bound, want of caution;not having life; unfavorable weather; a small distance.

123
12. True to history: to come upon or me*; beinghistorical; a stop or sudden halt; a hiddensupply; of absolute value.
13. Of comparative excellence; a piece of armor; toreplenish with care; that which is good; one holdingcommon views; a common word.
14. Of good humor: more generalized; various situations;having ornamental design; one who is pleasant and
dkeerfui.
15. Being the most remote: lessening of the power; toprovide what is necessary; furthermost away; lighterin color; a decorative design.
16. Time that is to come: to a great extent; withoutprospects; to banish from the earth; done by stealth;that which is the future.
1. Delirious excitement: characteristic of; to a factwith frenzy; to harden; of various classes; notedfor its beauty.
18. State of being friends: case of sickness; art of~. eating; what is known as friendship. immediate
change; current material.
19. A duplicate of something: to react as a pet; tocause to wither; last part of a course; a thingthat promotes; an exact copy of ~e o~1ginal,
20. To droop: lifting carefully; process of drifting;showing promise; to hand bending downwards; tochase.
Time_________________________ NO. Wrong.~

124
Time Record for SRA. Better Reading Books
Article
FinishingTime
StartingTime
ReadingRTimeReading
Rate
Answer Record for ~RA Better Reading Books
Tes1
2
-3
4
5
6
7
8
9
10
11
12
13
14
15
16
~core
125
CONTROLLED READING INDIVIDUAL PROGRESS CHART
Name - Date____________
80Q,
750
TOIL
400
350
300
250
20017515~125100
90807060
650
600
550~
500
450
bU4~—3V
0~

126
LEVEL I SVE GRAD~ PHRASES
Group 1
1. included the documents2. feared the drought3. was cast in a dungeon4, wrought from rare ebony5. planned for an education6. made of elastic fabric7, equipped with electricity8. contained another element9. ements a strange aroma
10. paid the faithful employee11. maintained great endurance12. endured considerable pain13. fought the enraged rhinoceros14. entered the private sanitarium15. left it entirely up to him16. placed in a manila envelope17. the result was quite evident18. will exhaust every resource19. often exploits the workers20. was dodging his enemies21. lived in a simple dwelling22. caught the wriggbng eel2:3. the mischievous little elf24. encroaching on his rights25. tried to entice him away
Group ~2
1, equip t~ new laboratory2, was an errant knight3. spoke to his excellency4. exhhange the nylon socks5. exhibit the art work6, was sent into exile7. no longer in existence8. attempt to explain it9. was extolling his worth
10. an extremely pretty child11. extract the aching tooth12. bowed to the exalted ruler13, raised his heavy eyebrows14. heated to a high degree15. paid upon its delivery16. 1i~ed in a democracy17, believed in democratic ways

127
18. arrived at the solution19. belonged to a detached group20. try not to detain them21. dilute the strong solution22.. able to discern the cause23. watched the wobbly cafe24. speeded their departure25. workdd in the same department
Group 3
1. despite the great problems2. was despondent and alone3. detect the slight error4. determine the consequence5. left with determination6. was absetted by the devil7. had a case of diphtheria8. earned .a college diploma9. never came directly home
10. went away in disgust11. was a dismal failure12. dismantle the old plane13. dispatch the urgent message14. recommended a new remedy15. learned by repetition16. lived in a great republic17. require considerable food18. resent the studious pupil19. gave considerable resistance20. resort to various practices21. fought in the revolution22. had a revolutionary idea23. will ruffle his feathers24. kept a bird sanctuary25. bought a small remnant
Group 4
1. lived in a remote area2. seemed very reproachful3. willresign very soon4. made a favorable response5. took on greater responsiLility6. will resume the duty7. revive the fainting girl8. used a small revolver9. cooked the red rhubarb

128
Group 4
10. liked to roam by himself11. enjoyed the western rodeo12. -answered with a rueful look13. the cheerful solution14. always salute the flag15. fascinated with the tale16. heard a fantastic story17. was suffering from fatigue18. opened the water faucet19. played on the flute20. focus your eyes here21. cut the fragant alfalfa22. helped the frail invalid23. disappeared quite frequently24. enjoyed the moist fudge25. seemed faintly familiar

FORMULAS
1. Mean ___
2. Median = L ~ b )-~--
\fJp
3, Standard Deviation ~‘fx2 LEfxl) 2
4. Standard Error ______
V N.4
5. Difference
6. Standard Error of Difference = ~
7. t’~1~ = M1.~.M2S.E.D

BIBLIOGRAPHY
Books
Bond, Guy L~ and Wagner, Eva B. Teaching the Child toRead. New York: Macmillan Company, 1960.
Harris, Albert J. Effective Teaching of Reading. New.York: David McKay Company, Inc., 1962.
________________ How To Increase Reading Ability.
New York: David McKay Company, Inc., 1962.
Hildreth, Gertrude. Teaching Reading. New York: Holt,Rhinehart and Winston, Inc., 1958.
McKee, Paul. The T~acbing of Reading in the ElementarySchool. Boston: Houghton M~fflin, 1948.
Smith, Henry P. and Dechant, Emerald V. Psychology inTeaching Reading. Englewood Cliffs, N.J.:Prentice—Hall, Inc., 1961.
Spache, George D. Toward Better Reading. Champaign,Illinois: Garrard Publishing Company, 1962.
Taylor, Stanford E. Eye—Movement Photography with theReading Eye. Huntington, New York: EducationalDevelopmental Laboratories Inc., 1959.
_________________ and FraCkenpohi, Helen. Controlled
Reader Techniques. Huntiágton, New York: Educational Developmental Laboratories, Inc., 1958.
Periodicals
Allen, Robert M. “Adult Reading Improvement at anArmy Service School “ School and Socie~y,
- L2~IV (August, 1959 ~.
Andrews, Joe 3. “An Approach to Speed Reading,”English Journal, XLI (September, l9~2).
130
131
Barry, Robert F. and Smith, Paul E. “An Experimentin Ninth—Grade Reading Improvement,” Journalpf Educational Psychology, XLV (November, 1954).
Bayle, Eva].yn, “The Nature and Causes of RegressiveMovements in Reading,” Journal of Experimental~4ucation, XI (September, 1942;).
Bottom].y, Forbes. “An Experiment With The ControlledReader,” Journal of Educational Research. LIV(March, 1961).
Bramm, Leonard, “Developing and Measuring Flexibilityof Reading,” The Reading Teacher, XVI (January,1963).
Carrillo, Lawrence W. and Sheldon, William D. ttpheFlexibility of Reading Rate,” Journal ofEducational Psychology, XLIII (May, 1952).
Cosper, Russell and Kephart, Newell C. “Retention ofReading Skills,” Journal of Educational Research,XLIX (November, 1955).
Gates, Arthur I. “Teaching Machines in Perspective,”Elementary School Journal, LXII (October, 1961).
Hadley, L.W. “New College Students Lack Study Techniques,”School and Society, L~XV (November, 1957).
Hoffman, Paul A. “Outcomes of Controlled Reading,” Clearing House, Xxxvii (October, 1962).
Letson, Charles T. “The Relative Influence of Materialand Purpose on Reading Rates,” Journal of Educational Research, LII (February, l95~.
Manolakes, George, “The Effects of TachistoscopicTraining in an Adult Reading Program,” Journal ofADolied Psychology, xxxvi (December, 1952).
Robinson, Helen M. and Smith Helen K. tiRate Problemsin the Reading Clinic,” The Reading Teacher, XV(May, 1962).
Smith, Edwin H. and Mary P. “Speed Reading in theMachine Age,” College English, Xx (February, 1959).

132
Speer, George S. “Using Mechanical Devices Can I~—crease Speed of Reading,” School and Society,XXXIX (February, 1934).
Tinker, Miles A. “The Role of Eye Movements in Diagnosticand Remedial Reading,” School and Society, XXXIX(February, 1934).
_____________ “Eye—%vements in Reading,” Education
LXXIX (May, 1959).
Thompson, Warren C. “A Book Versus Machine,Experimentin Adult Reading Improvement,” College English,XV (May, 1954).
Wedeen, Shirley Uliman, “Mechanical Versus Non—MechanicalReading Techniques for College Freshmen,” School andSociety, LXXXXIX (April, 1954).
Witty, Paul. “Evaluation of Methods and Devices to ImproveReading Rate and Comprehension,t’ ElementaryEnglish,XXXI (May, 1954).
Wooster, George F. “An Experimental Study of the Reading—rate Controller,” Journal of Educational Psychology,XLV (November, 1954).
Unpublished Materials
Parker, Walter R. “An Evaluation of the Effectiveness ofa Co11e~Level Reading Program,” Unpublished Ph. D.dissertation, University of North Carolina atChapel Hill, 1963.
Yearbooks
Jones, Earnest A. “A Small College Reading Program,”Techniques and Procedures in ~ollege and AdultReading Programs, The Sixth Yearbook of the South—west Reading Conference for College andUniversities, Fort Worth: Texas Christian UniversityPress, 1957.
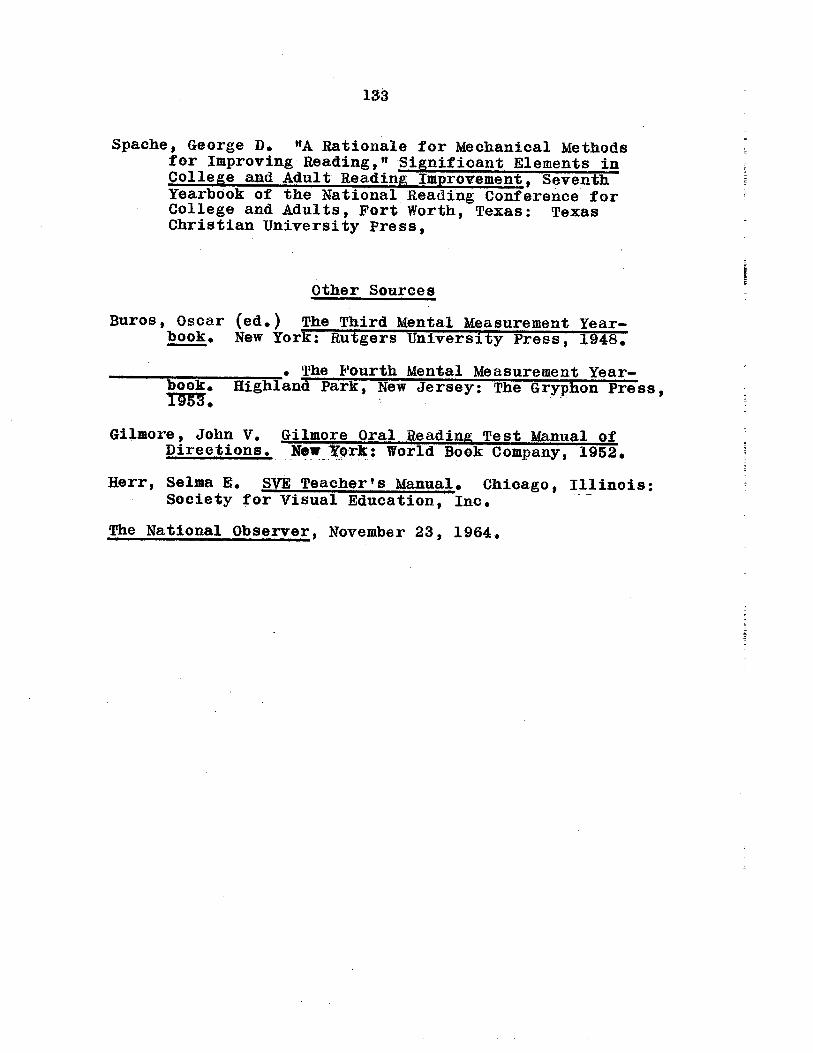
133
Spache, George D. “A Rationale for Mechanical Methodsfor Improving Reading,” Significant Elements inCollege and Adult Reading Improvement, SeventhYearbook of the National Reading Conference forCollege and Adults, Fort Worth, Texas: TexasChristian University Press,
Other Sources
Buros, Oscar (ed.) The Third Mental Measurement Yearbook. New York: Rutgers University Press, 1948.
___________________ The Fourth Mental Measurement Year
book. Highland Park, New Jersey: The Gryphon Press,1953.
Gilmore, John V. Gilmore Oral Reading Test Manual ofDirections. New York: World Book Company, 1952.
Herr, Selma E. SVE Teacher’s Manual. Chicago, Illinois:Society for Visual Education, Inc.
The National Observer, November 23, 1964.

VITA
Woodson, Daisy L0uise
Education: B. S. Morris Brown College,Atlanta, Georgia, 1963.
Major — Elementary Education
Experience: Graduate Assistant in Reading At Morris Brown College1963—64.
Personal Information: Single, member of St. PaulA.M.E. Church, StoneMountain, Georgia.
:1.34