Embed Size (px)
Citation preview

W&M ScholarWorks W&M ScholarWorks
Dissertations, Theses, and Masters Projects Theses, Dissertations, & Master Projects
1995
A Comparison of Three Wetland Evaluation Methods in their A Comparison of Three Wetland Evaluation Methods in their
Assessment of Nontidal Wetlands in the Coastal Plain of Virginia Assessment of Nontidal Wetlands in the Coastal Plain of Virginia
Melissa Claire Chaun College of William and Mary - Virginia Institute of Marine Science
Follow this and additional works at: https://scholarworks.wm.edu/etd
Part of the Water Resource Management Commons
Recommended Citation Recommended Citation Chaun, Melissa Claire, "A Comparison of Three Wetland Evaluation Methods in their Assessment of Nontidal Wetlands in the Coastal Plain of Virginia" (1995). Dissertations, Theses, and Masters Projects. Paper 1539617683. https://dx.doi.org/doi:10.25773/v5-0jfm-t183
This Thesis is brought to you for free and open access by the Theses, Dissertations, & Master Projects at W&M ScholarWorks. It has been accepted for inclusion in Dissertations, Theses, and Masters Projects by an authorized administrator of W&M ScholarWorks. For more information, please contact [email protected].

A COMPARISON OF THREE WETLAND EVALUATION
METHODS IN THEIR ASSESSMENT OF NONTIDAL
WETLANDS IN THE COASTAL PLAIN OF VIRGINIA
A Thesis
Presented to
The Faculty of the School of Marine Science
The College of William and Mary in Virginia
In Partial Fulfillment
Of the Requirements for the Degree of
Master of Arts
by
Melissa Claire Chaun
1995

APPROVAL SHEET
This thesis is submitted in partial fulfillment of the requirements for the degree of
Master of Arts
Melissa C. Chaun
Approved, December 1995
Carlton H. Hershner, Ph.D. Committee Chairman/Advisor
Thomas A. Barnard Jr., MrA.
^*r/James E. Kirkley, Ph.D j
James E. Perry III, Ph.D.
Gene M. Silberhom, Ph.D.
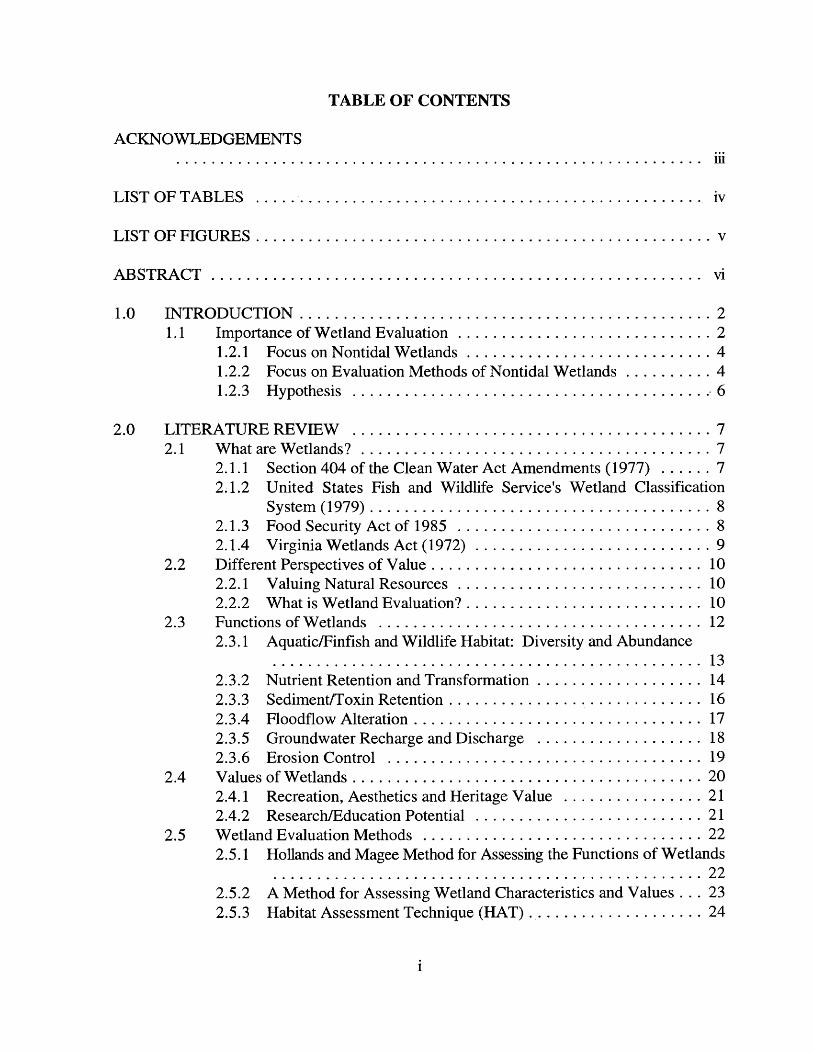
TABLE OF CONTENTS
ACKNOWLEDGEMENTS
LIST OF TABLES ........... iv
LIST OF FIGURES.................................................................................... v
A BSTR A CT.......................................................................................................................... vi
1.0 INTRODUCTION........................................................................................................ 21.1 Importance of Wetland E valuation..................................................................2
1.2.1 Focus on Nontidal W etlands..............................................................41.2.2 Focus on Evaluation Methods of Nontidal W etlands......................41.2.3 Hypothesis .......................................................................................... 6
2.0 LITERATURE REVIEW ...........................................................................................72.1 What are W etlands?..........................................................................................7
2.1.1 Section 404 of the Clean Water Act Amendments (1977) .............72.1.2 United States Fish and Wildlife Service's Wetland Classification
System (1979)...................................................................................... 82.1.3 Food Security Act of 1985 ................................................................82.1.4 Virginia Wetlands Act (1 9 7 2 )........................................................... 9
2.2 Different Perspectives of V alue...................................................................... 102.2.1 Valuing Natural R esources.............................................................. 102.2.2 What is Wetland Evaluation?............................................................10
2.3 Functions of Wetlands ....................................................................................122.3.1 Aquatic/Finfish and Wildlife Habitat: Diversity and Abundance
............................................................................................................. 132.3.2 Nutrient Retention and Transformation.......................................... 142.3.3 Sediment/Toxin Retention................................ 162.3.4 Floodflow Alteration......................................................................... 172.3.5 Groundwater Recharge and Discharge .......................................... 182.3.6 Erosion Control ................................................................................19
2.4 Values of W etlands.......................................................................................... 202.4.1 Recreation, Aesthetics and Heritage Value ................................... 212.4.2 Research/Education Potential ......................................................... 21
2.5 Wetland Evaluation Methods ........................................................................ 222.5.1 Hollands and Magee Method for Assessing the Functions of Wetlands
222.5.2 A Method for Assessing Wetland Characteristics and Values . . . 232.5.3 Habitat Assessment Technique (HAT) ..........................................24

2.5.4 Wetland Evaluation Technique II (WET I I ) ....................................252.5.5 Manual for Assessment of Bottomland Hardwood Functions (WET-
BLH) ..................................................................................................262.5.6 Method for the Evaluation of Inland Wetlands in Connecticut: A
Watershed Approach......................................................................... 272.5.7 Method for the Comparative Evaluation of Nontidal Wetlands in New
Hampshire .........................................................................................272.5.8 A Technique for the Functional Assessment of Nontidal Wetlands in
the Coastal Plain of V irg in ia ............................................................282.5.9 Canada's Wetland Evaluation Guide ...............................................29
3.0 METHODS AND SITE DESCRIPTIONS............................................................... 313.1 Selecting the Evaluation M ethods.................................................................. 313.2 Site Selection................................................................................................... 323.3 Materials ..........................................................................................................343.4 Data A nalysis................................................................................................... 35
3.4.1 Field Component................................................................................353.4.2 Theoretical Component.....................................................................36
4.0 R ESU LTS.......................................................... 50
5.0 DISCUSSION............................................................................................................. 53
6.0 CONCLUSIONS / MANAGEMENT IMPLICATIONS .......................................65
APPENDIX A: FIELD RESU LTS...................................................................................... 70
APPENDIX B: WEIGHTING THE FA CTO RS................................................................ 76
APPENDIX C: COMPARATIVE RANKING OF FACTORS ...................................... 123
APPENDIX D: EXAMPLES OF QUESTIONS / INTERPRETATION KEYS FROMEACH OF THE THREE M ETHODS...........................................129
REFERENCES......................................................................................................................139
VITA 146

ACKNOWLEDGEMENTS
My sincere gratitude and appreciation goes out to all the individuals who have influenced my life and work here at VIMS. First, I am indebted to Dr. Carl Hershner, my advisor and committee chairman, for his guidance, support and infinite patience during the progress of this project. Dr. Hershner provided the idea, but as a true mentor, allowed me to run with it. I would like to thank the rest of my committee, Tom Barnard, Jim Perry, Jim Kirkley and Gene Silberhom, for their input and support. A very special thank you goes to Pamela Mason whose never-ending encouragement helped me through the challenging times. I also wish to extend my gratitude to Julie Bradshaw for her invaluable insight and trust as I critiqued her VIMS Technique!
There are several other individuals I would like to recognize: Michelle Fox, Pamela Mason, Rebecca Smith and Dr. Gerry Johnson, for helping me with field work; Dr. David Evans, for his statistical reinforcement of my data analysis; Ms. Marilyn Lewis, for retrieving all that much needed literature; the trailer crew, Sharon Dewing, Julie Glover and Anna Kenne, for their hours of counsel in exposing me to the fine art of digitizing in ARC/Info, and to everyone in the Wetlands Program, for sharing their knowledge and enthusiasm of this precious resource.
Finally, I want to thank my parents, Hugh and Pamela Chaun, for their unconditional love and support in whatever I do. The greatest recognition, however, goes to God. Without Him, none of this would have been possible.
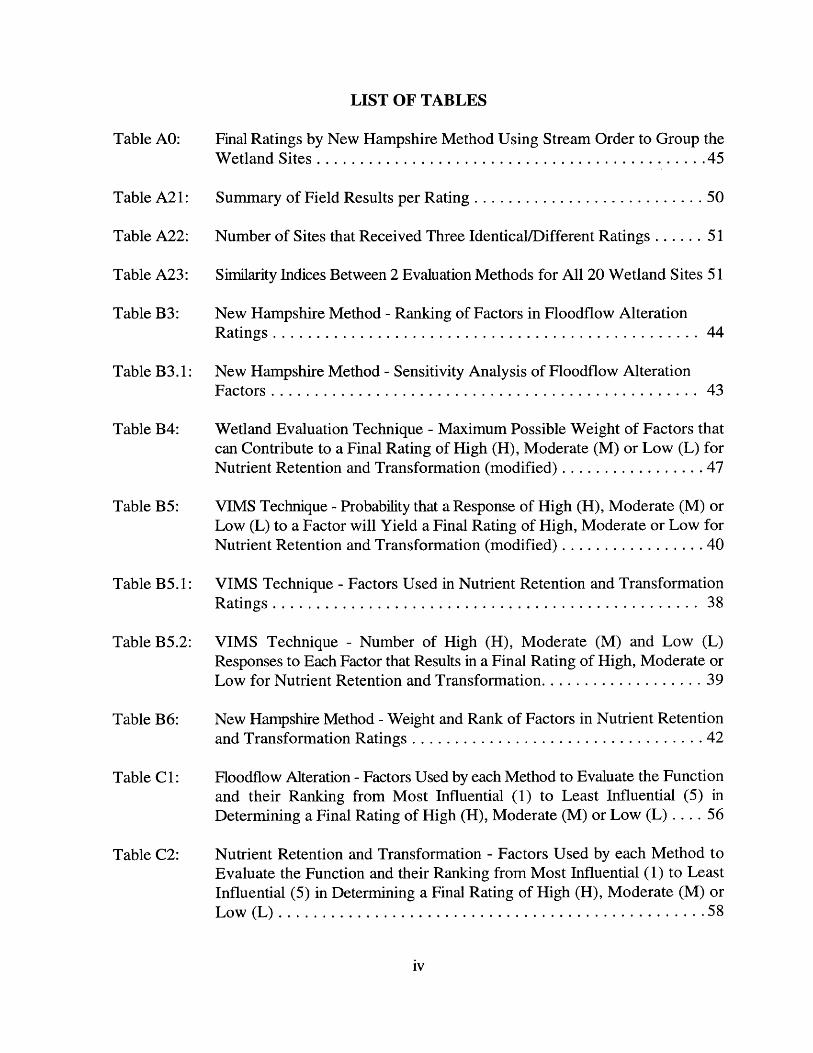
LIST OF TABLES
Table AO:
Table A21:
Table A22:
Table A23:
Table B3:
Table B3.1:
Table B4:
Table B5:
Table B5.1:
Table B5.2:
Table B6:
Table Cl:
Table C2:
Final Ratings by New Hampshire Method Using Stream Order to Group the Wetland S ites..................................................................................... 45
Summary of Field Results per R ating..........................................................50
Number of Sites that Received Three Identical/Different Ratings 51
Similarity Indices Between 2 Evaluation Methods for All 20 Wetland Sites 51
New Hampshire Method - Ranking of Factors in Floodflow Alteration Ratings............................................................................................................ 44
New Hampshire Method - Sensitivity Analysis of Floodflow Alteration Factors.............................................................................................................43
Wetland Evaluation Technique - Maximum Possible Weight of Factors that can Contribute to a Final Rating of High (H), Moderate (M) or Low (L) for Nutrient Retention and Transformation (modified)....................................47
VIMS Technique - Probability that a Response of High (H), Moderate (M) or Low (L) to a Factor will Yield a Final Rating of High, Moderate or Low for Nutrient Retention and Transformation (modified)....................................40
VIMS Technique - Factors Used in Nutrient Retention and Transformation R atings............................................................................................................ 38
VIMS Technique - Number of High (H), Moderate (M) and Low (L) Responses to Each Factor that Results in a Final Rating of High, Moderate or Low for Nutrient Retention and Transformation.........................................39
New Hampshire Method - Weight and Rank of Factors in Nutrient Retention and Transformation Ratings............................................... 42
Floodflow Alteration - Factors Used by each Method to Evaluate the Function and their Ranking from Most Influential (1) to Least Influential (5) in Determining a Final Rating of High (H), Moderate (M) or Low (L) . . . . 56
Nutrient Retention and Transformation - Factors Used by each Method to Evaluate the Function and their Ranking from Most Influential (1) to Least Influential (5) in Determining a Final Rating of High (H), Moderate (M) or Low (L ) ........................................................................................................... 58

Table C3: Sediment/Toxin Retention - Factors Used by each Method to Evaluate theFunction and their Ranking from Most Influential (1) to Least Influential (4) in Determining a Final Rating of High (H), Moderate (M) or Low (L) . . 60
Table C4: Aquatic/Finfish Habitat - Factors Used by each Method to Evaluate theFunction and their Ranking from Most Influential (1) to Least Influential (5) in Determining a Final Rating of High (H), Moderate (M) or Low (L) . . 63
Table C5: Wildlife Habitat - Factors Used by each Method to Evaluate the Function andtheir Ranking from Most Influential (1) to Least Influential (13) in Determining a Final Rating of High (H), Moderate (M) or Low ( L ) . . . . 54
Table C6: Similarity Indices Between 2 Evaluation Methods in the Type of Information(Factors) Used to Evaluate the 5 Functions................................................ 55
Table C7: Similarity Indices Between 2 Evaluation Methods in the Ranking of theFactors Used to Evaluate the 5 Functions................................................ 55
Table Dl: Landscape Management Information - Floodflow Alteration.................... 68
Table D2: Landscape Management Information - Nutrient Retention/Transformation . 68
Table D3: Landscape Management Information - Sediment/Toxin Retention 68
Table D4: Landscape Management Information - Aquatic/Finfish Habitat..................69
Table D5: Landscape Management Information - Wildlife Habitat..............................69
LIST OF FIGURES
Figure 1: Location of Wetland Sites in the York River Basin, Virginia..................... 33
v
ABSTRACT
Three wetland evaluation methods were compared to determine whether they were interpreting the wetland science in the same way. The methods used were: 1) Wetland Evaluation Technique (WET II), 2) A Technique for the Functional Assessment of Nontidal Wetlands in the Coastal Plain of Virginia (VIMS Technique); and, 3) Method for the Comparative Evaluation of Nontidal Wetlands in New Hampshire (New Hampshire Method). Twenty nontidal wetlands in the coastal plain of Virginia were evaluated by all three methods to see whether the methods gave the same ratings for the same wetland. Each method uses a unique qualitative evaluation/interpretation scheme, and thereby incorporates an element of professional judgment, to predict either a high, moderate or low probability that a particular wetland will perform a certain function. Although the methods vary in the number of functions/values they assess, there are five functions/values common to all: floodflow alteration, nutrient retention and transformation, sediment/toxin retention, wildlife habitat and aquatic habitat. The interpretation key for each of the five functions/values was scrutinized individually for the types of information required to evaluate the function and how that information was used to obtain the final rating for the function. It was hypothesized that all three methods would give similar ratings for the same wetland since all three claim to be scientifically defensible, based on the current scientific literature. The field results, however, reveal differences among the three methods in their assessment of each wetland. Furthermore, from the "sensitivity" analyses performed on the interpretation keys, it appears as though the wetland science is not being interpreted identically by all three methods. This comparative study demonstrates that the process by which science is interpreted and incorporated into a practical planning/management tool is anything but straightforward.
vi

A COMPARISON OF THREE WETLAND EVALUATION
METHODS IN THEIR ASSESSMENT OF NONTIDAL
WETLANDS IN THE COASTAL PLAIN OF VIRGINIA
1.0 INTRODUCTION
1.1 Importance of Wetland Evaluation
Wetlands of the United States can be divided into two principal classes according to water
regime: tidal and nontidal wetlands. The coastal plain of Virginia is the relatively flat land
east of U.S. Route 95 and influenced by the Chesapeake Bay and its tributaries. Virginia
comprises approximately 26.1 million acres, of which there are 387,300 acres (1.48%) of
coastal tidal wetlands (Field, Reyer, Genovese, and Shearer, 1991). Tidal wetlands generally
refer to coastal marshes, mudflats and mangrove swamps that are subjected to periodic
flooding by ocean-driven tides (Burke, Meyers, Tiner and Groman, 1988).
Nontidal coastal v/etlands in Virginia comprise some 525,700 acres (2.01% of Virginia) (Field
et al., 1991). Nontidal wetlands represent a diverse range of wet inland environments. They
consist of freshwater marshes and ponds, shrub swamps, bottomland hardwood forests,
wooded swamps and bogs, as well as inland saline and alkaline marshes and ponds (Burke et
a l , 1988). They are typically created by a combination of surface-water flooding or ponding,
and groundwater discharge. They therefore form along nontidal rivers, streams, lakes and
ponds; in isolated upland depressions where surface water accumulates; in conjunction with
springs and seeps (areas of active groundwater discharge); and where the water table remains
near the surface for some time. In such areas the soil becomes saturated to form hydric soils,
and plants, known as hydrophytes, adapted for life in wet, predominantly anaerobic conditions
become established to form nontidal wetlands (Burke et al., 1988). The formation of
anaerobic conditions following the onset of flooding or saturation depends upon such factors
as soil type, amount of organic material in the soils, soil temperature, and the chemical oxygen
demand of the reducing ions. The low oxygen availability reduces, or in many plant species
inhibits, metabolic activities of the roots and affects nutrient uptake and mobilization. These
conditions also result in the accumulation of reduced forms of iron, manganese, sulphur and
carbon to levels that are toxic to most plants (Coburn, 1993).
2

The evaluation of wetlands has occupied the interests of both scientists and politicians, with
resource managers playing the key liaison. Where wetlands were once valued primarily as
habitat for wildlife, particularly migratory birds, the legal basis for present day wetland
regulation is the recognition that these landscape units have ecological functions of
importance to public health, safety and welfare (Larson, 1990), as well as to the surrounding
environment. Human threats to wetlands include draining, dredging, filling, construction of
shoreline structures, groundwater withdrawal and impoundments. From 1956 to 1977,
Virginia lost over 63,000 acres of tidal wetlands and nontidal vegetated wetlands,
representing almost 7% of the state's total wetlands acreage (Tiner, 1987). Direct conversion
of wetlands to cropland was the major cause of inland wetland loss. Coastal wetland loss was
primarily due to urban development and coastal water impoundments (ibid).
Early efforts at wetland evaluation focussed on estimates of the dollar value of the wildlife
product or of the number of days of recreational use (Larson, 1990). Since the early 1970's,
numerous wetlands evaluation methods have been developed as a management tool in the on
going conflict between conservation goals and development pressures. Methods have been
designed by federal/state agencies, private consulting firms, and the academic community to
ascertain all known wetland functions and values, or a selected few. They have been created
to produce a verifiable and reproducible outcome which can be applied in a number of ways:
comparison of two or more wetlands; prioritization of wetlands for acquisition, research or
advanced identification; enumeration of possible permit conditions; prediction of project
impacts on wetland functions and values; and, comparison of created or restored wetlands
with reference or pre-impact wetlands for mitigation purposes (Adamus, Stockwell, Clairain,
Smith and Young, 1987).
3

1.2 Purpose of Study
1.2.1 Focus on Nontidal Wetlands
Concern for wetlands began with the goal of preserving tidal wetlands. These systems were
first recognized to be important for providing valuable fisheries and wildlife habitat,
contributing significant amounts of primary production to the aquatic environment and
maintaining shoreline stability. The importance of the fin- and shellfish industries, and the
general acceptance of these functional roles of tidal wetlands have convinced most coastal
states and communities that wetlands are valuable fish nurseries. Protection of these
functions, therefore, was the objective of the first wetlands legislation (Larson, 1990).
Although nontidal wetlands comprise approximately 95 percent of all wetlands in the
coterminous U.S. (Burke, Meyers, Tiner, and Groman, 1988), concern for this class of
wetlands is a more recent issue. This may be due to two factors. First, the attention given
to tidal wetlands may have overshadowed nontidal wetlands as a less important class of
wetlands. Second, due to private property implications, it may be more difficult to convince
the public, especially the agricultural sector, of the functions and values of these systems. The
present study focuses on nontidal wetlands because less research has been devoted to them.
In many states such as Virginia, nontidal wetlands still await significant protection by state
legislation (Odum, 1988).
1.2.2 Focus on Evaluation Methods o f Nontidal Wetlands
This study critiques three evaluation methods in their assessment of nontidal wetlands. Over
the past two decades, more than two dozen wetlands evaluation methods have been designed,
but little attempt has been made to evaluate the progress in designing these methods. The
knowledge-base concerning wetland functions and values has been steadily increasing over
time; however, our understanding of whether such evaluation methods are able to accurately
and consistently determine wetland functions and values, and how these methods actually
4

accomplish their objectives, appears to be lacking.
The accuracy of wetland evaluation methods can be examined by comparing the results from
these formal methods with more in-depth, site-specific numerical data from the same wetland
sites, as was done in a study by Eargle (1989). Eargle examined the accuracy (and
reproducibility) of the WET II Technique on three different wetland types in South Carolina.
However, quantitative studies on Virginia's nontidal wetlands are scarce and often do not
contain the specific data needed to quantify functions. Consequently, determining the
accuracy of these methods could not be addressed in the present study.
The precision or consistency (reproducibility) of wetland evaluation methods can be
addressed if numerous evaluators with similar backgrounds and experience were to evaluate
the same wetland sites using the same evaluation methods. (It has been observed that
following a one-week training course in WET II, however, variability of values assigned by
different evaluators is very low (Coburn, 1993).) Although feasible, this issue would require
significant effort and input by several individuals.
The present study therefore addressed the third issue: determining how nontidal wetlands
evaluation methods accomplish their objectives. It is assumed that the interpretation of the
wetland science into formal evaluation methods is consistent; that is, that best professional
judgment in the field of wetlands science is universal. In addition, some wetland professionals
claim to examine a broad range of factors when evaluating a site in the field. By critiquing
three methods of comparable age (1986-1991) to discern how they accomplish their
objectives, not only will the degree of universality in wetland science interpretation be
determined, but also it may be revealed that few factors are actually necessary in the
evaluation of a function. If that is the case, then wetland evaluation methods could be further
refined.
5

The study had a two-fold objective: 1) to determine whether wetland evaluation methods
interpret the wetland science in the same way, and 2) as a practical application, to identify
whether these qualitative assessment data may be organized into useful landscape
management information.
1.2.3 Hypothesis
It was hypothesized that all three evaluation methods would give very similar final ratings for
the functions assessed at each wetland site because they share three fundamental
characteristics. Each method uses a unique qualitative evaluation/interpretation scheme, and
thereby incorporates an element of professional judgment, to predict either a high, moderate
or low probability that a particular wetland will perform a certain function. The methods,
therefore, are intended to precede, not replace, site-specific quantitative studies or
assessments. All the authors recommend that the final evaluations remain qualitative; that the
evaluator does not attempt to assign discrete numbers to the high, moderate or low ratings.
Secondly, these qualitative methods are designed essentially to compare two or more
wetlands. They can be used as a management tool to "red-flag" a wetland that may be
providing a valuable, if not critical, function and/or value to the surrounding landscape.
Lastly, each method claims to be scientifically defensible and therefore based upon accepted
wetland science. It was presumed that if all three methods assess the same function, they will
require a similar input of data to adequately evaluate the function qualitatively. In addition,
it was anticipated that each method would be very similar at the finer scale of data
interpretation. They would assign comparable weights (degrees of influence) to each factor
(type of information) they had in common, again, because they are assumed to use the same
universally accepted wetland science.
6

2.0 LITERATURE REVIEW
2.1 What are Wetlands?
Wetlands are transitional systems between terrestrial and aquatic habitats. They are
components of the landscape where the permanent or temporary presence of water acts
together with the soils to determine the type of vegetation. Hence, hydrology, vegetation and
soil composition are the primary criteria used in the identification of a wetland. The presence
of at least one wetland indicator from each of the three parameters is usually required to make
a positive wetland identification. Sometimes however, rooted plants may be absent and in
some cases the substrate may consist of rocks instead of soil. Several definitions have been
developed at the federal and state levels to define "wetland" for various laws, regulations and
programs. Four definitions are cited for comparison.
2.1.1 Section 404 o f the Clean Water Act Amendments (1977)
Section 404 of the Clean Water Act (CWA) requires a permit to be issued for any dredge or
fill activity in waters of the United States including wetlands. The following is the regulatory
definition of wetlands used by the United States Environmental Protection Agency (EPA) and
U.S. Army Corps of Engineers (COE) for administering the Section 404 Permit Program:
[Wetlands are] those areas that are inundated or saturated by surface or groundwater at a frequency and duration sufficient to support, and that under normal circumstances do support, a prevalence o f vegetation typically adapted for life in saturated soil conditions. Wetlands generally include swamps, marshes, bogs, and similar areas.
Functional assessment is critical to the Section 404 program since most decisions revolve
around an assessment of wetland functions (Ainslie, 1994).
7
2.1.2 United States Fish and Wildlife Service's Wetland Classification System (1979)
The Fish and Wildlife Service (FWS), in cooperation with other federal agencies, state
agencies and private organizations and individuals, created a wetland definition for conducting
an inventory of the nation's wetlands. This definition was published in the FWS's volume
"Classification of Wetlands and Deepwater Habitats of the United States" (Cowardin, Carter,
Golet and LaRoe, 1979):
Wetlands are lands transitional between terrestrial and aquatic systems where the water table is usually at or near the surface or the land is covered by shallow water. For purposes o f this classification wetlands must have one or more o f the following three attributes: (1) at least periodically, the land supports predominantlyhydrophytes, (2) the substrate is predominantly undrained hydric soil, and (3) the substrate is nonsoil and is saturated with water or covered by shallow water at some time during the growing season o f each year.
2.1.3 Food Security Act o f 1985
This definition is used by the U.S. Department of Agriculture, Natural Resource Conservation
Service (NRCS), for identifying wetlands on agricultural land in assessing farmer eligibility
for the department's program benefits under the "Swampbuster" provision of this Act (PL 99-
198):
Wetlands are defined as areas that have a predominance o f hydric soils and that are inundated or saturated by surface or ground water at a frequency and duration sufficient to support, and under normal circumstances do support, a prevalence o f hydrophytic vegetation typically adapted for life in saturated soil conditions, except lands in Alaska identified as having a high potential fo r agricultural development and a predominance o f permafrost soils.*
* Special note: The Emergency Wetlands Resources Act of 1986 also contains this definition, but without the exception for Alaska.
The "Swampbuster" provision denies federal price supports, payments, certain loans and other
benefits to farmers who convert wetlands for agricultural purposes (Subtitle B of the FSA).
8

2.1.4 Virginia Wetlands Act (1972)
The Commonwealth of Virginia adopted the Virginia Wetlands Act (§28.2-1300, Va Code
Ann.) in 1972 to establish standards and guidelines for tidal wetlands, thereby legally
segregating tidal and nontidal wetlands in Virginia (Coburn, 1993). Nontidal wetlands are
as yet unprotected by state law. However, Virginia is presently developing a program to
regulate uses of nontidal freshwater wetlands and to meet Past-Govemor Wilder's stated goal
of no net loss of nontidal wetlands values. This will be effected primarily through
enhancement of Section 401 Certification of the Clean Water Act Amendments (Cobum,
1993).
To date, therefore, the Virginia Wetlands Act defines wetlands to mean only vegetated and
non vegetated tidal wetlands:
"Vegetated wetlands" means lands lying between and contiguous to mean low water and an elevation above mean low water equal to the factor one and one-half times the mean tide range at the site o f the proposed project in the county, city, or town in question, and upon which is growing any o f the following species: saltmarsh cord grass (Spartina altemiflora). saltmeadow hay fSpartina patens), saltgrass fDistichlis spicata).../~32 species, including saline, brackish and freshwater varieties!...reed grass fPhragmites communis). or switch grass fPanicum virgatum).
"Nonvegetated wetlands" means unvegetated lands lying contiguous to mean low water and between mean low water and mean high water, including those unvegetated areas o f Back Bay and its tributaries and the North Landing River and its tributaries subject to flooding by normal and wind tides but not hurricane or tropical storm tides.
The EPA, COE and NRCS wetland definitions include only areas that are vegetated under
normal circumstances, while the definitions used by the FWS and Virginia Wetlands Act
recognize both vegetated and nonvegetated areas. The first three wetland definitions are
conceptually the same; they all incorporate three basic elements — hydrology, vegetation and
soils — for identifying wetlands.
9
2.2 Different Perspectives of Value
2.2.1 Valuing Natural Resources
An ecosystem may be valued for several practical reasons: 1) gauging the feasibility of broad
policy goals, such as "no-net-loss of wetlands" or the merits of protecting fisheries habitat;
2) computing the losses resulting from damage to habitats from hazardous wastes, oil spills,
development, or other impacts; 3) determining project priorities in environmental restoration;
4) assessing property values and engaging in wetland mitigation banking; and, 5) analyzing
regulatory impacts (NOAA Chesapeake Bay Environmental Valuation Workshop, 1994). A
fundamental distinction between the way economists and other disciplines use value is the
economist's emphasis on human preferences. Nonpreference-related "values" are
mathematical and functional. In the mathematical sense, value means magnitude. In the
functional sense, value refers to the biological or physical relationships of one entity to
another. For example, wetlands can be valued as water filtration/purification systems, as
spawning habitat for fish, or for the nutritional value of omega-3 fatty acids. These exist
whether or not humans prefer them or are even aware of them (NOAA Chesapeake Bay
Environmental Valuation Workshop, 1994).
2.2.2 What is Wetland Evaluation ?
Wetland evaluation can be considered as two operations: the scientific process of functional
assessment in which the biological, chemical, geological and physical characteristics of a
wetland are determined; and, the socio-economic process of assigning values to the wetland
by defining those characteristics that are beneficial to society (Larson and Mazzarese, 1992).
For example, functional assessment typically focusses on the probability a wetland is
important for hydrologic processes such as flood control, shoreline stability and water quality
maintenance. To determine its ability to purify water, the assessment may therefore examine
the wetland's capability of retaining nutrients, toxins and/or trapping sediments. However,
many assessment methods also consider the wetland's importance as a habitat for aquatic and
10

terrestrial species. The socio-economic evaluation of wetlands considers the habitat
significance of a wetland, but it examines that feature as it pertains to human values. For
example, this type of evaluation often considers the active and passive recreational values of
a wetland. Game hunting and fishing constitute active recreational activities; bird watching
and aesthetic/spiritual enjoyment are considered passive ones. Moreover, a particular wetland
may be highly valued by society if it is utilized by an endangered species. The potential of a
wetland to serve as an educational/research site is also often weighed in this type of
evaluation.
Some methods focus on functional assessment; others take a more comprehensive approach
and incorporate both the functional assessment and socio-economic evaluation of a wetland.
Recently, producers of assessment/evaluation methods have aimed at generating relatively
simple techniques, enabling a preliminary assessment/evaluation to be conducted within a
minimal time period. Such techniques are intended to precede, not replace, lengthier scientific
inventories (Abate, 1992). They are a means of quickly assessing those wetlands which may
require further examination as they appear to be particularly important for one or several
functions and/or values. The methods are therefore capable of "red-flagging" a wetland, as
well as comparing several wetlands within a watershed or other landscape unit.
It is now recognized that not all wetlands perform all known functions, and not all functions
are performed equally by each wetland. The specific biological, chemical, geological and
physical features of each wetland determine how the wetland will function. It is therefore
difficult to determine the functions a wetland performs without site-specific analysis.
Detailed, scientific studies of a wetland are necessary to quantify the functions of a wetland.
However, general descriptions and measurements of these features, as obtained from these
assessment/evaluation methods, can help predict which functions may be present in a specific
wetland (Larson, Adamus and Clairain, 1989). Nevertheless, there is the need for an accurate
and sophisticated assessment method to support long-term management and policy
development (Hershner, 1993).
11

Apart from being a component of many wetlands assessment techniques, the socio-economic
evaluation of wetlands also has its own field in the domain of economics. Methods include
both market and nonmarket strategies. Some believe that a wetland evaluation must
incorporate both ecology and economics in a common framework to produce accurate, robust
value information (Amacher, Brazee, Bulkley and Moll, 1988). The short-term economic
gains acquired through wetlands destruction can be ascertained; therefore, development is
perceived to be of net benefit to society (Coburn, 1993). Furthermore, the laws of
margination continue to apply. As we deplete wetlands, the value of the goods and services
of that resource will increase. However, the long-term economic and environmental costs of
wetland destruction may well outweigh the short-term gains. To date, a handful of economic
evaluation methods do exist, but none have proved satisfactory in their application to
wetlands.
2.3 Functions of Wetlands
Ecological processes are generally described by function, such as nutrient retention and
transformation or wildlife diversity and abundance. Function is an ecological process that
may not directly benefit humanity. The further classification of a function by its value
connotes usefulness to humanity. However, these terms are often used interchangeably
because functions may also be values. The location of a wetland within the landscape (i.e.
proximity to human development) may determine the value of a functional ecologic process
(Mitsch and Gosselink, 1993). A wetland may play an active role in the hydrologic cycle of
its watershed, but may be regarded as highly valuable if human development exists
downstream and the wetland can dissipate flood waters. If the wetland is located downstream
from a pollution source, it may have the opportunity to act as a water filtration system, thus
purifying the inflowing water before it reaches downstream environments, whether they be
potable water reservoirs, groundwater aquifers, agricultural lands or pristine wilderness.
12
Assessment/evaluation methods may vary not only in the functions they choose to assess, but
also in how they categorize these functions. The principal functions most prevalent in these
methods are described below.
2.3.1 Aquatic/Finfish and Wildlife Habitat: Diversity and Abundance
Wetlands provide habitat for numerous species of birds, mammals, reptiles, amphibians, fish,
shellfish and insects (Marble, 1992). Moreover, of the nation's endangered and threatened
species, 50 percent of the animals and 28 percent of the plants rely on wetlands for their
survival (Niering, 1988). This function refers to the support of diverse and/or abundant
invertebrates and vertebrates via activities such as herbivory, predation and bioturbation
(Brinson, 1993). In addition, a wetland may support migratory and ephemeral species that
use the resource only periodically for such specific life stages as breeding, migration, molting
and over-wintering (Marble, 1992). Many bird species depend on wetland habitat.
Predacious birds such as hawks, bald eagles, ospreys and owls feed and nest in wetlands.
Wetland seeds and tubers provide crucial winter food for waterfowl such as ducks and geese
(Weller, 1979). Bottomland forested wetlands are primary wintering grounds for waterfowl
and important breeding areas for wood ducks, herons, egrets and wild turkeys (Tiner, 1984).
Furthermore, during the autumn season when uplands lose most of their wildlife habitat value,
bottomland hardwood wetlands are entering a new productivity phase by releasing mast
(Harris and Gosselink, 1990).
Wetlands can be used by fish species as feeding, spawning and nursery grounds. While this
function is well defined for coastal estuaries and associated wetlands, little is known about
the role of nontidal wetlands in support of fisheries. Nonetheless, common fish species that
utilize freshwater wetlands include pickerel, sunfish, bass, crappie, bullhead, carp, herring,
white perch and American shad (Mitsch and Gosselink, 1993).
13

A wetland's ability to fulfill this function depends upon the type and quality of habitat it
possesses. Critical habitat factors affecting terrestrial and aquatic diversity and abundance
include: location and size of wetland, accessibility, adjacent forest acreage, watershed size,
vegetation composition and canopy structure, the interspersion of vegetation and water, water
quality, pH, salinity, temperature, substrate composition, water depth and velocity, and degree
of human disturbance. For example, wetlands having large watersheds may be more valuable
as wildlife habitat because they are likely to be sustained hydrologically throughout time, and
are also richer in nutrients than those with smaller watersheds (Marble, 1992).
Since needs vary from species to species, the more diverse a wetland's attributes, the more
likely it will be able to sustain a diversity of species. Vertical layering and horizontal overlap
of several vegetation classes, such as forested, scrub/shrub, emergent and algal, support a
greater diversity of wildlife species than a wetland with a less complex vegetative structure.
Complex foliage height diversity, for example, increases the number of niches available for
feeding, protective cover and shading. Moreover, although diversity and abundance are
different conceptually, they are known to be highly correlated with one another (Marble,
1992).
2.3.2 Nutrient Retention and Transformation
This function refers to the retention of nutrients, the transformation of inorganic compounds
to their organic forms, and the transformation of nitrogen into its gaseous form. Wetlands
in systems with flowing waters are generally more productive than those with stagnant waters
due to the continuous influx of nutrients (Coburn, 1993). Wetlands receive water from
precipitation, surface runoff, directly (flooding) and indirectly (percolation) from streams and
lakes, groundwater and as wastewater discharges. Water may leave wetlands as surface water
outflows, groundwater, evaporation, evapotranspiration or pumping (Coburn, 1993).
Wetlands can maintain water quality by removing nutrients from both the water column and
sediments during the growing season, via uptake and storage by wetland vegetation. In
14

addition, some nutrients may adhere to sediment particles. Vegetation can reduce water
velocity via frictional resistance, which in turn enhances sedimentation out of the water
column. Nutrient burial below the zone of biological activity is thus increased (Marble,
1992). The age of the wetland vegetation is also important. Unlike the early stages of
succession where accumulating biomass retains nutrients such as phosphorus, mature
successional stages recycle vegetative phosphorus and do not remove it from the sediments
or water (Cobum, 1993).
Soil composition is also an important factor. Phosphorus is readily immobilized by aluminum,
calcium and iron via adsorption and precipitation reactions. Since fine mineral soils typically
possess higher concentrations of these ions, they usually have a greater capacity to retain
phosphoms than organic soils (Marble, 1992).
Studies have shown that wetlands can act as sinks for nitrogen and phosphoms under both
nutrient enriched and natural conditions. Wetlands can therefore function as nutrient traps
for urban and agricultural runoff which tend to contain significant concentrations of dissolved
nitrogen and phosphorus. In an average stream, both total nitrogen and total phosphoms
concentrations are roughly 9 times higher when the watershed is > 90% farmed as compared
with > 90% forested watersheds (Omernik, 1977). Mitsch, Dorge and Wiemhoff (1979)
found a riverine swamp to be acting as a sink for phosphoms. The net phosphoms input by
floodwaters to the swamp was over 10 times greater than the outflow of phosphoms to the
river. Boyt, Bayley and Zoltek (1976) studied a hardwood swamp that had been receiving
sewage effluent for 20 years and found a 98 percent reduction in total phosphoms and a 90
percent reduction in total nitrogen in the outflow waters. These percentages are comparable
to those achieved by advanced treatment of wastewater (i.e. coagulation-sedimentation and
nitrification-denitrification).
Nutrient retention and transformation improves with retention time and low nutrient loading
rates. Retention time increases with hydroperiod, (permanently flooded or saturated
15

conditions), lower slopes, dense vegetation (weaker water velocities), and constricted or non
existent outlets (Marble, 1992).
2.3.3 Sediment/Toxin Retention
Sediment/toxin retention is similar to the nutrient retention and transformation function.
Sediments often contain chemically and physically attached nutrients and contaminants such
as heavy metals, pesticides, herbicides and other organic toxins. Sediments and associated
toxins are transported by runoff or channel flow into wetlands where they can be removed by
several processes. Compounds can be removed from the water column via sediment
deposition and burial, chemical breakdown, and/or assimilation by organisms. Several studies
have shown wetlands to be effective filtration mechanisms and thus can behave as natural
wastewater and stormwater treatment systems. Riparian areas have been shown to retain 80
percent of sediment runoff from adjacent agricultural lands (Richardson, 1989). Freshwater
wetlands filter 60 to 90 percent of suspended solids from wastewater (Richardson, 1989).
The Commonwealth's Best Management Practices (BMP) Manual for urban areas suggests
using wetland vegetation for the natural biological treatment of stormwater. Wetland plants
can provide the following water treatment operations: 1) break down phenols to amino acids,
2) destroy cyanide groups, 3) consume nitrates and phosphates from untreated stormwater,
4) neutralize extreme pH conditions, 5) reduce chemical oxygen demand; and, 6) increase the
dissolved oxygen demand content of water (Virginia State Water Control Board, 1979b).
As with nutrient retention and transformation, detention of sediments and toxins improves
with retention time. Deposition of upland-eroded sediment appears to be greatest in riparian
areas bordering first-order streams. The larger flow volumes of the higher order streams
probably allow less chance for sediment deposition (Lowrance, Sharpe and Sheridan, 1986;
Cooper, Gilliam, Daniels and Robarge, 1987). In addition, the fetch/exposure of a particular
wetland can determine whether it provides this function. Sheltered areas are less prone to
wind mixing which enhances suspension and transport of sediments out of the wetland.
16

Shallow water wetlands offer greater frictional resistance to flow, and in turn, favour
sedimentation of suspended solids. Apart from providing frictional resistance, vegetation
encourages the retention of materials by reducing the resuspension of bottom sediments from
wind mixing, by lengthening the flow path of water through the wetland, and by contributing
to the organic content of the bottom sediments which in turn helps to retain toxins associated
with sediments (Marble, 1992).
Such factors determine whether a wetland will be effective at performing the function of
sediment/toxin retention. Wetlands that receive runoff from watersheds with erosion-prone
areas or contaminant sources, are most likely to have the opportunity to function as sediment
and toxin removers. As will be shown later, some evaluation techniques choose to keep these
two concepts separate.
2.3.4 Floodflow Alteration
Floodflow alteration is the process by which peak flows from runoff, surface flow and
precipitation are delayed or stored. Depending upon its position within the watershed, a
wetland can detain flood waters by intercepting sheet flow, thereby reducing flood peaks. By
reducing flood peaks, wetlands can abate flood-related damage (Marble, 1992). Wetlands
can store or remove water in several ways. While water storage capacity varies according to
wetland size, water depth, degree of constriction and soil properties, the processes of uptake
and evapotranspiration vary depending upon type and extent of vegetation. Open water
bodies engage in surface evaporation. In addition, vegetated wetlands usually contain large
quantities of litterfall that act as a sponge, and if not already saturated, can release water very
slowly (Cobum, 1993).
Flood control has become evermore important in urban areas where the rate and volume of
stormwater runoff have increased with impervious surfaces, such as roads, parking lots and
buildings (Wohlgemuth, 1993). Even in the early 1970's, the U.S. Army Corps of Engineers
17

found that protection of 3,400 ha of natural wetland systems along the Charles River in
Massachusetts was the most cost-effective solution to controlling flood waters. The report
presented a novel attitude to flood control for Congressional consideration. All the proposed
expenditures were not to build but to preserve (U.S. Army Corps, 1972; Carter, Bedinger,
Novitzki and Wilen, 1979).
From a more non-human perspective, a wetland capable of surface water storage also
provides maintenance of water on site for vegetation and wildlife. Inputs from the watershed
during flooding include not only water, but also particulate and dissolved organic matter, as
well as nutrients (Cobum, 1993). Consequently, a wetland can improve downstream and/or
groundwater quality (Brinson, 1993). Such phenomena demonstrate that most wetland
functions are not independent of one another (Larson, Adamus and Clairain, 1989).
2.3.5 Groundwater Recharge and Discharge
By holding surface water long enough to enable the water to percolate into the underlying
sediments and/or bedrock aquifers, a wetland is capable of recharging groundwater. To
recharge groundwater, the water source of the wetland must be surface water i.e. channel
flow or overland flow (Marble, 1992). Recharge potential varies according to wetland type,
geographic location, season, permeability of underlying soil strata, water table location and
precipitation (Tiner, 1984).
A wetland is more likely to recharge groundwater if, for example, it is located in a watershed
dominated by soils with slow infiltration rates because the volume of runoff entering the
wetland will be significant. A wetland underlain by permeable soils and materials with high
infiltration rates is also more likely to recharge groundwater. The longer the detention time
of the water in the wetland, the greater the opportunity for the water to percolate into the
underlying substrate. A constricted or non-existent outlet usually creates a hydraulic gradient
favouring groundwater recharge. Moreover, such conditions typically result in a wetland
18

possessing fluctuating water levels, which will periodically inundate adjacent unsaturated
soils. Seasonally or temporarily flooded soils are more likely to transmit water than saturated
soils (Marble, 1992).
While wetlands positioned above the local groundwater table may have the ability to recharge
groundwater, wetlands in direct contact with saturated zones can serve as discharge areas for
groundwater. Such wetlands are located where permeable rocks intersect at the surface
(Novitzki, 1989). Factors affecting discharge of groundwater into wetlands include: location
and hydrological characteristics of aquifers, soil types and profiles in conjunction with
topography, and seasons (Coburn, 1993). Whether a wetland serves as a groundwater
recharge or discharge site therefore primarily depends upon its position relative to the water
table (Cobum, 1993).
Issues of public interest concerning groundwater sources that influence wetlands include
contamination, raising or lowering of local water tables by impounding, irrigation or pumping
for municipal, industrial or agricultural water supplies, and paving formerly pervious surfaces
(Brooks, 1989). At least 60 municipalities in Massachusetts have public wells in or very near
wetlands (Motts and Heeley, 1973), and freshwater wetlands have been observed to be
important potential recharge reservoirs to the groundwater aquifer that supplies potable water
on Hilton Head Island, South Carolina (May, 1989).
2.3.6 Erosion Control
The movement of water generated by winds, storms and river currents can cause substantial
erosion of coastlines and shorelines. Tidal wetlands can contribute to shoreline stability; in
the same way, nontidal wetlands can function as a protective fringe along the shores of rivers,
lakes and reservoirs by helping to dissipate the kinetic energy of moving water. Emergent
vegetation can reduce erosive and destabilizing forces along banks by slowing water velocity
via frictional resistance and by anchoring soil with their dense root masses. Trees and shrubs
19

along riparian zones can help buffer alluvial floodplain sediments from the erosive power of
a flooding river (Brooks, 1989). Hence, the Virginia Erosion and Sediment Control
Handbook recognizes the use of wetland vegetation in stabilizing streambanks (Virginia
Department of Conservation and Recreation, 1992).
Factors involved in erosion control and substrate stabilization include: waterbody type,
energy of the water, type and location of wetland vegetation, erodibility of the soils, type and
amounts of suspended materials in the water, and season of the year (Coburn, 1993).
2.4 Values of Wetlands
Functions and values of wetlands are not two distinct concepts. The six functions just
described are all valuable to humanity in one way or another. The authors of an evaluation
method designed in Connecticut, for example, use the term "functional values" to refer to all
the functions and/or values assessed. However, there are those who prefer to differentiate
between the two, despite their association from the human perspective. Functions are those
abiotic and biotic processes that a wetland performs within its physical landscape. Values are
less tangible than functions. They are those attributes of a wetland which directly or indirectly
provide an investment or worth to humanity; that is, value is an anthropocentric term.
Wetland values may change as our perception and technology change even though the
functions of wetlands remain the same (Harris and Gosselink, 1990). As previously
mentioned, wetland evaluation can be considered as two operations: the scientific process
of functional assessment in which the biological, chemical, geological and physical
characteristics of a wetland are identified; and, the socio-economic process of assigning
values to the wetland by defining those characteristics that are beneficial to society (Larson
and Mazzarese, 1992).
20

2.4.1 Recreation, Aesthetics and Heritage Value
Many recreational activities involve water. Although deepwater habitats are primarily used
for water-dependent recreation such as swimming and boating, vegetated wetlands can attract
hunters, trappers, anglers, birders, hikers and nature-lovers of all kinds. The dynamic nature
of the wetland ecosystem has fascinated the human mind, and many artists, photographers,
authors and musicians have been inspired by these environments (Brooks, 1989).
Recreational activity can often be translated into economic value by determining the amount
of money spent on license and admission fees, travel, accommodation, food, the purchase and
rental of equipment, and the purchase of art, crafts and various kinds of literature (Brooks,
1989).
Although more difficult to quantify, aesthetic and heritage values are often recognized. A
wetland located within an urban landscape may be more highly valued (and enjoyed) for its
intrinsic qualities than one surrounded by other wetlands and/or a more pristine environment.
A wetland may provide habitat for unusual and rare flora and fauna, (e.g. insectivorous plants
and bog turtles), contribute to the regional landscape scenes familiar to and appreciated by
travellers (e.g. riverine wetlands along the Susquehanna River and peat bogs of the Poconos),
or be a part of the local, cultural history (e.g. archaeological significance of the forested
wetlands of Virginia's Colonial National Historical Park) (Brooks, 1989).
2.4.2 Research/Education Potential
Since wetlands of all types have been observed to support a great number and variety of life
forms, they also represent a living laboratory for the study of ecosystem dynamics, the inter
relationships between abiotic and biotic elements and processes.
21

However, other than general statements of this nature, little has been documented about the
use of wetlands for education and research, although this use may be considerable. For
example, about one-half of the high schools in Ontario, Canada incorporate at least one
annual wetland visit as part of their science curriculum. Moreover, the extensive body of
literature on wetlands demonstrates the general significance of these systems for research
(Bardecki, 1984).
For an individual wetland to have research/educational value, it must be accessible by foot
and/or vehicle. In addition, its proximity to and affiliation with an educational institution will
enhance its educational value.
2.5 Wetland Evaluation Methods
Previous literature reviews of wetland evaluation methods have been conducted by Lonard,
Clairain, Huffman, Hardy, Brown, Ballard and Watts, (1981 and 1984) and Bradshaw, J.
(1991). The 1981 review examined 40 wetlands evaluation methods according to several
screening criteria, and assessed 20 of the methods in detail using a series of descriptive
parameters. The 1984 review summarized 25 wetlands evaluation methods identified from
the pre-1981 literature, as well as those published since 1981. This study, therefore, mentions
those methods which are either more recent, more applicable to the present study, and/or are
less well-known in the literature.
2.5.1 Hollands and Magee Method fo r Assessing the Functions o f Wetlands
The method was first developed in 1975 in response to requirements under the Massachusetts
Protection Act to determine the significance of threatened wetlands for each of seven
functions. During the next decade, the authors modified the method to incorporate the
requirements of other state wetland statutes and Section 404 of the Clean Water Act. The
method is now designed to evaluate ten functions: biological, hydrologic support,
22

groundwater, storm and floodwater storage, shoreline protection, water quality maintenance,
cultural and economic, recreational, aesthetic, and educational.
Thirty-two factors (variables) are used to evaluate the ten functions via a semi-quantitative
weighting scheme. Since the authors believed that some factors were of greater significance
than others in evaluating a given function, the factors were weighted based upon the authors'
professional judgment. Numbers were assigned according to the significance (weight) of a
particular factor, and its value (weight) for the wetland in question. Factors used in the
evaluation include: dominant wetland class, class richness, vegetative density, hydrological
position, topographic position in watershed, water level fluctuation, size, percent open water,
underlying and surficial geology and public access.
According to the authors, their method enables comparison among several wetlands, it
provides wetland inventory data for regulatory agencies, it is quick, simple and inexpensive,
and the results compare favorably with more complex methods such as the Adamus (1983)
method. The only disadvantage they claim, however, is that the method cannot be done by
one individual. A two-person team comprising a geologist/hydrologist and a
botanist/ecologist experienced in wetlands is required.
2.5.2 A Method fo r Assessing Wetland Characteristics and Values
Marble and Gross (1984) provide a classification and qualitative evaluation system to identify
glaciated northeastern wetland functions and their social values. The authors profess that the
information required to determine wetland values can be easily collected and assessed.
Therefore, the method can be implemented on a regional- or municipal-wide level to provide
local decision-makers, planners and other interested individuals with consistent and
comparable data on wetlands.
23

The method identifies the relative importance of wetlands in providing wildlife habitat, flood
control and erosion/sediment control, based upon the assumption that physical and functional
attributes of wetlands vary predictably in relation to topographic location. The wetland
physical characteristics of vegetation, size, underlying glacial material and surface hydrology,
were found to be highly correlated with the three landscape positions of valley, hillside and
hilltop. Moreover, landscape position frequently determined wetland values relating to
wildlife habitat, flood control and erosion/sediment control. Based on these relationships, it
was concluded that wetlands in valley locations have the highest value, as opposed to hillside
and hilltop wetlands in the Connecticut study area.
As with most evaluation methods, the authors caution that their method is not intended to be
the only tool by which to evaluate wetlands. Scenic, recreational and educational values
should be considered for any political or administrative decision to be complete. A field visit
to the wetland of interest should be made, but time-consuming measurements and sampling
are not necessary. The method, therefore, is not intended to replace intensive field
assessment.
2.5.3 Habitat Assessment Technique (HAT)
The wetland Habitat Assessment Technique (HAT), developed by Cable, Brack and Holmes
(1989), is the first known attempt to directly incorporate ecological concerns (faunal and
species indices) with the concept of economic efficiency (optimum habitat area). It represents
a refinement of the earlier efforts to modify the Graber and Graber (1976) method and
addresses many of the concerns expressed by Lonard and others (1981) (Cable et al., 1989).
The HAT procedure is founded on the premise that species diversity and the uniqueness of
species found in a wetland can be used to assess the quality of a wetland habitat. The
presence of both numerous species and uncommon species makes an area more valuable.
Establishing the optimum habitat tract size, however, the element that integrates economics
24

and ecology, is the least precise component of HAT. Additional wildlife studies will help to
provide the missing data on species habitat requirements.
Nonetheless, using birds as indicators, HAT quantifies habitat quality, thus enabling
comparisons to be made among sampled areas. It is not only rapid, (a field visit is not
necessary if site-specific bird records are available), simple and inexpensive, but it can provide
input to more comprehensive evaluation techniques, such as the U.S. Fish and Wildlife
Services' Habitat Evaluations Procedure (HEP), or the Army Corps of Engineers' WET II,
which assess other wetland values.
2.5.4 Wetland Evaluation Technique II (WET II)
WET II, the 1987 revision of the method initially developed for the Federal Highway
Administration, qualitatively evaluates a total of eleven wetlands functions and values:
groundwater recharge and discharge, floodflow alteration, sediment stabilization,
sediment/toxin retention, nutrient retention and transformation, production export, terrestrial
and aquatic wildlife diversity and abundance, uniqueness/heritage and recreation. WET II
evaluates these functions and values at three levels: social significance, effectiveness and
opportunity. Social significance assesses the value of a wetland to society based on its
strategic location, official status or designations, and natural features. Effectiveness assesses
the capability of a wetland to perform a function due to its biological, chemical or physical
attributes. Effectiveness does not estimate the magnitude at which a function is performed
(Larson, Adamus and Clairain, 1989). The last level, opportunity, assesses the probability
that a wetland will perform a function to its level of capability. For example, at present, a
wetland may be potentially very effective at sediment trapping due to its constrictive outlet,
but there may be no sediment to trap. Twenty years later after development has occurred
within its watershed, there may be ample opportunity for the wetland to trap sediment
(Odum, Harvey, Rozas and Chambers, 1986).
25
WET II evaluates a wetland by identifying its functions and values in terms of variables
(factors) that correlate with its biological, chemical and physical characteristics, as well as
those of its watershed or surrounding landscape. Answers to an extensive series of questions
are analyzed in an interpretation key which assigns qualitative probability ratings of high,
moderate or low to each of the functions and values assessed.
The method can be used equally well for a diverse range of systems such as, bottomland
hardwoods, mudflats, desert stream beds and tropical swamps. It can be used with highly
variable levels of data sources ranging from office available data to field testing results
(Cobum, 1993).
Despite its comprehensive nature, WET II is primarily designed for conducting an initial,
rapid assessment of wetland functions and values. It is not intended to substitute for
numerical data or quantitative evaluation methods. It does not, for example, assess the
suitability of wetland habitats for many important wildlife resources, such as furbearers and
game animals. Other methods such as the U.S. Fish and Wildlife Services' Habitat
Evaluations Procedure (HEP) must be used for these species (Adamus et al. 1987). Since the
procedure yields only high, moderate or low values, comparisons among wetlands are difficult
but nonetheless possible.
2.5.5 Manual fo r Assessment o f Bottomland Hardwood Functions (WET-BLH)
Along with its revised version, the WET II procedure also underwent regionalization in 1990.
WET-BLH applies to bottomland hardwoods (BLH) in the southeastern United States. It
evaluates the majority of wetland functions identified in WET II, at both the levels of
effectiveness and opportunity. Along with social significance, WET-BLH adopts additional
categories and evaluates ecological significance, economic significance, cultural and
recreational significance.
26

2.5.6 Method fo r the Evaluation o f Inland Wetlands in Connecticut: A Watershed
Approach
The "Connecticut Method" was first published in 1986 by the Connecticut Department of
Environmental Protection. It was subsequently reviewed for a second publication in 1991.
More recently, the Connecticut Method was adapted for the state of New Hampshire via an
Editorial Review Committee comprised of representatives from several state and private
organizations.
2.5.7 Method for the Comparative Evaluation ofNontidal Wetlands in New Hampshire
As with the Connecticut Method, the New Hampshire Method provides a quasi-quantitative
method of wetland evaluation for use by public officials and those involved in wetlands
management who are not necessarily experts in the wetlands field (Ammann and Stone,
1991). The method is therefore more simple, rapid and easier to use than WET II. It is
designed to be scientifically defensible, although the technical rationales for many of the rating
criteria are not included in the manual. The method encompasses as many of the known
functions and values of wetlands as possible, 14 in total: ecological integrity, wildlife habitat,
finfish habitat, educational potential, visual/aesthetic quality, water-based recreation, flood
control potential, groundwater use potential, sediment trapping, nutrient attenuation,
shoreline anchoring and dissipation of erosive forces, historical site potential and
noteworthiness. It also introduces urban wetland quality values.
To facilitate making comparisons among wetlands, the method advises that all wetlands
within the same watershed be evaluated. The wetlands can then be ranked for each of the 14
functional values. Comparisons among wetlands for each function are easily made because
the technique utilizes a functional value index (FVI). The FVI is obtained from scaled and
weighted values. Since the numbers are only arbitrary and relative, the index is most useful
in comparing different wetlands, or the same wetland under different management plans
27

(Mitsch and Gosselink, 1993).
According to the authors, a number of technical changes have been made in the New
Hampshire version of the Connecticut Method. The flood control function was rewritten and
Ammann added a new function, urban quality of life. The principal author also separated the
sediment trapping and nutrient retention functions into two functions: sediment trapping and
nutrient attenuation. Technical changes were also made in the remaining functions and the
explanatory appendices were expanded.
The method is an inventory and planning tool, not a detailed evaluation method. It is
therefore intended to be used to compare the relative values of a number of wetlands and not
as a site-specific impact evaluation tool (Ammann and Stone, 1991).
2.5.8 A Technique fo r the Functional Assessment o f Nontidal Wetlands in the Coastal
Plain o f Virginia
Also known as the VIMS Technique, this very rapid relatively inexpensive assessment
technique, designed by Bradshaw (1991) at the Virginia Institute of Marine Science, relies on
data easily obtained from existing sources and brief site visits. The method enables the rating
of a wetland as having a high, moderate, or low probability of opportunity and effectiveness
at performing the following functions: flood storage and storm flow modification, nutrient
retention and transformation, sediment retention, toxin retention, sediment stabilization,
wildlife habitat, aquatic habitat and public use. It excludes the evaluation of groundwater
discharge/recharge due to time constraints, and does not explicitly address the social values
of a wetland, other than public use. The factors (variables) characteristic of a particular
function are quantitatively and qualitatively assessed to give a qualitative rating of high,
moderate or low for each factor. The relative importance ("weight") of each factor is
reflected in the combination of the factor ratings, as determined by the interpretation key, to
produce a final rating of high, moderate or low for each function. This, in turn, predicts a
28
wetland's overall ability to perform that function.
The method has had limited field testing but is promising. Revisions of the technique are
currently being considered to better evaluate functions according to effectiveness and
opportunity. In addition, modifications are anticipated to create several versions of the
technique to enable the evaluation of different wetlands according to type and landscape
position (e.g. lakeside, riverine and estuarine).
2.5.9 Canada's Wetland Evaluation Guide
The scope of functions evaluated in the Canadian method is similar to that of WET II, but it
does not clearly differentiate between wetland functions, processes, products and values.
According to Larson and Mazzarese (1992), it nevertheless advances wetland assessment into
a new dimension. The guide consists of three stages. Stage One, called the "General
Analysis," is a preliminary assessment of the wetland, based upon biophysical, hydrological,
biogeochemical and socio-cultural data, and the proposed project, based upon economic
significance. All considerations are at an international, federal, or provincial/state level of
significance. A few also consider regional importance.
Comparing the significance of the wetland and the project provides the evaluator with
knowledge about the desirability of: 1) protecting the wetland due to its exceptional value;
2) approving the project because it has outstanding value and the wetland has little or no
value; and 3) deferring to Stage Two because no conclusion is obvious. (The ratings provide
guidance only to the recommendations.) Stage Two, the "Detailed Analysis," is a detailed
assessment of the functions and benefits of both the wetland and the proposed project using
a multiple value evaluation matrix. The matrix requires biological, hydrological and
biogeochemical, social/cultural and market and non-market economic production values of
the wetland. It also uses project production values. The stage is divided into six steps: steps
one to five complete the evaluation matrix and provide a summary of wetland and project
29

status; step six recommends a course of action: project approval, rejection, approval with
conditions, or referral to Stage Three.
Designed for the evaluation of federal, or at most, provincially significant projects,the final
stage, "Specialized Analysis," requires expertise in resource economics, biology and financial
assessment. It emphasizes the calculation of precise market and non-market economic
production costs and benefits occurring from wetlands as well as from proposed development
with potential impact.
30

3.0 METHODS AND SITE DESCRIPTIONS
3.1 Selecting the Evaluation Methods
Three wetland evaluation methods were selected for critique in this study: the Wetland
Evaluation Technique II (WET II), revised by the U.S. Army Corps of Engineers (Adamus,
Stockwell, Clairain, Smith and Young, 1987); the Method for the Comparative Evaluation
of Nontidal Wetlands in New Hampshire (New Hampshire Method), produced by A.P.
Ammann and A.L. Stone (1991); and, the Technique for the Functional Assessment of
Nontidal Wetlands in the Coastal Plain of Virginia (VIMS Technique), designed by J.
Bradshaw (1991) at the Virginia Institute of Marine Science.
WET II was developed after many years of research and review by numerous individuals from
government (COE, FWS, EPA), academia and private industry. The method was selected for
this study because due to its history of development and extensive use to date, WET II is
regarded as one of the most comprehensive wetlands evaluation methods available and is
currently one of the best known. It can evaluate all types of wetlands in the coterminous
United States and therefore could be used for this study.
WET II consists of three levels of assessment effort for certain functions and values. Since
the third level necessitates the calculation of species diversity indices and the seasonal
assessment of several factors, evaluation was restricted to the second level of effort to make
the assessment feasible within one or two working days. Also, this made the degree of effort
more comparable with the other two techniques. The interpretation key from WET II is
available in a computerized version and was used to interpret and store the field data in this
study.
The New Hampshire Method was selected because, like WET II, it is comprehensive in the
number of functions and values it assesses, yet, unlike WET II, it is not geared for exclusive
use by wetland scientists and those with similar expertise. Ammann and his co-workers
31

created the method so that any concerned citizen could "red-flag" a wetland if, for example,
local developmental pressures were eminent. Although designed for the state of New
Hampshire, the method was easily applied to the non-tidal wetlands of Virginia. The method
is attractive to use in New Hampshire because the manual includes county, soil and
groundwater map data. As with other qualitative assessment techniques, the New Hampshire
Method claims to be scientifically defensible but its questions are fewer in number; hence, it
requires less time to use compared with WET II.
Lastly, the VIMS Technique was selected for two reasons: it was designed for the coastal
plain of Virginia, and since further revisions of the technique are anticipated for the future,
as much field testing as possible was advocated.
3.2 Site Selection
The three evaluation methods were critiqued to identify the similarities and differences in their
assessment of nontidal wetlands. Twenty York River basin nontidal wetlands, representing
a variety of wetland classes in the coastal plain of Virginia, were selected for study sites.
Selection was based upon the class and size of wetland, as well as accessibility by vehicle and
foot. As Figure 1 shows, 12 of the wetland sites were located in the upper reaches of the
York River, in the vicinity of West Point, Virginia. The remaining 8 sites were selected from
York County and the City of Newport News. Wetland sites were chosen to ensure a diversity
of wetland classes and surrounding land-uses was used in the study.
32

Figure 1: Location of Wetland Sites in the York River Basin, Virginia
33

Wetl
and
Site
s

The nontidal wetlands represented three major Palustrine classes: forested, scrub-shrub and
emergent wetlands, as identified by National Wetland Inventory (NWI) maps. The NWI
developed a standardized system that would serve all agencies in the United States. The
classification scheme, based on Cowardin et al. (1979), groups ecologically similar habitats,
furnishes acceptable units for inventory and mapping, and provides uniformity in concepts,
terminology and definitions. The system uses a hierarchial format of systems, subsystems,
classes, subclass modifiers and dominance types. Consequently, a wetland can be clearly
defined (Cobum, 1993). The Palustrine System includes all nontidal wetlands dominated by
trees, shrubs, persistent emergents, or emergent mosses and lichens. It also includes wetlands
lacking such vegetation, but with all of the following four characteristics: 1) area less than
8 ha (20 acres); 2) lack of active wave-formed or bedrock shoreline features; 3) water depth
in the deepest part of the basin less than 2 m (6.6 ft) at low water; and, 4) salinity due to
ocean-derived salts less than 0.5 ppt (Cowardin et al., 1979).
3.3 Materials
Field equipment included a hand-held level and stadia rod for estimation of elevations between
the water/wetland border and the wetland/upland border (as required by the VIMS
technique), a soil probe and a metre stick for water depth and velocity estimations.
The evaluation methods not only require field visits, but also information from various other
published sources. The most recent (1989-93) National Wetland Inventory (NWI) maps
(1:24,000) were used to select and identify the twenty nontidal wetland sites. U.S. Geological
Survey Topographic Maps (1:24,000) and NRCS Soil Survey Maps (1:15,840) of the
counties were referenced to determine surrounding land-use and possible impacts to the
wetland, public access for educational, research and recreational purposes, and soil/sediment
composition. Agencies and organizations such as the Department of Conservation and
Recreation, (Divisions of Natural Heritage, and Planning and Recreation), Department of
Game and Inland Fisheries, Department of Environmental Quality (Water Division),
34

Department of Historic Resources, and the appropriate Planning District Commissions were
contacted for information on wildlife and aquatic importance of the wetlands, the recreational
significance of the sites, groundwater and surface water relevance of the wetlands,
archaeological significance of the areas and rate of development in the surrounding landscape,
respectively. Although the majority of these values were not used in the final comparative
study, all questions asked by all three methods were answered as completely as possible.
To calculate acreage (wetland(s), watershed, open water) and stream length, GIS
(Geographic Information System) technology was used, specifically, the software package
ARC/Info 6.0. (ARC/Info is a registered trademark of ESRI, Inc. of Redlands, California).
3.4 Data Analysis
3.4.1 Field Component
To critique the three methods, a function-specific comparative study was done. Since the
methods varied in the total number of functions they assessed, the five functions common to
all three methods were examined. These were floodflow alteration, nutrient retention and
transformation, sediment/toxin retention, wildlife habitat and aquatic habitat.
Each of the twenty wetland sites was assessed using all three evaluation methods. (See
Appendix D for examples of questions and interpretation keys). The final ratings from each
method for the five functions were tabulated and compared via similarity indices. The indices
were calculated by adding together the number of sites which received two identical ratings
from two of the techniques, (i.e. two H's, two M's or two L's), and dividing that number by
20, the total number of sites.
35

3.4.2 Theoretical Component
The type of information (factors) required to evaluate each function was compared among
the three methods by categorizing the factors into broad terms. (See Table C l excerpt below
and Tables Cl to C5 in Appendix C).
Table Cl: Floodflow Alteration - Factors Used by each Method to Evaluate theFunction...
No. FactorH M
WET VIMS NH WET VIMS
1
Water velocity/flow ( inlet/outlet/channel characteristics - constriction, ditches, canals, channelization, levees, type of flow, sinuosity)
2 Acreage (wetland(s), including accessible wetlands, watershed [ratio], open water)
3Hydroperiod/hydrology (flooding regime, extent and duration, ponding, impoundments)
4 Vegetation ([sub]class, density, fringe, interspersion with water, zonation)
For example, questions relating to water velocity, degree of channel constriction, or sinuosity
were all lumped under the water velocity/flow category. Any question about acreage was
placed into a category by that name. Acreage for the wetland itself, its watershed, upstream
wetlands, the waterbody, etc., were all grouped into the same broad category. The challenge
was to lump as many of the headings and subheadings used by WET II into as few categories
as possible, without losing vital information, while maintaining enough commonality so as to
be able to compare the data with the other two less comprehensive methods. This
arrangement was used to record the ranking of each factor in determining its degree of
influence (weight) on a final rating of High (H), Moderate (M) or Low (L) for the function.
36

To calculate the degree of influence (weight) of each factor, two basic approaches were used.
One involved the calculation of probabilities. Since the VIMS Technique comprised relatively
few questions and a simple interpretation key, it was possible to identify all the various
combinations of responses that could result in the three final ratings of H, M and L for each
function. In other words, it was possible to sample the entire "universe." Tables B2.1&2,
B5.1&2, B8.1&2, B11.1&2 and B14.1&2 in Appendix B, with an example below, illustrate
how this was done.
37

Tabl
e B5
.1:
VIM
S Te
chni
que
- Fac
tors
Used
in
Nut
rien
t Re
tent
ion
and
Tran
sfor
mat
ion
Rat
ings G
*•£3ac2EoUWD.G’-Sa
&
5 3 ^ j 55 S j a ■ S
55 S 55 S 5 5 S 55 -< &
55 S
55S
55 S
55 S
55 2
55 S
5SS
55 S
55 S
55 S
55 S
£ S
55 S
a
a
05I*2oC8
3©o3
©JO
OT3
int-"A
oiniin<N
1 1C/5 ^o o o oM-h JOH—» :O 'rtc ©fljQi © •O is© ”^ 11 3 ClO c/3 C/3 - -H
bo3JO©3©
8*mo4V
3oo o £tH ^ T)a s is -S' 8 .s 92 ’c2 ^ 3Dh ^ ^c <u ao "S c13 £ sjq
mi
inoJ
ffi S J OcoOh
g*£3 3■s '$T3 33K-hO 3 O'E o c
P h CD3 JO ! - '03 Oh O
C l,T3 ©
JOC/5 Uh<D•4—*cd
S s'S_3
C/3 i J 3 c/3© © ! 3 ^ 3 c }Q00 .3 O' 3 <+-i A° -S •• 3 ^ KC/3 3
12 ^3 ©3 £
JOo3
V
►J
©3 -3 3 3I .s'S 04«-• ^30 . .^ s3- ^04
o 3 c/3 © <801 o 3
SGO32©bo3Lh©><
04A
cnV
00
-O©33C/3Lh
3* # O OO92 A P ,
t2 hHC/3 H H
©bo3L-i©><
T3©
OJO3"04
8*m04VI
A04 <4-hO . .3 X o . .‘E ’2o 3
2 & £
© .92
X S h-i
&AGGP<2G
ai ’S t ; c
a"«»
Total
Num
ber
of Co
mbi
natio
ns t
o ob
tain
each
Fina
l Ra
ting:
H
- 32,
M - 4
14,
L - 4
0 (7
%,
85%
, 8%
)

Table B5.2: VIMS Technique - Number of High (H), Moderate (M) and Low (L)Responses to Each Factor that Results in a Final Rating of High, Moderate or Low for Nutrient Retention and Transformation
FactorsFrequency of Responses
H M L H M L H M L
Potential sources of excess nutrients: 16 16 0 138 138 138 8 8 24
Proportion of land with nutrient source... 16 16 0 138 138 138 8 8 24
Average runoff in 2 year, 24 hour storm: 24 4 4 133 153 128 5 5 30
Average slope of watershed: 24 4 4 133 153 128 5 5 30
Proportion of 2 year, 24 hour storm... 28 0 4 210 0 204 5 0 35
Retention/detention of stormwater... 24 4 4 133 153 128 5 5 30
Final Rating: Total Number of Combinations
32 H 414 M 40 L
Once the total number of possible combinations was identified, the probability that a response
of h, m or 1 to each factor would yield an analogous final rating of H, M or L was calculated
(Tables B2, B5, B8, B 11 and B 14 in Appendix B). For example, Tables B5.1 and B5.2 show
that there are 486 different ways to answer all six factors to evaluate the nutrient retention
and transformation function. If the entire universe of possibilities is sampled, each factor can
ultimately receive an equal number of high, moderate and low responses i.e. 162 H's, 162 M's
and 162 L's. (Since factor 5 has no Moderate option, it can receive 243 H's and 243 L's).
According to the technique's interpretation key, 32 of the 486 different combinations will
result in a final rating of High (H), 414 in Moderate (M), and 40 in Low (L). When the first
factor, potential sources of excess nutrients, is answered High, theoretically, 16/162 or 10%
of the time, the final rating will also be High. When it is given a Moderate response, 138/162
or 85% of the time, the final rating will also be Moderate. Fifteen percent of the time, or
39

24/162 low responses to the first factor will result in a Low final rating. The factors were
ranked in order of decreasing probabilities. A rank of 1 represented the highest probability
that a factor answered h, m or 1 will result in a final rating of H, M or L, respectively.
Table B5: VIMS Technique - Probability that a Response of High (H), Moderate(M) or Low (L) to a Factor will Yield a Final Rating of High, Moderate or Low for Nutrient Retention and Transformation
FactorsH M L
(P) Rank (P) Rank (P) Rank
Potential sources of excess nutrients: 0.10 3 0.85 (2) 0.15 2
Proportion of land with nutrient source... 0.10 3 0.85 (2) 0.15 2
Average runoff in 2 year, 24 hour storm: 0.15 1 0.94 1 0.19 1Average slope of watershed: 0.15 1 0.94 1 0.19 1Proportion of 2 year, 24 hour storm... 0.12 2 0 - 0.14 3
Retention/detention of stormwater... 0.15 1 0.94 1 0.19 1
Final Rating: 1a 5A 1L(P) - probability(2) - Actually has no influence on the Moderate final rating. There was calculated to be an equal probability (0.85) among all three responses (h, m, l)in their effect on a Moderate outcome.
Although there are few questions to be answered in the VIMS Technique, many questions
represented more than a single factor category. For example, factors 3 and 5 in the above
table, average runoff and storm volume, involve some quantitative calculations and additional
considerations to arrive at a response. Factor 3 not only uses the average rainfall for the
region, but also requires the estimation of land-use proportions and the size of the wetland,
its watershed and any upstream wetlands. Factor 5 involves the same calculations as well as
the determination of wetland storage capacity. Therefore, if two or more rankings were given
to the same factor category in influencing the same final outcome, the highest rank was used.
As in the case of a High rating, Factor 3 is ranked a 1, while Factor 5 is ranked a 2. A rank
of 1 would therefore be used for the implied factor categories of climate/rainfall, land use and
acreage.
40

For the New Hampshire and WET II methods, a final score of 1.0 was used since the
identification of all possible combinations (sampling the entire “universe”) could not be done
feasibly. Nonetheless, the New Hampshire Method was straightforward to analyze. Unlike
the other two techniques where a factor's degree of influence on the final rating may change,
the factors in the New Hampshire Method keep the same weight, regardless of whether a
High, Moderate or Low rating is being determined. In addition, the method asks a series of
questions whose h, m and 1 responses are assigned semi-quantitative values of 1.0, 0.5 and
0.1, respectively. The Functional Value Index (FVI) used by the method requires that the
average score of all the questions be calculated. Consequently, a maximum score of 1.0 is
possible, (not involving the final step of multiplying by an acreage value to obtain a Wetland
Value Unit (WVU)). Therefore, a value of 1.0 was divided by the total number of questions
per function to arrive at a weight for each question. Some questions belonged to a subset
asked in previous sections. For example, the nutrient retention and transformation function
uses FVTs from the sediment/toxin retention function, and the wildlife habitat function uses
the FVI from a functional value known as Ecological Integrity. These factors (questions)
consequently received lower weights. The factors were ranked in order of decreasing weight.
(See Table B6 below , modified to show ranking and Tables B6, B9, B12 and B15 in
Appendix B).
Acreage (the entire wetland or stream/lake area) is used in the New Hampshire Method as a
multiplier in all functions to obtain the Wetland Value Unit (WVU). Acreage, therefore, has
the greatest influence in determining a final rating for any function. Regardless of the FVI,
small wetlands tend to rate Low on the WVU scale; large wetlands, High. As a result, the
acreage factor was labelled the multiplier and given the highest rank.
41

Table B6: New Hampshire Method - Weight and Rank of Factors in Nutrient____________ Retention and Transformation Ratings____________________________
Factors Weight Rank
Average slope of watershed above wetland:H: >8% M: 3-8% L: <3% 0.0875 4
Potential sources of excess sediment in the watershed above the wetland:H: extensive areas of active cropland, construction sites, eroding banks, ditches, etc.M: some areas of active cropland, a few construction sites, and similar areasL: land use in watershed predominantly forested, abandoned farmland or undeveloped
0.0875 4
Potential sources of excess nutrients in watershed above wetland:H: large areas of active cropland, pastureland, or urban land; many dairies/livestock operations, sewage treatment plants/numerous on-site septic systems within 100’ of streamM: watershed contains some/few such areas/operations/plants/systems within 100' of streamL: watershed predominantly forested or otherwise undeveloped
0.125 3
Effective floodwater storage of wetland 0.05 5
Wetland location in relation to an intermittent or perennial stream or a lake:H: wetland forms a buffer > 50 ft wide between upland and stream or lakeM: buffer 20-50 ft wideL: buffer < 20 ft wide or wetland not bordering a stream or lake
0.05 5
Dominant wetland class bordering a stream or lake:H: scrub-shrub or dense stands of cattails or phragmites M: forestedL: other types, or wetland does not border a stream or lake
0.05 5
Areas of impounded open water (including beaver dams):H: wetland contains permanently impounded open water > 5 acres M: 0.5-5 acresL: < 0.5 acres or wetland does not contain open water
0.05 5
Dominant wetland class:H: floating aquatic plants, emergent (marsh), forested, or scrub/shrub L: bogs
0.25 2
Wetland hydroperiod:H: wetland contains permanently impounded open water > 5 acres M: 0.5-5 acres, OR > 5 acres of wetland flooded or ponded annually L: above criteria not met (saturated or rarely ponded or flooded)
0.25 2
Functional Value Index (FVI) 1.0 -
Total area of wetland (acres) multiplier 1
Wetland Value Units WVU -H, M, L -1.0, 0.5, 0.1
42

Table B3.1 shows the "sensitivity” analysis performed on the floodflow alteration function of
the New Hampshire Method. For only this function, the method uses the factors to produce
two ratios. Since the operator is therefore division and not addition, a "weight" could not be
assigned to the factors of wetland acreage, watershed acreage and wetland control length
(outlet diameter). Instead, each of the three factors was increased by 1%, 5%, 10%, 50%,
100%, 200% and 500% increments, while holding the other two factors constant, to detect
the effect each could have on the FVI. The three factors were ranked according to which had
the most and which had the least effect on the FVI for floodflow (Table B3).
Table B3.1: New Hampshire Method - Sensitivity Analysis of Floodflow AlterationFactors
PercentIncrease
WetlandArea FVI Watershed
Area FVI OutletDiameter FVI
0 1.00 0.600 2.00 0.600 2.00 0.600
1 1.01 0.600 2.02 0.600 2.02 0.600
5 1.05 0.600 2.10 0.610 2.10 0.575
10 1.10 0.600 2.20 0.620 2.20 0.550
50 1.50 0.600 3.00 0.700 3.00 0.435
100 2.00 0.600 4.00 0.800 4.00 0.350
200 3.00 0.600 6.00 0.900 6.00 0.225
500 6.00 0.600 12.00 0.800 12.00 0.055
PercentIncrease
WetlandArea FVI Watershed
Area FVI OutletDiameter FVI
0 20.00 1.00 50.00 1.00 4.00 1.00
1 20.20 1.00 50.50 1.00 4.04 1.00
5 21.00 1.00 52.50 1.00 4.20 1.00
10 22.00 1.00 55.00 1.00 4.40 1.00
50 30.00 1.00 75.00 1.00 6.00 1.00
100 40.00 1.00 100.00 1.00 8.00 1.00
200 60.00 1.00 150.00 1.00 12.00 1.00
500 120.00 1.00 300.00 1.00 24.00 0.81
43
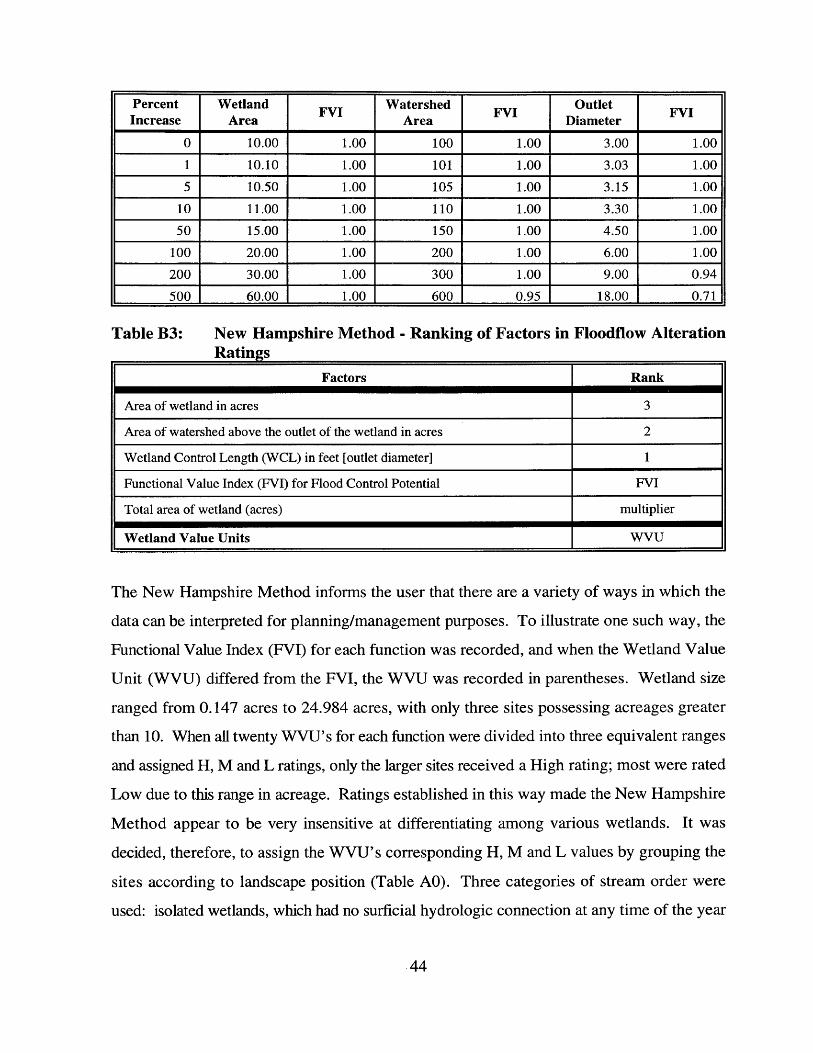
PercentIncrease
WetlandArea FVI Watershed
Area FVI OutletDiameter FVI
0 10.00 1.00 100 1.00 3.00 1.00
1 10.10 1.00 101 1.00 3.03 1.00
5 10.50 1.00 105 1.00 3.15 1.00
10 11.00 1.00 110 1.00 3.30 1.00
50 15.00 1.00 150 1.00 4.50 1.00
100 20.00 1.00 200 1.00 6.00 1.00
200 30.00 1.00 300 1.00 9.00 0.94
500 60.00 1.00 600 0.95 18.00 0.71
Table B3: New Hampshire Method - Ranking of Factors in Floodflow AlterationRatings
Factors Rank
Area of wetland in acres 3
Area of watershed above the outlet of the wetland in acres 2
Wetland Control Length (WCL) in feet [outlet diameter] 1
Functional Value Index (FVI) for Flood Control Potential FVI
Total area of wetland (acres) multiplier
Wetland Value Units WVU
The New Hampshire Method informs the user that there are a variety of ways in which the
data can be interpreted for planning/management purposes. To illustrate one such way, the
Functional Value Index (FVI) for each function was recorded, and when the Wetland Value
Unit (WVU) differed from the FVI, the WVU was recorded in parentheses. Wetland size
ranged from 0.147 acres to 24.984 acres, with only three sites possessing acreages greater
than 10. When all twenty WVU’s for each function were divided into three equivalent ranges
and assigned H, M and L ratings, only the larger sites received a High rating; most were rated
Low due to this range in acreage. Ratings established in this way made the New Hampshire
Method appear to be very insensitive at differentiating among various wetlands. It was
decided, therefore, to assign the WVU’s corresponding H, M and L values by grouping the
sites according to landscape position (Table AO). Three categories of stream order were
used: isolated wetlands, which had no surficial hydrologic connection at any time of the year
44

to any other wetland; first-order wetlands, whose surface water represented a headwater or
the beginning of a perennial stream; and, higher-order wetlands, whose streams resulted from
the joining of at least two upstream channels. Once grouped, the range in WVU’s was
divided into three equal segments and assigned ratings of High, Moderate and Low.
Table AO: Final Ratings by New Hampshire Method Using Stream Order to Groupthe Wetland Sites
Site # FF Rating NRT Rating S/TR Rating AH Rating WH Rating
Isolated
13 0.06 L 0.05 L 0.02 L 0 L 0.09 L
15 0.09 L 0.07 L 0.04 L 0 L 0.09 L
18 2.61 H 1.01 H 0.78 H 0 L 1.66 H
19 1.74 H 0.67 H 0.52 H 0 L 1.12 H
20 0.54 L 0.32 M 0.20 L 0 L 0.57 M
First-Order
6 1.70 L 0.94 L 0.84 L 0.04 L 0.98 L
8 2.09 L 1.37 M 1.30 M 0.16 L 1.66 M
9 5.40 H 4.22 H 3.38 H 3.30 H 4.28 H
10 2.01 L 1.02 L 0.79 L 0 L 1.36 M
11 6.50 H 2.94 H 2.99 H 0 L 3.53 H
17 0 L 0.28 L 0.18 L 0.30 L 0.42 L
Higher-Order
1 3.65 L 2.10 L 1.82 L 0.10 L 2.51 L
2 3.07 L 1.50 L 1.53 L 0.03 L 2.22 L
3 16.67 H 10.54 H 11.33 H 0.41 L 13.85 H
4 24.98 H 15.80 H 16.99 H 0.49 M 18.26 H
5 2.30 L 1.40 L 1.34 L 1.32 H 1.72 L
7 4.80 L 5.43 M 5.14 L 0.10 L 6.09 M
12 24.68 H 16.04 H 14.81 H 0.55 M 18.13 H
14 4.70 L 2.52 L 2.50 L 0.07 L 3.58 L
16 0 L 0.58 L 0.30 L 0.59 M 0.85 L
FF - Floodflow AlterationNRT - Nutrient Retention and TransformationS/TR - Sediment/Toxin RetentionAH - Aquatic HabitatWH - Wildlife Habitat
45
To maintain a degree of consistency, and at the same time solve the problem of the purely
qualitative nature of WET II, the WET II technique was also analyzed using a final score of
1.0. However, since the interpretation keys were complex for this method, adjustments had
to be made. Often, a factor could have varying weights depending on its locations throughout
the key. Therefore, it was decided to calculate the maximum possible weight for each factor
used in evaluating the function (Tables B l, B4, B7, BIO and B 13 in Appendix B; Table B1
simplified below). For instance, if three questions belonging to the same level of the key all
had to be answered correctly to obtain a High rating, then each question/factor would be
assigned a weight of 0.33 (1.0/3). If a High rating could also be achieved by answering those
same three questions as "false," but answering an additional question at the next level of the
key as "true," then all four questions would have a weight of 0.25 (1.0/4). However, since
the maximum possible weight was used in the final analysis, the first three questions would
keep their weights of 0.33, while the fourth would receive 0.25 as its maximum weight. This
seemed appropriate since the fourth question was on a lower level. (See Appendix B, after
Table B l, for an illustration). As with the other two techniques, if the same factor received
two or more weights in its influence on the same final rating, the highest weight was used.
Again, the factors were ranked in decreasing order, with a rank of 1 assigned to the factor
with the most weight.
46

Tabl
e B4
: W
etlan
d Ev
alua
tion
Tech
niqu
e - M
axim
um
Possi
ble
Weig
ht o
f Fa
ctors
tha
t can
Co
ntrib
ute
to a
Fina
l Ra
ting
of H
igh
(H),
Mod
erat
e (M
) or
Low
(L)
for
Nut
rien
t Re
tent
ion
and
Tra
nsfo
rmat
ion
co(N <N
O
COCM
O
o© <oo o
CO
T3oxT3
m
©<N
O' ©co O
00
00 o
CL,
cnco
(SIVO
O
CSVO
T3<uT3
JO
*0two o
T3
co inO *—<
- max
imum
we
ight
for
oppo
rtuni
ty
(vs.
effe
ctiv
enes
s)
For the floodflow, nutrient and sediment functions, it was found that occasionally, factors
were used for evaluating opportunity, but not effectiveness, two concepts that are kept
separate in WET II. Ignoring the opportunity ratings would have implied that WET II failed
to consider some factors that were used by one or both the remaining methods. Information
would have been lost. To ensure fair treatment, since the other two techniques combined the
concepts, it was decided to record the opportunity ratings in parentheses when they differed
from the effectiveness ratings.
Only the Palustrine System was examined for the aquatic/finfish habitat and wildlife habitat
functions of WET n. The corresponding interpretation keys had specific boxes for the other
wetland systems of Estuarine, Lacustrine and Riverine. Since the field sites for this study
represented only the Palustrine System, those factors specific to the other systems did not
contribute to the final rating for these functions. Determining the weights of these factors,
therefore, would not have helped in explaining any field result discrepancies among the
methods. In addition, WET II actually separates the wildlife (waterfowl) function into three
categories: breeding, migration and wintering. To facilitate comparison with the other two
methods, the wildlife habitat key was treated as a single key by summing the maximum
possible weight from each of the three wildlife keys, to obtain a cumulative weight.
Consequently, for this function of WET II, the score could be greater than 1.0, but the
ranking process was the same.
To determine how much of the same type of information was used by each method to assess
the five functions, similarity indices were calculated. The cumulative number of different
factors used between each pair of methods comprised the denominator. The number of
factors shared by the two methods constituted the numerator.
Similarity indices were also calculated to determine to what extent the factors shared by two
methods were also given the same weight or degree of influence in evaluating the same
function. The number of factors given the same ranking by both methods was divided by the
48

number of factors the two methods had in common.
Finally, as a practical application, the study attempted to assess how useful and reliable the
acquired field data may be in assisting with management decisions. Using the field data from
any two sites of the same wetland class, i.e. two PFOlA's or two PFOlC's, tables were
constructed to illustrate one way in which the results from this study could be organized to
offer useful landscape management information.
49

4.0 RESULTS
Tables A1 to A20 in Appendix A record the results of using all three evaluation methods on
each of the twenty wetland sites.
Table A21: Summary of Field Results per Rating
FunctionH M L
WET VIMS NH WET VIMS NH WET VIMS NH
Floodflow Alteration 12 16 15 7 2 3 1 2 2
Nutrient R & T 10 0 1 1 19 19 9 1 0
Sediment/Toxin Retention 12 0 2 0 19 12 8 1 6
Aquatic/Finfish Habitat 0 11 4 8 0 9 12 9 7
Wildlife Habitat 17 9 11 3 10 9 0 1 0
Using only the Functional Value Index (FVI) ratings from the New Hampshire Method, Table
A21 reveals that all three methods tended to rate a majority (at least 12/20 or > 60%) of the
wetlands High for floodflow alteration. The three methods were similar in their individual
treatments of both the nutrient and sediment functions. Within each method, the numbers of
H, M and L’s were essentially the same for both functions. WET II evaluated most sites as
having either a High or a Low probability of performing the nutrient and sediment functions;
the VIMS and New Hampshire methods evaluated most sites as having a Moderate rating.
The proportion of H, M and L’s varied greatly among the three methods for the
aquatic/finfish habitat function. WET II failed to assign any H’s to the sites; the VIMS
Technique, any M ’s. For the wildlife habitat function, all three methods tended to evaluate
the sites as having either a High or Moderate probability of providing valuable habitat. Both
the VIMS and New Hampshire methods assessed half the sites as High, half as Moderate.
WET II awarded 85% of the sites as High.
50

Table A22: Number of Sites that Received Three Identical/Different Ratings
FunctionNumber of Sites
Identical Ratings Different Ratings
Floodflow Alteration 7 2
Nutrient Retention & Transformation 1 2
Sediment/Toxin Retention 0 7
Aquatic/Finfish Habitat 1(3) 6
Wildlife Habitat 9 1
(#) - value calculated using WVU's grouped by stream order for the NH Method
Table A23: Similarity Indices Between 2 Evaluation Methods for All 20 Wetland Sites
Function WET vs VIMS VIMS vs NH WET vs NH
Floodflow Alteration 0.70 0.55 0.35
Nutrient Retention & Transformation 0.05 0.90 0.05
Sediment/Toxin Retention 0.05 0.55 0.05
Aquatic/Finfish Habitat 0.15 0.55 0.10
Wildlife Habitat 0.60 0.55 0.70NH - ratings determined using FVTs (not WVU's)
If only the Functional Value Index ratings are used from the New Hampshire Method, Tables
A22 and A23 show that the wildlife habitat function exhibited the most agreement among the
three evaluation methods. Nine out of the twenty wetland sites received identical ratings from
the three techniques (i.e. three H's, M's or L's). All three similarity indices were > 55%.
More than half of the sites were given the same rating from two of the methods.
The floodflow alteration function displayed the second most agreement among the three
methods if the New Hampshire Method's FVI ratings were used in lieu of the Wetland Value
Unit ratings. Seven out of the twenty wetland sites were given the same final rating by all
three methods. All three similarity indices were >35% . At least one-third of all the sites
received identical ratings from the three methods.
51

If the WVU’s are used instead of the FVI’s, three sites received the same evaluation from the
three methods for the aquatic/finfish habitat function. (All three sites received a Low rating
from each method.) Just over half of the sites, (11/20 or 55%) were given the same
evaluation by the VIMS and New Hampshire methods. However, six sites were given
completely different ratings by the three methods; that is, each of the six sites received an H,
M and L for the aquatic/finfish habitat function.
Only one site showed a three-way agreement for nutrient retention and transformation.
However, the highest similarity index out of the five functions was achieved between the
VIMS and New Hampshire methods for the nutrient function. Eighteen of the twenty
wetlands, or 90% of the sites, received the same rating from these two techniques.
Not a single site was given the same rating by all three for sediment/toxin retention. In fact,
as far as displaying the most disagreement among the three methods, sediment/toxin retention
resulted in the highest total of seven sites. As with the floodflow, aquatic habitat and wildlife
habitat functions, 55% of the sites did receive the same final rating by the VIMS and New
Hampshire methods for sediment/toxin retention.
Finally, Table A23 shows that the VIMS Technique always shared the highest similarity index
with one of the other methods for the floodflow, nutrient, sediment and aquatic habitat
functions.
52

5.0 DISCUSSION
The wildlife habitat function exhibited the most agreement among the three evaluation
methods in assessing the 20 wetland sites. Historically, wetlands were first recognized and
appreciated for their habitat value. Literature about the role of wetlands for this function is
extensive and probably the best known when compared with the other four functions. The
critical factors for predicting the probability that a wetland will perform this function may be
clearly identified, leaving little question as to which factors are the most important. Table C5
in Appendix C (simplified below) shows that acreage, vegetation, accessibility, degree of
disturbance, surrounding land use, wetland type and water quality are used by all three
methods to evaluate wildlife habitat. Overall, the three methods use 44-64% of the same type
of information to evaluate the wildlife function (Table C6 below)
At least 19 of the 20 sites, or 95% of the wetlands surveyed, were rated as having either a
High or Moderate probability of providing valuable wildlife habitat (Table A21). Many
wetland scientists and managers appear to favour the wildlife habitat function as one of the
most, if not, the most valuable function a wetland can perform (P. Mason and J. Bradshaw,
pers. comm.). Hence, there could be a built-in bias towards rating most wetlands as having
at least a Moderate probability of performing the function.
53
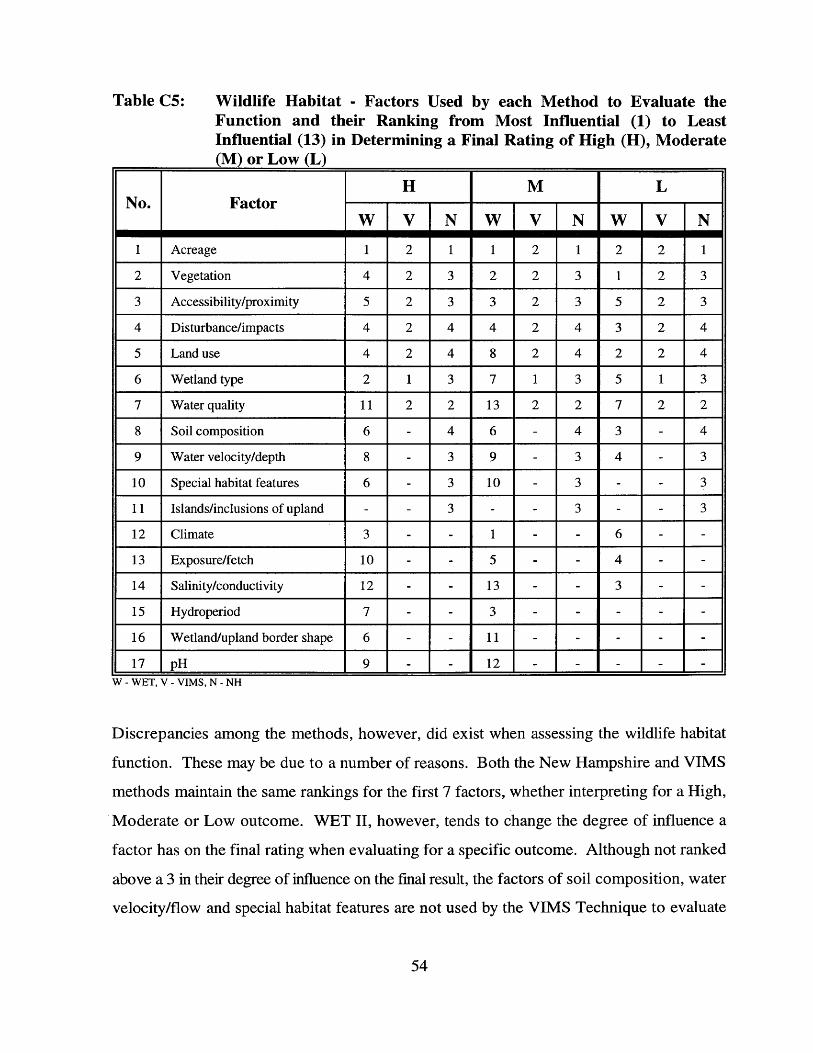
Table C5: Wildlife Habitat - Factors Used by each Method to Evaluate theFunction and their Ranking from Most Influential (1) to Least Influential (13) in Determining a Final Rating of High (H), Moderate (M) or Low (L)__________________________________________________
No. FactorH M L
W V N W V N W V N
l Acreage 1 2 l l 2 l 2 2 l
2 Vegetation 4 2 3 2 2 3 1 2 3
3 Accessibility/proximity 5 2 3 3 2 3 5 2 3
4 Disturbance/impacts 4 2 4 4 2 4 3 2 4
5 Land use 4 2 4 8 2 4 2 2 4
6 Wetland type 2 1 3 7 1 3 5 1 3
7 Water quality 11 2 2 13 2 2 7 2 2
8 Soil composition 6 - 4 6 - 4 3 - 4
9 Water velocity/depth 8 - 3 9 - 3 4 - 3
10 Special habitat features 6 - 3 10 - 3 - - 3
11 Islands/inclusions of upland - - 3 - - 3 - - 3
12 Climate 3 - - 1 - - 6 - -
13 Exposure/fetch 10 - - 5 - - 4 - -
14 Salinity/conductivity 12 - - 13 - - 3 - -
15 Hydroperiod 7 - - 3 - - - - -
16 Wetland/upland border shape 6 - - 11 - - - - -
17 PH 9 - - 12 - - - - -W - WET, V - VIMS, N - NH
Discrepancies among the methods, however, did exist when assessing the wildlife habitat
function. These may be due to a number of reasons. Both the New Hampshire and VIMS
methods maintain the same rankings for the first 7 factors, whether interpreting for a High,
Moderate or Low outcome. WET II, however, tends to change the degree of influence a
factor has on the final rating when evaluating for a specific outcome. Although not ranked
above a 3 in their degree of influence on the final result, the factors of soil composition, water
velocity/flow and special habitat features are not used by the VIMS Technique to evaluate
54

wildlife habitat, and the remaining seven factors of climate, degree of exposure, salinity
regime, hydroperiod, boundary shape and pH, are used solely by WET II. This difference in
the type of information used to assess the function may explain why less than 71% (Table
A23) of the sites received identical ratings by two or more of the evaluation methods.
Moreover, of the factors the techniques have in common, Table C7 reveals that < 30% are
given the same degree of influence in determining the final rating.
Table C6: Similarity Indices Between 2 Evaluation Methods in the Type of____________ Information (Factors) Used to Evaluate the 5 Functions_____________
FunctionWET vs VIMS VIMS vs NH WET vs NH
H M L H M L H M L
Floodflow Alteration 0.67 0.50 0.67 0.33 0.20 0.33 0.29 0.29 0.29
Nutrient Retention & Transformation 0.36 0.40 0.36 0.78 0.67 0.78 0.44 0.44 0.44
Sediment/Toxin Retention 0.33 0.46 0.43 0.70 0.60 0.70 0.30 0.31 0.31
Aquatic/Finfish Habitat 0.38 0.15 0.27 0.44 0.25 0.33 0.62 0.62 0.64
Wildlife Habitat 0.44 0.44 0.58 0.64 0.64 0.64 0.59 0.63 0.64Calculated using effectiveness (not opportunity) ratings by WET II
Table C7: Similarity Indices Between 2 Evaluation Methods in the Ranking of theFactors Used to Evaluate the 5 Functions
FunctionWET vs VIMS VIMS vs NH WET vs NH
H M L H M L H M L
Floodflow Alteration 0.33 0.33 0.17 0.33 0 0.33 0 0 0.50
Nutrient Retention & Transformation 0.25 0.75 0.50 0.14 0.17 0.14 0.75 0 0.25
Sediment/Toxin Retention 0.33 0.67 0.50 0.29 0.17 0.14 0.33 0.25 0.25
Aquatic/Finfish Habitat 0.80 0.50 0 0.50 0.50 0.33 0.25 0.25 0.29
Wildlife Habitat 0 0.14 0.29 0.14 0.14 0.14 0.30 0.30 0Calculated using effectiveness (not opportunity) ratings by WET II
The floodflow alteration function showed the second most agreement among the three
evaluation techniques. Table C l in Appendix C (simplified below) shows that all three
methods used outlet constriction (water velocity) and acreage to evaluate the function. In
fact, Table C6 above reveals that the three techniques use 20-67% of the same information
55
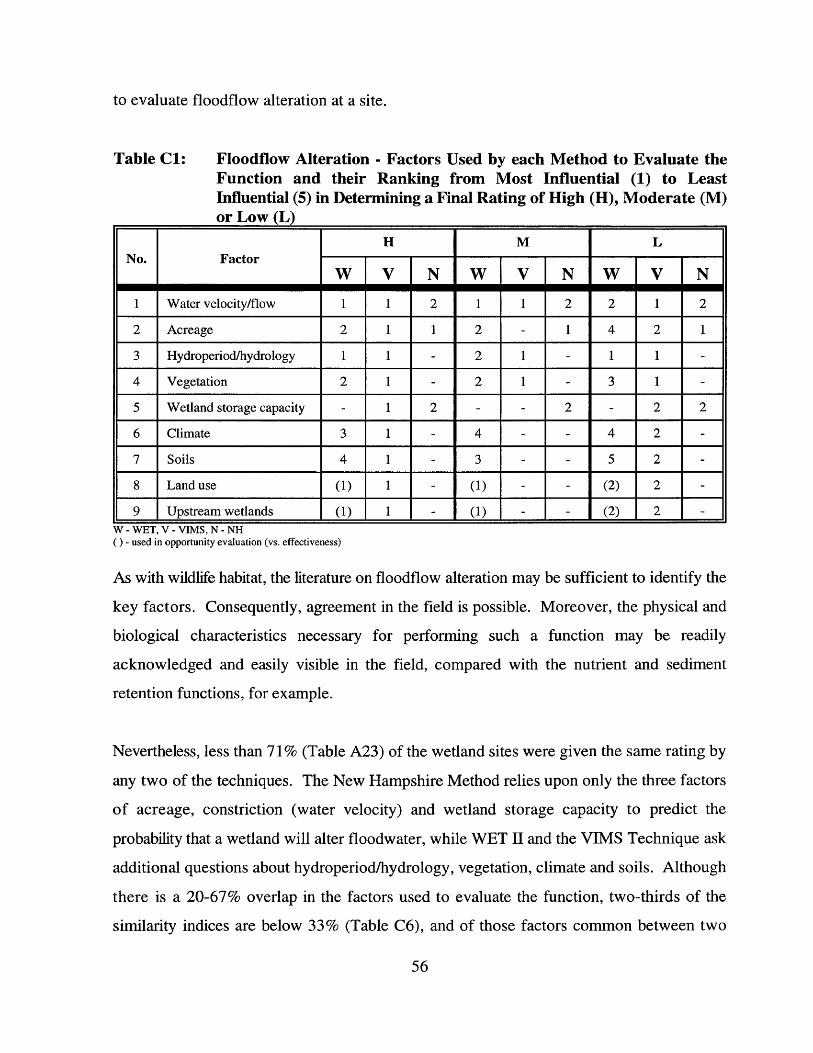
to evaluate floodflow alteration at a site.
Table Cl: Floodflow Alteration - Factors Used by each Method to Evaluate theFunction and their Ranking from Most Influential (1) to Least Influential (5) in Determining a Final Rating of High (H), Moderate (M) or Low (L)______________________________________________________
No. FactorH M L
w V N w V N w V N
1 Water velocity/flow 1 1 2 1 1 2 2 1 2
2 Acreage 2 1 1 2 - 1 4 2 1
3 Hydroperiod/hydrology 1 1 - 2 1 - 1 1 -
4 Vegetation 2 1 - 2 1 - 3 1 -
5 Wetland storage capacity - 1 2 - - 2 - 2 2
6 Climate 3 1 - 4 - - 4 2 -
7 Soils 4 1 - 3 - - 5 2 -
8 Land use (1) 1 - (1) - - (2) 2 -
9 Upstream wetlands (1) 1 - (1) - - (2) 2 -W - WET, V - VIMS, N - NH ( ) - used in opportunity evaluation (vs. effectiveness)
As with wildlife habitat, the literature on floodflow alteration may be sufficient to identify the
key factors. Consequently, agreement in the field is possible. Moreover, the physical and
biological characteristics necessary for performing such a function may be readily
acknowledged and easily visible in the field, compared with the nutrient and sediment
retention functions, for example.
Nevertheless, less than 71% (Table A23) of the wetland sites were given the same rating by
any two of the techniques. The New Hampshire Method relies upon only the three factors
of acreage, constriction (water velocity) and wetland storage capacity to predict the
probability that a wetland will alter floodwater, while WET II and the VIMS Technique ask
additional questions about hydroperiod/hydrology, vegetation, climate and soils. Although
there is a 20-67% overlap in the factors used to evaluate the function, two-thirds of the
similarity indices are below 33% (Table C6), and of those factors common between two
56

techniques, < 50% (Table Cl) are given the same weight (degree of influence). Moreover,
the function has three similarity indices of 0. Not a single factor has the same degree of
influence in determining a Moderate rating between the New Hampshire Method and the
other two techniques, or in determining a High rating between the New Hampshire Method
and WET II.
The highest similarity indices for the nutrient (0.90), sediment (0.55) and aquatic (0.55)
functions were shared between the VIMS and the New Hampshire methods(Table A23). The
methods were extremely similar in evaluating the sites for nutrient retention and
transformation. Ninety percent, or 18/20 wetland sites were given identical ratings by the two
methods. The two use 67-78% of the same information to evaluate the nutrient function
(Table C6, simplified below).
Table C6: Similarity Indices Between 2 Evaluation Methods in the Type of____________ Information (Factors) Used to Evaluate the 5 Functions_____________
FunctionWET vs VIMS VIMS vs NH WET vs NH
H M L H M L H M L
Nutrient Retention & Transformation 0.36 0.40 0.36 0.78 0.67 0.78 0.44 0.44 0.44
57

Table C2: Nutrient Retention and Transformation - Factors Used by each Methodto Evaluate the Function and their Ranking from Most Influential (1) to Least Influential (5) in Determining a Final Rating of High (H), Moderate (M) or Low (L)________________________________________
No. FactorH M L
W V N W V N W V N
l Vegetation 2 1 2 l 1 2 l 1 2
2 Hydroperiod/hydrology 2 1 2 l 1 2 2 1 2
3 Water velocity/flow 1 1 5 l 1 5 1 1 5
4 Land use 3 1 3 2 1 3 3 1 3
5 Acreage - 1 1 (2) 1 1 (2) 1 1
6 Watershed slope - 1 4 - 1 4 - 1 4
7 Wetland storage capacity - 5 - 5 - 5
8 Climate - 1 - (1) 1 - (2) 1 -
9 Upstream wetlands - 1 - (1) 1 - (2) 1 -
10 Impacts/modifications 2 - - 1 - - 1 - -
11 Soils 3 - - 2 - - 2 - -W - WET, V - VIMS, N - NH ( ) - used in opportunity evaluation (vs. effectiveness)
Table C2 in Appendix C (simplified above) shows that for the evaluation of this function, the
VIMS and New Hampshire techniques both consider the same seven factors: vegetation
density and diversity, type of hydroperiod/hydrology, water velocity/flow/depth
characteristics, surrounding land use, acreage, watershed slope and wetland storage capacity.
The WET II technique, on the other hand, does not use the latter two factors to assess the
nutrient function. Acreage is regarded as the most important factor according to the New
Hampshire and VIMS methods. WET II gives acreage a second-place ranking, but only uses
the factor when evaluating for opportunity separately. Finally, the degree of
impact/modification and soil type are used solely by WET II, which also may account for the
greater degree of disparity between WET II and the other two techniques.
58

Table C7: Similarity Indices Between 2 Evaluation Methods in the Ranking of theFactors Used to Evaluate the 5 Functions
FunctionWET vs VIMS VIMS vs NH WET vs NH
H M L H M L H M L
Nutrient Retention & Transformation 0.25 0.75 0.50 0.14 0.17 0.14 0.75 0 0.25
The fact that 18/20 sites received identical ratings from the VIMS and New Hampshire
methods is not well explained, however, by the similarity indices in Table C7 above. Only a
meager 14-17% of those factors shared by the two techniques are ranked the same in degree
of influence on the final rating. The challenge, as mentioned previously, was to represent all
the questions (factors) asked by all three methods by grouping the factors into sufficiently
broad categories so as to enable comparison among the methods. Some detail was lost,
therefore, in the lumping process. Hence, the indices may under- or over-estimate the degree
of similarity between two methods.
As far as receiving three identical ratings, only one site (Table A22), Site 3 (Table A3,
Appendix A) was evaluated as having a Moderate probability of retaining and/or transforming
nutrients by all three methods. Table C6 shows that less than half, 36-40%, and 44% of the
factors used by the methods are shared between WET II and the VIMS Technique, and WET
II and the New Hampshire Method, respectively. This difference in the type of information
used to assess the nutrient function may explain why only 5% (Table A23) of the sites earned
the same evaluation from either WET II and the VIMS Technique, or WET II and the New
Hampshire Method.
Similar explanations exist for the sediment/toxin retention function. Although only 11/20 of
the sites (55%) received identical ratings from the two methods, both the VIMS and New
Hampshire methods used the same seven factors. As Table C3 in Appendix C (simplified
below) shows, WET II only uses acreage and watershed slope when evaluating for
59

opportunity separately. Wetland storage capacity is not included. As with the nutrient
function, WET II used additional factors not considered by the other two methods. WET II
uses degree of impact/modification, amount of exposure/fetch, salinity regime and special
aquatic habitat features to evaluate for sediment/toxin retention.
Table C3: Sediment/Toxin Retention - Factors Used by each Method to Evaluatethe Function and their Ranking from Most Influential (1) to Least Influential (4) in Determining a Final Rating of High (H), Moderate (M) or Low (L)______________________________________________________
N o . F actorH M L
W V N W V N W V N
1 Vegetation 2 1 2 l 1 2 1 1 2
2 Hydroperiod/hydrology 3 1 2 l 1 2 2 1 2
3 Water velocity/flow 1 1 2 1 1 4 1 1 4
4 Land use (1) 1 3 3 1 3 4 1 3
5 Acreage - 1 1 (1) 1 1 (1) 1 1
6 Soils 2 1 - 1 1 - 1 1 -
7 Watershed slope (1) 1 3 (1) 1 3 (1) 1 3
8 Climate - 1 - 4 1 - 4 1 -
9 Wetland storage capacity - 2 2 - - 4 - 2 4
10 Upstream wetlands - 1 - (1) 1 - (1) 1 -
11 Impacts/modifications 3 - - 1 - - 1 - -
12 Exposure/fetch 3 - - 1 - - 1 - -
13 Salinity/conductivity - - - 1 - - 2 - -
14 Aquatic habitat features - - - 2 - - 3 - -W - WET, V - VIMS, N - NH ( ) - used in opportunity evaluation (vs. effectiveness)
Less than half, 33-46%, of the factors used by the WET and VIMS techniques are common
to both (Table C6, simplified below). Only 30-31% of the factors used by the WET II and
New Hampshire methods are common to both.
60

Table C6: Similarity Indices Between 2 Evaluation Methods in the Type of____________ Information (Factors) Used to Evaluate the 5 Functions_____________
FunctionWET vs VIMS VIMS vs NH WET vs NH
H M L H M L H M L
Sediment/Toxin Retention 0.33 0.46 0.43 0.70 0.60 0.70 0.30 0.31 0.31
Table C7: Similarity Indices Between 2 Evaluation Methods in the Ranking of theFactors Used to Evaluate the 5 Functions
FunctionWET vs VIMS VIMS vs NH WET vs NH
H M L H M L H M L
Sediment/Toxin Retention 0.33 0.67 0.50 0.29 0.17 0.14 0.33 0.25 0,25
The sediment/toxin retention function exhibited the most disagreement among the three
evaluation methods. Seven sites (Table A22) received three different ratings from the three
methods; the lowest similarity indices between two of the three methods were calculated for
this function (Table A23 below). This may be explained by the difference in type of
information used by each method, even though out of the few factors they did have in
common, 14-67% were given the same degree of influence on the final rating (Table C7
above).
61

Table A23: Similarity Indices Between 2 Evaluation Methods for All 20 Wetland SitesFunction WET vs VIMS VIMS vs NH WET vs NH
Floodflow Alteration 0.70 0.55 0.35
Nutrient Retention & Transformation 0.05 0.90 0.05
Sediment/Toxin Retention 0.05 0.55 0.05
Aquatic/Finfish Habitat 0.15 0.55 0.10
Wildlife Habitat 0.60 0.55 0.70NH - ratings determined using FVI's (not WVU's)
The literature may be insufficient in identifying the factors which contribute to a wetland’s
ability not only to retain sediments or toxins, but also to retain and/or transform nutrients.
There may not yet be universal consensus about which are the pivotal factors. Another
possible explanation for the disagreement among the methods in assessing the same site for
these functions, could be that both functions may only be adequately evaluated by quantitative
means, due to the inherent nature of their biophysical properties.
Consensus may be lacking for the aquatic/finfish habitat function as the focus and type of
information differ for each method. Both the New Hampshire Method and the VIMS
Technique evaluate this function with fish populations in mind, but the latter noticeably omits
factors which pertain to acreage, vegetation, surrounding land use and substrate composition
(Table C4 in Appendix C, simplified below). WET II evaluates for both finfish and
invertebrates, and asks for additional information such as pH, salinity, temperature and
climate. Nonetheless, degree of impact/modification, water quality, water velocity/depth and
cover/shade are considered by all three methods in predicting the probability that a wetland
will provide aquatic/finfish habitat. Moreover, this was the only function where all three
methods identically ranked a factor they had in common. Degree of impact/modification has
an influence of 2 (out of 5) when all three methods evaluate for a Moderate rating. Water
quality is also ranked a 2 by all three methods, but when determining a High rating.
62

Table C4: Aquatic/Finfish Habitat - Factors Used by each Method to Evaluate theFunction and their Ranking from Most Influential (1) to Least Influential (5) in Determining a Final Rating of High (H), Moderate (M) or Low (L)______________________________________________________
No. FactorH M L
W V N W V N W V N
l Impacts/modifications 1 2 2 2 2 2 2 - 2
2 Water quality 2 2 2 3 1 2 3 1 2
3 Water velocity/depth 1 1 2 3 - 2 3 1 2
4 Cover/shade 1 1 2 4 - 2 - 2 2
5 Hydroperiod 1 1 - 3 - - 3 1 -
6 Acreage 1 - 1 3 - 1 3 - 1
7 Vegetation 1 - 2 2 - 2 2 - 2
8 Land use 1 - 2 3 - 2 3 - 2
9 Substrate type 1 - 2 3 - 2 3 - 2
10 pH 1 - - 2 - - 2 - -
11 Salinity/conductivity 1 - - 1 - - 1 - -
12 Bottom water temperature 3 - - 4 - - - - -
13 Climate 2 - - 5 - - - - -W - WET, V - VIMS, N - NH
The VIMS and New Hampshire methods earned the highest similarity index for the function.
Fifty-five percent of the sites received the same final rating by the two methods (Table A23).
Although these methods have only 25- 44% of the information in common, 33-50% of the
factors they share are ranked the same in degree of influence on the final outcome (Tables C6
and C7, simplified below).
63

Table C6: Similarity Indices Between 2 Evaluation Methods in the Type of____________ Information (Factors) Used to Evaluate the 5 Functions_____________
FunctionWET vs VIMS VIMS vs NH WET vs NH
H M L H M L H M L
Aquatic/Finfish Habitat 0.38 0.15 0.27 0.44 0.25 0.33 0.62 0.62 0.64
Table C7: Similarity Indices Between 2 Evaluation Methods in the Ranking of theFactors Used to Evaluate the 5 Functions
FunctionWET vs VIMS VIMS vs NH WET vs NH
H M L H M L H M L
Aquatic/Finfish Habitat 0.80 0.50 0 0.50 0.50 0.33 0.25 0.25 0.29
64
6.0 CONCLUSIONS / MANAGEMENT IMPLICATIONS
The WET II, VIMS Technique and New Hampshire Method all differ in the total number of
factors they use to assess the functions of floodflow alteration, nutrient retention and
transformation, sediment/toxin retention, aquatic/finfish habitat and wildlife habitat. Any two
of the three methods use anywhere from 15-78% of the same type of information (factors)
to predict the probability that a wetland will perform one of these functions. Any two of the
three methods give 0-80% of their common factors, the same degree of influence in
determining a final rating of High, Moderate or Low.
The processes by which the factors were identified and ranked, however, were not simple.
The labelling of factor categories and the ranking of the various factors often called for its
own best professional judgment. The minimum/maximum number of factor categories had
to be decided to obtain the necessary information. Factors were often interdependent. For
example, the extent to which erosion occurs within a wetland depends upon variables such
as soil composition, average rainfall, adjacent gradient or slope and surrounding land use.
When a method asked a question about erosion, it had to be decided which factor category
or categories best represented that type of information.
This study did not attempt to critique the design of the methods themselves. Disagreement
among the three methods in assessing the field sites may also be explained by differences in
how the questions are asked. Although every attempt was made to ensure that similar
questions from each method were being answered as consistently as possible for the same site,
variations may have existed.
The VIMS Technique proved to require the least amount of time to complete. Fewer
questions needed to be answered, primarily because the technique assesses fewer functions
and no socio-cultural values, compared with the other two methods. The corresponding
interpretation keys are simple to use and the final ratings can be determined fairly quickly.
65

(Refer to Appendix D). It may be preferable, however, to alter the layout of the
interpretation keys. Often, it does not require much time and analysis to identify pivotal
questions/factors. Consequently, an evaluator may be able to (sub)consciously bias the
responses and thus the final outcome. Nonetheless, the highest similarity indices for the
nutrient (0.90), sediment (0.55) and aquatic (0.55) functions were shared between the VIMS
and the New Hampshire methods.
The VIMS Technique tends to rate most nontidal wetlands in Virginia's coastal plain (66%)
as High for floodflow alteration ability, 85% as having a Moderate probability of retaining
both nutrients and sediments, 83% of wetlands as having a Low probability of providing
aquatic/finfish habitat, and 41% and 46% as having a High or Moderate probability,
respectively, of providing wildlife habitat (Appendix B).
The format of the New Hampshire Method is even more straightforward than the VIMS
Technique, as shown in Appendix D. The interpretation/evaluation key is built into the
questionnaire and is easy to use. All calculations can be performed on the page. The manual
supplies most of the secondary data needed to evaluate many of the socio-cultural values.
Although specific to the state of New Hampshire, this method could be easily adapted for use
in Virginia. The fact that it was designed for the non-scientist as well as the scientist, makes
it an attractive evaluation/planning tool for almost any concerned/interested individual. As
many agencies continue to experience budget reductions, equipping the public with a "user-
friendly" wetland assessment technique helps to inform others of the valuable and yet
dwindling wetland resource.
The semi-quantitative scheme used to determine the final ratings, lends versatility to this
method. However, calculating the Wetland Value Unit (WVU), by multiplying the Functional
Value Index (FVI) by an acreage value, tends to result in only the larger sites of the data set
receiving High ratings. Small sites consistently appeared to be evaluated as Low. Many
ecologists would argue quality over quantity. There are those who believe that a small "high
66

quality" wetland may be just as valuable as a large "poor quality" wetland. The New
Hampshire Method does not appear to consider this concept.
The WET II technique required the most amount of time to complete. It is very
comprehensive due to the number of functions and values it assesses, and the extensive series
of questions that must be answered to evaluate them. If the technique does, in fact, undergo
modulations to separate the major types of wetlands (palustrine, lacustrine, estuarine, riverine,
marine, etc.), and thereby eliminate the need to answer questions that do not apply to certain
wetlands, then it will be much more efficient to use; hence, more attractive. Despite the
complexity of the interpretation keys, it is the complexity itself, facilitated by the software
package, which helps to create a somewhat "black-box" perspective when evaluating a site.
This promotes a more objective approach to answering the myriad of questions.
Apart from comparing different methods, there are additional reasons why it may be of value
to identify the rating factor(s) which have the greatest influence. If these pivotal factors are
identified, it may be worthwhile to question whether these evaluation methods can be refined.
If a few critical factors are all that are needed to evaluate a wetland, then an even more rapid
evaluation method could be designed.
Table Set D illustrates one way in which the field data from this study may be organized to
offer management information at the landscape level. Due to the general inconsistencies from
using more than one method to evaluate a site, obtaining this kind of information would, at
present, have to be restricted to the use of only one method. In addition, diversity among
wetland classes would have to be minimized in order to make the necessary generalizations.
Nevertheless, if a matrix could be established, such as the example shown here, a wetland
identified by the National Wetlands Inventory could be evaluated without a field visit, based
solely upon its position in the landscape. The accuracy of the evaluation method, however,
would have to be verified if such a management matrix were to be reliable.
67

Table Dl: Landscape Management Information - Floodflow Alteration
WetlandClass
First-Order Stream Higher Order Stream Isolated
WET VIMS NH WET VIMS NH WET VIMS NH
PFOIA(3 sites)
H/M H/L H - - - - - -
PFOIC (4 sites) H H H M M H H H M
PFOIE(2 sites) - - - M H/L H - - -
PEMIE (2 sites) - - - - - - H H H/M
where H, M, L - High, Moderate, Low NH - FVI (not WVU) final ratings
Table D2: Landscape Management Information - Nutrient Retention/Transformation
WetlandClass
First-Order Stream Higher Order Stream Isolated
WET VIMS NH WET VIMS NH WET VIMS NH
PFOIA L M M - - - - - -
PFOIC L M M L M M H M M
PFOIE - - - H MIL M - - -
PEMIE - - - - - - H M M
Table D3: Landscape Management Information - Sediment/Toxin Retention
WetlandClass
First-Order Stream Higher Order Stream Isolated
WET VIMS NH WET VIMS NH WET VIMS NH
PFOIA L M M - - - - - -
PFOIC L M M H M M H M L
PFOIE - - - L M/L M - - -
PEMIE - - - - - - H M L
68
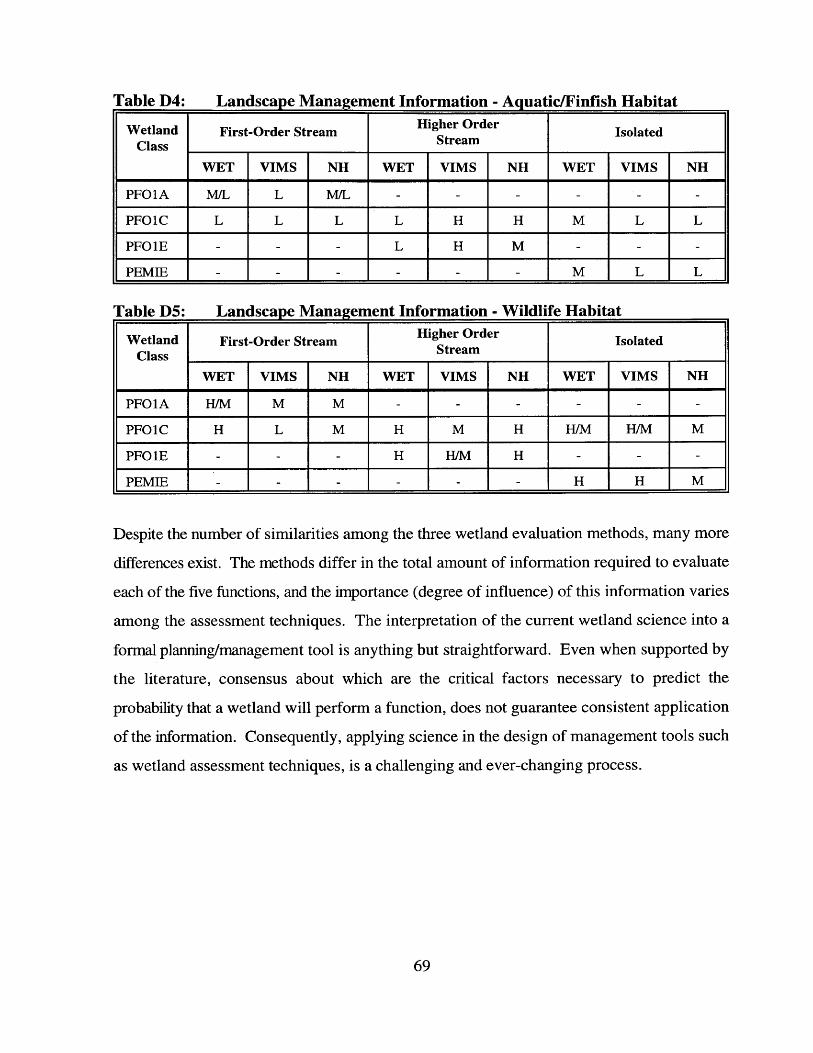
Table D4: Landscape Management Information - Aquatic/Finflsh Habitat
WetlandClass
First-Order Stream Higher Order Stream Isolated
WET VIMS NH WET VIMS NH WET VIMS NH
PFOIA M/L L M/L - - - - - -
PFOIC L L L L H H M L L
PFOIE - - - L H M - - -
PEMIE - - - - - - M L L
Table D5: Landscape Management Information ■ Wildlife Habitat
WetlandClass
First-Order Stream Higher Order Stream Isolated
WET VIMS NH WET VIMS NH WET VIMS NH
PFOIA H/M M M - - - - - -
PFOIC H L M H M H H/M H/M M
PFOIE - - - H H/M H - - -
PEMIE - - - - - - H H M
Despite the number of similarities among the three wetland evaluation methods, many more
differences exist. The methods differ in the total amount of information required to evaluate
each of the five functions, and the importance (degree of influence) of this information varies
among the assessment techniques. The interpretation of the current wetland science into a
formal planning/management tool is anything but straightforward. Even when supported by
the literature, consensus about which are the critical factors necessary to predict the
probability that a wetland will perform a function, does not guarantee consistent application
of the information. Consequently, applying science in the design of management tools such
as wetland assessment techniques, is a challenging and ever-changing process.
69

APPENDIX A: FIELD RESULTS
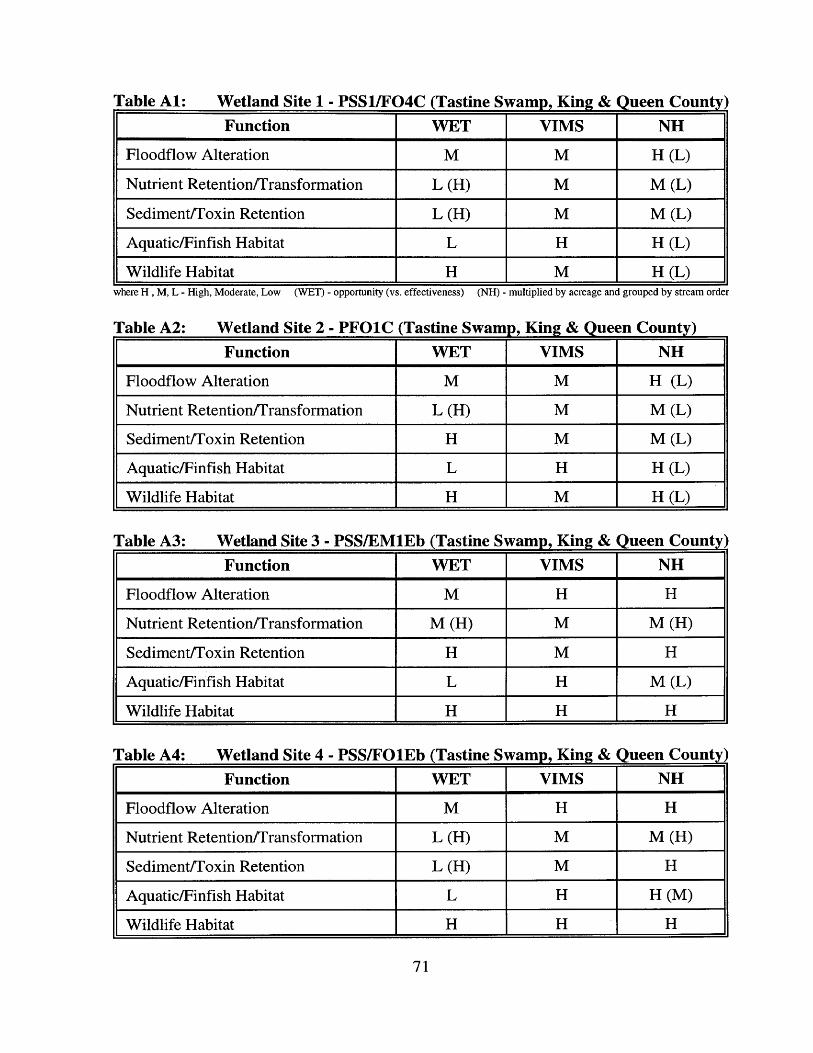
Table A l: Wetland Site 1 - PSS1/FQ4C (Tastine Swamp, King & Queen County^Function WET VIMS NH
Floodflow Alteration M M H (L)
Nutrient Retention/Transformation L (H) M M(L)
Sediment/Toxin Retention L (H) M M (L)
Aquatic/Finfish Habitat L H H (L)
Wildlife Habitat H M H (L)where H , M, L - High, Moderate, Low (WET) - opportunity (vs. effectiveness) (NH) - multiplied by acreage and grouped by stream order
Table A2: Wetland Site 2 - PFOIC (Tastine Swamp, King & Queen County)Function WET VIMS NH
Floodflow Alteration M M H (L)
Nutrient Retention/Transformation L (H) M M (L)
Sediment/Toxin Retention H M M(L)
Aquatic/Finfish Habitat L H H (L)
Wildlife Habitat H M H (L)
Table A3: Wetland Site 3 - PSS/EMlEb (Tastine Swamp, King & Queen County Function WET VIMS NH
Floodflow Alteration M H H
Nutrient Retention/Transformation M (H) M M (H)
Sediment/Toxin Retention H M H
Aquatic/Finfish Habitat L H M (L)
Wildlife Habitat H H H
Table A4: Wetland Site 4 - PSS/FOlEb (Tastine Swamp, King & Queen County'Function WET VIMS NH
Floodflow Alteration M H H
Nutrient Retention/Transformation L (H) M M (H)
Sediment/Toxin Retention L(H ) M H
Aquatic/Finfish Habitat L H H (M)
Wildlife Habitat H H H
71

Table A5: Wetland Site 5 - PEMlFh/PUBHh (Tastine Swamp, King & Queen Co/Function WET VIMS NH
Floodflow Alteration H (M) H H (L)
Nutrient Retention/Transformation H M M (L)
Sediment/Toxin Retention H M M (L)
Aquatic/Finfish Habitat M H M (H)
Wildlife Habitat H H H (L)
Table A6: Wetland Site 6 - PFOIA (Tastine Swamp, King & Queen County)Function WET VIMS NH
Floodflow Alteration M L H (L)
Nutrient Retention/Transformation L (H) M M (L)
Sediment/Toxin Retention L (H) M M (L)
Aquatic/Finfish Habitat L L M (L)
Wildlife Habitat M M M (L)
Table A7: Wetland Site 7 - PSSl/UBFb (Tastine Swamp, King & Queen County]Function WET VIMS NH
Floodflow Alteration H (M) H H (L)
Nutrient Retention/Transformation H M M
Sediment/Toxin Retention H M M (L)
Aquatic/Finfish Habitat M H H (L)
Wildlife Habitat H H H (M)
Table A8: Wetland Site 8 - PFOIA (Corbin Creek, King & Queen County)Function WET VIMS NH
Floodflow Alteration H (M) H H (L)
Nutrient Retention/Transformation L (H) M M
Sediment/Toxin Retention L (H) M M
Aquatic/Finfish Habitat L L M(L)
Wildlife Habitat H M M
72

Table A9: Wetland Site 9 - PUBHh (Glebe Swamp, King & Queen County)Function WET VIMS NH
Floodflow Alteration L (M) H H
Nutrient Retention/Transformation L (H) M H
Sediment/Toxin Retention H M M (H)
Aquatic/Finfish Habitat L H M (H)
Wildlife Habitat H H H
Table A10: Wetland Site 10 - PFOIC (West Point High School, King William Co.)Function WET VIMS NH
Floodflow Alteration H (M) H H (L)
Nutrient Retention/Transformation L (H) M M (L)
Sediment/Toxin Retention L (H) M M (L)
Aquatic/Finfish Habitat L L L
Wildlife Habitat H L M
Table A ll: Wetland Site 11 - PFOIA (Church of the Nazarene, King William Co.]
Function WET VIMS NH
Floodflow Alteration H (M) H H
Nutrient Retention/Transformation L M M (H)
Sediment/Toxin Retention L (H) M M (H)
Aquatic/Finfish Habitat M L L
Wildlife Habitat M M M (H)
Table A12: Wetland Site 12 - PFOIE (Mill Creek, City of Williamsburg)Function WET VIMS NH
Floodflow Alteration M (H) H H
Nutrient Retention/Transformation H M M (H)
Sediment/Toxin Retention L (H) M M (H)
Aquatic/Finfish Habitat L H M
Wildlife Habitat H M H
73

Table A13: Wetland Site 13 - PFOIC (Colonial National Historical Park, York Co.)Function WET VIMS NH
Floodflow Alteration H (M) H M (L)
Nutrient Retention/Transformation H (L) M M (L)
Sediment/Toxin Retention H (L) M L
Aquatic/Finfish Habitat M L L
Wildlife Habitat H H M (L)
Table A14: Wetland Site 14 - PFOIE (Baptist Run, York County)Function WET VIMS NH
Floodflow Alteration M L H (L)
Nutrient Retention/Transformation H(L) L M (L)
Sediment/Toxin Retention L (M) L M (L)
Aquatic/Finfish Habitat L H M (L)
Wildlife Habitat H H H (L)
Table A15: Wetland Site 15 - PFOIC (Shiping Light Church, City of Newport News]Function WET VIMS NH
Floodflow Alteration H (M) H M (L)
Nutrient Retention/Transformation H (L) M M (L)
Sediment/Toxin Retention H M L
Aquatic/Finfish Habitat M L L
Wildlife Habitat M M M (L)
Table A16: Wetland Site 16 - PFQ5Fh (Newport News Park, City of Newport NewsFunction WET VIMS NH
Floodflow Alteration H (M) H L
Nutrient Retention/Transformation L (M) M M (L)
Sediment/Toxin Retention H M L
Aquatic/Finfish Habitat L H M
Wildlife Habitat H M H (L)
74

Table A17: Wetland Site 17 - PFOlEh (Newport News Park, City of Newport NewsFunction WET VIMS NH
Floodflow Alteration H (M) H L
Nutrient Retention/Transformation H(L) M M (L)
Sediment/Toxin Retention H M M (L)
Aquatic/Finfish Habitat L H M (L)
Wildlife Habitat H M H (L)
Table A18: Wetland Site 18 - PEMIE (Newport News Park, York County)Function WET VIMS NH
Floodflow Alteration H (M) H H
Nutrient Retention/Transformation H (L) M M (H)
Sediment/Toxin Retention H (L) M L (H)
Aquatic/Finfish Habitat M L L
Wildlife Habitat H H M (H)
Table A19: Wetland Site 19 - PSS1E (Newport News Park, York County)Function WET VIMS NH
Floodflow Alteration H (M) H H
Nutrient Retention/Transformation H (L) M M (H)
Sediment/Toxin Retention H (L) M L (H)
Aquatic/Finfish Habitat M L L
Wildlife Habitat H M M (H)
Table A20: Wetland Site 20 - PEMIE (Newport News Park, York County)Function WET VIMS NH
Floodflow Alteration H (M) H M (L)
Nutrient Retention/Transformation H (L) M M
Sediment/Toxin Retention H (L) M L
Aquatic/Finfish Habitat M L L
Wildlife Habitat H H M
75
APPENDIX B: WEIGHTING THE FACTORS

Tabl
e Bl
: W
etla
nd
Eval
uatio
n Te
chni
que
- Max
imum
Po
ssib
le W
eight
of
Fact
ors
that
can
C
ontr
ibut
e to
a Fi
nal
Ratin
g of
High
(H
), M
oder
ate
(M)
or Lo
w (L
) for
Fl
oodf
low
Alte
ratio
n___
____
____
____
____
____
____
____
____
____
____
__ -COD
<U
£
3EE<3
vxuaC3
o©
i-"o
o&!d
Pp 111J
©P
P©"3
c jo
0 ©01
vo2 ae
p£o43
po'5bojM
’o X% ^ ©Po
•© e - P .2233 55 c l cd .tr xx o _£a p ©, 3I T £3 Si P
■ 5 cd <4-1 P O CdCJ C3S ° 2 5:3 •S .2
© fltf£ • ~ «d Oh8 '3•2 a
< CL "N -aCJ 0 )
CJ*3 CJtn ^ •—i a)
O
©
cn■p-
in<N
icj
pO
4 3cn53o>>
c joc j
2 e- .2 «©Pjdcj
cjocjcd> .pcd
©ccd
3cj
<+-(01cjCJ
*t3£3C/5CJ
43
OCN
o ©i n i n© o' '
c ncn©
o
S'©p_o
‘5bCDC/5 M
• a *g # Aa
on ^ CJ a O A © .. CD 4 3 6 0 cd CD M CJcd e - . © &c«I*OJ
3(D43
cd£3CD
43
o Olcj fcS
*3 v8 p m CD O h
od43
oCN
cncn
Po’5b
©©V
&©PO’5bCD
cnA
©CD43
i nA
IoCJcn
3CJO hoO hpoQ
cn©
cncn©
> o o ©tS ce <uCJ •*-»3 +5^ s£ I
poJ&3CJ43
o£3cd
©P
CDOQ
£ £, . CJo -—>
9 Po
43 ©
n -C -
OO ©
©■M PP CJCJ pp pp pg OJCJ ©© 43
43'1
OJ^ !
^p p0
cd 0
i n©
VOcn©
»oCN
5©£CD6 0PMCJ
%CJ
43
2cd£
4 360
CJ43
oCJ
43
O43■M33£CJ60cdCJ(►cd
vcj cn
CD43
o
3L-io■5©
GCJC/1
&. 1=8 -S3 ^ 1 ^ 2 6 0 CC ^
cn cd
CJ
©Pcd
> 1 ■§ 5 § "2© cd C O 4 3 CJ
Lh t j O h
2 . . S4-C rrt Cl
CJOJ■5©ocd
PCJ
°O h Pcn co
^ ° S 53 *2 « S <=| § •s -84 3 cj
opcd
cnN"
Oi n
OJpP
pCJp©<Dcn©Pcn
© IiS3CD>-•P<Dopo
Z<D ^
. p ^ cn cd © © S c
£ £© < S CJ p ©
"§ 3C/3 ^
§ I 6 0 ©©P Oo © o £3ppH 0 0P es
£O9CJ CJ
43 © p p
4 36 0PO
CJoQ
S o
cn 0 © i n
cncn
c pS3 o 9P O p CJ CJ.s .s^ s S^ .2: ■% (J L CP . .CJ o ©Ip-6 0CJ
43
§ cj 2pS p , g£ © S-P +t? cn cn cn -S9 y P S i 2 O h
CJ P 4 3
4 3CJ
P
©©
r-~©
Z
©pp
©pjd©CJ
OJDJDP£p
pCJcn
1Oa
r-t*-
CJ43
CDO©a©ppppO©Pjd'flu
CJ60
, P
sisp
L-hO
O h
3CJ9

<D>© P
2: 2 p p <D
© 9cd +Ss sp g<D c2 ° b o <->o . 5
& ©© pCD
£ ^ <D ©
© P <D P© CQ 8 8
e p</i ^M N <3 '+-' 73 o
X ! V.p «cn ©
'S *p c
/-> OJCJ ©
H-T O§ O
CD CD
*8 2c/3 c<D P
cn OM ©P
. 2 O t d 9"aj P 6 0 ©
S Ig j p
9 " 2
£ o o ©
7 3 . 2-0 *d 4-J P. 2 ©
(D4 3
r o©
ooCNoo
73 < ^P <J ,2
< 2 C 1(D
4 3
&
C5
& J30) T3
■8 M
53 J i
s .43a.o&
43
§ 1
2 =* © oH-H PCJ © CD - m
Mh CJ CD (D
CO ©
S3 -g
W) g ,
i §
13 § P 1 1 1 S-ap -o S
*1 S" S o•S
CT fi C S 4) Sca p xi p u ti <u
O 3
S i !-2 o 2 3rH th
P©
oo©
CDPPP
4 3CJ
C_ o"cn
Vh0)©
2 £f> « > OJ 6 0P Po
N_ p
po
©o
©p
o 53 b o ^ a j cn> PH-» 2CJ P CD p
o \o©
ooCNo
rrt Vh
© £ » 2© 5«3 . > £ p 63 aj o =2 oN (D . P
■ g - t
6 0_P
’p><DVh©CD
43
4 36 0’534 3
CD
x!CNPP©Vh
2
1©p
<DC-. 6 0O W
• g < 2p °P OJ
B °*CD ©
4 3 P« Bed M ©(D (D
g &cD P P 2
1 2 S
§ p o pp p
4 3 p cn 4 2 O (D
©
<DO
Q
8 Bp 2 P E«
4 3c j 1/54 © cn c
" o 3 © 2£ .©
S ^<D o cn £3VH<D =© ©cnc3 43" P i O P P •— CD © Vh
. 2 5 § ,
2 ~
6 0 Z
£ ^
o©
23
p
6 0P
'>P
4 3
<D9
CO©
00CN©©
CD4 3
©2p
4 2
pCD0 0u0)
<U©Ct-IO
-Pa
*-i 63M -M
6 0CD>cnPO
P ^D O
a 53 —© ] p ■g
p © BO M S
2 4)S po pO
gc-Ss *o =
■S z
^ ! *
CDPPP
4 3CJ
ID9
Q&CD©
CD>O4->Pocn©P
©
©PP
4 30pp
(D4 3
CDH—»P(D
<3oS £cn P O
’+->© P O CJ
£o
©CD6 0PCD
sMCD
P © 5-1 P2 pcd • •© 4 2
©CN
©n
c oCOcj
CD_P
© Pp K
o 2 55 ©9 ©
c 2 c 5
2 cnPPCDl-HCD©©PP
P4 3
icdz
> h - a
D >0 CJ© pcd
1CD
2 6 0 P©3
7 jXCD '
'S © 9 g3-h AOJ C/5cd X)^ 2cn O
P OCD cnc3 ©
CD“ (/5
§ aI t: x 6 0 £
> 0 CD cn m P ^ 6>
© u S a jCJ j -a j © M o. . Ma j o
s2p
©pcn vx Vh " 2o aPa 2
x > . 2
a jo cn Cd ©•c aS 9
CD©
0 £P XX o
r ^v o
©
00CN©
cn O © CD
© H—>P<D
©CD
POCJcn
Pcd©OJ6 0P6 0
£O©
' pId §
00*w ^ 0>.23 00
CJ ©
JD
z _ =0 J Pg © P PP P
■g ^P ' g22 oa c5 p
•O p cn 6 0 O Jd p c j ©
i s s© oj aj « 2 ^ 9CD9 p 42C+—IO
PP
CD
OOr -

ON o ONo ON<Noo o o
cn cn cn10o o o
ooCN o o
o o
bo CN
T3O’7=>o ’5T3
O
oeS OCL,<uTD
T 3T3
CL 9*
T3
cn T3bO
T3oT3
O T3rr-t72. ’S
Cd ^ 7- f<
O
"O
9<

WET 2.0
Floodflow Alteration Effectiveness (FFAE) Key
0.100.100 .1 0
0.10o.io
0.11
[ (10D/E/F-y) ) 1 . 0tidal/estuarine/marine -LOW
ANY of the following:
* \ 3A
[(8.3-=n) and (23=n) ] 0.-S'no permanent outlet and water not artificially removed
(9.2-yor 63.1-y> /.£>unconstricted inlet and constricted outlet or flat hydrograph
[(2.1. 2=y) + (31. 3=n)+(9 . l=y) ] 0 - S S>40 acres aind Zone B < Zone A and constricted outlet
[(2.1. 3=y)+(31. 5=y) + (23=n) ] Q & G>200 acres and Zone A >10% of Zones B and C and water not artificially removed
nAL^Xof the following:
(l) (2.1. l=n)>5 acres
2. (35.1-y)expansive flooding
3. (24.3-=n)soil does not have slow infiltration rate
4. (32A=n or 32E=y or 34.3.1=y)* not permanently flooded or saturated or ponding
(5.) (23-n) fp g p O X tjwater not artificially removed
){C(AU )of the following:
6 ) (2.1.3-y) •>200 acres
2. (24.3-n)soil does not have slow infiltration rate
3. (1.l=y) OR [(22.1.1=y)+(31.6D/E=y)+(12A/B=y)+ (15.1 A=y or 15.2-y)]
"dry" region or E>P OR flow suggested and Zone B and C >60% eB and forested or scrub-shrub and channel flow intercepted by large clumps or
. spreads out over a wide area(4.) (23-n)
water not artificially removed
(22.1. l=y) 0 J 6 * ?flow is suggested
T
Continued --
-HIGH
-HIGH
— FFAE List B -~FFAE List A

WET 2.0
FFAE Key (Cont.)
FFAE List A
K
0 X > & * AOS1*-
f the following:
1. (32A=y) 0 . 1 0 ^permanently flooded
2. (2.1.3=n) Ox 10D .< & * <200 acres
3. [ (1l=y) or (9.l=n+9.2=n)]fringe/island situation or outlet not constricted
4. [ (1. l=n) or (2.1. l=y) ]ot a "dry" region or E<P or <5 acres
■LOW
■MODERATE
FFAE L i s t B
/^LL/f the following:(12A+B=n)
not forested or scrub-shrub2. (31.6A=y or 31.6E=y)
<60% of Zones B and C is eB3. (15.2=n)
instream vegetation-water interspersion not great
LOW
MODERATE
— End —
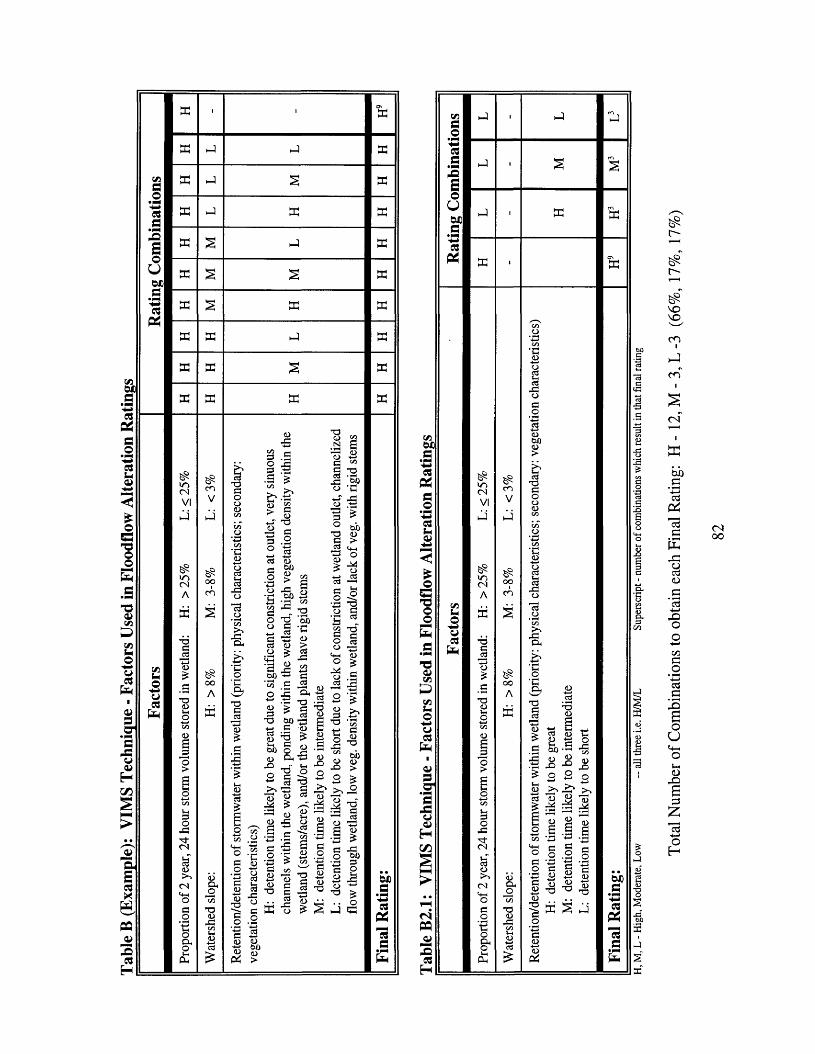
Tab
le B
(Exa
mpl
e):
VIM
S Te
chni
que
- Fac
tors
Used
in
Floo
dflow
Al
tera
tion
Rat
ings
CNcn
T3 60
60
’O 3CN
T3cn
cn
x:O h
60C/3
T3
CN
Total
Num
ber
of Co
mbi
natio
ns t
o ob
tain
each
Fina
l Ra
ting:
H
- 12
, M - 3
, L -3
(66%
, 17
%,
17%
)

cnm
o o
m
o cn
o
cn
m ©
2 -S
T3
O a
cn
ooi
cn C l,
OO
CN CL,
C l,

o
o oo
VOVOd
coco
CO TD
X!Cu bOT3
S ^ •o vii> . .£ Jp f i ns es 5
T3
XI
« IS
CNT3
"O<uX3
<N

Table B3: New Hampshire Method - Ranking of Factors in Floodflow Alteration____________ Ratings________________________________________________________
Factors Ranking
Area of wetland in acres 3
Area of watershed above the outlet of the wetland in acres 2
Wetland Control Length (WCL) in feet [outlet diameter] 1
Functional Value Index (FVI) for Flood Control Potential FVI
Total area of wetland (acres) multiplier
Wetland Value Units WVU
85
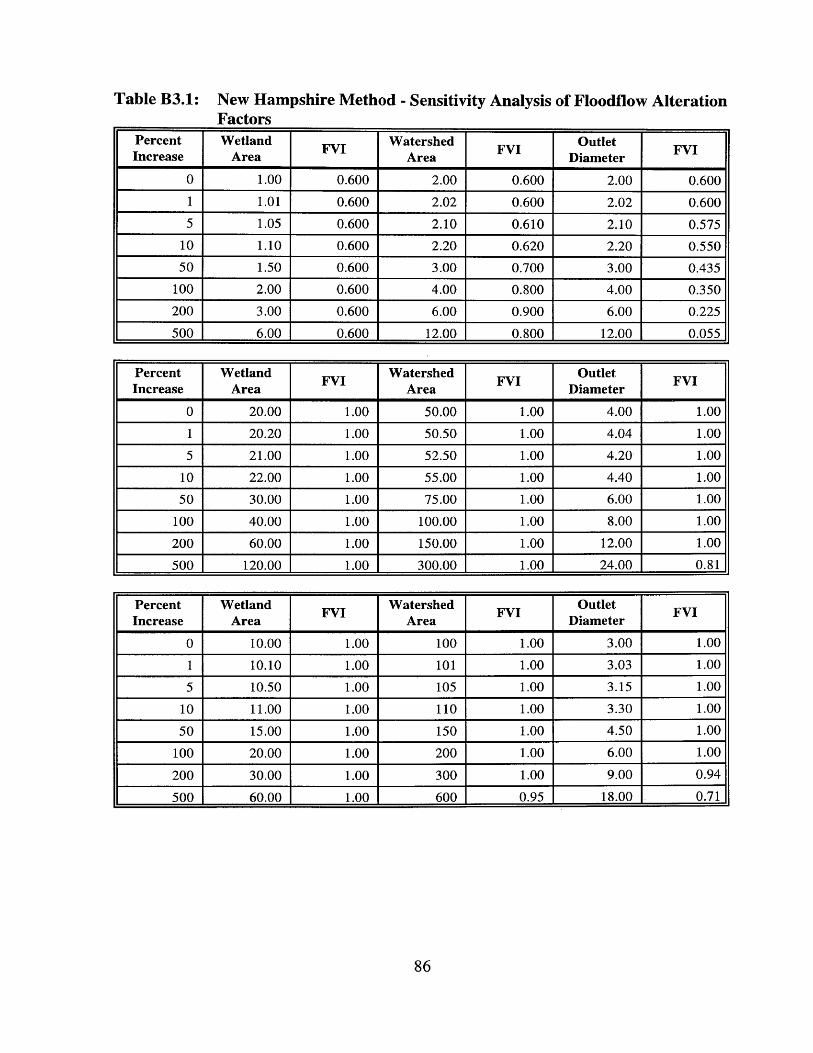
Table B3.1: New Hampshire Method - Sensitivity Analysis of Floodflow AlterationFactors
PercentIncrease
WetlandArea FVI Watershed
Area FVI OutletDiameter FVI
0 1 . 0 0 0.600 2 . 0 0 0.600 2 . 0 0 0.6001 1 .0 1 0.600 2 . 0 2 0.600 2 . 0 2 0.6005 1.05 0.600 2 . 1 0 0.610 2 . 1 0 0.575
1 0 1 . 1 0 0.600 2 . 2 0 0.620 2 . 2 0 0.55050 1.50 0.600 3.00 0.700 3.00 0.435
1 0 0 2 . 0 0 0.600 4.00 0.800 4.00 0.3502 0 0 3.00 0.600 6 . 0 0 0.900 6 . 0 0 0.225
500 6 . 0 0 0.600 1 2 . 0 0 0.800 1 2 . 0 0 0.055
PercentIncrease
WetlandArea FVI Watershed
Area FVIOutlet
Diameter FVI
0 2 0 . 0 0 1 . 0 0 50.00 1 . 0 0 4.00 1 . 0 0
1 2 0 . 2 0 1 . 0 0 50.50 1 . 0 0 4.04 1 . 0 0
5 2 1 . 0 0 1 . 0 0 52.50 1 . 0 0 4.20 1 . 0 0
1 0 2 2 . 0 0 1 . 0 0 55.00 1 . 0 0 4.40 1 . 0 0
50 30.00 1 . 0 0 75.00 1 . 0 0 6 . 0 0 1 . 0 0
1 0 0 40.00 1 . 0 0 1 0 0 . 0 0 1 . 0 0 8 . 0 0 1 . 0 0
2 0 0 60.00 1 . 0 0 150.00 1 . 0 0 1 2 . 0 0 1 . 0 0
500 1 2 0 . 0 0 1 . 0 0 300.00 1 . 0 0 24.00 0.81
PercentIncrease
WetlandArea FVI Watershed
Area FVI OutletDiameter FVI
0 1 0 . 0 0 1 . 0 0 1 0 0 1 . 0 0 3.00 1 . 0 0
1 1 0 . 1 0 1 . 0 0 1 0 1 1 . 0 0 3.03 1 . 0 0
5 10.50 1 . 0 0 105 1 . 0 0 3.15 1 . 0 0
1 0 1 1 . 0 0 1 . 0 0 1 1 0 1 . 0 0 3.30 1 . 0 0
50 15.00 1 . 0 0 150 1 . 0 0 4.50 1 . 0 0
1 0 0 2 0 . 0 0 1 . 0 0 2 0 0 1 . 0 0 6 . 0 0 1 . 0 0
2 0 0 30.00 1 . 0 0 300 1 . 0 0 9.00 0.94
500 60.00 1 . 0 0 600 0.95 18.00 0.71
86

Tabl
e B4
: W
etla
nd
Eval
uatio
n Te
chni
que
- Max
imum
Po
ssib
le W
eigh
t of
Fact
ors
that
can
Co
ntri
bute
to
a Fi
nal
Ratin
g of
High
(H
), M
oder
ate
(M)
or Lo
w (L
) for
N
utri
ent
Rete
ntio
n an
d T
rans
form
atio
n___
____
____
____
____
____
____
p C
.£f*3£s3S*
oCN
cncn©
^ ^o o oCN CN CNO O o'—"
/—vo o cnCN CN cno O os— "■—^
, - 2 p .
oo
cn3-
mcn CNOo o
cnO
cncno
oo
cncnO
o nCN
»nCN
C/1Ua
r'a3DO
c3£o333o'5bQJ
55><
4)PO'oj2 o o
u o
§ 2 ^ p .sis *p 'a^ O m® "3 O0 S CDO 8 «C
.221 < s" o < 2*+1 OJ OJ2 -5 -S 'S*« 3 isOJ
OJa33crcoOom
CN■oo
33c rCOOo
CDCNA
O T 3
3 X>
$0)3 3
onSoj4=
&T3
<DCO
IOCJ
3
3o'5ba
A
m A ol
^ § oT3 . . Oj P DO e3
aocd C. ^ & 3 3 * 2
2 § £ '5b3 CD £ £$CD
3 3
OJ ^
B v3CJ 3 S-,OJCL,
"Ss32
*330
'5ba
cnA01
T 3OJ33
3+->O
<+H0c nAOJC/3
1oCJ
OJCL,
C/3CL,3OQ
OJ
X 3 CJ
33
(D33
3OJ3crOJco
3 33C/3
X3I33 |
e3OJ
255h
©1OJ£OJ3
X 3333
3
1OJ£
QJ X13 ® > *- > o<4—, 3
° 5=1 > , ©
’g 3QJ
3DO T3
■n ojCJ
'BC /33OCJ3
3 3DO3O
OJ>T 3 ?
> S3 3.a £i s
rs3 i3OJ £
oCJ&
S3 .0Q P
T 3 3 OJ£ Voj » o
T 1 3 O 3
P PQ8 a •5 §co ro co N*2 C4_a o 33 be 3 «£ «
a^ QJ6 P* £+ 3 OS OJ
8 os 2oj c S
33• a
OJ 3
CO 3 OJ 3
OT 3
3-2 QJ3 £QJ 3 DO
^ 3QJ 3
& ‘SO 3 13 .S3
- 3C3C/3 H
O
c S
ao
iOJ
3 3
JS u 3 3P •c j a
I s3 OJ
1 •§»g.£ G *Z3 OS Gt§ 73
X> -M
12 &■ § ”2■o fiJ51 ^u <u ^
W) ia s a i i i
oo
P o ■C- 3CJ - o QJ --H
3 h c j OJ QJ
c n " 0
O 00 O ^ CD /—x t) ^ ^ ^ c3 "O X) - o U 73 U
DOS333

cnP
©CN
cncn©
cn3-
oVO
CN CNvo vo© ©© ©
VO©«n
cncn
CN3 "©
CN3 "©
C NVO©
CNVO©
©©
QJP
DO 3a «>
© p
P 33 ^co . 3
QJ
5 5
>h -y
0 p 55 P
b pc 2 § L-h 3
. 2 cn 3 3
aQJ O -i
p~§I'3 2
1co 3 C u
3 O QJ co
©QJCO
3O O h
oj <u DO (”> ° QJ 3 3 3: > . QJ© S§ s
8 £
QJ o
QJ>oc j
©33
< 5<
QJ■gDO
_ 3
©J 373S'S pp S
3 x >
* 2co O
3(D
3 2
0 £
co3qj33
§• e3323co J2 3 2o a 3 ^^ a p .2S3 >
W ' v-tc« o
a 45cd w*§ 3 p« 350 O5 hT o 3
• S O h > O
a j a
6 *o3o
"31aqj
§
3 - 0 0
33
3a
3o
&QJ>3QJ
* t !3
3
L-h
2O
P
3 £
S3
o © - 3CO Q)QJ 00q j a j> 3QJ O h
¥ ^2 o3 QJ
*V3 c/3
a a3 2 3Q 3
d o T ; 3 *D
• 3 co 3 QJ
.2 B0 531 2<4H po o
Q £
o33xQJco3O
3 3
&Oa3
32DO
t
©©©3 ^
33
P
Oa_ 3- 3H-J
3OO 3
£ O
QJ - X
2 3
•s c23J ‘LH3 ;
^ 2 5
& > h
O o -CO COQJ OJ
B P0
-4—> _ 3cd
2 OO
3 LhQJ
3 O hCJ O h
p 3_3 QJ
• gCOco 3"~l
2 a3 33 3coQJO J 3Q2
cd co
■ 5 < N<+h 3
O 3 co 2
QJ O h
e i 2,C QJ ol
£3O
P
3O
2a3QJO3Oo
3 2DO
PC+H
o
3DO
3 O
2 b 3QJ O 3 O o
3 QJ
P
§ f op a
00V
3o in N CN
pQJN
1L-h
CO
2 7 3 P
CO O QJ p a C L 3 QJ
o c/l<*> CO
P P2 S lh p• 3H-» 3
3 J 3 QJ
2 M- a3
3
1QJ-g3
P
V
QJ3ON
3
£QJ•g3
P
DO3
P QJ
£ O h
» gO h
£
> <2 *>h o
QJ g
O 3 O h
CO1 : — *
3 O 3 33o
«« 2 3 p
■«3 aL, (Dg p QJ QJ L’r>32 P DOP - r t c
3O
PQJ
n33QJP
PQJ
CO P«J - p 8 .0 2 >■» — 2 p >
QJ . 3 P P
CN
c o ^
8 p -a .0QJ QJ
b &&3 ~ -Oo P u_ Q) O h Op CO3 O 2n
P P 3 P CL ^
i s so £ - S
O ^ B2 o c3 QJ 0o & 0c o 3 co
wj ^ 83 QJ H
p co 3
3
QJDO3QJ
QJ QJ - c u
P
3 3 J
QJP
CO3QJ
O P
OOOO
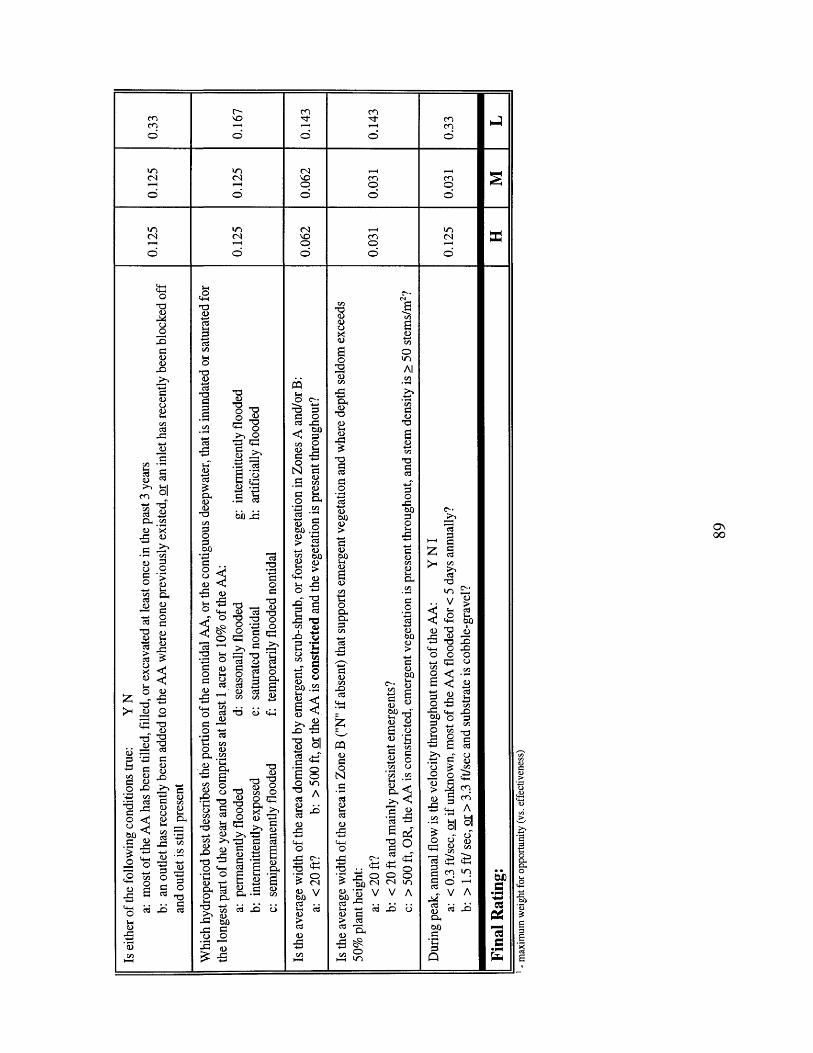
cnif cncncn
CNVOo©
inCN cnO
do o
CNVOod
CNm(N cno
do
T3
1 3
tJO
Ol 13i n
T3T3<3-O
13
2 <
>H U
r v lo
'-S &^ B T 3 1 3ft o _ S °^ O 1 3 oo O :S -O ^ OG6 s o & >>W? “ * O O ^■o & « >, §-4—» 2^ ^ 4 * 3 Cn“ >v3 ci a
<+-1cncn
i 3
CN
CL,b©
OSOO

Tabl
e B5
: VI
MS
Tech
niqu
e - P
roba
bilit
y th
at a
Resp
onse
of
High
(H
), M
oder
ate
(M)
or Lo
w (L
) to
a Fa
ctor
wi
ll Yi
eld
a Fi
nal
Ratin
g of
Hig
h, M
oder
ate
or Lo
w for
N
utri
ent
Rete
ntio
n an
d T
rans
form
atio
n
Os OS
i nOoi noo
cnoocnod
CNmooi no cn cn
os osmooo
ooO o
CNooCN CN
O o o o o
CNCN CN cn
o
cnOcno cn
oo
in
T3J 3 C D
> 3
XSCl,T3
T3 On ^3 *0c/5 D CN S J3 OJ O .tS3 .5? « ^ £a 43.? o
&’S-S> * -a
> ^CN
(U ■*—*
X3 CN
V CNA
CN o ooc ^c? cn
O h
s aoo
O h

Tabl
e B5
.1:
VIM
S Te
chni
que
- Fac
tors
Used
in
Nut
rien
t Re
tent
ion
and
Tran
sfor
mat
ion
Rat
ings
T3
2 bO-5 Js S)fi <4-, S £ "•c ° • - 3 ^
OiA „ A Si «
m
© .S T3 o oo
e ffi
H, M
, L
- Hig
h, M
oder
ate,
Low
-- all
thr
ee i.e
. H/
M/L
Su
pers
crip
t - n
umbe
r of
com
bina
tions
whic
h re
sult
in tha
t fin
al ra
ting

Tabl
e B5
.1 (C
ont):
VI
MS
Tech
niqu
e - F
acto
rs U
sed
in N
utri
ent R
eten
tion
and
Tran
sfor
mat
ion
Rat
ings
WO
bp
co
t>0-a .3 So
CM
X) T3
13 ’aCM
CM ooCM
T3a K o ..
Total
Num
ber
of Co
mbi
natio
ns t
o ob
tain
each
Fina
l Ra
ting:
H
- 32,
M - 4
14,
L - 4
0 (7
%,
85%
, 8%
)

Tabl
e B5
.2:
VIM
S Te
chni
que
- Num
ber
of Hi
gh
(H),
Mod
erat
e (M
) an
d Lo
w (L
) R
espo
nses
to
Each
Fa
ctor
th
at R
esul
ts in
a
Fina
l Ra
ting
of H
igh,
Mod
erat
e or
Low
for
Nut
rien
t Re
tent
ion
and
Tra
nsfo
rmat
ion_
____
____
____
____
____
___
©ViGo©<Vi©P4
©a©3O'a*u
fa
fa
ViI*B
fa
g(N
oocn
oocn
oocn
-1 6 a &3 CO£C5a , o -
s .2>3 G5 £ 1
£ i J^ o 3<U togp C *
■*IJC cda £•s Io ^y «
S3O
•3ao
Gc3eI-hy43
g
£ o 1=1 tS . 2 Oa m
A
s *8 ^« 2 g-S « <Sa * «sy I #6 *6 IdO 3 r "w ur A
s >>V —'in % in
CM O*' O
oCO <D co yy R* § y £<+-! G (3 .SoCM O h <D S3 O O *-i c G° m oo ffi
S32o
Oh
o *S
a aT'O 3 co yS £ h_> ,a> ■a c u2 59 “O h O Uhe o yo -g « c § * S o j
gCN
oocn
oocn
oocn
vo
?n-O
T3
G £>3CM CD
T3
ly£OOS33 ^o m
V
a - j
o oOh -go3 T3
OID O3o
,3 ^cm u n
a tG vo £ <N
cyVGC
rS£
T3CG
Gy
<D00g ^3 mCM
1 A a .. ^ Ky£ts
R. *O h (D o 43 l-i 33Oh O
Ocn
ooCN
cnm
cncn
GcN
CN
ocn
00CN
cnm
cncn
GCN
cnV
oo
G
i #O oo y AO h
•§ ffiy00Gt-Hy><
i ncn
GOCN
OCN
OOCN
T3S3Gy
_GT3y
CNCN
_ A o . .S ffiO«oO hO
Ocn
ooCN
cni n
cncn
GCN
G CMy § 5P i
'to ^
33
g in CN
3 viCMS-HG ^ O
43GCN
I S
4 3 CD y
CM Q
y - 6 'g
y Oh .. b S J 5(32yP<
OG f
NCO
c nOs
toC#©aG• pn
pOE©UCm©fc-©
pDE3Z13■M©HWDGd
13c

Table B6: New Hampshire Method - Weight of Factors in Nutrient Retention____________ and Transformation Ratings___________________________________
Factors Weight
Average slope of watershed above wetland:H: >8% M: 3-8% L: <3% 0.0875
Potential sources of excess sediment in the watershed above the wetland:H: extensive areas of active cropland, construction sites, eroding banks, ditches, etc.M: some areas of active cropland, a few construction sites, and similar areas L: land use in watershed predominantly forested, abandoned farmland or undeveloped
0.0875
Potential sources of excess nutrients in watershed above wetland:H: large areas of active cropland, pastureland, or urban land; many dairies/livestock operations, sewage treatment plants/numerous on-site septic systems within 100' of streamM: watershed contains some/few such areas/operations/plants/systems within 100' of streamL: watershed predominantly forested or otherwise undeveloped
0.125
Effective floodwater storage of wetland 0.05
Wetland location in relation to an intermittent or perennial stream or a lake:H: wetland forms a buffer > 50 ft wide between upland and stream or lake M: buffer 20-50 ft wideL: buffer < 20 ft wide or wetland not bordering a stream or lake
0.05
Dominant wetland class bordering a stream or lake:H: scrub-shrub or dense stands of cattails or phragmites M: forestedL: other types, or wetland does not border a stream or lake
0.05
Areas of impounded open water (including beaver dams):H: wetland contains permanently impounded open water > 5 acres M: 0.5-5 acresL: < 0.5 acres or wetland does not contain open water
0.05
Dominant wetland class:H: floating aquatic plants, emergent (marsh), forested, or scrub/shrub L: bogs
0.25
Wetland hydroperiod:H: wetland contains permanently impounded open water > 5 acres M: 0.5-5 acres, OR > 5 acres of wetland flooded or ponded annually L: above criteria not met (saturated or rarely ponded or flooded)
0.25
Functional Value Index (FVI) 1.0
Total area of wetland (acres) multiplier
Wetland Value Units WVU
H, M, L - 1.0, 0.5, 0.1
94

*oCNo
CNo o
o oo
o
cr
T3
O 53
-j.& 43 O *So ft
43 ^ O T3
0000
o **-<
O h •

TOGo
<D>P
TOa>>gp
TOppG
p-O3i/i
TOa03
d+-><d*sc<Don
Ca>&O
P00
TOpp
43toP
OTO
(1)00o>0)
. g
£o
1343
P■sao
r-"r "o
r -o
ooCNO
£ %■ JJ
on to
03■s
d <uco 3 OJO G‘S i
■s
03-8S
T3
P X ,
£ 30 ? 3_4 c/2 ©
1 8^c5^o^ <D
1 “
■ 3X> O 3 3
c§ "S► feb p C l ,G c •3 o S c
S i
00-s 73 >2— D•g a -
~ !c? “»
« "2 1 • ° g o■3 £? •
I I 103 <0 0C O C3 T O 4 3 T > U - O «
$P
43
G•so
43
cd4 03CO
TOGG
—1 3G
_o
soOO4)>
P>o
•9P
43
00cnoo
VOo
£o3 3(D
00G
&43
CD’G
COO£GC
TOSG
40
TO
a0>oo14
G
PTO
P>o3Oco
TOGP
G<d
TOG
Pg4-iO(3 O•2 513 < o p CU g
to G 43 •"■*
« G '*-* 5h«3 T,£ 5.23 00 V 13 o3is s —2 f l p&i 2 g 4-h 43 G O CD G
.. 43 >? ^co OS O 3
a.a43
P43coP
n 5• S G
POh _22 S3 o P
0) ® C/3 Vhcd o4h t> O h g to Go £
MSG t3° -a cd 1 2
G5 ^• S O
O ^, 2 S3 73 S3 •2 £(D O£ ^3
<u € 1—1 ‘53 £h
CO S _ | )—i <r*
GG - 2O c3
c3 o00 -G o u ,300 >■ 'O 9 4 -h g> o oco co SOS3 2 •2 ’o O1 * G . 9 ^ 8 )to - h r t O 4
S a?M e5>> Vh
-rf S313 3c3 Vh hO
r -i>o
f-~o
ooCNO
TOG
u
PQCO(UGoN_c!-
§SGCDO hO
. . 4-1
^ 0 < <D .. VhO o G G
N ^«+h zn O c3
* C 03
§ I5 13S 1 43 TO 0,3 <D O
2 ^6 a . ao o O (ZO
, <+-HJta .a
t-H 43Z &
O h OP O
a ve - O -(D ‘Z3 • «S -S
^ a3 . « 00 G P
>I? h-> GI s ^S a §CD ^ &^ G O
P£
o nCN
t"-o
<uGO
N_GVh
c3
GPO ho
WN
o43? n
X J
O h
X)CD
TOGGco(D
G43
c3435 "13TOto"GG
GO
'£oO hG
Or“Ho
X)
pG
aG CD
oo iz*-e ^, o 24 -h G
G
PO h
to"a
43
GO h
CO . —iG OCD coe3 TO
^ COCD o ^ & t3 gOO 4 1
> ° (D ^ 1- G^ P
§ S3 8 £
>H -O
P>o0
TOGG
1(D£00
_ c' £
13
^ £ 43 P
G X)* aco CD
GG43S-lG43Gco co t-i " Po S3 S3 S t3 & £ 43 .S 4-i 73 G 3l-lCO Og toM 'H 12 S a -pO
^ 2 ° £C G O
‘g 1ap
^ oLh t-1 0J CD
a c o4h
43 d
VOON

oCN
VO
cno
VOcno
cno
©o
oCN
I"-vo
oCN
VO
<nCN
o
r -o
oo ooCN CNO oo o
p-o
p-oo
oCN
cnooO
P s r v co
n s %,G Gt i .73 ^S S'Sco g - 2 P GG p O^ ^ SZ, O* Pp w oI % £C/3a p oo
4 3 GG° G- . S o 8)^ & 6 ^ 2 - T3 G P p
=3 i«g I 8B o ti O 73 °S3 G *3 cd ‘Bh1 1 s§ 1 §> BT & o 3 * -o< 43 GCD -- G5 * “O 73 2 p pG - 2 3P 3 00GOM 63 2jbb £3.2 'o -cG «« G
1 1 1 G
3 P G .. ■P Pg* So 00
G 43 O „O <H OJ >, G- § cn§3 3)0a ,s ^§ ■§ ^ “ i2 3
G Og P§£
t3pCOpf-HPg
I
oC/3 C/3 00
cd cd
I
s Ico" ,-SP T 3S G •a oG CD
Pg00 o©
■§ ^g rGP GB *8 ■§
^ lm p ^ co ODP >dg
p £Lh 7 3
^ 3S ! S'C PhQh ^P Lh 43 Pf * 8 o 5E ^O
z73 >-l G ^GThP>O
C l,
Z!*o-3Pg00G•GpGPCP£Eptop43
3Oco
§“6•cQhpg£o53”pG§
43CD
43 a 73
I
2 .2
bp &
p ' CP S
73P44
4 3
GPP43
G43
"O8 gc l , .bop " x
g <0G•*+ co« aCD O G •> o p
% ^ cd -»22 8etf §
7 3 (id P Lh13 P 5 43 G ^ PX <p <3s «■rffp O
73P73
12Gpp
4 3
P gS'Sco P § P g S* 5
5 Os I2 g
o
a,G
73PGIE£oo
pGoN
73poo
84 33coOG
zc.u73GG
PQco
oN
Gi
7 3pG4D00PG3
*3
§43POO
££PGOK1G01P00p73p00I3 m*« ecd
ip43
z
GO•d oG o p ^ 00 . . p p
H->GP00LhPp CT\
45 73 p . .cd 7 3 G
VO
O73P
^ ° S3 ^gp cn ooP d
p43
8§
43
p43oo
G-P
I z§ >Ho
. fpoo
^ - G pa s§ 12 ,L h G
<H-H - Jp oPh pH,2 a
UpGON73G °03 cn« 2h
p
O 4 Nc+-iOG °8 G Lh P Phe3
G£O73P Ph
r3 3O P
- SP3 ^CN
§gco gC/3 * Sp o
73 >> P GIt «O 3 £ ^ ” 1 73 p CD C p PE rnco ^
oON

oocnin(N
d
cn mCNd
oo o o o
oo cncn
cncnod
od
odo o
ooCNin
o o o
ClJ HH"O<DX>OO
T3
X>
ft
OOT3CN
T3I
00
T3
T3CL)
T3Oi n
2 <CL,(U OS•fi ^cn
cnT3O
i nO CNa ft
CO "2 «- o
T3
X)CDT»cn
cn
T3
O OOCD i,7 m
TO
CN
O h00
00ON
maxim
um
weig
ht f
or op
portu
nity
(v
s. ef
fect
iven
ess)

IT) OS OS
CO©©COoo
>no©co
Os O s
©
Os OsOS
CNOO©
CNOO©
CNoo»noo
©©
c n©©
CO©
© O CO©d
C O ©©S .2
CO
OT3
O I-J
ooICO
CNi nCN
c »oCN
CN
X ) o , T3 CN o oo
0© TD

Tabl
e B8
.1:
VIM
S Te
chni
que
- Fac
tors
Used
in
Sedi
men
t/Tox
in
Ret
entio
n R
atin
gs
T3 T3
. . <u'ui(SI
J O CN
<SlT3CN
<D ^bp oo
< ffi < ffi

Tabl
e B8
.1 (C
ont):
VI
MS
Tec
hniq
ue - F
acto
rs U
sed
in Se
dim
ent/T
oxin
Re
tent
ion
Rat
ings
CO
CNCN
CN
CN
CN Total
Num
ber
of Co
mbi
natio
ns t
o ob
tain
each
Fina
l Ra
ting:
H
- 32,
M - 4
14,
L - 4
0 (7
%,
85%
, 8%
)

Tabl
e B8
.2:
VIM
S Te
chni
que
- Num
ber
of Hi
gh
(H),
Mod
erat
e (M
) an
d Lo
w (L
) R
espo
nses
to
Each
Fa
ctor
th
at R
esul
ts in
a Fi
nal
Ratin
g of
Hig
h, M
oder
ate
or Lo
w for
Se
dim
ent/T
oxin
R
eten
tion
ocnCN <N cn
oo oo
oo oo m m m
oocn
ooCN
OOCN
OOCN
cnin ocn
oocn
cncn
cncn
CN
CNOOCN C NCN
w>
JS
o1° T3
£> -g cnSP
T3-0 o
« t - l
> ^ r - inE <NooI
cn
• j-H (UU -sc 10 T3(N o
CN
61)o OO <3 T3 &S* |S ^> ffi & s
a ,
ffi S jT3
CNO

Table B9: New Hampshire Method - Weight of Factors in Sediment/ToxinRetention Ratings
Factors Weight
Average slope of watershed:H: >8% M: 3-8% L: <3% 0.1
Potential sources of excess sediment in watershed:H: extensive areas of active cropland, construction sites, eroding road banks, ditches, and similar areasM: some areas of active cropland, a few construction sites, and similar areas L: land use in watershed predominantly forested, abandoned farmland or undeveloped
0.1
Effective floodwater storage of wetlands 0.2
Wetland location in relation to an intermittent or perennial stream or a lake:H: wetland forms a buffer > 50 ft wide between upland and stream or lake M: buffer 20-50 ft wideL: buffer < 20 ft wide or wetland not bordering stream or lake
0.2
Dominant wetland class bordering a stream or lake:H: scrub-shrub or dense stands of cattails or phragmites M: forestedL: other types, or wetland does not border a stream or lake
0.2
Areas of impounded open water (including beaver dams):H: wetland contains permanently impounded open water > 5 acres M: 0.5-5 acresL: < 0.5 acres or wetland does not contain open water
0.2
Functional Value Index (FVI) 1.0
Total area of wetland (acres) multiplier
Wetland Value Units WVU
H, M, L -1 .0 , 0.5, 0.1
103

Tabl
e BI
O:
Wet
land
Ev
alua
tion
Tech
niqu
e - M
axim
um
Poss
ible
W
eigh
t of
Fact
ors
that
can
Con
tribu
te
to a
Fina
l Ra
ting
of
Hi
gh
(H),
Mod
erat
e (M
) or
Low
(L)
for
Aqu
atic
/Fin
fish
Hab
itat
(Pal
ustri
ne
Onl
y)__
____
____
____
____
____
____
XIOf)'3£
3B• pNXei§
cno
cnO©
c«3e«fa
3T3-gGOSgG£
©>0©N1)£31 G a> <u xi©oQ
r -©
t-"VO
voo
i©
G5
cn©
cn©
©
Gcx1C/3
©©mCN■©©
o "O
r -VO
F -VO
VOO
GCTC/3
©©mCN
cj
O h - SG i-h _ gU P *
G£©O
,G'ti3ViVi©OQ
* B"© Ji3G ^
ccS X>
mCN©
mCN
VO©
©G"ti u™ s 3 ‘SC/3 2© g
T3■ S op •S § Sf l U U
G g■g 'g
“ -S -5u c cG . . • •© © T3t>0©
-G
©>o0
1 « 2-ti G .gS5 'Gfa 'SV3 W
? I ^ I ^ &^ CCS * 0
£
T3Grt©£©t>0G:p
G©s/3
u
*0G
'S£©DJDC
IN©
f -VO
VO©
_G"3pOswT3GG
©©H-fG©t>0
©bOa>>©g£o13
. o
G£-G
GO©cGG
uT3GG
OQC/3©GO
N4-Ho
1 s
« £G bp£ $G©Oh©
Vho©bo
T 3©©
■s
e g 'O'G ©+-> GG TOG GG G
"§_G
O c/>n o s
©H-»C/3
TO© G
g GV
_G H—>o
H—> oG S-HG ©‘G
■ g wO <
T3C/3
<• rH ©
1 »+->
pC <4-1» O
Go ©■>*© &C/3G
-*-*C/3QO W)G
3 8‘© D©T3 ■ g
§?"O Cto <D p8 § S S ti 8ccs -a
£3 -5 > *
G
-8 S■a |•o a ,
1 U a
u « I■° g o ■ a & s
a § 8S' I Ii T3 u xi ii
mCN
i ncn
vo©
o|%
©
©Vi
•Gto
GXi
O-G
©X)G
©bO©>
©>o
■8©£ao
©cn

c no©
F~VO
r~-VO
mCN
inCN X0
O 0
mCN©
mCN©
F -VO
F~~VO
inCN
inCN©
cno cno cno voo voo cno VOO
3©
X
Or -cG
X I
too
X©X£
©bJO©>
©X
oF -GGX
1O©X©X£
©b f l©>
©X
ot—GGx
■cI-o©X©X£
GT>G_os©b O©>
C/3 G © © © XC/3 H-J GG G <*>
tiOO hO hGC/3
X Ig I
XG tiOO hO hG
3 a«>ti •§o S& aO .2
©G X I >
§1 o
b o g | b o
©© bO O c/5
0> cd 0 ) cd
bQ G* - g
G O e -8
1313 134-1 ©© XB ~ti ^GG
,2 © Z 3 11 ibo ^ © . . > X
G_o§©b f l©>
c/3 r-| c/33 ^ 3
©G
' g 6G ©
6b g ©O c/3S5 *3 •6 ^ O C X G
cGti©O h
XGG
GX
| -8G via &© n ><U
©
£
©>o©
XGGt©Bbt>
_GXgT>x©©X
G G gG “
O h 2 §g
X © o
G£c/a
3©B<4-1o• c_o" g 1a
GGG
XS-H
X J 2 X X■I £ a 2x .SVnG >'—/ WhW O © „ © C/33 "Oti S3 ti« aW3 O3 -© c/3
• S O h
?■ 0 (m ©© © s *B O■ —H )_
G X ©
GG
g
gG
3©x
Gt iG
XbO_G-a
. 2 GG
aoQ
&
§aG©
_>'c/3GaX©©oG_o
'h—»G3. &-aG
G'©
©GX
©G£
g
GO
cdg©G
t i©
XX©C/3GG
G
G©
3©<F- 'Bg afi X
'o 2 t i ^ S3 o © G■S G 2
©©
X © X
■M £
3 £300 CCSe» ^
x©X
XG©©
X
GX
«3 S© Ga i
cn
i 2Oh &2© 'x
g ©
■—1
GX
I>G©X©S-H
> H g
XJH © x
G©©Xc/acd
<c
©xX©XXGG©©
X
G Ot i X ^ xu_|o X
Ge 2G c/3© © <-> b! © O h
©X
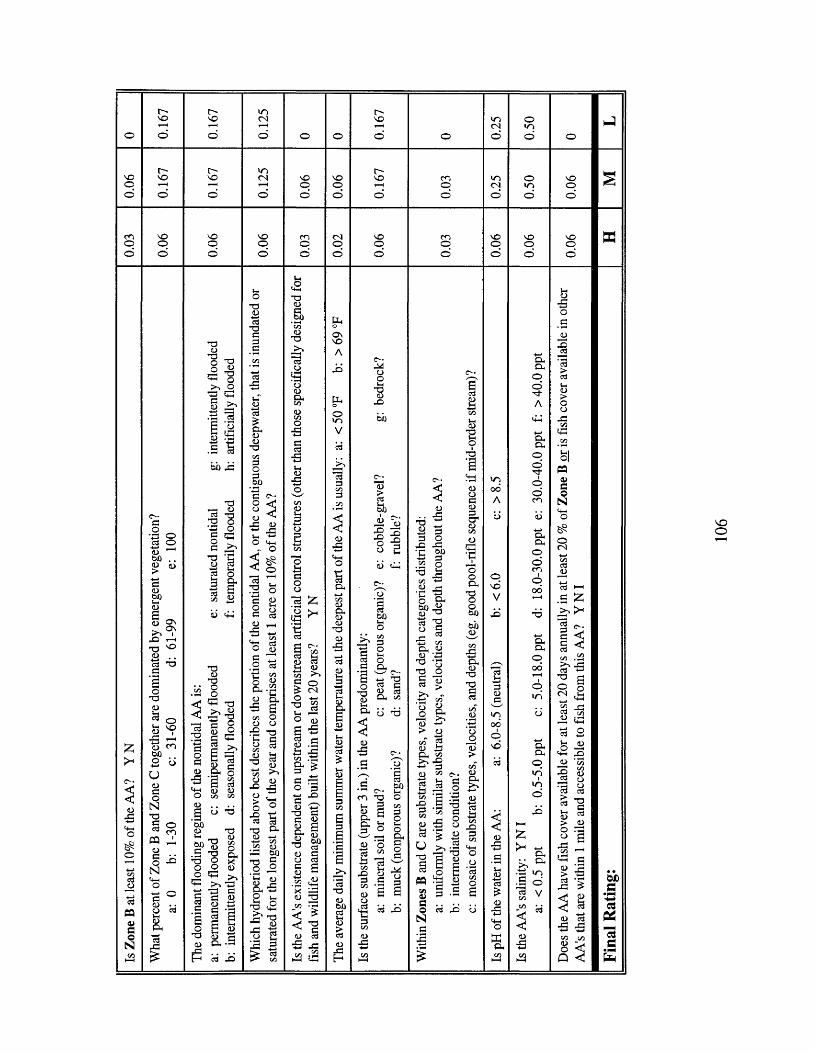
om<n<No o o o
m<Nvooo
VOo cn vooinoo o
VOo©VOo©
cSo
T3
T3
O«n
T3
b O
cnT3<U"O crT3 T3
ocniOooVO
60
T3<UT3OO
JQ60
xsT3
T3

Tabl
e B
ll:
VIM
S Te
chni
que
- Pro
babi
lity
that
a R
espo
nse
of Hi
gh
(H),
Mod
erat
e (M
) or
Low
(L)
to a
Fact
or
will
Yield
a
Fi
nal
Ratin
g of
Hig
h, M
oder
ate
or Lo
w for
A
quat
ic/F
infis
h H
abita
t
m00 cn00
cnooO Oo.
cnoo cnooo
o oo
oo
<N<N OOOoo
o o
ooo o
oo oo
cn
T3<DT3
T3<u x:
W>
T3
T3 CL,

Tabl
e B
ll.l:
VI
MS
Tech
niqu
e - F
acto
rs U
sed
in A
quat
ic/F
infis
h H
abita
t R
atin
gs
jaco
T3oT3 JoX >
T3<UT3
JD
CL, > v
a 'oT 3
T3<D"OT3
o <D T3cr £2
.. T3K S J I
Total
Num
ber
of Co
mbi
natio
ns t
o ob
tain
each
Fi
nal
Ratin
g:
H - 4
, M - 8
, L - 6
0 (6
%,
11%
, 83
%)

Tabl
e B1
1.2:
VI
MS
Tech
niqu
e - N
umbe
r of
High
(H
), M
oder
ate
(M)
and
Low
(L)
Res
pons
es t
o Ea
ch
Fact
or
that
Res
ults
in a
Fi
nal
Ratin
g of
Hig
h, M
oder
ate
or Lo
w for
A
quat
ic/F
infis
h H
abita
t R
atin
gs__
____
____
____
____
____
____
____
_
Via>VIeoa.Via>
o
c<a>3O'0>
Cflt-OW
En
VOc n
CM
A lT3
CUT DOO«+3d<UdCCJ<uo<
<D&H
v oC O
- c fCM
■22 ">
CM
CM
CM
CU(—i t h
S O<u JS;CO o
~ C/3C/3 C/3
s ' !-o oI ^S "3 d 3d . 2
1 C/3C/3* da) o d o
a ssco~ £3
1 « ^ e§ I0 2sp « £CO
I 1-1 |.S 650
oo1) "T3
- O <U
!S « S §
I I Oh
£ O d d
£ 2
0 d
1H->3X3
<u
CO
'E 3§ 8 o«3 p >ccj Od ^2 03S2 73 . d <u
o<u co3 3
r , <oh-h h-jc3 O-B ■B+ - i CO3 CUU lH
S o ' ^
* a S3 3 >O co
3 .22d<D -dco CO <U
O 3' O o2 2
4 )C/3cd £
’T-J O 3 C/32 oM H
<+h Tn• s *O d S cb 03 —i so cr0) S3-a dH OJ3 -c03l-H *tHCD O& O« 5CU O
d- d
bJQ
aj c3£ sd t3i lx: oO £
Si' t+i d o2 (U V co.-d 3"33
00 to2 aOh 5n’d ^
d d c3 d o q3
C+H «3 *b 0 (u
2 J3S3 3cd CUCu COT3a CO
iuis 3tn CO ' 5
2 OCO(U CO03>CU 3 CUCO C71CO!-lO i-H 3H—>d 3gS Oo£ £ a3o c3£
dCUb O
Xo
oCM
oCM
oCM
CM
CM
oc n
Ocn
o, o<+Hcnd"Ja
o3
1T3
(Ub O
o
X 3 £ 3 OCO CJH^ I *O d<UO d
, d d*tt B2 5
C4-I &o<5 .3h
ovo
oo
aT f
OnO
t o P
«D C »—< cdcd o
3 c nOh v S *-!cuCU >
O<->-2 3d
<u>oU
VC#o033• ph*
p3aoU
udi- D
a3Z3oHbiDc• PN
OS
a"cS3

Table B12a: New Hampshire Method - Weight of Factors in Aquatic/Finfish ____________ Habitat Ratings for Streams and Rivers_____________________
Factors Weight
Dominant land use in watershed: H: woodland, wetland or abandoned farmlandM: active farmland or rural residential L: urban and heavily developed suburban areas
0.125
Water quality of the watercourse associated with the wetland:H: minimal pollution; actual water quality meets or exceeds Class A or B standardsM: moderate pollution; actual water quality is below Class B standards
0.125
Barriers to anadromous fish ([beaver] dams, water falls, road crossings, etc.):H: no barrier(s), or if present equipped with provisions for fish passage, OR waterbody is beyond range of anadromous fishL: artificial barrier(s) without provision for fish passage, AND river/stream is within range of anadromous fish
0.125
Stream width (bank to bank): H: > 50 ft M: 2-50 ft L: < 2 ft 0.125
Available shade:H: woodland, scrubland or other tall vegetation provides > 50% cover (shade) to streamM: portions of stream bank unvegetated, OR vegetation too low (< 6') (25- 50% cover)L: major portions of stream bank veg. < 6', OR unvegetated (< 25% cover)
0.125
Physical character of stream channel associated with wetland:H: stream in natural channel, either a meandering low grade (< 0.2%) stream, OR moderate to high (0.2% or higher) gradient stream with pools + riffles M: portions of stream recently modified, OR stream formerly channelized but has regained some natural channel features (meandering, regrowth of instream vegetation, addition of cover objects)L: stream has recently been channelized, OR stream is confined in a nonvegetated chute or pipe
0.125
Abundance of cover objects:H: > 70% of water area contains cover objects (logs, undercut banks, submerged vegetation)M: 30-70% of water area contains cover objects L: < 30% of water area contains cover objects
0.125
Spawning areas:H: low gradient, slow moving stream with abundant areas of grass and low emergent vegetation which are flooded for several weeks in spring, OR a medium/high gradient stream with gravel M: moderate amount of spawning areas present L: few spawning areas present
0.125
Functional Value Index (FVI) 1.0
Area of stream or river associated with wetland (acres) multiplier
Wetland Value Units WVUH, M, L -1 .0 , 0.5, 0.1
110
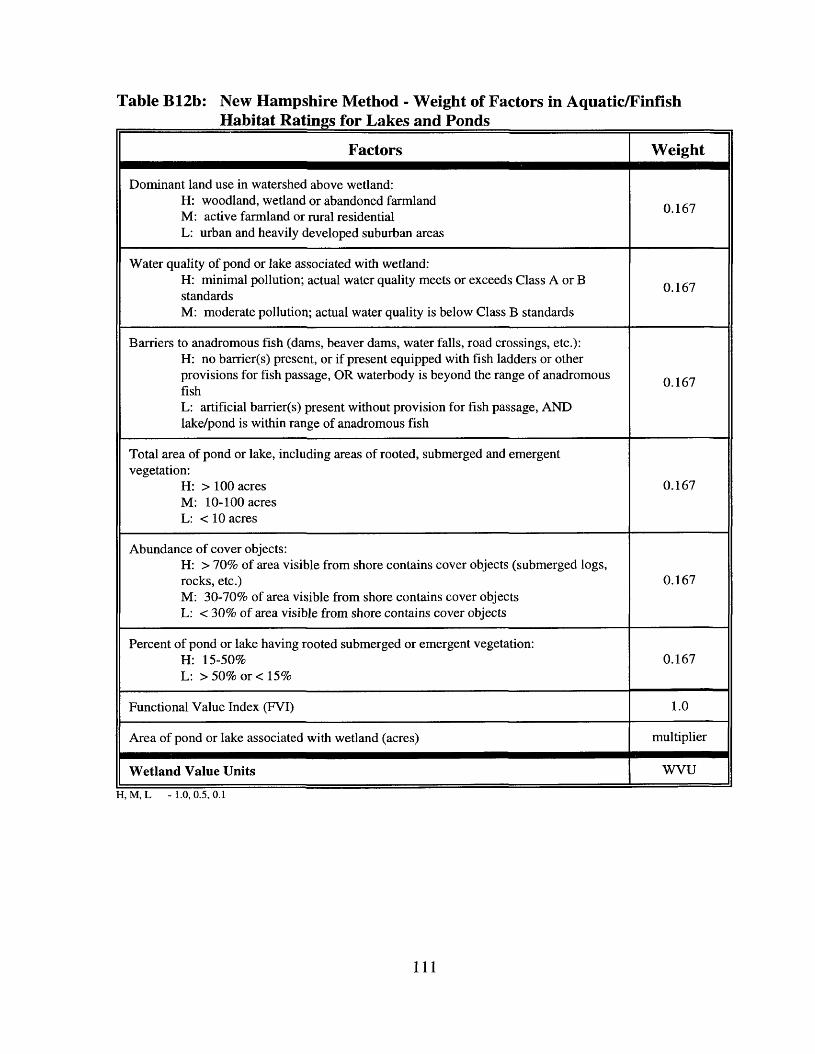
Table B12b: New Hampshire Method - Weight of Factors in Aquatic/FinfishHabitat Ratings for Lakes and Ponds
Factors Weight
Dominant land use in watershed above wetland:H: woodland, wetland or abandoned farmland M: active farmland or rural residential L: urban and heavily developed suburban areas
0.167
Water quality of pond or lake associated with wetland:H: minimal pollution; actual water quality meets or exceeds Class A or B standardsM: moderate pollution; actual water quality is below Class B standards
0.167
Barriers to anadromous fish (dams, beaver dams, water falls, road crossings, etc.):H: no barrier(s) present, or if present equipped with fish ladders or other provisions for fish passage, OR waterbody is beyond the range of anadromous fishL: artificial barrier(s) present without provision for fish passage, AND lake/pond is within range of anadromous fish
0.167
Total area of pond or lake, including areas of rooted, submerged and emergent vegetation:
H: >100 acres M: 10-100 acres L: < 10 acres
0.167
Abundance of cover objects:H: > 70% of area visible from shore contains cover objects (submerged logs, rocks, etc.)M: 30-70% of area visible from shore contains cover objects L: < 30% of area visible from shore contains cover objects
0.167
Percent of pond or lake having rooted submerged or emergent vegetation: H: 15-50%L: > 50% or < 15%
0.167
Functional Value Index (FVI) 1.0
Area of pond or lake associated with wetland (acres) multiplier
W etland Value Units WVU
H, M, L -1 .0 , 0.5, 0.1
111

Tabl
e B1
3:
Wet
land
Ev
alua
tion
Tech
niqu
e - C
umul
ativ
e W
eight
of
Fact
ors
that
Con
trib
utes
to
a Fi
nal
Ratin
g of
High
(H
),
Mod
erat
e (M
) or
Low
(L)
for
Wild
life
Hab
itat
(Pal
ustr
ine
Onl
y)__
____
____
____
____
____
____
____
____
____
__ J3.SP*33£
<D
3Es
V
CAuscs
fa
oocn©
ooCMcn©
o
&S3CD
tiX
Xti
tiX’ti
OoCD0 Xo |
X
1tacti£oXtio
‘So2
X £ p ^
CD r Xco• r t » •ti .S3. ■ t i C /3 C l t i
•“ X)a _2 *3p «X ti
XPti Oh
3 Xp P j* CD *3 OVi ^ LH CD
cncn
.1?c’ti
C /3
ati
ptio
XQJ!/3ti
X
atia
oa00ti■gX
ti
CtiX .
p C /3„ W > O tiS'St ) c/3
t2 4-1 * ° P D > CDo c<11 © P C/3 ©P LhP CL
4=1 t3
3fP N
X 60
3 xD XCD£ 2 d X XC/3P ^© o Q X
cno
oocn©
X X cnin in l—Ccn cn cn© © ©
3D
ti‘.g£
XC/3
o•4—*
X"S3VippDtiCD ^o 2 «» 2’O ”
S o ti o£
^ P P
X
8 «> y ^t i CD ^ «» c ot i 'Cf
*§ A ti . . X
A
Dti tiS3 mti vDCDeg tigPx
IT)("■
oocno
o
V
3pBfio
X? nCd£ti
O h3Xtiti3D6ti5'$tiIXp
pX
Xcn
OCM
tiOxBp00p>
Xp
X3
J3ViIX2o
CMAtiop00p>tip00papD 00 _P
cdO6
a o- c .53P GO D•4—*
-!2 ‘c3=:0) P eg to£ 5O y
C/3 -T3 0>S3 BSn — ,O S O S3 O X
a
mCM
oo
©
cn©
cncnVtioD00P>
Xp
X2p
oVtiop00p
h—>tip00papp00tip
pb.52 ^
Lh*' > < p
p .g™ p
xpJl :a+-* C/3
O oVi -X pS3 5o S o -3 o ,p
3
sx
©cn
xooCM
©o
tiL-loLhP>*Gti
P
opx
pti"tix
inti
<<p
oor-
oo
©
cn
CM©
©in
oo©©
r~©©
C.
3px
ti X’ co X
.L h « ©t i P PP t i c
s 'g 'sp G G ti .. p P XVh00p
X
l e ,S^'S BVi Vi S 3
p 1 3ClXC ti ti03 ti X
Xp
X£
CN

P
X> -3t i p
a <bXti p o ^ 2 o
a &s §p >
k b x
P 'l->>P
Xp > t i p
Xpp3
ti op
_ c
X t i tiupVi * 2
« t i
p £
B G3 pco Q .
T 3 O t i (LHt i o
O ' p P 0 0
X p
X ©ti _ti p X OO?T5
a ©8 g
* © - ap c
D X
P
OOi n
©
©cn
xooCM
V* h \ X ' t o P X ^ P
ti 035 x
+-* t i© ati c c • - 1
pti
_ o
sP X00 ti P o > X p
p- g
ao
• -H XX © ti ti”5 g o oP o
X Lhp
- p 50 •ti w
| 3
s .2
cd JB• fa ^ = 3
■ 8
J3CLo&
-O
W ) O h € O• ti o
• a sM - t i
• a § * 2 & S * 2
• ° x &
& * %o a> X• in h n - 4
tiOP
P Qp3O
Nc
tio
tiX
pc
8X
p
&$3
#o’ KLhpO h50LhP
ti_ o
HP00p>00tit ioXC Lti
X o 5« o cd <o c. . <o . . a> • ■ — • •ed T 3 JO t 3 o T 3 CD
8 :s1 3 8 ^C/3 X X
t " -Nr -
o oON
cn©
tiC L
3Co
oXp
X
coPO
Q
p3O
C '- 1 ?
3O
3ti
GXp>X t i n
t i Lh Xp O CO
O ' 0 0 COP p
> 1 3 t iX
3t i
4-hO
33t i
fa3CO
t i coP
Xp CO
C X T3PP
£
pH->t iX
c/T
" oo
Gcd
PX ’ t i
XX
O
,— ^ a tLH
G _ t i CO '$d>C/5 X X
J D p 1 3 p ocd t i _ > CO
Lh00
f a3
B_c a
PXCO
8
X
Xt i 3O
Vfao
H->C 8
ppp, t i
t it i
' X
X3op
’ cdCOO
a
“s '_ o
3
Lh
£
1— 1COLh
ti ti po o £
oX u
p> >4
©
©
©CM
ti_ osp0 0p>0 0ti
p’ t ico Oati
_ c
Xg x ti ’ti§ t i C L
X ©
t i ^ P * tt 0 0 Lh Pap
£ ^ X_ s" t i
p OX i 2
Xo p
■ pXp
&X
CMt it i
X
r—4 Mh/<c .a a
o CO _ h Ga ©O P
% s
x N
c .a1 3 3 c o
cdaCO
pt iO co
v© t i
C «
P 3. . p C L 0 0 co © t i >
. © CO
. 3 © x 2 © X© ap B2 P ‘ co© I— I
1 s : § §
3 * 8p a
B - s
* S *
p
• 5
tiP3p
X'%t iLhP>o* JtioCO
XtiPLhXco3P
X«->X3tiP33ti
XPti
_3
<<P,g <
COLhP P
3P 3
© t i CO 50ti *-> —H CP P00 cp a > t i
4 - iO t iCOp X
X o p o3 © < x x
" t i ^ ^a xCO p S , CO►O f a
. 2 & t i 4h3 p 13 c
3 pp oL h P > P t i © Sr
© X
* 2O p X 3
© § & 0 J -
p P 4 - h
§ ELh r P w
Xt i • -<
=> £
X
t " -Nr-
ooO n
cn©
p
3t ipp
£p
Xt io
pXco
13H—»c
‘t i ©© t i
3 L hco O
’ co P
§ § P — H
t i.a i3-X ti £ .2p tiX tia o o& ti 00 > Lh ^ P pa ibP g
1/5g ti25 oo
cti, © X
. o0 0 X P X
w t i co co P co
1 ti-b a
© 3 .2 5X ti ra cp p 00p o
£ s ^ © © X G falM <D
iX cd3 a3 O N•cO
X p
ti
a a ©■ti •** p co C - g p O . t i© ’© ^ t i X X *t i 1 2 xti S oo M O ' d o © xg ti tio . .
X X p

r "©■
mCM
o oNO
CMNCM
O
o o©©
©
CO©
oCM
omo
ONt > OO>—i ©© ©
i nCM©
CO©
c~~CM
m
©
r --©
NO©©
CO©
CO©CM
r -©
CO H—>ti ti
X3
3T x3
3PPti¥o3
3 t i bO ° p cob a
i s© — B §
x 3
8 ax© acd g X to
s i3 p p x p X£ 4=1P -
X ©
I ' z33 ^ O
X P
X
X3
OXULho
P3COp3O
N_ cLhgti£3PXO4-HopLhPti
0 LO
1 33 Nh
x aX p
B a
S 3X H-.
I IP PCO X •-H 4-H
- r f ©< j COco
= Pw - Lh P
£ n>* k b x
X §
I 2S 3 " «X p , PbJ) bO 4- hpH P Lh© > P£o
=5ti £a s §p X 1 g *£ ti O
4=1 t i X
px
o
P3p3O
N_ 3fa3cd
3PXo4-ho
X
3tiXp
X
3g' p
4-H3
3p
■ ao
Xpc oOX
8 © >—i co
© PQCM <u
p X N
xti
! >
>* p
pbO
XP
X&
3 ti 2 £ 3 ©
b ' Op X
OG H->
Lhba O3 3
'$ gg
sO pX bOp P
X >H->4-ho tiLhP
XH->' P
CO1— (
bfi X I3 X31 (Q
X &
* 3E I
cH 3 4 -H H—>
U Pbt)
p s>3 > O . .
N x
HQX
mp3O
N
©oo
pXtiX
P. g
X33O3
x3ti4-i ^2 C"p <| |I Io > © _
2 § 8 g^ •© X p§ ° a ©p co
g P< Lh
2 c SP Ci_ bO X P - > ©a wP LH
‘p ©x a
2p
- S
3 Pa pCO , t i c o H -h 3 H ti
XX3ti
33PLhPX
x "3
g
cd-G
CO . f acd O0 } CO
T 3 c o<Ucd
i f
£ & >H -O
P>op
Xsti
bo . 3 Xg * PX
i - e
o x
i , X p 1)b o a , §> *8
p
. S3ti Lh P P © X p X Lh O . . Lh P O
aa3
X3t o CO
Lh tO S3G ^ 3 ©
-© . 2Lh X3 >
t i X5= 3
p2 COt i x «g S3 ti -a
> oJ*H fao> o
£ o
xa
g' t i 1ap
;5
t i X P
3ti■ g
PH-Hti
ipx
gti£pp.31
X3ti
3 —Hp . 3Lh Ha 553 -a-S3 i §
o la ©
ti "2B §ti u
§ 38 a
CO O fa >2 o © x£ h ^
p
X £
s *3 t3
' t i
a §© '3 o 3 p t i
- © co G ti O P P
3O
laNti
XL-h0 coH—»3
1P
Xgti
ti3c rti
T G p bO
3 ti —i X2 CO3 ap o ti •© Lh 3O X
a 8
• © 8bOp +2
w 3 co ti3 . 23 3© aa3 O P Pao
ap ed
4-h _o x p ' C
^ §p ox °> tio xpLh P P P
■© a+-> =3co O
P g .t o 3 P X CL _ 3
p inbO ^ t i cd© P > P Lhco op
1 S’! jS J -to
LH PP ^2 H , t i x
I ^3 cd 5* Xb o n.a p
•3 ««p ^
X ^ Xa ©ti o
X © 3( j <1)
2 & fa ^ co
I 13!f 6 |p p t iCO CO L—I

O n
ONO
4—Hi n i nCM CM© ©
i nCM
oCO©
©od
ONONo
©o
om
CO<N
COoCM
CO CO
CO CO© ©
00NOCM
NO©©
COCO NO
©©
OOCOCO©
oXp
Xo
gx3pp
X
cdX
2OD t i^ Jnl
CO© X ti 53 X .eg p ' x
&c
pp3o
p
*co3O
’>P
52 ©
I a© ot i c X Q P 3© P3 (—i> xti p X p t
px
P 3 3
tiXX
l m> L-> L->n 4 h P Q n S
XP
XXti3PP
X
3a gp p
t i X
X
pX
> . _ X X 3 P
x4-h
. a v~>
Z Ato OlJ .£*B -I . a 8. 2 3X 3 P 3> §
X X2 4-h2 oo' 45
X p ° 2 Lh J hO X
• o 3fa <uI ^ « I
■ © ^8 8 a , o
f-H
5 VP X4-_> i-X
3O
X3OPbO3
' $O
PX
xl
LL h—> P P P 3
*© 3X 2CO © V X
£ * OC/5 C/50 Pa 2-S3 a<! Id< aP 3
- S P3 &a a a s3 X^ X
1 83 V4 5 X
3tit i X
©©
PbOP> ON© o\3 i P r —Hb p no
P . .a ^pS o
XXpaa © a8 3p . .S3 °LhP
gPbOg
u © g ^o ^
N ~ x3ti
PQp3O
N
3P • •p t i Lh P Xfacd
pG
£
bO X
XP
XOO
X
”t i3O
tiX
3O3
Xr -H P
1 ■§© X § % o c3
oI *p
tiX
3pB X
Xp
X<faQ X p
45oo
0)P
X oX d
a oo X
pS o
Xb b2
d S o 3Pc
b o. 3 a
p
3g
t i
X 3 • © po t i a . ©o Lh
d Pg a
H—* .3 p3 X 4 5t i3 ti X P
oXp
Xpti
T3333
tiX
pcd£XPP
X4 53O3b£)
3OPP
X
i13x3O3P
X
tip
px* 6
4 5P
X
PXp>o
XtiXp
Xo
a *op
X3tiaPSoPB
xpbJ)3
g
PXX2 4hX oX V|_|
X ■©H h hh
$
Xp3bO
'c /5P
X
tiP
d‘p
pxViP45OB3ti
Xpx
mLho3ti
3O
XbO3O
LL c/5 P
3 LhO ©P § bfl . 2P © > 3H-. P eo bO2 a
• 2 S
S 5
J-© 3tiX
C/5 o>' - 3
3 * -© i SP4 5 2 2
, 3© © © ppbfi .22
S3p ^
X X X 4h|
©oi n0
Xti1p
X
a > --Q 4-h
■> °> CMP V bO v t i . -S3 «*> tipx
pB
pB
.22 o
ti x
oXpLhX
i
3 (jjX ] Xa ‘ct i i pr- 173 3 cu.2 x "oa ©p -2 P -HS> X
3ti ml S3s £?£3 8 3a § b
' o ' o P 45 “3 p
in in
a
3 3 p g
. 3' t iH—>30 P
1
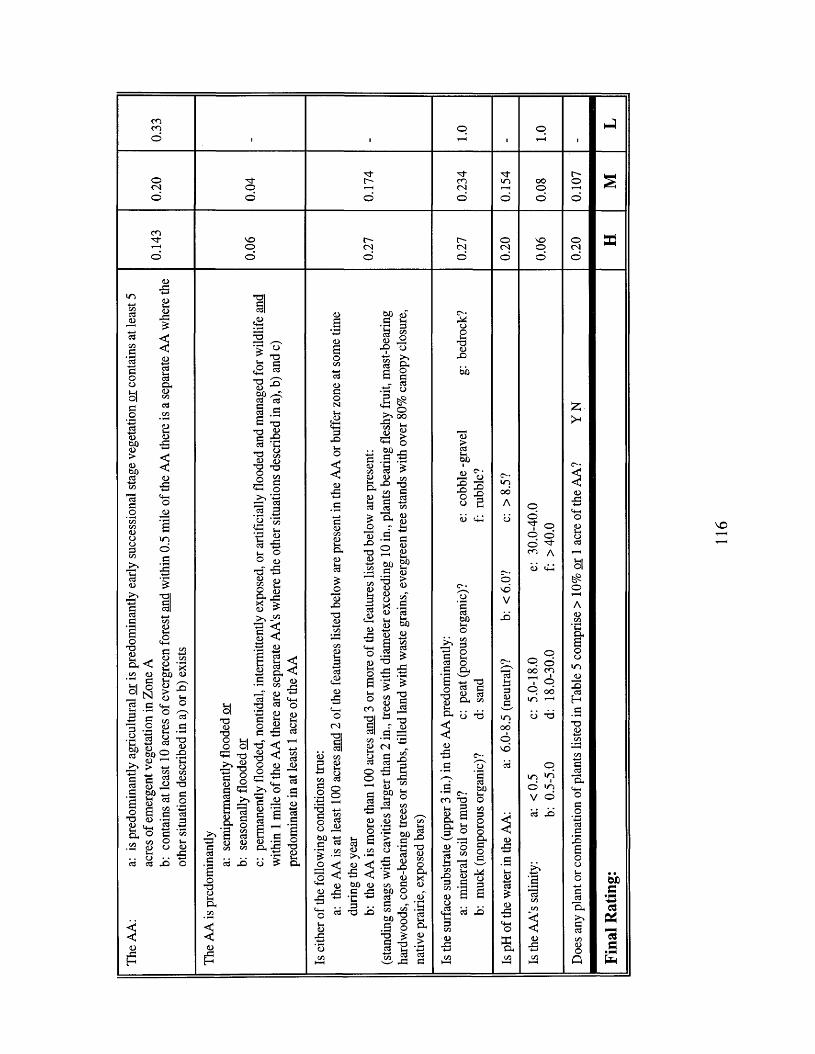
COC O
o
ooCNo
CO
CN cs CNo
T3
T 3CDbO
£r* °°
bO
O Oo60
T3
T3I
9-
&< 2 'BCL,b.0 T3-O
T3O T3T3T3
(NO
un »n © v> V o
oo bobo
.& o
So •Oh
T3

Tabl
e B1
4:
VIM
S Te
chni
que
- Pro
babi
lity
that
a Re
spon
se
of Hi
gh
(H),
Mod
erat
e (M
) or
Low
(L)
to a
Fact
or
will
Yield
a
Fina
l Ra
ting
of H
igh,
Mod
erat
e or
Low
for
Wild
life
Ha
bit
at
____
___
ON O n ON
O ■ o
ON O n O nOOOO
d
>n
xt-d o
NOCO
d
T3
I «T3 "O
T3
& (N <NlO
ooCO
T3
2 -a £* 23 £*
T3b f l O
Oh
T3

ViS3.©
CSS32a©
U&JDS3
■*«»ee
<Zi<3C
. g*<w
£cd
•pn• Scd
a
SH
£S3• PN
©tz>
p->V)X©-+-*©Cd
fcl■
©©
*3JC3©©
Hc /i
ViUaCd
fa
CQ
2©
H
x
S •d
X
nOP
CDX
CdX !
OOCOp2
2S • • o2 G m •<—» o u .SS . .* 2 SbO P1 “ c I p 2O H2 3 ^ p 2 o00 « Os c -2 Ap <D
^ tf5 H H
'S * o £4—» f ag aP Xa o
X o
Ou~>V
oON
55 S
53 S
ed> .
XnO2oPpPOP
nOCcdP£
nO *“C« Xcd ^2 °<D O > +■' O c/5 CO E?p P « .5Pp
CO Ped <u
§ 1 II | |P "P >• bo P p p 3 no ^ c/T v-c2 g »3 *-• 13a a* a. 3 "p ^” D X O ^ ’PCD S
T3 O nO•2 3 c•p 3P >N O ° P3 H £ 2 o X Mcd co
X“ *§ co G OD ed O *3CD P
b . . *S 2 j
CO
2DOwt-io
no
(Dopcd
X)
nOXo2>
pCD>
noPoS
S <d
S d
(D
i sI'-i4- 4-©
I icd «
Pbo
3£
CD_Pt o
no cd P P 3 P n~n cs <D -G
3. . c/)ffi 2
2.2‘ 5
12 p
CDJO
bOP
I(Xpp
no(D
X
no
2bO
2noPcd
t j
h-I no
PXp
p2oX
CD>
2pCD>
‘bOX
Sd
S e3
S 1=3
S
X
no a)§ - s
P3 oo *->^ CD CO<D O
2 2 S ao 3
edB 2 « >n
S-! P3 -p
2 73 3 S4-© OC/D ^
’ >< 2 (D 3O >nC XO - '
-p 2 'CO CO ■4“ •P X X PG co
nop x< J2 .. p *-> "X p 2 P^ s p
CS (—<
t st s2 cu X Bo
,J-< COX ed
PXp
p — o
* ^ O CDX '+-'
w S
X2>s _P noP Pa 2. . CD
hJ ^
S eJ
s <=a
o3 x .2 o 3‘o o
po
§pbop
pX
.a pd j l s
X P cs ^ 3 X G C4 oa
Z & Bcd x Xs * I
1 ^ ^ & K
_r O CO
CN
PPO
Jh*12op
3
’S MP +0 > p
*o ^ o . .X K3po
’bbpC2
x.o pCO c
P P§ « ^ a*-• iS
pp pr* 5x
3 o ’> no<u3 s p .2 3k p p px 2
| iX v-(
^ P.P P ^ P cd o
B ^ o ox (DS 2
£ j
OJDX
tC©
a
2©•pm
t x
oo

Tabl
e B1
4.1
(Con
t):
VIM
S Te
chni
que
- Fac
tors
Us
ed
in W
ildlif
e H
abita
t R
atin
gs mfi'Oad3So
Uwod»pN
73X
(H2
X
<N m in WD73 *j3 .S *fa IX
inb£
(N cn
Total
Num
ber
of Co
mbi
natio
ns t
o ob
tain
each
Fi
nal
Ratin
g:
H - 9
9, M
-111
, L
- 33
(41%
, 46
%,
13%
)

Tabl
e B1
4.2:
VI
MS
Tech
niqu
e - N
umbe
r of
High
(H
), M
oder
ate
(M)
and
Low
(L)
Res
pons
es t
hat
Resu
lts i
n a
Fina
l Ra
ting
of
Hig
h, M
oder
ate
or Lo
w for
W
ildlif
e H
ab
ita
t__
____
____
____
____
____
____
____
____
____
____
____
____
_ O n ON coco
o
ONCO
COCO
COCO
COCO
<4-1 CO
COCO
COCO
COC O
COCO
ONCO
ONCO
ONCO
ONCO ON
O nCO OS
OS
oo
co m c CO
£ .S
JD
CO T3
OON T3
00T3
X J T3O on 2 O . <4-1■s . .

Table B15: New Hampshire Method - Weight of Factors in Wildlife Habitat____________ Ratings___________________________________________________
Factors Weight
Percent of wetland having very poorly drained soils or Hydric A soils and/or open water: H: >50% M: 25-50% L: <25% 0.0083
Dominant land use zoning of WETLAND: H: agriculture, forestry/open spaceM: rural residential L: industrial, dense residential
0.0083
Ratio of number of occupied buildings within 500 ft of wetland edge to total area of wetland (acres): H: <0.10 M: 0.10-0.50 L: >0.50 0.0083
Percent of original wetland filled:H: < 10% M: 10-50% L: > 50%
0.0083
Percent of wetland edge bordered by a buffer of woodland or idle land at least 500 ft in width: H: >80% M: 20-80% L: <20%
0.0083
Level of human activity WITHIN WETLAND (litter, bike trails, roads, residences) H: low level - few trails in use and/or sparse litter M: moderate level - some used trails, roads, etc.L: high level - many trails, roads, etc. within wetland
0.0083
Level of human activity WITHIN UPLAND within 500 ft of the wetland edge as evidenced by litter, bike trails, roads, residences, etc.
H: low level - few trails in use and/or sparse litter M: moderate level - some trails, scattered residences, etc.L: high level - many trails, roads, etc. within upland
0.0083
Percent of wetland plant community presently being altered by mowing, grazing, farming, or other activity. (Include areas now dominated by phragmites or purple loosestrife).
H: < 10% M: 10-50% L: > 50%
0.0083
Percent of wetland being drained for agriculture or other purposes: H: < 10% M: 10-50% L: > 50%
0.0083
Public roads and/or railroad crossings per 500 ft: H: 0 M: 1 L: > 2 0.0083
Long-term stability:H: wetland appears to be naturally occurring, not impounded by dam/dike M: wetland appears to be somewhat dependent on artificial diking by dam, road, fill, etc.
0.0083
Area of shallow permanent open water (< 6' deep) including streams in or adjacent to wetland:
H: > 3 acres M: 0.5-3 acres L: < 0.5 acre0.1
Water quality of the watercourse, pond or lake associated with the wetland: H: minimal pollution; water quality > Class A or B standards M: moderate pollution; water quality is below Class B standards
0.1083
121

Wetland diversity: H: 3 or more wetland classesM: 2 wetland classes L: one wetland class
0.1
Dominant wetland class: H: emergent marsh and/or shallow open waterM: forested and/or scrub-shrub wetland L: scrub-shrub saturated (bog) or wet meadow
0.1
Interspersion of vegetation classes and/or open water:H: at least 2 wetland classes highly interspersed; areas of each class scattered within wetland like a patchwork quilt M: moderate interspersion of wetland classesL: low degree of interspersion; each wetland class is more or less contiguous and separate from the other classes
0.1
Wetland juxtaposition:H: wetland connected to other wetlands within 1 mile radius by perennial stream/lakeM: wetland connected to other wetlands within 1-3 mile radius by perennial stream/lake, OR other unconnected wetlands exist within 1 mile radius L: wetland not hydrologically connected to other wetlands within 3 miles and no other unconnected wetlands within 1 mile
0.1
Islands/inclusions of upland within wetland: H: > 2 M: 1 L: 0 0.1
Wildlife access to other wetlands (overland). Travel lanes should be 50-100 feet wide: H: free access along well vegetated stream corridor, woodland/lakeshore M: access partially blocked by roads, urban areas or other obstructions L: access blocked by roads, urban areas or other obstructions
0.1
Percent of wetland edge bordered by upland wildlife habitat (woodland, farmland) at least 500 ft in width: H: > 40% M: 10-40% L: < 10%
0.1
Functional Value Index (FVI) 1.0
Total area of wetland (acres) multiplier
Wetland Value Units wvuH, M, L - 1.0, 0.5, 0.1
122
APPENDIX C: COMPARATIVE RANKING OF FACTORS

Tabl
e C
l: Fl
oodf
low
Alte
ratio
n -
Fact
ors
Used
by
each
M
etho
d to
Eval
uate
the
Fu
nctio
n an
d th
eir
Rank
ing
from
Mos
t In
fluen
tial
(1) t
o Le
ast
Infl
uent
ial(5
) in
Det
erm
inin
g a
Fina
l Ra
ting
of Hi
gh
(H),
Mod
erat
e (M
) or
Low
(L)
04 04
04 04 04 CN 04 (N
04 0404 0404
04 04
04 04
04
CO0404
t3
oo
ON04 ooco
() - u
sed
in op
portu
nity
ev
aluat
ion
(vs.
effe
ctiv
enes
s)

Tabl
e C2
: Nu
trien
t Re
tent
ion
and
Tran
sform
atio
n - F
acto
rs U
sed
by eac
h M
ethod
to
Eval
uate
the
Fu
nctio
n an
d th
eir
Ran
king
fro
m M
ost
Influ
entia
l (1)
to
Leas
t In
fluen
tial
(5) i
n D
eter
min
ing
a Fi
nal
Ratin
g of
High
(H
), M
oder
ate
(M)
or L
ow CO
CO CO COCO c o
CO CO co
co coCO
CO c o
COCO CO coco
J S
£T3
T3
U)T3 T3
T3
T3
T3r* ‘S
■a -p5 S
CO oo
() - u
sed
in op
port
unity
ev
alua
tion
(vs.
effe
ctiv
enes
s)

Tabl
e C3
: Se
dim
ent/T
oxin
Re
tentio
n - F
acto
rs U
sed
by ea
ch
Meth
od
to Ev
alua
te
the
Func
tion
and
their
Ra
nkin
g fro
m M
ost
Influ
entia
l (1)
to
Leas
t In
fluen
tial
(4) i
n D
eter
min
ing
a Fi
nal
Ratin
g of
High
(H
), M
oder
ate
(M)
or Lo
w (L
)
0404
04
04 04 CO
O J CO
04CO
O J04 04 OJCO
04
O J04 COCOCO
TD<DXi
O h
Xi "O
bO
T3bQa.
JoX
Jo obO —o a>
T3O -O T3<UXi
O hT3
9-T3
0404 CO
() - u
sed
in op
port
unity
ev
alua
tion
(vs.
effe
ctiv
enes
s)
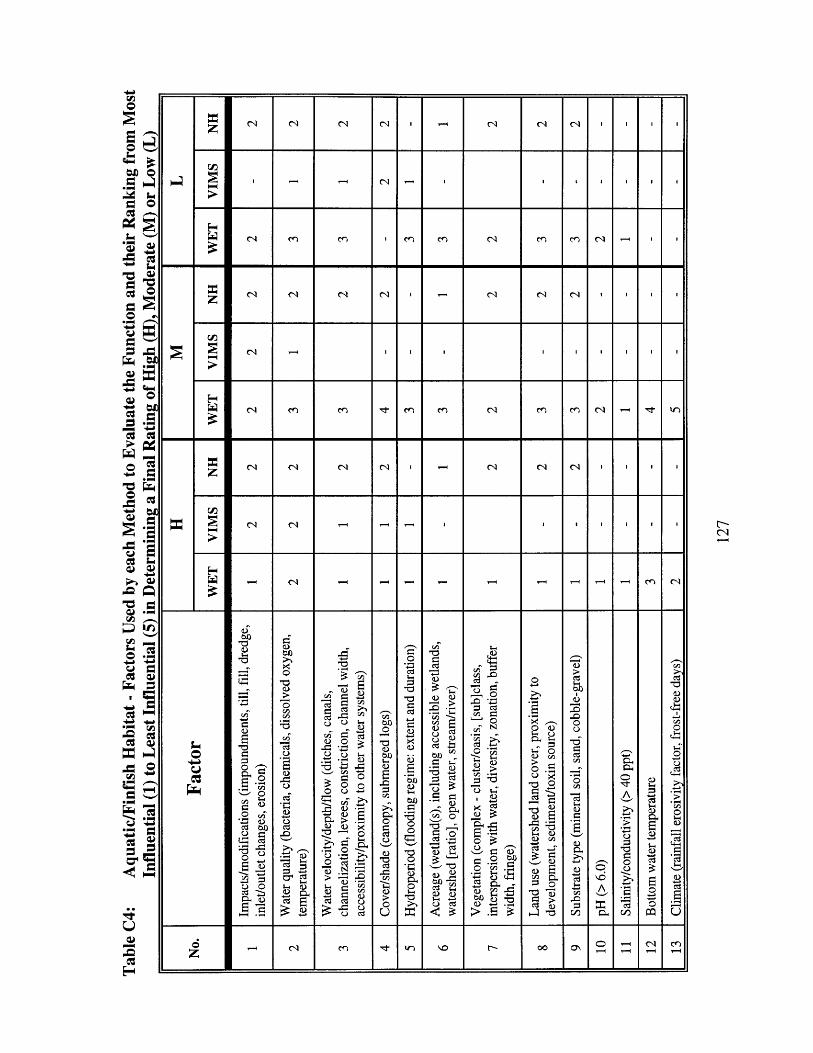
Tabl
e C4
: A
quat
ic/F
infis
h H
abita
t - F
acto
rs U
sed
by ea
ch
Met
hod
to Ev
alua
te
the
Func
tion
and
their
Ra
nkin
g fro
m M
ost
Influ
entia
l (1)
to
Leas
t In
fluen
tial
(5) i
n D
eter
min
ing
a Fi
nal
Ratin
g of
High
(H
), M
oder
ate
(M)
or Lo
w (L
) CO CO CO CO CO CO CM
CM
CO CO COco CO
CO CO CO CO
CO
CO
COCO CO COCO CO CO
CO COCO CO CO CO CO
CO CO
COCO CO
£T3
"OT3<DbJ)
T3T3
T3 T3T3cSJS O
no-O
COONCO CO

Tabl
e C5
: W
ildlif
e H
abita
t - F
acto
rs U
sed
by ea
ch
Meth
od
to Ev
alua
te
the
Func
tion
and
their
Ra
nkin
g fro
m M
ost
Influ
entia
l (1)
to
Leas
t In
fluen
tial
(13)
in
Det
erm
inin
g a
Fina
l Ra
ting
of Hi
gh
(H),
Mod
erat
e (M
) or
Low
(L)_
____
____
__ CSCO COCO
CSCS <N CS CS CS
<N
<Nco CO CO CO
CS CSCS CS
o C SCOO noo CO
co CO CO CO
CSCS CS CS
o CS ONoo
T3(DX !
CL,
ClT3
two
T3T3
X3-e
*3Oj<D;o
T3TDT3 X !
too -s T3>> a
NOCOONCS CO

APPENDIX D: EXAMPLES OF QUESTIONS / INTERPRETATION KEYS FROM EACH OF THE THREE METHODS

WETLANDS RESEARCH PROGRAM
TECHNICAL REPORT Y-87-
WETLAND EVALUATION TECHNIQUE (WETVolume II
by
Paul R. Adamus
Eco-Analysts, Inc.
and
ARA, Inc.Augusta, Maine 04330
and
Ellis J. Clairain, Jr., Daniel R. Smith, Richard E. Young
Environmental Laboratory
DEPARTMENT OF THE ARMY Waterways Experiment Station, Corps of Engineers
PO Box 631, Vicksburg, Mississippi 39180-0631
©IPEIMTDOGML DEMFT
April 1987
Prepared for DEPARTMENT OF THE ARMY US Army Corps of Engineers Washington, DC 20314-1000
and US Department of Transportation Federal Highway Administration
Washington, DC 20590

WET 2.0
15. VEGETATION/WATER INTERSPERSION
(Answer "I" to all of 15.1 if the wetland system is riverine. Answer "Yn to 15.1A if surface water is absent.) Does the horizontal pattern of erect vegetation in Zone B (Figure 15) consist of:
15.1A -Relatively few, continuous areas supporting vegetation with little or no interspersion with channels, pools, or flats (Figure 16)?
15. IB A condition intermediate between 15.1A and 15.1C.?
15.1C A mosaic of relatively small patches of vegetation (i.e., none smaller in diameter than two times the height of the prevailing vegetation) interspersed with pools, channels, or flats (Figure 16)?
15.2 (Answer "I" if channel or tidal flow never occurs in the AA/IA.) Is either of the following conditions present in that portion of the AA/IA having measurable flow?
(a) In channel situations, vegetation in Zone B consists mainly of persistent emergent distributed in the mosaic pattern described in 15.1C.
(b) Under average flow conditions, water enters the AA/IA in a channel and then spreads out over a wide area.
OR OR
B.
OROR
Figure 16. Examples of low and high vegetation/water interspersion (Note:In this figure, Part A exemplifies low vegetation/water interspersion (Question 15.1A = ,rY"), and Part B exemplifies high vegetation water interspersion (Question 15.1C = "Y").)

WET 2.0
Sediment/Toxicant Retention Effectiveness (S/TRE) Key
ANY of the following:
1. (9.2=y)unconstricted inlet and constricted outlet
2. (8.3=n and 8.4=n)no outlet
3. [(36.1.2=y) and ((22.3 = n) or (64 = n)J]substantial erect vegetation in Zones A and B and no evidence of erosion on aerial photos or inlet
HIGH
\ FANY of the following:
1. [(19.1A=n) + (43A/B/C/D/E=y) + (31.4=n) + (31.6A=y)]not sheltered and water depth <40 in. and sB<oB and B and C is 0% eB
2. (19.lB=y)unsheltered
(28 = y )
direct alteration evident
T3.
4. [(7=n) or (41.2=y)] high velocity
LOW
[(7=y) or (4l.l=y) or (42.1.1=y)] low velocity
AND ANY of the following:
1. (34.3.l=y)dike or dam downslope creates flooding
2. [ (22.3 = n) + (31.6A=n)+(12A/B/Da=y)+(22.2=y or 19.2=y}]no long-term erosion and B and C is not 0% eB and forested/scrub-shrub or persistent emergent and actively accreting delta part of AA
HIGH
.BOTH of the following:
1.
2 .
[(7=y) or (4l.l=y) or (3l.l=n)]low velocity or Zone C > Zones A and B
(45E+F+G=n)substrate not bedrock, rubble or cobble-gravel
S/TRE List A
S/TRE List B
— Continued —

WET 2.0
S/TRE Key (Cont.)
S/TRE List A
BOTH of the following:
1 . (13A/B/Da=y)part forested, scrub-shrub or persistent emergent
2. [ (3 6.1.l=n) + (25.2A=y) ] OR [(36.2.1 = n) + (25.2B=y) + (7=y)+ (9. l=y)]
erect vegetation in Zones A+B >20 ft wide and sediment sourceis overland flow OR Zone eB usually >20 ft wide and sediment source is channel flow and low velocity and constricted outlet
T-----MODERATE
OR ALL of the following:
1 . (9. l=y) constricted outlet
rS/TRE List B
2. (10D/E=y)tidal riverine or estuarine
3. (48B=y) or [(1.2=y)+ (13A/B/Da=y)]salinity=0.5-5.0 ppt or high rain-erosivity factor and forested,scrub—shrub or persistent emergent
S/TRE List B
ALL of the following;..
1. (31. 4=y)Zone sB > Zones oB and C
2. (10D/E/F=y)marine, estuarine or tidal riverine
3. (48B=y)salinity = 0.5-5.0 ppt
OR ALL of the following:
1. (10C/D=y)riverine
2. (35.l=y)expanded flooding or flow
3. [ (15.2=y) or (31.4=y)]good interspersion or Zone sB > Zones oB and C
4. (9.1=y) or (31.1=n) or ((49.1. 2=y) +(49.1.l=y)]
constricted outlet or Zones A+B>C or pools/riffles
— End —

A T echnique for the Functional A ssessm en t o f N on tid a l W etlands in the Coastal P lain
of V irginia
by
Julie Go Bradshaw
Special Report No. 315 in A pplied M arine Science and
Ocean Engineering
Virginia Institute of M arine Science School of M arine Science
College of W illiam and M ary G loucester Point, Virginia 23062
Decem ber 1991
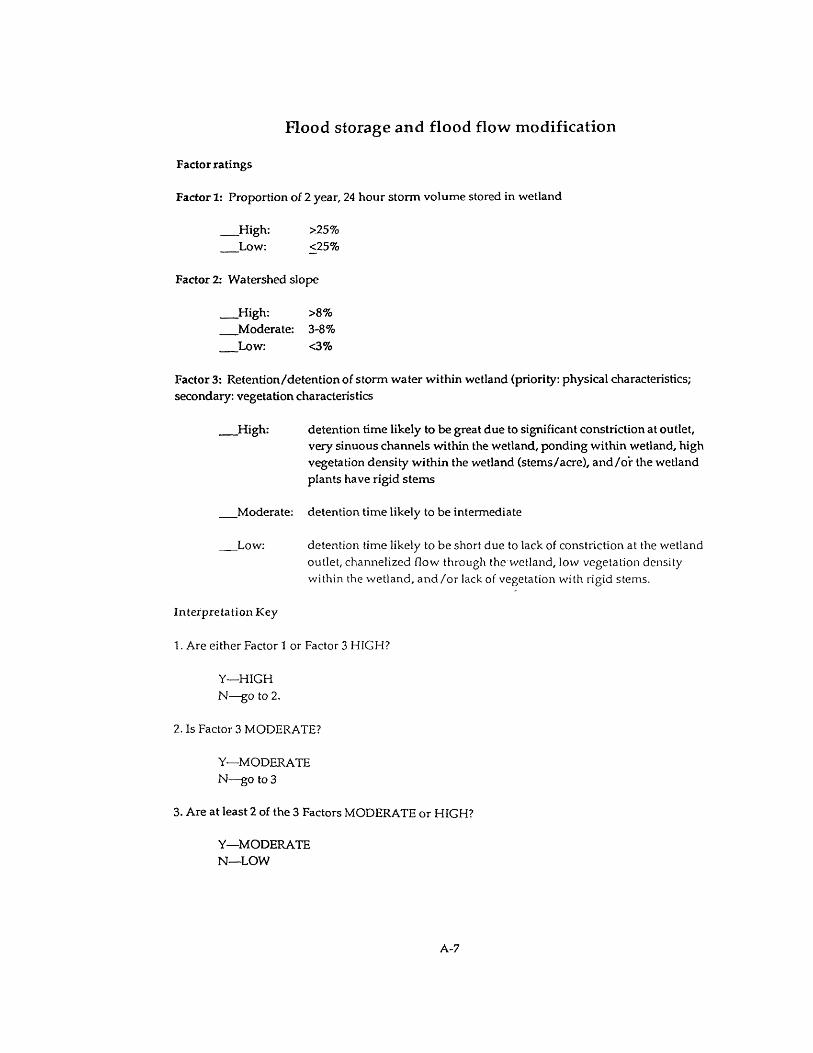
Flood storage and flood flow m odification
Factor ratings
Factor 1: Proportion of 2 year, 24 hour storm volum e stored in wetland
High: >25% Low: <25%
Factor 2: W atershed slope
High: >8% Moderate: 3-8% Low: <3%
Factor 3: R etention/detention of storm w ater w ithin wetland (priority: physical characteristics; secondary: vegetation characteristics
High: detention time likely to be great due to significant constriction at outlet,very sinuous channels within the wetland, ponding w ithin wetland, high vegetation density w ithin the wetland (stem s/acre), a n d /o r the wetland plants have rigid stem s
Moderate: detention time likely to be intermediate
Low: detention time likely to be short due to lack of constriction at the wetlandoutlet, channelized flow through the wetland, low vegetation density within the wetland, a n d /o r lack of vegetation with rigid stems.
In terpretation Key
1. Are either Factor 1 or Factor 3 HIGH?
Y—HIGH N —go to 2.
2. Is Factor 3 MODERATE?
Y—MODERATE N—go to 3
3. Are at least 2 of the 3 Factors MODERATE or HIGH?
Y—MODERATE N —LOW
A-7

NHDES - WRD - 1991 - 3
METHOD FOR THE COMPARATIVE EVALUATION OF NONTIDAL WETLANDS IN NEW HAMPSHIRE
Based on the "Method for the Evaluation of Inland Wetlands in Connecticut"(Ammann, et al., 1986)
The preparation o f this manual was supported by the Audubon Society o f New Hampshire Wetlands Protection Project and the USDA Soil Conservation Service.
This manual is published by the New Hampshire Department of Environmental Services6 Hazen Drive
Concord, NH 03301
Prepared for the Assistance of New Hampshire Towns by:
Alan P. Ammann, Ph.D., Principal Author U.S.D.A. Soil Conservation Service
Amanda Lindley Stone Audubon Society of New Hampshire
Robert W. Varney, Commissioner John Dabuliewicz, Assistant Commissioner
Printed on Recycled Paper
MARCH 1991
NHDES

Wetland Name/Code:
NEEDED FOR THIS EVALUATION: Functional Value 10NUTRIENT A TTENUA TION• USGS topographic map
• Land use map or recent aerial photographs• Knowledge or familiarity with the area regarding extent and type of current development• Ability to delineate a watershed (See Appendix E)
A BEvaluation Computations Questions or Actual Value
C D Evaluation Functional Value
Criteria Index (FVI)
PART A - OPPORTUNITY FOR NUTRIENT ATTENUATIONALL QUESTIONS TO BE ANSWERED IN THE OFFICE:1. Opportunity for sediment
trapping.Average FVI for Part A of FV 9
2. Potential sources of excess nutrients in watershed above wetland.
a. Large areas of active cropland, 1 0 pastureland, or urban land.Many dairies or other livestock operations, sewage treatment plants, or numerous on-site septic systems within 100 feet of stream
b. Watershed contains some 0 5 areas of active cropland, pastureland, or urban land. Afew dairies or other livestock operations or a few on-site septic systems within 100 feet of the stream
c. Watershed predominantly 0.1 forested or otherwise undeveloped
AVERAGE FVI FOR FUNCTIONAL VALUE 10. PART A = Average of Column D for Pari A =
PART B - OVERALL POTENTIAL FOR NUTRIENT ATTENUATION
QUESTIONS TO ANSWER IN THE OFFICE:1. Opportunity for nutrient
attenuation.Average FVI for Part A (above)
2. Overall potential for sediment trapping in the wetland.
Average FVI for Part B of FV 9
QUESTIONS TO ANSWER IN THE FIELD:
3. Dominant wetland class. (Refer to Question V.2.4).
a. Floating aquatic plants, emergent (marsh), forested, or scrub/shrub, except bogs
b. Bogs °-1
Continued on next page..,

Wetland Name/Code:
Functional Value 10 NUTRIENT A TTENUA TION (continued)
AEvaluationQuestions
Computations or Actual Value
CEvaluation
Criteria
DFunctional Value
Index (FVI)
4. Wetland hydroperiod. a. Wetland contains perma- 1.0 nently impounded openwater > 5 acres in size
b. Wetland contains perma- 0.5 nently impounded openwater from 0.5 to 5 acres in size, OR more than 5 acres of the wetland are flooded or ponded annually during a portion of the growing season
c. Above criteria are not met 0.1 (e.g. the wetland has predominantly saturatedsoil conditions and is rarely ponded or flooded during the growing season.)
AVERAGE FVI FOR FUNCTIO NAL VALUE 10, PART B = Average of Column D for Part B = = Average FVI forNutrient Attenuation.
EVALUATION AREA FOR FUNCTIONAL VALUE 10 = Total area of wetland = __________________ acres.

REFERENCES
Abate, T. 1992. Environmental rapid-assessment programs have appeal and critics: Are they the domain of the conservative elite? BioScience 42(7): 486-489.
Albrecht, V.S. 1991. Are all wetlands created equal?: Bring standards back to reality. National Wetlands Newsletter, Sept./Oct. 13(5): 6-7.
Amacher, G.S., Brazee, R.J., Bulkley, J.W. and R.A. Moll. 1988. Interdisciplinary Approach to Valuation of Michigan Coastal Wetlands. Rep. U.S. Geol. Surv. Water Resour. Div., 112 pp.
Adamus, P.R., Stockwell, L.T., Clairain, E.J., Jr., Smith, R.D. and R.E. Young. 1987. Wetland Evaluation Technique (WET)Vol. II. Methodology. U.S. Army Corps of Engineers, Waterways Experiment Station, Vicksburg, MS. 206 pp. plus appendices.
Adamus, P.R., Daniel, R.D. and T. Muir. 1990. Manual for Assessment of Bottomland Hardwood Functions. U.S. Environ. Protection Agency, Office of Wetlands Protection. Washington, D.C., USA. 72 pp.
Ainslie, W.B. 1994. Rapid wetland functional assessment: Its role and utility in the regulatory arena. Water, Air and Soil Pollution 77: 433-444.
Ammann, A.P., Franzen, R.W. and J.L. Johnson. 1986 and 1991. Method for the Evaluation of Inland Wetlands in Connecticut: A Watershed Approach. DEP Bulletin No. 9. Connecticut Department of Environmental Protection, Hartford, CT. pp. (Incomplete citation).
Ammann, A.P. and A.L. Stone. 1991. Method for the Comparative Evaluation of Nontidal Wetlands in New Hampshire. New Hampshire Department of Environmental Services, Concord, NH. NHDES-WRD-1991-3.
Bardecki, M.J. 1984a. What value wetlands? J. Soil and Water Conserv. 39(3): 166-169.
Bond, W.K., Cox, K.W., Heberlein, T., Manning, E.W., Witty, D.R. and D.A. Young. 1992. Wetland Evaluation Guide. Final Report of the Wetlands are not Wastelands Project. Sustaining Wetlands Issues Paper, No. 1992-1. North American Wetlands Conservation Council (Canada), Ottawa, Ontario. 121 pp.
Boyt, F.L., Bayley, S.E. and J. Zoltek, Jr. 1976. Removal of nutrients from treated municipal wastewater by wetland vegetation. J. Water Poll. Cont. Fed. 49: 789-799.
Bradshaw, J.G. 1991. A Technique for the Functional Assessment of Nontidal Wetlands in
139
the Coastal Plain of Virginia. Special Report No. 315 in Applied Marine Science and Ocean Engineering. Virginia Institute of Marine Science, School of Marine Science, College of William and Mary, Gloucester Point, VA.
Bradshaw, J.G. Personal communication, June 1, 1995. Marine Scientist, Virginia Institute of Marine Science, Gloucester Point, VA 23062.
Brinson, M.M. 1993. A Hydrogeomorphic Classification for Wetlands. Draft. Prepared for Office, Chief of Engineer, U.S. Army. Washington, D.C. 81 pp. plus field data sheets.
Brooks, R.P. 1989. An overview of ecological functions and economic values of wetlands, pp. 11-20 In: Majumdar, S.K., R.P. Brooks, F.J. Brenner and R.W. Tiner, Jr. (eds). Wetlands Ecology and Conservation: Emphasis in Pennsylvania. 395 pp.
Brown, M. 1986. Assessing wetland values in landscapes dominated by humanity, pp. 49- 54. In: Kusler, J.A. and P. Riexinger. Proc. National Wetland AssessmentSymposium. June 17-20, 1985, Portland, Maine. Assn. State Wetland Managers, Chester, VT. 331 pp.
Burke, D.G., Meyers, E.J., Tiner, R.W., Jr. and H. Groman. 1988. Protecting Nontidal Wetlands. American Planning Association, Chicago, IL. 76 pp.
Cable, T.T., Brack, V. and V.R. Holmes. 1989. Simplified method for wetland habitat assessment. Environ. Mgmt. 13(2): 207-213.
Carter, V., Bedinger, M.S., Novitzki, R.P. and W.O. Wilen. 1979. pp. 334-376 In: Greeson, P.E., Clark, J.R. and J.E. Clark (eds). Wetland Functions and Values: The State of Our Understanding. American Water Resources Assoc.
Chaun, M. 1993. Plowing through the muck: A review of wetland assessment/evaluation methods. Wetlands Program Technical Report, November 1993, No. 93-11.
Cobum, C.B., Jr. 1993. An Overview of Approaches to Evaluating and Regulating Wetlands in the States. Department of Biology, Tennessee Technological University. 162 pp.
Cooper, J.R., Gilliam, J.W., Daniels, R.B. and W.P. Robarge. 1987. Riparian areas as filters for agricultural sediment. Soil Sci. Soc. Am. J. 51: 416-420.
Cowardin, L.M., Carter, V., Golet, F.C. and E.T. LaRoe. 1979. Classification of Wetlands and Deepwater Habitats of the United States. U.S. Fish and Wildlife Service, FWS/OBS-79/31. U.S. Government Printing Office. Washington, D.C., USA. 103pp.
140

Eargle, M.F. 1989. A Functional Comparison of Selected Wetland Types in South Carolina Using the WET Technique. Thesis. Department of Biological Sciences, University of South Carolina. 155 pp.
Federal Interagency Committee for Wetland Delineation. 1989. Federal Manual for Identifying and Delineating Jurisdictional Wetlands. U.S. Army Corps of Engineers, U.S. Environmental Protection Agency, U.S. Fish and Wildlife Service, and U.S.D.A. Soil Conservation Service, Washington, D.C. Cooperative technical publication. 76 pp. plus appendices.
Ferng, Yue-Lang. 1988. Wetland functional evaluation and management of Onondaga County, New York. Ph.D. Thesis. State University of New York, College of Environmental Science and Forestry, Syracuse, NY. 271 pp.
Field, D.W., Reyer, A.J., Genovese, P.V. and B.D. Shearer. 1991. Coastal Wetlands of the United States: An Accounting of a Valuable National Resource. National Ocean Service, NOAA. U.S. Fish and Wildlife Service, Washington, D.C. and Slidell, LA. 59 pp.
Graber, J.W. and R.R. Graber. 1976. Environmental evaluations using birds and their habitats. Illinois Natural History Survey, Biology Notes 97: 1-39.
Harris, L.D. and J.G. Gosselink. 1990. Cumulative Impacts of Bottomland Hardwood Forest Conversion on Hydrology, Water Quality, and Terrestrial Wildlife. Chapter 9, pp. 259 -322 In: Gosselink, J.G., Lee, L.C. and T.A. Muir. 1990. Ecological Processes and Cumulative Impacts. Lewis Publishers, Chelsea, MI.
Hershner, C. 1993. VTMS hosts a wetlands functional assessment workshop. The Virginia Wetlands Report, Summer 1993, No. 93-8, p. 5.
Hollands, G.G. and D.W. Magee. 1986. pp. 108-118 In: Kusler, J.A. and P. Riexinger. Proc. National Wetland Assessment Symposium. June 17-20, 1985, Portland, Maine. Assn. State Wetland Managers, Chester, VT. 331 pp.
Larson, J.S., Adamus. P.R. and E.J. Clairain, Jr. 1989. Functional Assessment of Freshwater Wetlands: A Manual and Training Outline. The Environmental Institute, University of Massachusetts at Amherst. Publication No. 89-6. 62 pp.
Larson, J.S. 1990. Wetland value assessment, pp. 389-400 In: Patten, B.C. et al. (ed). Wetlands and Shallow Continental Bodies. Volume 1. SPB Academic Publishing bv, The Hague, The Netherlands.
141

Larson, J.S. and D.B. Mazzarese. 1992. Recent development and current goals of wetland functional assessment (working draft). Presented at INTECOL's IV International Wetlands Conference, Columbus, Ohio, USA, September 13-18, 1992. 13 pp.
Lonard, R.I., Clairain, E.J., Jr., Huffman, R.T., Hardy, J.W., Brown, L.D., Ballard, P.E. and J.W. Watts. 1981. Analysis of Methodologies Used for the Assessment of Wetland Values. Environmental Laboratory, U.S. Army Corps of Engineers, Waterways Expt. Station, Vicksburg, Miss., 68 pp. plus appendices.
Lonard, R.I., Clairain, E.J., Jr., Huffman, R.T., Hardy, J.W., Brown, L.D., Ballard, P.E. and J.W. Watts. 1984. Wetlands Function and Values Study Plan. Appendix A: Analysis of Methodologies for Assessing Wetlands Values. Tech. Rep. Y-83-2, U.S. Army Engineer Waterways Experiment Station, CE, Vicksburg, Miss.
Lonard, R.I. and E.J. Clairain, Jr. 1986. Identification of methodologies for assessment of wetland functions and values, pp. 66-72. In: Kusler, J.A. and P. Riexinger. Proc. National Wetland Assessment Symposium. June 17-20, 1985, Portland, Maine. Assn. State Wetland Managers, Chester, VT. 331 pp.
Lowrance, R, Sharpe, J.K. and J.M. Sheridan. 1986. Long-term sediment deposition in the riparian zone of a coastal plain watershed. J. Soil Water Conserv. July-August: 266- 271.
Marble, A.D. 1992. A Guide to Wetland Functional Design. Lewis Publishers, Inc., Chelsea, MI. 222 pp.
Marble, A.D. and M. Gross. 1984. A method for assessing wetland characteristics and values. Landscape Planning 11: 1-17.
Mason, P. 1993. Natural resources management in coastal Virginia. Wetlands Program Technical Report, July 1993, No. 93-6.
Mason, P. Personal communication, October 23, 1995. Marine Scientist, Virginia Institute of Marine Science, Gloucester Point, VA 23062.
May, J.P. 1989. Groundwater recharge potential of freshwater wetlands on Hilton Head Island, South Carolina. In: Sharitz, R.R. and J.W. Gibbons (eds). Freshwater Wetlands and Wildlife. Proceedings of a symposium held at Charleston, SC. March 24-27, 1986. U.S. Department of Energy.
Mitsch, W.J., Dorge, C.L. and J.R. Wiemhoff. 1979. Ecosystem dynamics and a phosphorus budget of an alluvial cypress swamp in southern Illinois. Ecology 60: 1116-1124.
142

Mitsch, W. J., and J.G. Gosselink. 1993. Wetlands. Van Nostrand Reinhold Company Inc., New York, N.Y., 539 pp.
Motts, W.S. and R.W. Heeley. 1973. Wetlands and groundwater. In: Larson, J.S., ed. A Guide to Important Characteristics and Values of Freshwater Wetlands in the Northeast. University of Massachusetts, Water Resources Center. Pub. No. 31, pp. 5-8.
National Oceanic and Atmospheric Administration Chesapeake Bay Environmental Valuation Workshop. 1994. NOAA Coastal Ocean Program, NOAA Economics Group, Maryland Sea Grant Extension Program, Department of Agricultural & Resource Economics, University of Maryland, Chesapeake Research Consortium, June 1, 1994, Chesapeake Research Conference, Norfolk Waterside Marriott Hotel. 77 pp.
Niering, W.A. 1985. Scenic, cultural (heritage) and educational values of wetlands, pp. 58- 64 In: Kusler, J.A. and P. Riexinger. Proc. National Wetland AssessmentSymposium. June 17-20, 1985, Portland, Maine. Assn. State Wetland Managers, Chester, VT. 331 pp.
Niering, W.A. 1988. Endangered, threatened and rare wetland plants and animals of the continental United States, pp. 227-238 In: Hook, D.D. et al. (eds). The Ecology and Management of Wetlands. Vol. 1. Ecology of Wetlands. Timber Press, Portland, OR.
Novitzki, R.P. 1989. Wetland hydrology, pp. 47-64 In: Majumdar, S.K., R.P. Brooks, F.J. Brenner and R.W. Tiner, Jr. (eds). Wetlands Ecology and Conservation: Emphasis in Pennsylvania. Pennsylvania Academy of Science, Easton, PA. 395 pp.
Odum,W.E. 1988. Non-tidal freshwater wetlands in Virginia. Virginia J. o f Nat. Resources Law 7: 421-434.
Odum, W.E., Harvey, J., Rozas, L. and R. Chambers. 1986. Functional assessment of selected wetlands of Chincoteague Island, Virginia. U.S. Fish Wildl. Serv. National Wetlands Research Center Open File Report 86-7. May 1986. 127 pp.
Omemik, J.M. 1977. Nonpoint Source-Stream Nutrient Level Relationships: A Nationwide Study. EPA-600/3-77-105. U.S. Environmental Protection Agency. Corvallis, Oregon. 151 pp. plus maps.
Richardson, C.J. 1989. Freshwater wetlands: transformers, filters, or sinks? pp.25-46 In: Sharitz, R.R. and J.W. Gibbons (eds). Freshwater Wetlands and Wildlife. Proceedings of a symposium held at Charleston, SC. March 24-27, 1986. U.S. Department of Energy.
143

Taylor, J.R., Cardamone, M.A. and W.J. Mitsch. 1990. Bottomland Hardwood Forests: Their Functions and Values, pp. 13-86 In: Gosselink, J.G., Lee, L.C. and T.A. Muir. 1990. Ecological Processes and Cumulative Impacts. Lewis Publishers, Chelsea, MI.
Tiner, R.W., Jr. 1984. Wetlands of the United States: Current Status and Recent Trends. National Wetlands Inventory, U.S. Fish and Wildlife Service. Washington, D.C. 59pp.
Tiner, R.W., Jr. 1987. Mid-Atlantic Wetlands: A Disappearing Natural Treasure.Washington, D.C. U.S. Fish and Wildlife Service.
U.S. Army Corps of Engineers. 1972. Charles River Watershed, Massachusetts. New England Division, U.S. Army Corps of Engineers, Waltham, MA.
U.S. Code of Virginia, Title 13, Chapter 28.2, Section 1302, Article 2: Wetlands Zoning Ordinance and Wetlands Boards, pp. 220-221.
U.S. Department of Agriculture, Soil Conservation Service. 1985. Soil Survey of James City and York Counties and the City of Williamsburg, Virginia.
U.S. Department of Agriculture, Soil Conservation Service. 1980. Soil Survey of Gloucester County, Virginia.
Virginia Department of Conservation and Recreation, Division of Soil and Water Conservation. 1992. Virginia Erosion and Sediment Control Handbook. Third Edition.
Virginia State Water Control Board. 1979b. Best Management Practices Handbook. Urban. Planning Bulletin, 321 pp.
Weller, M.W. 1979. Wetland habitats, pp.210-234 In: Greeson, P.E., Clark, J.R. and J.E. Clark (eds). Wetland Functions and Values: The State of Our Understanding. American Water Resources Assoc.
Wohlgemuth, M. 1993. Wetland Functions and Values. Self-Taught Education Unit. Wetlands Program, Virginia Institute of Marine Science, School of Marine Science, The College of William and Mary, Gloucester Point, Va. 16 pp.
144

VITA
Melissa Claire Chaun
Bom in Vancouver, British Columbia, Canada on April 11, 1969. Graduated from Crofton House School, Vancouver, B.C. in 1987. Received a B.Sc. in Biology (Ecology) from McGill University, Montreal, Quebec in 1991. Entered the Master's Program at the Virginia Institute of Marine Science, School of Marine Science, The College of William and Mary in August 1992.
145