Embed Size (px)
Citation preview
RESEARCH SERIES ON THE RECIDIVISM OF
FEDERAL GUIDELINE OFFENDERS
RELEASE 3
A COMPARISON OF THE
FEDERAL SENTENCING GUIDELINES
CRIMINAL HISTORY CATEGORY
AND THE U.S. PAROLE COMMISSION
SALIENT FACTOR SCORE
January 4, 2005
Submitted to the United States Sentencing Commission
RICARDO H. HINOJOSA
Chair
RUBEN CASTILLO
Vice Chair
WILLIAM K. SESSIONS, IIIVice Chair
JOHN R. STEER
Vice Chair
MICHAEL E. HOROWITZ
Commissioner
BERYL A. HOWELL
Commissioner
MICHAEL E. O’NEILL
Commissioner
EDWARD F. REILLY, JR.(Ex officio)
DEBORAH J. RHODES
(Ex officio)
Prepared by
LINDA DRAZGA MAXFIELD
MILES HARER*
TIMOTHY DRISKO
CHRISTINE KITCHENS
SARA MEACHAM
MATTHEW IACONETTI
*while serving at the U.S. Sentencing Commission
Examples of government use of criminality prediction instruments include the Salient Factor Score of the U.S.1
Parole Commission, the Risk Prediction Index (RPI) of the Administrative Office of the U.S. Courts, or the OffenderGroup Reconviction Scale (OGRS) in the United Kingdom described in Copas and Marshall (1998).
Hoffman and Beck, 1974. 2
Hoffman and Beck (1976) subsequently re-tested the SFS, finding that the SFS retained its predictive accuracy3
in identifying those at high risk of parole failure. The early studies by Hoffman and Beck (1974, 1976) used a two year
follow-up recidivism period. With the passage of time, the later studies tested the SFS using longer follow-up periods.
Using two, three, and five year follow-up periods, the SFS not only maintained predictive accuracy but actually became
slightly more accurate as the follow-up period length was extended (Hoffman and Beck, 1985).
The Commission explicitly allows that an offender’s prior criminal history is predictive of recidivism. See4
U.S. Sentencing Commission, 1987: 41-44.
U.S. Sentencing Commission, 2004: Chapter Four, Part A - Criminal History.5
Page 1 of 34
Criminal justice practitioners over the years have used various forms of predictioninstruments to help guide prisoner risk decisions, such as whether to sentence a1
person to prison or probation, or when to parole an offender. Such predictioninstruments do not foresee the future nor predict whether an offender will go back to a life of crime.Rather, they use a set of observable measures — such as age, frequency of prior offending, orrecency of prior offending — to identify offenders who have the highest probability of recidivating.
The U.S. Parole Commission’s re-offending prediction instrument has been in use for thelongest period of time. In its1970s effort to structure discretion and equalize decision making witha quantified instrument, the U.S. Parole Commission developed a recidivism prediction measurecalled the Salient Factor Score (SFS). Early research documents that the SFS (operating as a pilot2
project in 1972) identified groups of offenders more, or less, likely to recidivate. In addition to itsconstruction sample of federal prisoners released in 1970, the thorough evaluation employed twovalidation samples of federal prisoners also released in 1970. With these successful validationresults, the then U.S. Board of Parole adopted the SFS as its main decision-making instrument inOctober 1973. Since that time, the Parole Commission has used empirical recidivism data to guide,construct, and revise the SFS. Continuing research and validation demonstrates that the SFS is an3
accurate and reliable recidivism risk assessment tool.
In its work to implement the Sentencing Reform Act of 1984, the U.S. SentencingCommission (USSC) developed an empirical recidivism risk prediction instrument as a componentof the federal sentencing guidelines. This instrument, the Criminal History Category (CHC),4
appears as Chapter Four in the federal Guidelines Manual. Unique in this USSC effort, however,5
is the identification of two goals for its criminal history instrument: first, to predict recidivism, and
Ibid.: 41.6
U.S. Sentencing Commission, 2004: Chapter Four, Part A - Criminal History, introductory comment.7
Apprendi v New Jersey, 120 S. Ct. 2348 (June 26, 2000).8
Blakely v Washington, 124 S. Ct. 2531 (June 24, 2004).9
Blumstein et al.: 1986: 188.10
Page 2 of 34
second, to reflect offender culpability. With this dual purpose, the CHC relies heavily, but not6
exclusively, upon the empirical foundation of the SFS. For example, both the SFS and the CHCfocus on the number and timing of prior criminal history events. However, the computation strategyof the individual scores, the time periods employed, and the assignment of points differ.Nonetheless, the SFS and the CHC remain related in structure. The purpose of this paper is todescribe the differences between the SFS and the CHC, to compare their predictive abilities (bothoverall, and component by component), and to suggest alternative formulations of the CHC thatpromote maximum predictive accuracy.7
The first section below describes the empirical foundations of the guidelines’ CHC. Thisis followed by a component comparison of elements in the CHC and the SFS. The third sectiondescribes the data and methodology used in the analysis. Section D and section E look explicitly atpredictive power, with the first of these sections assessing the predictive power of the individualcomponents and the second section comparing the total predictive power of each instrument.
The focus of the paper turns toward the goals of revision and improvement with the finalsections. Section F directly compares the component elements of the two models to determine whichformulation – that of the CHC or that of the SFS – is more predictive. Section G introduces age andfirst offender enhancements to the CHC and measures the increases in predictive power. Theconclusion section summarizes the findings and highlights the importance of efficiency andsimplicity in a post-Apprendi and post-Blakely guideline environment.8 9
This report is part of the USSC Research Series on the Recidivism of Federal GuidelineOffenders.
A. Origins of the Criminal History Category
In creating the CHC, USSC reviewed the four prediction measures made prominent in amid-1980s criminal careers study conducted by the National Academy of Sciences.10
These four risk assessment scales were the Iowa Assessment Scale, the Rand InmateScale, the U.S. Parole Commission’s Salient Factor Score, and the Proposed INSLAW Scale forSelecting Career Criminals for Special Prosecution. Although USSC recognized the importance ofaccurately measuring prior criminal behavior and future recidivism risk to promote the goals of
U.S. Sentencing Commission, 1987: 41.11
U.S. Sentencing Commission, 1987: 43; Hoffman and Beck, 1997: 1. 12
“The [SFS] score and its four risk categories are at the high end of the accuracy range reported in other parole13
recidivism studies ... In addition, these accuracy measures have been very stable over several validation samples”(Blumstein et al., 1986: 182); “In many ways, the Salient Factor Score is preferable to the other predictive instruments,due to its extensive validation and operational use in the criminal justice system” (Janus, 1985:121).
In 1998, “[t]he Parole Commission revised the Salient Factor Score by increasing the weight given to prior14
commitments and age at offense, and deleting the drug-abuse item. The revised Salient Factor Score was designatedas SFS 98” (U.S. Parole Commission, 2003a: 33).
28 U.S.C.§ 991(b)(1)(A) mandates USSC to assure that the 18 U.S.C.§3553(a)(2) purposes of sentencing15
– including protection of the public from further crimes of the offender – are met. The other three purposes ofsentencing are listed in 18 U.S.C.§3553(a)(2) as: providing just punishment, affording adequate deterrence, andproviding adequate educational, vocational, medical, or other corrective treatment.
Page 3 of 34
crime control, it was constrained by the demanding time schedule of the newly-implemented11
Sentencing Reform Act. There were inadequate time and resources to evaluate empirically a newrecidivism prediction measure, particularly in light of the Commission’s desire to include the moresubjective culpability perspective along with the recidivism prediction perspective.
Consequently, the guideline’s criminal history measure did not emanate from its own directempirical evidence. To create the CHC, USSC relied on the validity of existent (non-Commission)data and the validity of existing prediction tools. In deriving the components of the guidelines’Chapter Four model, USSC elected to focus upon two of the four established recidivism predictiontools described in the National Academy of Science study.
First, the Commission adopted a modified version of several elements in the existing SFS.12
The creators of the guidelines criminal history measure, recognizing the Parole Commission’sprominence in related statistical methodologies, relied heavily upon the recidivism research and thewell-documented validity tests of the SFS. In fact, the SFS reliability has been continuously tested,13
reformatted, and evaluated throughout its history, with elements dropped when they did notindependently contribute predictive power within its set of factors.14
However, the CHC and SFS do have one essential conceptual difference. As an instrumentof the U.S. Parole Commission, the purpose of the SFS is to assess the likelihood of recidivism. Itselements are included if they add to predictive accuracy. On the other hand, the goal of the CHCencompasses more than recidivism prediction. Its second core philosophy involves additional15
purposes of sentencing: just punishment and deterrence. The introductory section of the GuidelinesManual’s Chapter Four on criminal history states that to protect society from known criminals, theCHC should not only take into account recidivism (i.e., the likelihood of re-offending), but alsoculpability (i.e., harsher punishments for offenders with aggravated prior criminal backgrounds):
A defendant with a record of prior criminal behavior is more culpable than a first
U.S. Sentencing Commission, 2004: Chapter Four, Part A - Criminal History, introductory comment.16
Forst et al, 1982: 19-21.17
U.S. Sentencing Commission, 1987: 43.18
U.S. Sentencing Commission, 2004: Chapter Four, Part A - Criminal History, introductory comment.19
Page 4 of 34
offender and thus deserving of a greater punishment. General deterrence of criminalconduct dictates that a clear message be sent to society that repeated criminalbehavior will aggravate the need for punishment with each recurrence.16
Because of the close historical relationship between the SFS and the CHC, there have beennumerous speculations concerning their comparative strengths in predicting recidivism. However,the SFS, with its single-minded recidivism prediction purpose, generally is assumed to be morepredictive than the CHC with its dual culpability and recidivism goals (Schmidt & Garner, 1991;Hoffman, 1994; Harer, 1994; Hoffman and Beck, 1997).
Second, the Commission identified one of the nine elements of Proposed INSLAW scale thattargeted violent behavior in the instant offense. The scale’s violence element was adapted to17
specific uncounted violent prior offenses and included in the CHC model.
From this approach, USSC reasoned that the high SFS predictive power demonstrated by theSFS, as well as from the Proposed INSLAW scale, would transfer, at least in part, to the nascentguidelines criminal history measure:
The indirect evidence available to the Commission strongly suggests that the criminalhistory score will demonstrate predictive power comparable to that of predictioninstruments currently in use. ... The high correlation between the two instrumentssuggests that the criminal history score will have significant predictive power. 18
Thus, with this amalgam of elements from pre-existing prediction instruments, the CHC is currentlythe recidivism prediction tool used at federal guideline criminal sentencings to measure offenderculpability, deter criminal conduct, and protect the public from further crimes of the defendant. 19
B. Component Comparison of the CHC and the SFS
Not surprisingly, given their historical commonality, the CHC and the SFS have underlyingconcepts that look and sound similar. To illustrate this similarity, the practitioner worksheets forthese measures appear in the appendices: the CHC worksheet appears in Appendix A and the SFSworksheet appears in Appendix B.
There are several procedural differences between the CHC and the SFS. One is the timeframe when it is administered. The USSC CHC is computed at the time of sentencing for the instantoffense. The Parole Commission’s SFS is computed during the offender’s incarceration to assist in
U.S. Sentencing Commission, 2004: Chapter Four, §4A1.1(a) through §4A1.1(f).20
Approximately every five years, the U.S. Parole Commission re-validates and updates the SFS. A current21
copy of the SFS can be found in Appendix B at the end of this report. Also see U.S. Parole Commission, 2003b: 58.
USSC §4A1.1(a),(b),(c) instruct that three points are added for each prior sentence of imprisonment exceeding22
one year and one month, two points for each prior sentence of imprisonment between 60 days and 13 months, and one
point for each other prior sentence (up to a total of 4 points). For example, if an hypothetical offender has four priorconvictions, one with a probation-only sentence, two each with a sentence of 6 months of prison, and one with a
Page 5 of 34
parole release determinations.
Not only is there a scaling magnitude difference between the two measures, additionally theyare scaled in opposite directions.
• Lower SFS values predict higher risks of recidivism within its finite rangeof values from zero to ten.
– Scoring at the minimum value of zero on the SFS indicates a veryhigh recidivism risk.
• Lower CHC values predict lower risks of recidivism. CHC has a lower limit
of zero, but has no upper limit. Some offenders accrue as many as 30, or 40,or more, points under the CHC.
– Scoring at the minimum value of zero on the CHC indicates a verylow recidivism risk.
To compute the scores for either the CHC or the SFS, practitioners follow the respective setof application criteria that attach numbers to the specific instrument components. Exhibit 1compares the computational structure between the USSC CHC and the Parole Commission SFS. The CHC is composed of six guideline computations that quantify criminal history. The current20
SFS (SFS98) is also composed of six guideline computations (Item A through Item F) that quantifyvariables highly associated in predicting recidivism. 21
To determine and compare the predictive abilities of both the CHC and SFS a brief
understanding of each of their respective components is necessary.
1. Frequency and Seriousness of Criminal History
For the first two components listed in Exhibit 1, frequency and seriousness of prioroffending, the SFS and the CHC use different counting techniques. The CHC adds up to three pointseach for separate prior conviction and makes distinctions between prior sentences in one of threecategories: those less than 60 days, between 60 days and 13 months, or more than 13 months. In22
sentence of 18 months of prison, the offender would receive eight criminal history points (i.e., the first receives onepoint, the next two receive 2 points each, and the fourth receives three points.) For the CHC, the higher the score, thehigher the hypothesized risk of recidivism.
The SFS Item A can add between 0 and 3 points, ranging from 0 points when the offender has three or more23
prior convictions, to three points if the offender has no prior convictions. The SFS Item B can add between 0 and 2points depending on the number of convictions exceeding 30 days. For example, if an hypothetical offender has fourprior convictions, one with a probation-only sentence, two each with a sentence of 6 months of prison, and one with asentence of 18 months of prison, the offender would receive 0 points for these SFS items. This is due to receipt of zeropoints from Item A (i.e., a total of four prior convictions) and zero points from Item B (i.e., a total of three priorconvictions with confinements longer than 30 days). For the SFS, the higher the score, the lower the hypothesized riskof recidivism.
U.S. Sentencing Commission, 2004: Chapter Four, §4A1.2(e).24
U.S. Sentencing Commission, 2004: Chapter Four, §4A1.2(d)(2).25
U.S. Parole Commission, 2003b: 60 (Item A.8). 26
U.S. Sentencing Commission, 2004: Chapter Four, §4A1.2(h),(i); U.S. Parole Commission, 2003b: 60 (Items27
A.9, A10).
U.S. Sentencing Commission, 2004: Chapter Four, §4A1.2(c); U.S. Parole Commission, 2003b: 59 (Item28
A.2(b)).Page 6 of 34
contrast, the SFS only adds points up to a maximum of four prior convictions and distinguishes onlytwo prior conviction commitment lengths: those 30 days or less, and those more than 30 days. 23
The computational rules for both instruments incorporate exclusions for certain prioroffenses. One of these exclusions is a “decay” factor, under which prior offenses occurring beforea designated time period are not counted in the computation. For the CHC, in general there are twodecay periods for adult offenses: 15 years for imposed sentences of 13 months or more, and 10 yearsfor other sentences. For juvenile sentences, the decay periods is five years. The SFS does not24 25
count prior convictions that occurred more than ten years prior to the instant offense if that ten-yearperiod is commitment-free. 26
Another exclusion rule involves the jurisdiction of prior convictions. The CHC excludesforeign convictions and tribal convictions while the SFS includes such offenses.27
Another exclusion rule involves minor offenses. Both the CHC and the SFS exclude minortraffic offenses (such as speeding), juvenile status offenses (such as truancy), and other minoroffenses such as hitchhiking, public intoxication, or vagrancy. For other misdemeanor or pettyoffenses, the conviction is only counted if the sentence involved is at least 30 days of imprisonmentor a one-year or longer sentence of probation. The specific provisions and definitions are similarbetween the instruments. 28
While there are differences in the computation and application of the frequency andseriousness variables, these respective elements target the same underlying concepts.
Page 7 of 34
2. Instant Offense While Under Criminal Justice Supervision
The “under supervision” element of the CHC and the SFS identify whether the offender wasunder any form of criminal justice supervision at the time of the instant federal offense. Thewordings of the provisions are similar. This element captures the higher recidivism likelihood whenthe instant offense is committed while the offender is still meeting a sentence obligation for anearlier offense.
The SFS Item E and the CHC §4A1.1(d) are similar. Guideline §4A1.1(d) instructs the userto “[a]dd 2 points if the defendant committed the instant offense while under any criminal justicesentence, including probation, parole, supervised release, imprisonment, work release, or escapestatus.”
Item E of the SFS allocates one point to those who at the time of their instant offense were“[n]either on probation, parole, confinement, or escape status . . . nor [were] committed as aprobation, parole, confinement, or escape status violator this time.”
3. Recency of Prior Offending
Both the CHC and SFS address the time since release from a prior commitment, butimplement it from differing perspectives. For the CHC, the measure identifies an offender whocommitted the instant offense less than two years after release from an imposed imprisonmentsentence of 60 days or longer. The SFS focuses on a “crime free period” and identifies as morelikely to recidivate an offender who both (1) has any prior offense with a commitment of 30 daysor longer, and (2) committed the instant offense less than three years after release from the mostrecent 30-days-or-longer commitment.
Note that this recency factor applies independently from the application for criminal justicesupervision (described immediately above). At the time of the instant offense, an offender whomeets the conditions for one of these two factors sometimes might also meet the conditions for both.
4. Prior Violent Offending
USSC guideline §4A1.1(f) may add points to a CHC score if a given crime of violence didnot receive points in the guideline calculation only because of its close relationship to another violentconviction that did receive points. The CHC “prior violent offending” element was derived fromthe Proposed INSLAW Scale. The SFS does not contain a violence component.
5. Age
Schmidt and Witte, 1988: 87. Schmidt and Witte additionally cite studies that date from the early 1970s and29
document the strong predictive relationship between recidivism and offender age.
“While empirical research has shown that other factors are correlated highly with the likelihood of recidivism,30
e.g., age and drug abuse, for policy reasons they were not included here at this time,” USSG, Ch. 4, Pt. A, intro.comment. (emphasis added)..
Hoffman and Beck, 1997: 193.31
Page 8 of 34
Item C and Item F in the SFS target the predictive recidivism power of the offender’s age.Item C captures the impact of the offender’s age at the instant offense in combination with thenumber of prior commitments: the older the defendant and the fewer the number of priorcommitments, then the higher the defendant’s SFS score (thus indicating a lower likelihood ofrecidivating.) SFS Item F assigns an additional point to offenders older than 41 years of age,accounting for a long-established high empirical correlation between age and recidivism. 29
USSC does not include age as a recidivism factor in the CHC, with the original Commissionmembers citing its exclusion on policy grounds. However, the introductory commentary to theguidelines criminal history chapter leaves open the possible reconsideration of its inclusion. Note,30
however, that the “decay” factor of the CHC is often interpreted as a proxy for age at currentoffense. 31
From the above component by component comparisons between the SFS and the CHC, ashared common core can be identified. The SFS items (excluding its age components) target thesame underlying predictors as does the CHC (excluding its violence component). There areoperational variations, particularly involving differences in the rules for calculating each componentand differences in scaling (the SFS scores from high to low recidivism risk in a bounded range fromzero to ten, respectively, while the CHC scores from low to high recidivism risk in an unboundedrange from zero and higher).
Outside this common core, however, there are two differences. The SFS contains two itemswhich incorporate offender age as a recidivism predictor. The USSC CHC has no age component,but includes a violence component motivated by its culpability goal.
The sections that follow introduce empirical data to compare the overall predictive powerof the SFS and the CHC. The analysis strives to attribute differences in predictive power toparticular SFS and CHC components. The next step compares the SFS to modified CHCinstruments that incorporate offender age and offender first offender status as predictive components.
C. The Recidivism Study
Due to alien deportation following conviction for criminal behavior, it is difficult to measure recidivism of32
noncitizens convicted of federal crimes.
Details on the structure, methodology, and statistical techniques of the analysis are documented in the project’s33
companion report, “Background and Methodology of the U.S. Sentencing Commission’s 2003 Recidivism Study.”
While the two-year recidivism follow-up period limit was set at June 1, 2001, the actual collection of FBI34
“RAP” sheet data did not occur until October 2001. The four month delay between June and October assured that “RAP”
sheet data would reflect all events prior to June 1. The intervening months accounted for administrative processing time
to update fingerprint card information on the FBI datafile, thus minimizing any potential bias due to the states’
differential schedules for reporting data to the FBI.
Page 9 of 34
The sections below describe the USSC recidivism study, including data collectionstrategy, research definitions, and analysis methods.
1. Recidivism Data
The recidivism study data are a stratified, random sample of 6,062 U.S. citizens who were32
sentenced under the federal sentencing guidelines in fiscal year 1992. Data on criminal behavior33
prior to the federal instant offense, as well as demographic and offender characteristics, werecollected from the federal pre-sentence reports (PSRs) and other court documents submitted to theSentencing Commission by U.S. district courts. Prison release date information was extracted fromthe SENTRY datafile of the Federal Bureau of Prisons in the U.S. Department of Justice.Recidivism information was obtained from the “RAP” sheet data of the Federal Bureau ofInvestigation’s Criminal Justice Information Services Division office.
The sample of offenders used in the recidivism analysis represents the 28,519 U.S. citizenfederal offenders in the Commission’s 1992 fiscal year sentencing datafile where the following “two-year window inclusion” conditions were met:
• a pre-sentence report (PSR) from a fiscal year 1992 sentencing was submittedto the Sentencing Commission,
• a “RAP” sheet was located on the FBI datafile;
• for offenders receiving prison sentences, the release from prison occurred atleast two years prior to June 1, 2001.
Given the project schedule for “RAP” sheet collection in October 2001, an offender musthave been released from prison by June 1, 1999. Because the sampled offenders were sentenced infiscal year 1992 (i.e., between October 1, 1991 and September 30, 1992), prison sentences as longas seven years are available for study. The selection of these specific dates reflects the34
Commission’s interest in the recidivism impact of mandatory minimum sentences. The effect of fiveyear mandatory minimum sentences can be analyzed using the project’s sampling strategy.
With the study’s prison release deadline established as June 1, 2001, there were offenders
This figure represents the sum of the sample offenders who by June 1, 2001, were still in prison (8.9%), who35
had died (0.4%) or had not been released for at least two years (5.4%). Even with these limitations, however, 85.3percent of the total recidivism sample is included in the analysis reported here. Not included in the analysis are thoseoffenders with sentences roughly longer than seven years who are disproportionately found in the higher CHCs,particularly CHC VI.
Disposition information was obtained from the FBI’s criminal history record (“RAP” sheet).36
Page 10 of 34
in the sample who either were still in prison on this date, or had at this time been released fromprison for less than two years. For the entire recidivism sample, 14.7 percent of sample offendersare not in the analysis because they had not finished serving their prison time or did not have a two-year “at risk” window of opportunity. 35
2. Defining Recidivism
Recidivism results are presented using one substantive definition. The recidivism definitionused in this analysis includes the first of any one of the three following events during the offendersfirst two years back in the community:
• a re-conviction for a new offense;
• a re-arrest with no conviction disposition information available on the post-release criminal history record; or36
• a supervision revocation (probation or post prison supervision).
3. Methodology
The use of the recidivism definition addresses the state of post-release criminal behaviorrecords. Recidivism researchers recognize that the FBI offender “RAP” sheets are the most accurateand readily available data source for repeat criminal behavior. However, “RAP” sheets can containerrors or partial information. For example, depending on the reporting policies and practices of localjurisdictions, arrest dispositions may not always be transferred to the FBI for inclusion on “RAP”sheets, or offender fingerprints may not be collected for certain types of crimes or offenders.Consequently, “RAP” sheets will underreport actual criminal behavior, and will under reportconvictions resulting from arrests.
Data cited throughout this paper are weighted to represent the entire comparable populationof fiscal year 1992 U.S. citizen offenders sentenced under the federal guidelines.
Two techniques are used to analyze recidivism rates of federal offenders. The two techniquesare hazard modeling and the receiver operating characteristic. Both are accepted methods for
Quinsey, Harris, Rice, and Cormier, 1998; Swets, Dawes, and Monahan, 2000. 37
Allison, 1995; Hosmer and Lemeshow, 1999; Klein and Moeschberger, 1997.38
The AUC methodology is summarized in Appendix A, with a detailed explanation in project’s companion39
report, “Background and Methodology of the U.S. Sentencing Commission’s 2003 Recidivism Study.”
As seen in the Exhibit 2's column labeled “Pr > ChiSq,” the level of statistical significance for CHC elements40
labeled in the Exhibit as i, ii, iii, and iv is 0.0001, signifying high predictive strength. Element v (violent priors nototherwise receiving points) is not a statistically significant predictor.
Page 11 of 34
evaluating recidivism. By using both methods, the Commission is able to show the degree to whichthe CHC and SFS components predict recidivism and compare in their predictive capabilities.37
Survival analysis, also known as hazard modeling, is a method that can be used to evaluatethe predictive ability of risk assessment tools such as the CHC and SFS. Survival analysis measuresthe ability of criminal history to predict how rapidly offenders recidivate during the follow-upperiod. The concept of crimes committed per unit of time has its roots in the incapacitation38
literature, where great effort was expended to identify offenders who frequently committed crimes.These repeat offenders were individuals committing multiple crimes in a given period, such as daily,monthly, or yearly. By identifying frequent offenders, they could be targeted for longer prison termsthan offenders who commit crimes less frequently. Incapacitation literature argues that the selectivetargeting of frequent offenders would result in a more efficient use of prison resources as a meansof crime reduction. Appendix C provides further explanation of hazard modeling.
Measuring the area under the curve (AUC) is an established technique associated with39
receiver operating characteristic (ROC) curve analysis. The AUC statistic provides a probability thatan offender’s criminal history is able to predict recidivism. The AUC statistic ranges from a valueof 0.5 (indicating no ability to predict recidivism) to a value of 1.0 (indicating 100 percent accuracyin predicting recidivism). The greater the AUC, the better the predictive power of the measure beingtested. Appendix D provides further explanation of the AUC method.
The sections below use these methodological techniques to compare the predictive abilitiesof the CHC and the SFS respective components.
D. Predictive Power of the Models’ Elements
Exhibits 2 and 3 display proportional hazard model results for each CHC and SFS element,predicting days until the primary recidivism measure during the offenders’ first two years at risk inthe community.
Exhibit 2 presents on the proportional hazard results for CHC elements in predicting daysuntil the primary recidivism measure. Each of the first five elements (§§4A1.1(a)-(e)) makes anindependent and statistically significant contribution to predictive power. The exception is the40
sixth element §4A1.1(f) measuring the predictive power of a specific violent offense which did nototherwise receive criminal history points.
As seen in the Exhibit 3's column labeled “Pr > ChiSq,” the level of statistical significance for all but one SFS41
element is 0.0002 or lower, signifying high predictive strength.
In all the analyses, the SFS scale is reordered such that a high SFS score is positively associated with a high42
risk of recidivism.
Significantly different from 0.5 at p<0.05.43
Page 12 of 34
Exhibit 3 displays the comparable proportional hazard results for the elements of the SFS.Of the six items, all but one show statistical significance for an independent contribution to41
predictive power. Item B, measuring the incidence of prior commitment longer than 30 days, notonly lacks statistical significance, and further has an effect opposite to expectation. Its positive signsuggests that having commitments longer than 30 days decreases the offender’s probability ofrecidivism. It is possible that this logically inconsistent result is an artifact of Item B’s highcorrelation with Item C, which also measures prior commitments.
E. Comparison of Criminal History Computation and Salient Factor Score
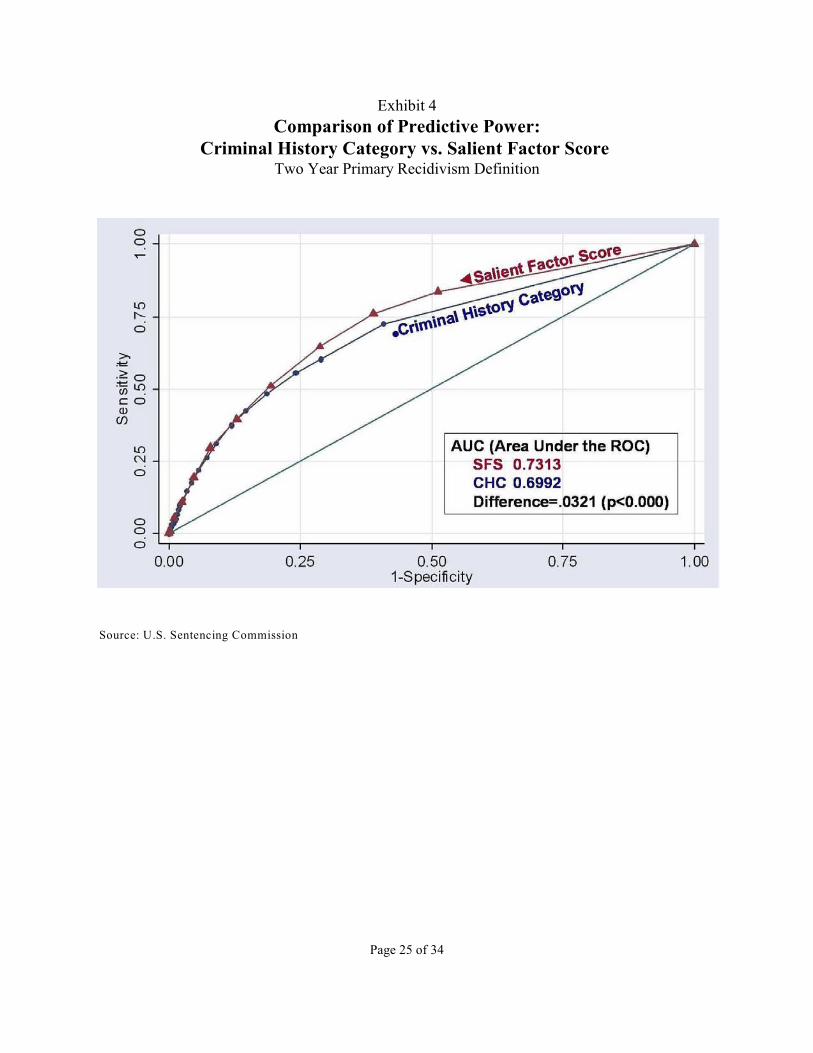
The AUC method is used to compare the predictive powers of the CHC and SFS.Exhibit 4 presents the ROC curves for the SFS and the CHC prediction of the primaryrecidivism measure. Also shown are results from tests for a statistically significant42
difference between the two areas. As displayed in Exhibit 4, the area for the SFS (0.7313), is largerthan that for the CHC (0.6992), a difference that is highly significant. 43
Overall, the SFS is a better predictor of recidivism than is the CHC.
The finding is consistent with the focus on prediction that underlies the SFS, and itssuccessful objective to maximize predictive accuracy. The next stage in the analysis seeks todetermine which separate elements of the SFS account for its higher predictive power over the CHC.This investigation examines how the predictive power of the SFS elements, both individually andin combination, compares to the predictive power of the associated CHC elements.
F. Comparison of Element-to-Element Formulations
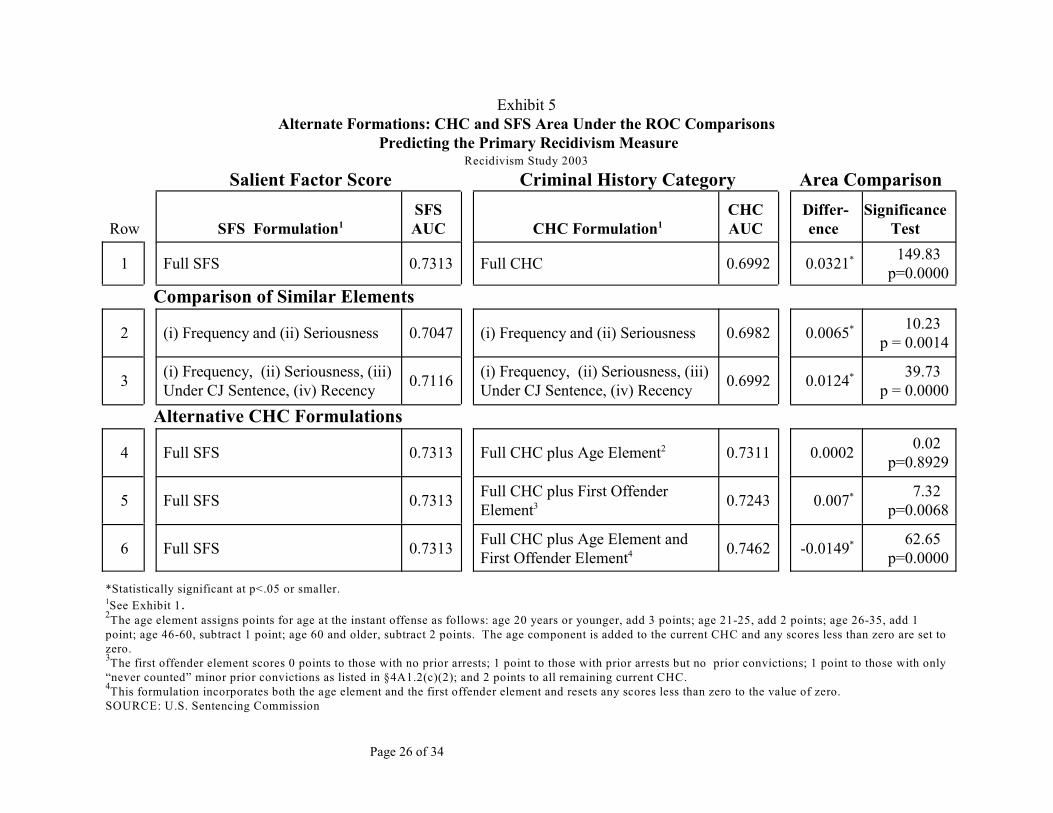
Both the CHC and SFS models contain measures that address frequency, seriousness,criminal justice sentence status, and recency. The comparative analyses belowexamine how the different operationalizations of these components affect their
relative prediction powers. The results of the AUC method appear in the rows of Exhibit 5. Toprovide a ready reference, the first row of Exhibit 5 displays the predictive power of the full CHCversus the full SFS model already documented and described above in Exhibit 4.
The AUC area difference in CHC versus SFS comparison is 0.0124 for the model combining solely the four44
elements of frequency, seriousness, recency, and under a criminal justice sentence.Page 13 of 34
1. Frequency and Seriousness Comparison.
The first reformulation involves a minimalist recidivism prediction model. Looking only atinformation on the frequency and seriousness of prior offending, the following comparison is made:
• the CHC elements for frequency and serious of prior offending(§§4A1.1(a)-(c) in Exhibit 1), and
• the SFS elements for frequency and serious of prior offending (Item A andB in Exhibit 1).
The second row of Exhibit 5 displays the results of this comparison. The AUC areadifference shrinks to a very small value (0.0065) which, although statistically significant (at the 0.05level), may have only small policy significance. This finding suggests that while the SFS measuresfor frequency and seriousness of prior offending provide statistically stronger predictions ofrecidivism, the magnitude of the predictive accuracy difference may not be meaningful for policydecision-making and its need to consider the practicality and efficiency of data collection.
2. Frequency, Seriousness, Under Sentence, and Recency Comparison.
The next comparison focuses on all four of the common elements of the CHC and SFS.These four common elements are: (i) the frequency of prior offending (as examined above); (ii) theseriousness of prior offending (as examined above); (iii) the status of the offender being under acriminal justice sentence at the time of the instant offense (CHC element §4A1.1(d) and SFS ItemE in Exhibit 1); and (iv) the recency of prior offending (CHC element §4A1.1(e) and SFS Item Din Exhibit 1).
The predictive power data for these four comparable elements appears in the third row ofExhibit 5. The AUC difference between the four-component CHC and SFS shrinks by about two-thirds, from 0.0321 to 0.0124. While this difference remains statistically significant (at the <0.01level) favoring the SFS, the smaller difference further questions the extent of its policy significance.
The results of both comparisons above highlight the predictive superiority of the SFSformulations of the four common recidivism prediction elements. However, the relatively smallmagnitude of this SFS advantage is noteworthy in the context of the full model comparison. The fullmodel comparison, showing the total benefit of the SFS, appears in row 1 of Exhibit 5. Recall thatin this head-to-head, full CHC versus full SFS all-element comparison, the difference in the AUCprediction areas is 0.0321. This difference — 0.0321 — in row 1 of Exhibit 5 is more than twiceas large as the area difference for the four-element comparison — 0.0124 — in row 3 of Exhibit 5.44
The major difference between the full and four-element models is the presence of offender age inthe full model comparison. Consequently, these findings suggest that the offender’s age is a
For this exercise, a CHC age component was created. Using age at the instant offense, the measure adds three45
points to the total CHC score if the offender was age 20 or younger; adds two points if the offender was age 21-25; adds
one point if the offender was age 26-35; makes no change if the offender was age 36-45; subtracts one point if the
offender was age 46-60, and subtracts two points if the offender was age 60 or older. Any resulting score less than zero
is reset to zero. It is not assumed that this is the most predictive age component that can be constructed but is offered
as an heuristic device to examine the predictive power of an age component in the CHC.
The predictive power of the CHC “first offender” component is documented in Maxfield et al., 2004b.46
The postulated first offender element applied in this analysis scores zero points to offenders with no prior47
arrests; one point to offenders with prior arrests but no prior convictions; one point to those only with “never counted”
minor prior convictions (as listed at §4A1.2(c)(2) and including hitchhiking, loitering, minor traffic infractions, public
intoxication, or vagrancy); or three points to all remaining current offenders. These points are added into the total sum
of criminal history points. It is not assumed that this is the most predictive nor desirable first offender element that can
be constructed. Instead, it is offered solely as an heuristic device to examine the predictive power of a first offender
component in the CHC. This particular formulation is based on the most predictive model explored in the recidivismseries’ report on first offender issues (Maxfield et al., 2004b) and incorporates any arrest that does not result in aconviction (or for which conviction status is unknown). Although arrests are highly predictive, their use raises potentiallegal and ethical issues in policy application.
Page 14 of 34
powerful component of recidivism prediction. This hypothesis motivates the next analyses whichtest the power of CHC elements for offender age and first offender status.
G. Predictive Power of Alternative CHC Formulations
These first steps in the USSC investigation to motivate more predictive, formulationsof the CHC are reported in the “Alternative CHC Formulation” section (rows 4, 5, and6) of Exhibit 5. In this analysis, the full SFS is compared to alternate formations of
the CHC which add an age component and/or a first offender component.
1. CHC with a Speculative Age Component
In row 4 of Exhibit 5, a speculative age component is added to the CHC. In the resulting45
comparison with the CHC, the AUC results demonstrate that the addition of an age element to theCHC diminishes the SFS predictive advantage. As presented in row 4, the AUC statistics for theCHC-with-age and the SFS show no statistical difference in recidivism prediction. The addition ofage to the CHC results in the two measures being equally accurate in the prediction of recidivism.This finding further accentuates the power of age as a factor in the prediction of recidivism.
2. CHC with a Speculative First Offender Status Component
Row 5 of Exhibit 5 compares the full SFS to the CHC with a speculative first offendercomponent. When a first offender element is added to the CHC, the difference in predictive46 47
power compared to the full SFS is decreased substantially: the difference in area is only 0.007.
Page 15 of 34
Nonetheless, this difference is still statistically significant (0.01 level), although of dubious policysignificance.
These data highlight the significance of a model that adapts for first offender status. Takenby itself, a CHC with an added first offender component would bring substantial recidivismprediction improvement by adjusting for offenders with extremely low levels of prior involvementwith the criminal justice system.
3. CHC with Speculative Component for Both Age and First Offender Status
Finally, in row 6 of Exhibit 5, the full SFS is compared to the reformulated CHC thatincludes both a speculative age component and first offender component. As displayed in row six,this alternate formation of the CHC surpasses the SFS in predictive power. The CHC with bothspeculative offender age and first offender components is significantly better at predictingrecidivism than is the full SFS.
H. Conclusion
The analyses above compare the recidivism risk prediction powers of the U.S.Sentencing Commission’s criminal history category (CHC) and the U.S. ParoleCommission’s Salient Factor Score (SFS). The SFS serves as a historical model for
the CHC, with many components derived from common concepts, although the actual measurementstrategies vary.
The predictive power comparisons reveal an array of contrasts between the two measures.First, both measures have components which did not contribute to prediction accuracy. For theCHC, the element that adds points for prior violent offenses otherwise uncounted did not havestatistical significance. For the SFS, the element that incorporates the number of prior commitmentsexceeding 30 days did not have statistical significance.
In their current formulations, the SFS is a statistically better recidivism risk predictioninstrument than is the CHC. The results suggest that, in large part, the greater predictive power ofthe SFS is due to its use of offender age as a predictive factor. Supporting this conclusion is theresult achieved when an age component is added to the CHC. With a speculative offender ageprovision, the modified CHC eliminates approximately two-thirds of the SFS prediction advantage.
Pursuing enhanced predictive power for the CHC, the analysis also considers a “firstoffender” criminal history element. A first offender adjustment would decrease the guideline’scriminal history score for offenders with minimal or no prior experience in the criminal justicesystem. The data indicate that a speculative first offender adjustment improves the predictive powerof the CHC, although to a lesser degree than observed with an offender age CHC element. However,the analysis suggests that, taken together and dependant upon the actual policies adopted, the
Apprendi v New Jersey, 120 S. Ct. 2348 (June 26, 2000). See also Blakely v Washington, 124 S. Ct. 253148
(June 24, 2004).
For example, USSG §4A1.2(c) describes the inclusion rules for misdemeanor and petty offenses.49
For example, §2L1.2 uses the offense of a prior conviction to determine the substantive Specific Offense50
Characteristic enhancement.Page 16 of 34
addition of both offender age and first offender components could serve to boost the CHC predictivepower statistically beyond that of the current SFS.
The comparisons of relative predictive power of the CHC and SFS provide interestingopportunities for analytical speculation. However, the comparison itself is detrimental if it obscuresthe more important goal of instrument revision and improvement both for prediction accuracy andfor application efficiency. Meticulous information collection by the probation officer is the basisfor both the CHC and SFS calculations. Efficient revisions to the methods are welcome if inaddition to providing appropriate prediction levels, they also either simplify the data collectionprocess or assist in its more accurate collection.
The CHC and SFS models share many predictive concepts. These include the frequency,seriousness, and recency of prior offenses, as well as the offender status under a criminal justicesentence. The presence of these shared concepts motivates areas of possible guideline simplification. For example, when the CHC and SFS formulations for frequency and seriousness alone are analyzed(as they are in results reported in row 2 of Exhibit 5), the SFS formulation is found to be statisticallymore predictive. The SFS has greater predictive power even though the SFS formulation is morecomputationally straightforward. The SFS procedure merely sums up the number of priorconvictions, and commitments exceeding 30 days. In contrast, the CHC formulation is morecomplex, requiring the classification of each prior conviction into one of three imposed sentencelength categories and the application of both mathematical addition and multiplication. The analysissuggests that not only can a reformulation of the CHC be simplified, but that simplified calculationscan additionally be more predictive.
The need for efficient revision of the guidelines CHC may soon become a mandate. TheApprendi v New Jersey Supreme Court decision states:
Other than the fact of a prior conviction, any fact that increases the penalty for acrime beyond the prescribed statutory maximum must be submitted to a jury, andproved beyond a reasonable doubt.48
The CHC uses several facets of the prior conviction to assign criminal history points. Theseattributes include the length of the imposed sentence for each prior offense and the relative timingbetween the instant offense and the prior offenses. Additionally, the nature of a prior offenseconviction determines criminal history point assignment for certain offenses, or offense level49
computation under certain substantive guidelines. If the Supreme Court finds that any of these50
Page 17 of 34
characteristics of prior offenses are beyond the “fact of a prior conviction,” several components ofthe current CHC will require modification. The approach of SFS Element A and its simple countof prior convictions provides a suggested alternative, and perhaps improved, formulation of a CHCrecidivism prediction measure.
While it may be tempting to proclaim broad conclusions from the results presented, theseconclusions do not suggest that use of the CHC be suspended, nor that it adopt the calculationprovisions of the SFS. However, the analysis does underscore that modifications to the current CHCcould simplify computation, enhance recidivism prediction, and contribute to a resolution ofemergent Apprendi constitutional issues. One of the benefits of the USSC recidivism data is theiravailability at this time both for development of a post-Blakely guideline system and for theempirical fine-tuning desired and foreseen by the original federal Sentencing Commission.
Page 18 of 34
References
Allison, Paul D. 1995 Survival Analysis Using the SAS System: A Practical Guide. Cary, North Carolina:
SAS Institute Inc.
Andrews, Don, and James L. Bonta. 1995 Level of Service Inventory-Revised (LSI-R). Toronto, Ontario: Multi-Health Systems
Inc.
Beck, Allen J. and Bernard E. Shipley 1989 Recidivism of Prisoners Released in 1983. Bureau of Justice Statistics Special
Report. Washington, D.C.: U.S. Department of Justice.
Betsey, Charles 1989 Future Plans for Research Memorandum, May 22. Washington, D.C.: U.S Sentencing
Commission.
Blumstein, Alfred and Jacqueline Cohen 1979 Deterrence and Incapacitation. Report of the National Academy of Sciences Panel on
Research on Deterrent and Incapacitative Effects. Washington, D.C.: National Academy Press.
Blumstein, Alfred, Jacqueline Cohen, Jeffrey A. Roth, and Christy A. Visher, editors. 1986 Criminal Careers and “Career Criminals.” Volume 1. Washington D.C.: National
Academy Press.
Brame, Robert, Raymond Paternoster, Paul Mazerolle, and Alex Piquero 1998 Testing for the Equality of Maximum-Likelihood Regression Coefficients Between
Two Independent Equations. Journal of Quantitative Criminology 14:245-261.
Copas, John B., Peter Marshall, and Roger Tarling 1996 Predicting Reoffending for Discretionary Conditional Release. HomeOffice
Research Study 150. London: Home Office.
Copas, John B., and Peter Marshall. 1998 The Offender Group Reconviction Scale: the Statistical Reconviction Score for Use
by Probation Officers. Journal of the Royal Statistical Society Series C-47:159-71.
Delong, E. R., D. M. Delong, and D. L. Clarke-Pearson 1988 Comparing the Areas under Two or More Correlated Receiver Operating Curves: A
Nonparametric Approach. Biometrics 44:837-845.
Page 19 of 34
Forst, Brian, William Rhodes, James Dimm, Arthur Gelman, and Barbara Mullin. 1982 Final Report of the Federal Career Criminal Research Project. Prepared for the
Federal Justice Research Program, U.S. Department of Justice, under contractNumber JYFRP-81-C-0126. Washington, D.C.: INSLAW, Inc. Available as anappendix to “Armed Robbery and Burglary Prevention Act: Hearing before theSubcommittee on Crime of the Committee on the Judiciary,” U.S. House ofRepresentatives, 97 Congress, Second Session, September 23, 1982. th
Greenwood, Peter W., with Allan Abrahamse 1982 Selective Incapacitation. Prepared for the National Institute of Justice, U.S.
Department of Justice, under Grant Number 79-NI-AX-0055. Santa Monica,California: The Rand Corporation.
Hanley, J. A. and B. J. McNeil 1982 The Meaning and Use of the Area under a Receiver Operating Characteristic (ROC)
Curve. Radiology 143:26-36.
1983 A Method of Comparing the Areas under Receiver Operating Characteristic Curves Derived from the Same Cases. Radiology 148:26-36.
Harer, Miles D. 1994 Recidivism Among Federal Prison Releasees in 1987: A Preliminary Report.
Washington, D.C.: U.S. Federal Bureau of Prisons, U.S. Department of Justice.
Henegan, Sharon 1999 Presentation in the Panel on Post-Release Supervision at the National Association of
Sentencing Commissions 1999 Annual Conference. Salt Lake City, Utah.
Hoffman, Peter B. 1994 Twenty Years of Operational Use of a Risk Prediction Instrument: The United States
Parole Commission’s Salient Factor Score. Journal of Criminal Justice, Vol. 22, No.6:477-494.
Hoffman, Peter B., and James Beck 1974 Parole Decision-Making: A Salient Factor Score. “Journal of Criminal Justice 2:195-
206.
1976 Salient Factor Score Validation - A 1972 Release Cohort. Journal of Criminal Justice4:69-76.
1985 Recidivism Among Released Federal Prisoners. Criminal Justice and Deviant
Behavior 2(4):501-507
1997 The Origin of The Federal Criminal History Score. Federal Sentencing Reporter 9(4):192-197.
Page 20 of 34
Hosmer, David W. Jr. and Stanley Lemeshow 1999 Applied Survival Analysis: Regression Modeling of Time to Event Data. New York:
Wiley.
Janus, Michael G. 1985 Selective Incapacitation: Have We Tried It? Does It Work? Journal of Criminal
Justice 13:117-129.
Jones, Mark and Barbara Sims 1997 Recidivism of Offenders Released from Prison in North Carolina: A Gender
Comparison. The Prison Journal 77:335-348.
Klein, John P. and Malvin L. Moeschberger 1997 Survival Analysis: Techniques for Censored and Truncated Data. New York, New
York: Springer.
Langan, Patrick A. and David J. Levin 2002 Recidivism of Prisoners Released in 1994. Bureaus of Justice Statistics Special
Report. Washington D.C.: U. S. Department of Justice.
Maxfield, Linda Drazga, Miles Harer, Tim Drisko, Christine Kitchens, and Sara Meacham. 2004a Measuring Recidivism: The Criminal History Computation of the Federal Guidelines.
Release 1 in the Recidivism Research Series. Washington D.C.: U.S. SentencingCommission.
2004b Recidivism and the First Offender. Release 2 in the Recidivism Research Series. Washington D.C.: U.S. Sentencing Commission.
Maltz, Michael D. 1984 Recidivism. Orlando, Florida: Academic Press.
Quinsey, Vernon L., Grant T. Harris, Marnie E. Rice, Catherine A. Cormier 1998 Violent Offenders: Appraising and Managing Risk. Washington, D.C.: American
Psychological Association.
Roberts, Julian V. and Loretta Stalans 1997 Public Opinion, Crime and Criminal Justice. Boulder, Colorado: Westview Press.
Schmidt, Annesley K., and Joel H. Garner 1991 Recidivism of Federal Prisoners Released in 1978: A Five Year Follow-Up (Draft
report dated March 6). Washington, D.C. : U.S. Sentencing Commission.
Page 21 of 34
Schmidt, Peter and Ann Dryden Witte 1988 Predicting Recidivism Using Survival Models. New York: Springer-Verlag. Sphon, Cassia and David Holleran 2002 The Effect of Imprisonment on Recidivism Rates of Felony Offenders: A Focus on
Drug Offenders. Criminology 40:329-357.
Swenson, Win 1990 Future Commission Tasks Memo (April 25). Washington, D.C.: U.S. Sentencing
Commission.
Swets, John A., Robyn M. Dawes, and John Monahan 2000 Better Decisions Through Science. Scientific American 283:82-87.
U.S. Parole Commission 2003a History of the Federal Parole Commission (May). Washington, D.C.: U.S. Parole
Commission. Available at http://www.usdoj.gov/uspc/history.htm
2003b Rules and Procedures Manual (August 15). Washington, D.C.: U.S. ParoleCommission. Available at http://www.usdoj.gov/uspc/rules_procedures/uspcmanual8-15-03final.pdf
U.S. Sentencing Commission 2004 Guidelines Manual (November). Washington, D.C.: U.S. Sentencing Commission.
2003 Variable Codebook: Criminal History and Recidivism Study: Data Collection fromPSR. Washington, D.C.: U.S. Sentencing Commission.
1987 Supplemental Report on the Initial Sentencing Guidelines and Policy Statements(June 18). Washington, D.C.: U.S. Sentencing Commission.
Wilkins, William Jr. 1990 Letter to Congressman Schumer Regarding Commission Projects (March 16).
Washington, D.C.: U.S. Sentencing Commission.
Page 22 of 34
Exhibit 1
Comparison of Elements in the Criminal History Computation and the Salient Factor Score
Criminal HistoryComputation(U.S. Sentencing
Commission)
Salient FactorScore SFS98
(U.S. Parole
Commission)
Elements
iFrequency of PriorOffending
Count of prior
convictions (§§4A1.1(a),(b),(c))
Count of priorcommitments
(up to four)(Item A)
ii Seriousness of PriorOffending
Individual imposedsentence lengths of prior
convictions (§§4A1.1(a), (b), (c))
Count of priorcommitments of 30 days or more
(up to three) (Item B)
iii Under Criminal JusticeSentence at InstantOffense
Instant offensecommitted while undersentence or supervision
(§4A1.1(d))
Instant offensecommitted while undersentence or supervision
(Item E)
iv Recency of PriorOffending
Two years since releasefrom 60 days or moredays’ prison imposed
(§4A1.1(e))
Three years since lastrelease from 30 days or
more commitment(Item D)
v Violent PriorsWithout Points
Related violentconvictions not receiving
points(§4A1.1(f))
—
vi Age—
Age at instant offenseand priors
(Item C);
Over age 41at instant offense
(Item F)
Source: U.S. Sentencing Commission.
Page 23 of 34
Exhibit 2
Criminal History Score Elements:Predicting Days Until Primary Recidivism
Element1
ParameterEstimate
StandardError
Chi-Square
Pr >ChiSq
HazardRatio
i, ii Number of Priorswith One Point
(§4A1.1(c))
0.25539 0.01145 497.7580 <.0001* 1.291
i, ii Number of Priorswith Two Points
(§4A1.1(b)) 0.04920 0.00651 57.0525 <.0001* 1.050
i, ii Number of Priorswith Three Points
(§4A1.1(a)) 0.04934 0.00410 144.7873 <.0001* 1.051
iii Under CriminalJustice Sentence
(§4A1.1(d))
0.17359 0.01666 108.5080 <.0001* 1.190
iv Recency of Priors (§4A1.1(e))
0.42601 0.02865 221.1488 <.0001* 1.531
v Violent PriorsWithout Points
(§4A1.1(f))
-8.56552 56.20198 0.0232 <0.8789 0.000
Likelihood Ratio Chi-Square 2114.3817 ( p = <.0001)
*Statistically significant at p<.05 or smaller.
See Exhibit 11
Source: U.S. Sentencing Commission
Page 24 of 34
Exhibit 3
Salient Factor Score (SFS 98):Predicting Days Until Primary Recidivism
Element1
ParameterEstimate
StandardError
Chi-Square
Pr >ChiSq
HazardRatio
i, ii Number of Priors(Item A)
-0.42982 0.01588 732.4484 <.0001* 0.651
i, ii Number ofPriors >30 days
(Item B)
0.01925 0.03134 0.3772 <.5391 1.019
iii Under CriminalJustice Sentence
(Item E)
-0.13032 0.03440 14.3486 <.0002* 0.878
iv Recency of Priors(Item D)
-0.33606 0.04536 54.8988 <.0001* 0.715
vi Age At InstantOffense and Priors
(Item C)
-0.31103 0.01478 442.6309 <.0001* 0.733
vi Over Age 41 atInstant Offense
(Item F)
-0.38346 0.04784 64.2358 <.0001* 0.681
Likelihood Ratio Chi-Square 2912.2049 (p = <0.0001)
*Statistically significant at p<.05 or smaller.
See Exhibit 11
Source: U.S. Sentencing Commission
Page 25 of 34
Exhibit 4
Comparison of Predictive Power:Criminal History Category vs. Salient Factor Score
Two Year Primary Recidivism Definition
Source: U.S. Sentencing Commission
Page 26 of 34
Exhibit 5Alternate Formations: CHC and SFS Area Under the ROC Comparisons
Predicting the Primary Recidivism MeasureRecidivism Study 2003
Salient Factor Score Criminal History Category Area Comparison
Row SFS Formulation1
SFSAUC CHC Formulation1
CHCAUC
Differ-ence
SignificanceTest
1 Full SFS 0.7313 Full CHC 0.6992 0.0321* 149.83 p=0.0000
Comparison of Similar Elements
2 (i) Frequency and (ii) Seriousness 0.7047 (i) Frequency and (ii) Seriousness 0.6982 0.0065* 10.23 p = 0.0014
3(i) Frequency, (ii) Seriousness, (iii)Under CJ Sentence, (iv) Recency
0.7116(i) Frequency, (ii) Seriousness, (iii)Under CJ Sentence, (iv) Recency
0.6992 0.0124* 39.73 p = 0.0000
Alternative CHC Formulations
4 Full SFS 0.7313 Full CHC plus Age Element 0.7311 0.00022 0.02 p=0.8929
5 Full SFS 0.7313Full CHC plus First OffenderElement3 0.7243 0.007* 7.32
p=0.0068
6 Full SFS 0.7313Full CHC plus Age Element andFirst Offender Element4 0.7462 -0.0149* 62.65
p=0.0000
*Statistically significant at p<.05 or smaller.
See Exhibit 1.1
The age element assigns points for age at the instant offense as follows: age 20 years or younger, add 3 points; age 21-25, add 2 points; age 26-35, add 12
point; age 46-60, subtract 1 point; age 60 and older, subtract 2 points. The age component is added to the current CHC and any scores less than zero are set tozero. The first offender element scores 0 points to those with no prior arrests; 1 point to those with prior arrests but no prior convictions; 1 point to those with only
3
“never counted” minor prior convictions as listed in §4A1.2(c)(2); and 2 points to all remaining current CHC. This formulation incorporates both the age element and the first offender element and resets any scores less than zero to the value of zero.
4
SOURCE: U.S. Sentencing Commission

Page 27 of 34
Appendix A
Criminal History Worksheet
Defendant______________________________________Docket Number_____________________________________
Enter the Date Defendant Commenced Participation in Instant Offense (Earliest Date of Relevant Conduct)____________________
1. 3 Points for each prior ADULT sentence of imprisonment EXCEEDING ONE YEAR AND ONE MONTH imposed within 15YEARS of the defendant's commencement of the instant offense OR resulting in incarceration during any part of that 15-YEARperiod. (See §§4A1.1(a) and 4A1.2.)
2. 2 Points for each prior sentence of imprisonment of AT LEAST 60 DAYS resulting from an offense committed ON OR AFTER thedefendant's 18th birthday not counted under §4A1.1(a) imposed within 10 YEARS of the instant offense; and
2 Points for each prior sentence of imprisonment of AT LEAST 60 DAYS resulting from an offense committed BEFORE thedefendant's 18th birthday not counted under §4A1.1(a) from which the defendant was released from confinement within 5 YEARS ofthe instant offense. (See §§4A1.1(b) and 4A1.2.)
3. 1 Point for each prior sentence resulting from an offense committed ON OR AFTER the defendant's 18th birthday not counted under§4A1.1(a) or §4A1.1(b) imposed within 10 YEARS of the instant offense; and
1 Point for each prior sentence resulting from an offense committed BEFORE the defendant's 18th birthday not counted under§4A1.1(a) or §4A1.1(b) imposed within 5 YEARS of the instant offense. (See §§4A1.1(c) and 4A1.2.)
NOTE: A maximum sum of 4 Points may be given for the prior sentences in Item 3.
Date of Offense Sentence Release Guideline CriminalImposition Date Section History Pts.**
Indicate with an asterisk those offenses where defendant was sentenced as a juvenile.*
A release date is required in only three instances:**
a. When a sentence covered under §4A1.1(a) was imposed more than 15 years prior to the commencement of theinstant offense but release from incarceration occurred within such 15-year period;
b. When a sentence counted under §4A1.1(b) was imposed for an offense committed prior to age 18 and more than5 years prior to the commencement of the instant offense, but release from incarceration occurred within such 5-year period; and
c. When §4A1.1(e) applies because the defendant was released from custody on a sentence counted under 4A1.1(a)or 4A1.1 (b) within 2 years of the instant offense or was still in custody on such a sentence at the time of theinstant offense (see Item 6).
4. Sum of Criminal History Points for prior sentences under §§4A1.1(a), 4A1.1(b), and 4A1.1(c) (Items 1,2,3).

Page 28 of 34
Appendix A (continued)
Defendant______________________________________ Docket Number_____________________________
5. 2 Points if the defendant committed the instant offense while under any criminal justice sentence (e.g.,probation, parole, supervised release, imprisonment, work release, escape status). (See §§4A1.1(d) and 4A1.2.) List the type of control and identify the sentence from which control resulted. Otherwise, enter 0 Points.
6. 2 Points if the defendant committed the instant offense LESS THAN 2 YEARS after release fromimprisonment on a sentence counted under §4A1.1(a) or (b), or while in imprisonment or escape status on sucha sentence. However, enter only 1 Point for this item if 2 points were added at Item 5 under §4A1.1(d). (See§§4A1.1(e) and 4A1.2.) List the date of release and identify the sentence from which release resulted. Otherwise, enter 0 Points.
7. 1 Point for each prior sentence resulting from a conviction of a crime of violence that did not receive any pointsunder §4A1.1(a), (b), or (c) because such sentence was considered related to another sentence resulting from aconviction of a crime of violence. Provided, that this item does not apply where the sentences are consideredrelated because the offenses occurred on the same occasion. (See §§4A1.1(f) and 4A1.2.) Identify the crimesof violence and briefly explain why the cases are considered related. Otherwise, enter 0 Points.
Note: A maximum sum of 3 Points may be given for Item 7.
8. Total Criminal History Points (Sum of Items 4-7)
9. Criminal History Category (Enter here and on Worksheet D, Item 4)
Total Points Criminal History Category
0-1 I
2-3 II
4-6 III
7-9 IV
10-12 V
13 or more VI

Page 29 of 34
Appendix B
Salient Factor Score (SFS 98)
Item A. PRIOR CONVICTIONS/ADJUDICATIONS (ADULT/JUVENILE) ...................................... _____
None = 3; One = 2; Two or three = 1; Four or more = 0
Item B. PRIOR COMMITMENT(S) OF MORE THAN 30 DAYS (ADULT/JUVENILE) .................. _____
None = 2; One or two = 1; Three or more = 0
Item C. AGE AT CURRENT OFFENSE/PRIOR COMMITMENTS ................................................... _____
26 years or more Three or fewer prior commitments = 3
Four prior commitments = 2
Five or more commitments = 1
22-25 years Three or fewer prior commitments = 2
Four prior commitments = 1
Five or more commitments = 0
20-21 years Three or fewer prior commitments = 1
Four prior commitments = 0
19 years or less Any number of prior commitments = 0
Item D. RECENT COMMITMENT FREE PERIOD (THREE YEARS)............................................... _____
No prior commitment of more than 30 days (adult or juvenile) or released to
the community from last such commitment at least 3 years prior to the
commencement of the current offense = 1; Otherwise = 0
Item E. PROBATION/PAROLE/CONFINEMENT/ESCAPE STATUS VIOLATOR THIS TIME... _____
Neither on probation, parole, confinement, or escape status at the time of the
current offense; nor committed as a probation, parole, confinement, or escape
status violator this time = 1; Otherwise = 0
Item F. OLDER OFFENDERS........................................................................................................... _____
If the offender was 41 years of age or more at the commencement of the current
offense (and the total score from Items A - F above is 9 or less) = 1; Otherwise = 0
TOTAL SCORE..................................................................................................................................... _____
Allison, 1995; Hosmer and Lemeshow, 1999; Klein and Moeschberger, 1997.51
Page 30 of 34
Appendix C
Evaluating Predictive Power with Survival Analysis
Survival analysis, also called hazard rate analysis, is a method that can be used toevaluate the predictive ability of the guidelines’ criminal history measure. Survivalanalysis measures the ability of criminal history to predict how rapidly offenders
recidivate during the follow-up period. The concept of crimes committed per unit of time has its51
roots in the incapacitation literature, where great effort was expended to identify offenders whocommitted crimes frequently. These repeat offenders were individuals committing multiple crimesin a given period, such as daily, monthly, or yearly. By identifying frequent offenders, they couldbe targeted for longer prison terms than offenders who commit crimes less frequently. Incapacitationliterature argues that the selective targeting of frequent offenders would result in a more efficient useof prison resources as a means of crime reduction.
Survival analysis is used here to examine how well criminal history predicts the numberof crimes offenders will commit during a specific follow-up period. The example below illustratesits strengths.
Assume a researcher has recidivism data for 200 offenders who were released from prisonall on the same day. Assume that all 200 offenders recidivate during the first two years back in thecommunity.
• The first 100 of the offenders all recidivate on the last day of the twoyear follow-up, the 730 day. Thus, 100 crimes were committed onth
day 730. The daily rate of crime for this group is 100 crimes dividedby 730 days, or 0.1370 offenses per day.
• The second 100 of these offenders all recidivate on the first day of thefollow-up period. Thus, 100 crimes were committed on day one. Thedaily rate of crime for this group is 100 crimes divided by one day, or100 offenses per day.
These two groups have different speeds of offending. Within 730 days, the first group isexpected to commit 100 crimes. During the same 730 day period, however, the second group isexpected to commit 73,000 crimes (assuming, of course, that none are apprehended).
Although an extreme example, it illustrates the concern of crime control advocates withrespect to their goal of protecting the public. This approach argues that criminal history must havethe predictive power to identify offenders who pose a greater risk to public. Survival analysis allowsfor this evaluation of the prior criminal history measures.
AUC denotes the Area Under the Curve analysis from the ROC curve, described in Appendix D.52
Companion reports in the recidivism project series perform these analyses such as, whether the guideline53
provision of “recency points” (§4A1.1(e)) adds significantly to predictive power over and above other criminal historycomponents.
Page 31 of 34
Survival analysis and the AUC provide different perspectives on recidivism risk. The52
AUC measures how well prior criminal history predicts whether offenders recidivate or not duringa fixed follow-up period. Given the 100 percent rate of recidivism for both groups in the example,the AUC would be identical when using criminal history to predict recidivism separately for eachgroup of offenders. The AUC is not sensitive to the speed at which offenders recidivate andtherefore, does not gauge how well criminal history predicts the frequency of re-offending.
In contrast, survival models are sensitive to the speed of recidivism and therefore providea way to test how well criminal history measures this important aspect of re-offending risk. Thesurvival curves in Exhibit 5 show, from a survival analysis perspective, the rapidity of recidivismfor each day of the two year follow-up period, for each of the six CHCs (I through VI). Offendersin CHCs V and VI recidivate most rapidly and therefore if not apprehended, are likely to offend morefrequently during the two year follow-up period than are offenders in CHC I.
Survival analysis has another advantage over the AUC when used to evaluate criminalhistory’s ability to predict recidivism. Multiple regression methods for survival analysis have beendeveloped that allow simultaneous evaluation of the independent contribution to predictive powerof the various criminal history components. The proportional hazard model estimates whether the53
independent variables contribute uniquely when predicting the rapidity of recidivism.
This is a simplified explanation. For the sake of clarity, additional issues involving “true negatives” and54
“false negatives” are not considered.
On the graph, the false positive rate is plotted along the x axis and the true positive rate (called the55
“sensitivity”) is plotted along the y axis. The false positive rate is defined as 1 minus the specificity.Page 32 of 34
Appendix D
Evaluating Predictive Power with theArea Under the Receiver Operating Characteristic Curve
Determining the area under a specific geometric curve is an established technique formeasuring the predictive power of a measurement instrument. This technique is wellestablished in diagnostic testing for health disorders when a procedure is used to
determine the presence of a disease. If the diagnostic test accurately predicts the presence of thedisease, this is a “true positive” result. However, the researcher must also know how often adiagnostic test indicates that a disease is present when in fact the disease is not present. This typeof prediction error is called a “false positive” result. The best prediction tool maximizes truepositives and minimizes false positives. The technique that analyzes predictive accuracy uses a54
graph that maps the “true positive” rate against the “false positive” rate. The curve of this graph iscalled a receiver operating characteristic (ROC) curve. The area under the curve provides a measureof the predictive power of the prediction instrument. The paragraphs below illustrate how thistechnique is used.
ROC analysis is a straightforward application of this technique to recidivism research. Herethe measurement instrument is the offender’s prior criminal history. For this example, assume thatthe instrument measures criminal history points. The points are used to predict recidivism. Theanalysis must show how often the measure of criminal history points accurately predicts recidivism,compared to how often the measure of criminal history points predicts recidivism incorrectly.
Graphically, the data are shown in a rectangular box with the area being one unit, as shownin the figure below. A diagonal line is drawn from the lower left to the upper right corners, bisectingthe rectangle into two equal parts. The area below the diagonal line measures one half the area ofthe box (i.e., 0.5 units) and represents “random” prediction, or no predictive power at all. Anyobservation along the diagonal line is equally likely to be a true positive or a false positive. Thisline, and the area of the rectangle below it, is the comparison point for the recidivism model.
When the observed true positive and false positive recidivism data are plotted in thisrectangular box, they form a line that curves upward from the diagonal line. This curved line is the55
ROC curve. The higher the ROC line curves above the diagonal line (and toward the top and leftside of the rectangle), the greater the area under its curve. The area under the ROC curve representsthe predictive power of the criminal history model. Because the ROC curve is higher than thediagonal line, the area under the ROC curve is greater than the area under the diagonal line. Thus,as represented in the figure, the ROC curve improves upon random chance prediction.
Page 33 of 34
The statistic used to measure the predictive power of the criminal history model is the“AUC”: the Area Under the Curve. The greater the AUC, the better the predictive power of themeasurement instrument.
The AUC has several desirable qualities as a prediction power gauge. First, and in thecontext of prior criminal history predicting recidivism, the AUC is interpreted as the probability thata randomly chosen known recidivist will have more prior criminal history than a randomly chosenknown non-recidivist. Therefore, the AUC ranges from 0.5 to 1.0.
• With an AUC of 0.5, a randomly chosen known recidivist has a 50 percentchance of having more prior criminal history than a randomly chosen non-recidivist. This would mean that there is no relationship between recidivismand prior criminal history.
• With an AUC of 1.0, 100 percent of the randomly chosen recidivists willhave more prior criminal history than the randomly chosen non-recidivists,meaning that prior criminal history predicts recidivism perfectly. With anAUC of 1.0, all recidivists would have more prior criminal history than allnon-recidivists.
AUCs between 0.5 and 1.0 indicate a “better than random” predictive accuracy, but a “lessthan perfect” predictive accuracy. For the hypothetical example appearing in the figure above, theAUC of 0.67 indicates that 67 out of 100 times, randomly chosen recidivists and non-recidivists arecompared, a recidivist would have more prior criminal history than a non-recidivist. This indicatesthat while the extent of prior criminal history is a strong predictor of recidivism, it is not a perfectpredictor. The predictive power of a criminal history measure might be improved by adding or
The introductory comments of USSG Ch.4, Pt. A states that “while empirical research has shown that other56
factors are correlated highly with the likelihood of recidivism, e.g., age and drug abuse, for policy reasons they werenot included here at this time.”
Hanley and McNeil, 1982; Hanley and McNeil, 1983, Delong, Delong, and Clarke-Pearson, 1988. The ability57
to compare different criminal history models makes AUC an important tool in assessing impacts of changes to theguidelines’ Chapter Four provisions.
Page 34 of 34
changing its components. However, both legal and policy factors guide the types of characteristicsthat can be part of a prediction model.56
The AUC statistic has three additional desirable properties. It is insensitive to the base rateof recidivism. It can be used across multiple prediction instruments to compare statisticallysignificant predictive power differences. Finally, the AUC can be graphically represented allowing57
visual comparisons among multiple curves calculated from different prediction instruments.