Embed Size (px)
Citation preview

2011
A Comparison of the 2011 Census and 2011 SAPF for Hampshire
_______
Published July 2012

Summary A comparison between the 2011 Census results and 2011 Small Area Population Forecasts (SAPF) shows: In Hampshire overall, the SAPF estimates were 1.2 % different to the 2011
Census results. In Hampshire County the difference was smaller at 1.1 %. SAPF underestimated the total population of Hampshire in 2011 by 22,000
people. Most variation between the 2011 Census and 2011 SAPF was in the young adult
and older age groups. SAPF estimated there to be a larger number of people aged 85 and over in all of
Hampshire’s districts than the 2011 Census found there were.

Introduction
The aim of this report is to highlight the similarities and differences between the 2011 Census results and Hampshire County Council’s 2011-based Small Area Population Forecasts (SAPF). The Census is conducted every ten years. In-between censuses it is necessary to rely on other data sources for annual estimates of the population. The release of the 2011 Census results provides an opportunity to assess the accuracy of these estimates. This report compares the first release 2011 Census county and district results with Hampshire County Council’s 2011-based Small Area Population Forecasts. The forecasts provide estimates of the population of Hampshire from 2011-2018 and are available for all districts down to ward level broken down by age and gender. The first release of the 2011 Census results can be found at the following location: www.hants.gov.uk/census2011 SAPF data can be found at the following location: http://www3.hants.gov.uk/planning/factsandfigures/population-statistics/small-area-pop-stats.htm The first release of the 2011 Census results are limited to population estimates by five year age bands for local authorities, together with household estimates and estimates of short term migrants. More detailed results for lower geographic areas are expected in further releases, from November 2012. Once more detailed 2011 Census results are published, they will be compared with SAPF at lower geographic areas, to try to further understand the differences and similarities. The findings of this report will be used to validate the quality of the SAPF model and to explore potential improvements, once more detailed 2011 Census data is released.

Population Totals Table 1: Population Totals, Number and Percentage Difference between 2011 Census
and 2011 SAPF
Area
2011 Census Population
Totals
2011 SAPF Population
Totals Number
Difference Percentage Difference
Portsmouth 205,100 199,644 -5,456 -2.66 Southampton 236,900 235,329 -1,571 -0.66 Southampton (Alternative SAPF) 236,900 238,763 1,863 0.79 Basingstoke and Deane 167,800 167,291 -509 -0.30 East Hampshire 115,600 113,166 -2,434 -2.11 Eastleigh 125,200 123,447 -1,753 -1.40 Fareham 111,600 111,253 -347 -0.31 Gosport 82,600 80,128 -2,472 -2.99 Hart 91,000 88,692 -2,308 -2.54 Havant 120,700 116,700 -4,000 -3.31 New Forest 176,500 174,372 -2,128 -1.21 Rushmoor 93,800 96,745 2,945 3.14 Test Valley 116,400 114,058 -2,342 -2.01 Winchester 116,600 117,134 534 0.46 Hampshire County 1,317,800 1,302,986 -14,814 -1.12
Hampshire including Portsmouth and Southampton 1,759,800 1,737,959 -21,841 -1.24
SAPF estimated there to be fewer people in Hampshire and Hampshire County than the 2011 Census found there were with a percentage difference of just over 1 % between the two sources. At district level, the largest number difference is 5,460 in Portsmouth, whilst the smallest is 350 in Fareham. Percentage wise, for four districts the difference between 2011 Census and SAPF is marginal at less than 1 %. A slightly larger difference is seen in Havant and Rushmoor (over 3 %). Alternative SAPF figures were carried out for Southampton that incorporate different input data to that used in the main set of SAPF estimates. The main Southampton SAPF figure and the Alternative figure fall either side of the 2011 Census figure. The following sections analyse the differences and similarities for Hampshire, Hampshire County, and each district.

Hampshire (including Portsmouth and Southampton)
Table 2: Hampshire including Portsmouth and Southampton: Number and Percentage Difference between 2011 Census and 2011 SAPF
Age Group 2011 Census
2011 SAPF
Number Difference
Percentage Difference
0 ‒ 4 106,200 107,957 1,757 1.65 5 ‒ 9 96,100 98,051 1,951 2.03 10 ‒ 14 101,300 99,734 -1,566 -1.55 15 ‒ 19 113,900 114,338 438 0.38 20 ‒ 24 123,500 123,712 212 0.17 25 ‒ 29 109,900 105,509 -4,391 -4.00 30 ‒ 34 106,500 101,846 -4,654 -4.37 35 ‒ 39 115,700 113,252 -2,448 -2.12 40 ‒ 44 127,400 125,865 -1,535 -1.20 45 ‒ 49 132,500 127,701 -4,799 -3.62 50 ‒ 54 116,300 112,470 -3,830 -3.29 55 ‒ 59 99,800 98,263 -1,537 -1.54 60 ‒ 64 108,800 104,851 -3,949 -3.63 65 ‒ 69 86,900 84,056 -2,844 -3.27 70 ‒ 74 69,300 68,055 -1,245 -1.80 75 ‒ 79 57,600 57,376 -224 -0.39 80 ‒ 84 44,500 45,777 1,277 2.87 85+ 43,300 49,142 5,842 13.49 Total Population 1,759,800 1,737,959 -21,841 -1.24

Figure 2a: Female Population in Five Year Age Groups, 2011 Census and 2011 SAPF, Hampshire including Portsmouth and Southampton
0
10,000
20,000
30,000
40,000
50,000
60,000
70,000
Aged0-4
Aged5-9
Aged10-14
Aged15-19
Aged20-24
Aged25-29
Aged30-34
Aged35-39
Aged40-44
Aged45-49
Aged50-54
Aged55-59
Aged60-64
Aged65-69
Aged70-74
Aged75-79
Aged80-84
Aged85+
2011 Census2011 SAPF
Figure 1b: Male Population in Five Year Age Groups, 2011 Census and 2011 SAPF,
Hampshire including Portsmouth and Southampton
0
10,000
20,000
30,000
40,000
50,000
60,000
70,000
Aged0-4
Aged5-9
Aged10-14
Aged15-19
Aged20-24
Aged25-29
Aged30-34
Aged35-39
Aged40-44
Aged45-49
Aged50-54
Aged55-59
Aged60-64
Aged65-69
Aged70-74
Aged75-79
Aged80-84
Aged85+
2011 Census2011 SAPF
Table 2 and Figures 1a and b show that SAPF estimated there to be a larger number of males and females in the youngest and oldest age groups (0-9 and 80 and over). In the

majority of other age groups, the 2011 Census contained a larger number of people. The figures for females aged in their 20s and 30s have the largest percentage difference where SAPF estimated fewer numbers (25-29 age group has 6.5 % fewer females in SAPF than Census), whilst males aged 85 and over has the largest percentage difference where SAPF estimated higher numbers (16.5 %). Hampshire County
Table 3: Hampshire County: Number and Percentage Difference between 2011 Census and 2011 SAPF
Age Group 2011 Census
2011 SAPF
Number Difference
Percentage Difference
0 ‒ 4 77,300 78,485 1,185 1.53 5 ‒ 9 73,300 75,315 2,015 2.75 10 ‒ 14 78,900 78,210 -690 -0.87 15 ‒ 19 80,000 83,176 3,176 3.97 20 ‒ 24 71,300 74,317 3,017 4.23 25 ‒ 29 71,100 71,988 888 1.25 30 ‒ 34 74,000 72,294 -1,706 -2.31 35 ‒ 39 86,600 84,412 -2,188 -2.53 40 ‒ 44 98,500 97,184 -1,316 -1.34 45 ‒ 49 103,900 99,995 -3,905 -3.76 50 ‒ 54 91,700 88,773 -2,927 -3.19 55 ‒ 59 79,700 77,704 -1,996 -2.50 60 ‒ 64 88,100 83,047 -5,053 -5.74 65 ‒ 69 70,600 65,988 -4,612 -6.53 70 ‒ 74 56,300 53,409 -2,891 -5.13 75 ‒ 79 46,500 45,020 -1,480 -3.18 80 ‒ 84 35,700 35,649 -51 -0.14 85+ 34,200 38,017 3,817 11.16 Total Population 1,317,800 1,302,986 -14,814 -1.12

Figure 2a: Female Population in Five Year Age Groups, 2011 Census and 2011 SAPF, Hampshire County
0
10,000
20,000
30,000
40,000
50,000
60,000
Aged0-4
Aged5-9
Aged10-14
Aged15-19
Aged20-24
Aged25-29
Aged30-34
Aged35-39
Aged40-44
Aged45-49
Aged50-54
Aged55-59
Aged60-64
Aged65-69
Aged70-74
Aged75-79
Aged80-84
Aged85+
2011 Census2011 SAPF
Figure 2b: Male Population in Five Year Age Groups, 2011 Census and 2011 SAPF,
Hampshire County
0
10,000
20,000
30,000
40,000
50,000
60,000
Aged0-4
Aged5-9
Aged10-14
Aged15-19
Aged20-24
Aged25-29
Aged30-34
Aged35-39
Aged40-44
Aged45-49
Aged50-54
Aged55-59
Aged60-64
Aged65-69
Aged70-74
Aged75-79
Aged80-84
Aged85+
2011 Census2011 SAPF
Table 3 and Figures 2a and b show that SAPF estimated there to be a larger number of males and females in the majority of age groups up to 29 years and in the oldest age

group (85 and over). In the majority of other age groups, the 2011 Census contained a larger number of people. The figures for males aged in their 60s and 70s have the largest percentage difference where SAPF estimated fewer numbers (65-69 age group has 6.8 % fewer females in SAPF than Census), whilst males aged 85 and over has the largest percentage difference where SAPF estimated higher numbers (14 %). Portsmouth Table 4: Portsmouth: Number and Percentage Difference between 2011 Census and
2011 SAPF
Age Group 2011 Census
2011 SAPF
Number Difference
Percentage Difference
0 ‒ 4 13,500 13,316 -184 -1.36 5 ‒ 9 11,000 10,659 -341 -3.10 10 ‒ 14 10,900 10,299 -601 -5.51 15 ‒ 19 16,000 14,009 -1,991 -12.44 20 ‒ 24 22,800 19,151 -3,649 -16.00 25 ‒ 29 17,000 14,902 -2,098 -12.34 30 ‒ 34 13,900 13,946 46 0.33 35 ‒ 39 13,400 13,823 423 3.16 40 ‒ 44 14,300 13,828 -472 -3.30 45 ‒ 49 13,800 13,267 -533 -3.86 50 ‒ 54 11,900 11,200 -700 -5.88 55 ‒ 59 9,300 9,340 40 0.43 60 ‒ 64 9,800 10,172 372 3.80 65 ‒ 69 7,700 8,518 818 10.62 70 ‒ 74 6,200 7,032 832 13.42 75 ‒ 79 5,200 5,819 619 11.90 80 ‒ 84 4,000 4,740 740 18.50 85+ 4,400 5,623 1,223 27.80 Total Population 205,100 199,644 -5,456 -2.66

Figure 3: Population in Five Year Age Groups, 2011 Census and 2011 SAPF, Portsmouth
0
5,000
10,000
15,000
20,000
25,000
Aged0-4
Aged5-9
Aged10-14
Aged15-19
Aged20-24
Aged25-29
Aged30-34
Aged35-39
Aged40-44
Aged45-49
Aged50-54
Aged55-59
Aged60-64
Aged65-69
Aged70-74
Aged75-79
Aged80-84
Aged85+
2011 Census2011 SAPF
Table 4 and Figure 3 shows that the largest number variation between 2011 Census and SAPF is for those aged 20-24 (3,650 people), whilst the largest percentage difference is for those aged 85 and over (28 %).

Southampton Table 5: Southampton: Number and Percentage Difference between 2011 Census and
2011 SAPF
Age Group 2011 Census
2011 SAPF
Number Difference
Percentage Difference
0 ‒ 4 15,400 16,156 756 4.91 5 ‒ 9 11,800 12,077 277 2.35 10 ‒ 14 11,500 11,225 -275 -2.39 15 ‒ 19 17,900 17,153 -747 -4.17 20 ‒ 24 29,400 30,244 844 2.87 25 ‒ 29 21,800 18,619 -3,181 -14.59 30 ‒ 34 18,600 15,606 -2,994 -16.10 35 ‒ 39 15,700 15,017 -683 -4.35 40 ‒ 44 14,600 14,853 253 1.73 45 ‒ 49 14,800 14,439 -361 -2.44 50 ‒ 54 12,700 12,497 -203 -1.60 55 ‒ 59 10,800 11,219 419 3.88 60 ‒ 64 10,900 11,632 732 6.72 65 ‒ 69 8,600 9,550 950 11.05 70 ‒ 74 6,800 7,614 814 11.97 75 ‒ 79 5,900 6,537 637 10.80 80 ‒ 84 4,800 5,388 588 12.25 85+ 4,700 5,502 802 17.06 Total Population 236,900 235,329 -1,571 -0.66
Figure 4: Population in Five Year Age Groups, 2011 Census and 2011 SAPF,
Southampton
0
5,000
10,000
15,000
20,000
25,000
Aged0-4
Aged5-9
Aged10-14
Aged15-19
Aged20-24
Aged25-29
Aged30-34
Aged35-39
Aged40-44
Aged45-49
Aged50-54
Aged55-59
Aged60-64
Aged65-69
Aged70-74
Aged75-79
Aged80-84
Aged85+
2011 Census2011 SAPF

Table 5 and Figure 4 show that the most number variation between the 2011 Census and SAPF occurs in the 25-29 age group (3,180) and largest percentage difference is in the 30-34 age group (16 %). Table 6: Southampton: Number and Percentage Difference between 2011 Census and
2011 Alternative SAPF
Age Group 2011 Census
2011 SAPF
Number Difference
Percentage Difference
0 ‒ 4 15,400 16,156 756 4.91 5 ‒ 9 11,800 12,306 506 4.29 10 ‒ 14 11,500 11,740 240 2.09 15 ‒ 19 17,900 17,365 -535 -2.99 20 ‒ 24 29,400 31,264 1864 6.34 25 ‒ 29 21,800 20,618 -1,182 -5.42 30 ‒ 34 18,600 17,265 -1,335 -7.18 35 ‒ 39 15,700 16,275 575 3.66 40 ‒ 44 14,600 15,124 524 3.59 45 ‒ 49 14,800 13,679 -1,121 -7.57 50 ‒ 54 12,700 11,684 -1,016 -8.00 55 ‒ 59 10,800 10,653 -147 -1.36 60 ‒ 64 10,900 11,137 237 2.17 65 ‒ 69 8,600 9,221 621 7.22 70 ‒ 74 6,800 7,372 572 8.41 75 ‒ 79 5,900 6,344 444 7.53 80 ‒ 84 4,800 5,233 433 9.02 85+ 4,700 5,326 626 13.32 Total Population 236,900 238,763 1,863 0.79

Figure 5: Population in Five Year Age Groups, 2011 Census and 2011 Alternative SAPF, Southampton
0
5,000
10,000
15,000
20,000
25,000
Aged0-4
Aged5-9
Aged10-14
Aged15-19
Aged20-24
Aged25-29
Aged30-34
Aged35-39
Aged40-44
Aged45-49
Aged50-54
Aged55-59
Aged60-64
Aged65-69
Aged70-74
Aged75-79
Aged80-84
Aged85+
2011 Census2011 SAPF
The Southampton Alternative SAPF data has larger numbers in the majority of age groups. Most number variation occurs in the young adult age groups (20-34) and older age groups (65 and over) (Table 6 and Figure 5).

Basingstoke and Deane Table 7: Basingstoke and Deane: Number and Percentage Difference between 2011
Census and 2011 SAPF
Age Group 2011 Census
2011 SAPF
Number Difference
Percentage Difference
0 ‒ 4 11,400 11,350 -50 -0.44 5 ‒ 9 9,900 10,001 101 1.02 10 ‒ 14 10,400 10,186 -214 -2.06 15 ‒ 19 9,600 10,240 640 6.67 20 ‒ 24 8,900 10,084 1,184 13.30 25 ‒ 29 11,000 10,553 -447 -4.06 30 ‒ 34 11,500 10,454 -1,046 -9.10 35 ‒ 39 12,400 11,822 -578 -4.66 40 ‒ 44 13,700 13,190 -510 -3.72 45 ‒ 49 13,700 13,114 -586 -4.28 50 ‒ 54 11,400 11,108 -292 -2.56 55 ‒ 59 9,500 9,716 216 2.27 60 ‒ 64 10,200 10,330 130 1.27 65 ‒ 69 7,700 7,560 -140 -1.82 70 ‒ 74 5,700 5,832 132 2.32 75 ‒ 79 4,600 4,646 46 1.00 80 ‒ 84 3,200 3,543 343 10.72 85+ 2,900 3,563 663 22.86 Total Population 167,800 167,291 -509 -0.30

Figure 6: Population in Five Year Age Groups, 2011 Census and SAPF 2011, Basingstoke and Deane
0
2,000
4,000
6,000
8,000
10,000
12,000
14,000
Aged0-4
Aged5-9
Aged10-14
Aged15-19
Aged20-24
Aged25-29
Aged30-34
Aged35-39
Aged40-44
Aged45-49
Aged50-54
Aged55-59
Aged60-64
Aged65-69
Aged70-74
Aged75-79
Aged80-84
Aged85+
2011 Census2011 SAPF
Basingstoke and Deane has the smallest overall percentage difference of any district, with 0.3 %. The largest variation in numbers is for those aged 20-24, with 1,180 more people in the 2011 SAPF. The largest percentage difference is for those aged 85 and over, with 23 % (Table 7 and Figure 6).

East Hampshire Table 8: East Hampshire: Number and Percentage Difference between 2011 Census
and 2011 SAPF
Age Group 2011 Census
2011 SAPF
Number Difference
Percentage Difference
0 ‒ 4 6,200 6,509 309 4.98 5 ‒ 9 6,500 7,080 580 8.92 10 ‒ 14 7,300 7,223 -77 -1.05 15 ‒ 19 7,300 7,677 377 5.16 20 ‒ 24 5,400 6,041 641 11.87 25 ‒ 29 5,100 5,617 517 10.14 30 ‒ 34 5,500 5,802 302 5.49 35 ‒ 39 7,000 7,061 61 0.87 40 ‒ 44 8,800 8,518 -282 -3.20 45 ‒ 49 9,600 9,063 -537 -5.59 50 ‒ 54 8,800 8,237 -563 -6.40 55 ‒ 59 7,600 6,819 -781 -10.28 60 ‒ 64 8,200 7,315 -885 -10.79 65 ‒ 69 6,600 5,783 -817 -12.38 70 ‒ 74 5,200 4,516 -684 -13.15 75 ‒ 79 4,100 3,688 -412 -10.05 80 ‒ 84 3,200 2,917 -283 -8.84 85+ 3,100 3,302 202 6.52 Total Population 115,600 113,166 -2,434 -2.11

Figure 7: Population in Five Year Age Groups, 2011 Census and SAPF 2011, East Hampshire
0
1,000
2,000
3,000
4,000
5,000
6,000
7,000
8,000
9,000
10,000
Aged0-4
Aged5-9
Aged10-14
Aged15-19
Aged20-24
Aged25-29
Aged30-34
Aged35-39
Aged40-44
Aged45-49
Aged50-54
Aged55-59
Aged60-64
Aged65-69
Aged70-74
Aged75-79
Aged80-84
Aged85+
2011 Census2011 SAPF
The figures for East Hampshire are largely split down the middle of the age groups, with a larger number in SAPF for those aged under 40 and a smaller number in SAPF for those aged over 40. The largest number difference is 890 for those aged 60-64. The largest percentage difference is 13 % for those aged 70-74 years (Table 8 and Figure 7).

Eastleigh
Table 9: Eastleigh: Number and Percentage Difference between 2011 Census and 2011 SAPF
Age Group 2011 Census
2011 SAPF
Number Difference
Percentage Difference
0 ‒ 4 7,700 7,749 49 0.64 5 ‒ 9 7,000 7,088 88 1.26 10 ‒ 14 7,400 7,474 74 1.00 15 ‒ 19 7,500 8,002 502 6.69 20 ‒ 24 7,200 7,357 157 2.18 25 ‒ 29 7,300 7,334 34 0.47 30 ‒ 34 7,900 7,143 -757 -9.58 35 ‒ 39 8,600 8,135 -465 -5.41 40 ‒ 44 9,400 9,284 -116 -1.23 45 ‒ 49 9,800 9,772 -28 -0.29 50 ‒ 54 8,900 8,845 -55 -0.62 55 ‒ 59 7,600 7,676 76 1.00 60 ‒ 64 8,100 7,603 -497 -6.14 65 ‒ 69 6,000 5,762 -238 -3.97 70 ‒ 74 5,000 4,682 -318 -6.36 75 ‒ 79 4,000 3,701 -299 -7.48 80 ‒ 84 3,100 2,994 -106 -3.42 85+ 2,800 2,844 44 1.57 Total Population 125,200 123,447 -1,753 -1.40

Figure 8: Population in Five Year Age Groups, 2011 Census and SAPF 2011, Eastleigh
0
1000
2000
3000
4000
5000
6000
7000
8000
9000
10000
Aged0-4
Aged5-9
Aged10-14
Aged15-19
Aged20-24
Aged25-29
Aged30-34
Aged35-39
Aged40-44
Aged45-49
Aged50-54
Aged55-59
Aged60-64
Aged65-69
Aged70-74
Aged75-79
Aged80-84
Aged85+
2011 Census2011 SAPF
Table 9 and Figure 8 show that SAPF estimated there to be more people aged under 30 than the 2011 Census. The largest number and percentage difference was for the 30-34 age group with 760 more people (10 %) in the Census than SAPF.

Fareham
Table 10: Fareham: Number and Percentage Difference between 2011 Census and 2011 SAPF
Age Group 2011 Census
2011 SAPF
Number Difference
Percentage Difference
0 ‒ 4 5,600 5,772 172 3.07 5 ‒ 9 5,800 5,865 65 1.12 10 ‒ 14 6,700 6,540 -160 -2.39 15 ‒ 19 6,700 6,889 189 2.82 20 ‒ 24 5,700 5,772 72 1.26 25 ‒ 29 5,400 5,379 -21 -0.39 30 ‒ 34 5,500 5,956 456 8.29 35 ‒ 39 7,000 7,444 444 6.34 40 ‒ 44 8,600 8,611 11 0.13 45 ‒ 49 9,000 8,588 -412 -4.58 50 ‒ 54 8,100 7,890 -210 -2.59 55 ‒ 59 7,000 6,774 -226 -3.23 60 ‒ 64 7,800 7,447 -353 -4.53 65 ‒ 69 6,600 6,295 -305 -4.62 70 ‒ 74 5,200 5,042 -158 -3.04 75 ‒ 79 4,500 4,277 -223 -4.96 80 ‒ 84 3,400 3,304 -96 -2.82 85+ 3,100 3,406 306 9.87 Total Population 111,600 111,253 -347 -0.31
Figure 9: Population in Five Year Age Groups, 2011 Census and SAPF 2011,
Fareham
0
1000
2000
3000
4000
5000
6000
7000
8000
9000
Aged0-4
Aged5-9
Aged10-14
Aged15-19
Aged20-24
Aged25-29
Aged30-34
Aged35-39
Aged40-44
Aged45-49
Aged50-54
Aged55-59
Aged60-64
Aged65-69
Aged70-74
Aged75-79
Aged80-84
Aged85+
2011 Census2011 SAPF

The number difference in the total population between the Census and SAPF was smallest in Fareham, with just 350 more people in the Census than SAPF. Among the age groups, the most variation was in those aged 30-34, with 460 more people estimated in SAPF. The largest percentage difference was for those aged 85 and over (10 %) (Table 10 and Figure 9). Gosport
Table 11: Gosport: Number and Percentage Difference between 2011 Census and 2011 SAPF
Age Group 2011 Census
2011 SAPF
Number Difference
Percentage Difference
0 ‒ 4 5,400 5,450 50 0.93 5 ‒ 9 4,700 4,699 -1 -0.02 10 ‒ 14 4,900 4,776 -124 -2.53 15 ‒ 19 5,100 5,147 47 0.92 20 ‒ 24 5,000 4,976 -24 -0.48 25 ‒ 29 5,400 5,180 -220 -4.07 30 ‒ 34 5,000 5,078 78 1.56 35 ‒ 39 5,400 5,538 138 2.56 40 ‒ 44 5,900 5,734 -166 -2.81 45 ‒ 49 6,100 5,502 -598 -9.80 50 ‒ 54 5,700 4,949 -751 -13.18 55 ‒ 59 4,600 4,283 -317 -6.89 60 ‒ 64 5,200 4,638 -562 -10.81 65 ‒ 69 4,000 3,753 -247 -6.18 70 ‒ 74 3,300 3,176 -124 -3.76 75 ‒ 79 2,900 2,897 -3 -0.10 80 ‒ 84 2,100 2,221 121 5.76 85+ 2,000 2,130 130 6.50 Total Population 82,600 80,128 -2,472 -2.99

Figure 10: Population in Five Year Age Groups, 2011 Census and SAPF 2011, Gosport
0
1000
2000
3000
4000
5000
6000
7000
Aged0-4
Aged5-9
Aged10-14
Aged15-19
Aged20-24
Aged25-29
Aged30-34
Aged35-39
Aged40-44
Aged45-49
Aged50-54
Aged55-59
Aged60-64
Aged65-69
Aged70-74
Aged75-79
Aged80-84
Aged85+
2011 Census2011 SAPF
In Gosport, the 2011 Census and 2011 SAPF follow a similar pattern for the younger age groups. There is more variation for those aged 40-65 and again in the oldest age groups. The largest number and percentage difference is for those aged 50-54 (13 %) (Table 11 and Figure 12).

Hart Table 12: Hart: Number and Percentage Difference between 2011 Census and 2011
SAPF
Age Group 2011 Census
2011 SAPF
Number Difference
Percentage Difference
0 ‒ 4 5700 5832 132 2.32 5 ‒ 9 5700 5972 272 4.77 10 ‒ 14 5800 5468 -332 -5.72 15 ‒ 19 5200 5516 316 6.08 20 ‒ 24 4300 5032 732 17.02 25 ‒ 29 4500 5115 615 13.67 30 ‒ 34 5300 5159 -141 -2.66 35 ‒ 39 7000 6025 -975 -13.93 40 ‒ 44 7400 6857 -543 -7.34 45 ‒ 49 7700 7004 -696 -9.04 50 ‒ 54 6300 5881 -419 -6.65 55 ‒ 59 5400 5057 -343 -6.35 60 ‒ 64 5900 5498 -402 -6.81 65 ‒ 69 4700 4292 -408 -8.68 70 ‒ 74 3700 3208 -492 -13.30 75 ‒ 79 2800 2499 -301 -10.75 80 ‒ 84 2000 2021 21 1.05 85+ 1800 2254 454 25.22 Total Population 91000 88692 -2,308 -2.54
Figure 11: Population in Five Year Age Groups, 2011 Census and SAPF 2011, Hart
0
1000
2000
3000
4000
5000
6000
7000
8000
Aged0-4
Aged5-9
Aged10-14
Aged15-19
Aged20-24
Aged25-29
Aged30-34
Aged35-39
Aged40-44
Aged45-49
Aged50-54
Aged55-59
Aged60-64
Aged65-69
Aged70-74
Aged75-79
Aged80-84
Aged85+
2011 Census2011 SAPF

For almost all the age groups in Hart, SAPF had a lower estimate than the 2011 Census. However, the exceptions to this rule have the largest percentage differences, with 17 % more people aged 20-24 in SAPF than the Census, and 25 % more aged 85 and over. The largest number difference is 980 more people in the Census than SAPF for the 35-39 age group (Table 12 and Figure 11). Havant
Table 13: Havant: Number and Percentage Difference between 2011 Census and 2011 SAPF
Age Group 2011 Census
2011 SAPF
Number Difference
Percentage Difference
0 ‒ 4 6,700 6,818 118 1.76 5 ‒ 9 6,400 6,333 -67 -1.05 10 ‒ 14 7,200 6,840 -360 -5.00 15 ‒ 19 7,600 7,419 -181 -2.38 20 ‒ 24 6,800 6,441 -359 -5.28 25 ‒ 29 6,400 5,635 -765 -11.95 30 ‒ 34 5,900 5,583 -317 -5.37 35 ‒ 39 6,700 6,747 47 0.70 40 ‒ 44 8,400 8,333 -67 -0.80 45 ‒ 49 8,900 8,746 -154 -1.73 50 ‒ 54 8,500 8,060 -440 -5.18 55 ‒ 59 7,500 7,197 -303 -4.04 60 ‒ 64 8,200 7,841 -359 -4.38 65 ‒ 69 7,000 6,673 -327 -4.67 70 ‒ 74 5,900 5,728 -172 -2.92 75 ‒ 79 5,200 4,949 -251 -4.83 80 ‒ 84 4,000 3,764 -236 -5.90 85+ 3,500 3,593 93 2.66 Total Population 120,700 116,700 -4,000 -3.31

Figure 12: Population in Five Year Age Groups, 2011 Census and SAPF 2011, Havant
0
1000
2000
3000
4000
5000
6000
7000
8000
9000
Aged0-4
Aged5-9
Aged10-14
Aged15-19
Aged20-24
Aged25-29
Aged30-34
Aged35-39
Aged40-44
Aged45-49
Aged50-54
Aged55-59
Aged60-64
Aged65-69
Aged70-74
Aged75-79
Aged80-84
Aged85+
2011 Census2011 SAPF
The 2011 Census data for Havant has a larger number of people in almost all the five year age groups. The largest number and percentage difference is 770 people (12 %) for those aged 25-29 (Table 13 and Figure 12).

New Forest Table 14: New Forest: Number and Percentage Difference between 2011 Census and
2011 SAPF
Age Group 2011 Census
2011 SAPF
Number Difference
Percentage Difference
0 ‒ 4 8,600 8,620 20 0.23 5 ‒ 9 8,500 8,739 239 2.81 10 ‒ 14 9,700 9,520 -180 -1.86 15 ‒ 19 9,700 10,091 391 4.03 20 ‒ 24 8,200 8,277 77 0.94 25 ‒ 29 7,600 7,293 -307 -4.04 30 ‒ 34 7,800 7,475 -325 -4.17 35 ‒ 39 9,700 9,467 -233 -2.40 40 ‒ 44 11,700 11,784 84 0.72 45 ‒ 49 13,200 12,919 -281 -2.13 50 ‒ 54 12,100 12,148 48 0.40 55 ‒ 59 11,700 11,672 -28 -0.24 60 ‒ 64 13,900 13,016 -884 -6.36 65 ‒ 69 11,700 10,857 -843 -7.21 70 ‒ 74 9,700 9,240 -460 -4.74 75 ‒ 79 8,400 8,368 -32 -0.38 80 ‒ 84 7,000 6,868 -132 -1.89 85+ 7,400 8,017 617 8.34 Total Population 176,500 174,372 -2,128 -1.21

Figure 13: Population in Five Year Age Groups, 2011 Census and SAPF 2011, New Forest
0
2000
4000
6000
8000
10000
12000
14000
Aged0-4
Aged5-9
Aged10-14
Aged15-19
Aged20-24
Aged25-29
Aged30-34
Aged35-39
Aged40-44
Aged45-49
Aged50-54
Aged55-59
Aged60-64
Aged65-69
Aged70-74
Aged75-79
Aged80-84
Aged85+
2011 Census2011 SAPF
The New Forest figures for the 2011 Census and SAPF are fairly similar until the older age groups. The largest variations occur in the 60-64 age group (880 more people in the Census) and 85 and over age group (8 %) (Table 14 and Figure 13).

Rushmoor Table 15: Rushmoor: Number and Percentage Difference between 2011 Census and
2011 SAPF
Age Group 2011 Census
2011 SAPF
Number Difference
Percentage Difference
0 ‒ 4 6,700 7,123 423 6.31 5 ‒ 9 5,600 6,275 675 12.05 10 ‒ 14 5,400 5,886 486 9.00 15 ‒ 19 6,000 6,118 118 1.97 20 ‒ 24 6,700 7,146 446 6.66 25 ‒ 29 7,300 7,972 672 9.21 30 ‒ 34 7,500 7,256 -244 -3.25 35 ‒ 39 7,600 7,296 -304 -4.00 40 ‒ 44 7,500 7,276 -224 -2.99 45 ‒ 49 7,200 7,156 -44 -0.61 50 ‒ 54 5,700 5,720 20 0.35 55 ‒ 59 4,600 4,678 78 1.70 60 ‒ 64 4,600 4,612 12 0.26 65 ‒ 69 3,500 3,359 -141 -4.03 70 ‒ 74 2,800 2,836 36 1.29 75 ‒ 79 2,000 2,271 271 13.55 80 ‒ 84 1,600 1,798 198 12.38 85+ 1,600 1,967 367 22.94 Total Population 93,800 96,745 2,945 3.14
Figure 14: Population in Five Year Age Groups, 2011 Census and SAPF 2011,
Rushmoor
0
1000
2000
3000
4000
5000
6000
7000
8000
Aged0-4
Aged5-9
Aged10-14
Aged15-19
Aged20-24
Aged25-29
Aged30-34
Aged35-39
Aged40-44
Aged45-49
Aged50-54
Aged55-59
Aged60-64
Aged65-69
Aged70-74
Aged75-79
Aged80-84
Aged85+
2011 Census2011 SAPF
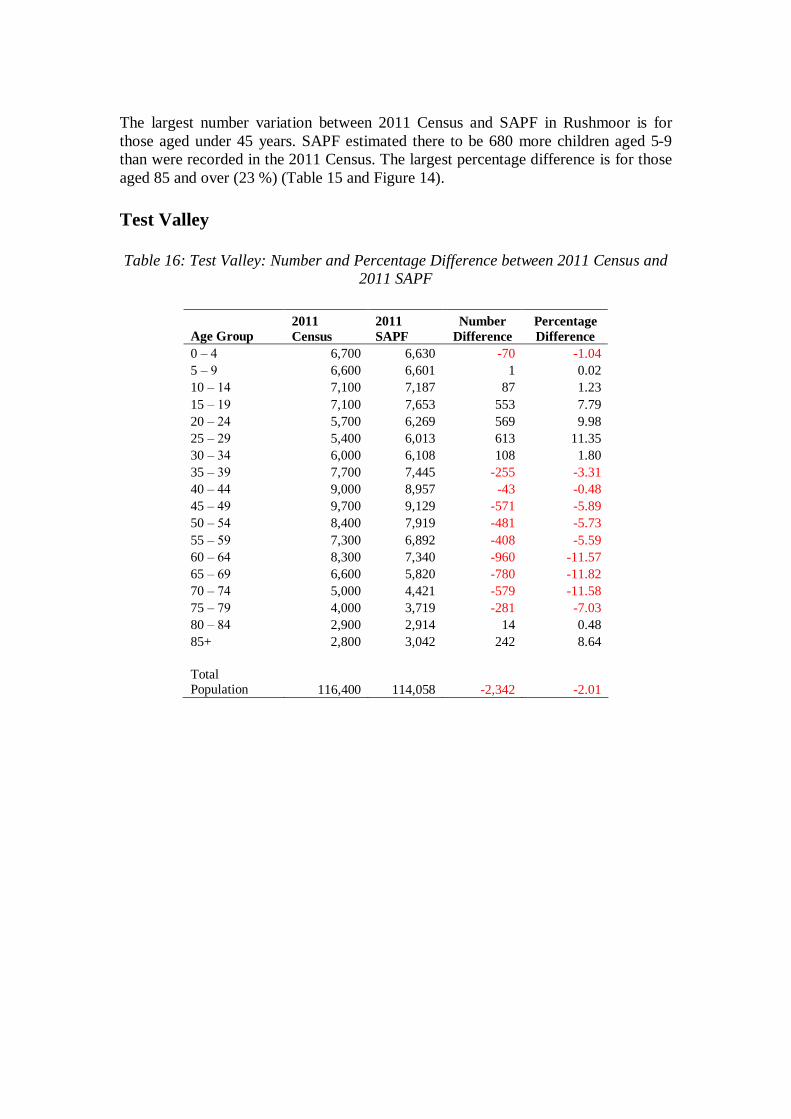
The largest number variation between 2011 Census and SAPF in Rushmoor is for those aged under 45 years. SAPF estimated there to be 680 more children aged 5-9 than were recorded in the 2011 Census. The largest percentage difference is for those aged 85 and over (23 %) (Table 15 and Figure 14). Test Valley Table 16: Test Valley: Number and Percentage Difference between 2011 Census and
2011 SAPF
Age Group 2011 Census
2011 SAPF
Number Difference
Percentage Difference
0 ‒ 4 6,700 6,630 -70 -1.04 5 ‒ 9 6,600 6,601 1 0.02 10 ‒ 14 7,100 7,187 87 1.23 15 ‒ 19 7,100 7,653 553 7.79 20 ‒ 24 5,700 6,269 569 9.98 25 ‒ 29 5,400 6,013 613 11.35 30 ‒ 34 6,000 6,108 108 1.80 35 ‒ 39 7,700 7,445 -255 -3.31 40 ‒ 44 9,000 8,957 -43 -0.48 45 ‒ 49 9,700 9,129 -571 -5.89 50 ‒ 54 8,400 7,919 -481 -5.73 55 ‒ 59 7,300 6,892 -408 -5.59 60 ‒ 64 8,300 7,340 -960 -11.57 65 ‒ 69 6,600 5,820 -780 -11.82 70 ‒ 74 5,000 4,421 -579 -11.58 75 ‒ 79 4,000 3,719 -281 -7.03 80 ‒ 84 2,900 2,914 14 0.48 85+ 2,800 3,042 242 8.64 Total Population 116,400 114,058 -2,342 -2.01

Figure 15: Population in Five Year Age Groups, 2011 Census and SAPF 2011, Test Valley
0
1000
2000
3000
4000
5000
6000
7000
8000
9000
10000
Aged0-4
Aged5-9
Aged10-14
Aged15-19
Aged20-24
Aged25-29
Aged30-34
Aged35-39
Aged40-44
Aged45-49
Aged50-54
Aged55-59
Aged60-64
Aged65-69
Aged70-74
Aged75-79
Aged80-84
Aged85+
2011 Census2011 SAPF
Table 16 and Figure 15 show the results for Test Valley. The most variation occurs in the age groups covering those aged 15-29 and 60-74. The largest number difference is 960 for those aged 60-64 and the largest percentage difference is in the 65-69 age group (12 %).

Winchester Table 17: Winchester: Number and Percentage Difference between 2011 Census and
2011 SAPF
Age Group 2011 Census
2011 SAPF
Number Difference
Percentage Difference
0 ‒ 4 6,600 6,632 32 0.48 5 ‒ 9 6,500 6,662 162 2.49 10 ‒ 14 7,000 7,110 110 1.57 15 ‒ 19 8,100 8,424 324 4.00 20 ‒ 24 7,500 6,922 -578 -7.71 25 ‒ 29 5,600 5,897 297 5.30 30 ‒ 34 6,200 6,280 80 1.29 35 ‒ 39 7,500 7,432 -68 -0.91 40 ‒ 44 8,300 8,640 340 4.10 45 ‒ 49 8,900 9,002 102 1.15 50 ‒ 54 8,000 8,016 16 0.20 55 ‒ 59 6,900 6,940 40 0.58 60 ‒ 64 7,700 7,407 -293 -3.81 65 ‒ 69 6,200 5,834 -366 -5.90 70 ‒ 74 5,000 4,728 -272 -5.44 75 ‒ 79 4,000 4,005 5 0.13 80 ‒ 84 3,300 3,305 5 0.15 85+ 3,300 3,899 599 18.15 Total Population 116,600 117,134 534 0.46
Figure 16: Population in Five Year Age Groups, 2011 Census and SAPF 2011,
Winchester
0
1000
2000
3000
4000
5000
6000
7000
8000
9000
10000
Aged0-4
Aged5-9
Aged10-14
Aged15-19
Aged20-24
Aged25-29
Aged30-34
Aged35-39
Aged40-44
Aged45-49
Aged50-54
Aged55-59
Aged60-64
Aged65-69
Aged70-74
Aged75-79
Aged80-84
Aged85+
2011 Census2011 SAPF

For the total population there is only a small number and percentage difference between the 2011 Census and SAPF (530 people and 0.5 %). In the majority of age groups, the number difference is below 500 and the percentage difference is less than 5 %, with the largest differences 580 for those aged 20-24 and 18 % for those aged 85 and over (Table 17 and Figure 16).