Embed Size (px)
Citation preview

A Comparison of Space-Time 2D and 3D Geo-visualization
Merve Keskin*, Bahadır Çelik*, A. Özgür Doğru*, M. Ercan Pakdil**
* Istanbul Technical University, Geomatics Eng. Dept., Ayazaga Campus, 34469, Istanbul, Turkey ** Pegasus Airlines, Navigation Engineering, 34912, Istanbul, Turkey
Abstract. This paper aims to introduce a dynamic 3D environment allow-ing to elaborate space and time together, a mobile application detecting movement, an evaluation of space-time human behaviors by using 2D and 3D geo- visualization methods. For this reason, a case study carried out to observe the mobility in a university campus. The methodology of the study was structured upon (i) spatio-temporal data collection with mobile devic-es, (ii) dynamic 2D visualization (animation) on temporal GIS environment, and (iii) 2D and 3D geovisualization by using space-time paths and space-time cube. Based on the outcomes of the case study, 2D and 3D geovisuali-zation were compared and pros and cons were discussed.
Keywords: 2D geovisualization, 3D geovisualization, space-time cube, spatio-temporal data, temporal GIS
1. Introduction
In today’s world, each second, massive volumes of data are being generated and most of it has geographic relevance. Geographic coordinates, time se-ries and space-time activities have become common concepts in our lives. Such that, 80% of all digital data produced consist geospatial reference (MacEachren & Kraak, 2001). Nowadays, people regularly share where they are, what they are doing and they like to be aware of what others do, too. Sharing time and location effortlessly with any smart phones have created a brand-new data source called user-generated information. These big data are encouraging in terms of analyzing the information which is previously unknown, yet potentially valuable to provide a better understanding of complex human behaviors (Dykes & Mountain, 2003; Guo et al., 2006). It
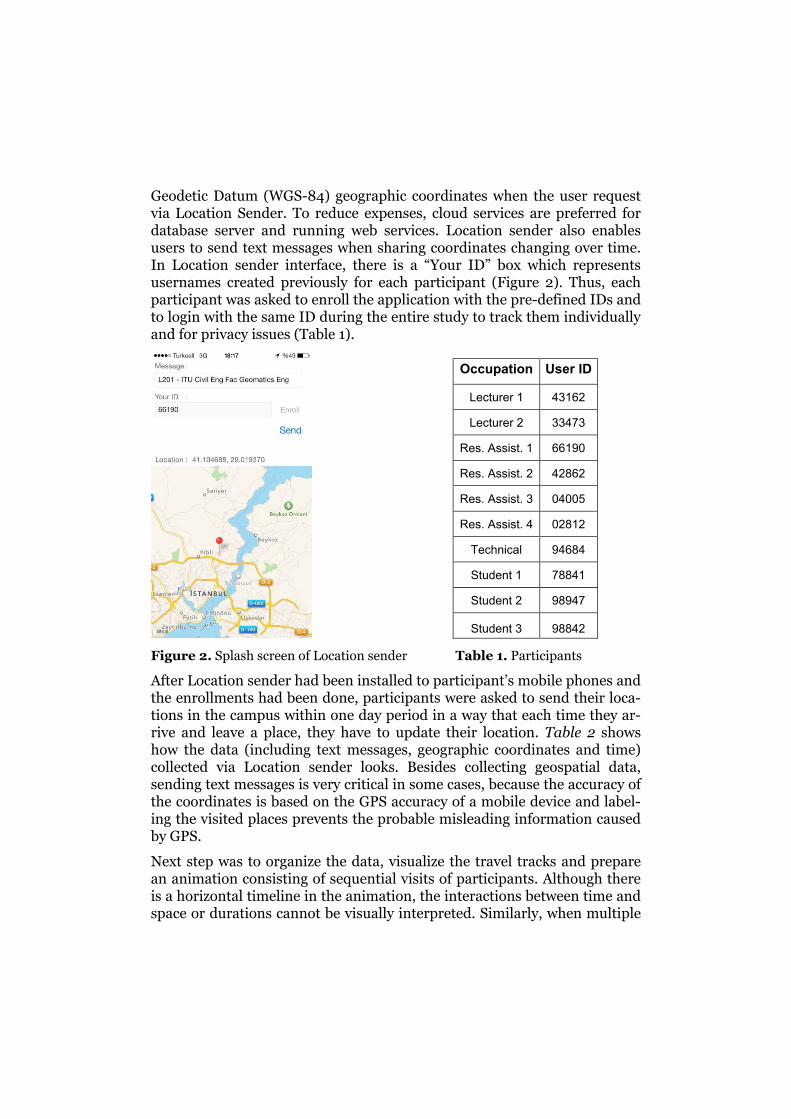
is a win-win situation due to a strong personal geo-data need for location-based services and these spatial data are collected and sent to databases by individuals, especially the mobile users (Kraak, 2003). Space-time analysis combined with the mobile data may reveal numerous hidden information about human behaviors within changing place and time and interrelations among other variables affecting mobility. For this reason, spatio-temporal data should be graphically visualized.
However, there are difficulties of analysis of human activity-travel patterns such as location, time, duration and activity sequences due to the character-istics and complexity of movement in space and time. Many GIS software mostly deals with the categorized data that are represented as discrete units. For instance, temporal data are represented as time intervals such as starting time, time periods and ending time, while spatial data is defined by distance. Since time and space are considered as continuous phenomena, this approach may be insufficient to explore the interaction between space and time (Kwan, 2000). Temporal Geographic Information System (GIS) is a system that integrates time into GIS in order to process, manage, and ana-lyze spatio-temporal data, in other words, geospatial data changing over time. The difference between temporal GISs and other GISs is that tradi-tional GIS data models provide only static representations of reality (Frank et al, 1991). Space-time activities such as modeling of geospatial lifelines, relating time and geography based on analytical formulations of entities and displaying life paths underlying time-geographic constraints (Kritzler, 2007).
This paper aims to introduce a dynamic 3D environment allowing to elabo-rate space and time together, a mobile application detecting movement, and an evaluation of space-time human behaviors. In addition, the advantages and handicaps of 3D visualization over 2D are discussed. Hence, the paper is organized as follows. Section 2 provides information about mobile tech-nology and location-based services with literature review. Description of geovisualization, including 2D and 3D techniques, are mentioned in Section 3, which is followed by a case study carried out to observe the mobility in a university campus in Section 4. The methodology of the study was struc-tured upon (i) spatio-temporal data collection with mobile devices, (ii) dy-namic 2D visualization (animation) on temporal GIS environment, and (iii) 2D and 3D geovisualization by using space-time paths and space-time cube. Section 6 includes the comparison of 2D and 3D geovisualization and final-ly discussion and concluding remarks are presented in Section 7.

2. Mobile Technology and Location-based Services
Rapid development of mobile technology has definitely changed the way we live. The more the location-aware devices are used, the more the demand of staying connected is increasing. In the early stages of mobile development, attracting user’s attention was underestimated, since the demands of a loca-tion-based applications were increased in a way that they should recognize and adapt dynamic environments. However, the only way to get user attrac-tion is to create a context-aware system, which is defined as “any infor-mation that can be used to characterize the situation of entities”. Location as well is a kind of context that can be gathered real-time and can be used to create “environments that sense, perceive, interpret, project, react to and anticipate the events of interest and offer services to users accordingly” (Abowd et al, 1999; Augusto & Aghajan, 2009; Henricksen et al., 2002; Huang, 2010). Nevertheless, location becomes meaningful when it is com-bined with content, so that, a location-based service can overcome individ-ual needs of mobile users. A location information can be used as (i) a filter; resulting locations that are close to the user, (ii) a pointer; showing the us-er’s location on a map, and (iii) a definer; launching notifications when us-ers enter a defined area (Ajam, 2008; GSM, 2003). Hence, user-generated content by itself is the key to meet user’s own expectations better.
Positioning technologies that track the movement of mobile users play a significant role for location-based services (Martin et al., 2000). Every loca-tion-based mobile application uses GNSS technology to allow users to see or share their location within time. The collected spatio-temporal data have led researchers and private sector to acquire knowledge about human mo-bility at temporal and user participation scale (Noulas et al., 2013).
There are hundreds of studies and researches subjecting to geographic user activity patterns of location based social media users. In one study, mobility patterns of approximately 700,000 Foursquare users were analyzed (which is the most popular Location-based Social Network-LBSN) based on 12,000,000 check-ins over 111 days. Based on the research, geo-temporal rhythms, check-in dynamics, activity and place transitions were identified and by this way, the most popular places visited during weekdays and weekends, the times passed between two individual check-ins, the variety of activities and check-in frequencies. (Noulas et al., 2011). Another study fo-cuses on socio-spatial properties of LBSN by using Foursquare user’s data. In this study, authors discuss the basic relationship between similarities in friendship and geographic distance, and they found out that user behaviors depend on neither the number of friends, nor the average distance of friends, thus it is mostly heterogeneous (Scellato et al, 2011). Similarly, one of the recent studies aims to introduce human movement patterns

within various time scales and place. After gathering tracks of the 10,000 most active Foursquare users, authors first, analyzed the time distribution of check-ins and recognized that there is a consistent weekly activity pat-tern. Secondly, they observed consecutive check-ins of the same user and found out that there is mostly 2 hours between two check-ins. Third, they realized that most users visit a few places very often based on the venue frequency distribution analysis. After such data explorations, they catego-rized check-ins, examined daily patterns and durations in order to analyze human movement. Finally, future user movements were predicted based on transitions between categories and behavioral clusters of users (Preoţiuc-Pietro, & Cohn, 2013). Therefore, analyzing human activity behaviors is essential and required for enhancing user-centric location-based services.
3. 2D and 3D Geovisualization of Space-Time Activi-ties
Visualization aims to enhance human understanding by using graphics in-stead of tabular data and it is efficient for large and complex attributes such as activity-travel patterns (Kwan, 2000). Geovisualization includes theories from cartography, exploratory data analysis and information representation (Bleisch, 2012). As MacEachren and Kraak (2001) defined, geovisualization is “the integration of visualization in scientific computing, cartography, image analysis, information visualization, exploratory data analysis and GIS, which all together provide theory, methods and tools for visual explo-ration, analysis, synthesis and presentation of geospatial data”. Thus, ge-ovisualization should excite visual thinking and make spatial contexts and problems visible (MacEachren et al., 1992). It is possible to represent spa-tial data in both 2D and 3D views depending on the information to be pro-vided. 2D representations perform better to illustrate precise relationships, while 3D methods are mostly used for qualitative comprehension (Spring-meyer et al., 1992).
There are bunch of different methods to visualize spatio-temporal data in 3D (i.e. time geography). One of them is to create 3Dable geographic data-base by appointing the Z value in 2D database, thus, there can only be one Z value for a single location. However, this approach restricts complex geo-graphic object representation in 3D (Kwan, 2000). Since the static 2D maps are not especially temporal, in many early studies, cartographic animation approach that is based on visualizing individual frames sequentially has been frequently used for temporal visualization (DiBiase et al., 1992; Fisher, 1993; Krygier, 1994; MacEachren & Kraak, 1997; Ren & Kwan, 2007). Other methods can be listed as solid modeling in computer-aided design (CAD)

environment, the voxel (3D pixel) data structure and object-oriented 3D data models (Manson et al., 1999; Kwan, 2000).
On the other hand, geovisualization of human activity-travel behavior in-volves large volume of spatial, temporal and multi-dimensional data, more-over, a powerful data exploratory tools are required to understand activity-travel patterns better. In several early researches, 2D maps and graphics containing lines connecting destinations, were used to illustrate the human activity patterns. Time, in fact, is a crucial component for exploring activity-travel patterns. That is the reason of a number of problems occurring relat-ed to the geovisualization of human behavioral patterns, such that the travel data has both spatial and temporal characteristics which are difficult to handle and there is no specific visualization technique for analyzing peo-ple’s activity patterns. Although the animation technique (mentioned above) has temporal characteristic, it is not suitable for analyzing the whole activity pattern, and the connections and relationships between dynamic variables which are activities and travel time (MacEachren & Kraak, 1997; Kwan, 2000; Ren & Kwan, 2007).
Since the travel data consists of multi-dimensional activity-travel attributes, multivariate visualization techniques such as bivariate or trivariate choro-pleth maps, multivariate dot maps and multivariate point symbols maps are suitable for portraying human space-time activities (Ren & Kwan, 2007). Another useful spatio-temporal visualization method is called parallel coor-dinate (PCP) (Edsall, 2003; Wegman, 1990). Despite handling the multiple attributes of activity-travel behavior, PCP cannot visualize activity duration and people’s sequential movement (Ren & Kwan, 2007).
Space-time cube is one of the most efficient 3D geovisualization techniques that contributes the spatio-temporal data comprehension of human behav-ior (MacEachren, 1999; Kraak, 2003). This representation is used in a wide range applications including orienteering events, gender/ethnic differences in space-time activity and demonstrating temporal cluster of events such as Napoleon’s march into Russia or spatial epidemiological analysis of crime (Kraak, 2003; Kwan, 2004; Nakaya & Yano, 2010). Space-time cube is a dynamic and interactive visualization technique which gives users a better visual understanding with its flexible display option besides data query and analysis. This concept was first introduced by Hägerstrand (Figure 1-I). According to Hägerstrand; a life path can be visualized as a 3D space by projecting it on a 2D plane. As the base (x and y axis) corresponds the geog-raphy, the height (z axis) represents the time. Space-time cube consists of space-time paths and space-time prisms. Space-time paths (i.e. trajectories) show the movement of individuals in space over time (Figure 1-II). The slope of the path gives the travel velocity. If there is no temporal change in

the action, this means that the path is vertical. Space-time paths can be pro-jected on the map in order to get path’s footprint. On the other hand, space-time prism represents the locations reached within a specified time interval (from a starting point to an ending point in space-time) (Figure 1-III). The largest extent of the prism indicates a potential path space and its projec-tion gives potential path space (Hägerstrand, 1970; Kraak, 2003; Kritzler, et al., 2007; Miller, 1991; Miller, 2003). It is also possible to visualize human travel activities as 2D space-time paths by identifying X axis as distance and Y axis as time (Ren & Kwan, 2007).
Figure 1. Space time cube (I), Space time path (II) and Space time prism (III)
(Kraak, 2003).
4. Case Study
To observe daily mobility and space-time behavior of individuals, a minor case study was conducted in Istanbul Technical University (ITU) Ayazaga Campus with 10 participants. The study consists of spatio-temporal data collection, and geovisualization of spatio-temporal data in both 2D (space-time paths) and 3D environments (space-time cube).
First of all, authors developed a mobile application called “Location Sender” for data collection. Location sender is an IOS mobile application which al-lows users to send device location information on GNSS equipped mobile devices. This location information is collected on dedicated web services to store on the database server for any kind of spatial analysis, such as real-time tracking, visualizing, mapping, etc. The database server stores World
Geodetic Datum (WGS-84) geographic coordinates when the user request via Location Sender. To reduce expenses, cloud services are preferred for database server and running web services. Location sender also enables users to send text messages when sharing coordinates changing over time. In Location sender interface, there is a “Your ID” box which represents usernames created previously for each participant (Figure 2). Thus, each participant was asked to enroll the application with the pre-defined IDs and to login with the same ID during the entire study to track them individually and for privacy issues (Table 1).
Figure 2. Splash screen of Location sender Table 1. Participants
After Location sender had been installed to participant’s mobile phones and the enrollments had been done, participants were asked to send their loca-tions in the campus within one day period in a way that each time they ar-rive and leave a place, they have to update their location. Table 2 shows how the data (including text messages, geographic coordinates and time) collected via Location sender looks. Besides collecting geospatial data, sending text messages is very critical in some cases, because the accuracy of the coordinates is based on the GPS accuracy of a mobile device and label-ing the visited places prevents the probable misleading information caused by GPS.
Next step was to organize the data, visualize the travel tracks and prepare an animation consisting of sequential visits of participants. Although there is a horizontal timeline in the animation, the interactions between time and space or durations cannot be visually interpreted. Similarly, when multiple
Occupation User ID
Lecturer 1 43162
Lecturer 2 33473
Res. Assist. 1 66190
Res. Assist. 2 42862
Res. Assist. 3 04005
Res. Assist. 4 02812
Technical
Staff
94684
Student 1 78841
Student 2 98947
Student 3 98842

participants are involved, it becomes complicated and hard to perceive (Figure 3).
User-ID Message Latitude Longitude Time
66190 L201 41.10479 29.01926 2014-04-22 08:33:51.891+00
66190 L201 41.10479 29.01926 2014-04-22 09:33:51.243+00
66190 Library 41.10373 29.02136 2014-04-22 09:53:26.66+00
66190 Library 41.10373 29.02136 2014-04-22 11:08:26.049+00
66190 Student Cafe 41.10454 29.02040 2014-04-22 11:13:07.292+00
66190 Student Cafe 41.10454 29.02040 2014-04-22 11:31:07.719+00
66190 Student Union 41.10568 29.02275 2014-04-22 11:40:18.191+00
66190 Student Union 41.10568 29.02275 2014-04-22 13:26:18.09+00
66190 Restaurant 41.10448 29.01923 2014-04-22 13:34:13.911+00
66190 Restaurant 41.10448 29.01923 2014-04-22 14:10:13.393+00
66190 Rectorate 41.10706 29.02164 2014-04-22 14:17:15.661+00
66190 Rectorate 41.10706 29.02164 2014-04-22 14:31:15.15+00
66190 Market 41.10560 29.01926 2014-04-22 14:33:13.142+00
66190 Market 41.10560 29.01926 2014-04-22 14:40:13.197+00
66190 L201 41.10479 29.02018 2014-04-22 14:44:13.268+00
66190 L201 41.10479 29.02018 2014-04-22 17:23:13.312+00
66190 Bank ATM 41.10454 29.02040 2014-04-22 17:25:07.152+00
66190 Sport Center 41.10276 29.02174 2014-04-22 17:32:12.213+00
66190 Sport Center 41.10276 29.02174 2014-04-22 18:52:12.307+00
Table 2. An example data gathered from Location Sender (User ID-66190)

Figure 3. Places visited by 66190 within a day time period (animated in GIS envi-
ronment and saved as avi format).
Geovisualization of space-time activities was provided for both 2D and 3D environments as space-time paths and space-time cube, respectively. For this reason, Pandas Data Analysis Library, NumPy scientific computing module and Matplotlib Mplot3D toolkit libraries of Python programming language were used. Pandas library is very convenient for data manipula-tion and analysis, particularly for manipulating numerical tables and time series by offering data structures and operations. On the other hand, NumPy is the fundamental package for scientific computing with Python. Also, Mplot3D toolkit for Matplotlib library is a convenient tool for 3D plot-ting (Hunter, 2007; McKinney, 2010; van der Walt et al., 2011). In order to project location information onto 2D surface, firstly, the geographic coordi-nates (latitude, longitude) were converted into Cartesian coordinates (northing, easting) and then the space-time paths and space-time cube were plotted. Figure 4 combines a daily campus activities of a selected partici-pant (66190) as space-time paths. Mobility of this participant can be fol-

lowed by looking at the Figure 4 and Table 2. This 2D representation shows an individual action space, including a typology of actual action spaces and a simulation model. Within 10,5 hours, she visits different places and stays at those places about 9,5 hours. This may give us an idea that she spends approximately 1 hour on travel. The distinction between time spent on ac-tivities and travel time is important in terms of mobility (Drewe, 2005).
Figure 4. 2D space time path representation of a typical day of 66190 in the
campus
Next step is the elaboration of campus activities as a space-time cube. Due to the flexible display options of space-time cube representation, one can gather a new travel information by exploring the cube at different point of views. Figure 5 indicates the space-time activities of the same selected par-ticipant (66190) in Figure 4. In this case, rather than the distances between locations visited by 66190, the actual coordinates of the places and the cor-responding time of visit are depicted. Although calculating travel times and time durations is possible by using both 2D and 3D graphical visualization, information such as individual action space, potential path space and the volume covered by individuals for a specific time interval can be extracted by creating space-time prisms based on 3D space time cube.
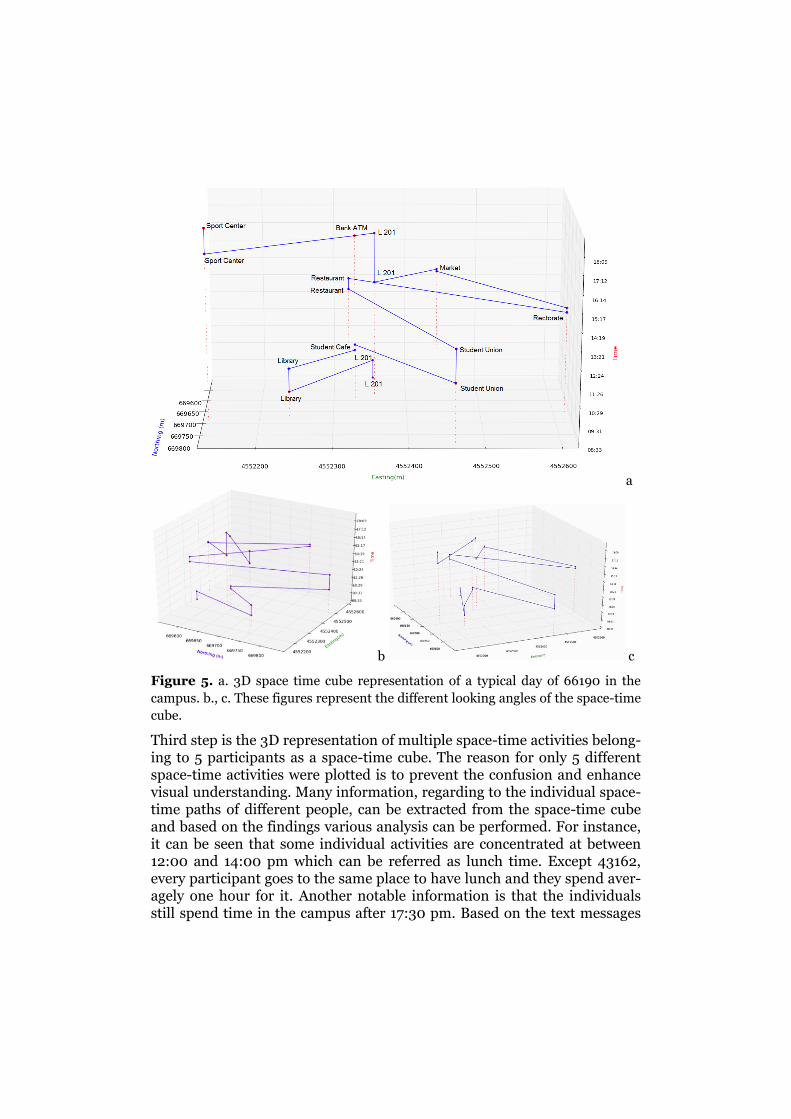
a
b c
Figure 5. a. 3D space time cube representation of a typical day of 66190 in the
campus. b., c. These figures represent the different looking angles of the space-time
cube.
Third step is the 3D representation of multiple space-time activities belong-ing to 5 participants as a space-time cube. The reason for only 5 different space-time activities were plotted is to prevent the confusion and enhance visual understanding. Many information, regarding to the individual space-time paths of different people, can be extracted from the space-time cube and based on the findings various analysis can be performed. For instance, it can be seen that some individual activities are concentrated at between 12:00 and 14:00 pm which can be referred as lunch time. Except 43162, every participant goes to the same place to have lunch and they spend aver-agely one hour for it. Another notable information is that the individuals still spend time in the campus after 17:30 pm. Based on the text messages

gathered from the Location sender, these activities can be listed as sports, working overtime and sitting in the green areas. As perpendicular lines rep-resent the duration of activities at a single place, working/studying activi-ties are the ones that individuals spend most of their time. Due to the close-ness of places visited in the campus, people do not spend much time for travel. The average travel time is calculated as approximately 40 minutes (Figure 6).
Figure 6. Multiple 3D space time cube representation of a typical day in the cam-
pus
Generally, based on activities of 10 participants, it has been found out that most of the people participated in the study were tend to be more stable in the campus, so that, 4 participants went to lunch in the same building. Coupling constraints occurred regarding to institutional restrictions and time plans such as to be obliged to get back to work place or class. Further-more, the events in the campus, such as seminars and conferences can af-fect the mobility. For instance; 1 participant attended a seminar during the working hours. Another outcome is that a few people (mostly research as-sistants) were still mobile in the campus after working hours (e.g. overtime, sports, leisure time, etc.), so that, 3 participants attended to a sport activity after 5.00 pm.
5. 3D vs. 2D Geovisualization
Related to human travel-activity patterns, travel distances and connections between specific travel points can be depicted in 2D representations. How-ever, information regarding timing, duration or activity sequences cannot be observed by using 2D graphical methods. 3D space-time representations are not only graphics, they are also information sources of comprehending, analyzing and modeling particular human behaviors (Kwan, 2000).
Space-time cubes are mostly beneficial for analyzing complex data sets vis-ually and the idea is to understand interactions between movement and patterns as a whole. Despite the fact that space-time cube is a powerful vis-ualization tool for human activity behaviors, it lacks of visual communica-tion when many space-time paths are illustrated together. Based on the researches, space-time cube is decent in many ways (Kveladze & Kraak, 2012). However, cartographic design issues and information flow in terms of user-centric approach have been essentially considered in few studies. Some studies resulted that space-time cube is effective than 2D representa-tion whereas some studies did the opposite. Evaluation capability of multi-ple space-time relationships is better than 2D and animation techniques. On the contrary, most of the basic tasks such as calculating distances and duration of activities can be performed better with 2D visualization (see Demissie, 2010; Kristensson et al., 2009; Kjellin et al., 2010; Kveladze & Kraak, 2012; Willems et al., 2011).
6. Discussions & Conclusion
Geovisualization of spatio-temporal data is a very promising topic especial-ly for social sciences. It is possible to use space-time cube to reveal activity-travel patterns of different genders, ethnic subgroups, non-employees, etc. and all the information can be related to urban planning, transportation, location based services and many other fields dealing with individual geo-data.
3D geovisualization can perform better than 2D in terms of the information extraction by especially experts. However, there are several both technical and usability difficulties related to 3D geovisualization of spatio-temporal data. First one is the orientation of the user in a visualized scene. People may find hard to perceive the information in 3D with changing angles, so that, some basic tasks are still performed better with 2D. Second one is the complexity of the visualized data (i.e. visual clutter of multiple data repre-sentation). Third one is, 3D space-time cube representation lacks of carto-graphic design especially in terms of good communication of information.

Thus, it affects the information transmitted via visualized spatio-temporal data. As a result of these reasons, further investigation has to be considered to enhance the visual understanding of the space-time.
On the other hand, the geovisualization Python code written by authors can be developed and standardized for spatio-temporal visualization applica-tions. It can also be integrated into GIS software as a tool or an extension. For further researches, user-centric approach, visual understandability and cartographic design issues should be considered in 3D space-time cube vis-ualization. Last but not least problematic issue is the privacy violation, due to the individual-level geo-data collection. Thus, the ID’s of the participants should be kept confidential and never be shared with the third-parties.
References
Ajam, N. (2008). Privacy Based Access to Parlay X Location Services. Fourth Inter-national Conference on Networking and Services (ICNS). doi: 10.1109/icns.2008.34
Augusto, J., & Aghajan, H. (2009). Editorial: Inaugural issue. Journal of Ambient Intelligence and Smart Environments. 1(1): 1–4.
Abowd, G. D., Dey, A. K., Brown, P. J., Davies, N., Smith, M., & Steggles, P. (1999). Towards a Better Understanding of Context and Context-Awareness. Handheld and Ubiquitous Computing, 304-307. doi: 10.1007/3-540-48157-5_29
Bleisch, S. (2012). 3D Geovisualization; Definition and Structures for the Assess-ment of Usefulness. ISPRS Ann. Photogramm. Remote Sens. Spatial Inf. Sci., I-2, 129–134. doi: 10.5194/isprsannals-i-2-129-2012
Demissie, B. (2010) Geo-Visualization of Movements: Moving Objects in Static Maps, Animation and The Space-Time Cube, VDM Verlag Dr. Müller.
DiBiase, D., MacEachren, A. M., Krygier, J. B., & Reeves, C. (1992). Animation and the Role of Map Design in Scientific Visualization. Cartography and Geographic Information Science, 19(4), 201–214. doi: 10.1559/152304092783721295
Drewe, P. (2005). What about time in urban planning & design in the ICT age. In Proceedings of the CORP conference. ISBN: 3-901673-12-1 (Hardcopy-Edition) ISBN: 3-901673-13-X (CD-Edition).
Dykes, J., & Mountain, D. (2003). Seeking structure in records of spatio-temporal behaviour: visualization issues, efforts and applications. Computational Statistics & Data Analysis, 43(4), 581–603. doi: 10.1016/s0167-9473(02)00294-3
Edsall, R. M. (2003). The parallel coordinate plot in action: design and use for geo-graphic visualization. Computational Statistics & Data Analysis, 43(4), 605–619. doi: 10.1016/s0167-9473(02)00295-5

Fisher, P. F. (1993). Visualizing Uncertainty in Soil Maps by Animation. Carto-graphica: The International Journal for Geographic Information and Geovisuali-zation, 30(2), 20–27. doi: 10.3138/b204-32p4-263l-76w0
Frank, A. U., & Mark, D. M., (1991). Languages issues for GIS. In Geographic In-formation Systems: Principles and Applications, ed. Maguire, D. J., Goodchild, M. F., and Rhind, D. W. Esses: Longman Scientific & Technical Inc. 1, 147 -163.
GSM. 2003. Groupe Speciale Mobile (GSM) Association, “Location Based Services”, Permanent Reference Document PRD SE. 23, January.
Guo, D., Chen, J., MacEachren, A. M., & Liao, K. (2006). A Visualization System for Space-Time and Multivariate Patterns (VIS-STAMP). IEEE Transactions on Vis-ualization and Computer Graphics, 12(6), 1461–1474. doi: 10.1109/tvcg.2006.84
Groves, P. D. (2008). Principles of GNSS, Inertial, and Multisensor Integrated Nav-igation Systems. Artech House, ISBN-13: 978-1-60807-005-3.
Hägerstrand, T. (1970). What about people in regional science? Papers of Regional Science Association 24: 7-21. doi: 10.1111/j.1435-5597.1970.tb01464.x
Henricksen, K., Indulska, J., & Rakotonirainy, A. (2002). Modeling context infor-mation in pervasive computing systems. In Pervasive 2002, ed. Mattern F., & Naghshineh, M. 167–80. Berlin/Heidelberg: Springer LNCS 2414. doi: 10.1007/3-540-4566-2_14
Huang, H. (2010). Supporting Smart Mobile Navigation in a Smart Environment. Applications, Technologies, and Security, 109–129. doi: 10.1201/9781420071986-c5
Hunter, J. D. (2007). Matplotlib: A 2D Graphics Environment. Comput. Sci. Eng., 9(3), 90–95. doi: 10.1109/mcse.2007.55
Kjellin, A., Pettersson, L. W., Seipel, S., & Lind, M. (2010). Evaluating 2D and 3D visualizations of spatiotemporal information. ACM Transactions on Applied Per-ception, 7(3), 1–23. doi: 10.1145/1773965.1773970
Kraak, M. J. (2003). The space-time cube revisited from a geovisualization per-spective. In Proc. 21st International Cartographic Conference (pp. 1988-1996).
Kritzler, M., Raubal, M., & Krüger, A. (2007). A GIS Framework for Spa-tio‐temporal Analysis and Visualization of Laboratory Mice Tracking Data. Transactions in GIS, 11(5), 765-782. doi: 10.1111/j.1467-9671.2007.01071.x
Kristensson, P. O., Dahlback, N., Anundi, D., Bjornstad, M., Gillberg, H., Haralds-son, J., Stahl, J. (2009). An Evaluation of Space Time Cube Representation of Spatiotemporal Patterns. IEEE Trans. Visual. Comput. Graphics, 15(4), 696–702. doi: 10.1109/tvcg.2008.194
Krygier, J. B. (1994). Sound and Geographic Visualization. Modern Cartography Series, 149–166. doi: 10.1016/b978-0-08-042415-6.50015-6
Kveladze, I., & Kraak, M. J. (2012). What do we know about the space-time cube from cartographic and usability perspective?. In in Proceedings of AutoCarto
2012: the international symposium on Automated Cartography. Columbus, Ohio, USA, Sep (pp. 16-18).
Kwan, M. P. (2000). Interactive geovisualization of activity-travel patterns using three-dimensional geographical information systems: a methodological explora-tion with a large data set. Transportation Research Part C: Emerging Technolo-gies, 8(1-6), 185–203. doi: 10.1016/s0968-090x(00)00017-6
Kwan, M. P. (2004). GIS Methods in Time-Geographic Research: Geocomputation and Geovisualization of Human Activity Patterns. Geografiska Annaler, Series B: Human Geography, 86(4), 267–280. doi: 10.1111/j.0435-3684.2004.00167.x
MacEachren, A. M., Buttenfield, B. P., Campbell, J. B., DiBiase, D. W., & Monmon-ier, M. (1992). Visualization. Geography's inner worlds: Pervasive themes in con-temporary American geography, Ed. d by R. Abler, M. Marcus and J. Olson (New Brunswick, NJ: Rutgers University Press), 99-137. doi: 10.5860/CHOICE.30-3436
MacEachren, A. M., & Kraak, M.-J. (1997). Exploratory cartographic visualization: Advancing the agenda. Computers & Geosciences, 23(4), 335–343. doi: 10.1016/s0098-3004(97)00018-6
MacEachren, A. M., & Kraak, M.-J. (2001). Research Challenges in Geovisualiza-tion. Cartography and Geographic Information Science, 28(1), 3–12. doi: 10.1559/152304001782173970
Manson, S. M., Burrough, P. A., & McDonnell, R. A. (1999). Principles of Geograph-ical Information Systems: Spatial Information Systems and Geostatistics. Eco-nomic Geography, 75(4), 422. doi: 10.2307/144481
Martin, E., Liu, L., Covington, M., Pesti, P., & Weber, M. (2010). Positioning Tech-nologies in Location-Based Services. Applications, Technologies, and Security, 1–45. doi: 10.1201/9781420071986-c1
Miller, H. J. (1991). Modelling accessibility using space-time prism concepts within geographical information systems. International Journal of Geographical Infor-mation System, 5(3), 287-301. doi: 10.1080/02693799108927856
Miller, H. J. (2003). What about people in geographic information science? Com-puters, Environment and Urban Systems, 27(5), 447–453. doi: 10.1016/s0198-9715(03)00059-0
Nakaya, T., & Yano, K. (2010). Visualising Crime Clusters in a Space-time Cube: An Exploratory Data-analysis Approach Using Space-time Kernel Density Estima-tion and Scan Statistics. Transactions in GIS, 14(3), 223–239. doi: 10.1111/j.1467-9671.2010.01194.x
Noulas, A., Scellato, S., Mascolo, C., & Pontil, M. (2011). An Empirical Study of Geographic User Activity Patterns in Foursquare. Proceedings of the Fifth Inter-national AAAI Conference on Weblogs and Social Media (ICWSM), 11, 70-573.
Preoţiuc-Pietro, D., & Cohn, T. (2013). Mining user behaviours. Proceedings of the 5th Annual ACM Web Science Conference on – WebSci ’13. doi: 10.1145/2464464.2464479

Ren, F., & Kwan, M.-P. (2007). Geovisualization of Human Hybrid Activity-Travel Patterns. Transactions in GIS, 11(5), 721–744. doi:10.1111/j.1467-9671.2007.01069.x
Scellato, S., Noulas, A., Lambiotte, R., & Mascolo, C. (2011). Socio-Spatial Proper-ties of Online Location-Based Social Networks. Proceedings of the Fifth Interna-tional AAAI Conference on Weblogs and Social Media (ICWSM), 11, 329-336.
Springmeyer, R. R., Blattner, M. M., & Max, N. L. (1992). A characterization of the scientific data analysis process. Proceedings Visualization ’92. doi: 10.1109/visual.1992.235203
Van der Walt, S., Colbert, S. C., & Varoquaux, G. (2011). The NumPy Array: A Structure for Efficient Numerical Computation. Comput. Sci. Eng., 13(2), 22–30. doi: 10.1109/mcse.2011.37
Wegman, E. J. (1990). Hyperdimensional Data Analysis Using Parallel Coordi-nates. Journal of the American Statistical Association, 85(411), 664. doi: 10.2307/2290001
Wes McKinney. (2010). Data Structures for Statistical Computing in Python, Pro-ceedings of the 9th Python in Science Conference, 51-56.
Willems, N., van de Wetering, H., & van Wijk, J. J. (2011). Evaluation of the Visibil-ity of Vessel Movement Features in Trajectory Visualizations. Computer Graphics Forum, 30(3), 801–810. doi: 10.1111/j.1467-8659.2011.01929.x